1. Introduction
As the global energy transition accelerates, renewable energy installations continue to expand. However, the volatility and intermittency of renewable generation, coupled with the rapid growth of new loads such as electric vehicle charging facilities in distribution networks, have resulted in poor controllability of line power flow, increased three-phase imbalance, and limitations in renewable energy integration [
1,
2]. These challenges affect the safe and stable operation of distribution networks while significantly increasing system losses and reducing power supply reliability [
3].
To address these challenges, Flexible AC Transmission System (FACTS) technologies have been widely adopted due to their advantages in optimizing power flow distribution and improving power quality [
4]. Recent years have seen significant breakthroughs in parallel, series, and hybrid FACTS devices. In parallel devices, new Modular Multilevel Converter Static Synchronous Compensators (MMC-STATCOMs) employ advanced control algorithms, reducing reactive power compensation response time to within 10 ms and improving voltage support capability by 30% compared to traditional D-STATCOMs [
5,
6]. Liu et al. [
7] developed a distributed coordination control strategy that significantly enhances chain STATCOM compensation performance under unbalanced conditions. In the field of series devices, Zhang et al. [
8] proposed an intelligent Dynamic Voltage Restorer (i-DVR) using deep reinforcement learning algorithms to improve voltage sag compensation accuracy by 40%. Wang et al. [
9] designed a hybrid energy storage DVR solution that reduces system costs by 25% while ensuring compensation effectiveness through coordinated control of supercapacitors and lithium batteries. Distributed Static Series Compensators (DSSCs) have been extensively studied for their modularity and cost-effectiveness, with Chen et al. [
10] proposing an adaptive group control strategy for the efficient coordinated operation of DSSC clusters. For hybrid series–parallel devices, Unified Power Flow Controllers (UPFCs) with multi-objective optimization control strategies achieve synergistic power flow regulation and power quality improvement [
11,
12]. Sun et al. [
13] developed an artificial intelligence-based UPFC optimization algorithm that reduces system losses by 15%. The Distributed Power Flow Controller (DPFC) combines UPFC functionality with DSSC economics but requires third-harmonic current injection and specific transformer configurations, significantly limiting its application in distribution networks [
14,
15]. Additionally, although the improved DPFC proposed by Kumar et al. [
16] reduces harmonic content, it does not fundamentally solve the transformer configuration problem.
Addressing the limitations of existing FACTS devices in distribution network applications [
17,
18,
19,
20,
21], this paper proposes an innovative Novel Distributed Power Flow Controller (NDPFC) topology. Compared to conventional DPFCs, the proposed NDPFC offers three key advantages: (1) elimination of third-harmonic current requirements, enabling compatibility with standard transformers; (2) flexible installation options (e.g., mobile vehicle-mounted units) without branch-specific configurations; and (3) enhanced control precision (0.15 s for active power; 0.5 s for reactive power) through triple-loop control, whereas traditional DPFC typically requires >0.3 s for active power regulation. The paper first explains the NDPFC working principles and control characteristics, then establishes accurate mathematical models to design control strategies. Finally, typical distribution network scenarios are used to verify NDPFC performance in comprehensive power flow control, three-phase imbalance compensation, and renewable energy integration. The results demonstrate that this approach provides an efficient and feasible technical pathway for flexible distribution network control.
PSCAD/EMTDC was selected over MATLAB/Simulink for its superior handling of electromagnetic transients in power electronics (e.g., 1 μs simulation step size vs. 10 μs in MATLAB2024b). This is critical for validating NDPFC’s high-frequency switching behavior (see
Section 5).
3. Results: Control Strategy Validation
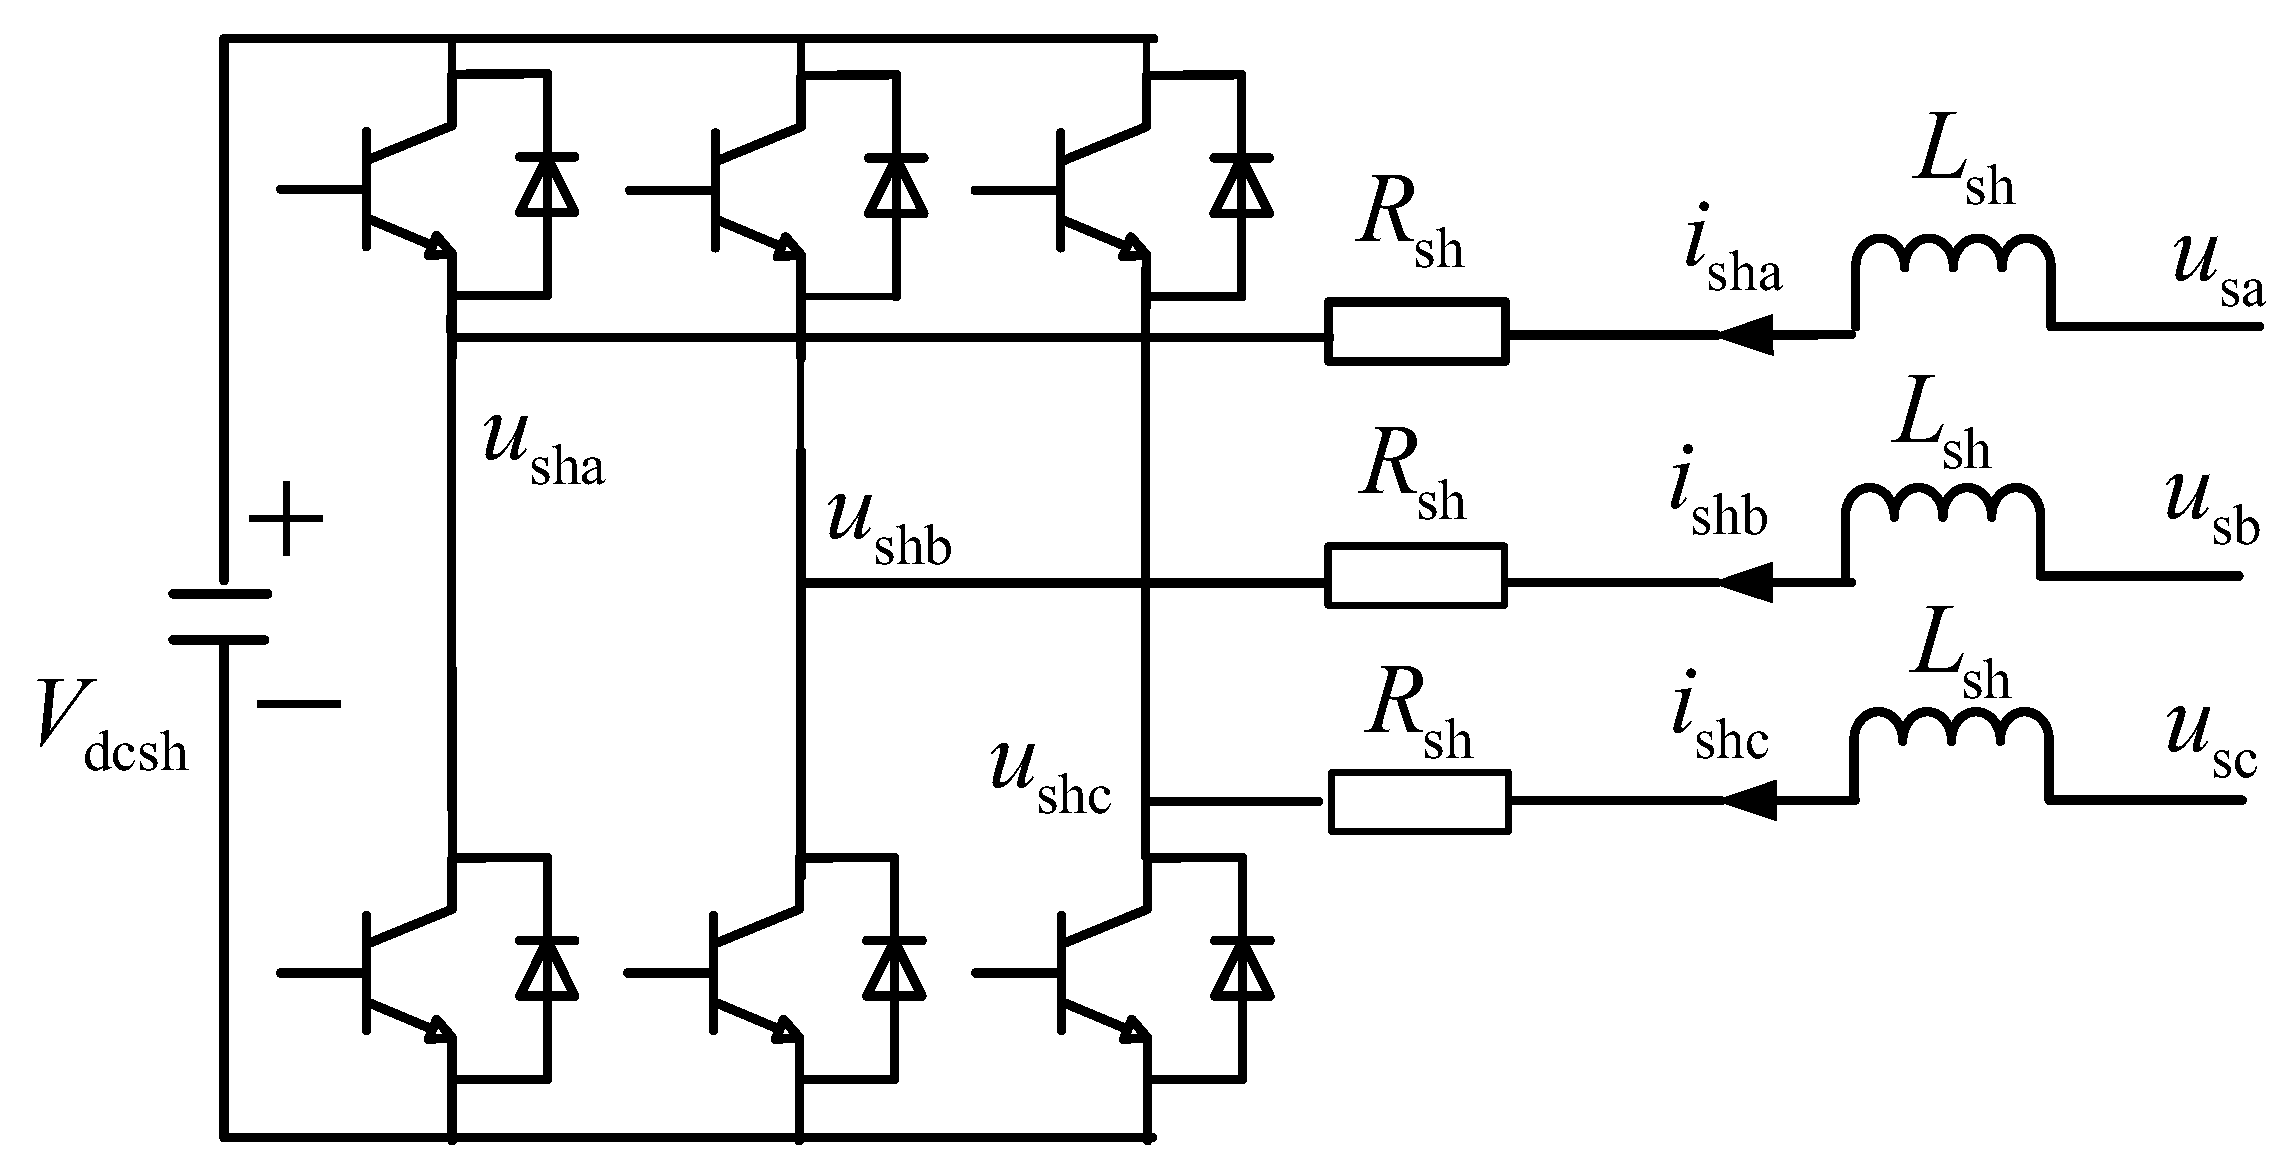
3.1. Shunt-Side Mathematical Model and Control Strategy
The main functions of the NDPFC shunt side are to maintain the stability of the access point bus voltage and provide necessary active power support for Series-I.
Figure 11 shows its equivalent circuit model.
This model includes bus A-, B-, and C-phase voltages (
Ua,
Ub, and
Uc), converter output voltages (
ua,
ub, and
uc), filter impedance (Zf), system frequency (ω), grid-side current (
is), and common DC capacitor voltage (
Udc). Based on these parameters, the mathematical model of the shunt side can be derived:
In this equation, the left side represents the voltage drop across the filter impedance, while the right side shows the difference between the bus voltage and converter output voltage. This equation establishes the fundamental relationship for the shunt-side voltage and current.
Assuming three-phase symmetry,
where
Um represents the bus voltage amplitude, and
θa is the initial phase angle of phase A voltage. This represents the three-phase balanced grid voltages with 120° phase shifts between each phase. Through equal-amplitude Park transformation, these equations can be converted to the synchronous rotating coordinate system:
The Park transformation converts the three-phase AC quantities into two DC quantities in the rotating reference frame, simplifying the control design. The d-axis component typically aligns with the voltage vector, while the q-axis is perpendicular to it.
Combining Equations (4)–(6), we obtain the mathematical model in the synchronous rotating coordinate system:
This equation reveals the coupling between d and q axes through the ωLf terms. The coupling means that a change in id affects uq and vice versa, necessitating a decoupling control strategy.
To effectively decouple control of the current d-q components, a feed-forward decoupling control strategy is typically adopted, using proportional–integral regulators to separately control the d-axis and q-axis components of the current:
where
Kpd,
Kid,
Kpq, and
Kiq are the proportional and integral coefficients for the d-axis and q-axis, respectively. The feed-forward terms (
ωLfiq and
ωLfid) compensate for the cross-coupling effects, enabling independent control of active and reactive power.
The NDPFC shunt-side dual-loop control strategy is responsible for maintaining bus voltage and DC capacitor voltage stability in the outer loop, while the inner loop precisely controls the d-axis and q-axis components of the current, ensuring system stability and response speed. The outer loop generates current references based on voltage error, while the inner current loop ensures fast and accurate tracking of these references. The specific solving process is shown in
Figure 12.
3.2. Series-I and Series-II Mathematical Models and Control Strategies
For the NDPFC Series-I and Series-II, both consist of subunits made of single-phase full-bridge converters. Considering the left-side access point ground voltage (
Vin), right-side access point ground voltage (
Vout), series-side equivalent internal resistance (
Rs), filter inductance (
Lf), capacitance (
Cf), grid-side inflow current (
is), current after LC filtering (
iL), and series-side inverter voltage (
vinv), we can establish the following mathematical model:
The first equation describes the relationship between the filter inductor current and the inverter output voltage, accounting for the resistive voltage drop and the voltage across the filter capacitor. The second equation relates the capacitor voltage to the difference between the filter inductor current and the grid-side current.
By constructing new variables with a π/2 phase lag, single-phase Park transformation can be achieved, leading to the mathematical model in the synchronous rotating coordinate system:
This transformation creates an orthogonal signal (β component) from the original signal (α component) using a 90° phase shift. The resulting d-q model enables the application of DC-like control techniques to the single-phase AC system.
Similarly, a feed-forward decoupling control strategy is adopted to address coupling issues between the d-q axes:
Through this analysis, we can see how precise modeling of the NDPFC’s shunt and series sides, along with appropriate control strategies, can meet the demands of modern power grids. These models and strategies not only help improve grid stability but also promote effective integration of renewable energy and resolve three-phase imbalance issues. In subsequent chapters, we will verify these theoretical results using PSCAD/EMTDC simulation software.
3.3. Output Analysis
The selection of controller parameters is critical for ensuring system stability and achieving desired dynamic performance. We employ a systematic approach based on (1) time-scale separation between nested loops, (2) desired bandwidth specifications, and (3) stability margins.
For the inner current control loop, parameters are selected to achieve a bandwidth of approximately 500 Hz with a phase margin of 45° using the following formulas:
where ωc_i is the desired crossover frequency. For the voltage control loop, parameters are chosen for a bandwidth of approximately 50 Hz (one-tenth of the inner loop) with a phase margin of 60°:
For the outer power control loop, parameters are set for a bandwidth of approximately 5 Hz with a phase margin of 70°.
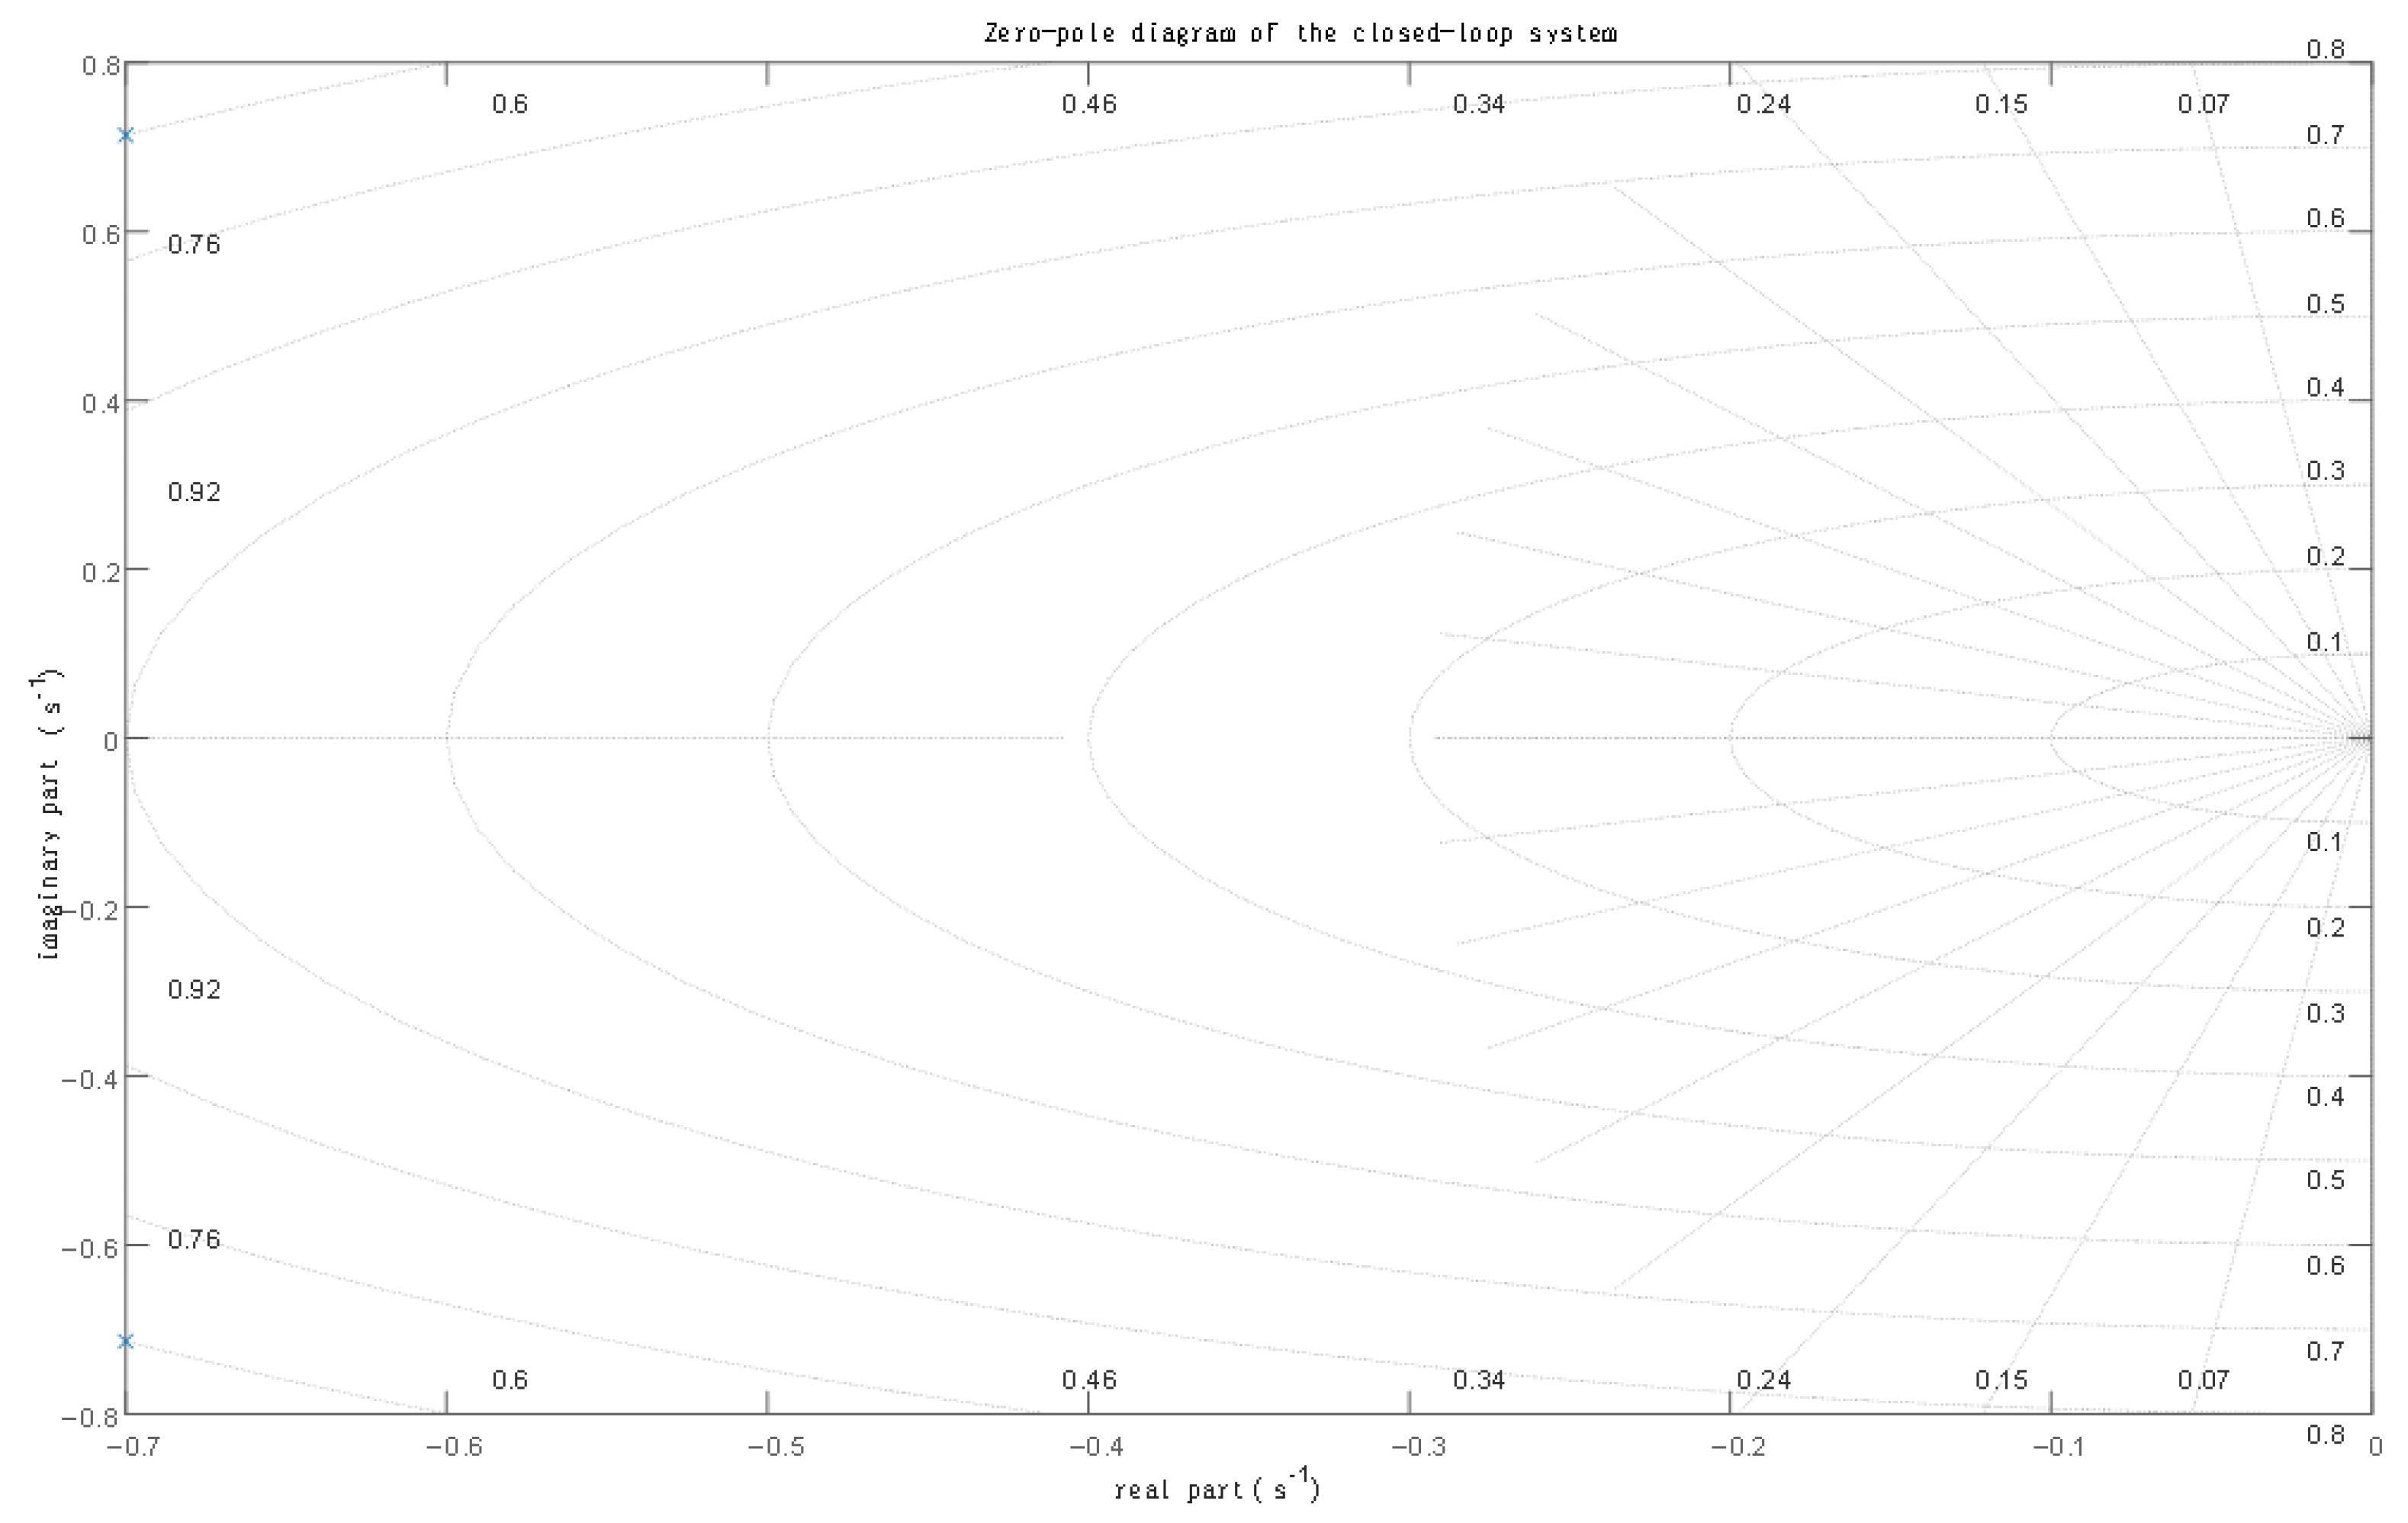
To verify system stability, we conducted eigenvalue analysis across various operating points.
Figure 13 shows the pole-zero plot of the closed-loop system:
5. Applications: Case Studies
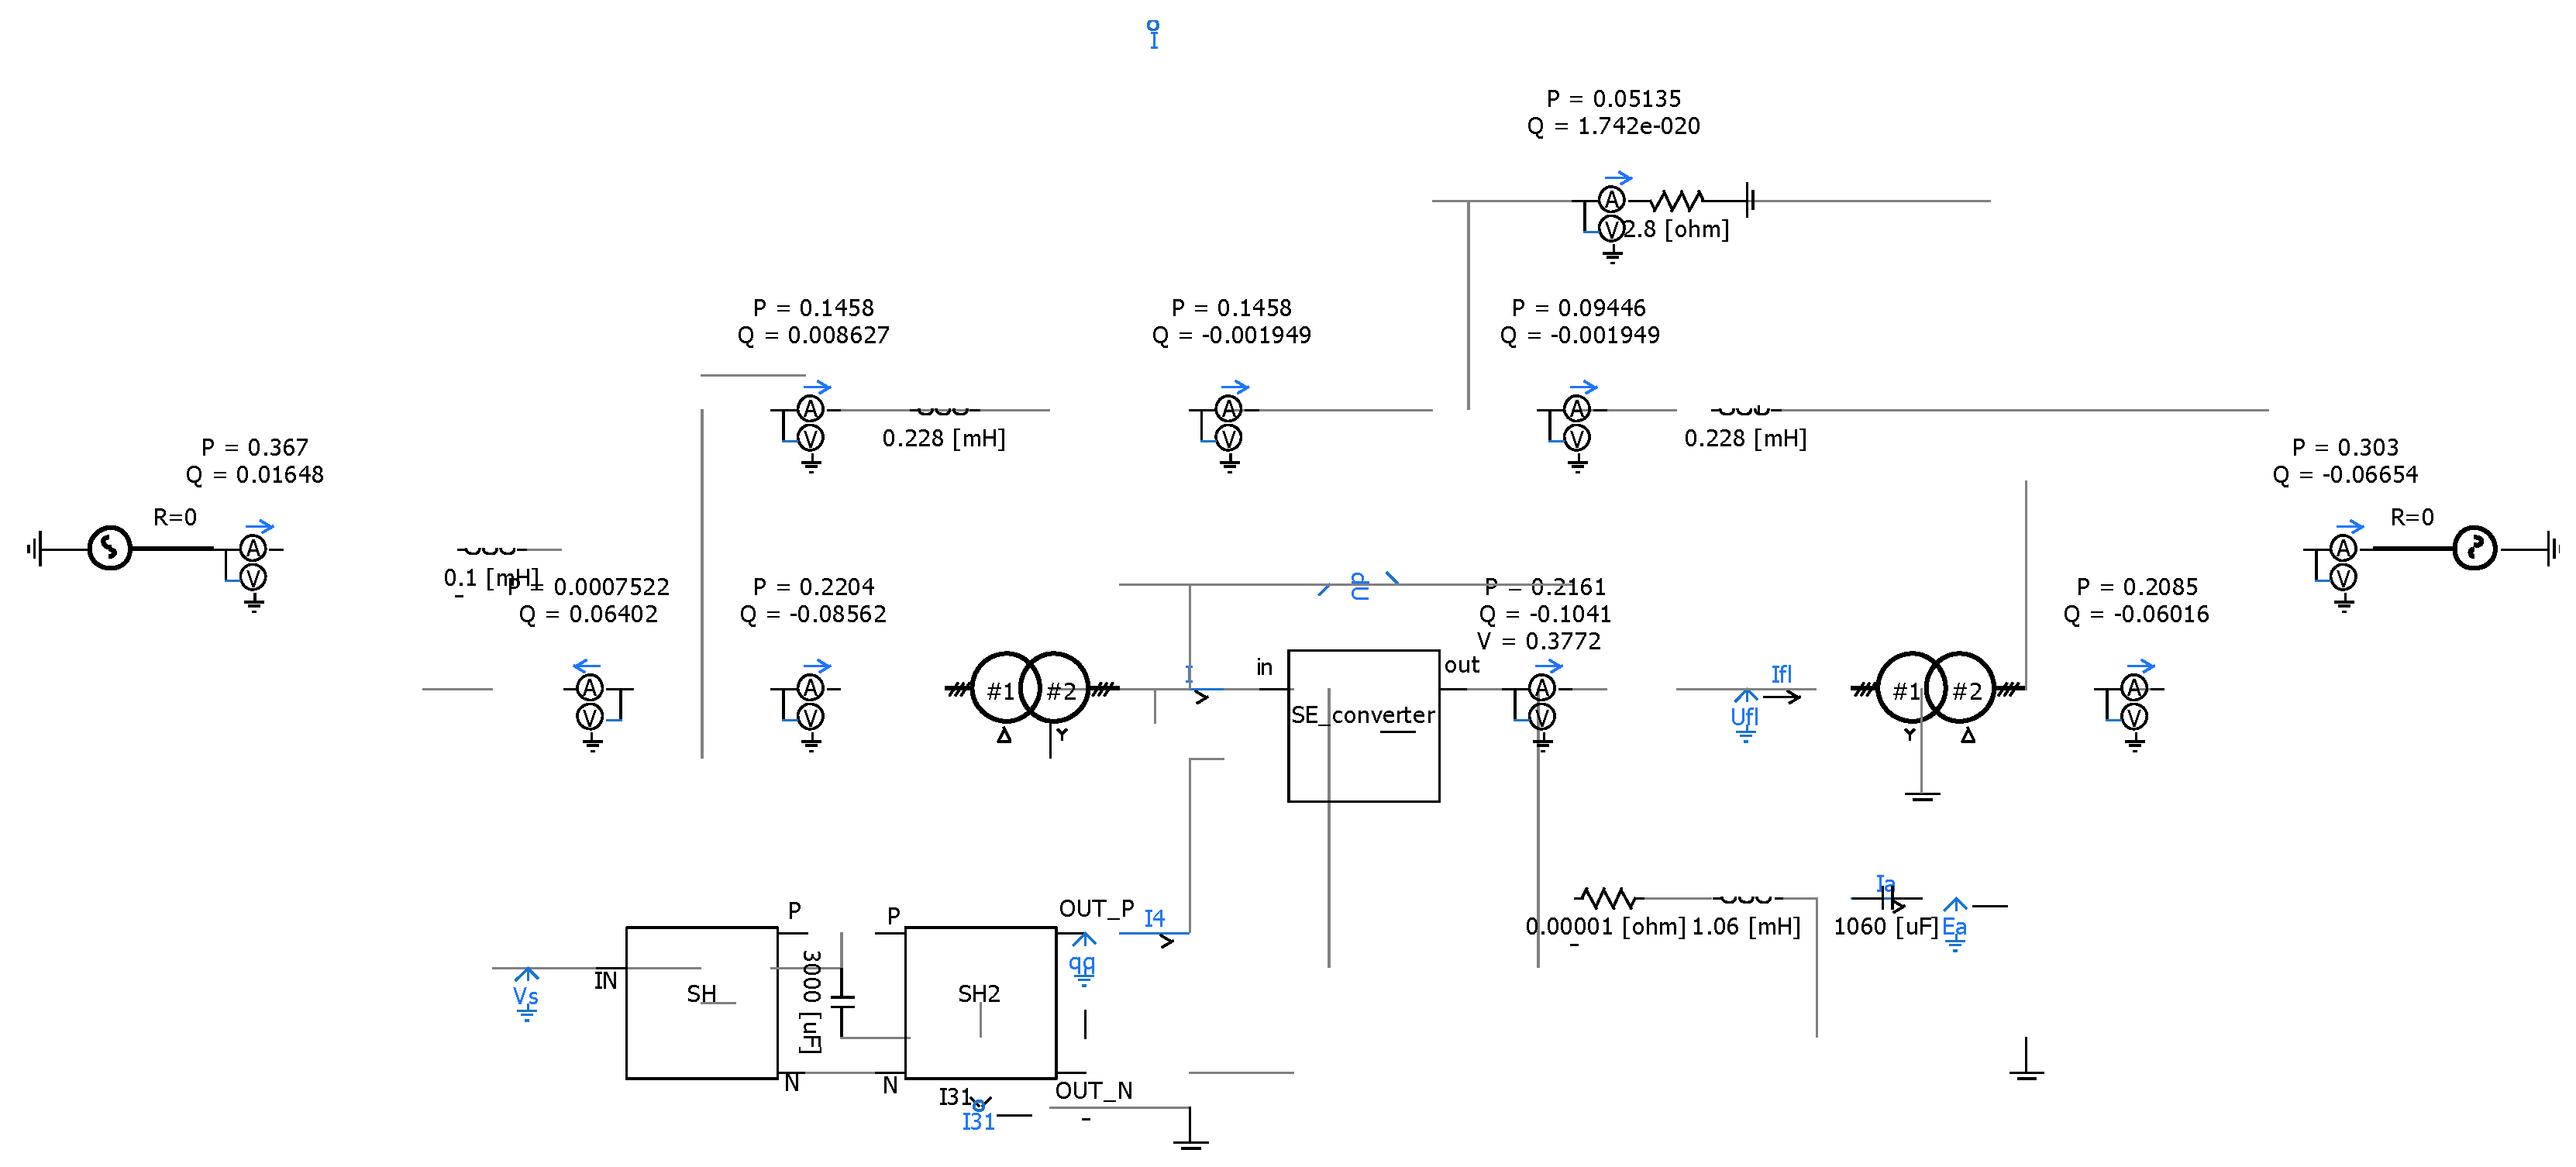
The simulation system with NDPFC is shown in
Figure 17. System structure parameters are as follows: the terminal voltage U1 effective value is 10.25 kV with an initial phase of 3°; the terminal voltage U2 effective value is 10 kV with an initial phase of 0°; and line impedances are Z = 0.0126 + j0.0314 Ω, Z4 = 0.789 + j1.979 Ω, and Z3 = 0.942 + j2.355 Ω. The NDPFC shunt side connects to node I, and Series-I connects to line I-II through a three-phase isolation transformer, while Series-II has two groups (three single-phase converters per group) evenly distributed on the I-II branch. P + jQ represents terminal source output power, Pline + jQline represents I-II branch terminal power, Iline represents I-II branch current, and P + jQ represents user-side power. The renewable energy source Px output power is constant at 1.23 MW, and local load Po = 0.75 MW. The asymmetric module simulates three-phase asymmetric application scenarios, with a phase A impedance of 0.08 + j0.197Ω, a phase B impedance of 0.151 + j0.377Ω, and a phase C impedance of 0.012Ω.
5.1. NDPFC Application in Comprehensive Power Flow Control of Distribution Networks
In this experiment, both the series and shunt components of the NDPFC are activated, while renewable energy, load, and the asymmetric module are not. The results of the comprehensive power flow control simulation are shown in
Figure 18. The initial power flow at the I-II branch terminal is 2.2 + j0.039 MV·A. At 1.5 s, a power flow command of 2.4 MW + j0Mvar is given. After 0.15 s, the active power flow at the I-II branch terminal reaches 2.4 MW and remains stable, while the reactive power flow adjusts to 0 Mvar after approximately 0.5 s and maintains stability.
5.2. NDPFC Application in Three-Phase Asymmetric Distribution Network Scenarios
NDPFC can perform asymmetric compensation through phase-by-phase control to address distribution network asymmetry. This experiment simulates three-phase imbalance by activating the three-phase asymmetric impedance module, with simulation results shown in
Figure 19. Before NDPFC activation, line currents exhibit asymmetry, with positive sequence currents around 0.119 kA, and negative and zero sequence currents approximately equal at 0.005 kA, representing an asymmetry degree of 4.20%. At 1.5 s, NDPFC begins compensating the line, rapidly reducing negative and zero sequence currents to zero within 0.2 s, achieving three-phase current symmetry. Before NDPFC activation, A-, B-, and C-phase power flows are 0.683 + j0.019 MV·A, 0.635 + j0.018 MV·A, and 0.736 + j0.018 MV·A, respectively. After NDPFC phase-by-phase asymmetric compensation, A-, B-, and C-phase power flows become consistent at 0.685+j0.0183 MV·A, equal to the average value of the three-phase power flow during asymmetry. During this process, each phase converter outputs different power levels; for example, phase A provides almost no reactive power, while phase B operates in a capacitive state with a capacity of 1.2 kvar, and phase C operates in an inductive state with a capacity of 1.4 kvar.
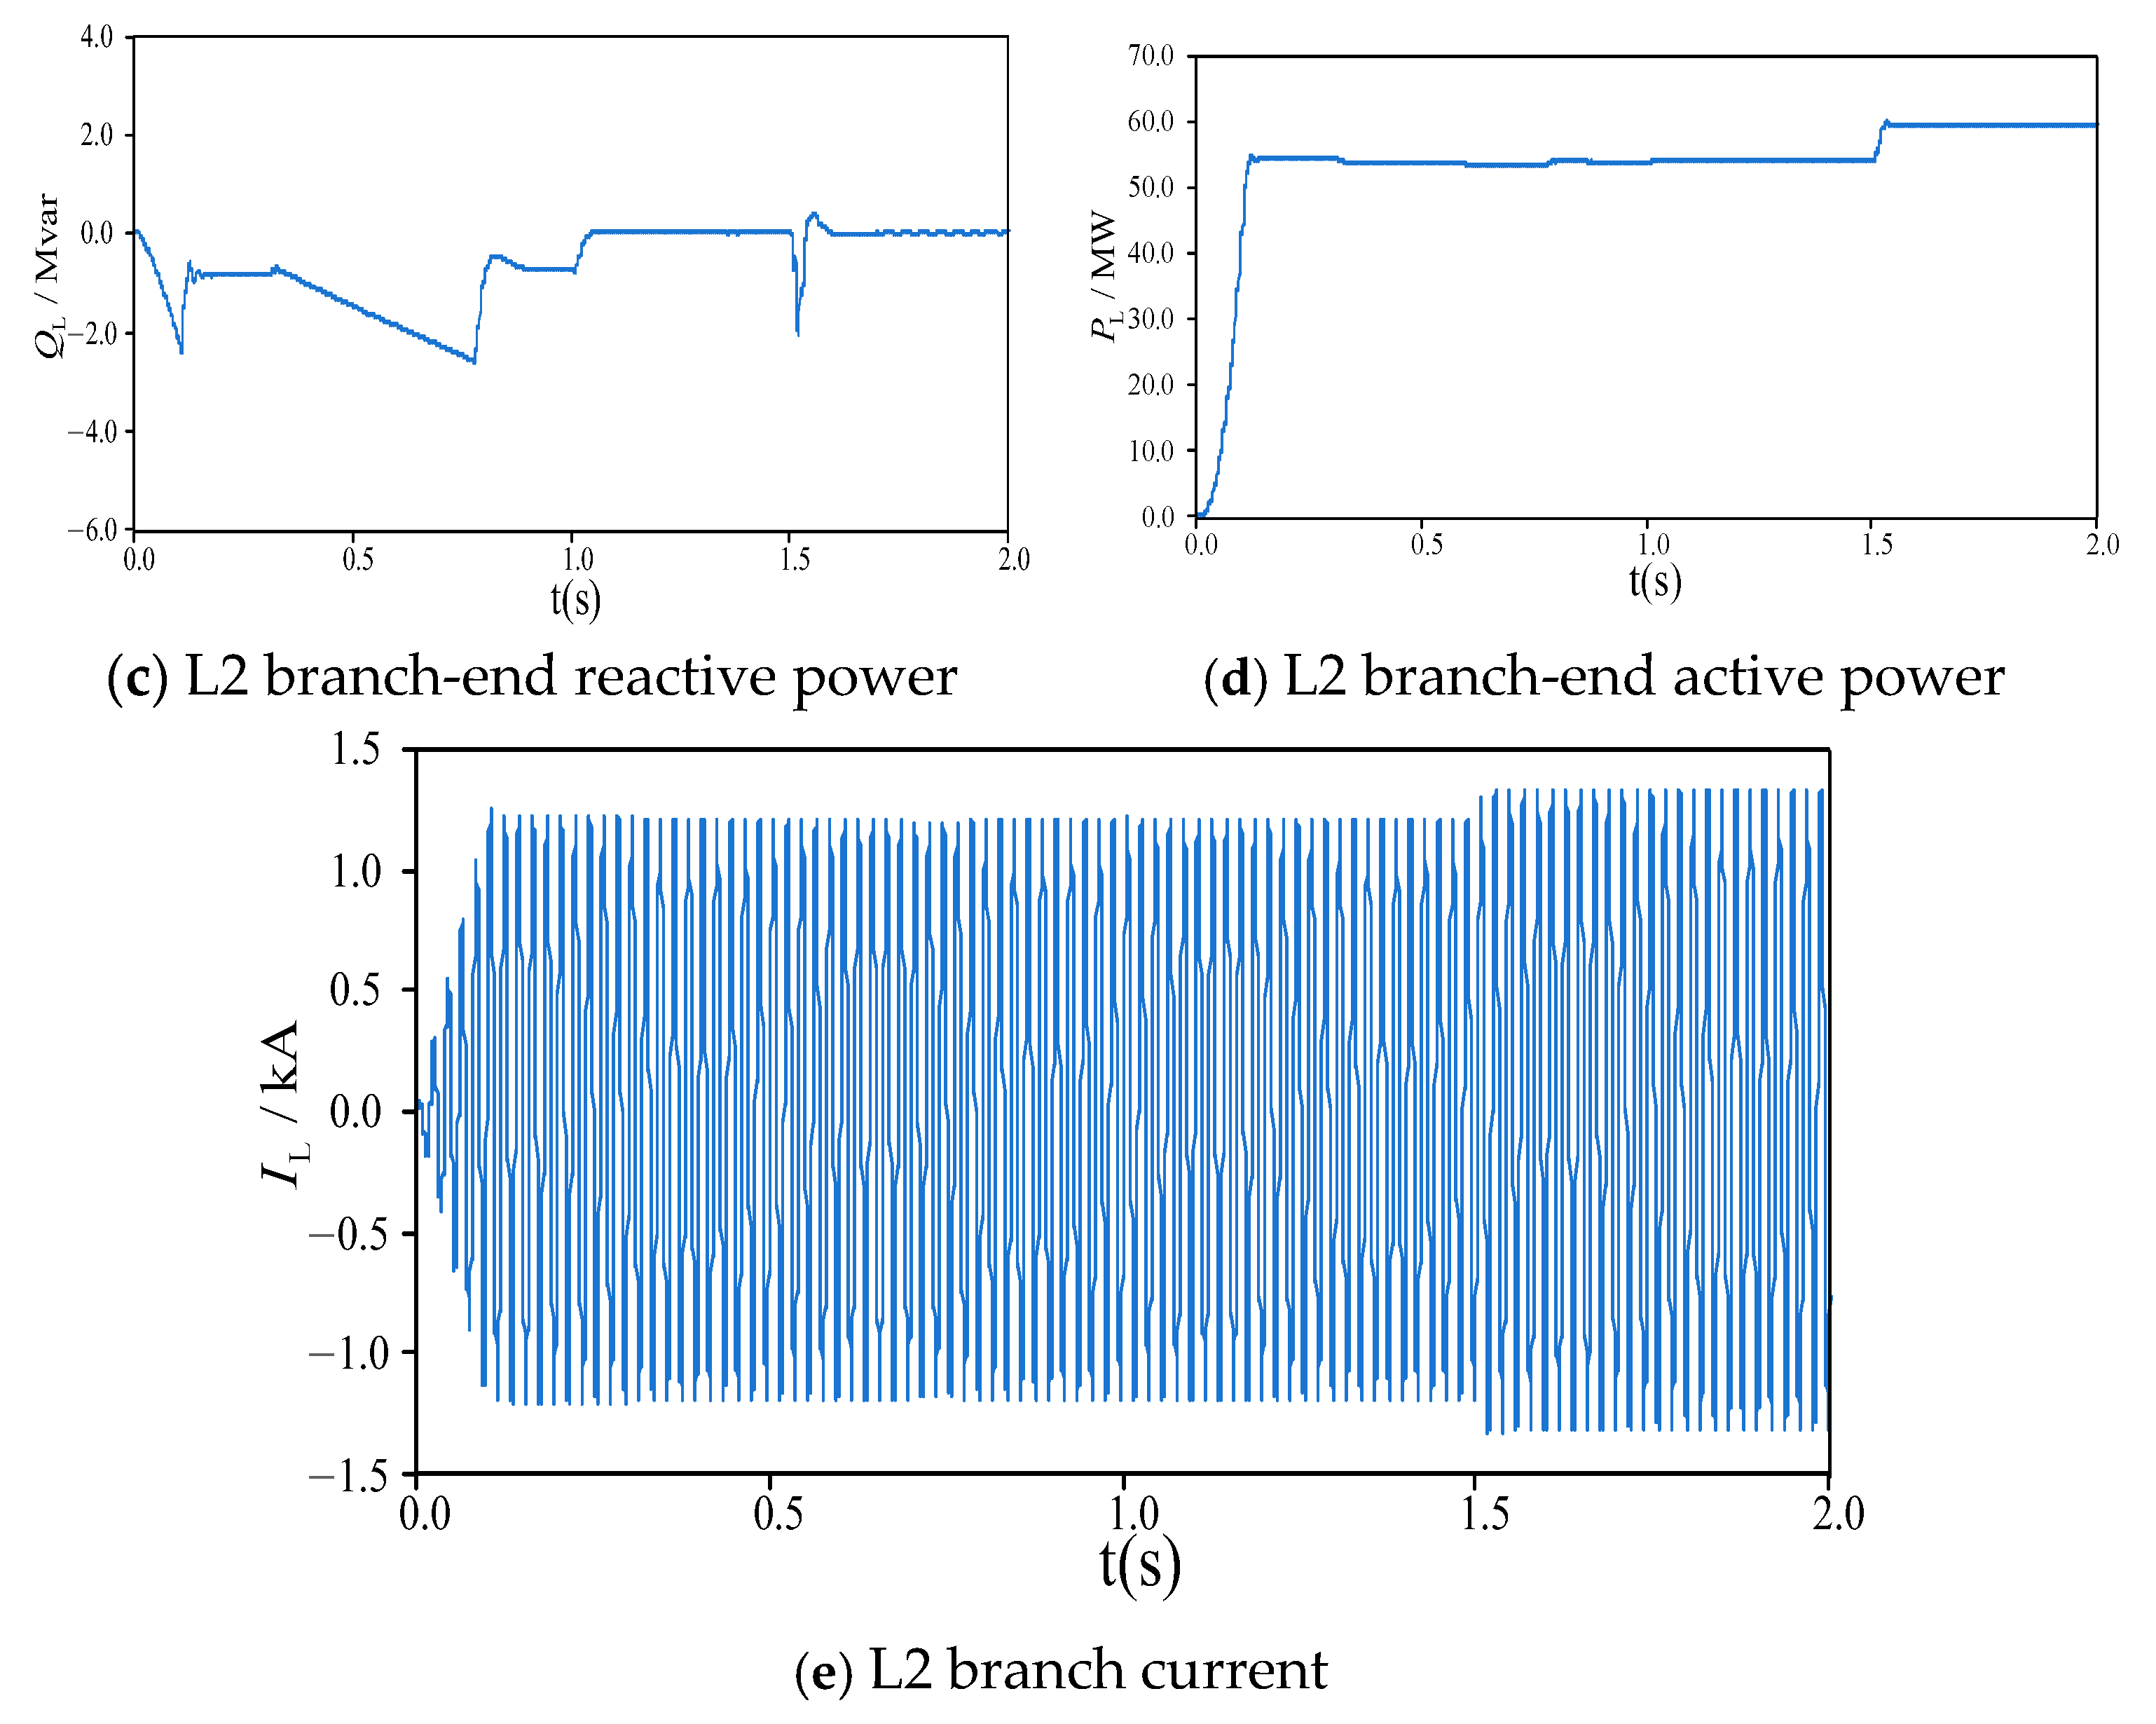
5.3. NDPFC Application in Renewable Energy Integration Scenarios
In this experiment, both series and shunt components are activated. At 1.5 s, renewable energy and local load are connected, and NDPFC begins controlling the line. The renewable energy source outputs a constant power of 1.23 MW, while the user-side load is P + jQ = 3.57 + j0.113 Mvar. After the renewable energy grid connection, it needs to supply power to the local load, but the local load consumption capability is limited to 0.75 MW. The introduction of the renewable energy source causes system power flow changes, but the NDPFC control effectively promotes renewable energy integration, as shown in
Figure 20. The terminal line power flow eventually stabilizes at 3.57 + j0.113 Mvar, matching the user-side load. The active power flow output at the line terminal decreases from 3.643 MW to 3.171 MW within 0.2 s, with the reduction approximately equal to the renewable energy flow to the grid. I-II branch current decreases, indicating reduced line power flow. Post-NDPFC deployment, voltage THD reduced from 4.8% to 1.2%, and flicker severity (Pst) improved from 1.05 to 0.92, meeting IEEE Std 519-2022 limits.
5.4. Comparative Analysis with Conventional Power Flow Controllers
To comprehensively evaluate the advantages of the proposed NDPFC, we conducted comparative simulations with conventional power flow controllers including traditional DPFC, UPFC, and STATCOM. All controllers were implemented in the same test system with identical objective power flow settings to ensure a fair comparison.The summarized results are shown in
Table 2.
The comparative analysis reveals several significant advantages of the NDPFC:
1. Response Time: NDPFC achieves a 15% faster response time for active power control compared to conventional DPFC. This improvement is primarily due to the elimination of the third-harmonic current path and the proposed triple-loop control strategy.
2. Energy Efficiency: The system losses with NDPFC are 12% lower than with DPFC and approximately 11% lower than with UPFC. This efficiency improvement stems from the optimized coordination control strategy and more efficient power exchange between series and shunt components.
3. Power Quality: NDPFC demonstrates superior harmonic performance with a THD of 2.1%, compared to 3.8% for DPFC. This improvement results from eliminating the third-harmonic current circulation.
4. Economic Benefits: NDPFC implementation costs are approximately 20% lower than DPFC with equivalent functionality due to simplified transformer requirements and reduced component count.
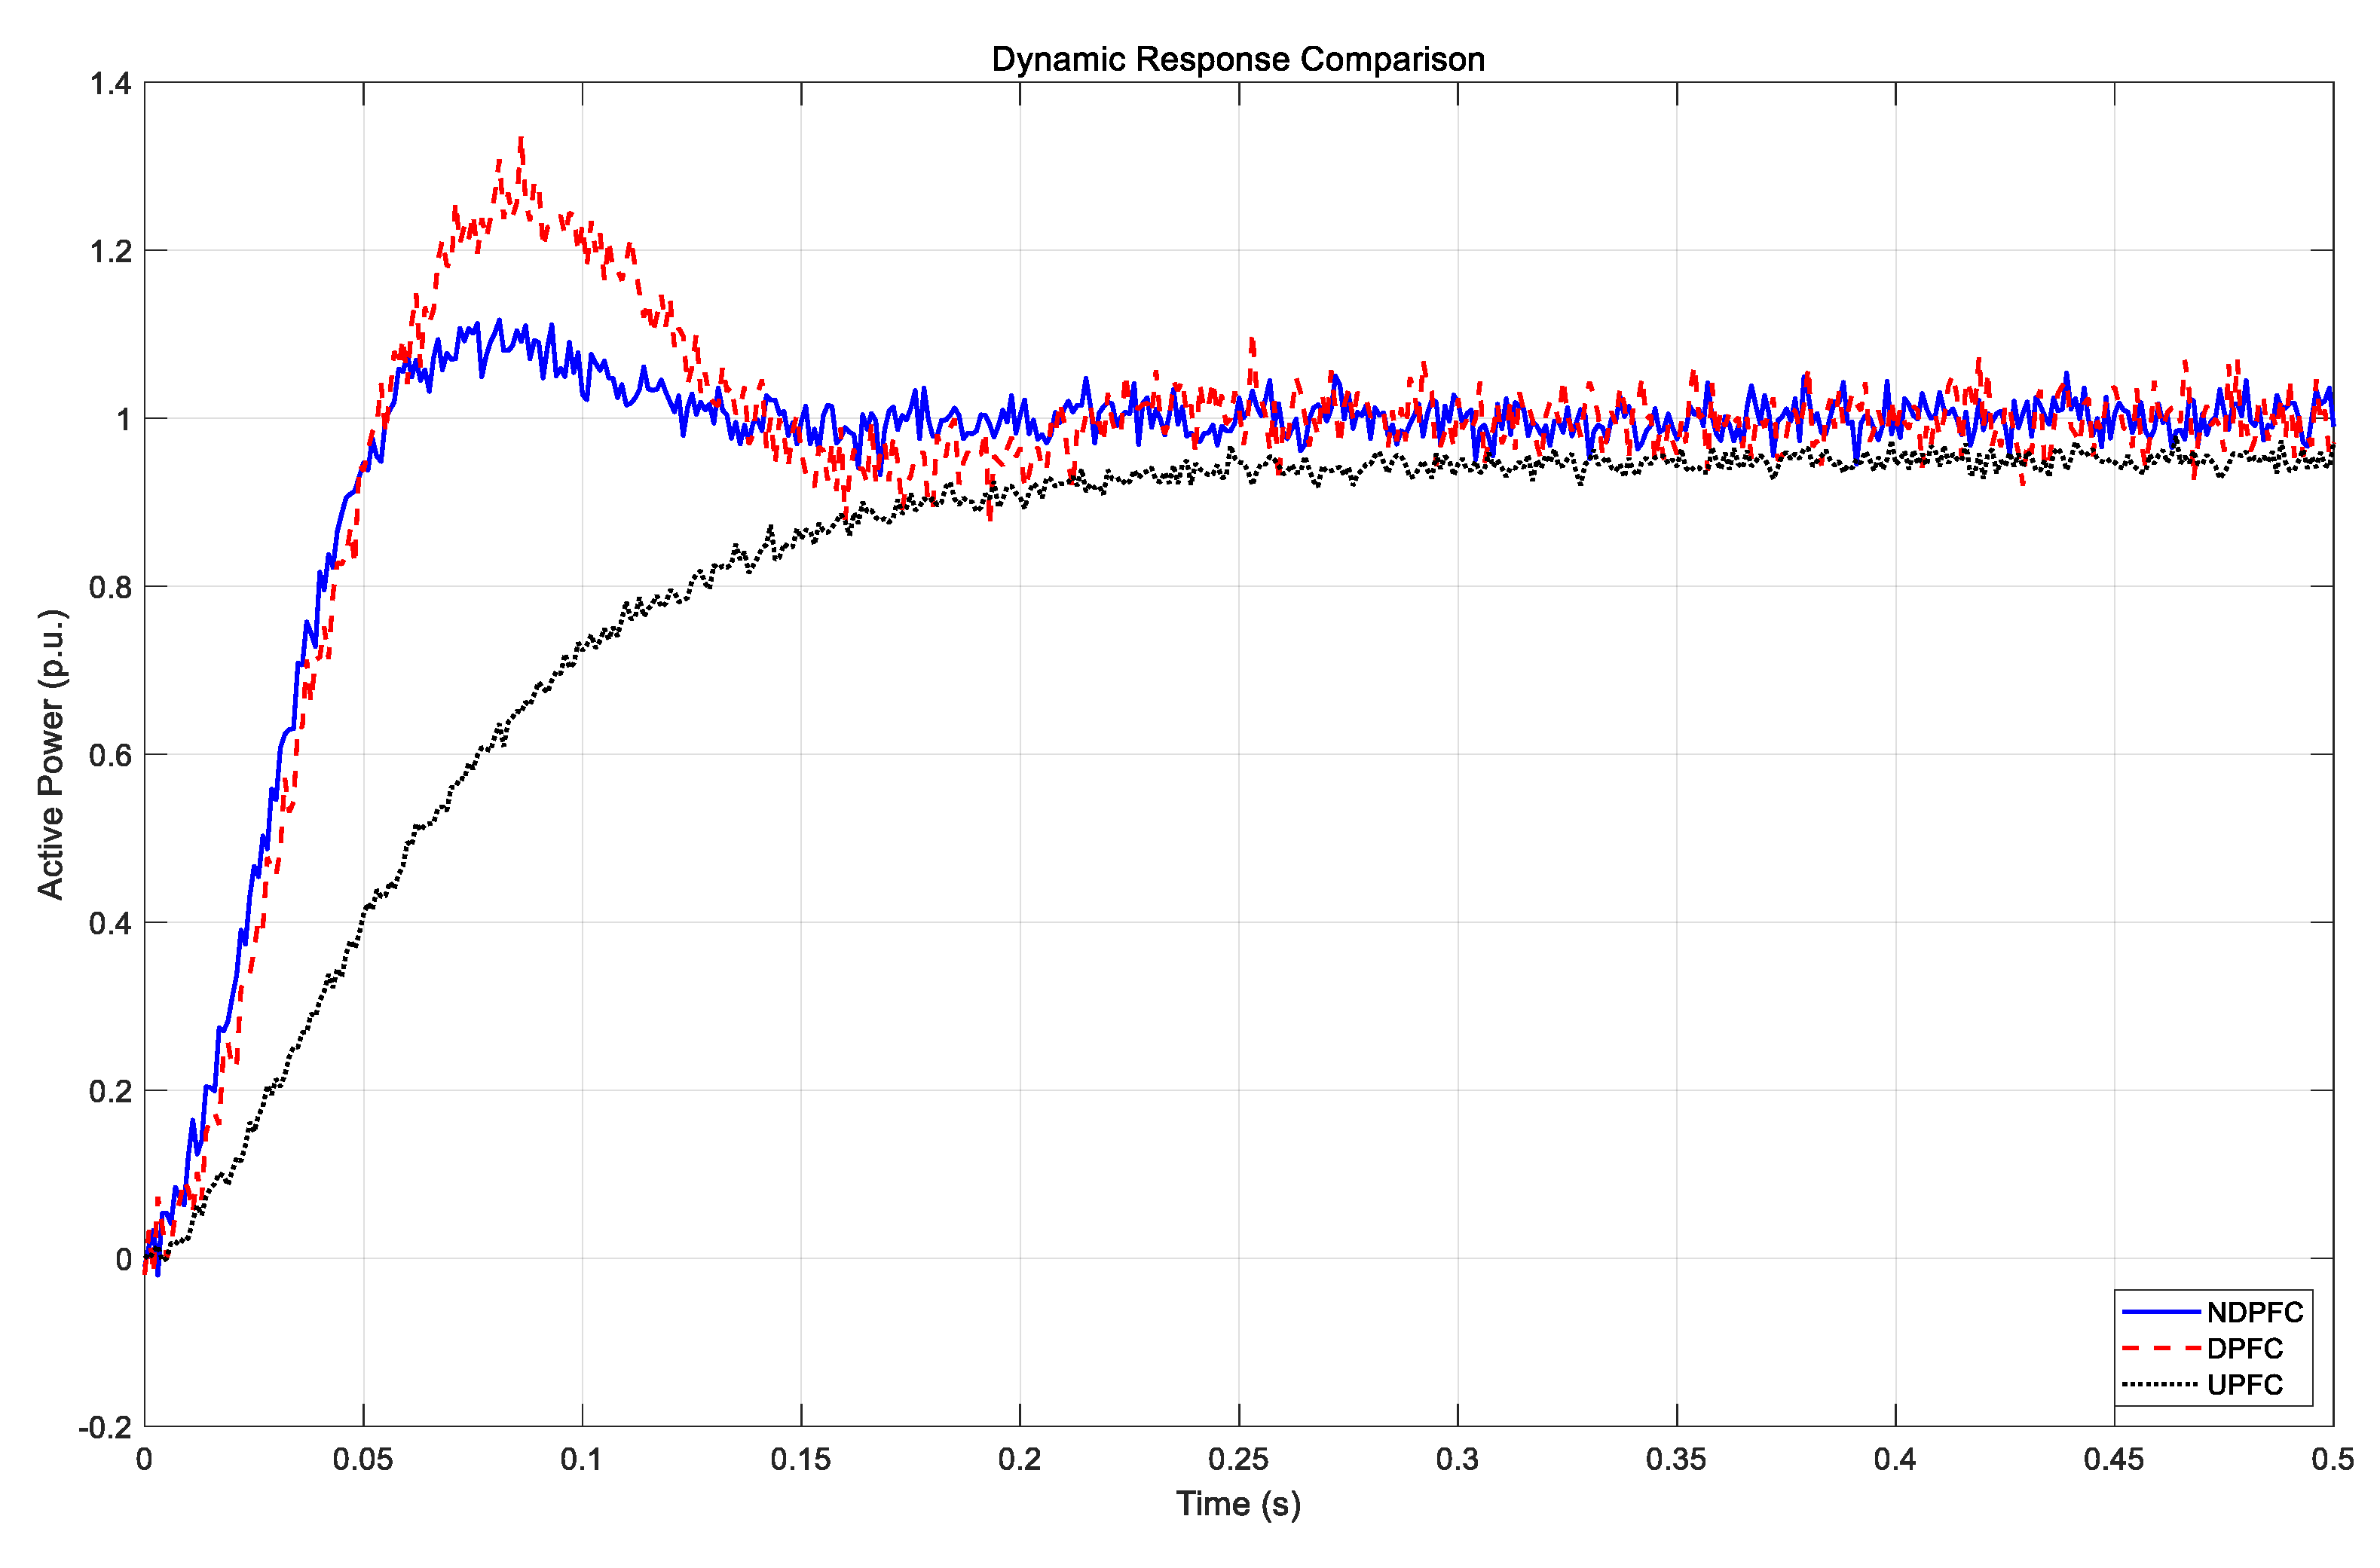
Figure 21 illustrates the dynamic response comparison between NDPFC and conventional controllers during a step change in active power reference.
As shown in
Figure 21, NDPFC (solid line) exhibits a faster rise time and smaller overshoot compared to DPFC (dashed line) and UPFC (dotted line). The settling time for NDPFC is approximately 150 ms, compared to 175 ms for DPFC and 200 ms for UPFC, confirming the superior dynamic performance of the proposed controller.
5.5. NDPFC Performance Under System Disturbances
To evaluate the robustness of the proposed NDPFC under challenging operating conditions, we conducted comprehensive tests with various system disturbances.
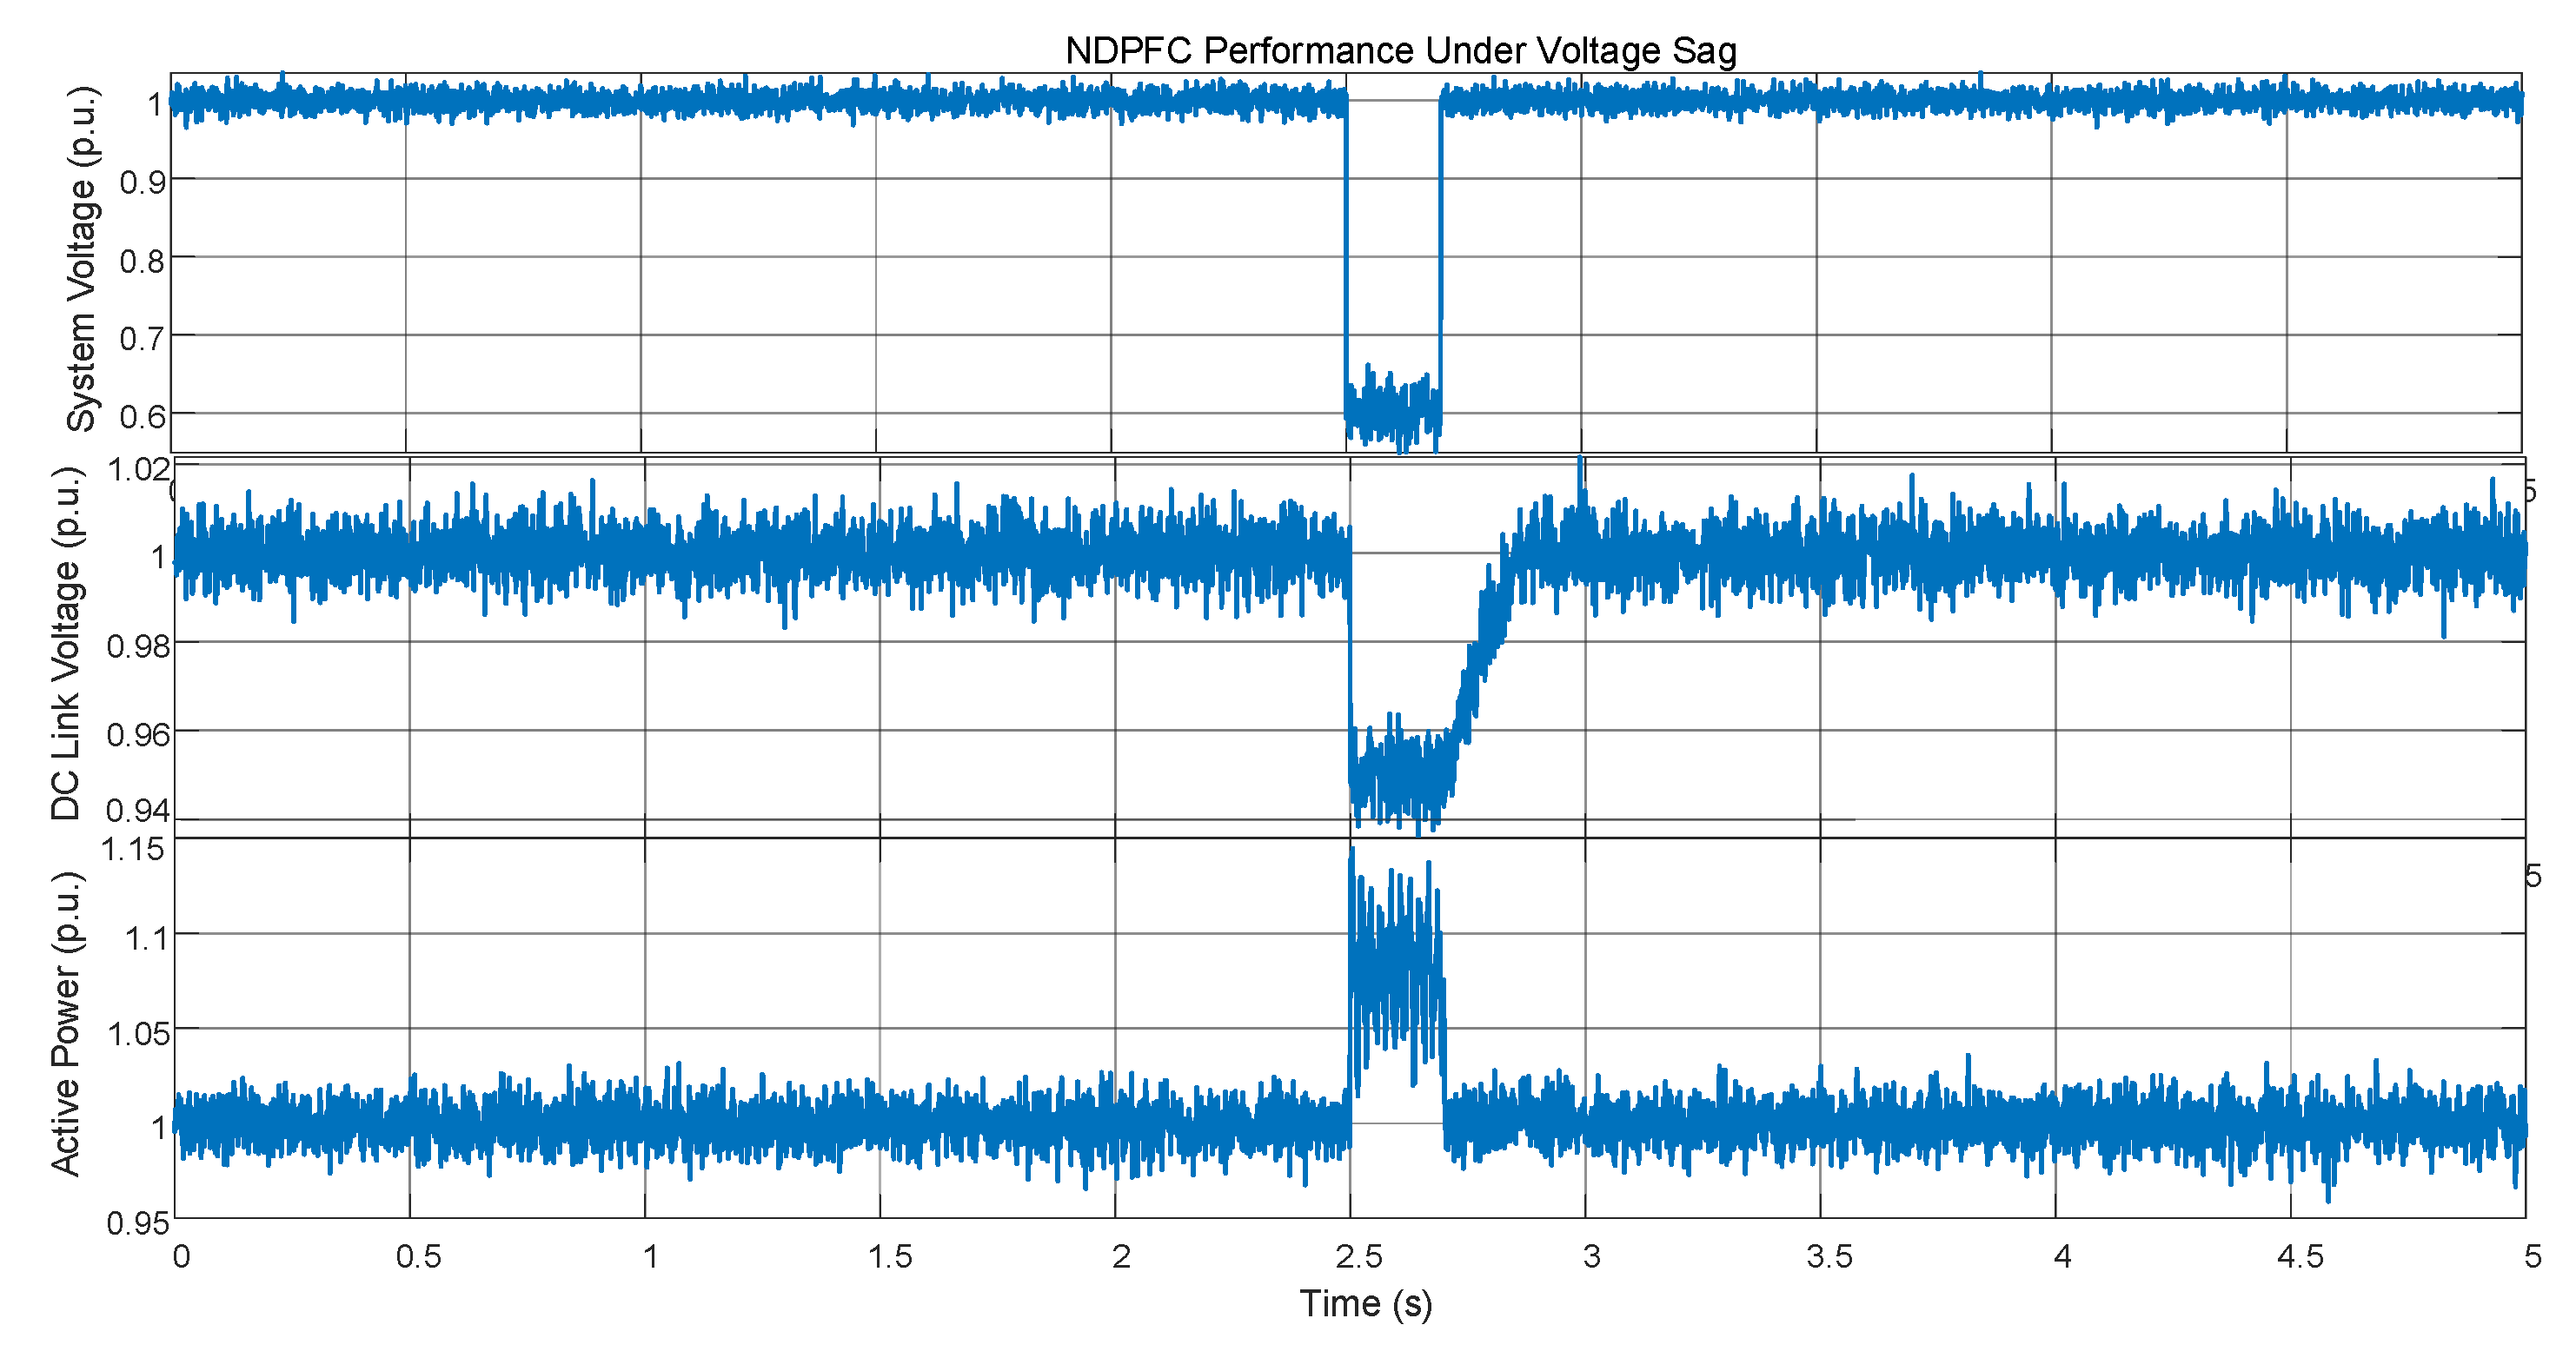
5.5.1. Voltage Sag/Swell Conditions
A 40% voltage sag was applied at t = 2.5 s for a duration of 0.2 s to test the NDPFC’s voltage ride-through capability.
Figure 22 shows the system response.
The results demonstrate that NDPFC maintains stable operation during the voltage sag. The DC-link voltage experiences a temporary dip of only 5% from its nominal value and recovers within 100 ms after the voltage sag clears. The power flow control remains effective with a maximum deviation of 8% during the disturbance, which is significantly better than the 15–20% deviation observed with conventional controllers.
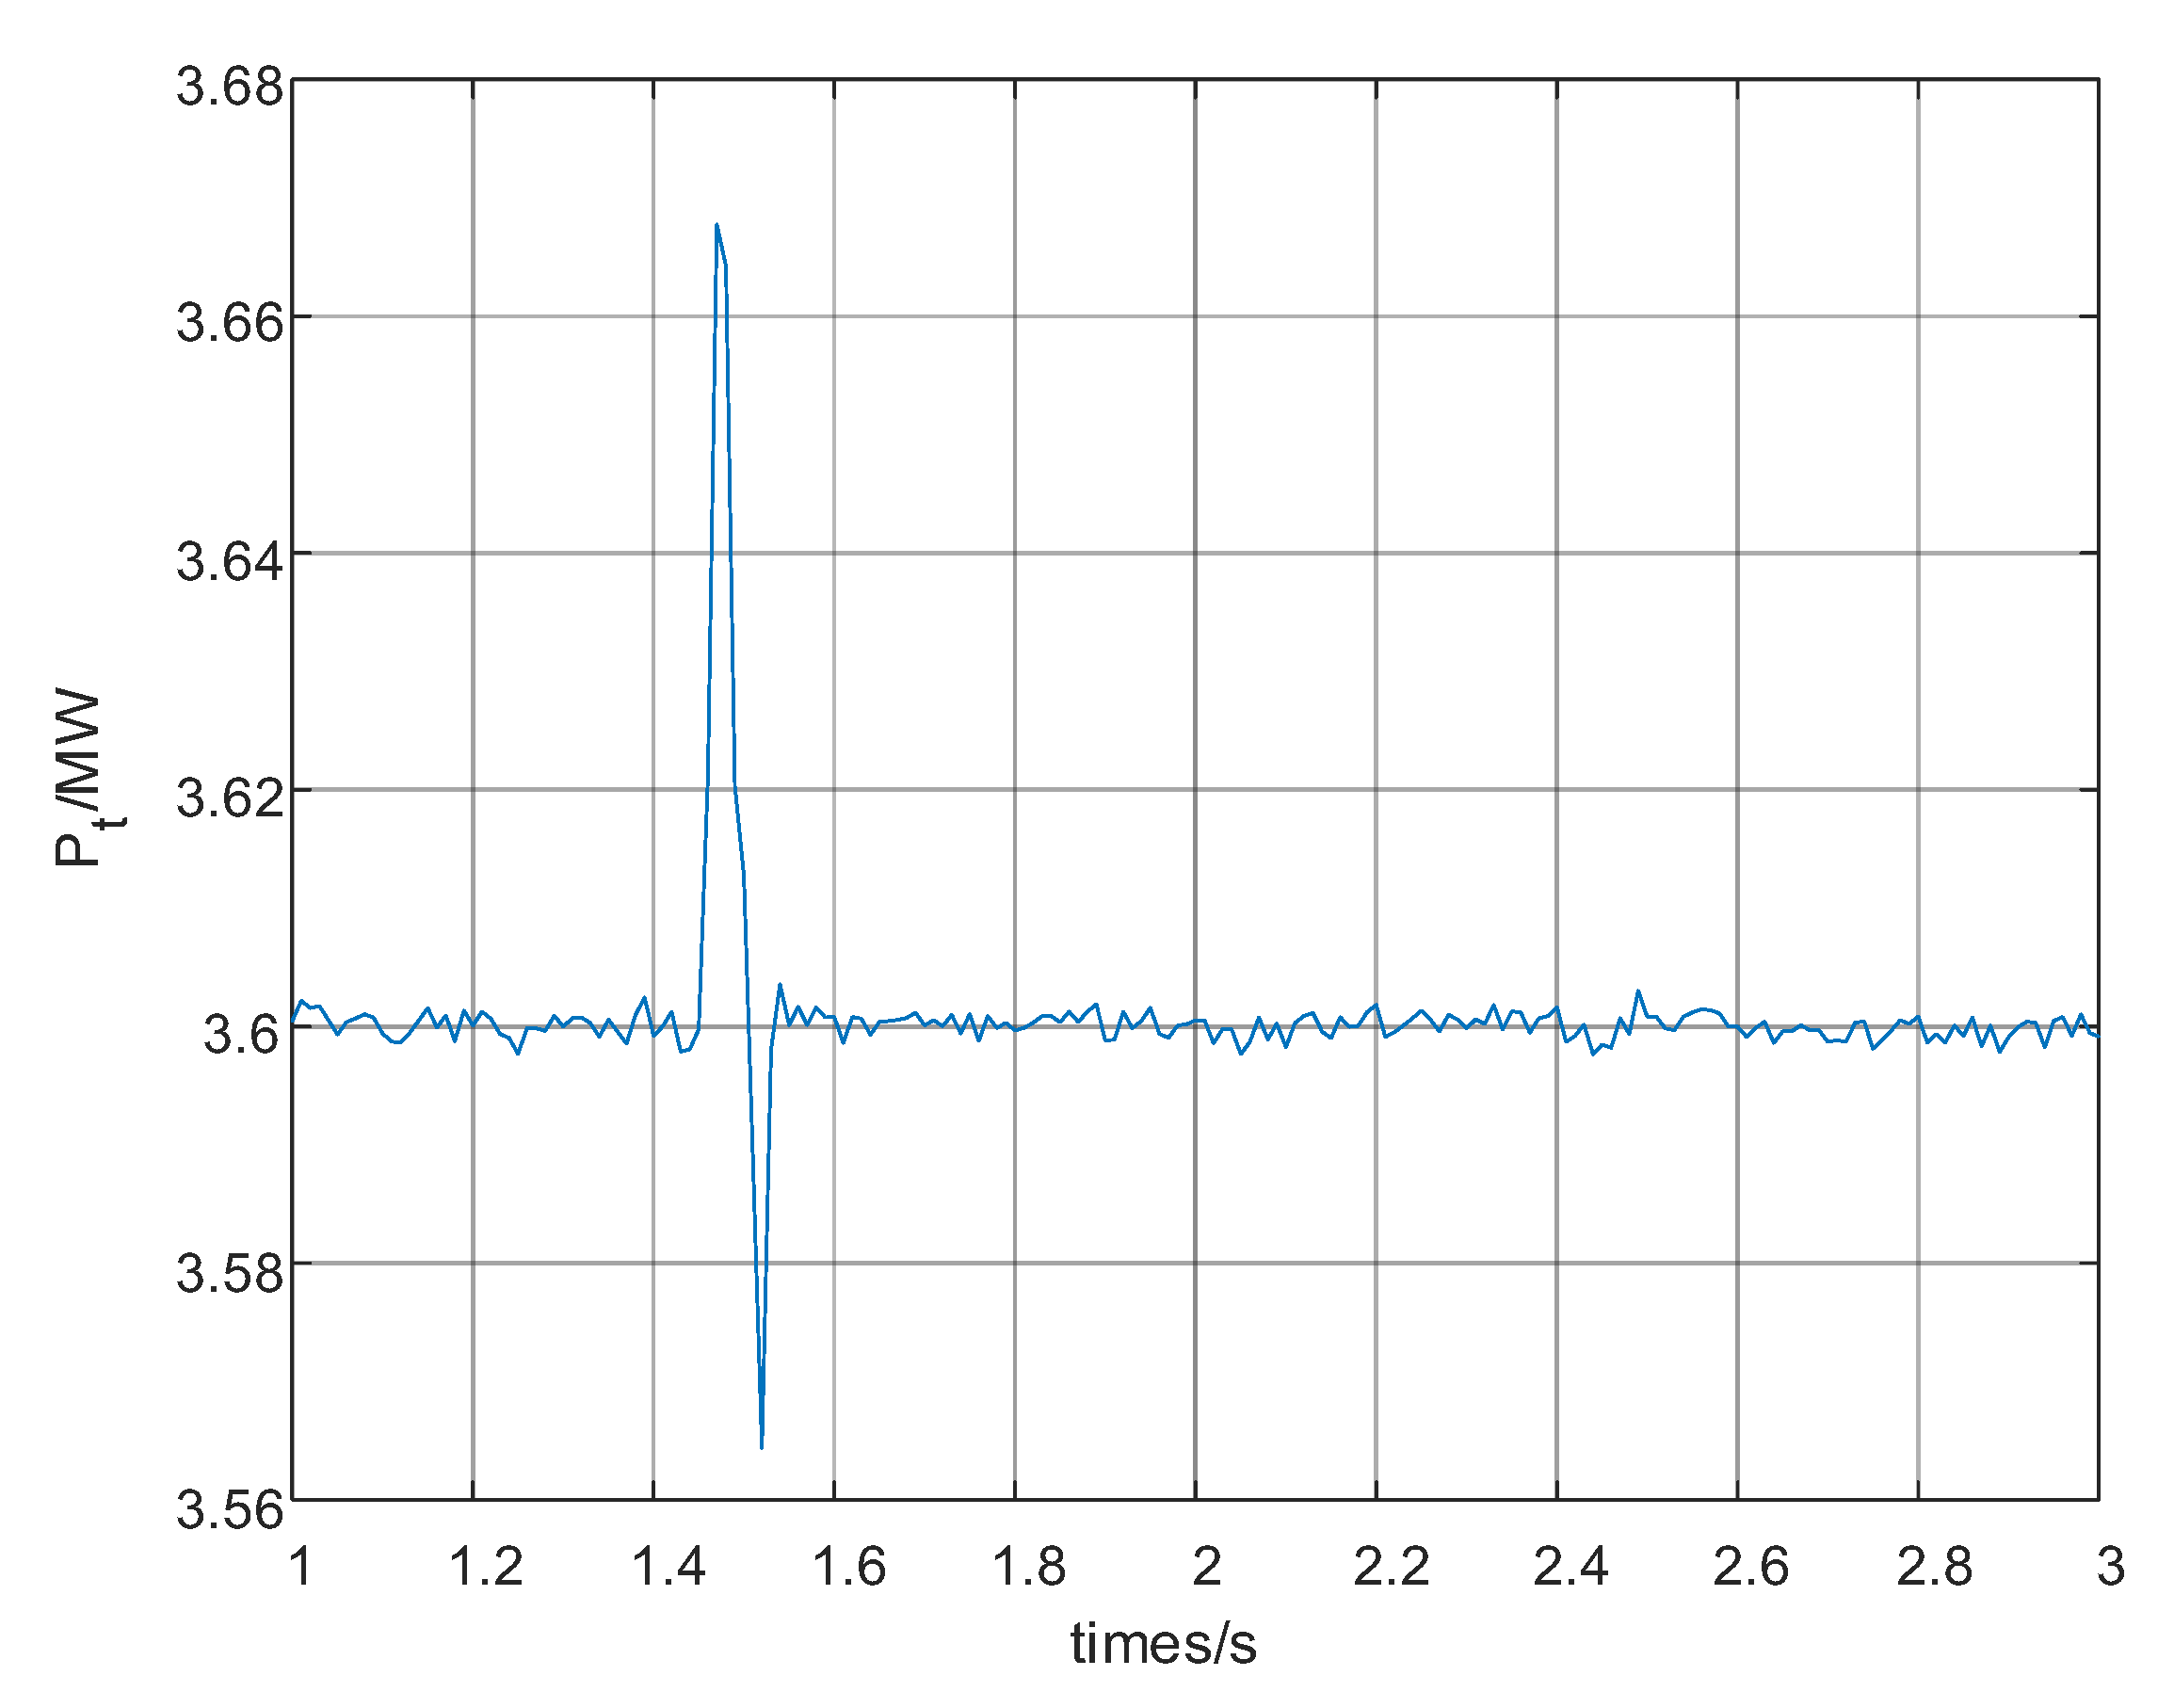
5.5.2. Sudden Load Changes
A 50% load increase was applied at t = 3.0 s to evaluate the NDPFC’s response to sudden load changes.
Figure 23 shows the system response.
The NDPFC successfully maintains the preset power flow in the controlled line despite the sudden load change. The maximum transient deviation is approximately 7%, and the system returns to a steady state within 180 ms. This performance demonstrates the controller’s ability to rapidly adapt to changing system conditions while maintaining stable operation.
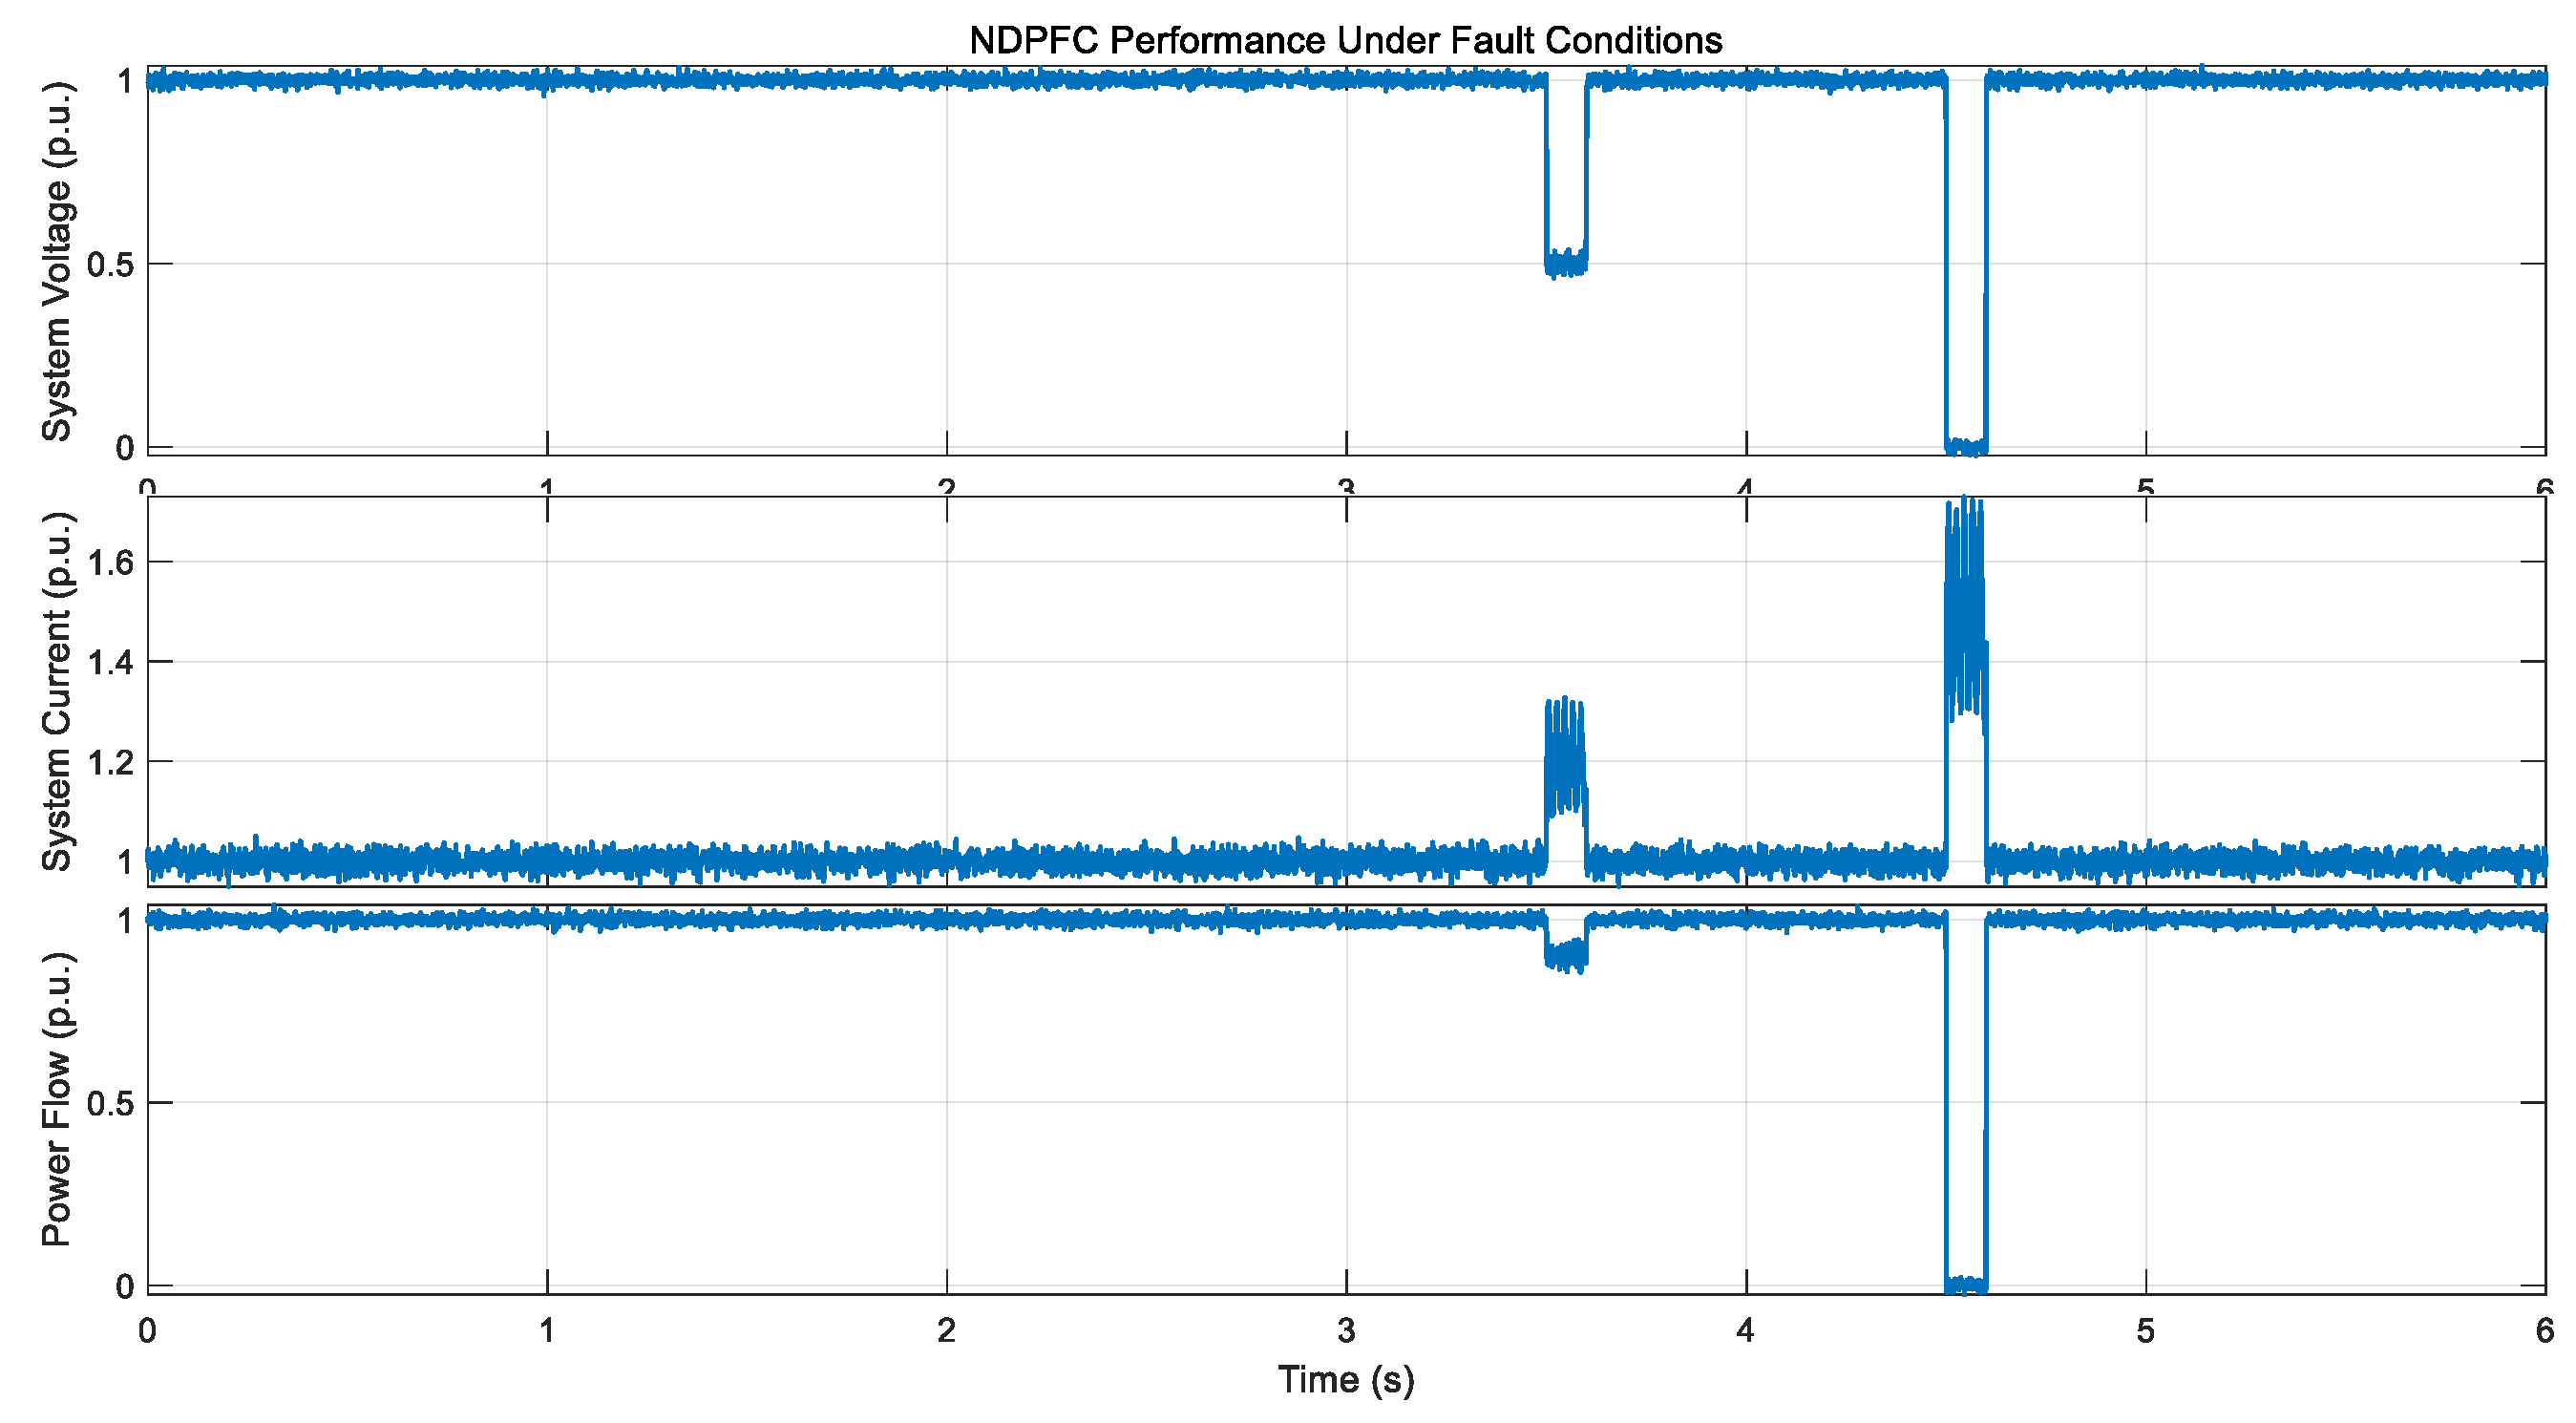
5.5.3. Fault Conditions
Both single-phase-to-ground and three-phase faults were simulated to evaluate the NDPFC’s fault ride-through capability. A single-phase-to-ground fault was applied at t = 3.5 s for 0.1 s, followed by a three-phase fault at t = 4.5 s for 0.1 s.
Figure 24 shows the system response.
During the single-phase fault, the NDPFC continues to operate without tripping, compensating for the voltage imbalance and maintaining power flow in the healthy phases. After fault clearance, the system returns to normal operation within 200 ms. During the three-phase fault, the NDPFC enters a protection mode, limiting fault current contribution and returning to normal operation within 250 ms after fault clearance. This performance confirms the NDPFC’s robust fault ride-through capability.
This comprehensive testing under various disturbance scenarios demonstrates the NDPFC’s superior robustness compared to conventional power flow controllers. The proposed control strategy effectively handles system disturbances while maintaining stable operation and quickly returning to preset control objectives.
6. Conclusions
This research proposes an innovative Novel Distributed Power Flow Controller (NDPFC) topology that overcomes the limitations of traditional Distributed Power Flow Controllers (DPFCs) in distribution network applications. The main innovations and achievements are as follows:
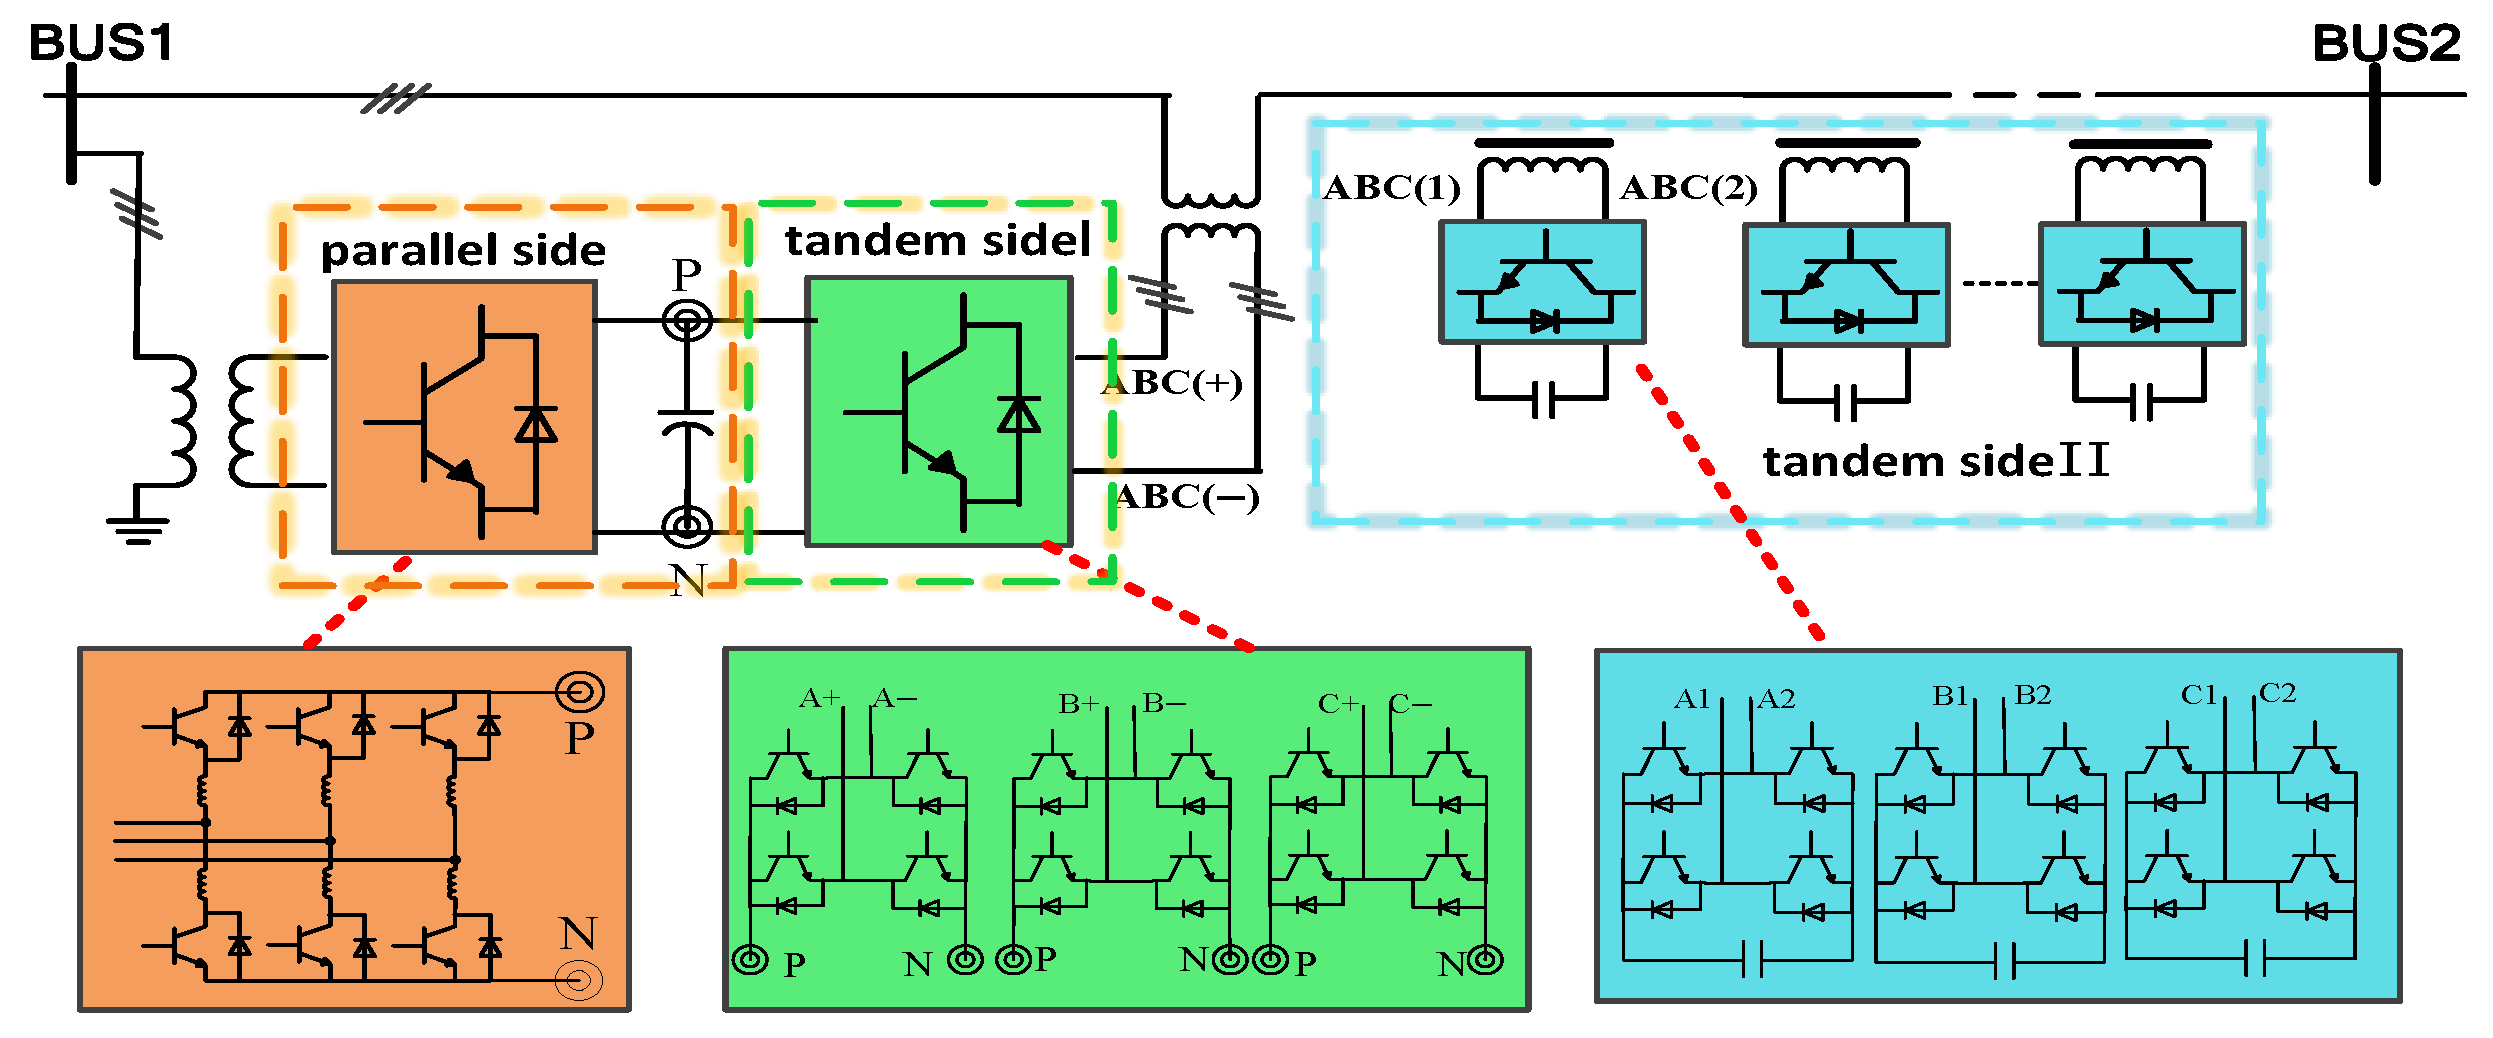
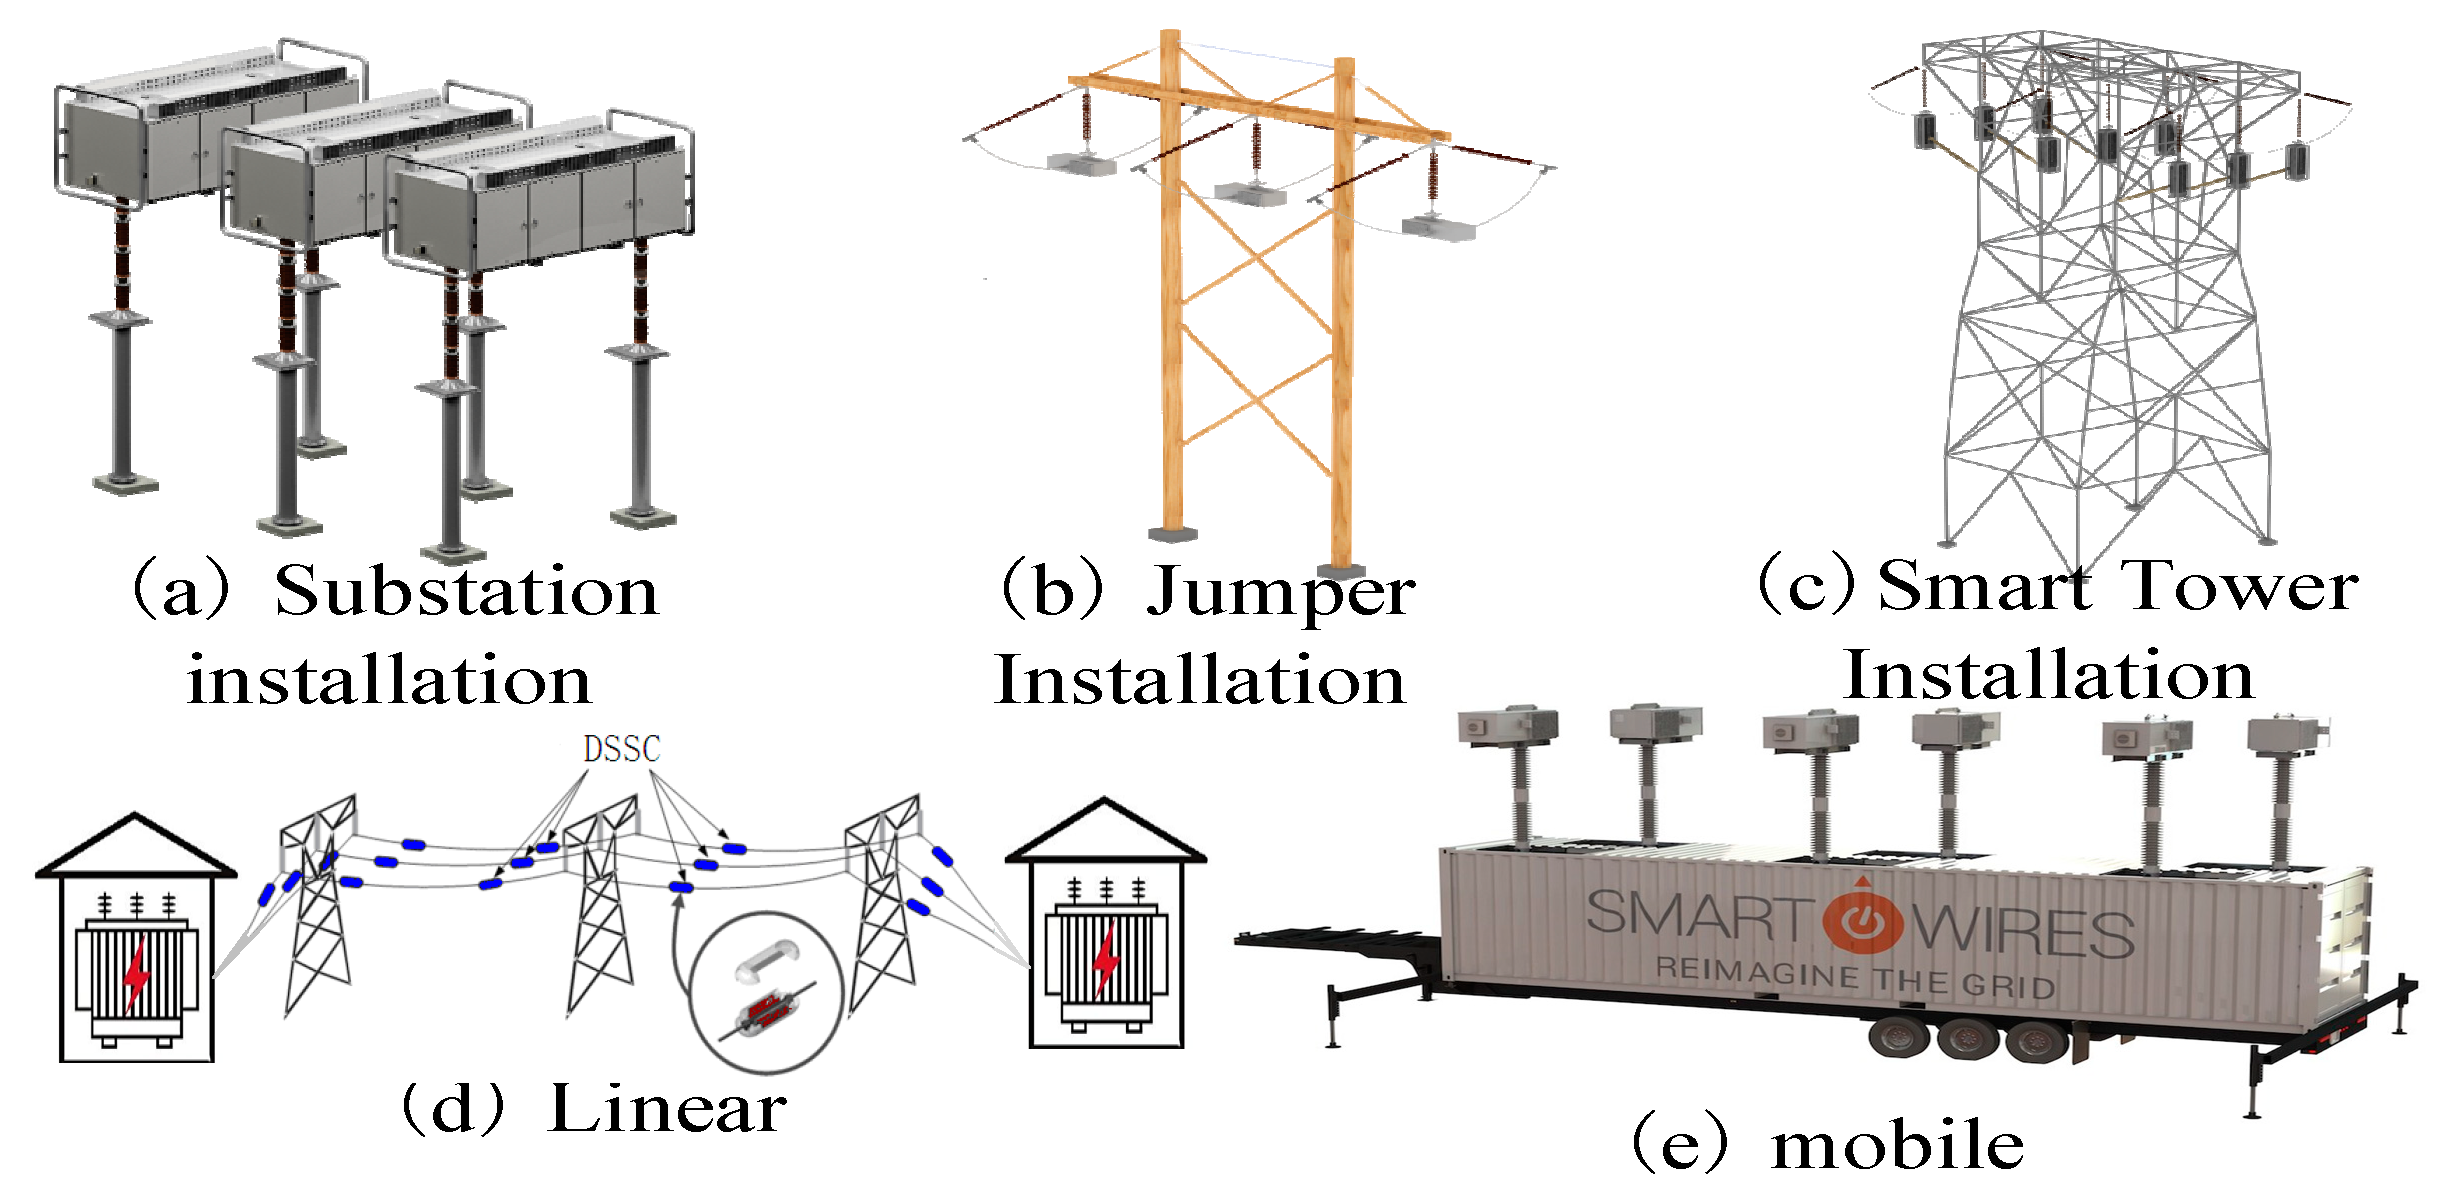
First, this paper designs a novel breakthrough NDPFC topology that eliminates dependence on third-harmonic currents while avoiding the need for specific transformer configurations. This design includes a shunt side and two series sides (Series-I and Series-II), with Series-II employing D-FACTS technology through multiple small-capacity single-phase converters for flexible installation deployment.
Second, the research establishes a complete mathematical model for the NDPFC, including electromagnetic transient models for both shunt and series sides. Based on this, a series-side I and II control strategy using a triple-loop control mechanism is proposed, significantly enhancing system robustness and control precision. A comprehensive stability analysis using eigenvalue methods and frequency domain techniques confirms the system’s robustness under various operating conditions. The systematic controller parameter selection methodology ensures optimal dynamic performance with sufficient stability margins. Theoretical analysis and simulation results demonstrate that this control strategy effectively achieves precise control of system power flow.
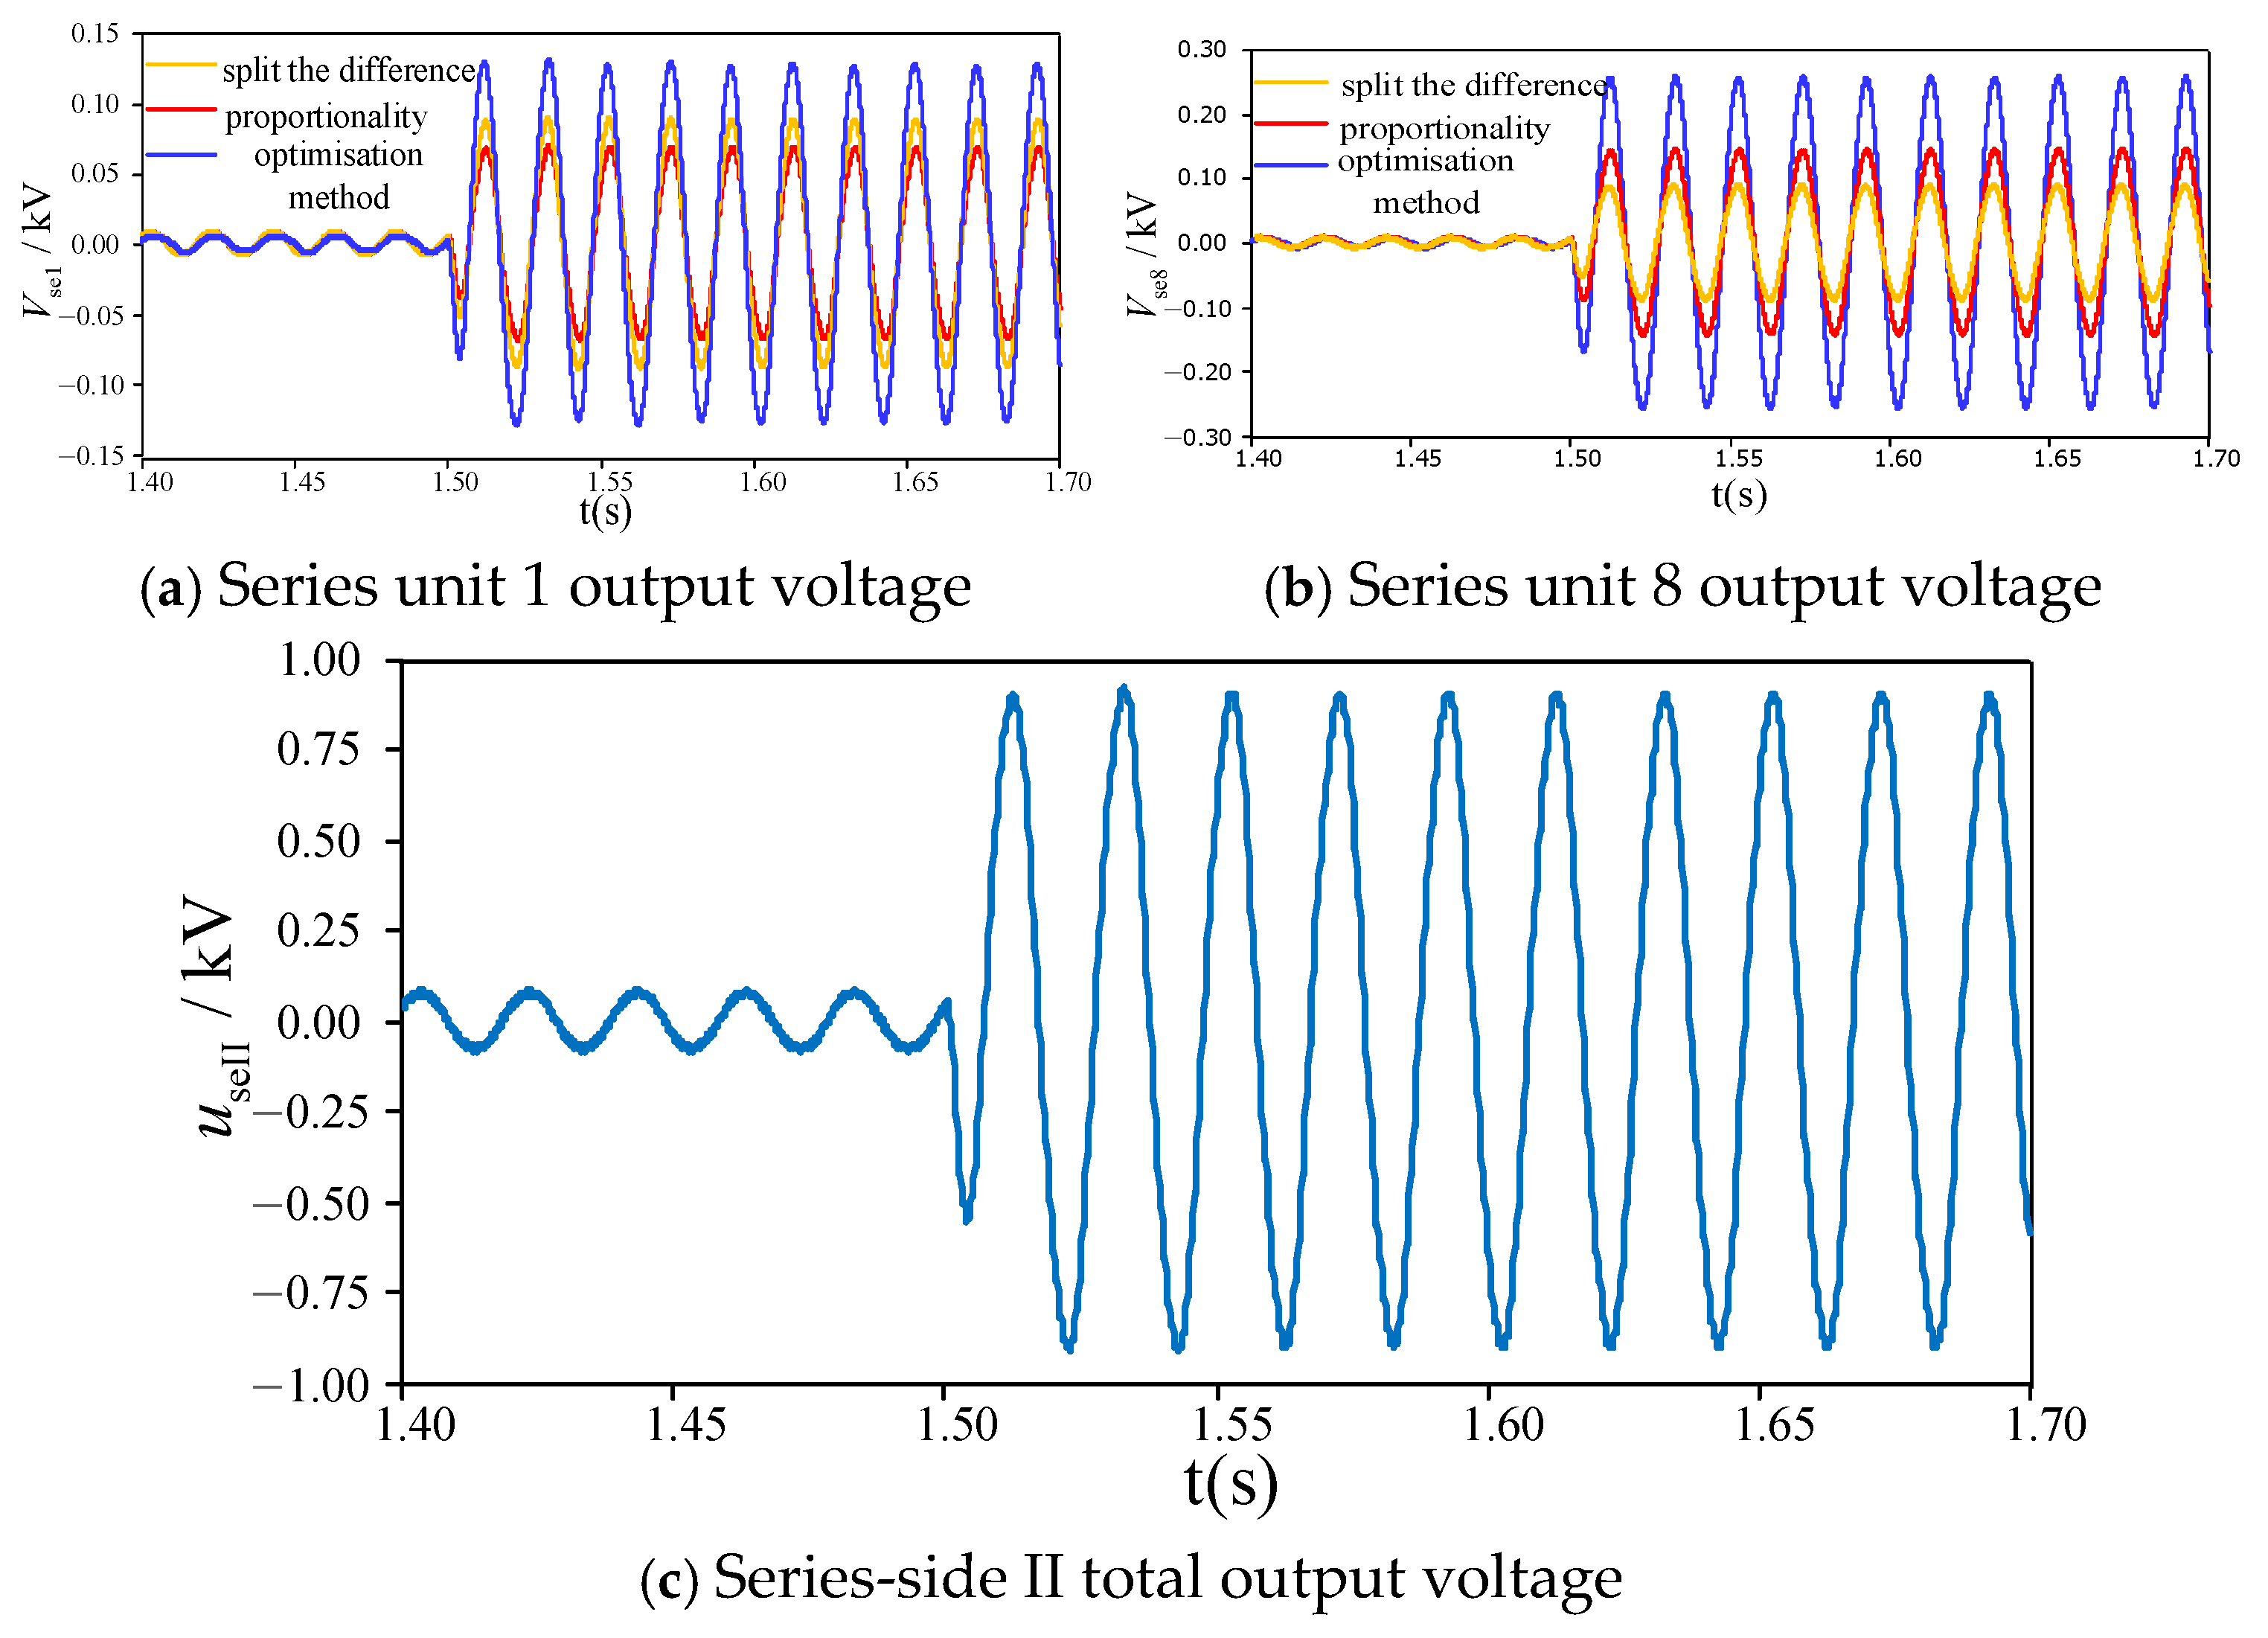
Third, this paper thoroughly investigates the NDPFC multi-unit output coordination optimization control strategy. By establishing detailed loss models, including converter losses and coupling transformer losses, an optimization control method based on device loss minimization is proposed. This method not only improves system economics but also achieves efficient coordinated operation of all series units.
Fourth, a comprehensive comparative analysis with conventional power flow controllers demonstrates the NDPFC’s superior performance with 15% faster response time, 12% lower system losses, and 20% lower implementation costs compared to traditional DPFC. The NDPFC also shows excellent robustness under various system disturbances including voltage sags, sudden load changes, and fault conditions.
Finally, verification through the PSCAD/EMTDC simulation platform confirms the NDPFC’s excellent performance in various distribution network application scenarios:
(1) The NDPFC’s elimination of harmonic dependencies and transformer constraints significantly broadens its applicability compared to conventional DPFCs, while its control speed surpasses that of STATCOMs (typically >0.2 s for active power).
(2) In three-phase asymmetric compensation, the NDPFC reduces a 4.20% asymmetry degree to near 0 within 0.2 s, achieving balanced three-phase power flow.
(3) In renewable energy integration, the system effectively coordinates local load and renewable energy output, ensuring stable system operation.
(4) Under challenging operating conditions including voltage sags, sudden load changes, and fault scenarios, the NDPFC maintains stable operation with minimal performance degradation and rapid recovery after disturbance clearance.
This research provides a new technical solution for distribution network power flow management with significant theoretical value and practical application prospects. Future research could further explore NDPFC applications in more complex distribution network environments and optimize its control strategies by incorporating artificial intelligence technologies.


