Abstract
With the continuous expansion of distributed photovoltaic (PV) integration, the hosting capacity of distribution networks has become a critical issue in power system planning and operation. Under varying meteorological and load fluctuation conditions, traditional assessment methods often face adaptability and uncertainty handling challenges. To enhance the practical applicability and accuracy of hosting capacity evaluations, this paper proposes a PV hosting capacity assessment model that incorporates source–load uncertainty and constructs an alternative scenario optimization evaluation framework driven by target-oriented scenario generation. The model considers system constraints and employs the sparrow search algorithm (SSA) to optimize the maximum PV hosting capacity. On the source side, PV output scenarios with temporal characteristics are generated based on the mapping relationship between meteorological factors and PV power. On the load side, historical data are employed to extract fluctuation ranges and to introduce random perturbations to simulate load uncertainty. In addition, a PV power scenario generation method based on the Wasserstein generative adversarial network with gradient penalty (WGAN-GP) is proposed, integrating physical-data dual-driven strategies to enhance the physical consistency of generated data, while incorporating a target-driven weighted sampling mechanism to improve its learning ability for key features. Case studies verify that the proposed method demonstrates strong adaptability and accuracy under varying meteorological and load conditions.
1. Introduction
As the share of renewable energy in power systems continues to grow, the large-scale integration of photovoltaic (PV) generation has become a significant trend in the development of future distribution networks [1,2]. However, the high randomness of PV output poses challenges to the stable operation of the grid, making PV hosting capacity a key metric for assessing the grid’s ability to accommodate PV generation [3,4]. Accurately evaluating PV hosting capacity helps optimize the allocation of PV resources, enhances grid scheduling flexibility, and provides critical support for renewable energy integration and grid stability. However, PV output is significantly influenced by weather variations, and meteorological uncertainties directly affect the fluctuation characteristics of PV power, presenting challenges regarding the accuracy of hosting capacity assessments [5,6]. Therefore, there is an urgent need to establish a reliable scenario generation method that fully captures the impact of meteorological uncertainties on PV hosting capacity, ensuring the reliability of the assessment results.
The core objective of a PV hosting capacity assessment is calculating the maximum PV output the grid can accommodate. Existing research mainly focuses on optimizing calculation methods [7] and improving assessment models [8]. The former enhances assessment accuracy and computational efficiency through optimization techniques, while the latter improves the applicability of results by constructing mathematical models that better reflect grid operational characteristics. For example, some studies have introduced improved grey wolf optimization algorithms [9] or data-driven approaches based on neural networks [10] to enhance the accuracy and efficiency of the calculation. Meanwhile, other works have incorporated voltage sensitivity analysis [11], urban spatial distribution and demographic features [12], and rooftop PV potential estimations based on satellite imagery [13] to better reflect practical grid constraints and spatial deployment characteristics. Although existing research has improved the accuracy and applicability of hosting capacity assessments, most methods are based on specific PV scenarios, making it difficult to adapt to complex weather conditions. Therefore, developing a PV hosting capacity assessment method that can accommodate alternative scenario variations and effectively handle the uncertainties of PV power fluctuations is a key challenge in enhancing the adaptability of the assessment methods.
Researchers have begun to focus on generating PV power scenarios to enhance the adaptability of PV hosting capacity assessments. Existing approaches can generally be classified into two categories—those based on adjusting historical data characteristics and those driven by data. The first involves adjustments based on historical data characteristics, typically employing density-based clustering methods [14] or random perturbation simulation strategies [15] to extract and refine structural features from existing samples to construct representative scenarios. The second category comprises data-driven methods, often relying on recurrent neural network structures [16] or hybrid models combining deep learning and clustering algorithms [17] to expand the sample distribution and better capture complex fluctuation patterns. In general, methods based on historical data offer clear modeling logic and are easy to implement, making them suitable for scenarios with high-quality data and relatively stable fluctuations. However, they may have limited generalizability under complex meteorological conditions. In contrast, data-driven methods exhibit stronger capabilities in nonlinear modeling and generating diverse samples, making them more suitable for assessments under high uncertainty. However, they impose greater demands regarding model design and training quality.
In recent years, deep learning generative models have become one of the key methods for PV power scenario generation research due to their advantages in feature extraction and modeling nonlinear relationships [18,19]. Generative adversarial networks (GANs), as a representative in this field, use adversarial training between the generator and discriminator, enhancing the quality of generated samples through iterative competition [20,21]. With the continuous optimization of GAN technology, several variations have emerged and are widely applied in complex tasks, such as renewable energy scenario generation [22,23]. Building upon this foundation, recent studies have further improved scenario generation performance by incorporating conditional constraints [24], enhancing the correlation between feature representations and control encoding [25], and optimizing the structural mapping between inputs and outputs [26]. In summary, GAN models demonstrate strong potential in improving PV power scenario generation capabilities, effectively supporting PV hosting capacity assessment models, especially when dealing with complex meteorological conditions and source–load fluctuations, thus helping to enhance the accuracy and applicability of the assessments.
This study proposes a PV hosting capacity assessment model for distribution networks considering source–load uncertainty. The main contributions of this work are summarized as follows:
- A PV hosting capacity evaluation model is introduced, employing an alternative scenario optimization framework to assess the maximum PV integration capacity while considering system constraints such as voltage stability, power flow balance, and line transmission capacity;
- A scenario generation method based on WGAN-GP is introduced to simulate the random fluctuations in PV power, ensuring that the generated PV power scenarios exhibit reasonable physical characteristics. A load uncertainty modeling method is proposed, which constructs fluctuation ranges from historical data and introduces random disturbances to account for load uncertainty;
- A physics-data joint-driven strategy is proposed to control the generated samples, ensuring that the generated scenarios exhibit diversity and align with actual meteorological conditions and the operational rules of the power system, thereby enhancing the data’s physical plausibility and reliability;
- To enhance the structural controllability of scenario generation, this paper improves the original WGAN-GP framework by introducing a target-driven weighted sampling mechanism. This modification enables the generator to focus more effectively on key structural samples, thereby improving its ability to represent critical features and increasing the accuracy and diversity of generated scenarios.
The paper is structured as follows: Section 2 introduces the PV system model and the PV hosting capacity assessment model; Section 3 describes the WGAN-GP-based scenario generation method and load uncertainty modeling; Section 4 presents a case study analysis and the results; Section 5 provides the discussion; and Section 6 concludes the study.
2. PV Hosting Capacity Assessment Model and Solution Method for Distribution Networks
2.1. PV System Model for Distribution Networks
PV output is subject to fluctuations and intermittency, primarily influenced by meteorological conditions, with solar irradiance and module temperature being the key factors that determine PV power. To quantitatively describe the characteristics of PV generation, it is necessary to establish a mathematical model that characterizes the variation of PV output under different environmental conditions. The output power of the PV system can be expressed as follows:
where PPV represents the actual output power of the PV system; η is the power factor of the PV system, typically set at 0.9; S is the rated installed capacity of the PV system; It is the actual irradiance at time t (kW/m2); Is is the irradiance under standard test conditions, typically set at 1 kW/m2; and αp is the power temperature coefficient (%/°C), representing the output sensitivity to cell temperature. It is treated as a constant in this study and assigned a value of –0.0045; Tcell, t is the PV module surface temperature at time t (°C), which is approximated by the ambient temperature in this study; and Tnorm is the surface temperature of the PV module under standard test conditions, typically 25 °C. The specific values of the modeling parameters used in this study can be found in Table 1 in Section 4.1.

Table 1.
Parameters of PV capacity assessment.
The above model shows that PV power increases with irradiance, while higher temperatures generally reduce the module’s conversion efficiency, thereby impacting the power generation performance. Therefore, when assessing the impact of PV integration on the distribution network, it is essential to consider both irradiance and temperature variations to accurately characterize the PV output characteristics, providing theoretical support for constructing the PV hosting capacity model.
2.2. PV Hosting Capacity Assessment Model for Distribution Networks
When integrating distributed PV systems into a distribution network, it is crucial to ensure safety and stability during the network’s operation. Therefore, a PV hosting capacity assessment model must be established to determine the maximum PV integration capacity to satisfy the network’s physical limitations. The optimization goal of the model is to maximize the PV integration capacity while considering key constraints such as voltage stability, power balance, and line transmission capacity. The optimization is performed across a 24 h time sequence to ensure the network’s stability and performance [27].
2.2.1. Objective Function
The core objective of a PV hosting capacity assessment is to determine the maximum PV integration capacity at each node while ensuring the safe and stable operation of the distribution network. The mathematical expression for this objective is as follows:
where represents the total maximum PV integration capacity; N is the total number of PV nodes; and Si is the PV integration capacity at node i.
This objective function is used to quantify the PV hosting capacity of the distribution network, determining the maximum power capacity that can be integrated at each node while satisfying the system’s operational constraints, thereby enhancing the utilization of renewable energy in the distribution network.
2.2.2. Constraint Condition
The PV hosting capacity assessment model must adhere to the set of operational constraints Ωcon of the distribution network to ensure that large-scale PV integration does not lead to issues such as voltage violations, power flow imbalances, or line overloading. All constraints must be satisfied at any given time t ∊ T over 24 h.
- 1.
- Power flow equation constraint C1
Power flow equations are the fundamental constraints that describe the operation of the distribution network, representing the dynamic balance between the injected power at the nodes, the load demand, and the transmission power through the lines. The specific forms of the power flow equations are as follows:
where Pij,t and Qij,t are the active and reactive power flows at time t from node i to node j; and are the active and reactive load power at node j at time t; and and are the active and reactive power outputs of the PV system at node j at time t. The PV system typically only provides active power, and the reactive power can be considered as zero or within a specific adjustable range; Rij and Xij are the resistance and reactance of the line between nodes i and j; Ui,t is the voltage at node i at time t; and Iij,t denotes the current flowing through the line between nodes i and j at time t. Ωj represents the set of all nodes connected to node j. Pjk,t and Qjk,t denote the active and reactive power flows from node j to each adjacent node k at time t, where k belongs to the adjacent node set Ωj.
- 2.
- Branch transmission capacity constraint C2
The branch transmission capacity constraint ensures that the power transmitted through each line in the distribution network does not exceed its maximum capacity, thereby preventing overloads and ensuring the safety of the grid:
where is the maximum transmission power of the line between nodes i and j, and ΩC is the set of all lines in the network.
- 3.
- Voltage deviation constraint C3
The voltage levels in the distribution network must be maintained within the specified operational range to ensure that PV integration does not lead to voltage violations. Excessive voltage can damage equipment, while insufficient voltage can affect power quality, leading to a worse user experience. Therefore, the voltage deviation constraint must satisfy the following conditions:
where UN is the nominal voltage; ΩNode is the set of all nodes in the system; and εH and εL are the upper and lower limits of the prescribed voltage deviation, respectively. In this study, the voltage deviation is set to ±5%; i.e., the nodal voltage is constrained within the range of 0.95 to 1.05 pu.
- 4.
- PV system operation constraint C4
The actual output of the PV system cannot exceed its maximum allowable output, and it must ensure that it does not generate negative power (i.e., the power must always be non-negative). The PV output constraint is expressed as follows:
where is the maximum allowable output of the PV system at node i.
2.3. PV Hosting Capacity Assessment Method Based on Sparrow Search Optimization
In order to solve the PV hosting capacity assessment model, this study employs the sparrow search algorithm (SSA). The foraging behavior of sparrows was the inspiration for the SSA, and it exhibits strong global search capabilities. This method effectively handles the uncertainties in PV capacity integration and the constraints of the power grid. It optimizes the PV integration plan and determines the maximum PV hosting capacity that satisfies grid stability requirements.
The SSA solution process is illustrated in Figure 1, which involves several key steps, including population initialization, the calculation of fitness, a position update, a constraint check, and the determination of convergence. Initially, the sparrow population is randomly initialized, with each sparrow representing a specific PV capacity configuration. The fitness of each configuration is then evaluated, and the optimization plan is checked to ensure it satisfies the grid’s operational constraints. During the iteration process, the positions of the sparrows are updated based on their individual best solution and the global best solution, progressively optimizing the PV integration plan. If a sparrow violates any constraint, its position is adjusted or penalized in terms of fitness to ensure the feasibility of the solution. The algorithm terminates once the convergence criteria are met, and the optimal PV integration is output [10].
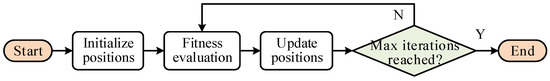
Figure 1.
Process of SSA for capacity assessment.
- 1.
- Population initialization
In the initialization phase of the SSA, the number of sparrows, denoted as N, is set, and the search space for PV hosting capacity is defined, which includes the minimum and maximum allowable PV capacity. Then, the initial positions of the sparrows are randomly generated to ensure the complete coverage of the search space. This initialization can be performed using the following formula:
where and represent the minimum and maximum allowable PV hosting capacities, respectively. Rand(0,1) is a random number generated between 0 and 1, which is used to generate the initial position of each sparrow randomly.
- 2.
- Fitness calculation
The fitness function considers the optimization objective of PV hosting capacity and includes penalty terms to ensure that the grid stability constraints are satisfied. The fitness function can be expressed as follows:
The formula’s first term represents the total PV hosting capacity at the m-th iteration. The second term is the penalty for violating constraints, where λ is the penalty factor, and ϵk represents the degree of violation for the k-th constraint if the constraint is satisfied (ϵk = 0).
- 3.
- Position update
In each iteration, the positions of the sparrows are updated according to specific rules. The core idea is to simulate the foraging behavior of sparrows, combining global and local search strategies to approach the optimal solution progressively. The follower sparrows update their positions by moving towards the leader sparrow’s position. The position update formula is as follows:
where represents the position of the i-th sparrow at the m-th iteration; represents the position of the leader sparrow, which is the best solution in the current population; and c1 and c2 are adjustment coefficients that control the weight of exploration and exploitation behaviors, respectively.
The leader sparrow adjusts its position based on the current global best solution, guiding the entire population toward convergence to the optimal solution. The position update formula for the leader sparrow is as follows:
where γ is the adjustment factor that controls the magnitude of the position update for the leader sparrow; the best solution represents the position of the sparrow with the best fitness value in the current population.
- 4.
- Convergence determination
The algorithm converges and terminates when the maximum number of iterations M is reached or the change in fitness values falls below a predefined threshold. The optimal PV integration plan that satisfies all the constraints is then output. The mathematical expression is as follows:
where represents the total PV hosting capacity that satisfies all constraints. This result indicates the maximum PV capacity that can be integrated into the distribution network while ensuring all operational constraints are met, guaranteeing that the algorithm has found the global optimal solution within the search space.
3. Source–Load Uncertainty Scenario Generation and Optimization Method
3.1. PV Scenario Generation Method Based on WGAN-GP
The assessment of PV hosting capacity depends on constructing representative scenarios that capture PV output characteristics under varying meteorological conditions. To this end, this study employs the WGAN-GP for scenario generation, leveraging adversarial training between the generator and discriminator to produce diverse and realistic sample data [28].
3.1.1. Generator Design
The core task of the generator is to generate samples that follow the target distribution based on the noise input to meet the scenario requirements of the PV hosting capacity assessment. To ensure the diversity and authenticity of the generated data, the generator’s design includes data input, a network structure, and a loss function.
- 1.
- Data input
The input to the generator is random noise z, which follows a specific probability distribution to ensure that the generator explores a more expansive sample space, thereby increasing the diversity and generalization ability of the generated samples.
- 2.
- Network structure
The generator uses a multi-layer, fully connected network for data mapping. The input layer transforms the random noise to provide a basis for subsequent feature learning. The multi-layer hidden layers employ nonlinear activation functions (such as ReLU or Leaky ReLU) to extract data distribution features and learn underlying patterns. The output layer generates samples that conform to the target distribution, ensuring the continuity and stability of the data.
- 3.
- Loss function
The training objective of the generator is to minimize the Wasserstein distance between the generated data and the real data, ensuring that the generated data approaches the actual sample data in terms of distribution shape and dynamic characteristics. The loss function LG is expressed as follows:
where represents the generated samples from the generator; Pg is the distribution of the generated samples; and is the score assigned by the discriminator to the generated samples. By minimizing this loss function, the generator can continuously adjust its generation strategy to align its output data more closely with the actual data.
3.1.2. Discriminator Design
The core task of the discriminator is to measure the distributional difference between the generated data and real data, providing an optimization direction for the generator. The WGAN-GP discriminator computes the Wasserstein distance to assess the closeness of the data distributions and introduces a gradient penalty to ensure the model satisfies the K-Lipschitz continuity condition. This approach improves the training stability and ensures the authenticity and diversity of the generated data.
- 1.
- Data input
The input to the discriminator consists of both real data and data generated by the generator. By feature extraction and comparison, the discriminator measures the closeness between the generated and real data.
- 2.
- Network structure
The discriminator employs a deep convolutional network to extract temporal features and learn data distribution patterns. The input layer receives and normalizes the time-series data to ensure numerical stability. The convolutional layers use convolutions to capture time-dependent characteristics, enhancing the discriminator’s ability to represent dynamic changes in the data. The fully connected layers map the extracted features to a lower-dimensional space and compute scores. The output layer generates the scores to assess the authenticity of the input data. A higher score indicates that the data are closer to the real distribution.
- 3.
- Loss function
The optimization objective of the discriminator is represented by the Wasserstein distance, maximizing the score gap between real and generated data and introducing a gradient penalty term to ensure stable training. The loss function is given by the following:
where represents the real samples; Pr is the real data distribution; is the gradient of the discriminator with respect to the generated sample; and λGP is the gradient penalty strength coefficient. The first term in Equation (16) increases the score for real data to enhance the discriminator’s ability. The second term reduces the score for generated data to increase the score gap between the real and generated data. The third term LGP applies a gradient penalty to constrain the gradient norm, ensuring it satisfies the 1-Lipschitz condition, as defined in Equation (17). Specifically, the penalty forces the gradient norm of the discriminator output with respect to the interpolated input to remain close to 1, thereby softly enforcing the Lipschitz constraint. This regularization improves training stability and helps prevent gradient vanishing or explosion issues.
The operational flow of WGAN-GP is shown in Figure 2, and its core mechanism includes the following iterative optimization process. First, the generator receives random noise as input and generates samples through nonlinear mapping. Subsequently, the discriminator is trained to distinguish between real and generated data, calculating the Wasserstein distance to measure the distributional difference between the two while applying a gradient penalty term to ensure the model satisfies the Lipschitz continuity constraint. After the discriminator has been trained, the feedback information is used to optimize the generator, enabling it to progressively generate data that closely approximates the real data distribution, thereby improving its authenticity and fitting accuracy. The generator and discriminator are optimized alternately in an iterative training process until the statistical characteristics of the generated data sufficiently match those of the real data.
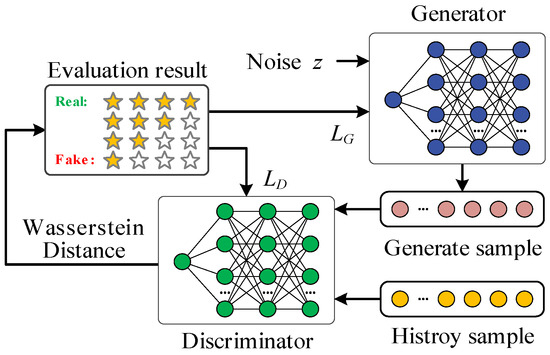
Figure 2.
The network structure of WGAN-GP.
3.1.3. Sample Weight Assignment
During the optimization process of the discriminator, appropriate weight allocation helps strengthen the model’s learning of target–feature samples while preserving the diversity of the generated data. Improper weight adjustment may cause the model to become biased toward specific categories, thereby affecting the balance of the data distribution. To address this, this paper introduces target feature screening, ensuring that weight adjustments are applied only to samples that match the defined target features. This allows the model to focus on learning key features while maintaining data diversity. The screening rule is defined as follows:
where Fi represents the statistical feature value of sample i (such as the maximum irradiance), and Fmin and Fmax are the screening thresholds used to retain samples whose feature values fall within this interval. Sd is the target feature screening indicator, where Sd = 1 indicates that the sample matches the target feature and will participate in the weight adjustment process; otherwise, it will not affect the weight calculation.
After completing the target feature screening, a dynamic adjustment strategy based on generation error feedback is adopted. This allows the sampling weights to be adaptively optimized throughout the training process, ensuring that the model sufficiently learns from samples within the target feature interval while avoiding mode collapse. The dynamic weight is calculated using the following formula:
where represents the weight of sample d at the m-th training iteration, β is the weight adjustment coefficient, and denotes the generation error of sample d at iteration m, which is specifically defined as follows:
where and denote the generated sample and the real sample for the m-th training iteration, respectively; and D(·) represents the score assigned by the WGAN-GP discriminator.
The average generation error within the target feature interval is calculated as follows:
where NS represents the number of samples that meet the target feature condition. The generation error of each sample and the average error within the target interval jointly determine the adjustment direction of the sampling weight. When the individual sample error exceeds the average error (i.e., ), the sampling weight is increased to strengthen the model’s learning on that sample. Conversely, when the sample error is below the average (i.e., ), the sampling weight is decreased to prevent the model from overfitting to specific samples and to maintain the overall diversity of the data distribution.
Based on this, the loss function of the discriminator is modified as follows:
where ωd affects only the expectation of real samples; increasing the weights of key target samples encourages the discriminator to focus more on the distributional characteristics of samples that exhibit the desired features.
This strategy enhances the model’s attention to key samples during the early stages of training, enabling faster adaptations of the generated data to the target distribution. In the later stages, the sample weights are dynamically adjusted to ensure that the generated data not only reflect the target features but also maintain diversity, thereby effectively preventing mode collapse. Through proper weight assignment and adaptive adjustment, the generator can effectively learn the distribution patterns of target feature samples and ultimately produce scenarios that meet the intended structural objectives.
3.1.4. Probability Adjustment Based on Sample Weight
In PV power scenario generation, samples with specific target characteristics are often underrepresented in the dataset. Even when assigned higher training weights, these samples may still have limited influence on the model due to their low selection frequency. To improve the match between generated data and target characteristics, this study introduces a probability adjustment strategy based on dynamic sample weights. By increasing the selection probability of target–feature samples, the model’s learning effectiveness for those features is enhanced, thereby improving both the quality and diversity of the generated data.
The selection probability P(d) of sample d is determined by its weight ωd and is calculated as follows:
where N is the total number of samples. This adjustment strategy increases the occurrence frequency of target-specific samples within each training batch, thereby enhancing their influence on the optimization of the discriminator. As a result, the discriminator becomes more sensitive to key feature distributions, while the generator improves its ability to learn from target samples, ensuring that the final generated outputs align with the expected structural characteristics.
3.2. Load Uncertainty Modeling Method
In PV hosting capacity assessments for distribution networks, load fluctuation uncertainty is one of the key factors affecting their PV power integration capability. Load fluctuations are influenced not only by seasonal changes but also by daily electricity consumption patterns. In particular, in a given region, the daily load profile typically exhibits a regular pattern of variation. Due to the stability of this daily fluctuation trend, the amount of variation over the long term is relatively limited. Therefore, modeling using historical data can effectively capture the main characteristics of load fluctuations. Based on this regularity, the random load fluctuations can be simulated by introducing appropriate random disturbances into the historical data without relying on complex scenario generation methods. This approach can accurately reflect load fluctuation characteristics and efficiently support the assessment of PV integration capacity.
The modeling of load fluctuation uncertainty primarily depends on a statistical analysis of historical data. The load distribution range and mean can be calculated by collecting and analyzing daily load data over a period. Specifically, the upper and lower bounds of load fluctuation are determined based on statistical parameters such as the minimum, maximum, and mean values of historical load data. These statistical parameters provide the foundation for modeling load fluctuations and help capture the range and trend of load variations. Random perturbation methods simulate load variability once the load fluctuation range and mean are obtained. Random disturbances are introduced within a range based on the historical data’s mean and fluctuation range during each simulation. The size of the disturbance is determined according to the characteristics of load fluctuations, typically using a normal or uniform distribution to generate the disturbance values, ensuring that the simulated load data fluctuate within the historical data’s distribution range. In this way, the simulated load data reflect the fluctuations within a reasonable range, avoiding generating load values outside the actual range.
This modeling method can realistically reflect the uncertainty of load fluctuations, especially during high or low network load periods, providing more accurate load scenarios for PV hosting capacity assessments. By incorporating load fluctuation uncertainty, the proposed PV hosting capacity evaluation model can simulate PV integration capacity under different load conditions, thereby providing a more comprehensive assessment of the impact of PV integration on the operation of the distribution network. This method offers reliable support for grid dispatch optimization and PV integration planning.
3.3. Optimization Generation Strategy Driven Jointly by Physics and Data
In the scenario generation process based on WGAN-GP, relying solely on data-driven methods may generate data that violates physical laws, such as non-zero irradiance at night. In contrast, load data, constrained by historical observational data, naturally adapt to the statistical distribution, eliminating the need for additional physical constraints. Therefore, to ensure the physical validity of the generated data while maintaining the flexibility of data-driven approaches, constraints must be applied to irradiance to ensure that it aligns with the physical characteristics of PV generation and enhances the reliability of the generated data.
This paper adopts a hard constraint clipping strategy to achieve this, in which irradiance data that do not conform to physical laws are corrected after sample generation. Specifically, all generated irradiance data are forcibly set to zero during nighttime hours (e.g., from sunset to sunrise) to ensure they comply with the diurnal variation pattern. Additionally, to prevent the generation of non-physical samples, a non-negativity constraint is applied to all irradiance data, clipping any irradiance values that are below zero or zero, ensuring the physical reasonableness of the data. This strategy allows WGAN-GP to maintain the advantages of data-driven methods while strictly adhering to the physical characteristics of PV irradiance, thus enhancing the authenticity of the generated data and providing more reliable scenario data support for PV hosting capacity assessments.
The core objective of the PV hosting capacity assessment model is to calculate the maximum PV output that the grid can accommodate while ensuring the safe and stable operation of the network. This paper employs the SSA to determine the optimal solution for PV integration capacity, considering constraints such as voltage stability, power flow balance, and line transmission capacity. Regarding uncertainty modeling, PV power fluctuations are simulated through scenario generation methods to represent random variations accurately. In contrast, load fluctuations are modeled by constructing fluctuation ranges from historical data and introducing random disturbances.
The scenario generation section proposes a PV power scenario generation method based on WGAN-GP. This method involves adversarial training between the generator and the discriminator, combined with a physics-driven data strategy, ensuring the physical plausibility and diversity of the generated scenarios. Finally, the generated PV power scenarios are integrated with the assessment model, and through an alternative scenario optimization framework, the PV integration capacity under various meteorological and load conditions is accurately evaluated.
4. Case Study Analysis
4.1. Parameter Settings
This paper conducts a case study analysis and validation of the IEEE 33-bus distribution network system to verify the effectiveness and correctness of the algorithm. The network topology is shown in Figure 3, which illustrates the layout and connectivity of the nodes. The PV integration nodes are located at node 5, node 12, and node 24. These nodes are selected to represent different topological locations within the network: node 5 is situated near the middle of the main feeder, node 12 is at the end of the main feeder, and node 24 is located at the terminal of a lateral branch. This selection ensures a representative coverage of both the trunk and lateral parts of the system, allowing for a more comprehensive analysis of how PV hosting capacity is influenced by node position. The system voltage levels, base capacity, and line impedance parameters are set according to the default settings of the Matpower 33-bus case.
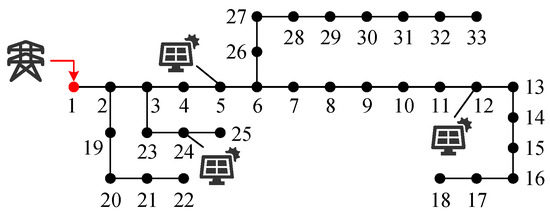
Figure 3.
33-bus distribution network system.
The parameters of the PV hosting capacity assessment model are shown in Table 1. The parameters of the SSA are listed in Table 2. In the PV power scenario generation section, the network structure and hyperparameter configuration of WGAN-GP are provided in Table 3 and Table 4, respectively. The total number of iterations is set to 5000 to enhance training stability, and the discriminator is updated five times before each instance of generator training. The model runs in a hardware environment equipped with an Intel(R) Core(TM) i9-13900 HX processor and an NVIDIA GeForce RTX 4060 laptop GPU.
Table 2.
Parameters of SSA.
Table 3.
Network structure of WGAN-GP.
Table 4.
Hyperparameters of WGAN-GP.
4.2. Scenario Generation Evaluation Index System
This paper takes the hourly temperature and irradiance data from a location in Shijiazhuang, Hebei Province, in 2020 as the research object, with a total of 8784 valid samples (approximate coordinate: 38.0344° N, 114.5251° E). To better illustrate the characteristics of the input data, Figure 4 presents the annual hourly distributions of temperature and irradiance, which reflect the seasonal variation and overall range of meteorological conditions in the selected region. A comparative analysis uses a traditional GAN, a variational autoencoder (VAE), and the WGAN-GP improvement method. The evaluation is performed using the mean squared error (MSE), autocorrelation coefficient (ACC), and structural similarity index (SSIM), which quantify the generation results from three dimensions: the numerical error, temporal structure, and characteristic similarity. The use of MSE, ACC, and SSIM as evaluation metrics provides a more objective basis for assessing the effectiveness of scenario generation.
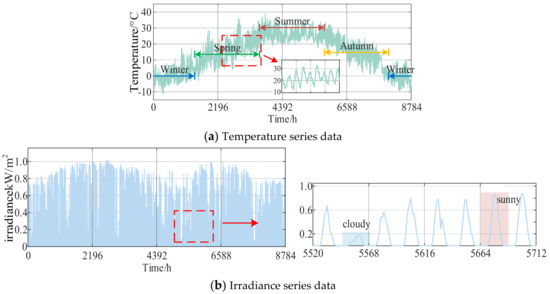
Figure 4.
Annual hourly temperature and irradiance data.
4.3. Comparison of Different Scenario Generation Methods
4.3.1. Temperature Scenario Generation
Variations in solar irradiance primarily drive the fluctuation of photovoltaic power, while the temperature impact is relatively minor. Since seasonal temperature differences are primarily reflected in numerical values and the intraday temperature variation pattern remains relatively consistent, this study selects summer temperature samples for normalization and scenario generation. The generation results are shown in Figure 5, and the quantitative evaluation metrics are presented in Table 5.
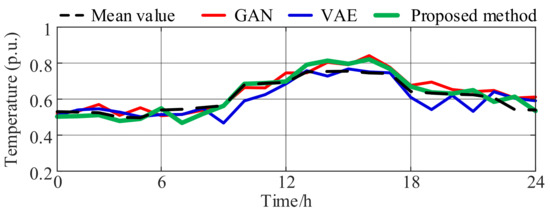
Figure 5.
Temperature scenario generation results.
Table 5.
Evaluation of temperature scenario generation.
As the figure shows, all three methods capture the overall temperature trend similarly, effectively reproducing the typical intraday rise-and-fall pattern. However, regarding preserving local details, WGAN-GP demonstrates smoother and more natural outputs, accurately reflecting subtle temperature fluctuations. As shown in Table 5, the WGAN-GP model outperforms the traditional GAN and VAE methods across all evaluation metrics (MSE, ACC, and SSIM), highlighting its superior capability in maintaining structural continuity and trend fidelity.
4.3.2. Irradiance Scenario Generation
The annual irradiance data are first normalized and divided into daily sequences. Days are classified as sunny if the maximum irradiance exceeds 0.7, and as overcast if it is ≤0.3. Samples within 0.3–0.7 are excluded to avoid training noise. This filtering ensures that the training focuses on distinct physical patterns, thereby enhancing the quality and consistency of scenario generation.
Based on the classified dataset, this paper compares the scenario generation performance of three models: a traditional GAN, VAE, and the proposed WGAN-GP. The results are shown in Figure 6 and Figure 7, and the corresponding quantitative evaluation metrics are presented in Table 6 and Table 7. The irradiance curve presents a distinct midday peak for sunny days, while overcast days exhibit relatively lower irradiance levels and flatter profiles. The generated results from all three methods replicate the general irradiance variation trend well. However, the GAN and VAE generate non-zero values during nighttime, whereas WGAN-GP ensures zero irradiance at night, enhancing the generated data’s physical consistency. Quantitatively, WGAN-GP outperforms the other two models regarding MSE, ACC, and SSIM, indicating a greater accuracy in capturing local details and overall structure.
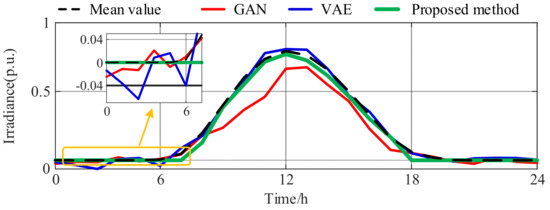
Figure 6.
Generation results of sunny day irradiance scenario.
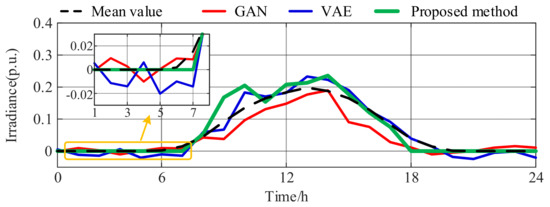
Figure 7.
Generation results of cloudy day irradiance scenario.
Table 6.
Evaluation of sunny scenario generation.
Table 7.
Evaluation of cloudy scenario generation.
4.4. Comparison of Alternative Scenario Hosting Capacity Assessment Results
This section evaluates the PV hosting capacity of the distribution network under different load and irradiance conditions, focusing on how an insufficient PV output, grid absorption constraints, and power fluctuation characteristics affect the hosting capacity results. To construct representative scenarios for this evaluation, the study selects typical daily data samples corresponding to different conditions and performs scenario generation using WGAN-GP. The maximum PV integration capacities obtained under these conditions are presented in Table 8.
Table 8.
Maximum accessible capacity of each PV node under different scenarios.
4.4.1. Insufficient PV Output Scenario
The insufficient PV output scenario reflects situations in which, during high-power-demand periods, the grid cannot meet the demand due to an insufficient PV output, particularly under high-load-demand and low-irradiance conditions. The maximum irradiance for a single day is taken as the target feature, with the target feature selection range set to the low range, guiding the model to emphasize learning in this range and generate scenarios with overall low irradiance levels. Through a hosting capacity assessment for this scenario, the maximum total PV integration capacity is determined as 43.065 MW. Figure 8 shows the daily load power and PV output under this integration capacity and the generated scenario. As seen in the figure, under insufficient-PV-output conditions, when the output is inadequate, the demand for PV integration capacity increases. By increasing the integration capacity, the grid’s demand can be met, thereby avoiding the issue of insufficient system load.
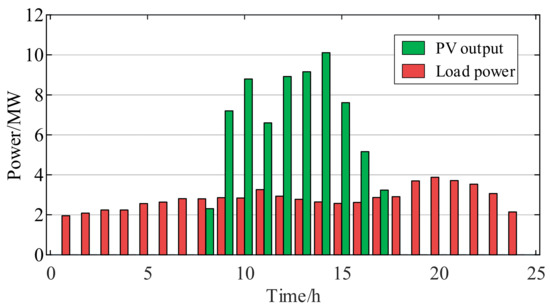
Figure 8.
Waveform of daily load and PV output under PV output insufficiency scenario.
4.4.2. Grid Consumption Limitation Scenario
The grid consumption limitation scenario primarily describes the curtailment of PV power due to insufficient grid consumption, resulting in curtailment. The curtailment of PV power is explicitly observed under low-load-demand and high-irradiance conditions. The maximum irradiance for a single day is taken as the target feature, with the target feature selection range set to the high range, guiding the model to generate scenarios with an overall higher irradiance level. Through a hosting capacity assessment for this scenario, the maximum total PV integration capacity is determined as 15.007 MW. Figure 9 shows the PV integration capacity, the daily load power, and PV output for the grid consumption limitation scenario.
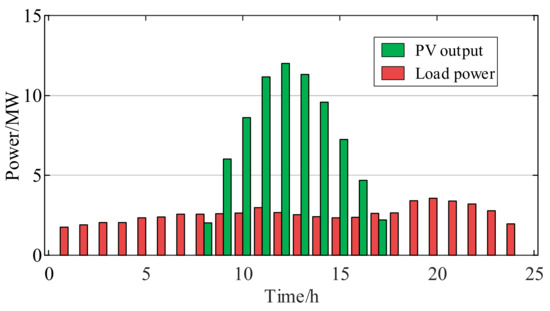
Figure 9.
Waveform of daily load and PV output under grid consumption limitation scenario.
4.5. Comparative Analysis of Optimization Algorithms
The applicability and stability of the selected optimizer in multi-scenario PV hosting capacity assessments are evaluated by comparing the performance of the SSA with two commonly used metaheuristic algorithms: particle swarm optimization (PSO) and grey wolf optimization (GWO). All three algorithms were independently executed under the same modeling structure, constraint conditions, and input scenarios.
The comparative experiment is based on the “insufficient PV output scenario” constructed in Section 4.4.1, which corresponds to high-load and low-irradiance conditions. This scenario reflects practical challenges, making it suitable for testing optimization performance under complex operating conditions.
Table 9 presents the total optimal PV integration capacity obtained by each algorithm under this scenario, while Figure 10 illustrates the distribution of PV capacity across node 5, node 12, and node 24. Regarding objective values, all three algorithms achieved comparable results, confirming the solvability and robustness of the proposed evaluation model regardless of the optimization method used. Regarding computational efficiency, the SSA achieved the target solution with fewer average iterations, indicating faster convergence and better search adaptability. This feature is particularly advantageous in multi-scenario evaluations involving complex constraints.
Table 9.
Maximum accessible PV capacity under different optimization algorithms.
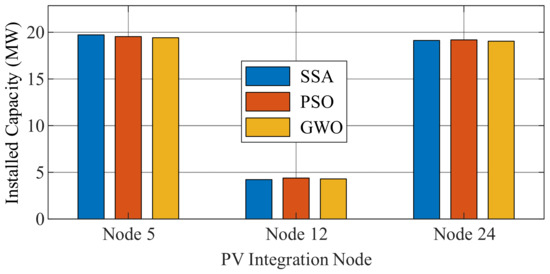
Figure 10.
Optimal PV allocation across nodes under different optimization algorithms.
Moreover, the SSA features a lightweight structure and minimal parameter tuning and is easily implemented, making it especially suitable for the multi-variable, source–load-coupled evaluation model proposed in this paper. While the SSA is not a novel algorithm, its performance in the case study demonstrates its high compatibility and effective integration with the proposed framework, making it a practical choice for optimization.
In summary, the adoption of the SSA was not intended to highlight its algorithmic novelty but rather stemmed from its strong structural compatibility and computational stability. Through a comparative analysis with mainstream algorithms, the practicality and applicability of the SSA under uncertainty have been verified, providing a reliable optimization foundation for the overall evaluation process.
5. Discussion
In PV hosting capacity assessments, the breadth and depth of uncertainty modeling directly determine the accuracy and applicability of the evaluation method. Although numerous studies have examined the impact of source-side or load-side uncertainty on PV integration capacity, most existing approaches exhibit the following limitations: (1) they often model only one side of the uncertainty, ignoring the coupled evolution of source and load fluctuations; or (2) they frequently adopt fixed typical day samples or static scenarios, which fail to reflect the dynamic changes and temporal patterns present in real-world operating conditions. To address these issues, this paper establishes a joint source–load modeling framework: on the source side, solar irradiance and temperature are simultaneously introduced as input variables, and WGAN-GP is used to generate high-quality scenarios with both physical consistency and temporal structure; on the load side, intraday variation sequences are generated using historical statistical distributions combined with perturbation mechanisms. This joint modeling strategy significantly enhances the evaluation model’s structural adaptability and scenario generalization under multi-source uncertainty.
In addition, this paper conducts a comprehensive analysis and comparison of existing studies that have attempted to incorporate uncertainty modeling. One class of methods is based on adjustments to historical data features, using techniques such as clustering, association mining, or random perturbation to construct scenarios. However, these methods are inherently limited by the distribution of available samples and show weak generalization performances under data scarcity or unseen states. Another class involves data-driven modeling using generative networks like the VAE or conventional GANs. While such methods can increase sample diversity, they often lack physical constraints, resulting in unrealistic nighttime generation or numerical anomalies and a struggle to express temporal structure accurately.
To overcome these challenges, this paper proposes a scenario generation method based on WGAN-GP. By optimizing the adversarial training process between the generator and discriminator, the method not only stabilizes training but also reinforces the physical consistency of the generated samples. Additionally, the method introduces a goal-driven weighted sampling strategy to enhance the learning of key structural features, effectively guiding the generator to prioritize samples with target characteristics and improve modeling precision in critical regions. On the source side, the proposed approach effectively learns intraday trends and localized fluctuations in meteorological data while ensuring that the generated sequences remain physically reasonable regarding their value range, structural patterns, and real-world interpretability. Compared with the VAE and traditional GANs, the proposed method significantly improves sample quality. Specifically, it outperforms the baseline models in MSE (numerical accuracy), ACC (temporal correlation), and SSIM (structural similarity), verifying its comprehensive advantage in scenario generation quality and assessment adaptability. The improved performance in these evaluation metrics further strengthens the reliability and practical usability of the hosting capacity evaluation results.
Furthermore, to enable efficient multi-scenario optimization, this study employs the SSA as the solver for the hosting capacity model. Although the SSA is not a newly proposed algorithm, its lightweight structure and mature mechanisms make it well suited for complex, high-dimensional problems. In the case study, SSA achieves comparable optimization results to other mainstream methods such as PSO and GWO. Its simple parameter configuration and stable performance contribute to maintaining computational stability under uncertainty, making it a practical and reliable choice for distributed PV hosting assessments.
This study offers a practical and robust framework across three key dimensions: modeling structure, scenario generation, and optimization solving. The proposed method is adaptable to source–load uncertainty and provides a reliable modeling foundation for future PV planning and dispatch strategies in distribution networks.
6. Conclusions
This study addresses the challenge of source–load uncertainty in PV hosting capacity evaluation. It proposes a comprehensive multi-scenario assessment method integrating high-quality scenario generation with adaptive optimization solving. The main conclusions are as follows:
- (1)
- A joint source–load modeling framework is constructed to enhance adaptability to input uncertainty. This study proposes a joint modelling strategy to overcome the limitations of conventional methods that typically consider only single-sided fluctuations or use static scenario inputs. On the source side, irradiance and temperature are key meteorological variables; on the load side, historical load data are combined with stochastic perturbations to construct representative intraday fluctuation sequences. This dynamic framework more accurately reflects the real operating conditions of distribution networks;
- (2)
- A physically consistent and structurally expressive scenario generation mechanism is developed for the source side. The WGAN-GP generates meteorological scenarios, incorporating physical constraints to ensure the generated sequences maintain realistic numerical ranges, temporal trends, and structural features. In addition, a goal-driven weighted sampling strategy is introduced to enhance the model’s ability to learn and represent key structural features in the target distribution. Compared with the VAE and traditional GAN approaches, the proposed method achieves better performance in MSE, ACC, and SSIM metrics, thereby providing high-quality input data for PV hosting capacity evaluations;
- (3)
- To validate the practicality and generalizability of the proposed evaluation method, the SSA is employed as the optimization solver. Although the SSA is not a newly developed algorithm, it features a lightweight structure and mature search mechanism, making it well suited for solving complex multi-variable and multi-constraint problems. In the case study, the SSA demonstrates stable performance in terms of solution accuracy and convergence consistency, supporting the reliable execution of the evaluation model under diverse uncertainty scenarios.
The proposed method demonstrates clear advantages in modeling completeness, scenario generation quality, and optimization practicality, offering a reliable framework for PV integration planning and operational decision making under diverse conditions.
Author Contributions
Conceptualization, C.C.; Methodology, W.P., C.X., Y.H. and S.D.; Validation, C.C., W.P. and Y.H.; Investigation, C.X.; Writing—Original Draft, W.P. All authors have read and agreed to the published version of the manuscript.
Funding
This research was supported by the State Grid Zhejiang Electric Power Company Science and Technology Project “Research on New Distribution System State and Hosting Capacity Assessment Technology for Large-Scale Distributed Renewable Energy Integration” (Project No. B311DS240017).
Data Availability Statement
The data used in this study are included in the article. Further inquiries can be directed to the corresponding author.
Conflicts of Interest
All authors are affiliated with the Electric Power Science Research Institute of State Grid Zhejiang Electric Power Co., Ltd. and the College of Electrical Engineering, Zhejiang University. The authors declare that this research was conducted in the absence of any commercial or financial relationships that could be construed as a potential conflict of interest.
References
- Wang, S.; Li, Y.; Zhang, M.; Peng, Y.; Tian, Y.; Lin, G.; Chang, F. Harmonic resonance suppression with inductive power filtering method: Case study of large-scale photovoltaic plant in China. IEEE Trans. Power Electron. 2023, 38, 6444–6454. [Google Scholar] [CrossRef]
- Zhang, F.; Ju, Y. TrPFZ2TLV-based decision-making frameworks for site selection of large-scale solar photovoltaic power plants. IEEE Trans. Eng. Manag. 2024, 71, 8075–8087. [Google Scholar] [CrossRef]
- Sahu, S.K.; Kumari, S.; Ghosh, D.; Dutta, S. Estimation of photovoltaic hosting capacity due to the presence of diverse harmonics in an active distribution network. IEEE Access 2024, 12, 47868–47879. [Google Scholar] [CrossRef]
- Ismeil, M.A.; Alfouly, A.; Hussein, H.S.; Hamdan, I. Hardware in the loop real-time simulation of improving hosting capacity in photovoltaic systems distribution grid with passive filtering using OPAL-RT. IEEE Access 2023, 11, 78119–78134. [Google Scholar] [CrossRef]
- Pan, G.S.; Hu, Q.R.; Gu, W.; Ding, S.; Qiu, H.; Lu, Y. Assessment of plum rain’s impact on power system emissions in Yangtze-Huaihe River basin of China. Nat. Commun. 2021, 12, 6156–6165. [Google Scholar] [CrossRef] [PubMed]
- Men, M.; Zhang, Q.; Zhai, W.; Zhang, J.; Zhao, R. Bi-level optimal configuration of energy storages in the distribution network considering distributed photovoltaic carrying capacity. In Proceedings of the Third International Conference on Electrical, Electronics, and Information Engineering (EEIE 2024), Wuhan, China, 14–16 November 2024; pp. 316–323. [Google Scholar]
- Qiu, H.; Veerasamy, V.; Ning, C.; Sun, Q.; Gooi, H.B. Two-stage robust optimization for assessment of PV hosting capacity based on decision-dependent uncertainty. J. Mod. Power Syst. Clean Energy 2024, 12, 2091–2096. [Google Scholar] [CrossRef]
- Fang, X.; Fu, X.; Gao, K.; Sun, Z.; Deng, J. A method of calculating the accessible capacity of distributed photovoltaic in a distribution network considering capacity ratio. In Proceedings of the 2023 IEEE 3rd International Conference on Information Technology, Big Data and Artificial Intelligence (ICIBA), Chongqing, China, 26–28 May 2023; pp. 490–494. [Google Scholar]
- Xie, J.; Tang, Y. Calculation method of hosting capacity for distributed grid-connected photovoltaic based on IGWO. In Proceedings of the 2022 2nd International Conference on Intelligent Power and Systems (ICIPS 2022), Chengdu, China, 18–20 November 2022; pp. 012023–012032. [Google Scholar]
- Su, L.; Pan, X.; Sun, X.; Guo, J.; Anvari-Moghaddam, A. Research on PV hosting capacity of distribution networks based on data-driven and nonlinear sensitivity functions. IEEE Trans. Sustain. Energy 2025, 16, 483–495. [Google Scholar] [CrossRef]
- Kisuule, M.; Ndawula, M.B.; Gu, C.; Hernando-Gil, I. PV hosting capacity in LV networks by combining customer voltage sensitivity and reliability analysis. Energies 2023, 16, 5893. [Google Scholar] [CrossRef]
- Chen, S.; Zhang, Y.; Zheng, J. Assessment on global urban photovoltaic carrying capacity and adjustment of photovoltaic spatial planning. Sustainability 2021, 13, 3149. [Google Scholar] [CrossRef]
- Xu, Y.; He, J.; Liu, Y.; Li, Z.; Cai, W.; Peng, X. Evaluation method for hosting capacity of rooftop photovoltaic considering photovoltaic potential in distribution system. Energies 2023, 16, 7677. [Google Scholar] [CrossRef]
- Wang, H.; Zhong, F.; Xu, D.; Luo, Z.; Li, Y.; Wang, X.; Peng, X. Generation method of typical light-load correlation scenario set for photovoltaic hosting capacity assessment. In Proceedings of the 2023 6th International Conference on Energy, Electrical and Power Engineering (CEEPE), Guangzhou, China, 12–14 May 2023; pp. 977–984. [Google Scholar]
- Jiang, W.; Du, Z.; Zhou, W.; Lin, X. Photovoltaic hosting capacity assessment of a distributed network based on an improved holomorphic embedding load flow method and stochastic scenario simulation. J. Renew. Sustain. Energy 2024, 16, 023506–023518. [Google Scholar] [CrossRef]
- Chu, H.; Ye, Y.; Cao, W.; Xu, H.; Sun, L.; Wang, Y.; Gong, C. Research on capacity estimation of photovoltaic system carrying capacity improvement in low-voltage distribution network based on data mining. In Proceedings of the 2024 IEEE 7th International Conference on Automation, Electronics and Electrical Engineering (AUTEEE), Shenyang, China, 27–29 December 2024; pp. 786–791. [Google Scholar]
- Zhang, L.; Lei, Z.; Ye, Z.; Peng, Z. Distributed PV carrying capacity prediction and assessment for differentiated scenarios based on CNN-GRU deep learning. Front. Energy Res. 2024, 12, 1481867–1481883. [Google Scholar] [CrossRef]
- Fu, X.; Lu, N.; Sun, H.; Zhang, Y. Extraction of representative scenarios for photovoltaic power with shared weight graph clustering. IEEE Trans. Smart Grid 2024, 15, 6158–6170. [Google Scholar] [CrossRef]
- Cramer, E.; Gorjão, L.R.; Mitsos, A.; Schäfer, B.; Witthaut, D.; Dahmen, M. Validation methods for energy time series scenarios from deep generative models. IEEE Access 2022, 10, 8194–8207. [Google Scholar] [CrossRef]
- Song, Z.; Huang, Y.; Xie, H.; Li, X. Generation method of multi-regional photovoltaic output scenarios-set using conditional generative adversarial networks. IEEE J. Emerg. Sel. Top. Circuits Syst. 2023, 13, 861–870. [Google Scholar] [CrossRef]
- Kousounadis-Knousen, M.A.; Bazionis, I.K.; Georgilaki, A.P.; Catthoor, F.; Georgilakis, P.S. A review of solar power scenario generation methods with focus on weather classifications, temporal horizons, and deep generative models. Energies 2023, 16, 5600. [Google Scholar] [CrossRef]
- Liang, J.K.; Tang, W.Y. Sequence generative adversarial networks for wind power scenario generation. IEEE J. Sel. Areas Commun. 2020, 38, 110–118. [Google Scholar] [CrossRef]
- Xia, B.B.; Huang, Q.Y.; Wang, H.; Ying, L. Wind power prediction in view of ramping events based on classified spatiotemporal network. Front. Energy Res. 2022, 9, 754274–754282. [Google Scholar] [CrossRef]
- Yang, X.; He, H.; Li, J.; Zhang, Y. Toward optimal risk-averse configuration for HESS with CGANs-based PV scenario generation. IEEE Trans. Syst. Man Cybern. Syst. 2021, 51, 1779–1793. [Google Scholar] [CrossRef]
- Yuan, R.; Wang, B.; Sun, Y.; Song, X.; Watada, J. Conditional style-based generative adversarial networks for renewable scenario generation. IEEE Trans. Power Syst. 2023, 38, 1281–1296. [Google Scholar] [CrossRef]
- Peng, Y.; Ye, L.; Zhao, Y.; Li, Z.; Wang, X.; Li, P. Stochastic scenario generation for wind power and photovoltaic system based on CGAN. In Proceedings of the 2022 IEEE/IAS Industrial and Commercial Power System Asia (I&CPS Asia), Shanghai, China, 8–11 July 2022; pp. 1441–1446. [Google Scholar]
- Dong, C.; Yu, T.; Pan, Z.; Wu, Y.; Wang, Z.; Wang, Y.; Wang, K. Renewable energy hosting capacity assessment in distribution networks based on multi-strategy improved whale optimization algorithm. IET Renew. Power Gener. 2024, 1–15. [Google Scholar] [CrossRef]
- Han, J.; Cai, C.; Pan, W.; Liu, H.; Xu, Z. Hybrid proximal policy optimization—Wasserstein generative adversarial network framework for hosting capacity optimization in renewable-integrated power systems. Energies 2024, 17, 6234. [Google Scholar] [CrossRef]
Disclaimer/Publisher’s Note: The statements, opinions and data contained in all publications are solely those of the individual author(s) and contributor(s) and not of MDPI and/or the editor(s). MDPI and/or the editor(s) disclaim responsibility for any injury to people or property resulting from any ideas, methods, instructions or products referred to in the content. |
© 2025 by the authors. Licensee MDPI, Basel, Switzerland. This article is an open access article distributed under the terms and conditions of the Creative Commons Attribution (CC BY) license (https://creativecommons.org/licenses/by/4.0/).