Article

Influence of the Void Structure on Thermal Performance in HGM/ER Composites

1
Deepwater Engineering Research Center, Dalian University of Technology, Dalian 116024, China
2
China Construction Fifth Division Installation Engineering Co., Ltd., Shenzhen 518118, China
*
Author to whom correspondence should be addressed.
Energies 2025, 18(8), 2073; https://doi.org/10.3390/en18082073
Submission received: 23 February 2025 / Revised: 24 March 2025 / Accepted: 27 March 2025 / Published: 17 April 2025
(This article belongs to the Section J1: Heat and Mass Transfer)

Abstract

:
The heat transfer mechanism of hollow glass microsphere/epoxy resin composites (HGM/ER) is intricate, and the formation of void structures during material preparation complicates the prediction of thermal conductivity. To investigate the microscopic heat transfer mechanisms of HGM/ER materials with void structures and analyze the impact of void variables on the overall thermal performance, this study addresses the issue of low packing density and poor uniformity in traditional cellular unit structures. An improved random sequential adsorption (RSA) algorithm is proposed, increasing the upper limit of particle fill rate by 25% relative to traditional RSA algorithms. The Benveniste equivalent microsphere thermal conductivity model is selected for thermal performance simulation, demonstrating its high correlation with the three-component model (air, glass, resin), with a maximum relative error of only 1.32%. A classification method for void types in HGM/ER materials is proposed, categorizing them into interfacial and free voids. The microscopic heat transfer mechanisms of HGM/ER materials are investigated under different voids levels and void types, and it was found that the effect of interfacial voids on thermal conductivity is 60% higher than that of free voids. Based on the measured voids of the material, this study provides a reference for the convenient prediction of thermal conductivity in practical engineering applications of HGM/ER composites.

1. Introduction

HGM/ER composite foam materials are multicomponent materials that incorporate hollow glass microspheres (HGM) as fillers and epoxy resin (ER) as the matrix. They are characterized by light weight, high strength, and excellent thermal insulation properties [1,2,3]. Their comprehensive performance makes them widely used in various thermal insulation applications, such as marine oil pipelines [4,5,6]. However, due to the influence of processing techniques and material properties, some gas is inevitably trapped during the composite process, forming void structures inside the material [7]. Moreover, physical variables such as void size and filler ratio significantly influence the overall thermal conductivity of the composite material [8,9].
Most of the related scholars have macroscopically explored the influencing factors of the thermal properties of composites from the perspective of overall experiments [10,11], but due to the high complexity of RVE modeling of metamaterials [12,13] and the difficulty of numerical simulation, there is a lack of microscopic research on the internal thermal conductivity mechanism of composite materials. Therefore, the RSA algorithm was proposed, which is the most commonly used method for generating RVEs. However, the logic of RSA to generate particles one by one makes the first generated particles limit the space for the generation of subsequent particles, making it difficult for this algorithm to generate models with a high filling rate [14]. Kari et al. [15] introduced the RSA algorithm to generate spherical particles of the same dimensions, with a maximum filling rate of only 30%. Therefore, the improved RSA algorithm has been proposed a lot. Tian et al. [16] improved the RSA algorithm based on molecular dynamics and collision detection, etc., which can achieve a filling rate of more than 50%. However, the problem with the improved algorithm is that the generated particles can cross the RVE boundaries, which will cut and remove the part that crosses the boundaries, which is unfavorable for materials such as hollow glass beads.
Once the RSA algorithm was proposed, it was widely used in numerical simulation. Luo Wen et al. [17] developed secondary programming of the APDL language in ANSYS 15.0 and introduced the RSA algorithm to simulate the random distribution of microbeads in the resin matrix. Qi et al. [18] improved the RSA algorithm, introduced periodic boundaries, and used Abaqus to obtain the average stress and strain of RVE. Zhu et al. [19] constructed a randomly generated RVE model of carbon-brazed dimensional reinforced polyether ether ketone (PEEK) composite and investigated its mechanical properties.
The above study shows that it is completely feasible to use the improved RSA algorithm for the thermal simulation of microbead-type composites, but the problems that need to be overcome are that the upper limit of the filling rate of the microbeads in the current algorithm does not consider the microbeads crossing the RVE boundary, the microbead filling rate is low, and the distribution is relatively inhomogeneous, so it is not able to predict the thermal performance of composite foams with a high filling rate [20]. On the other hand, with the rise in the filling rate of the microbeads, the material void ratio can reach more than 8% [21], which will make a difficult to ignore the impact on the thermal performance of composites. Current research on the relevant thermal performance is mostly focused on the parameters and properties of microbeads and resins, and seldom considers the influence of the void structure on the thermal performance of composites [22] or the division of void types. Therefore, the current understanding of the internal thermal conductivity mechanism of void-containing composites is not clear enough, and the prediction of thermal conductivity has a large deviation, which needs to be measured with the help of professional equipment [23].
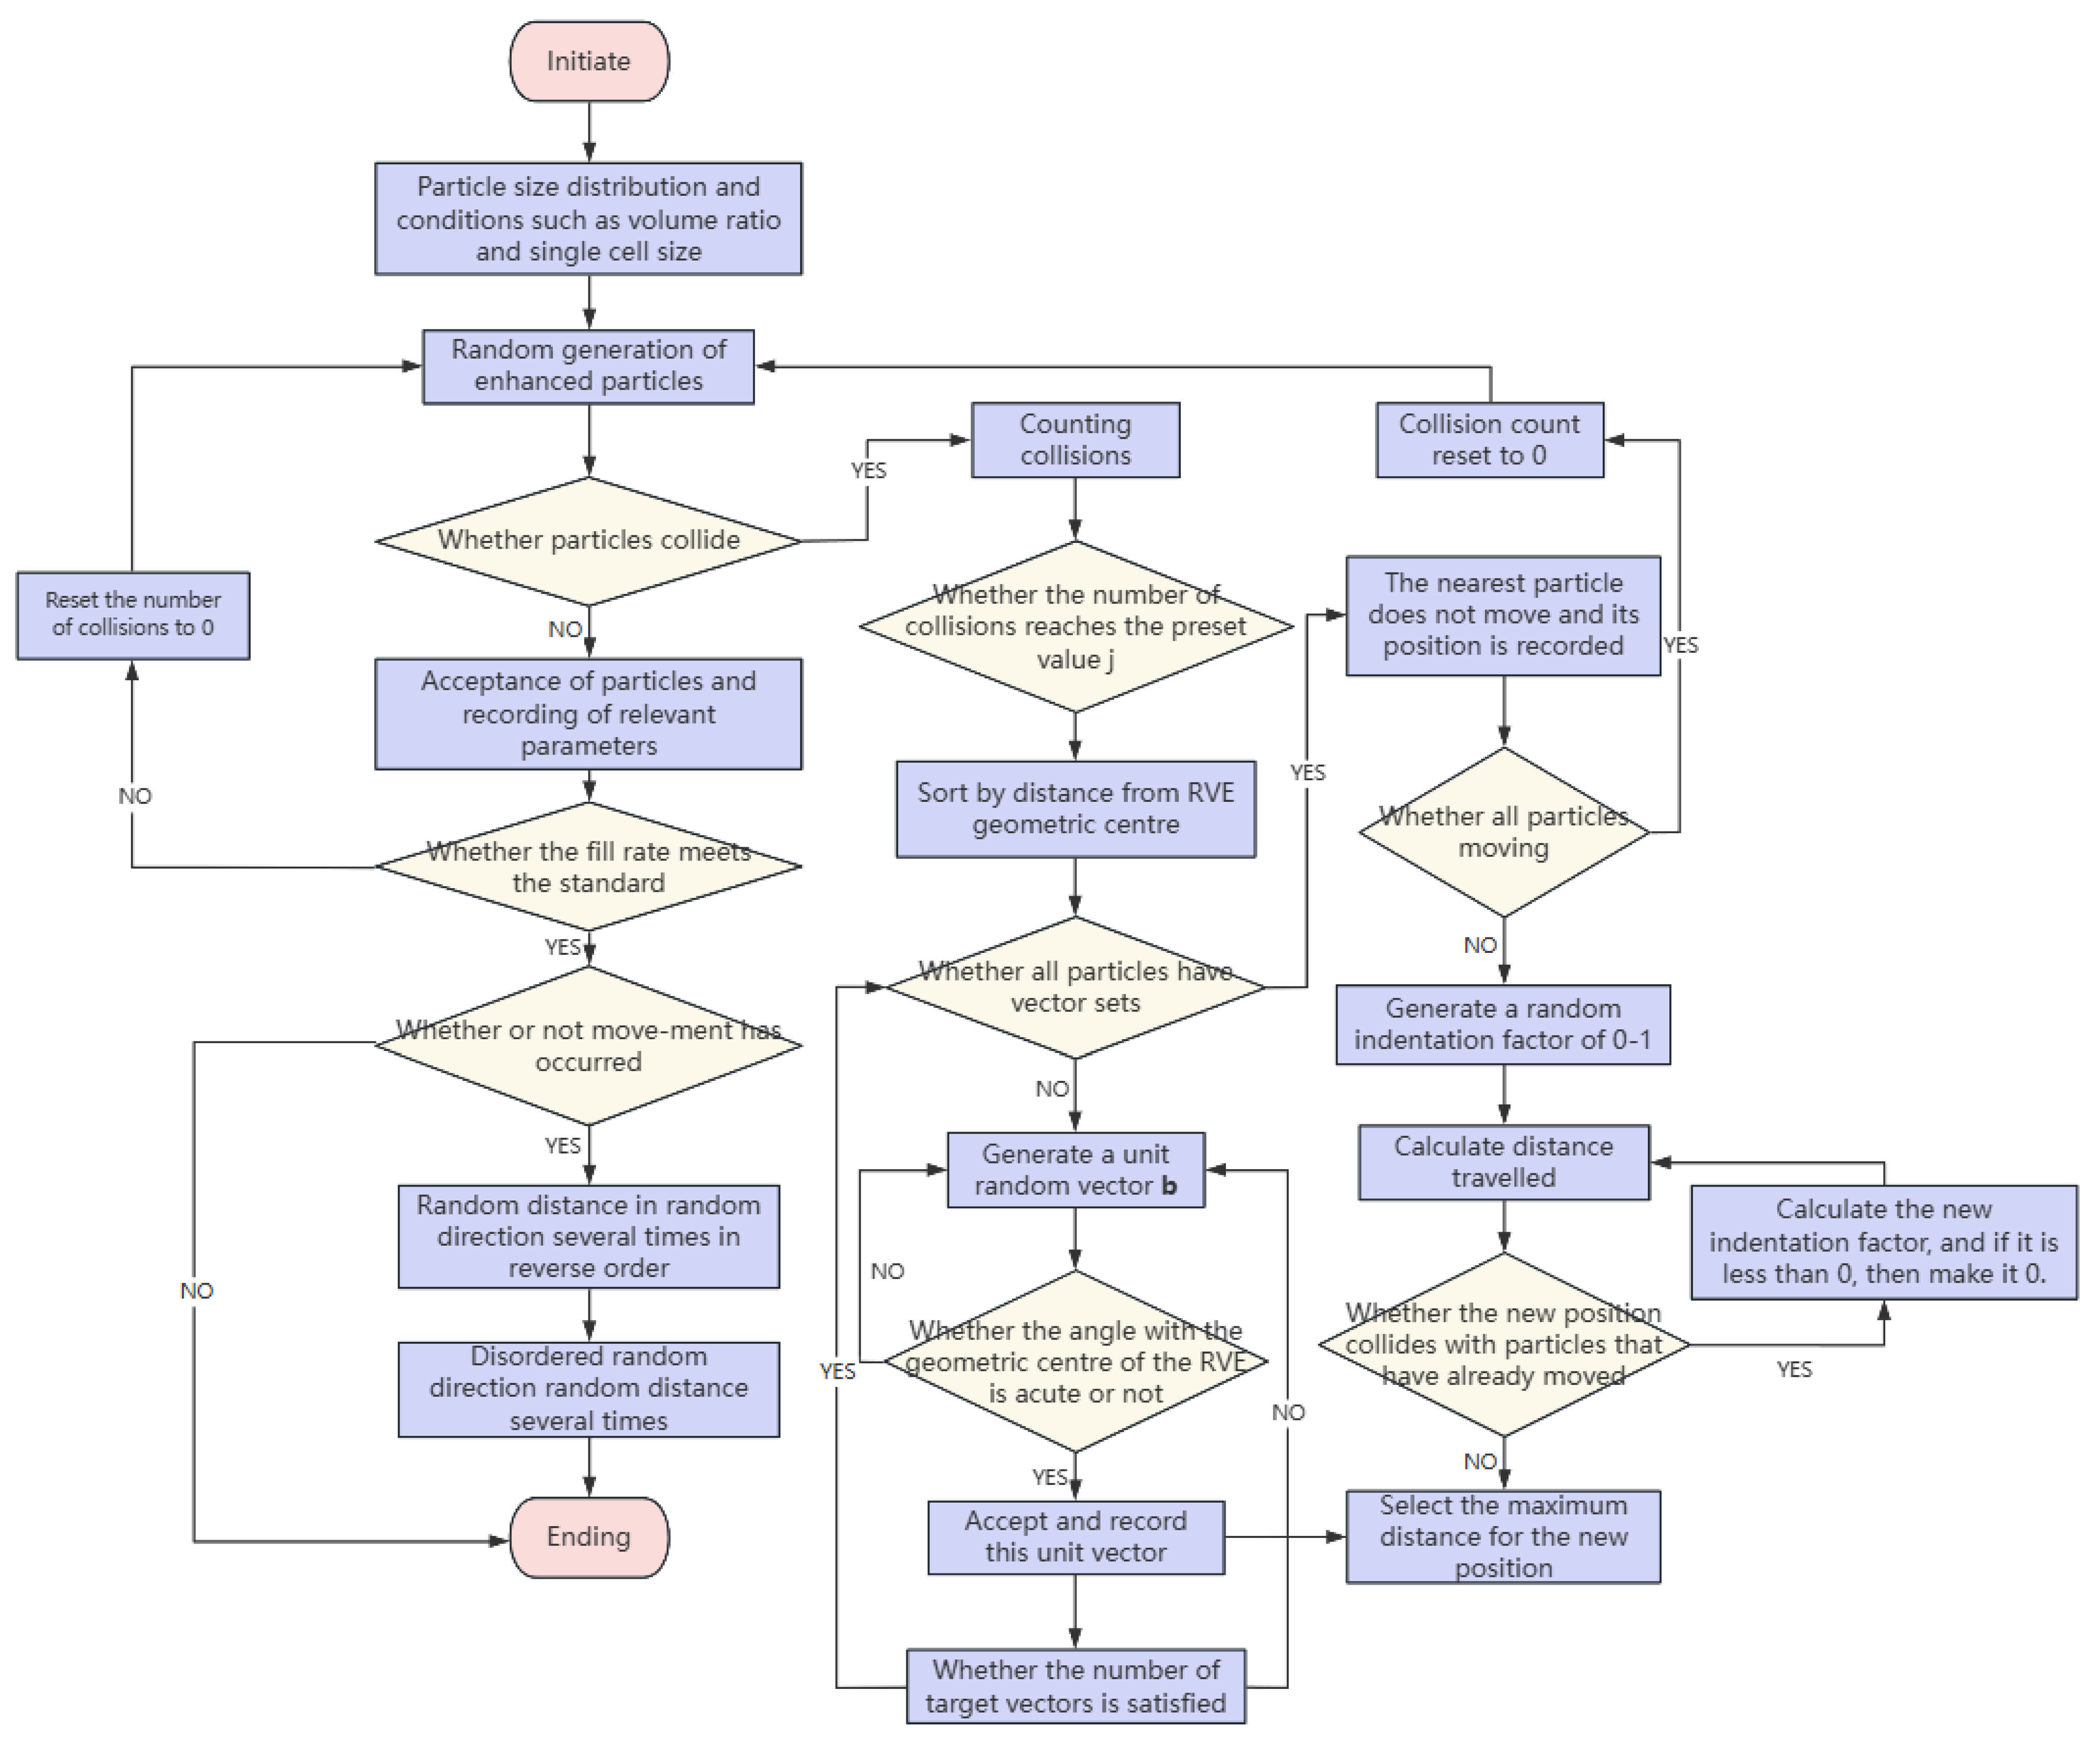
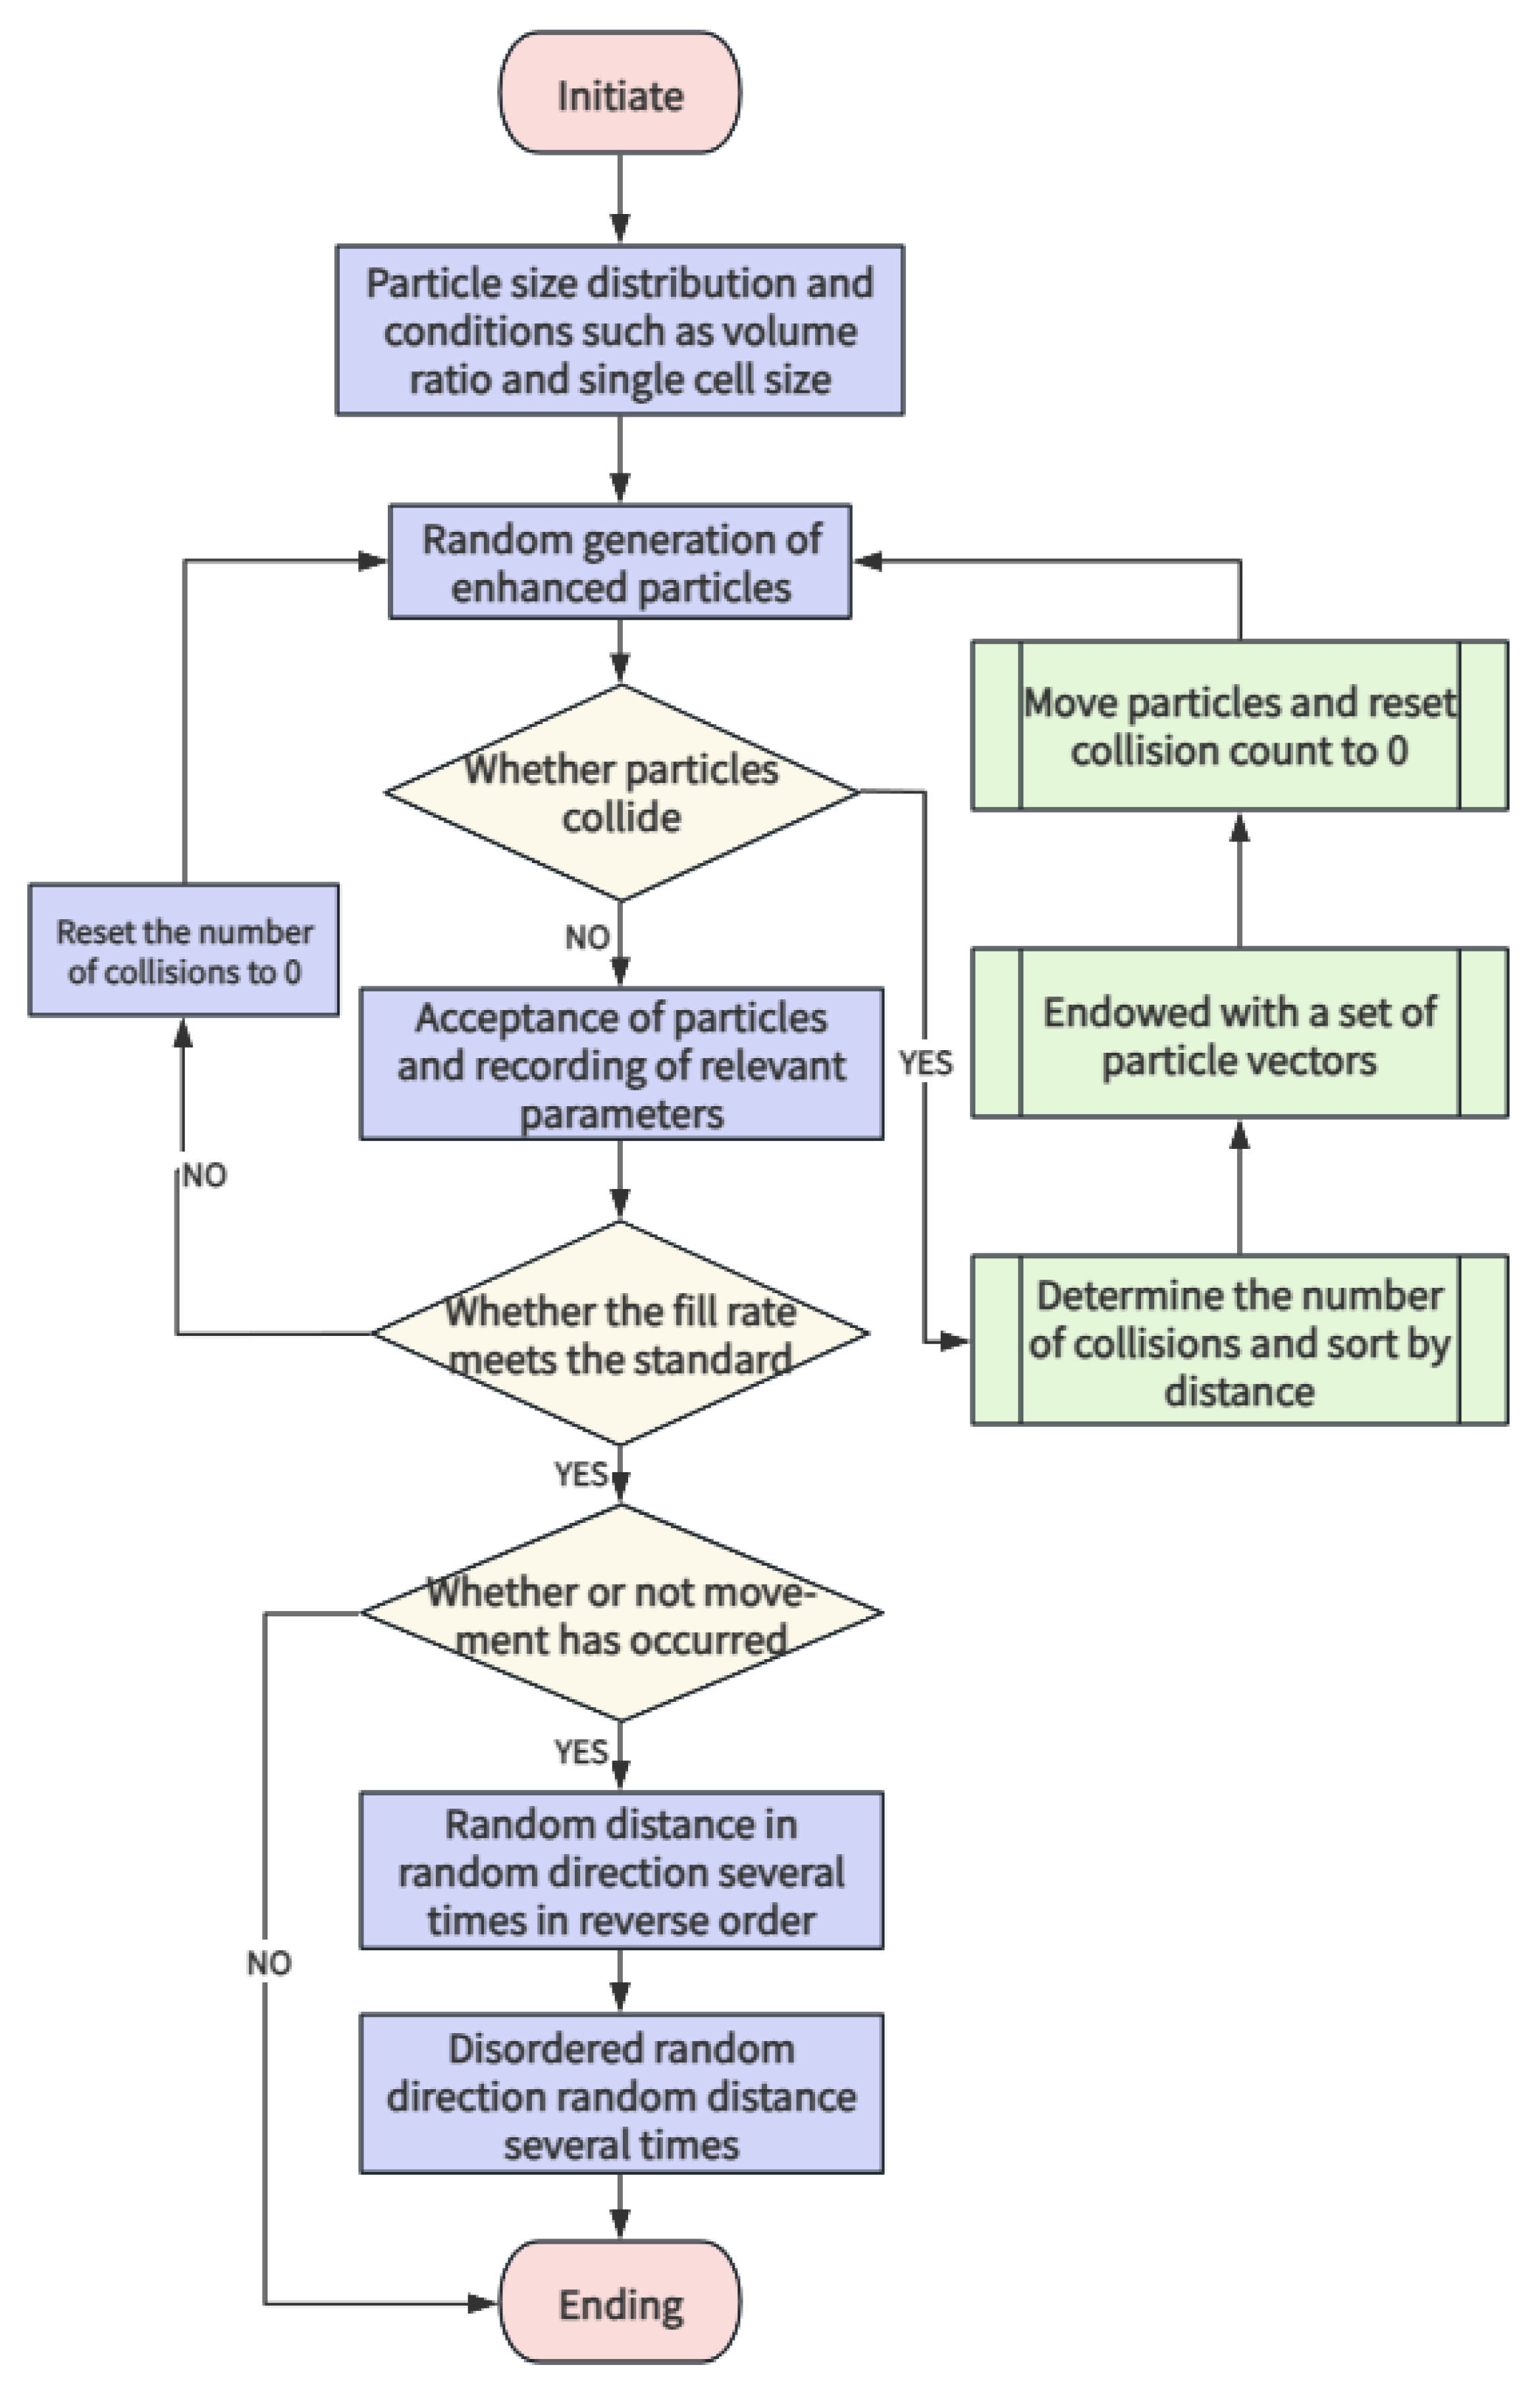
To overcome the above problems and generate RVE with a high filling rate without cutting the microbead particles, an improved RSA algorithm is proposed in this paper, which achieves high filling and uniform distribution of microbeads in RVE by formulating the particle movement strategy. In addition, this paper delineates the type of void structure within the HGM/ER composites and adopts the equivalent microbead thermal conductivity model to investigate its microscopic mechanism by thermal simulation using the Abaqus 2022 finite element software, which can provide a basis for the prediction of thermal conductivity of composites under different void ratios.

2. Theoretical Basis

2.1. Heat Transfer Theory

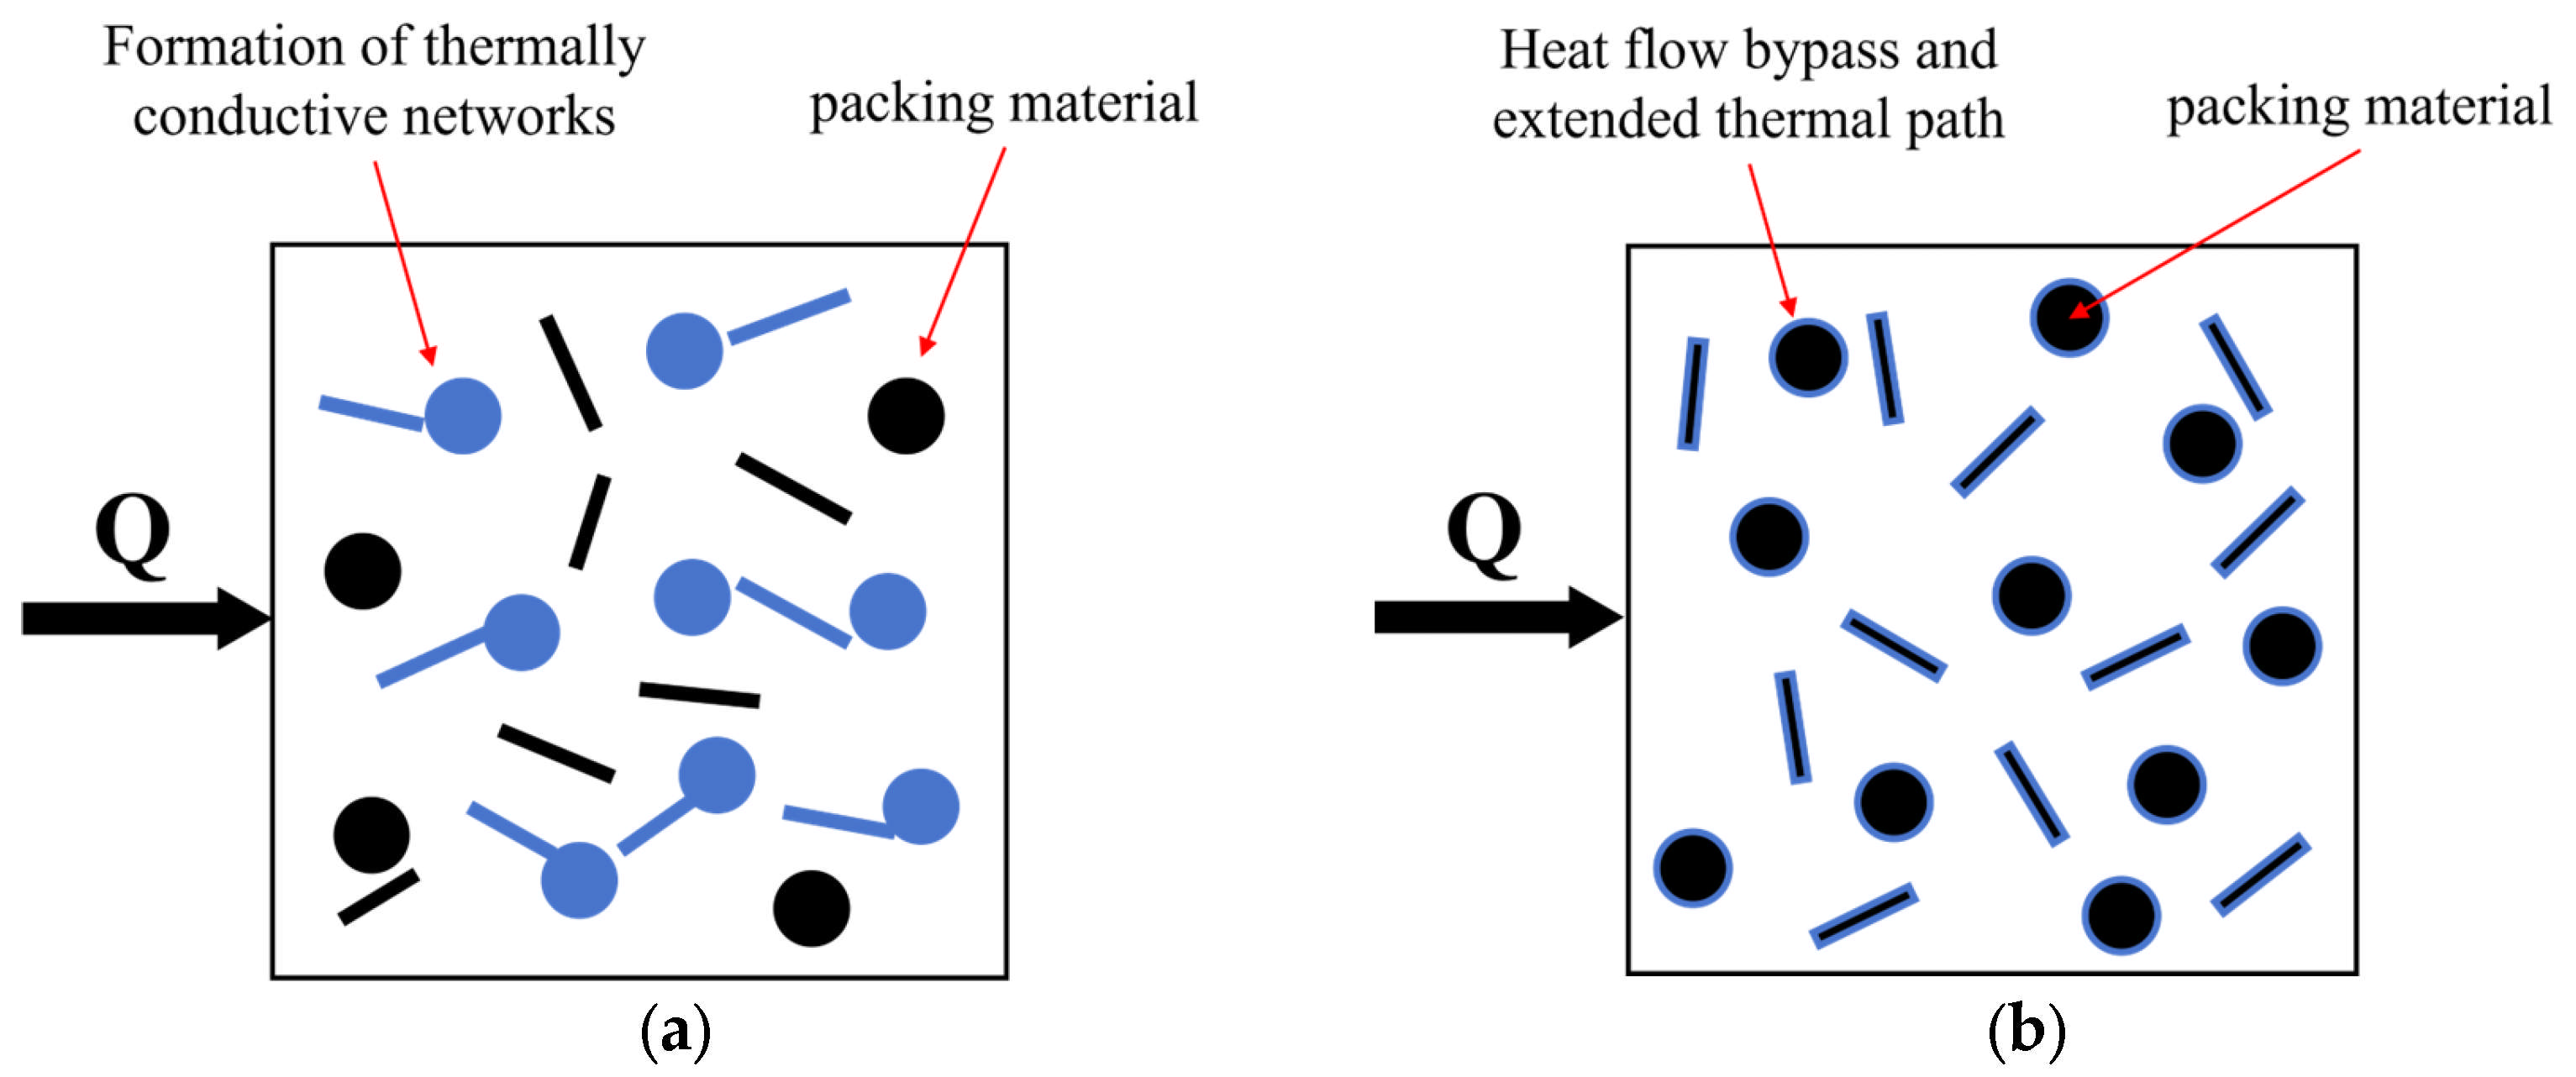
The thermal conduction path theory is one of the primary directions in the study of thermal conductivity mechanisms in polymer materials such as HGM/ER. Specifically, it can be described as follows. Thermally conductive fillers may form conductive networks within the polymer, leading to an increase in the overall thermal conductivity of the composite material. Thermal insulating fillers, on the other hand, increase the thermal conduction path length within the matrix, resulting in a decrease in the overall thermal conductivity of the composite material, as illustrated in Figure 1. The outer wall thickness of HGM is much smaller than its diameter, and thus the microspheres and void structures can be considered predominantly composed of air cavities, making them typical thermal insulating fillers compared to the matrix.
Heat transfer within a material occurs via three primary mechanisms: convective heat, radiative heat, and conductive heat. In the study of heat transfer mechanisms within HGM/ER composites, the heat transfer via convection [24] and radiation [25] can be neglected due to the extremely small diameter of the voids and the very thin walls of the microspheres. The primary focus is on the effect of conductive heat transfer. Heat conduction depends on the motion of microscopic energy carriers in a material. For HGM/ER composites, the heat conduction within the voids arises from collisions between gas molecules, following the kinetic theory model (Equation (1)) [26]. In contrast, the heat conduction of the solid outside the voids mainly depends on lattice vibrations of the solid molecules around their equilibrium positions and follows the dynamic model (Equation (2)) [27]:
k g , 0 = 1 3 C g , 0 · υ g , 0 · Λ g , 0 · ε
In the formula,  k g , 0  is the gas thermal conductivity coefficient;  C g , 0  is the gas-specific heat capacity at constant volume;  υ g , 0  is the root mean square velocity of the gas molecules;  Λ g , 0  is the mean free path of the gas molecules; ε is the correction factor that describes the influence of viscosity on the thermal conductivity coefficient.
k s , 0 = 1 3 C s , 0 · υ s , 0 · Λ s , 0
In the formula,  k s , 0  represents the thermal conductivity coefficient of the solid;  C s , 0  represents the specific heat capacity at constant volume of the solid;  υ s , 0  represents the root mean square velocity of the solid;  Λ s , 0  represents the mean free path of the phonons in the solid.
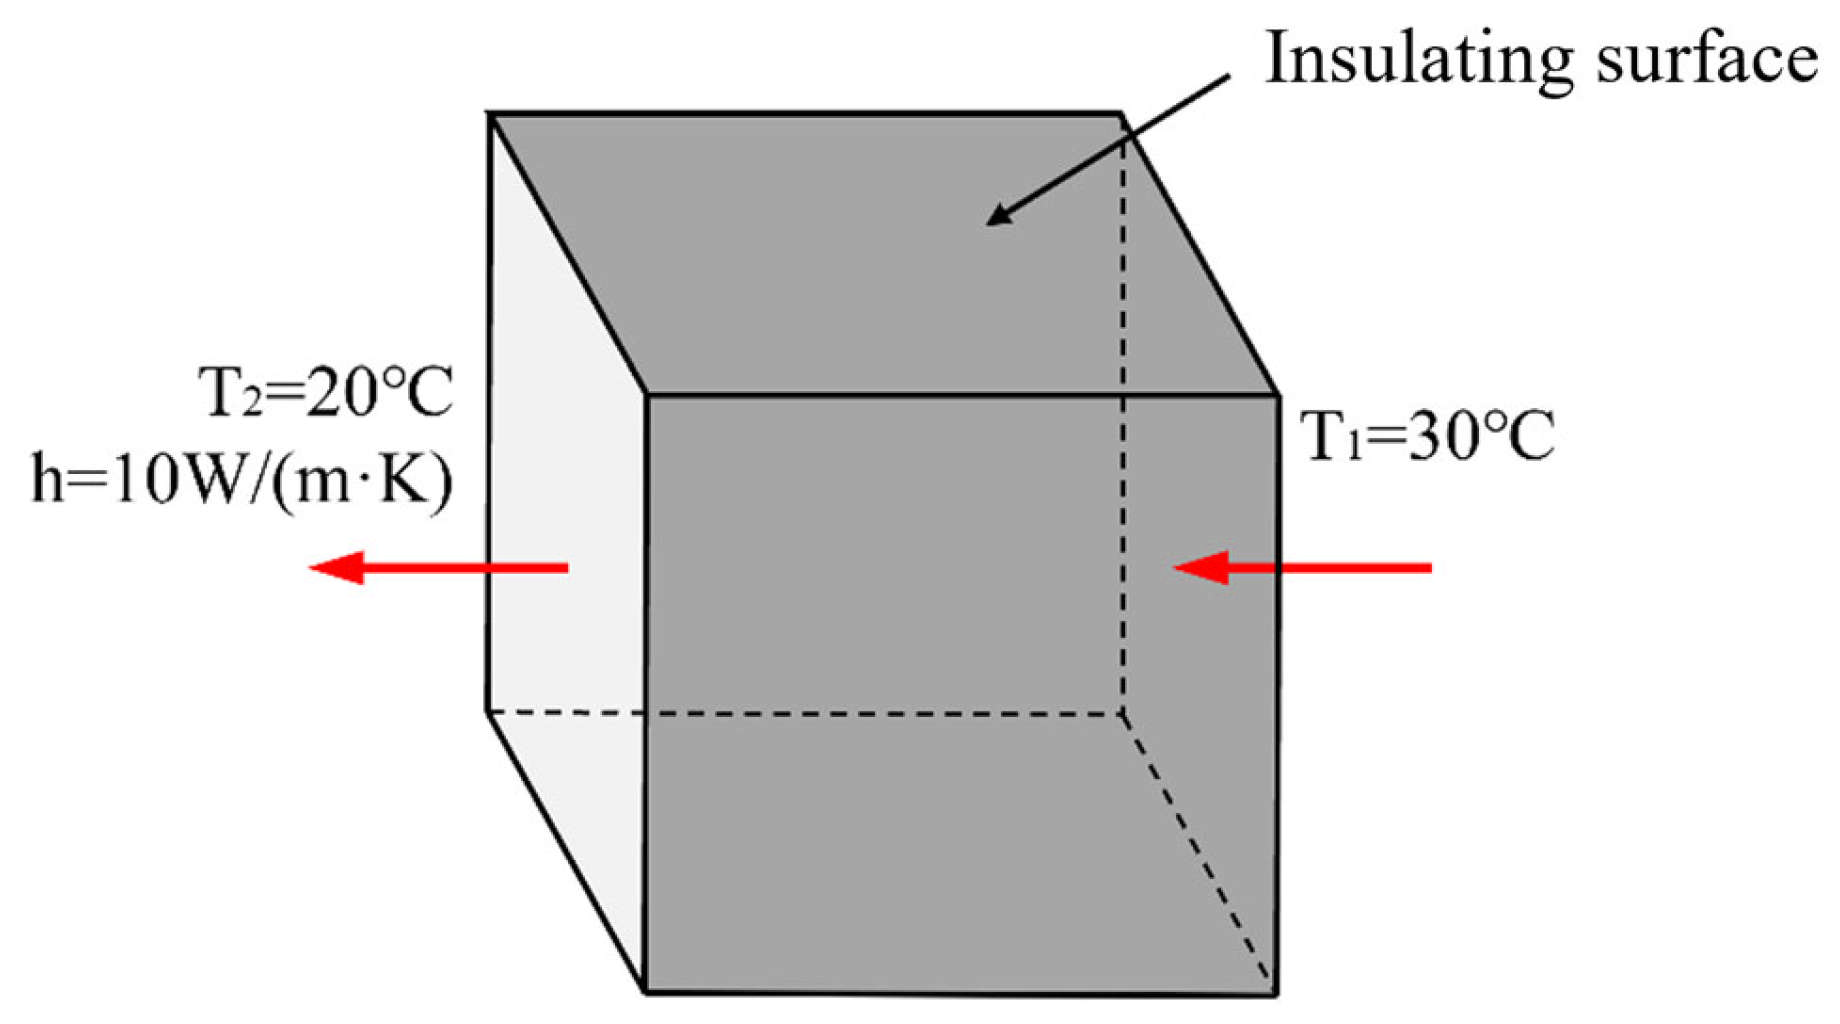
This study investigates the steady-state temperature field, where the temperature distribution at each point in the material is independent of time. Heat transfer at each node within the filled system follows Fourier’s law [28]. In three-dimensional numerical simulations, considering Fourier’s law in a Cartesian coordinate system, the formula is as follows:
q = λ t = λ ( t x i + t y j + t z k )
In the formula, q represents the heat flux density, in units of W/m2; λ represents the thermal conductivity coefficient, which indicates the material’s ability to conduct heat, in units of W/(m·K); gradt represents the temperature gradient. The negative sign in the formula indicates that the direction of the heat flux density vector is opposite the direction of the temperature gradient vector, meaning that in heat conduction, heat always spontaneously flows from regions of higher temperature to regions of lower temperature.

2.2. Microbead Thermal Conductivity Model

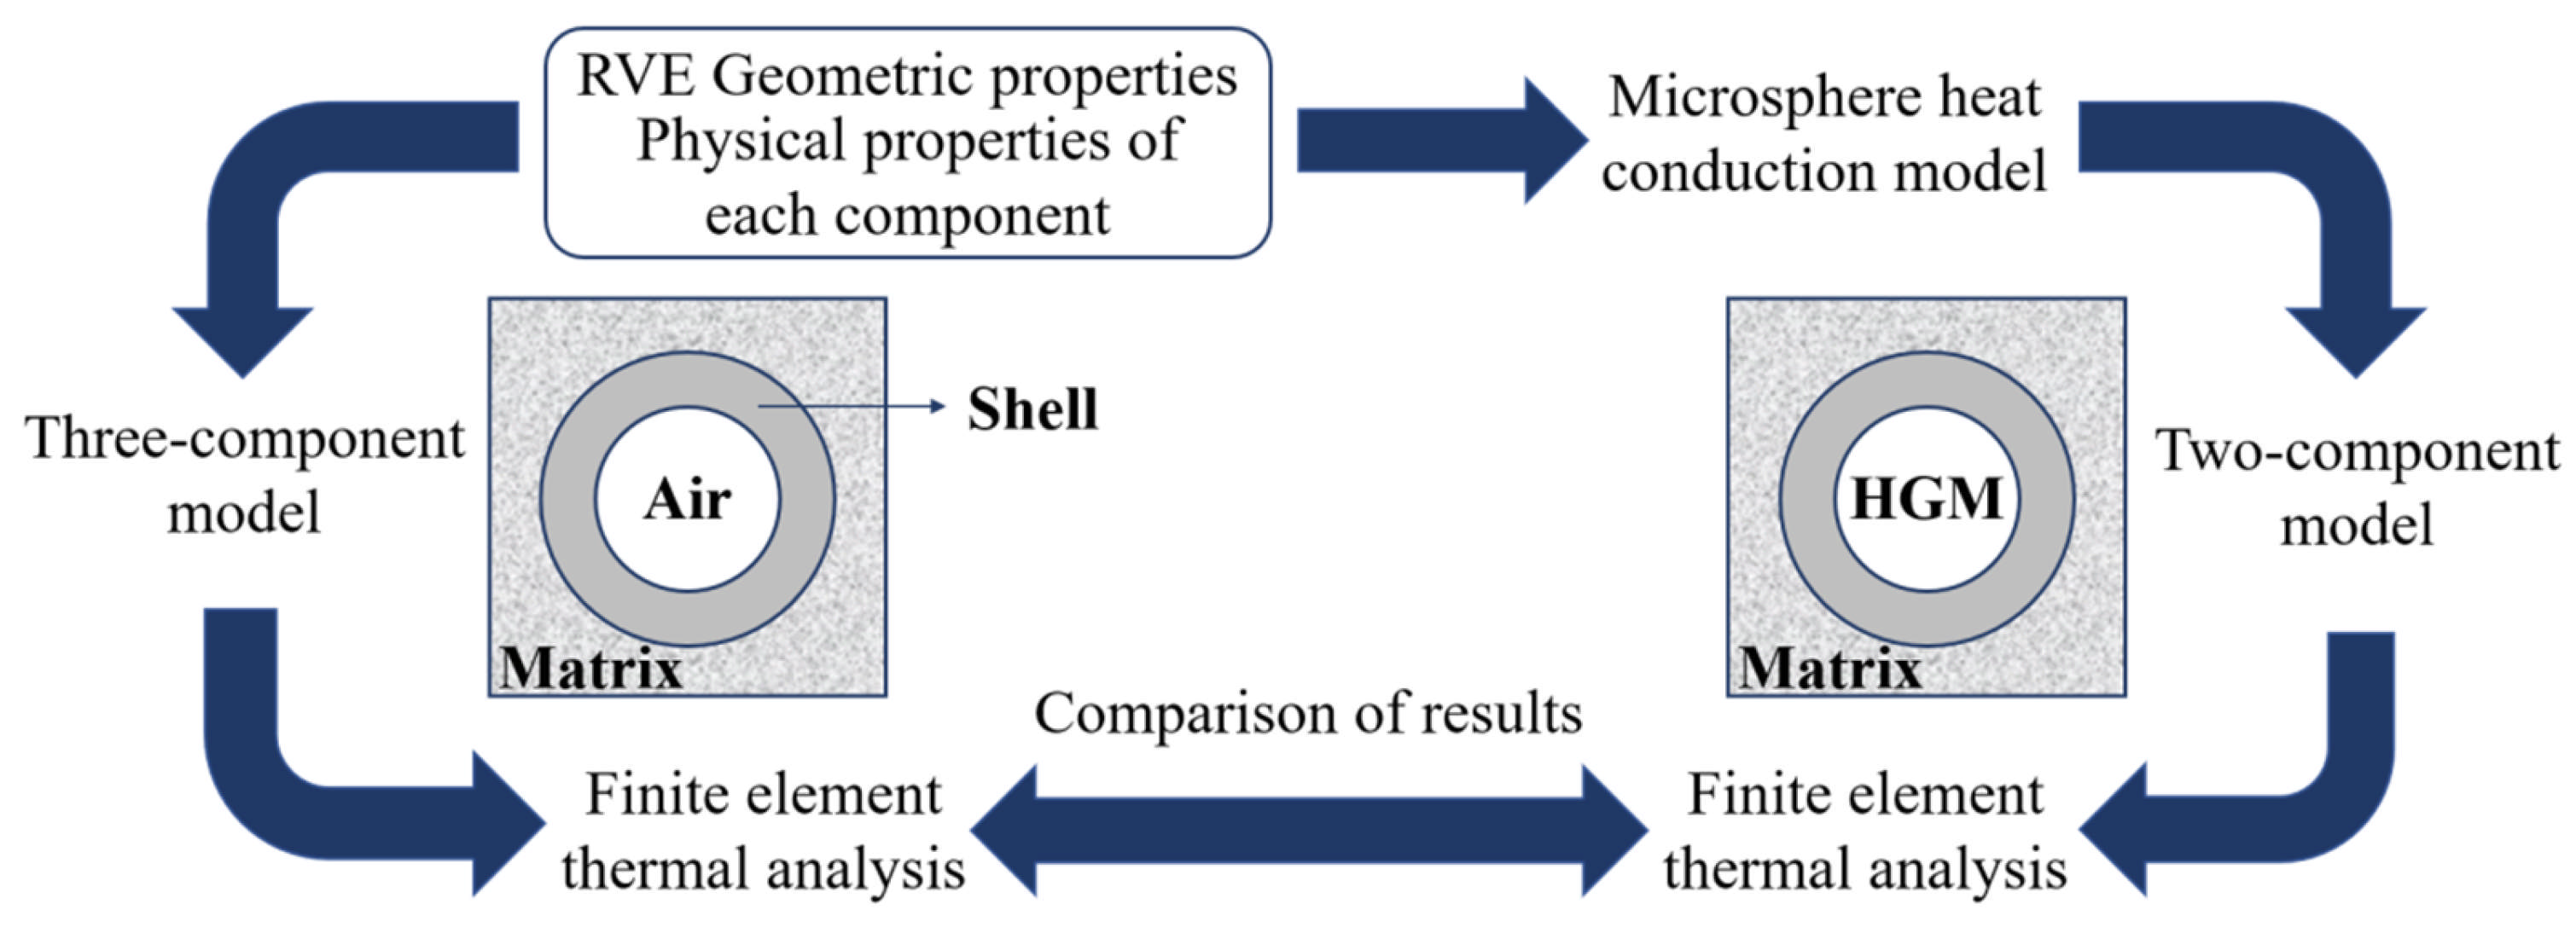
For HGM/ER composites with a void structure, the model is highly complex, comprising four components: the resin matrix, voids, the outer layer of microsphere glass, and the internal gas of the microspheres. The computational load for thermal simulations is significant, necessitating model simplifications. On the other hand, if the equivalent thermal conductivity of the microspheres is known, simplifying the two-component model into a single-component model allows for the exclusion of variables within the microspheres, thus enabling a more focused analysis of the influence of the void structure outside the microspheres on the thermal performance of the composite material. Therefore, in the subsequent analysis, this study considers an equivalent microsphere thermal conductivity model for heat transfer simulations, as shown in Figure 2.
In the simplification of the thermal conductivity model for hollow glass microspheres, numerous two-component models have been proposed by leading scholars, such as the Park model based on the heat conduction equation [29], the Liu model based on the generalized self-consistent theory [30], and the Benveniste model based on microthermal conduction theory [31], as shown in Table 1 below.
In the formulas in the table, to unify the variables, the same variables are represented by the same symbols. Here,  k H G M  is the thermal conductivity coefficient of the hollow glass microspheres, in units of W/(m·K);  k g  is the thermal conductivity coefficient of the glass shell layer of the hollow glass microspheres, in units of W/(m·K);  k a  is the thermal conductivity coefficient of the air layer inside the hollow glass microspheres, in units of W/(m·K); f is the volume fraction of air inside the microspheres.
Since the simulation results of the 3D model are closer to the experimental data than those of the 2D model [22], this paper compares and analyzes the thermal conductivity differences of the above three types of microsphere two-component and three-component models at different particle size ratios, while ensuring that the geometric and physical properties, such as microsphere particle size and filling ratio, are consistent across the models.
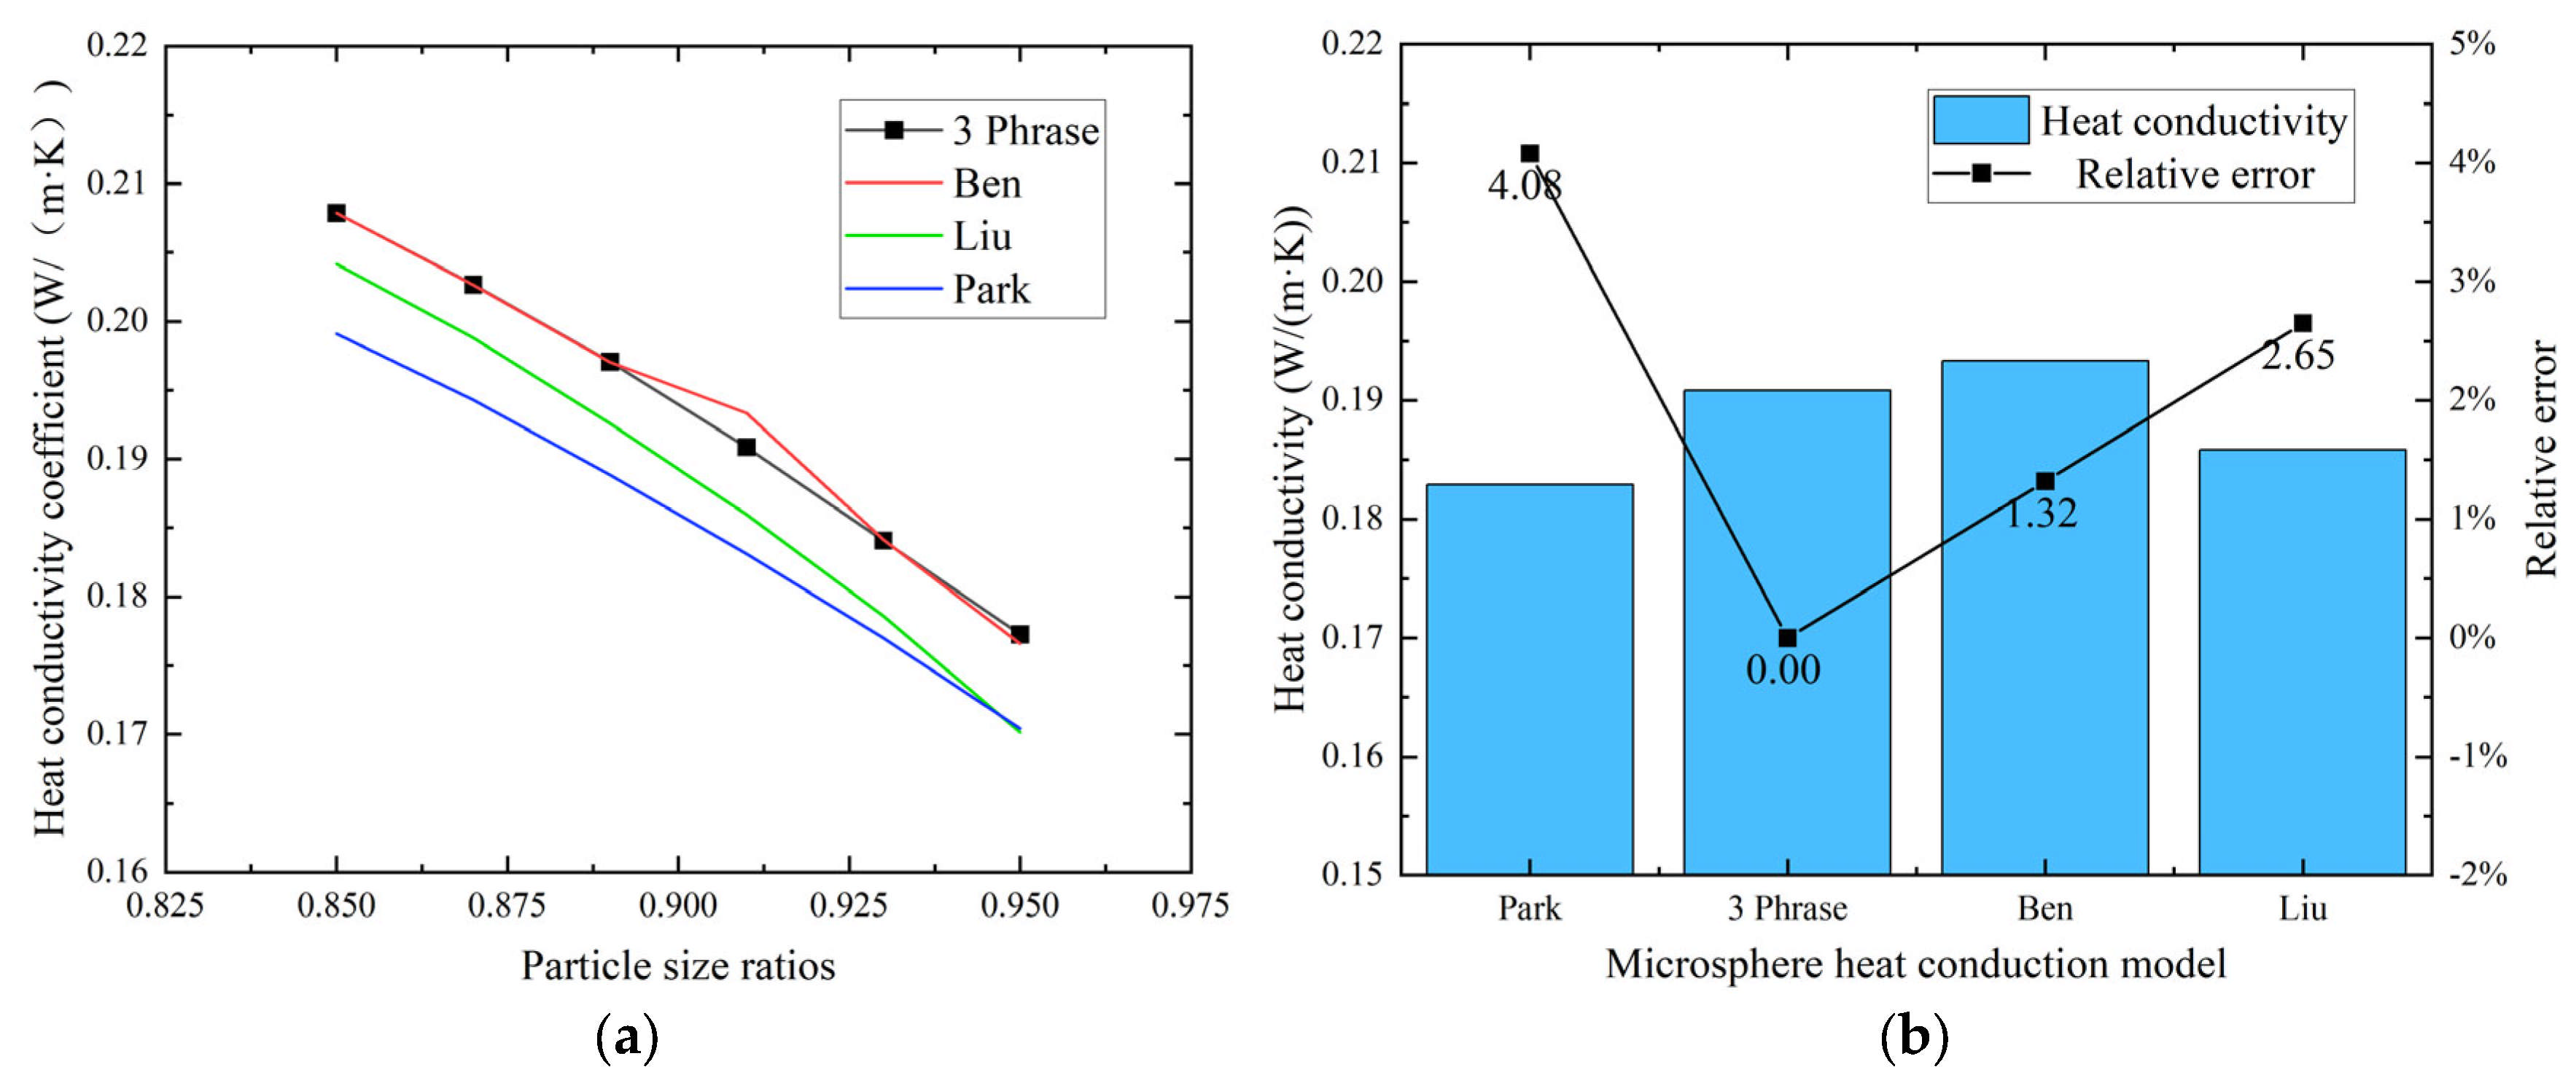
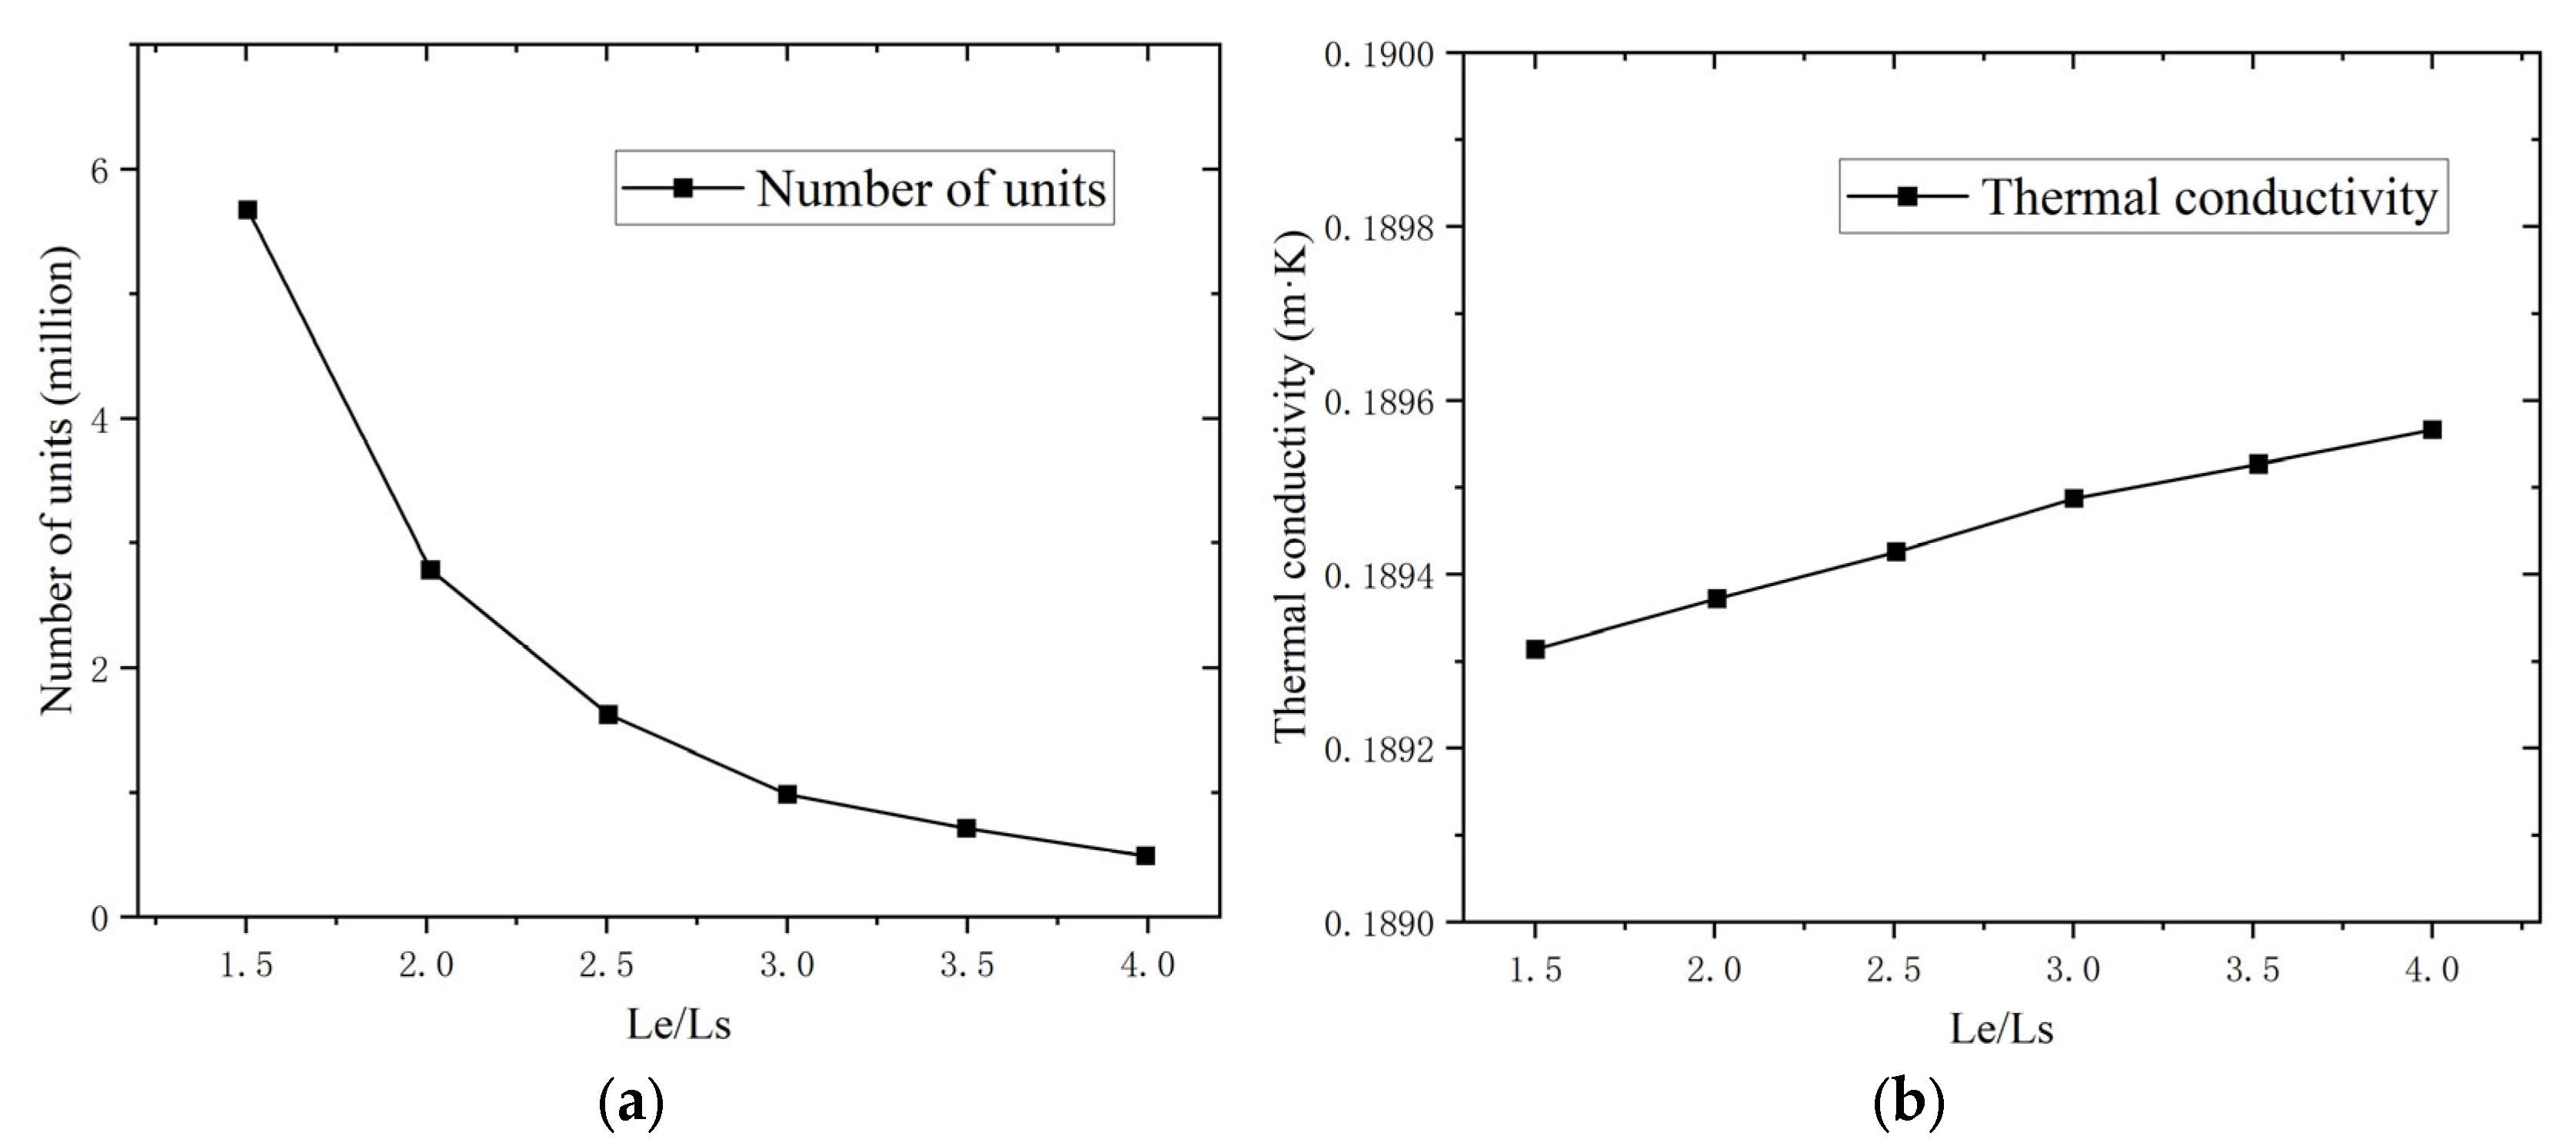
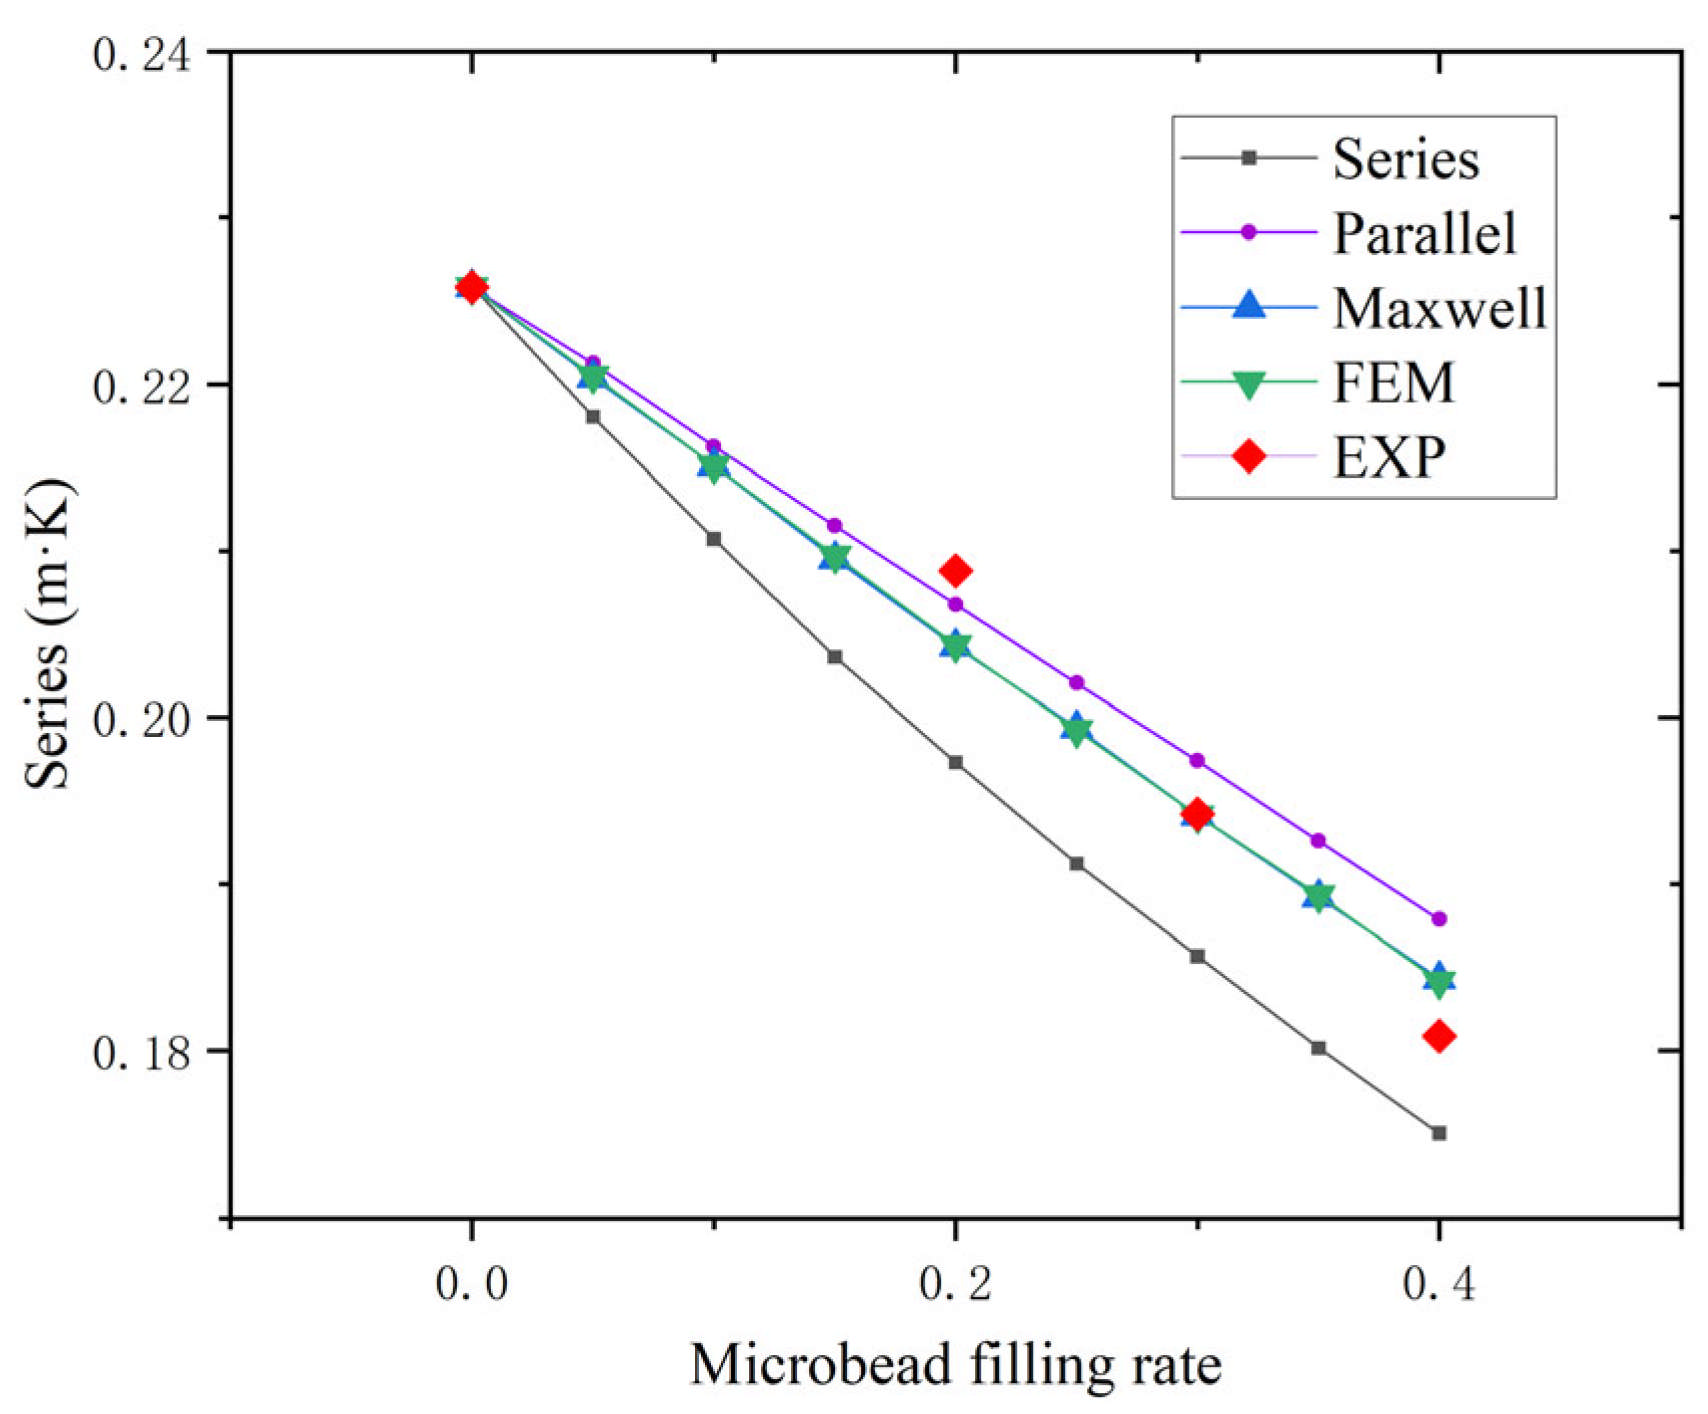
As shown in Figure 3, with the increase in particle size ratio, the thermal conductivity of the microspheres decreases. The thermal conductivity of the microspheres calculated using the Benveniste model is in good agreement with that of the ternary model, and even when the particle size ratio is 0.91, where the error is largest, the relative error is only 1.32%, which is still smaller than that of the Park and Liu models. Therefore, in subsequent simulations, the Benveniste model will be used to calculate the thermal conductivity of hollow glass microspheres and the binary microspheres will be simplified to a single component.

3. RVE Model Optimization and Validation

3.1. RSA Algorithm Optimization

This paper improves and optimizes the traditional RSA algorithm [32], based on the particle physical scale randomization criterion and the particle movement optimization distribution strategy, to achieve the preset filling ratio standard while ensuring the uniformity of particle distribution. The abbreviated algorithmic optimization process is shown in Figure 4 and the specific optimization strategy can be found in Appendix A.
In Abaqus 2022, the RVE model for HGM/ER materials is constructed by determining whether the volume filling rate of the filler and void particles meets the standard, which serves as the termination condition for adding particles. To verify the improved and optimized RSA algorithm, this paper sets an example with a particle diameter of 30 μm and a particle-to-cell edge length ratio of 5. It is verified that the traditional RSA algorithm can achieve an upper limit of 28% for the particle filling rate, while the improved and optimized RSA algorithm can increase the upper limit of the particle filling rate to 35% under the same conditions, with an optimization improvement of 25%. Additionally, the uniformity of the particle distribution is significantly improved, and the specific optimization effect is shown in Figure 5.

3.2. RVE Grid Sensitivity Verification

In this study, we adopt the ratio of the global mesh size (Le) to the thickness size (Ls) of the microbead glass layer in Abaqus 2022 as a scaling criterion for assessing the mesh sensitivity of the RVE model in order to ensure that the meshing meets the requirements of computational accuracy as well as to effectively control the consumption of computational resources, the schematic diagram of the grid division is shown in Figure 6.
The particle size ratio of hollow glass beads refers to the ratio of the inner diameter to the outer diameter of the beads, which generally ranges from about 0.85 to 1 [33], and the focus here is on the beads with a particle size ratio of 0.95 when the thickness of the glass layer is thinner because the smaller the wall thickness of the beads, the more sensitive the model is to the mesh size. The meshing process is in the common form, assuming that the particles are ideally bonded to the substrate and filled with 25% volume fraction of microbeads, and setting the thermal conductivity of the epoxy resin substrate, the glass layer of hollow glass beads, and the air to be 0.226 W/(m·K), 0.75 W/(m·K), and 0.0267 W/(m·K), respectively [22], and the effect of the mesh size on the calculation of thermal conductivity is shown in Figure 7.
As can be seen from the figure, the number of meshes in the RVE decreases by more than five times when Le/Ls increases from 1.5 to 3, while the thermal conductivity only increases from 0.18931 to 0.18948, with a change of 0.09%. This indicates that the number of meshes in the model shows a significant order of magnitude increase as the Le/Ls values change. However, despite such a significant change in the number of meshes, the calculated thermal conductivity results are quite close. This indicates that the calculation of thermal conductivity has a low sensitivity to changes in grid size or grid density, and thus a higher Le/Ls value in subsequent calculations can improve the efficiency of the calculation while ensuring the accuracy of the calculation.

3.3. Boundary Conditions and Model Reasonableness Validation

During the determination of the steady-state thermal conductivity of the simulated flat plate, the actual situation was simulated by setting the right boundary of the model to be a constant heat source and the left side to be the ambient temperature. The convective heat transfer coefficient was set to 10 W/(m·K) and the rest of the boundaries were adiabatic to the environment. The detailed boundary conditions are shown in Figure 8.
We used the improved RSA algorithm proposed in the previous paper to establish the RVE model to participate in the numerical simulation and compare the mathematical model and experimental data [21], in which the mathematical model selects the more classical series–parallel model and Maxwell thermal conductivity model [34,35], to validate the reasonableness of the model established by the optimized RSA. As shown in Figure 9. The series model and parallel model are rougher, while the numerical results of the optimized model match well with the Maxwell model, which proves that the optimization algorithm can effectively achieve the uniformity of the particle distribution and reduce the phenomenon of particle agglomeration. There is a small error with the experimental data, which is higher than the numerical prediction of 2.1% at the 20% filling rate of the microbeads, and 1.7% lower than the numerical prediction when the filling rate of the microbeads is 40%. At a 40% filling rate of beads, the experimental data prediction is 1.7% lower than the numerical prediction, which may be caused by the formation of heat conduction paths by the crushing of beads or the existence of voids to extend the heat conduction paths, etc. The overall error is within a reasonable range. Overall, the errors are within reasonable limits and do not affect the validation of the rationality of the optimized RSA model.

4. Effect of Voids on the Thermal Properties of HGM/ER

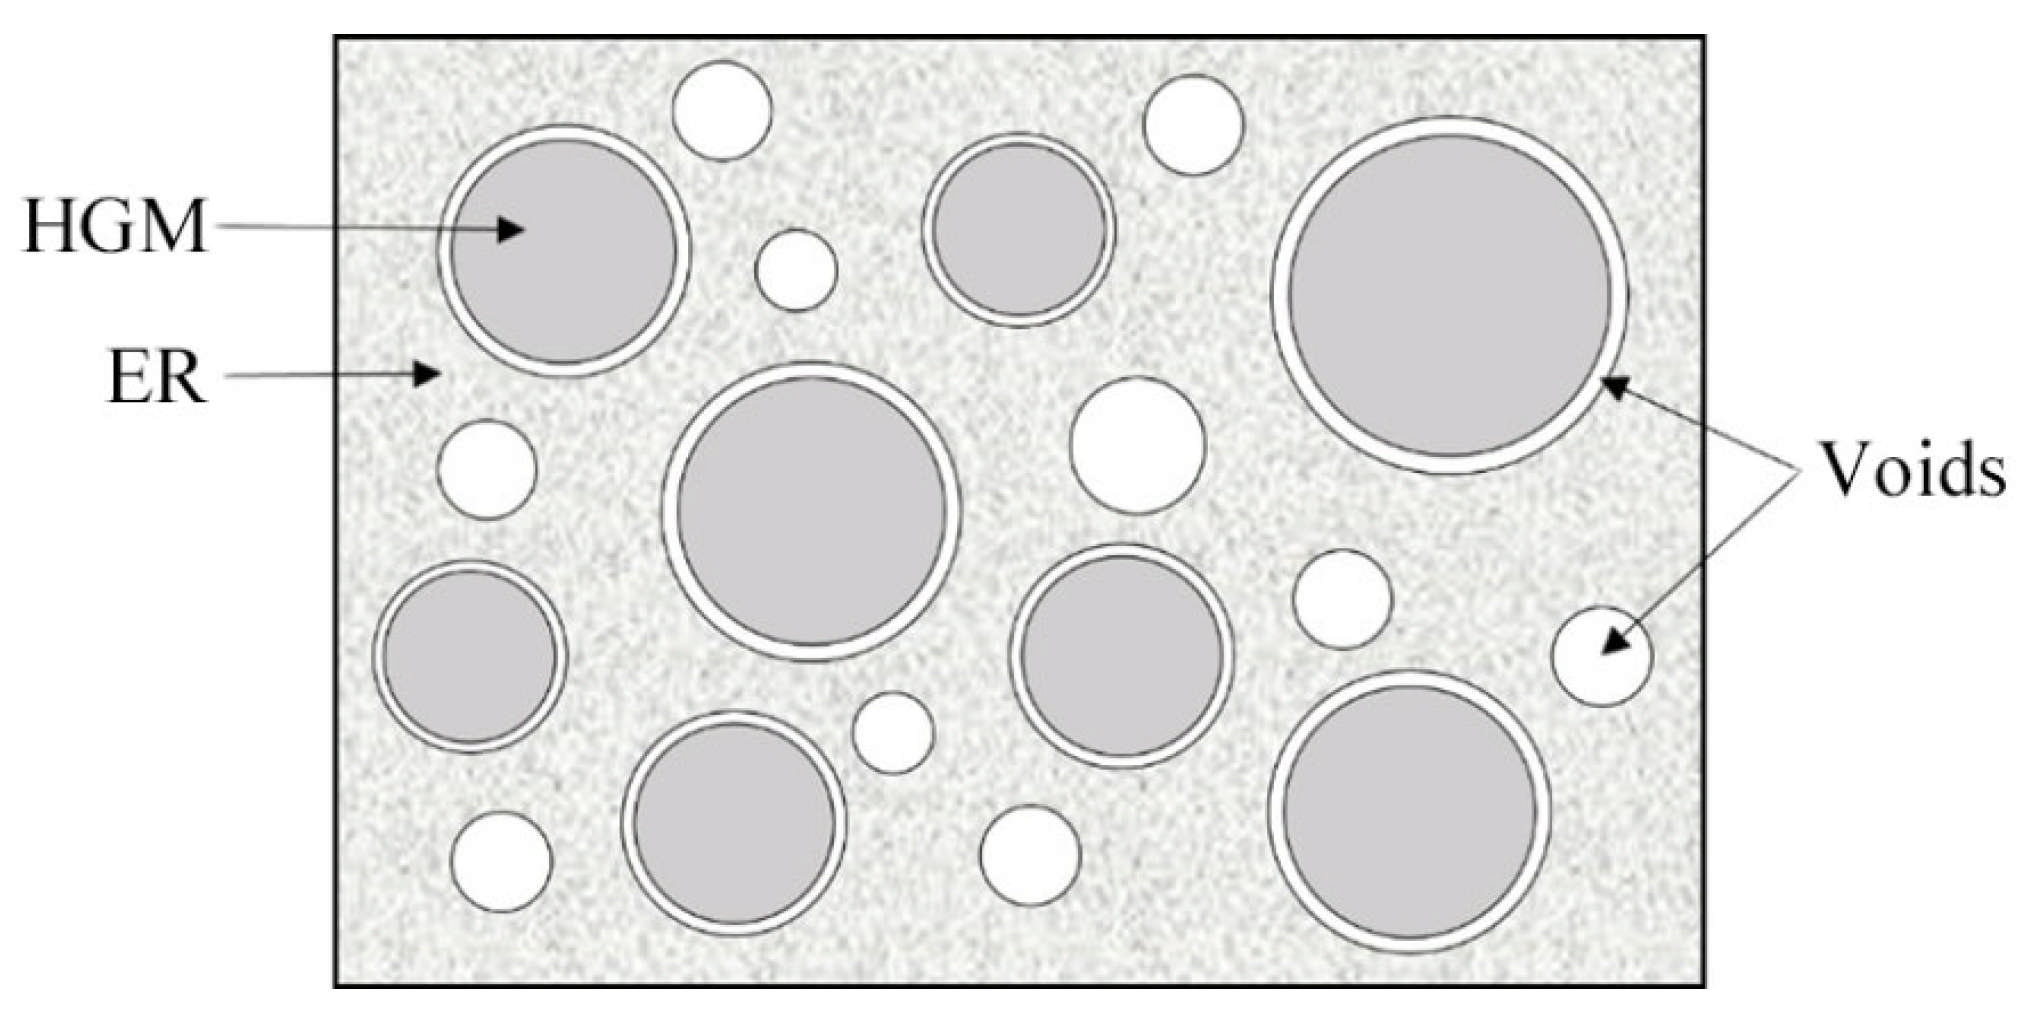
There are two main types of void structures outside the microspheres: one is bubbles, free within the resin, and the other exists as interfacial thermal resistance, embedded between the microsphere shell and the resin, as shown in Figure 10. Both void morphologies occur randomly and indeterminately, which is closely related to the manufacturing process and the chemical reagents used. This study simplifies the voids free within the resin as spherical structures [36], referred to as free voids, and simplifies the voids on the outer surface of microspheres as spherical shells, referred to as interfacial voids. It is assumed that the thermal conductivity of the interfacial voids is not affected by the Knudsen effect [37]. In fact, due to the presence of interfacial effects, the microbead inorganic glass surface may appear difficult to bond with the organic epoxy resin, but this phenomenon is not global, so the assumptions made in this paper about the shape of the interfacial voids may bias the low results of the thermal conductivity prediction.
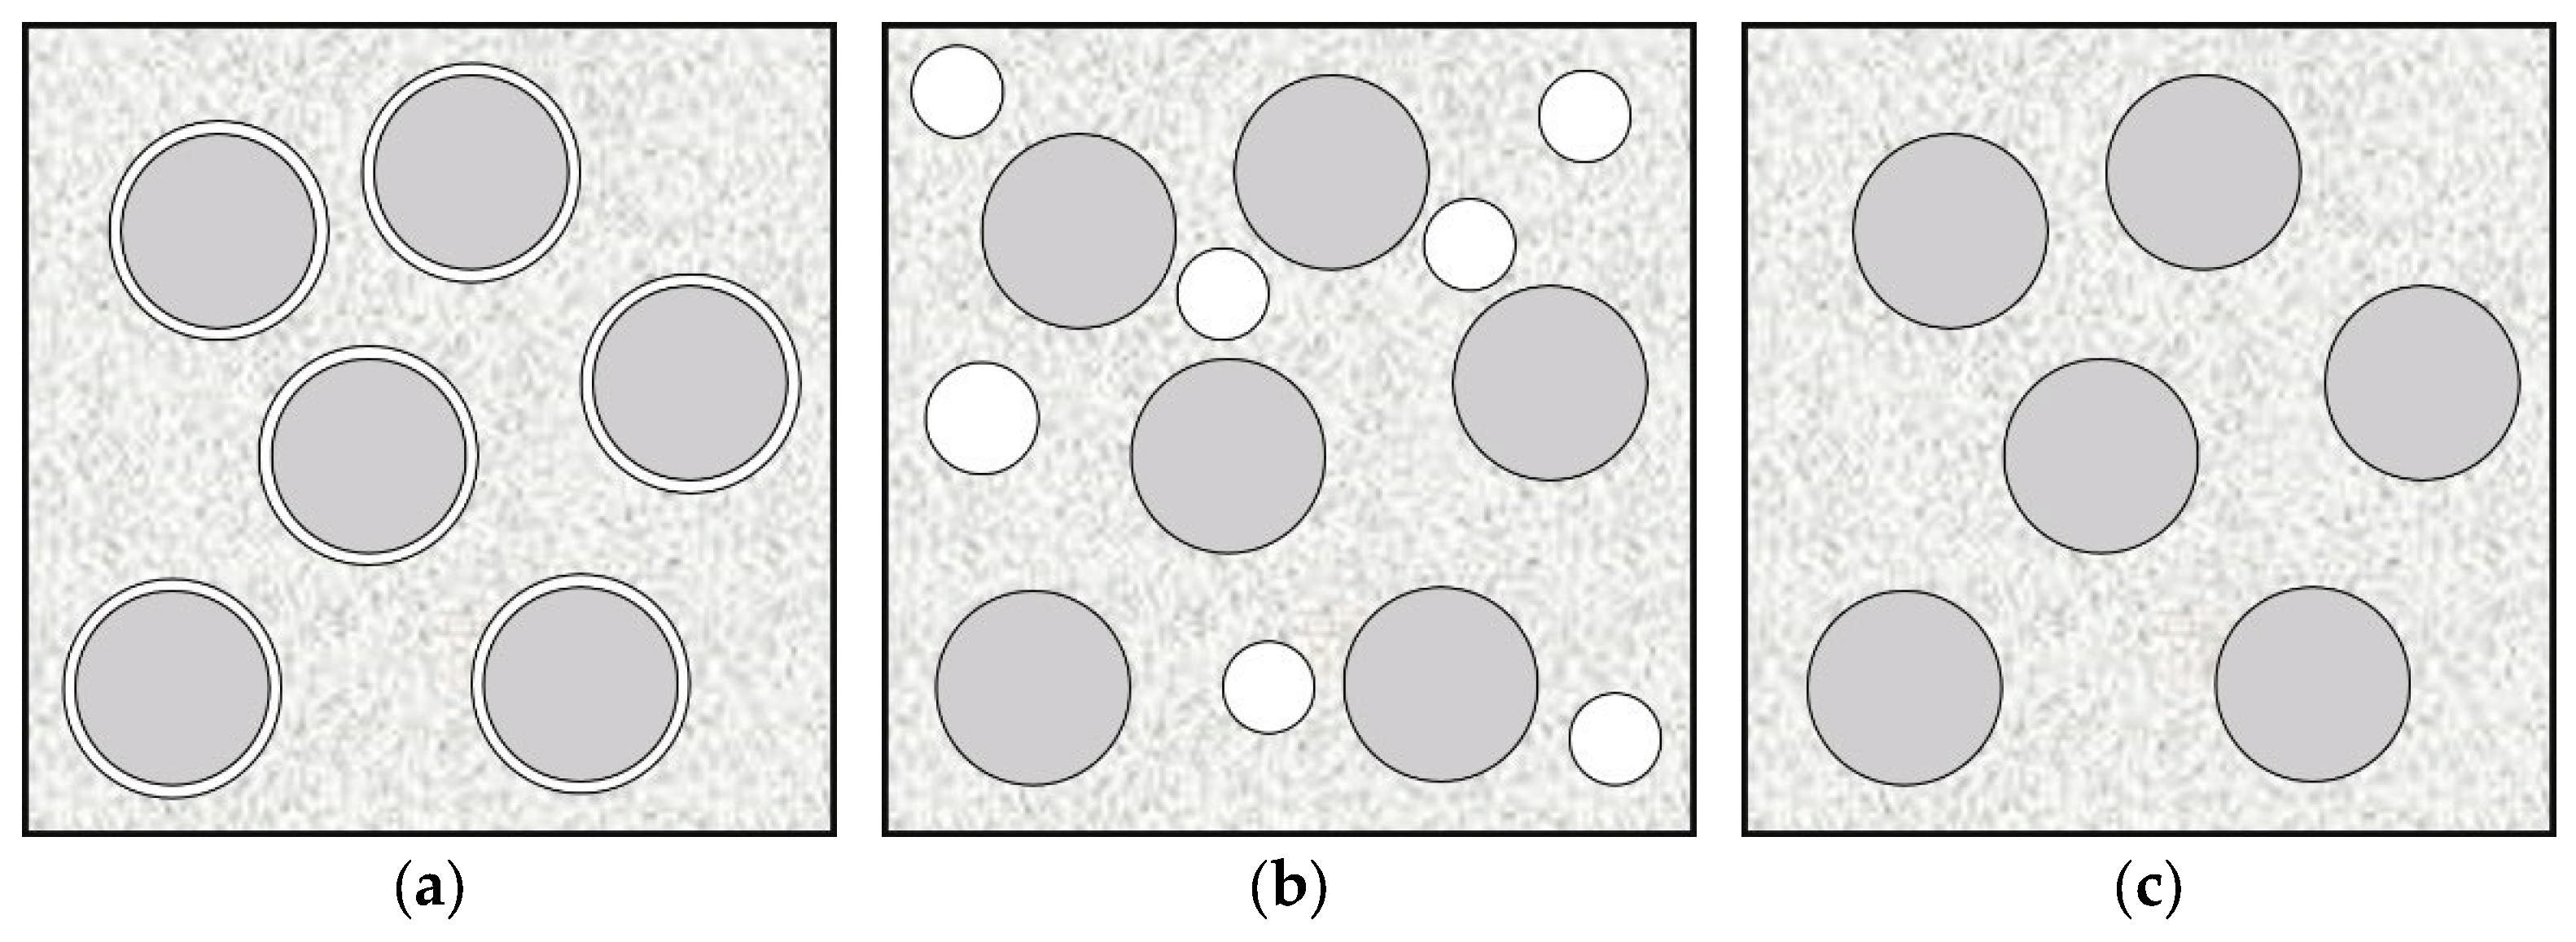
The increase in the particle size of the beads and the increase in the volume fraction may cause an increase in the void ratio inside the HGM/ER materials [
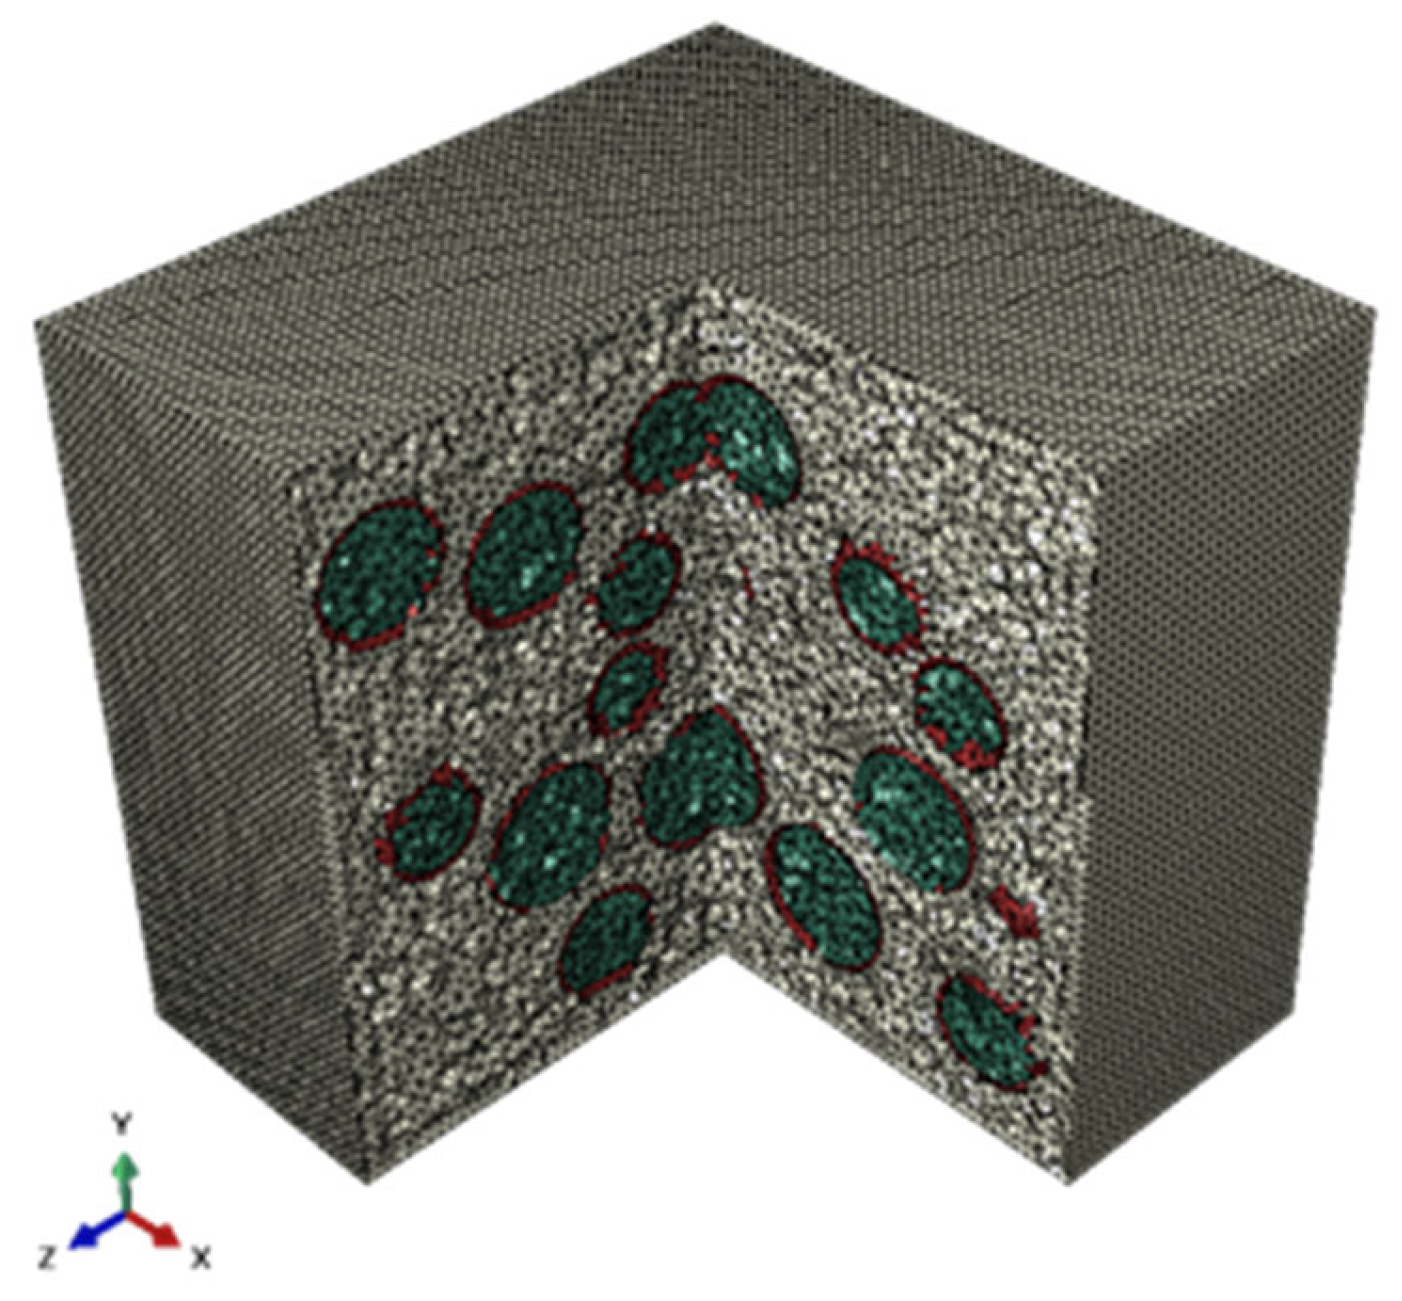
38], and the mixing time and the degree of homogeneity also affect the void ratio of the composites, which is inherently stochastic. In this paper, the effect of void type on the thermal properties of the material will be investigated through a single void structure thermal simulation, as shown in Figure 11. In establishing the RVE model of the void structure, the thickness of the interfacial void layer is the average thickness of the void ratio uniformly distributed over all the microbeads, and the size of the spherical voids is designed to be randomly distributed in the range of 15~25 μm.

4.1. Effect of Interface Voids on the Thermal Properties of HGM/ER

The thermal conductivity of resin is set to 0.226 W/(m·K), and the thermal conductivity of air is set to 0.029 W/(m·K). The microsphere diameter is 50 μm, with a diameter ratio of 0.9 and a volume fraction of 25%. RVE models of HGM/ER composites with interface voids of 3%, 4%, 5%, and 6% are established. The effective thermal conductivity of the composites calculated is shown in the following Table 2.
From the table, it can be seen that under the same microsphere diameter and volume fraction conditions, the effective thermal conductivity of the HGM/ER material is negatively correlated with the change in interface voids. When the interface voids increase from 3% to 6%, the material’s thermal conductivity decreases from 0.197 W/(m·K) to 0.185 W/(m·K), a reduction of 6%. Given that the voids of the HGM/ER material can reach more than 8% [21], interface voids are an important factor affecting the thermal properties of the material under practical conditions. To further investigate the effect of interface voids on the material’s thermal performance, the thermal simulation contour for voids of 6% is shown below.
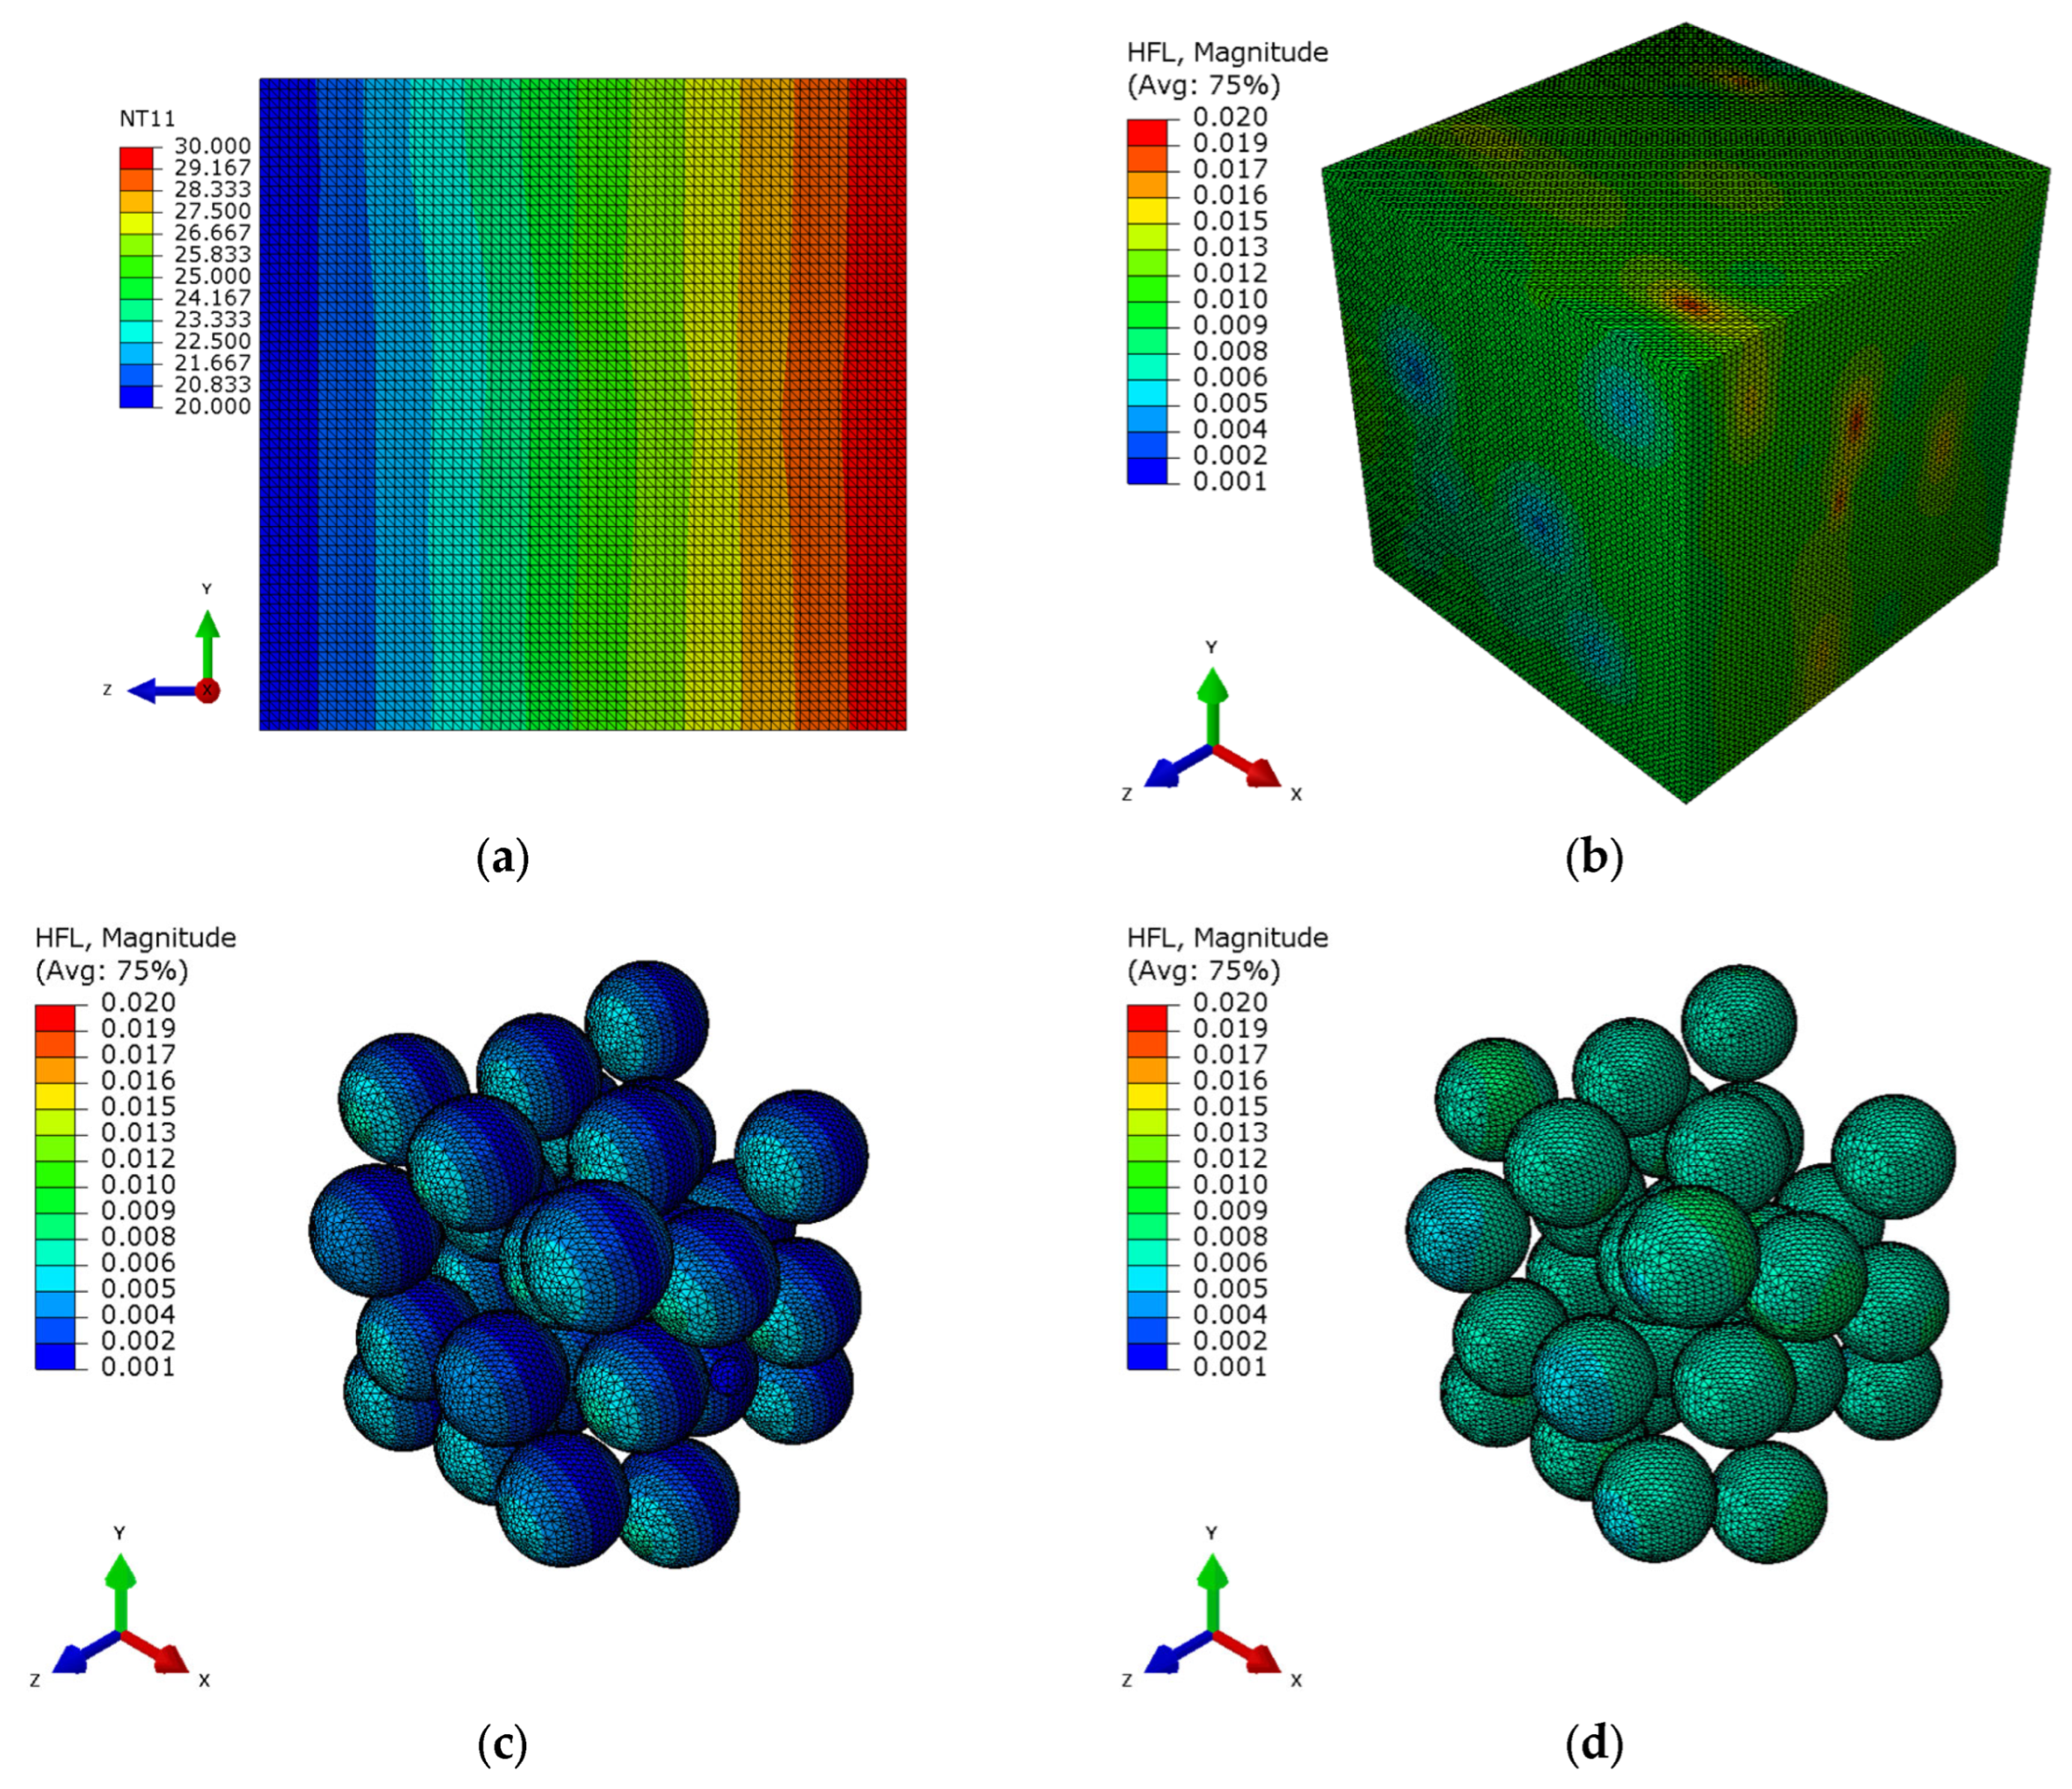
As shown in the temperature profile in Figure 12a, the temperature contour lines on the side of the RVE are irregular, which is due to the random distribution of HGM and void structures that alter the natural convection and heat conduction within the resin matrix, resulting in an uneven temperature decrease as heat is transferred through different phases within the RVE.
When heat flow directly reaches the interface voids, it is divided into three parts. One part of the heat flow passes through interface voids into hollow glass microspheres; another part spreads along the interface voids layer, but due to the longer path and relatively higher thermal resistance, heat flow along this path is minimal; the third part is along the resin outside voids, where the resin has the lowest thermal resistance, so the heat flow is maximal. From the heat flow contour of the interface voids (Figure 12c), it can be seen that along the z-direction of heat transfer, the middle part of the spherical void becomes darker as it approaches the center, indicating a decrease in the heat transfer and an increase in thermal resistance. This region of heat flow tends to accumulate more in the resin matrix outside interface voids, as shown by the red area in Figure 12b. The color at both ends of the interface voids becomes lighter, indicating that part of the heat flow, after traveling along a certain path through the interface voids, enters the microsphere with relatively lower thermal resistance, as shown in Figure 12d.
The first two heat transfer pathways involve varying degrees of flow through the porous regions. Therefore, compared to direct heat transfer through high thermal conductivity resins or glass microspheres, these two pathways exhibit higher thermal resistance. The third heat transfer pathway bypasses the porous layer and transfers heat through the resin matrix, resulting in the highest heat flux. However, as the pore size increases, the bypass path becomes longer, which in turn increases the thermal resistance to heat transfer. Therefore, the presence of voids at the outer interface of the microspheres increases the thermal resistance to heat transfer at different levels. On a macroscopic scale, this results in a reduction in the material’s thermal conductivity.

4.2. Effect of Free Voids on the Thermal Performance of HGM/ER

Under the same conditions as above, a thermal simulation was performed on the RVE model of the HGM/ER composite material, which only contains free voids. The effective thermal conductivity of the processed material is shown in the following Table 3.
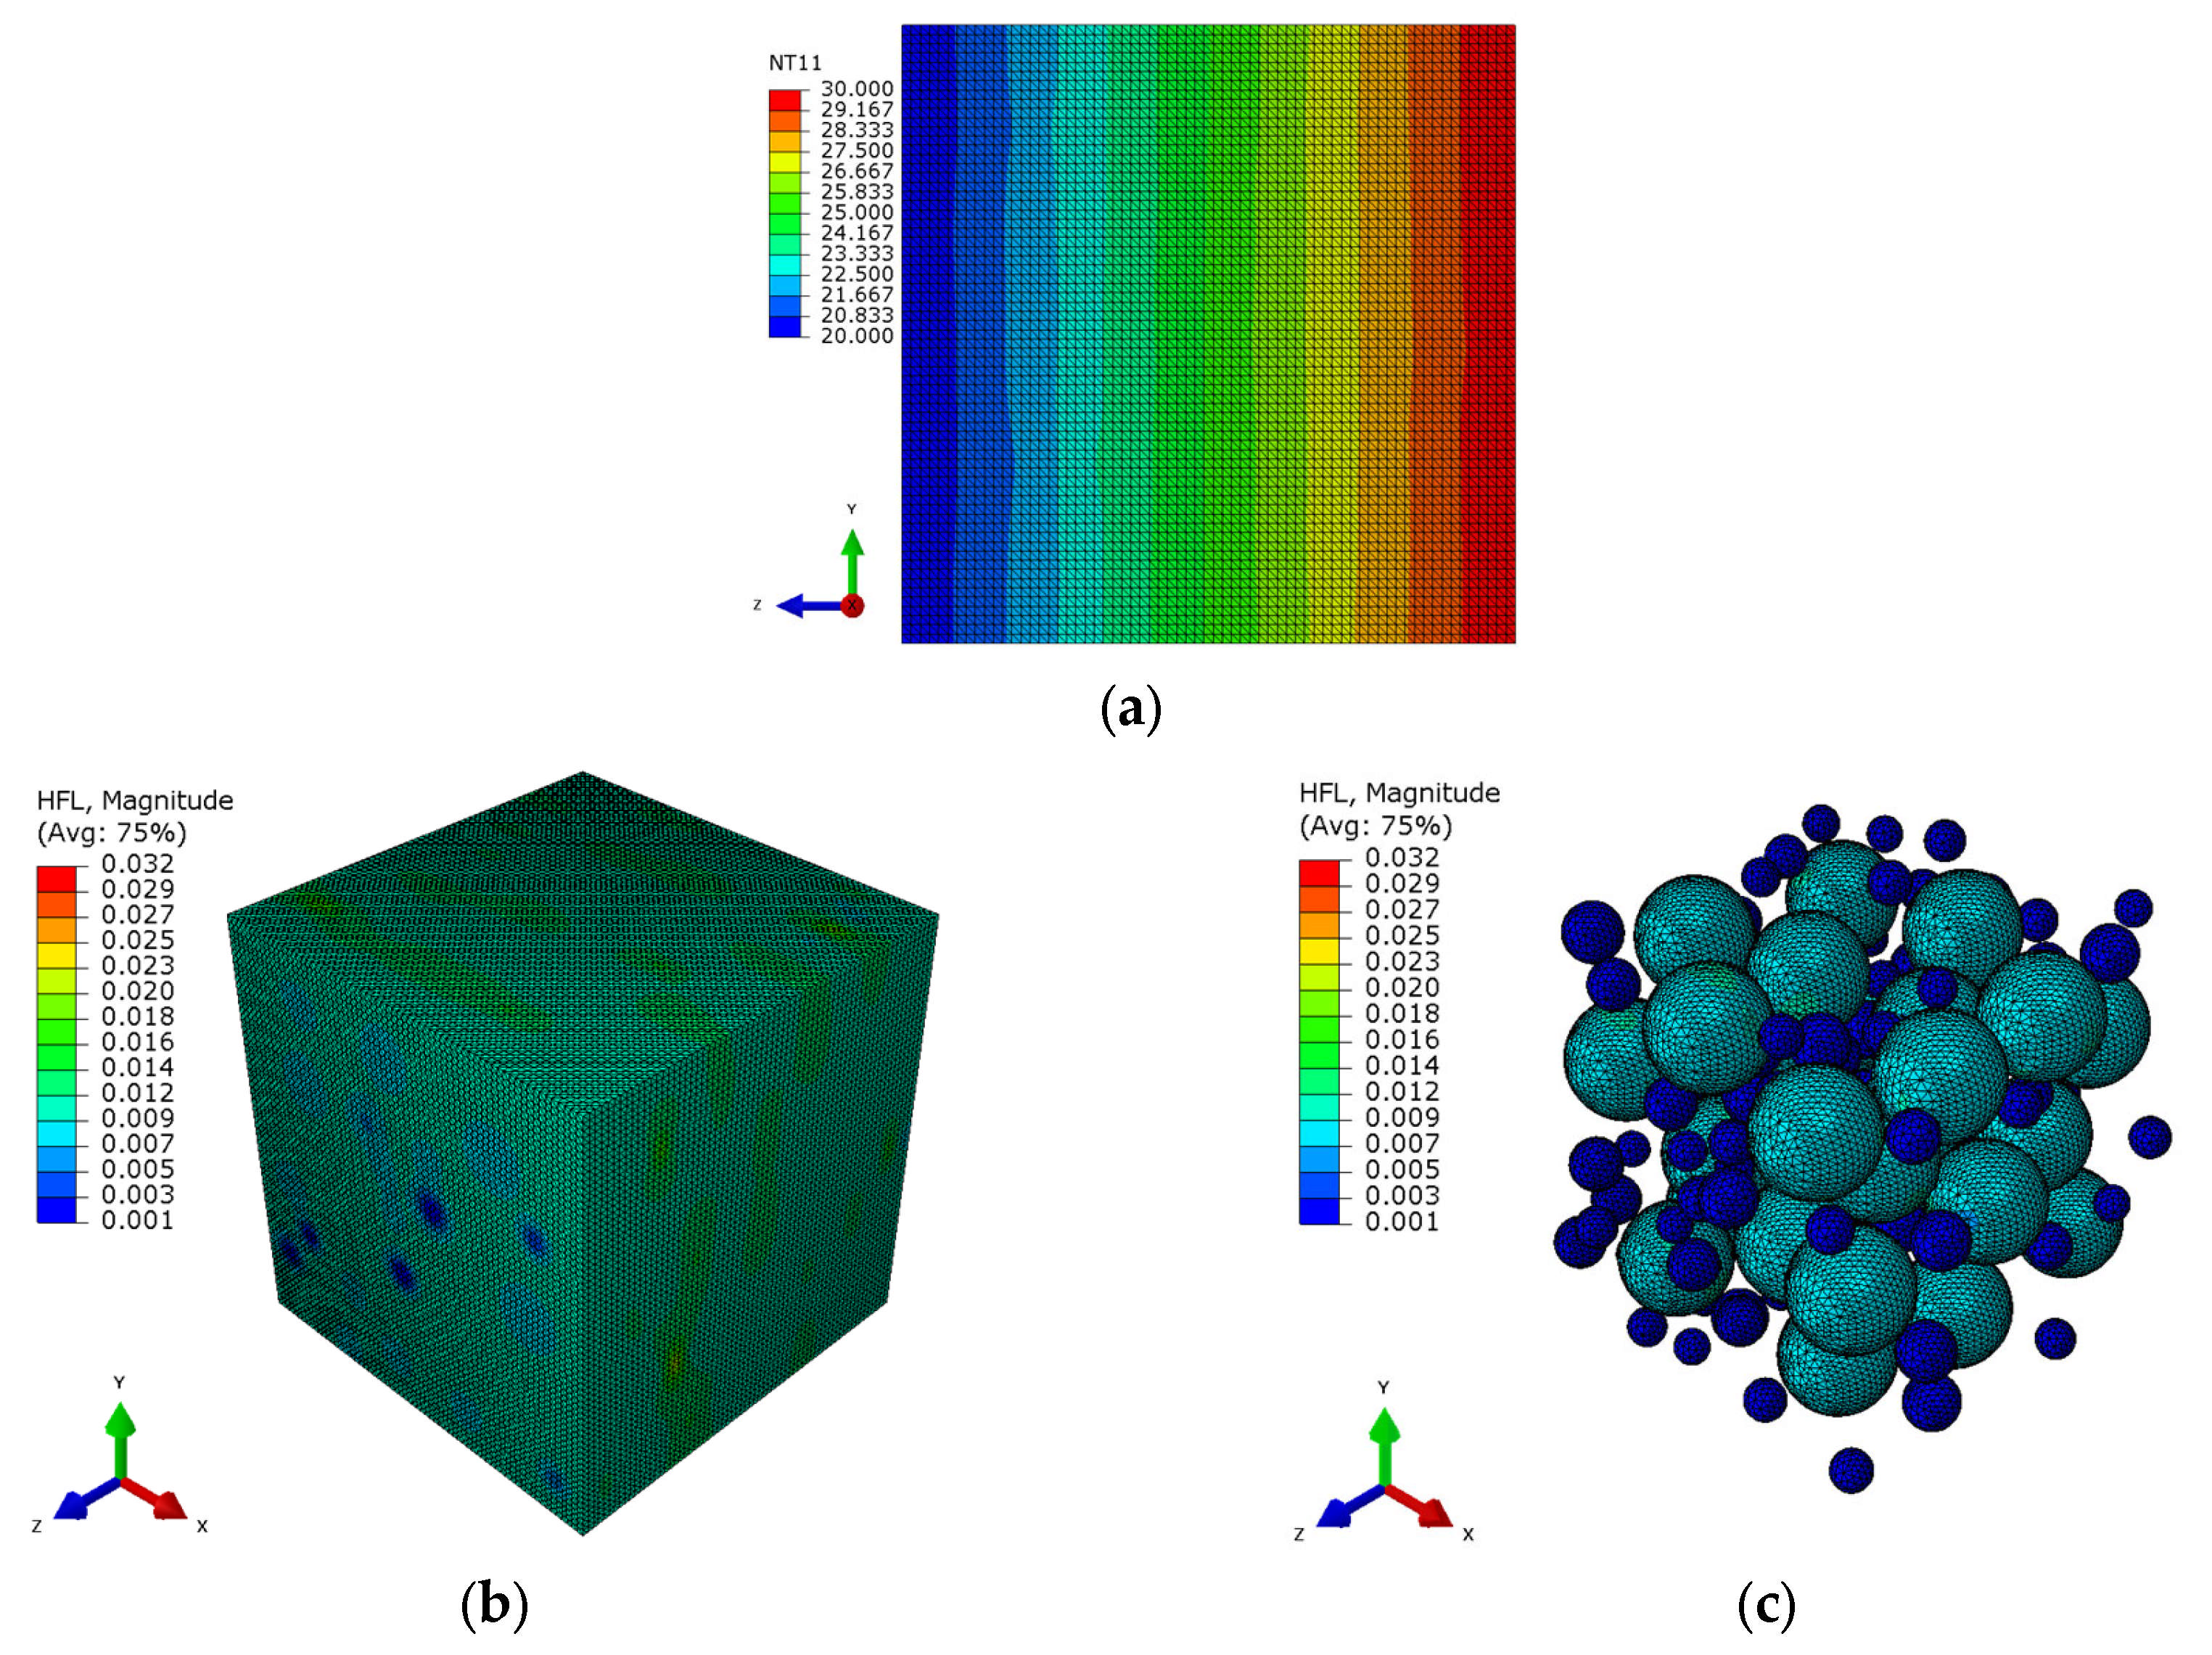
Similar to the pattern observed for interface voids, under the same conditions of glass microsphere particle size and filling ratio, the effective thermal conductivity of HGM/ER material linearly decreases with the increase in free voids. When the free voids increase from 3% to 6%, the material’s thermal conductivity decreases from 0.202 W/(m·K) to 0.194 W/(m·K), a reduction of 4%. Compared to interface voids, the change in thermal conductivity caused by free voids is relatively small. Taking the thermal simulation contour map of HGM/ER material with 6% voids as an example, the microscopic heat conduction mechanism inside the material is explained, as shown in Figure 8.
According to Fourier’s law of heat conduction, heat flow tends to move towards areas with relatively low thermal resistance. In the RVE, heat flows through the microspheres and voids with high thermal resistance, leading to an uneven temperature distribution within the RVE model, as shown in Figure 13a. This is consistent with the reason for the uneven temperature distribution caused by the interface voids.
Figure 13c shows the heat flow distribution map for the microspheres and voids. It can be observed that the heat flow passing through the voids is significantly smaller than that through the microspheres. This is due to two reasons: on one hand, the thermal resistance of the free voids is higher than that of the microspheres; on the other hand, the particle size of the free voids is smaller than that of the microspheres, resulting in a shorter path for the heat flow to bypass the voids. Therefore, when the heat flow directly moves toward the microspheres and voids, it bypasses the voids, and the proportion of heat flow diverted from the resin matrix is higher, as shown in Figure 13b,c.
Compared to interface voids, the effect of free voids on the thermal performance of HGM/ER materials is simpler. Both the thermal resistance of the voids themselves and the bypassing of heat flow contribute to an increase in the overall thermal resistance, leading to a decrease in the material’s thermal conductivity as the free void fraction increases.

5. Effect of Void Morphology on the Thermal Performance of HGM/ER

In the previous sections, the voids around the microspheres were classified into interface voids and free voids, both of which influence the heat transfer within the material at the microscopic level. Under the same voids, the impact of free voids on the thermal performance of HGM/ER materials is smaller than that of interface voids. Based on the simulation data discussed earlier, the following section will provide a detailed comparative analysis to explore the reasons for the differences in the impact of these two types of voids on the material’s thermal conductivity.
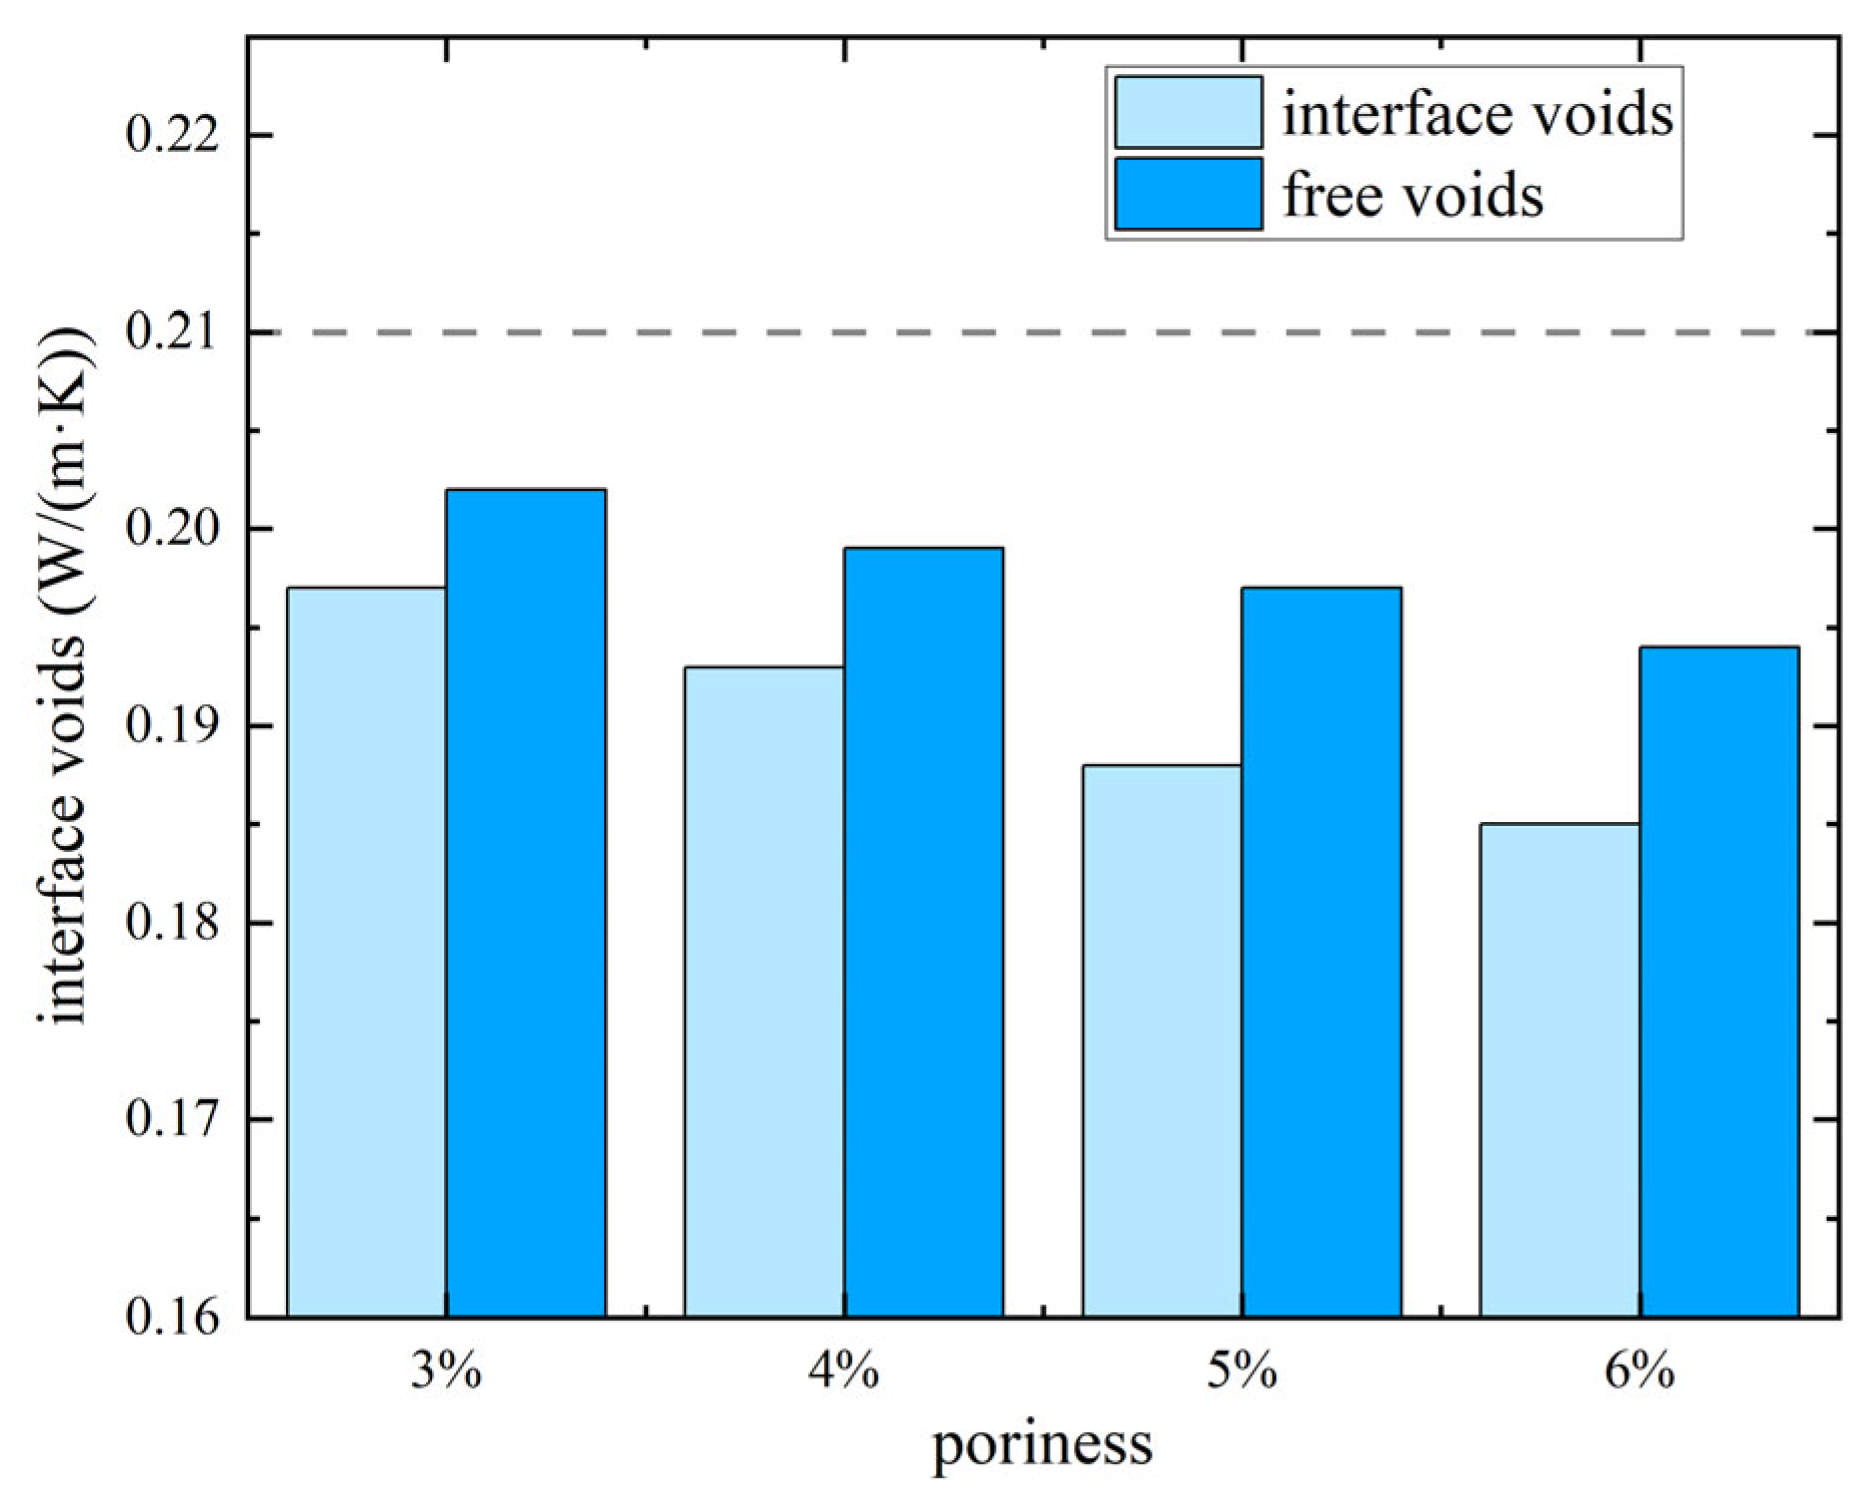
Observing Figure 14, where the dashed line represents the control group with no voids, it is evident that under the same voids, the difference in the reduction in thermal conductivity caused by interface voids and free voids is significant. Taking 3% voids as an example, free voids cause the material’s thermal conductivity to decrease from 0.210 W/(m·K) to 0.202 W/(m·K), whereas the reduction in thermal conductivity caused by interface voids is 65.5% greater than that caused by free voids. Additionally, under conditions of 3% interface voids and 5% free voids, the thermal conductivity is both 0.197 W/(m·K), which means that for the same thermal conductivity, the volume fraction of interface voids in the material is 60% smaller than that of free voids. The specific reasons for this can be further analyzed through the heat profile inside the material.
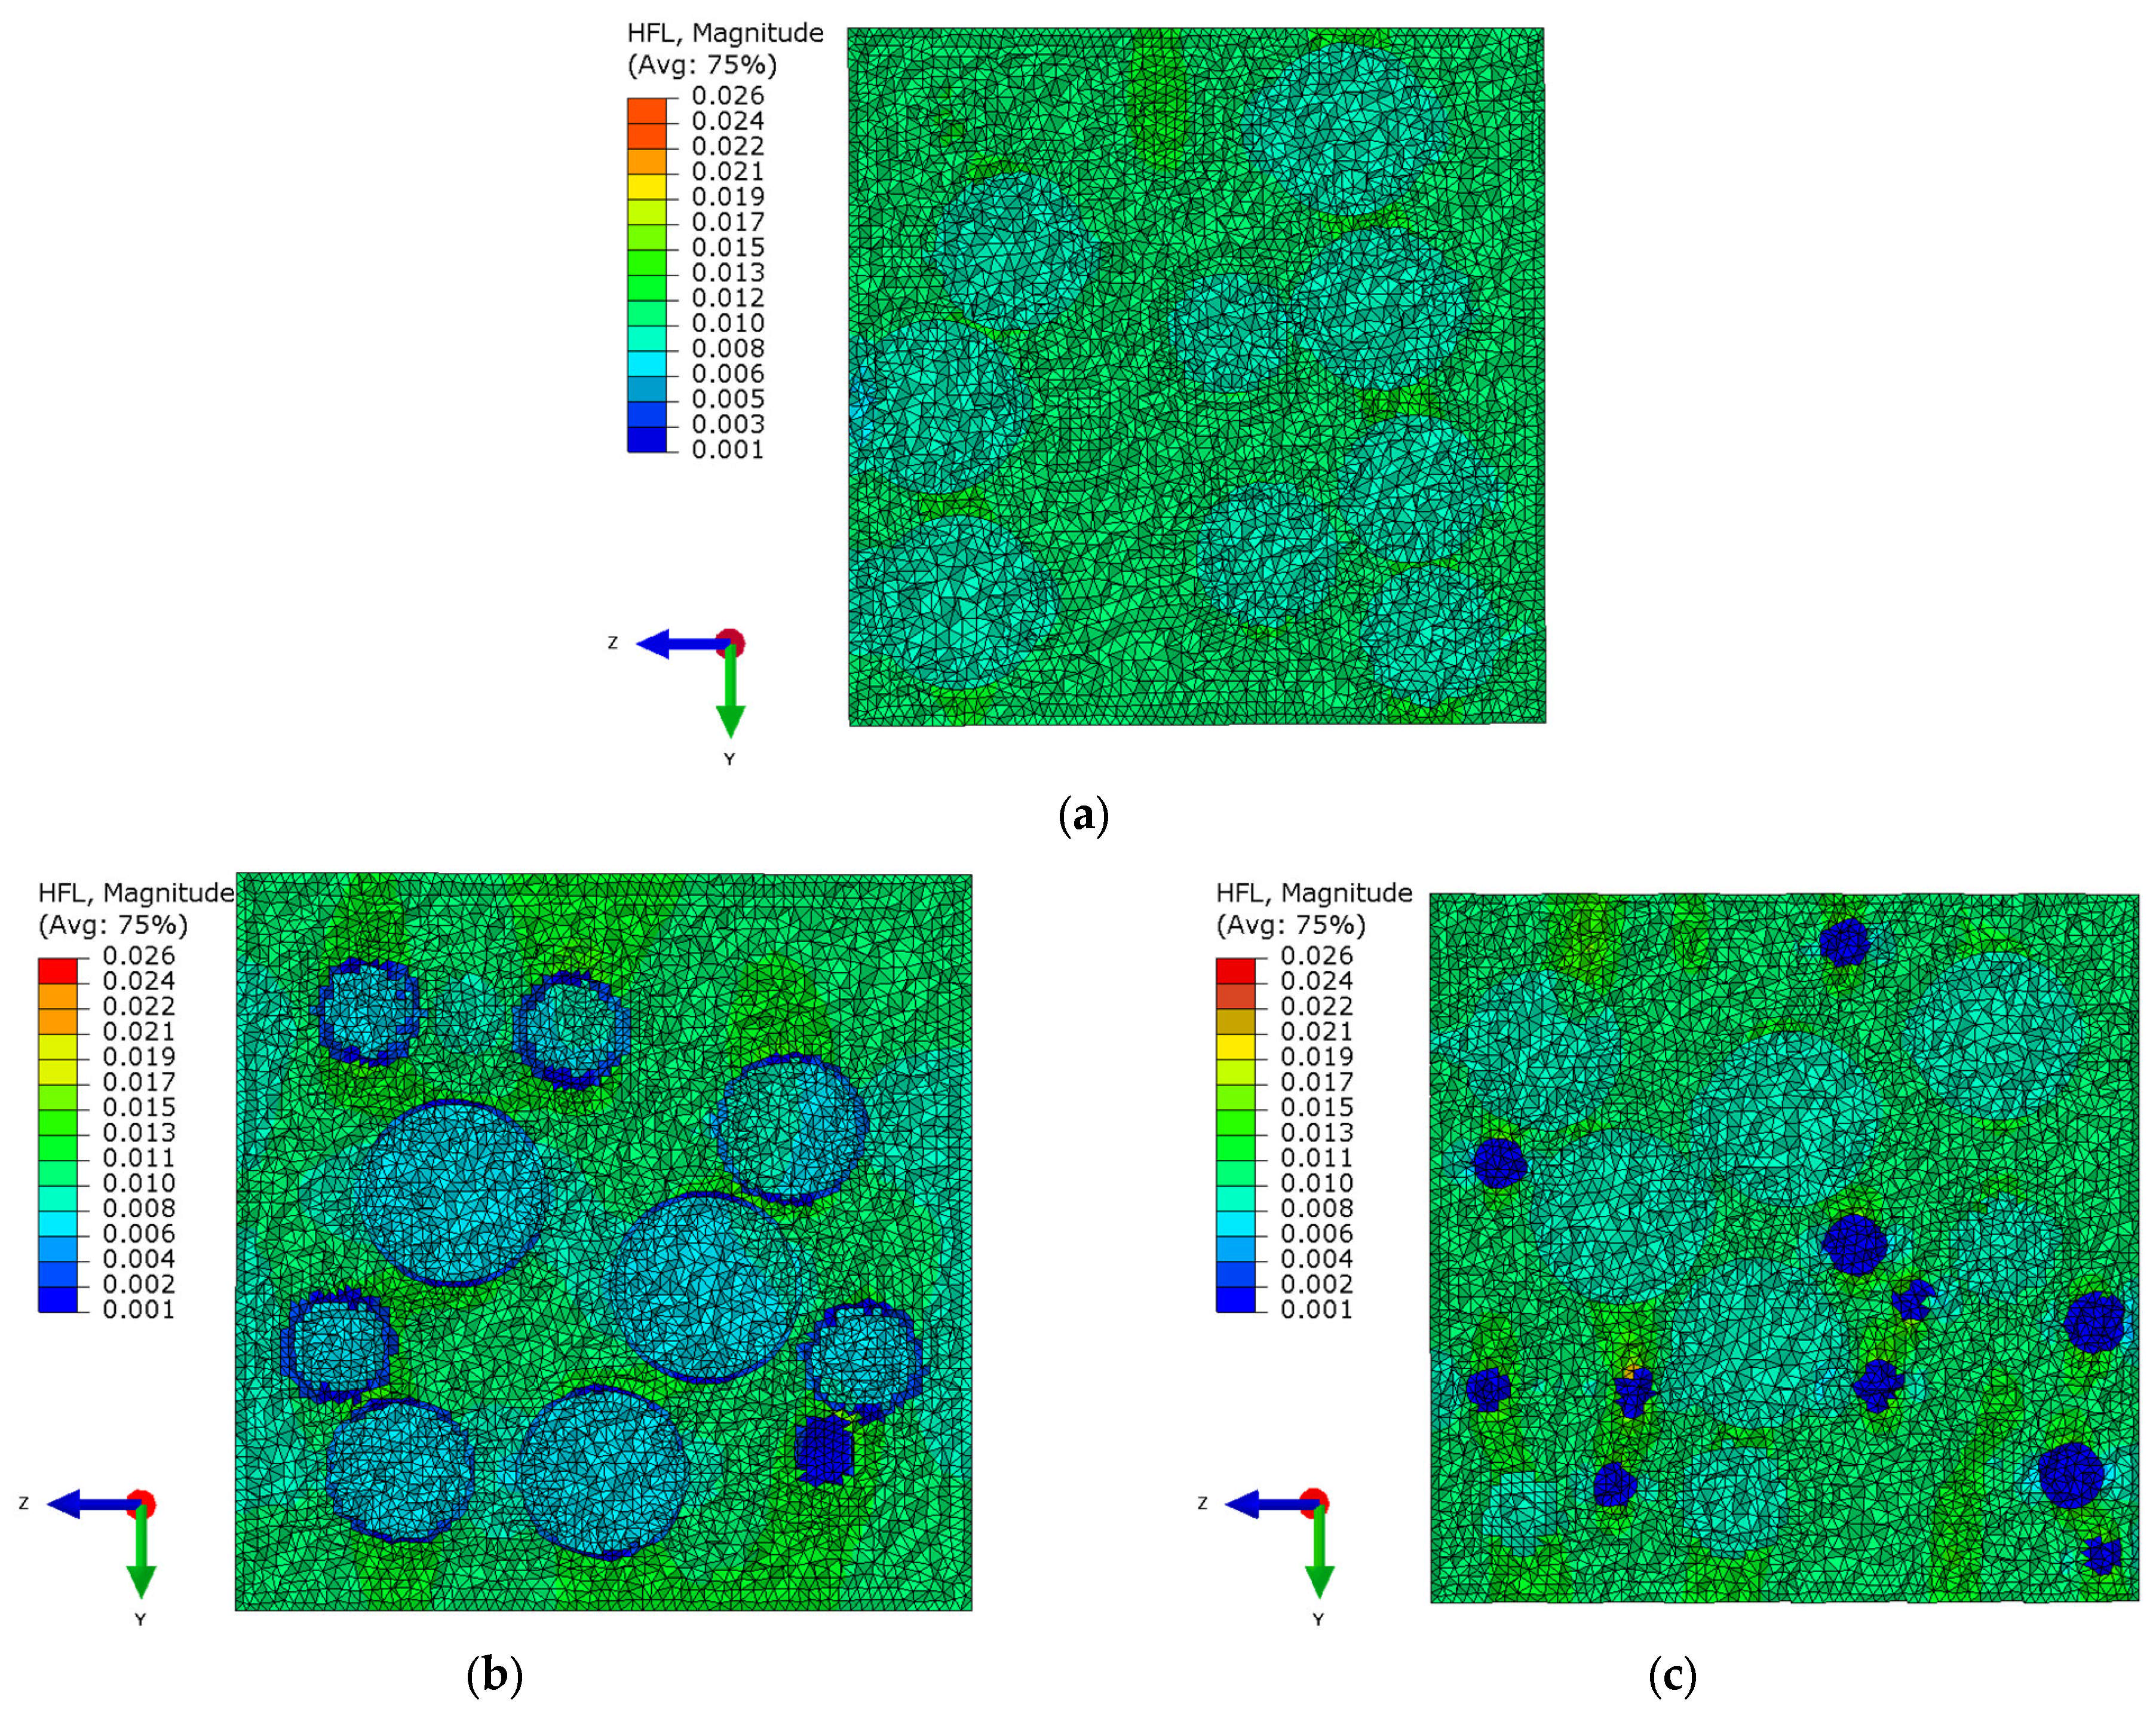
The dark blue regions in Figure 15b,c represent void structures with different morphologies. Compared to Figure 15a, the presence of voids increases the areas of dark green in the corresponding heat flow distribution contour map. This reflects the phenomenon of heat flow by passing and converging in specific areas. Due to the influence of void morphology, the amount of heat flow passing through the microspheres varies. In the RVE model containing interface voids, the microspheres appear darker blue, indicating a smaller amount of heat flow passing through. The reason for this is that interface voids increase thermal resistance along the path to the microspheres, causing more heat flow to bypass the voids and propagate through the resin matrix.
However, notably, as the particle size of the microspheres and their interface voids increases, the path of heat flow becomes longer. At this point, the radial thermal resistance across the interface voids is smaller than the thermal resistance of heat flow passing through the resin matrix. As shown in Figure 15b, with larger microspheres, more heat flow directly passes through the interface voids into the microspheres, which results in lighter colors at both ends of the interface voids along the heat flow’s z-direction. In contrast, for smaller particle sizes, the interface voids at both ends along the y-direction are colored blue, indicating lower bypass thermal resistance and less heat flow passing through the interface voids.
For free voids, as shown in Figure 15c, the particle size also affects the heat flow path. It can be observed that the larger the particle size of the voids, the more saturated the blue areas in the heat profile, which approached the shape of the voids themselves. This is due to the bypassing phenomenon during thermal simulation, where very little heat flow passes radially through the voids. Additionally, since free voids are smaller in size compared to the microspheres, they do not directly affect the thermal conductivity of the microspheres, which occupy a larger volume. Therefore, the impact of free voids on the thermal conductivity of the composite material is smaller than that of interface voids. In other words, for the same void fraction, HGM/ER materials containing only interface voids have better thermal insulation performance.

6. Conclusions

This study validates the accuracy and reliability of the Benveniste equivalent microbead thermal conductivity model in calculating the thermal conductivity of HGM. The RSA algorithm is improved and optimized to achieve high particle packing and uniform distribution in the cell units. Additionally, a classification method for void types is proposed to explore the effects of void fraction and morphology on the thermal properties of HGM/ER materials, providing a detailed interpretation of the internal heat conduction mechanisms from a microscopic perspective. The main conclusions are as follows:
  • Among the equivalent microbead thermal conductivity models, the Benveniste model shows the best agreement with the three-component thermal conductivity model. The maximum relative error occurs at a particle size ratio of 0.91, but it is only 1.32%.
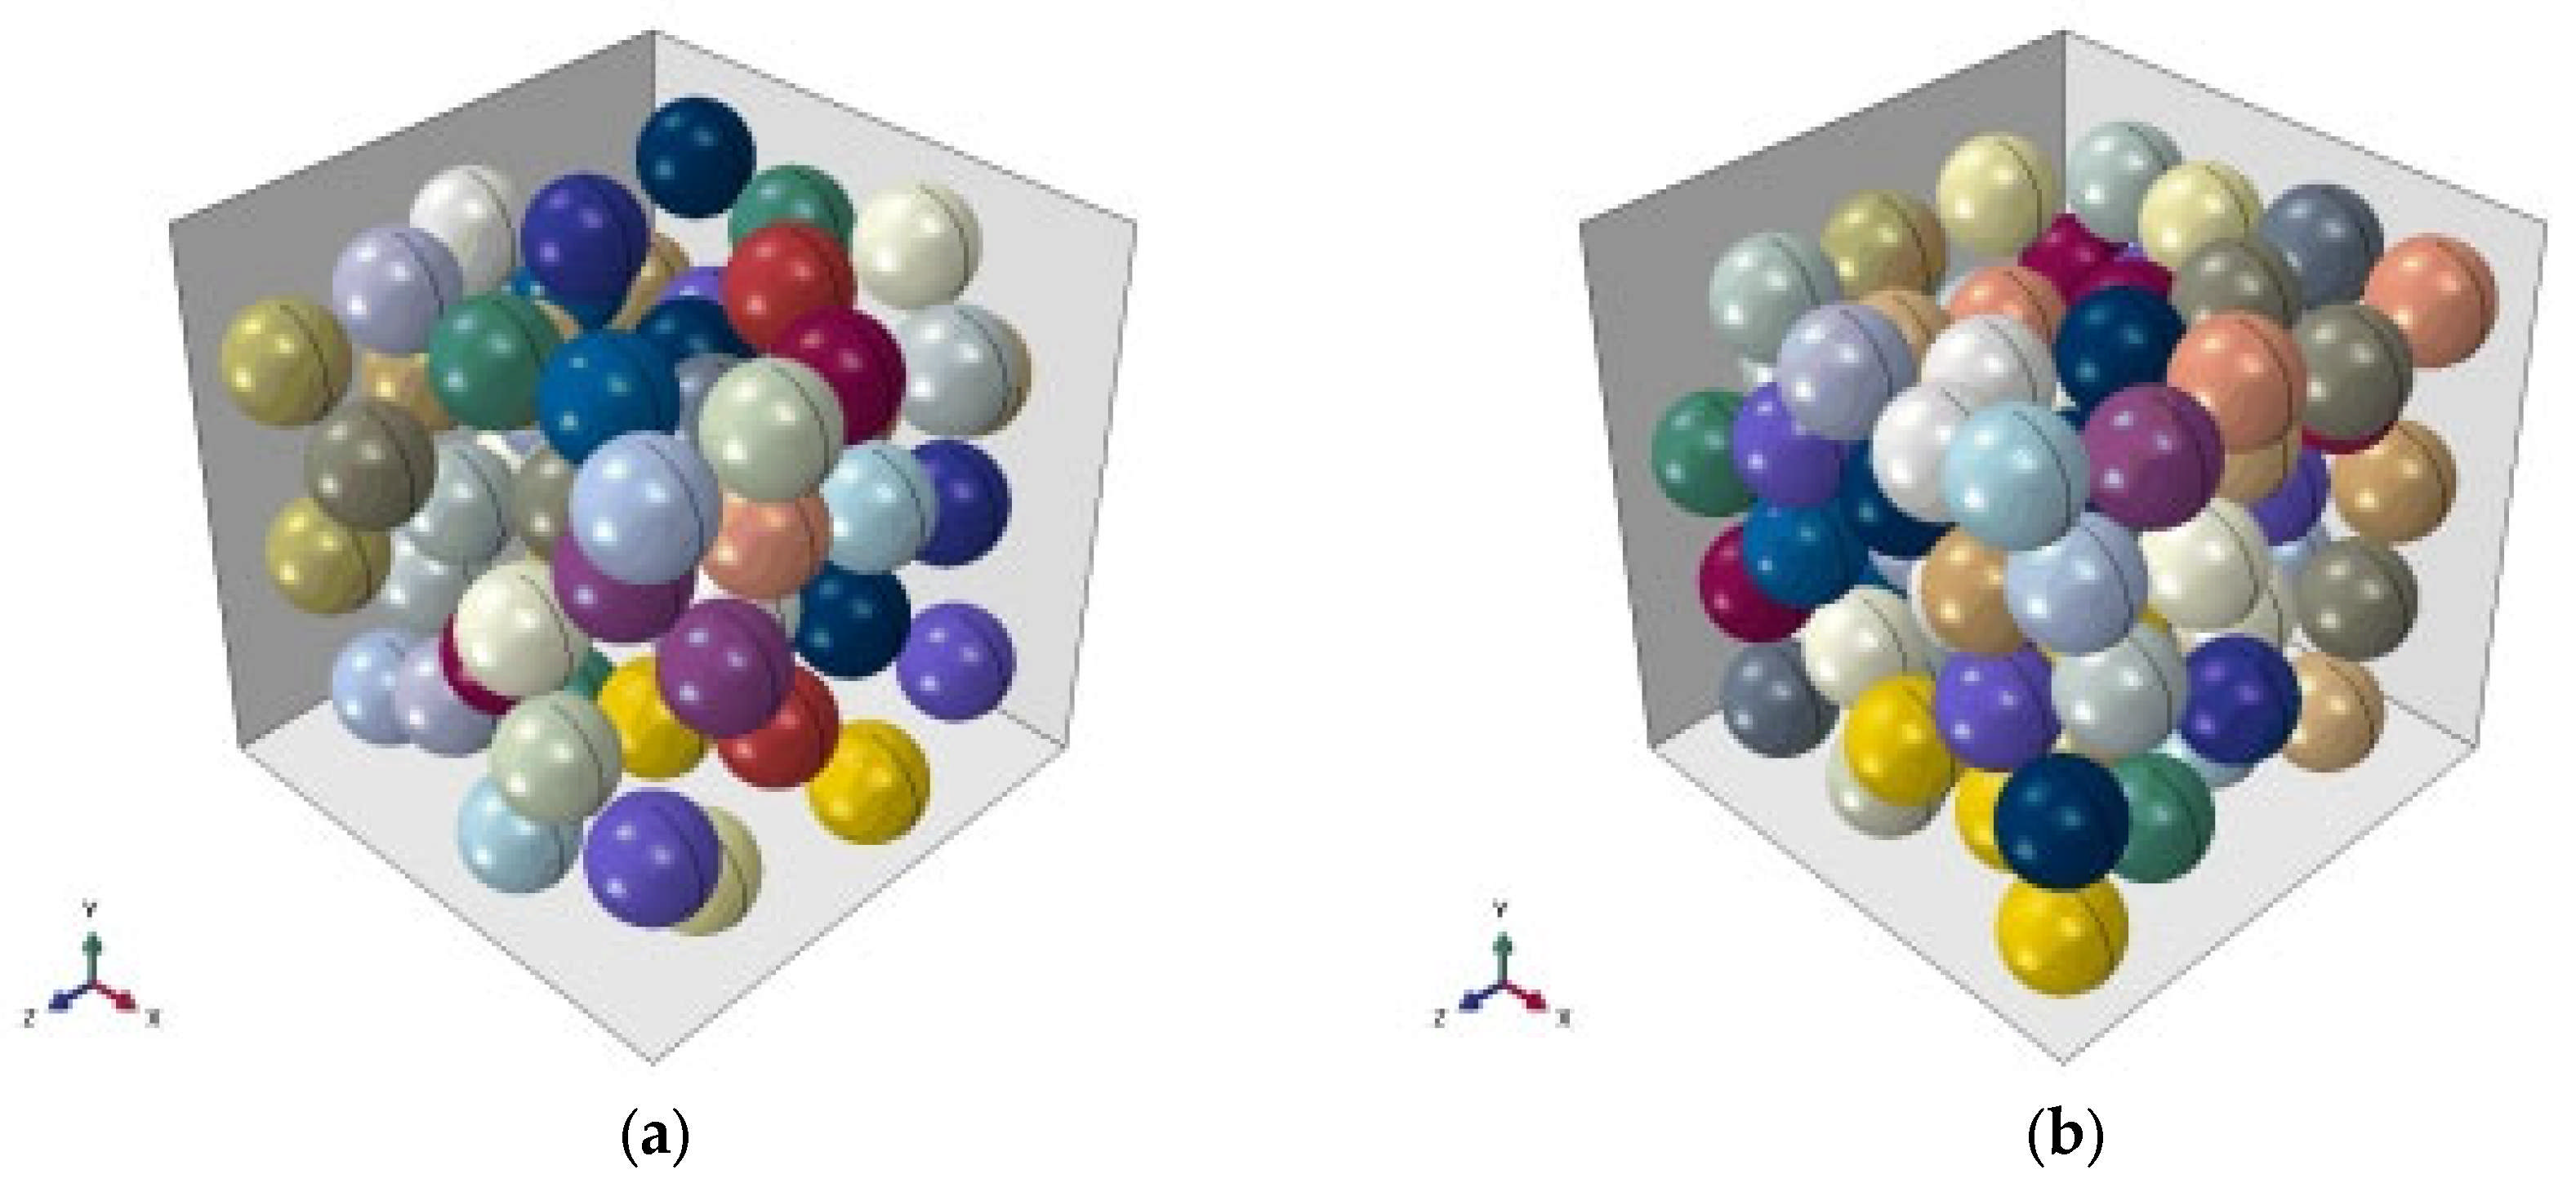
  • The improved and optimized RSA algorithm achieves a higher particle packing density, increasing the upper limit of packing by 25% compared to the traditional RSA algorithm, while also ensuring a more uniform particle distribution.
  • The void types can be classified as interface voids and free voids. The air within the voids causes heat flow bypassing, and the strength of this bypassing phenomenon is influenced by both the void type and particle size. Simplification of the interfacial voids may result in a low prediction of the thermal conductivity.
  • The void fraction is negatively correlated with the thermal conductivity. The effect of interface voids on reducing the thermal conductivity of the material is more significant, being nearly 60% higher compared to free voids of the same volume.
The thermal conductivity of the void-containing HGM/ER materials studied in this paper has an upper limit corresponding to that of materials containing only free voids and a lower limit corresponding to materials with only interface voids. This allows for an estimation of the thermal conductivity of materials with different void fractions, providing important references for the practical application of HGM/ER composites in insulation and thermal insulation fields.

Author Contributions

Conceptualization, Y.D.; methodology and software, Z.D.; validation, H.X.; writing—original draft preparation, Z.M.; writing—review and editing, G.Z. All authors have read and agreed to the published version of the manuscript.

Funding

This research was funded by Liaoning Province Natural Science Foundation project, grant number 2021-MS-109.

Data Availability Statement

The original contributions presented in the study are included in the article; further inquiries can be directed to the corresponding author.

Conflicts of Interest

The study was completed by the Deepwater Engineering Research Center, Dalian University of Technology, and verified jointly with China Construction Fifth Division Installation Engineering Co., Ltd. There are no other conflicts of interest.

Appendix A

RSA optimization in this study aims to enable efficient aggregation of particles and rapid optimization of space by developing an accurate particle movement strategy, which ultimately results in high particle filling and uniform distribution. The detailed flowchart is shown below.
Figure A1. Detailed optimization strategy flowchart.
Energies 18 02073 g0a1
In this study, a threshold value of 1,000,000 is set for the number of failures, and when the number of failures in generating new particles reaches this threshold, the system starts to adjust its strategy and no longer generates new particles randomly, but turns to optimize the position of the generated particles.
The distance-based ranking method is adopted. The specific measures are to calculate the spatial distance between the particle coordinates and the RVE geometric center and then move the particles according to the distance from near to far; the position of the particle closest to the RVE geometric center remains unchanged; the angle between the particle’s moving direction and the direction of the RVE geometric center must be less than 90°; randomly generate several candidate moving vectors for each particle, and select the vector that can achieve the furthest distance. The vector that can achieve the furthest distance is chosen as the final moving direction of the particle, which is mathematically represented as
a i · b i , n > 0 , 0 < n x ,
where  a i  is the unit vector of the ith particle center coordinate point pointing in the direction of the geometric center of the RVE;  b i , n  is the nth random movement vector generated on the ith particle; x is the number of vectors on each particle set by the human.
Using the group of generated vectors, the distance ordering is started and the particles are moved sequentially along the vectors in the corresponding vector group. During the moving process, the following strategy is used: using the particle size d of the particles as the base for the moving distance, a number between 0 and 1 is generated as a random indentation factor s. The actual moving distance of the particle along the retaining wall vectors is obtained by calculating the product of s and the particle size. The coordinates to move to the new position are mathematically expressed as
x i , n = x i , o + b i , n , x · d · s ,
y i , n = y i , o + b i , n , y · d · s ,
z i , n = z i , o + b i , n , z · d · s ,
where  x i , n y i , n , and  z i , n  are the coordinate values on the x, y, and z axes, respectively, of the ith particle moving to the new position;  x i , o y i , o , and  z i , o  are the original coordinates of the ith particle.  b i , n , x b i , n , y , and  b i , n , z  denote the component values of the nth randomly generated movement vector on the x, y, and z axes of the ith particle, respectively.
An adjustment mechanism is introduced: if a particle moves to a new position that crosses or overlaps with other particles that have been successfully transferred, the indentation factor s is reduced to a fixed preset value, and a re-determination is performed until there is no crossing. If the indentation factor s decreases below 0, it is reset to 0, indicating that the particle does not move in that vector direction.
To address the effect of particle movement on uniformity, a two-step strategy is proposed: first, based on the distance of the particles from the center of the RVE, order them from far to near, allow each particle to move a random distance in a random direction, and repeat the step to ensure that the particles are gradually dispersed to each region of the RVE; second, break the original order of the particles, and allow each particle to move a random distance in a random direction to repeat the step to ensure that the particles are uniformly distributed in the entire RVE space.

References

  1. Zhai, G.J.; Ding, Y.; Wang, Y.; Ma, Z. Experimental investigation of the hydrostatic compression of a hollow glass microspheres/epoxy resin under high-pressure conditions at the full ocean depth. Polym. Compos. 2020, 41, 5331–5342. [Google Scholar]
  2. Zhai, G.J.; Wei, Z.H.; Ma, Z.; Ding, Y.; Liu, B.J. Establishment and program development of failure criterion of hollow glass microspheres/epoxy resin composites based on tension/compression discrepancy. Eng. Fail. Anal. 2023, 149, 107270. [Google Scholar] [CrossRef]
  3. Anirudh, S.; Jayalakshmi, C.G.; Anand, A.; Kandasubramanian, B.; Ismail, S.O. Epoxy/hollow glass microsphere syntactic foams for structural and functional application—A review. Eur. Polym. J. 2022, 171, 111163. [Google Scholar]
  4. Ding, Y.; Zhai, G.J.; Ma, Z.; Wei, Z.H.; Li, X. Effect of Water Absorption on the Mechanical Property and Failure Mechanism of Hollow Glass Microspheres Composite Epoxy Resin Solid Buoyancy Materials. China Ocean Eng. 2023, 37, 876–884. [Google Scholar]
  5. Zhai, G.J.; Ding, Y.; Ma, Z.; Wei, Z.H.; Li, X.; Liu, B.J. Novel triaxial experimental investigation on compressive behavior of hollow glass microspheres composites under varied temperature environments. Polym. Test. 2022, 115, 107745. [Google Scholar] [CrossRef]
  6. Wu, X.F.; Gao, Y.; Wang, Y.; Ran, R.H.; Ali, Z.; Yu, J.H.; Yang, K.; Sun, K.; Li, X.F.; Lei, Y.H.; et al. Recent developments on epoxy-based syntactic foams for deep sea exploration. J. Mater. Sci. 2021, 56, 2037–2076. [Google Scholar] [CrossRef]
  7. Hu, F.; Wu, S.; Sun, Y. Hollow-structured materials for thermal insulation. Adv. Mater. 2019, 31, 1801001. [Google Scholar] [CrossRef]
  8. Zhang, Z.Y.; Dai, X.H.; Li, L.; Zhou, S.S.; Xue, W.; Liu, Y.P.; Liu, H.C. Current status of research on the modification of thermal properties of epoxy resin-based syntactic foam insulation materials. Polymers 2021, 13, 3185. [Google Scholar] [CrossRef]
  9. Tong, J.J.; Li, S.M.; Wang, T.Y.; Wang, S.X.; Xu, H.; Yan, S.Y. A study of the influence of fin parameters on porous-medium approximation. Energies 2024, 17, 1133. [Google Scholar] [CrossRef]
  10. Yang, J.P.; Chen, L.; He, Z.Q.; Li, C.; Yu, B.; Wei, Z.J.; Zhao, Z.Y.; Hao, Z.X. High-strength hollow glass microsphere/epoxy resin composite insulation materials for deep in-situ condition preserved coring. Geofluids 2022, 2022, 1118434. [Google Scholar] [CrossRef]
  11. Herrera-ramírez, L.C.; Cano, M.; De-villoria, R.G. Low thermal and high electrical conductivity in hollow glass microspheres covered with carbon nanofiber–polymer composites. Compos. Sci. Technol. 2017, 151, 211–218. [Google Scholar]
  12. Tian, W.L.; Chao, X.J.; Fu, M.W.; Qi, L.H. An advanced method for efficiently generating composite RVEs with specified particle orientation. Compos. Sci. Technol. 2021, 205, 108647. [Google Scholar]
  13. Ramin, R.; Giuseppe, S. Numerical and experimental study of fluid flow and heat transfer in porous media: A review article. Energies 2025, 18, 976. [Google Scholar] [CrossRef]
  14. Cooper, D.W. Random-sequential-packing simulations in three dimensions for spheres. Phys. Rev. A 1988, 38, 522–524. [Google Scholar]
  15. Kari, S.; Berger, H.; Rodriguez-Ramos, R.; Gabbert, U. Computational evaluation of effective material properties of composites reinforced by randomly distributed spherical particles. Compos. Struct. 2007, 77, 223–231. [Google Scholar]
  16. Tian, W.L.; Chao, X.J.; Fu, M.W.; Qi, L.H. An algorithm for generation of RVEs of composites with high particle volume fractions. Compos. Sci. Technol. 2021, 207, 108714. [Google Scholar]
  17. Luo, W. Numerical Simulation of the Thermal Properties of Spheres Filled Epoxy Resin Syntactic Foams. Master’s Thesis, Wuhan University of Technology, Wuhan, China, 2016. [Google Scholar]
  18. Qi, L.H.; Tian, W.L.; Zhou, J.M. Numerical evaluation of effective elastic properties of composites reinforced by spatially randomly distributed short fibers with certain aspect ratio. Compos. Struct. 2015, 131, 843–851. [Google Scholar]
  19. Zhu, Z.W.; Liu, X.; Ma, Y. Study on Mechanical Study on Mechanical Properties of Carbon Fiber Reinforced Polyeth-er Ether Ketone Composites. J. Comput. Theor. Nanosci. 2013, 10, 2920–2925. [Google Scholar]
  20. Lall, P.; Islam, S.; Suhling, J.; Tian, G.Y. Temperature and time-dependent property prediction and validation for nano-underfills using RSA based RVE algorithms. In Proceedings of the 10th Intersociety Conference on Thermal and Thermomechanical Phenomena in Electronic Systems, San Diego, CA, USA, 1 January 2006. [Google Scholar]
  21. Wang, X.D. Preparation and Thermal Insulation Mechanism of Resin-Based Lightweight Insulation Composite Materials. Ph.D. Thesis, Harbin Engineering University, Harbin, China, 2017. [Google Scholar]
  22. Xing, Z.P.; Ke, H.J.; Wang, X.D.; Zheng, T.; Qiao, Y.J.; Chen, K.X.; Zhang, X.H.; Zhang, L.L.; Bai, C.Y.; Li, Z.R. Investigation of the thermal conductivity of resin-based lightweight composites filled with hollow glass microspheres. Polymers 2020, 12, 518. [Google Scholar] [CrossRef]
  23. Paulina, K.; Krzysztof, C.; Aleksandra, B.; Kacper, L.; Radoslaw, Z.; Fabio, R. Voids assessment in geological cores using 3D data. Energies 2023, 16, 1038. [Google Scholar]
  24. Gibson, L.J.; Ashby, M.F. Cellular Solids: Structure & Properties, 2nd ed.; Cambridge University Press: Cambridge, UK, 1997; pp. 283–308. [Google Scholar]
  25. Lin, T.C.; Gupta, N.; Talalayev, A. Thermoanalytical characterization of epoxy matrix-glass microballoon syntactic foams. J. Mater. Sci. 2009, 44, 1520–1527. [Google Scholar] [CrossRef]
  26. Schiffres, S.N.; Kim, K.H.; Hu, L.; Mcgaughey, A.J.H.; Islam, M.F.; Malen, J.A. Gas diffusion, energy transport, and thermal accommodation in single-walled carbon nanotube aerogels. Adv. Funct. Mater. 2012, 22, 5251–5258. [Google Scholar] [CrossRef]
  27. Chen, G. Nanoscale Energy Transport and Conversion: A Parallel Treatment of Electrons, Molecules, Phonons, and Photons, 1st ed.; Oxford University Press: New York, NY, USA, 2005; pp. 123–158. [Google Scholar]
  28. Li, S.N.; Cao, B.Y. Vortex characteristics in Fourier and non-Fourier heat conduction based on heat flux rotation. Int. J. Heat Mass Transf. 2017, 108, 2403–2407. [Google Scholar] [CrossRef]
  29. Park, Y.K.; Kim, J.G.; Lee, J.K. Prediction of thermal conductivity of composites with spherical microballoons. Mater. Trans. 2008, 49, 2781–2785. [Google Scholar] [CrossRef]
  30. Liu, Y.L.; Li, B.; Xu, M.J.; Wang, L.L. Highly efficient composite flame retardants for improving the flame retardancy, thermal stability, smoke suppression, and mechanical properties of EVA. Materials 2020, 13, 1251. [Google Scholar] [CrossRef]
  31. Benveniste, Y.; Miloh, T. On the effective thermal conductivity of coated short-fiber composites. J. Appl. Phys. 1991, 69, 1337–1344. [Google Scholar] [CrossRef]
  32. Tian, W.L.; Fu, M.W.; Qi, L.H.; Chao, X.J.; Liang, J.H. Interphase model for FE prediction of the effective thermal conductivity of the composites with imperfect interfaces. Int. J. Heat Mass Transf. 2019, 145, 118796. [Google Scholar] [CrossRef]
  33. Gupta, N.; Pinisetty, D. A review of thermal conductivity of polymer matrix syntactic foams-effect of hollow particle wall thickness and volume fraction. JOM 2013, 65, 234–245. [Google Scholar] [CrossRef]
  34. Bigg, D. Thermal-conductivity of heterophase polymer compositions. Therm. Electr. Conduct. Polym. Mater. 1995, 119, 1–30. [Google Scholar]
  35. Fiedler, T.; Ochsner, A.; Muthubandara, N.; Belova, I.V.; Murch, G.E. Calculation of the effective thermal conductivity in composites using finite element and monte carlo methods. Mater. Sci. Forum 2007, 553, 51–56. [Google Scholar] [CrossRef]
  36. Liu, L.; Li, X.; Tian, X.L.; Zhang, X.T.; Xu, L.X.; Zhang, X.Z. Numerical investigation on inclined hydraulic transport of large particles for deepsea mining. China Ocean Eng. 2023, 36, 720–733. [Google Scholar]
  37. Notario, B.; Pinto, J.; Solorzano, E.; De-saja, J.A.; Dumon, M.; Rodríguez-Pérez, M.A. Experimental validation of the Knudsen effect in nanocellular polymeric foams. Polymer 2015, 56, 57–67. [Google Scholar] [CrossRef]
  38. Chung, S.L.; Lin, J.S. Thermal conductivity of epoxy resin composites filled with combustion synthesized h-BN particles. Molecules 2016, 21, 670. [Google Scholar] [CrossRef] [PubMed]
Figure 1. Schematic diagram of heat conduction path theory. (a) Thermally conductive filler to form a thermal network. (b) Thermally insulating filler to extend the thermal paths.
Energies 18 02073 g001
Figure 2. Comparison schematic of microbead thermal conductivity models.
Energies 18 02073 g002
Figure 3. Comparison of thermal conductivity modeling results. (a) Comparison of thermal conductivity coefficients for different models. (b) Comparison of results and error plot at a particle size ratio of 0.91.
Energies 18 02073 g003
Figure 4. RSA algorithm optimization flowchart.
Energies 18 02073 g004
Figure 5. Comparison of RSA generation rates. (a) Traditional RSA algorithm RVE. (b) Optimized RSA algorithm RVE.
Energies 18 02073 g005
Figure 6. Schematic diagram of grid division.
Energies 18 02073 g006
Figure 7. Grid sensitivity validation. (a) Number of units in Le/Ls and RVEs. (b) Number of units in Le/Ls and thermal conductivity.
Energies 18 02073 g007
Figure 8. Schematic diagram of RVE boundary conditions.
Energies 18 02073 g008
Figure 9. Equivalent thermal conductivity versus microsphere fill level.
Energies 18 02073 g009
Figure 10. Simplified schematic of HGM/ER material structure.
Energies 18 02073 g010
Figure 11. Schematic diagram of different microbead outer void patterns. (a) Interface voids. (b) Free voids. (c) No voids.
Energies 18 02073 g011
Figure 12. Temperature and heat flow distribution cloud of RVE with 6% interfacial void ratio. (a) RVE temperature distribution cloud. (b) RVE heat flow distribution cloud. (c) Heat flow distribution cloud of free voids. (d) HGM heat flow distribution cloud.
Energies 18 02073 g012
Figure 13. Temperature versus heat flow distribution cloud for RVE with 6% free void ratio. (a) RVE temperature distribution cloud. (b) RVE heat flow distribution cloud. (c) Heat flow distribution cloud of HGM and voids.
Energies 18 02073 g013
Figure 14. Effect of void ratio on thermal conductivity in different void patterns.
Energies 18 02073 g014
Figure 15. Cloud view of heat flow distribution with different void types at 6% void ratio. (a) Heat flow distribution cloud of no voids. (b) Heat flow distribution cloud of interface voids. (c) Heat flow distribution cloud of free voids.
Energies 18 02073 g015
Table 1. Thermal conductivity modeling of hollow glass beads.
ModelFormulas
Park   k H G M = k g 2 1 f k g + 1 + 2 f k a 2 1 + f k g + 1 f k a
Liu   k H G M = k g · 1 f k g / 1 + 0.5 f
Benveniste   k H G M = k g 2 1 f k g + 1 + 2 f k a 2 + f k g + 1 f k a
Table 2. Thermal conductivity at different interfacial voids ratio.
Interface voids ratio3%4%5%6%
Thermal conductivity W/(m·K)0.1970.1930.1880.185
Table 3. Thermal conductivity at different free voids ratio.
Free voids ratio3%4%5%6%
Thermal conductivity W/(m·K)0.2020.1990.1970.194
Disclaimer/Publisher’s Note: The statements, opinions and data contained in all publications are solely those of the individual author(s) and contributor(s) and not of MDPI and/or the editor(s). MDPI and/or the editor(s) disclaim responsibility for any injury to people or property resulting from any ideas, methods, instructions or products referred to in the content.

