Article

The Interregional Embodied Oil Transfer in China: Estimation and Path Structure Decomposition

School of Economics, Xiamen University, Xiamen 361005, China
*
Author to whom correspondence should be addressed.
Energies 2025, 18(8), 2070; https://doi.org/10.3390/en18082070
Submission received: 18 March 2025 / Revised: 10 April 2025 / Accepted: 14 April 2025 / Published: 17 April 2025
(This article belongs to the Section C: Energy Economics and Policy)

Abstract

:
The complexity of China’s interregional oil transfer networks poses challenges for identifying the economic and environmental risks linked to embodied oil flows within the global value chain (GVC) division of the labor framework. This paper employed a multiregional input–output model to quantify the scale of embodied oil transfers across Chinese regions and analyzed the value chain structure of interregional oil channels using an extended value-added decomposition model. The findings reveal key insights: (1) while embodied oil transfer patterns exhibit growing divergence and concentration across industries, provincial-level distributions are gradually moving toward equilibrium; (2) China’s inland regions predominantly depend on embodied oil from the eastern coastal zone; (3) interregional trade plays a pivotal role in embodied oil flows, with most interprovincial transfers occurring through simple national value chains and only a minimal proportion routed via complex national value chains. These insights offer valuable guidance for designing targeted oil-conservation policies and advancing China’s “dual carbon” goals.

1. Introduction

As one of the largest oil consumers in the world, China faces multiple challenges in its economic development. On the one hand, its reliance on foreign oil supplies has increased to 77.63% (Data source: https://www.energyinst.org/statistical-review, accessed on 9 January 2025) due to limited domestic resources, which undoubtedly threatens its energy security. On the other hand, carbon emissions from oil consumption have caused serious environmental pollution, conflicting with China’s ecological civilization policy. In 2022, the carbon emission intensity of China’s oil production reached 45.1 kgCO2e/barrel (Data source: https://www.cup.edu.cn/sba/docs/2024-04/4aedf3eb28a447608fcfbd8702e77f7c.pdf, accessed on 3 February 2025).
To lower the reliance on external oil supplies, improve the management of domestic oil resources and realize the “dual carbon” target, it is crucial to study the interregional transfer of China’s oil. However, focusing only on the direct oil flows is not enough, as the scale of oil transferred implicitly in various goods and services is also substantial [1]; that is, we should also pay attention to the embodied oil, which is the total amount of oil consumed throughout the production process, including direct oil consumption and indirect oil consumed by intermediate inputs [2]. As a major hub in the global oil trade network, China processes a significant portion of embodied oil and resells it as commodities and services [3], thus exacerbating the issue of oil outflows [4]. Therefore, research on the transfer of embodied oil can maximize oil flows in the global value chain and reduce unnecessary outflows.
However, existing research primarily focuses on the overall assessment of energy security or carbon emissions, lacking thorough investigation into interregional oil transfers within China. Such gaps significantly impact the formulation and implementation of related national policies. On the one hand, China’s regions exhibit substantial disparities in natural conditions and resource endowments, resulting in uneven development across the country, which implies huge differences in oil consumption and carbon emissions among the regions. By analyzing embodied oil transfers at the provincial level, we can identify regional differences in oil consumption and allocation, as well as uncover the flow characteristics and key routes of interprovincial oil movement, which is helpful for the formulation of relevant policies. On the other hand, regional interdependencies have intensified, and oil transfer pathways have grown increasingly complex due to China’s recent emphasis on establishing a domestic circulation-driven development paradigm. To foster coordinated regional economic growth and clarify the oil consumption responsibilities each province should uphold, a systematic analysis of embodied oil transfers is essential.
This paper examines China’s interregional embodied oil transfer at the provincial level. Employing the concept of embodied oil and integrating theories from complex networks and extended value-added decomposition, the study addresses two key issues: (1) The overall scale and characteristics of embodied oil transfers across provinces and industries in China. (2) The source composition and structural features of the value chain paths underpinning China’s interregional embodied oil flows.
The original contributions of this paper are threefold. First, it extends the study of embodied oil from the international to the domestic provincial level. By analyzing China’s oil dynamics through a domestic lens, the research deepens the understanding of provincial-level embodied oil transfers, addresses existing research gaps, and clarifies patterns of domestic oil flows. Second, it broadens the application of value-added decomposition models in the embodied oil field, enriching both methodological approaches and theoretical frameworks while offering novel analytical perspectives. Third, by leveraging the latest Chinese multiregional input–output data and energy consumption statistics, the study supplements and refines existing findings in the embodied energy literature.
The remainder of this study is structured as follows. Section 2 reviews existing literature. Section 3 describes the methodology and data sources. Section 4 presents the empirical results, Section 5 discusses key findings, and Section 6 concludes the study and outlines policy implications.

2. Literature Review

2.1. Research on Embodied Oil Flows

In the field of petroleum research, the study of oil flow remains one of the most prominent topics. Over time, research perspectives, methodologies, and theoretical foundations in this domain have continuously expanded and evolved. To better understand the spatial structure and flow dynamics of international oil trade, scholars have increasingly adopted complex network theory, utilizing quantitative tools and network indicators to analyze interactions between elements within the global oil transfer system [5,6,7].
However, constructing a network solely based on direct oil flow is not sufficient to comprehensively reflect the characteristics of international oil flow, because direct energy flow networks often tend to overlook the role of indirect oil, which is transferred along with goods and services during the production and trade processes [1]. Therefore, it is necessary to further expand the scope of petroleum research to the embodied oil transfer network. The term “embodied” was first proposed at a meeting of the Energy Analysis Working Group of the International Federation of Institutes for Advanced Study (IFIAS) in 1974. It was designed to measure the total amount of a certain resource directly and indirectly consumed in the production of a product or service. Later, the concept of embodied energy emerged from the field of systems ecology research [8,9], reflecting the total energy input throughout the product supply chain, and it has characteristics such as comprehensiveness, fluidity, separability, and scalability [10]. Embodied oil is a further refinement of embodied energy, referring to the concept of “embodied” specifically in the field of petroleum study.
Existing research on embodied oil primarily concentrates on three key areas: (1) quantifying embodied oil flows, with studies identifying sectors such as communication equipment and computer manufacturing as major contributors to embodied oil exports [11]; (2) analyzing drivers of embodied oil trade [12,13]; and (3) investigating the production tiers and industrial pathways of these flows [4]. However, limited attention has been paid to the structural characteristics of China’s interprovincial embodied oil transfer networks—a gap this study directly addresses.
Furthermore, diverging from prior work that emphasizes embodied oil outflows within global trade systems [4,14,15], our research adopts a domestic lens, focusing on intra-national embodied oil redistribution. This perspective not only complements existing international analyses but also expands the analytical framework for understanding embodied oil dynamics.

2.2. Application of Input–Output Model in Embodied Energy Research

At present, research on embodied oil mainly adopts the input–output method [3,11,12], including the single-region input–output (SRIO) model, the bilateral trade input–output (BTIO) model, and the multi-region input–output (MRIO) model. However, among them, the single-region input–output model ignores the differences in production technology levels at home and abroad and cannot analyze the impact of intermediate inputs [13]. It also fails to describe spatial heterogeneity in energy connections [14,15]. Additionally, the research object of the bilateral-trade input–output model is limited to only two specific countries or regions. Therefore, most scholars choose to conduct studies based on the multiregion input–output model.
There are four main research methods based on the multiregion input–output model to study embodied energy. The first is the structural path analysis (SPA) method, which analyzes the spatial and inter-industry transfer paths of embodied energy in the supply chain system by constructing a multidimensional framework [16,17]. The second is the decomposition analysis method, which uses index decomposition analysis (IDA) or structural decomposition analysis (SDA) to analyze the driving factors of embodied energy in trade [18,19]. The third is the complex network method, which reveals the structural characteristics of the embodied energy transfer network according to calculated network indicators [20,21,22]. The last is the value-added extended decomposition model, which studies embodied energy problems by the value-added accounting framework [23,24].
Among the four methods mentioned above, structural path analysis and decomposition analysis are better suited to examining the inflows and outflows of embodied energy (and their changes) within a single country or region. However, they are less effective in studying the intricate dynamics of embodied energy flows across industries in multiregional contexts. In contrast, the complex network model enables simultaneous analysis of both the global distribution and local characteristics of interregional embodied energy flows. This approach provides a macro-level perspective, offering insights into the spatial patterns and industrial linkages that shape these flows. Building on this foundation, the value-added trade decomposition model extends the analysis to a micro-level scale. This extension facilitates detailed decomposition and examination of diverse embodied energy types and their transmission pathways, thereby enriching the depth of the research.
However, studies integrating complex network theory to analyze the topological structure of the embodied oil transfer network are scarce: there are only two of them. One used a complex network model to trace the global scale of embodied oil flows [25], and the other constructed an embodied oil trade network to examine the energy risks of it [26].
In our study, we measured the scale of interprovincial transferred embodied oil using a multiregion input–output model. This allows us not only to fill gaps in relevant estimations but also to expand the application scope of the multiregion input–output model. Additionally, regarding the path characteristics of embodied oil transfer among regions in China, existing research mainly applied structural decomposition analysis to break down the scale and variations of transferred embodied oil into several factors from the consumption side [27]. However, there is a significant absence of systematic analysis concerning the supply–demand structure and value-chain path characteristics of embodied oil transfer in China. By employing the value-added extended decomposition model, we can further analyze the sources, supply–demand structure, and attribution characteristics within national value chains.

3. Methodology and Data Sources

3.1. Methodology

The input–output approach, used to examine different economic interdependencies and their effects on the environment or energy consumption, is mostly employed in research on embodied energy. The multiregional input–output model can consistently measure the flow of embodied oil between different regions in China because it considers the spatial heterogeneity and variations in production technology levels across these regions. In order to determine the entrance and outflow of embodied oil in different parts of China, this research employed the multiregional input–output model.
Value-added trade allows each country to focus on certain manufacturing phases to boost productivity and reduce costs by segmenting the production process of goods or services into discrete segments. The value-added trade accounting approach can be applied to the embodied energy area to conduct a comprehensive analysis and investigation of the various types of embodied energy and their transfer paths. This study initially determined the scale of embodied oil flow throughout Chinese provinces before using scale measurement data from a multiregional input–output model to better examine the flow path structure that depicts the oil flows.

3.1.1. Measurement of Interregional Embodied Oil Transfer Scale in China

The multiregion input–output model can clearly reflect the transfer of added value, energy, and environmental factors embodied in trade [13], and fully take into account the differences of production technology levels and spatial heterogeneity in different regions of China [15]. Therefore, the interprovincial embodied oil scale in China is measured by the multiregion input–output model.
To illustrate how the multiregion input–output model works, we could suppose there is a country with G regions and N industries in each region. All of the products and services produced by each industry are used for intermediate input and final consumption R i , S i . Z i j s r refers to the intermediate input of the i industry in the region s used by the j industry in the region r; y i s r refers to the final consumption of the i industry in the region s used by the region r; x i s refers to the total output of industry i in region s, and V a i s refers to the total added value of industry i in region s.
According to the Leontief input–output formula, a country’s economic balance can be expressed as:
X = A X + Y
After rearranging terms in Equation (1), we have:
X = ( I A ) 1 Y = B Y
where X s r = x 11 s r x 1 N s r x N 1 s r x N N s r ; A s r = a 11 s r a 1 N s r a N 1 s r a N N s r ; Y s r = y 11 s r y N 1 s r .
A is the direct consumption coefficient matrix of intermediate products, a i j s r = z i j s r / x j s ; and B = ( I A ) 1 is the inverse Leontief coefficient matrix.
Now, we introduce the direct oil consumption coefficient matrix F,
F = F 1 F G ;   F s = f 1 s f N s ;   f i s = o i s x i s   i = 1 ,   2 ,   ,   N ,
where o i s refers to the direct oil consumption of industry i in region s.
Then, the total amount of oil consumption in each region can be expressed as:
E O = F ^ ( I A ) 1 Y ^
where e o i j s r are factors of the matrix EO, referring to the embodied oil scale, which is transferred from industry i in region s to industry j in region r. On this basis, the scale of embodied oil transfer in China can be calculated from the provincial level and industry level respectively.
(1) Estimation of interprovincial transferred embodied oil scale
The amount of embodied oil transferred from region s to region r can be expressed as:
k s r = i = 1 N   j = 1 N   e o i j s r
The total output and total input of embodied oil in region s are:
k o u t s = r s G   k s r
k i n s = r s G   k r s
(2) Estimation of interindustrial transferred embodied oil scale
The amount of embodied oil transferred from industry i to industry j can be expressed as:
k i j = s = 1 G   r = 1 G   e o i j s r
The total output and total input of embodied oil in industry i are:
k i o u t = j i N   k i j
k i i n = j i N   k j i
Accurately measuring the extent of interregional transferred embodied oil in China is a crucial first step before exploring the current state of the network. In order to understand the flow trend of oil resources nationwide and how this flow is influenced by factors like geographic location, economic development level, and industrial structure, this research first uses the input–output model to quantify the embodied oil transfer volume of 30 provinces in 28 industries in China, calculating the total embodied oil consumption scale of each province and the embodied oil consumption scale of interregional transfer. Based on measuring the scale characteristics of embodied oil transfers between various provinces and industries, we then examine the geographical distribution characteristics of embodied oil transfers in China and investigate the interdepartmental distribution of embodied oil transfers among these provinces.

3.1.2. Structural Decomposition of Interregional Transferred Embodied Oil Path

The traditional multiregional input–output model can only measure the consumption and transfer of embodied oil between different industries in various regions at the overall level, while the value-added accounting framework based on the multiregional input–output model can decompose all intermediate goods trade flows at various levels according to their origin and final absorption destination, and eliminate duplicate measurement items included in a country’s total exports [28]. In order to investigate the relationship between the economies of China and the Asia-Pacific region, Pan and Li [29] have developed an expanded decomposition model of value-added trade based on the general trade accounting framework of KWW [30] and WWZ [31]. This model was then utilized by Ran et al. [32] to investigate China’s regional embodied carbon emissions. Therefore, in order to further analyze the structure of embodied oil transferred between different regions in China, this paper chooses to establish a decomposition model of embodied oil in China’s interregional trade based on the model mentioned proposed by Ran et al. [32]. Moreover, grounded in the research results of the overall scale of embodied oil transfers in the interval, this paper introduces the value-added extended decomposition model and draws on the classification model of value-added benefits in regional interactions proposed by Pan and Li [29] to first decompose the embodied oil transfer paths of each province from the source. Then, on the basis of this preliminary decomposition result and referring to the export trade classification standard [33], the transferred embodied oil will be further classified in accordance with the different value chain paths it follows, in order to clarify the oil consumption and transfer characteristics behind interprovincial trade in China under various domestic value chain models.
According to the Leontief input–output formula, the total trade value from region s to region r can be shown as E s r :
E s r = A s r X r + Y s r
Then, the total exports from region s to other regions can be shown as E s * :
E s * = r s   E s r + E s , r o w
where E s , r o w means the total exports of region s to foreign countries.
Combining (10) and (11), we can obtain the expression of the total exports from region s:
X s = r = 1 G   A s r X r + Y s r + E s , r o w
By further deriving Equation (12), we have:
X s = r = 1 G   B s r k = 1 G   Y r k + E r , r o w
Combining (10), (11), (12) and (13), the intermediate products flowing from area s to area r can be divided into the following four parts according to where it is finally consumed:
A s r X = A s r k s G   B r k l s G   Y k l 1 + A s r k = 1 G   B r k Y k s 2 + A s r B r s k s G   Y s k 3 + A s r k = 1 G   B r k E k , r o w 4
In the above formula, part (1) denotes the final products used for production and consumption outside region s; part (2) represents the intermediate products that flow out to other areas in the form of intermediates, and are finally used to produce the final products consumed in region r; part (3) refers to the intermediate products returned to area s later, which are finally used to produce the final products consumed in other areas; and part (4) means that these intermediates after being further processed in region r flow to other regions to produce final products for consumption overseas.
According to X r = A r r X r + Y r r + E r * , we obtain:
A s r X r = A s r L r r Y r + A s r L r E r *
where L r r = ( I A r r ) 1 is the Leontief inverse matrix.
Combined with the method of constructing the added value multiplier in Ran et al. [32], the embodied oil consumption in each region can be divided into oil consumption embodied in domestic products and in imported products. Now, V r is defined as direct oil consumption matrix in domestic products, and M r is defined as the oil consumption matrix in import products.
We assume that the shares of imports in the intermediate inputs of all industries are the same:
M r = I M r X r + E X r I M r O r
V r = O r M r
Then, the embodied oil multiplier can be constructed as:
s = 1 G   V s + M s B s r = u ,   r = 1 ,   2 ,   G
where u is a vector filled with ones.
By defining # as symbols of dot multiplication between matrices, we can obtain the expression of the total embodied oil from region s to region r according to Formulas (10), (11) and (18):
E O s r = u T E s r = ( s = 1 G   V s B s r + s = 1 G   M s B s r ) T ( A s r X r + Y s r ) = ( s = 1 G   V s B s r ) T ( A s r X r + Y s r ) + ( s = 1 G   M s B s r ) T ( A s r X r + Y s r )
E O V s r and E O M s r are used to represent the first and second term of the right parts in the above formula.
Then, E O V s r can be divided into nine parts according to the flow paths of the embodied oil:
E O ν s r = ( V s B s s ) T 1 Y s r + ( V s L s s ) 2 ( A s r k s G   B r k l s G   Y k l ) + ( V s L s s ) T 3 ( A s r k = 1 G   B r k Y k s ) + ( V s L s s ) T 4 ( A s r B r s k s G   Y s k ) + ( V s B s s V s L s s ) T s ( A s r X r ) + ( V s L s s ) T 6 ( A s r k = 1 G   B r k E k , r o w ) + k s G   V k B k s T γ Y s r + k s G   V k B k s T 8 ( A s r L r r Y r r ) + k s G   V k B k s T 9 ( A s r L r r E r * )
The meanings of V1V9 are shown in Table 1.
Similarly, we can obtain:
E O M s r = ( M s B s s ) T 1 Y s r + ( M s L s s ) 2 ( A s r k s G   B r k l s G   Y k l ) + ( M s L s s ) T 3 ( A s r k = 1 G   B r k Y k s ) + ( M s L s s ) T 4 ( A s r B r s k s G   Y s k ) + ( M s B s s M s L s s ) T s ( A s r X r ) + ( M s L s s ) T 6 ( A s r k = 1 G   B r k E k , r o w ) + k s G   M k B k s T γ Y s r + k s G   M k B k s T 8 ( A s r L r r Y r r ) + k s G   M k B k s T 9 ( A s r L r r E r * )
Then, E O s * can be further decomposed:
E O s * = r s G   E V s r + E M s r + E V s , r o w + E M s , r o w
where E O V s , r o w represents the oil consumption from China embodied in the export of regions s to overseas, and E O M s , r o w represents the oil consumption from imports embodied in the export of region s to overseas.
E O V s , r o w = ( V s B s s ) T 10 E s , r o w + r s G   V r B r s 11 E s , r o w
E O M s , r o w = ( M s B s s ) T 10 E s , r o w + r s G   M r B r s 11 E s , r o w
where V 10 is the oil consumption from region s itself, and V 11 is the oil consumption from other regions in China; M 10 and M 11 represent oil consumption from imports.
(1) Decompositions of sources
Table 2 illustrates how the 22 decomposition terms can be separated into 4 categories based on their sources.
(2) The supply-demand structure
In accordance with the value-added index method used by Pan and Li [29], 30 Chinese provinces are separated into eight regions. The supply–demand structure of the regional transferred embodied oil in China is examined using two indicators: the percentage of OVA (embodied oil from other regions in China) and the geographical distribution ratio of embodied oil supply.
The percentage of OVA (embodied oil from other regions in China) indicates the proportion of embodied oil from other regions in the total flowing out of this region, reflecting the dependence of this region on the embodied oil demand from other regions:
The   percentage   of   O V A = O V A s E O V s × 100 %
The geographical distribution ratio of embodied oil (expressed by VD) means the distribution ratio of embodied oil from region s (IVA) flowing from one region among other regions:
V D s r = I V A s r r s I V A s r × 100 %
(3) Value chain decomposition
Referring to Wang et al. [33], we further categorize the V1V11 terms that flow out of each province based on the value chain paths, as shown in Table 3, in order to examine the flow features of interregional transferred embodied oil under the value chain trade mode.

3.2. Data Sources

The data used in this analysis came from the Province Energy Inventory and the China Multiregional Input–Output Table, which were made available to the public via carbon emission accounting and datasets (CEADs). While the China Multiregional Input–Output Table has input–output data for 56 sectors in 31 Chinese provinces in 2012, 2015, and 2017, the Province Energy Inventory covers all forms of energy consumption statistics only for 30 Chinese provinces annually. Furthermore, the input–output table has been recreated without the Tibet-related data because the Province Energy Inventory does not contain Tibet’s energy consumption statistics. The 42 industries in the input–output table and the 48 industries in the energy emission list are then combined to form 28 unified industries; the precise industry classification is shown in Table 4. In addition, the term “oil” used in this study refers to oil in a broad sense, including liquefied petroleum gas, refinery gas, diesel oil, kerosene, crude oil, gasoline, and other petroleum products listed in the Province Energy Inventory.

4. Main Results

4.1. Estimation of Interregional Transferred Embodied Oil Scale in China

We estimate the scale of embodied oil transfers at both provincial level and industrial level, which gives us a general idea of the domestic embodied oil flowing patterns. Furthermore, by investigating the changing trends of the flows of embodied oil between provinces and sectors, we can gain insight into the current state of economic development in our country.

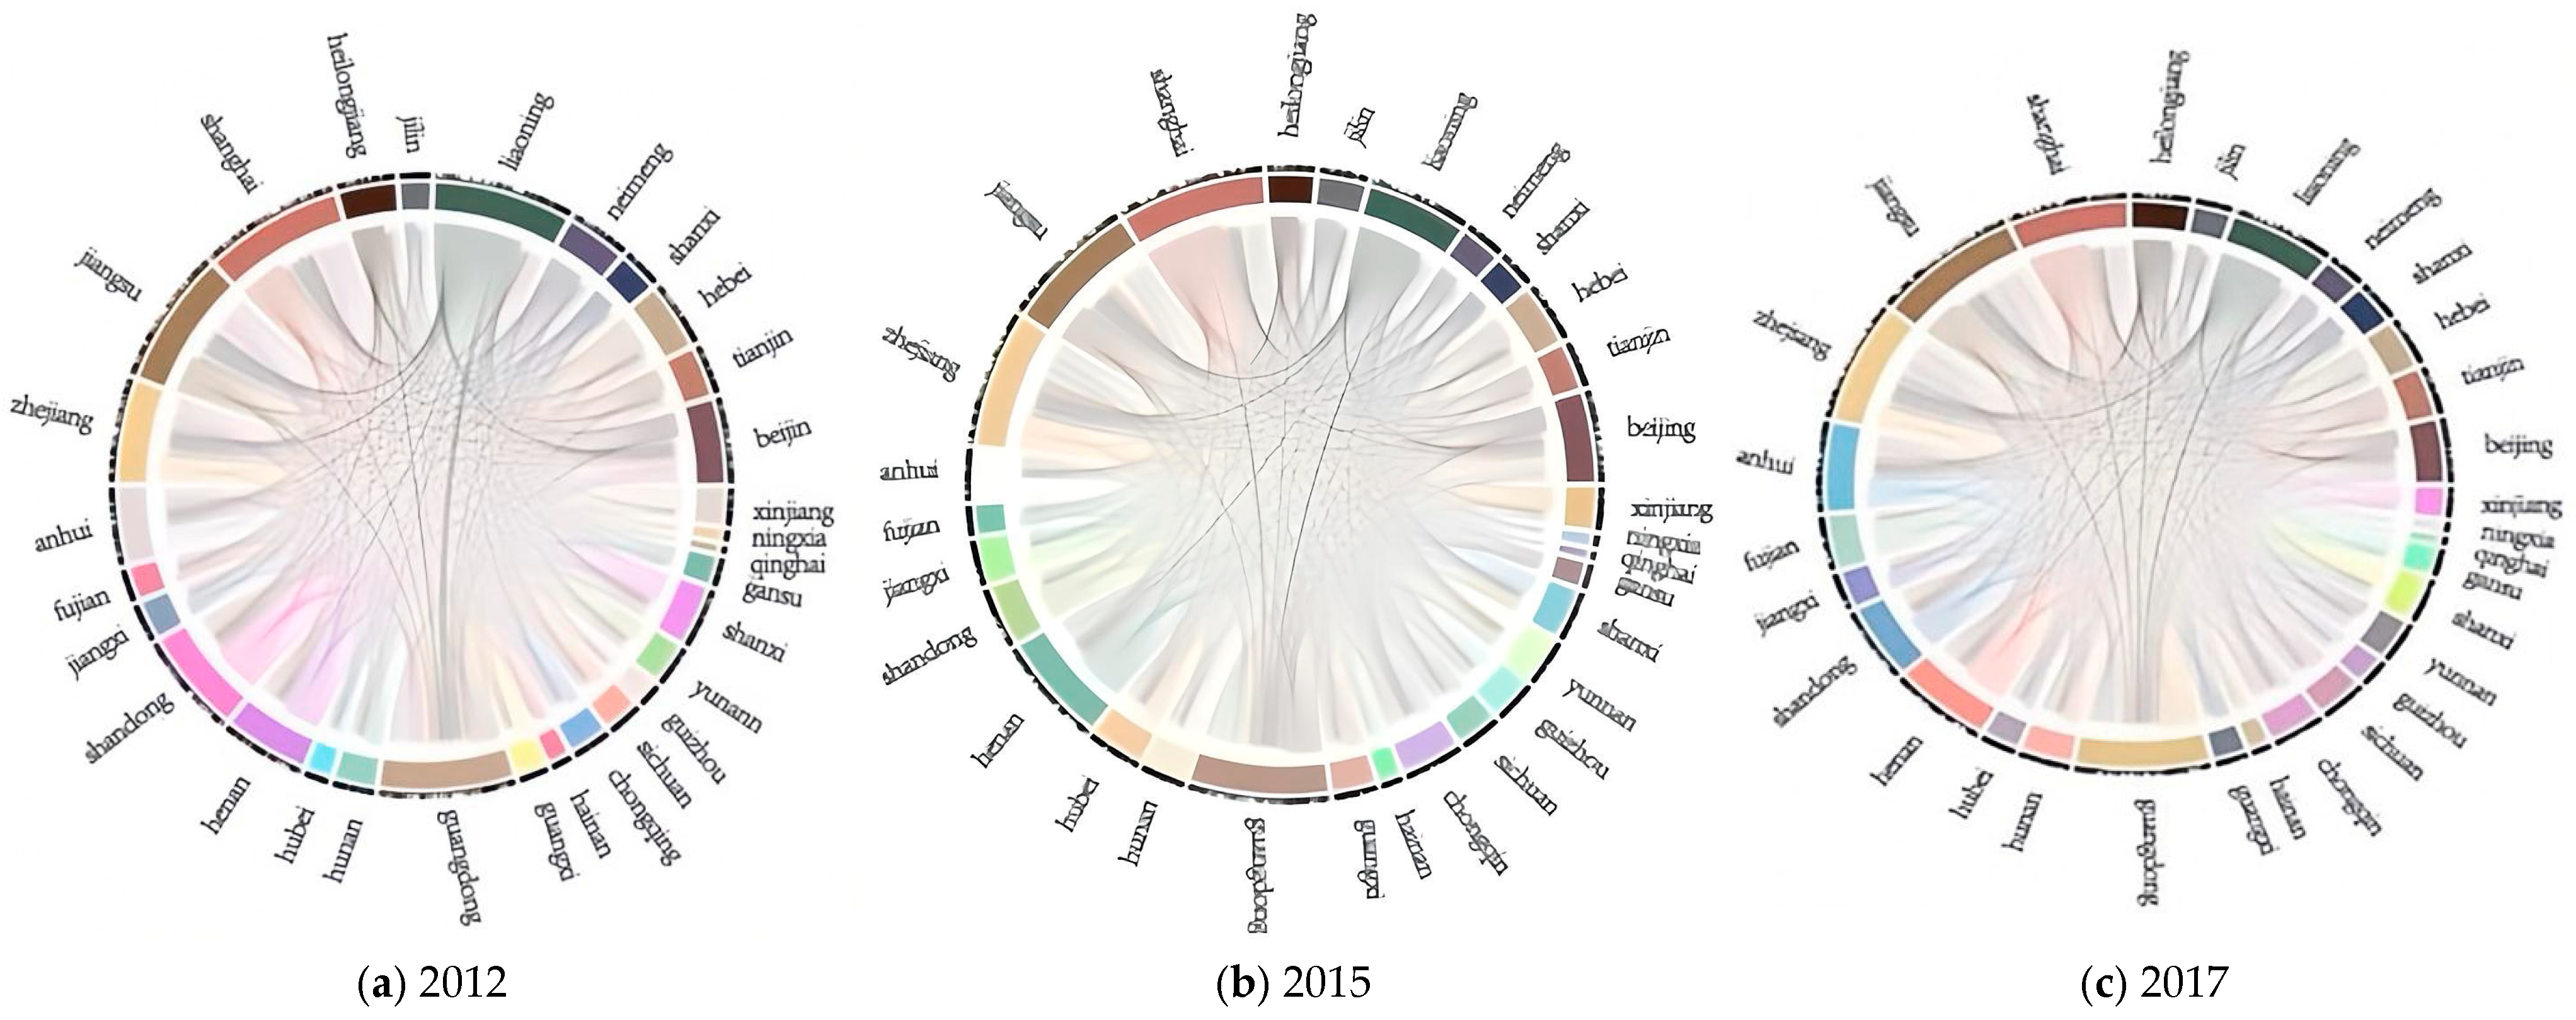
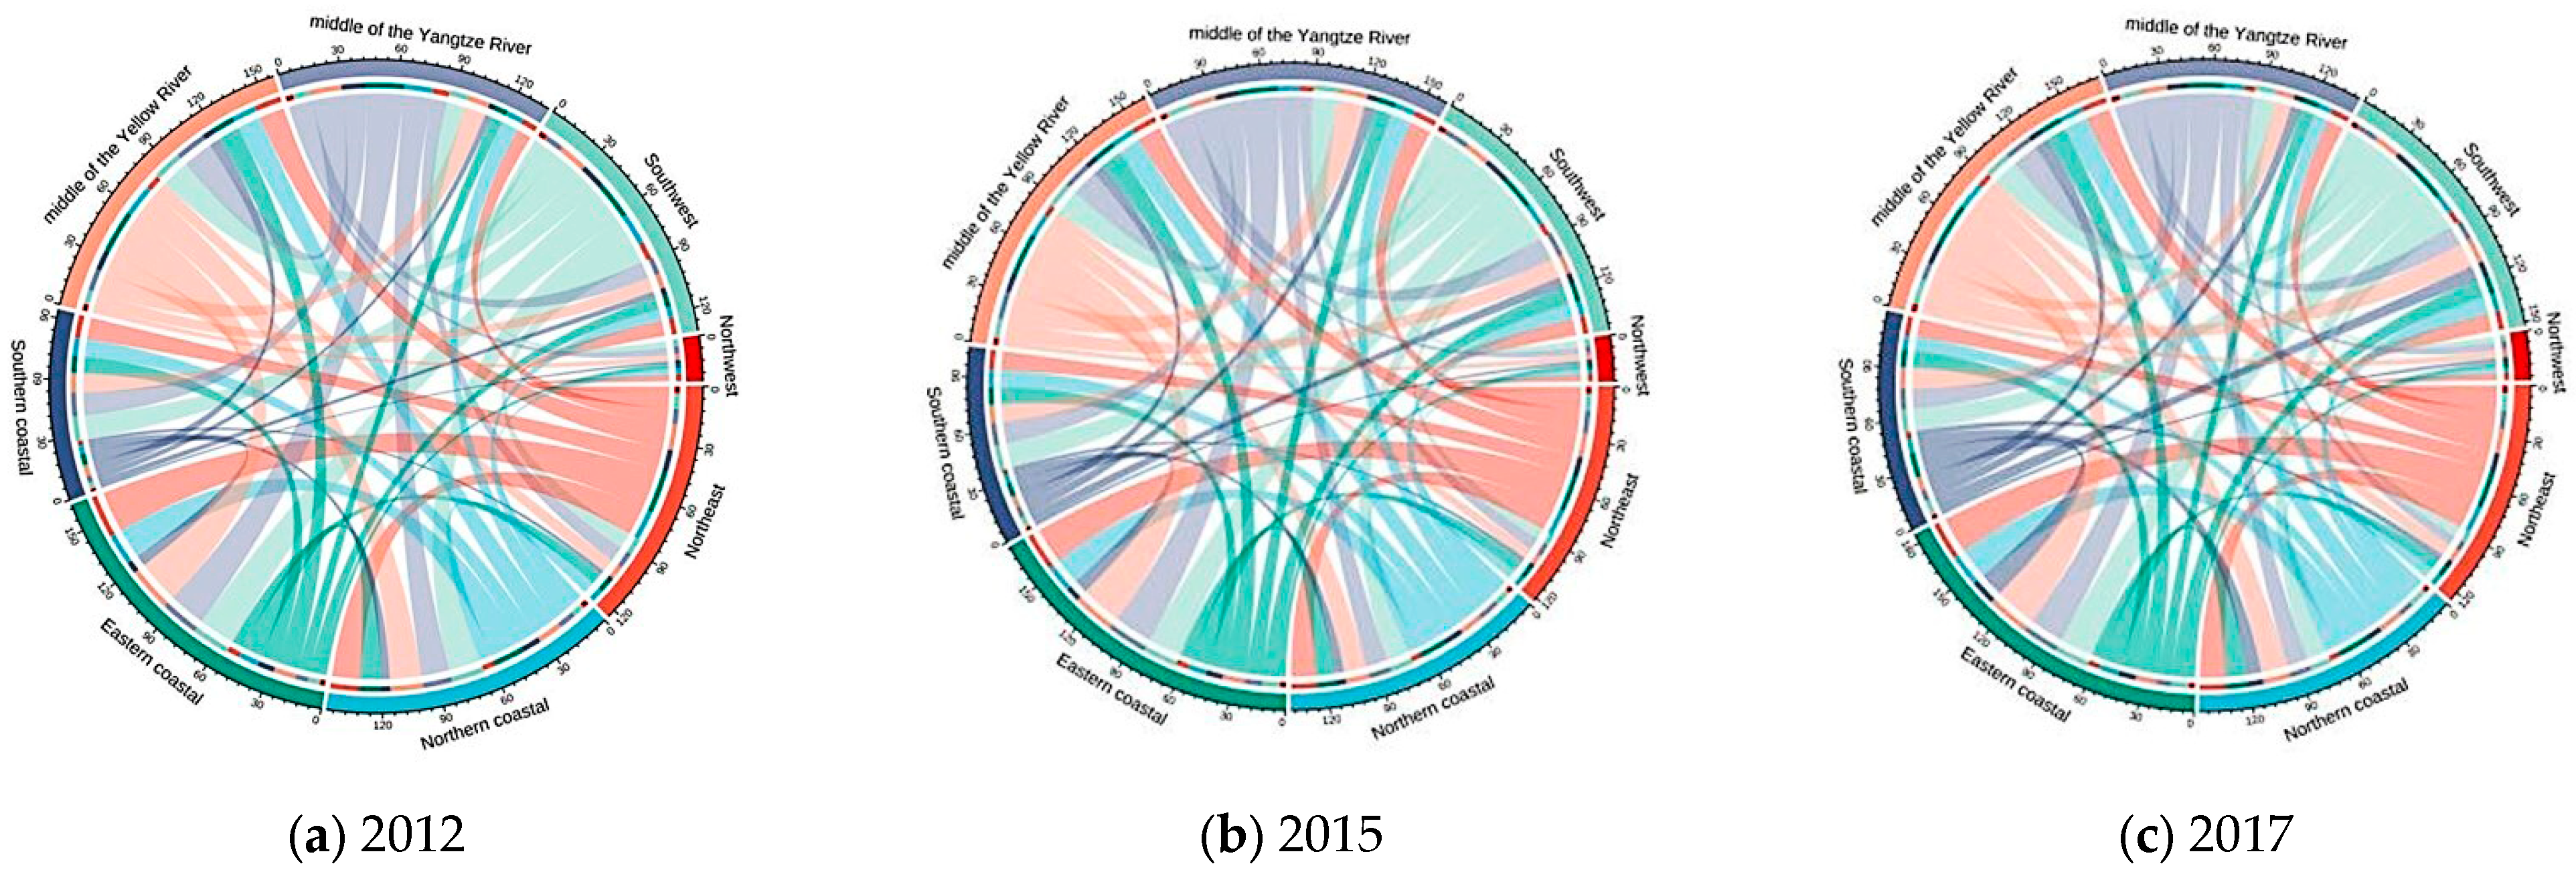
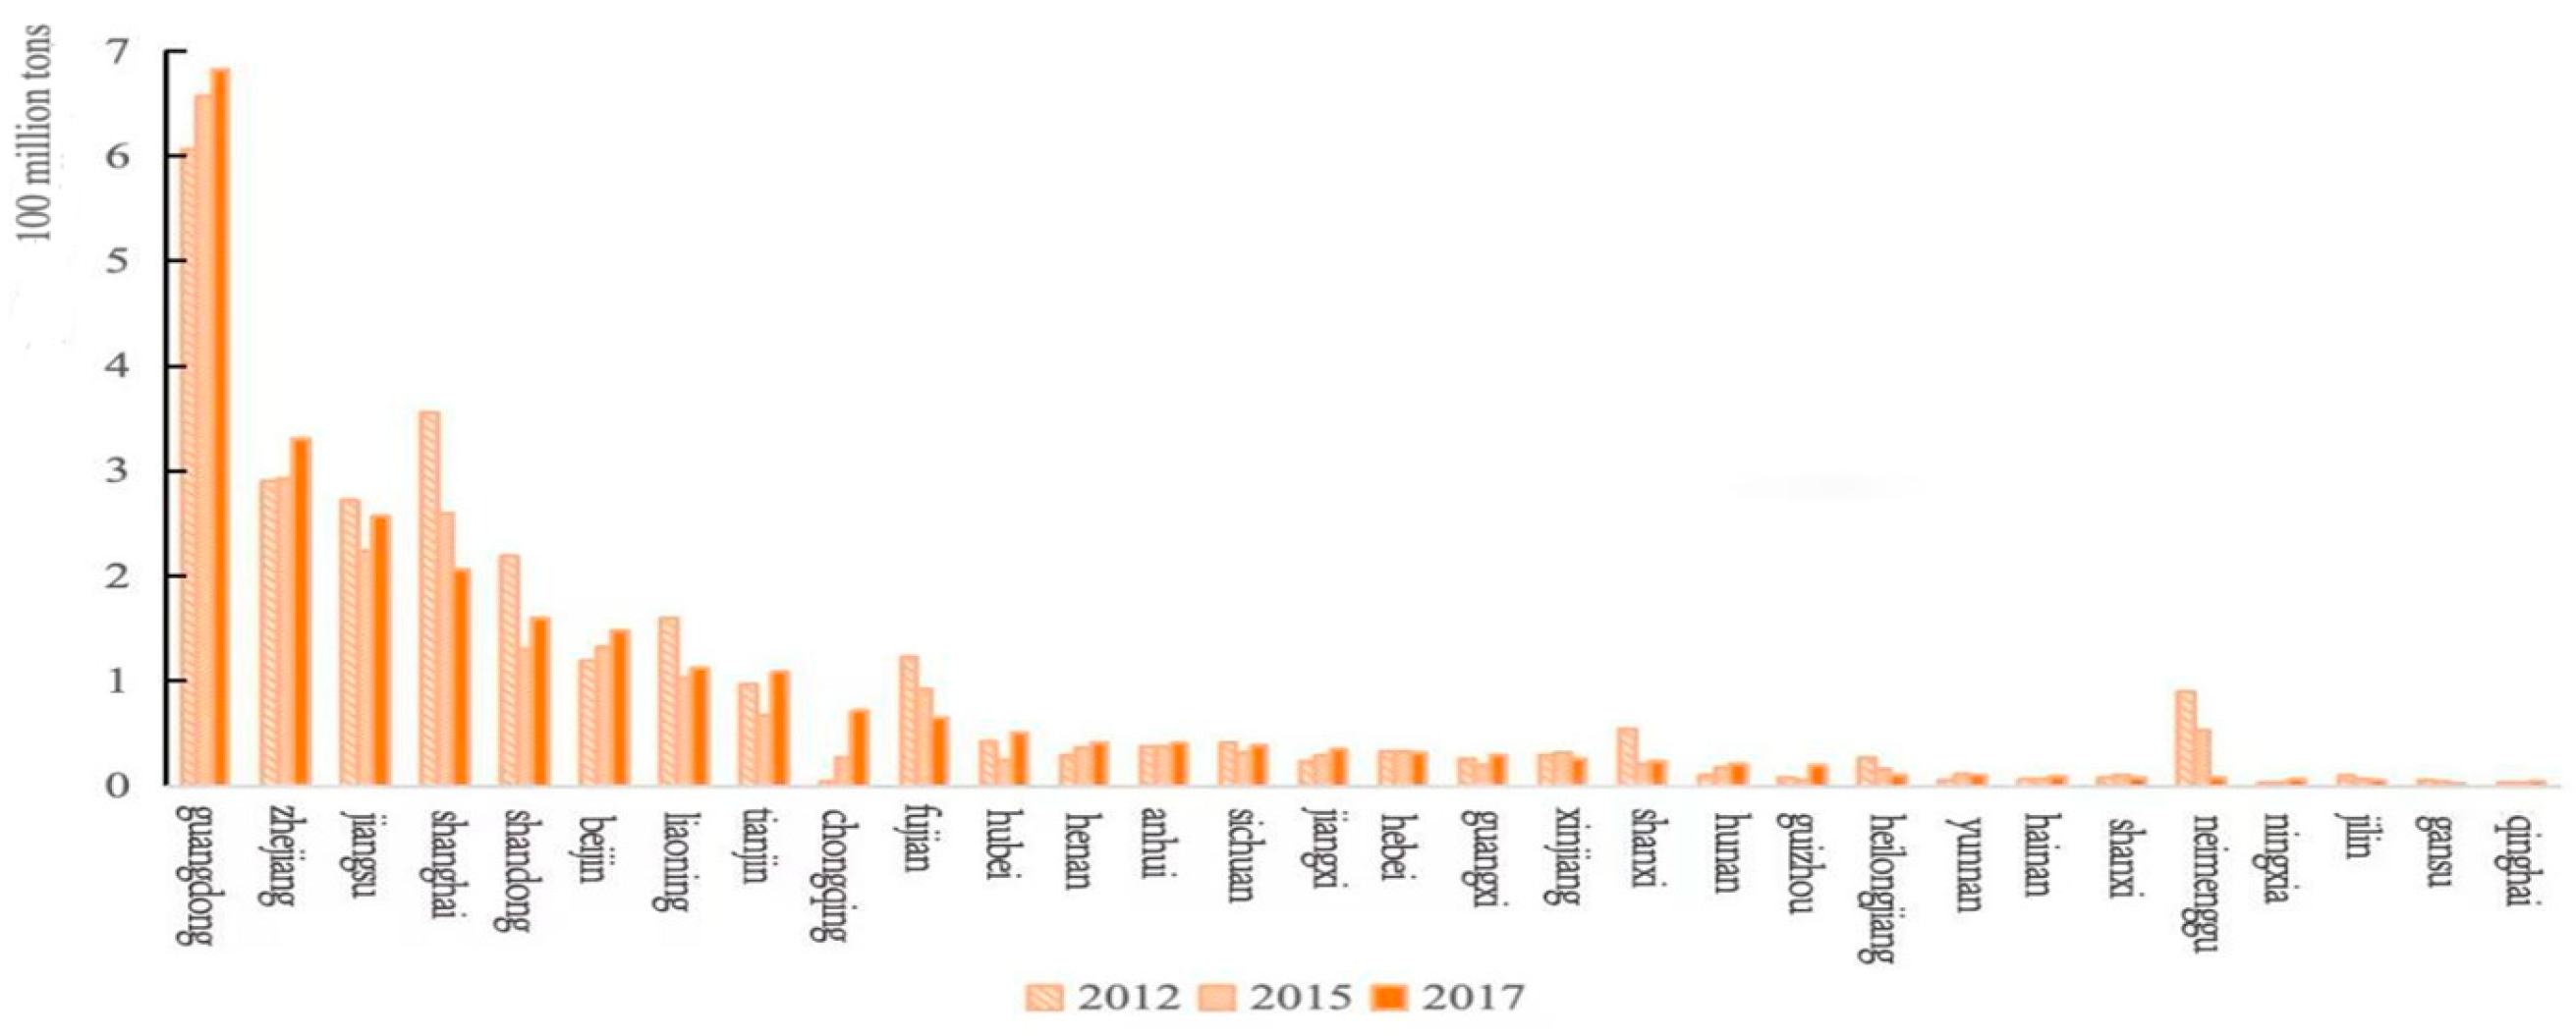
4.1.1. Interprovincial Transferred Embodied Oil

The scale of interprovincial embodied oil transfers in China generally exhibits a pattern of being higher in the east and lower in the west, as well as higher in the north and lower in the south, which can be seen from Figure 1. Specifically speaking, the amounts of embodied oil transferred among coastal regions are averagely higher, particularly between provinces in the eastern coastal areas such as Shanghai, Jiangsu, and Zhejiang, and in the southern coastal regions like Guangdong. In contrast, in the northwestern cities like Gansu, Qinghai, Ningxia, and Xinjiang, the embodied oil flowing content is relatively lower. This pattern shows that there is a discernible relationship between the size of interprovincial transfers and each province’s degree of economic development.
In the dynamics of embodied oil supply and demand, every province has a distinct role to play. For example, with outflows continuously above 12 million tons between 2012 and 2017, Liaoning has been a major supplier of embodied oil in China. However, in 2017, only four of the ten biggest interprovincial integrated oil transport routes had Liaoning as their principal origin and this figure in 2012 was eight, indicating a significant decrease in Liaoning’s ability to provide embodied oil in comparison with 2012. As opposed to Liaoning, Guangdong, as the destination of three out of the top ten transfer routes, has consistently been an important recipient of embodied oil. With an embodied oil outflow of 8.01 million tons and an inflow of more than 10 million tons in 2017, Guangdong is a major contributor to oil pollution and a principal driver of China’s economic growth.
Additionally, the supply and demand roles of certain provinces have shifted between 2012 and 2017. For instance, Shanghai and Fujian transitioned from net recipients to net exporters of embodied oil, while Sichuan, Shaanxi, and Ningxia moved from being net exporters to net recipients. In general, fewer provinces have a net outflow of embodied oil, and the amounts of net oil inflow or outflow in provinces such as Guangdong and Liaoning have decreased. This pattern suggests that China’s interprovincial embodied oil transfers are becoming more equitable and that interprovincial interactions are becoming stronger.

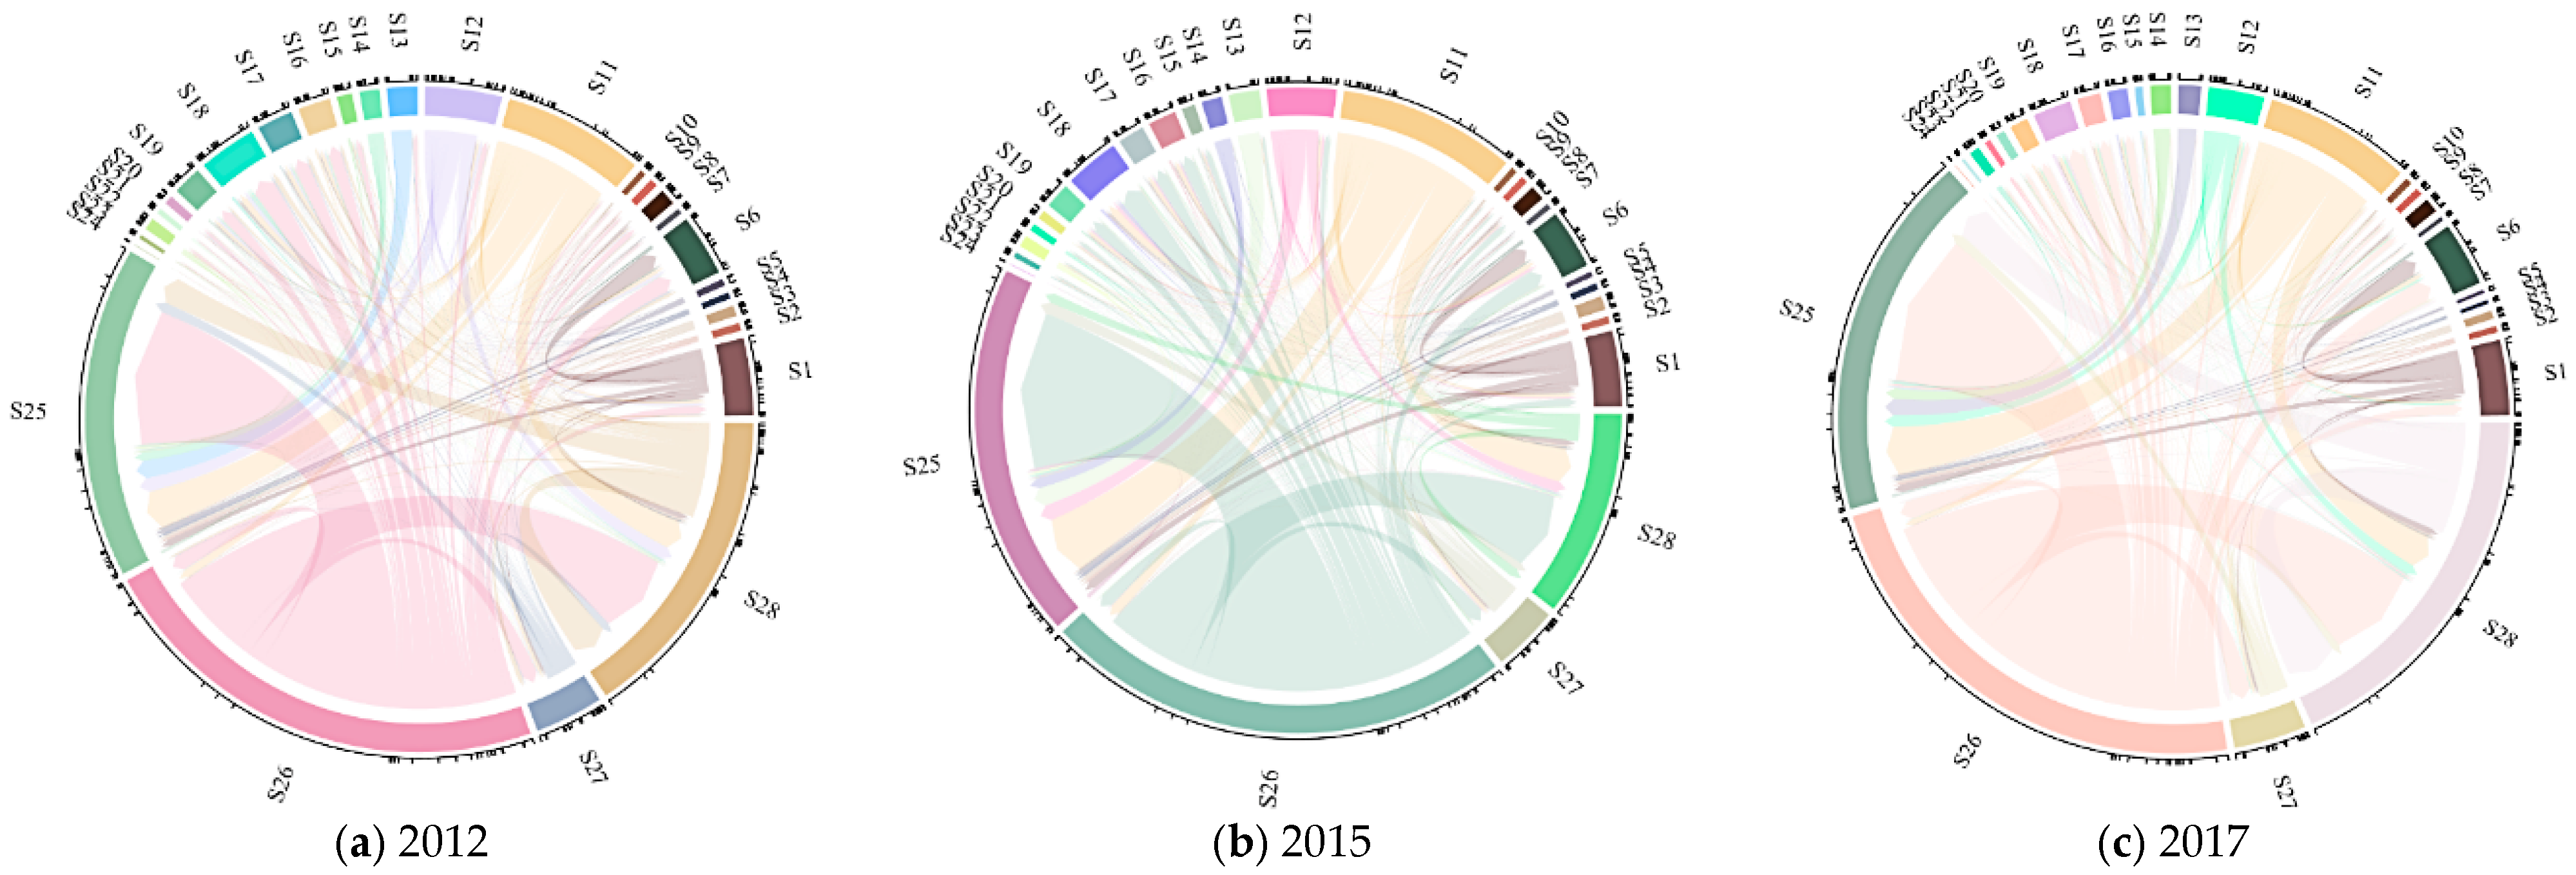
4.1.2. Interindustrial Transferred Embodied Oil

The extent and routes of the transportation of refined oil products between Chinese businesses in 2012, 2015, and 2017 are shown in Figure 2. The differences in the magnitude of embodied oil transfers between various sectors are the main focus of our investigation. Unlike the trend towards equilibrium in the interprovincial embodied oil transfer pattern, the pattern at sectoral level is relatively concentrated and exhibits a tendency towards further divergence. As illustrated in the figure, the transportation, storage, and postal services sector (S26), the petroleum, coking, and nuclear fuel processing industry (S11), along with other service sectors (S28), serve as the primary sources of embodied oil. Conversely, the construction industry (S25), the food and tobacco processing sector (S6), and a range of service industries (S26, S27, S28) are the principal destinations.

4.2. The Path Structure of Interregional Transferred Embodied Oil in China

In the years 2012, 2015, and 2017, the proportion of embodied oil transferred via the top ten intersectoral transfer pathways accounted respectively for 45%, 48%, and 54% of the total transfers, which indicates that the transferring of embodied oil among sectors is increasingly concentrated within certain specific industries. In 2017, the construction sector (S25) absorbed 39% of the total embodied oil inflows across all industries, while the transportation, warehousing, and postal services sector (S26) contributed to 48% of the total outflows from all businesses.
In summary, at the provincial level, China’s overall embodied oil transfer scale demonstrates a distinct geographical pattern of being higher in the eastern and northern regions and lower in the western and southern regions. According to studies, the supply and demand structure for embodied oil is gradually shifting away from impoverished provinces unidirectionally supplying other regions and towards developed provinces supplying each other. In contrast to the relatively balanced distribution observed at the provincial level, the pattern of embodied oil transfers among industries is more concentrated and tends to further distinguish.
The above analyses have demonstrated that interprovincial embodied oil transfers are becoming more equitable, while the pattern among industries is becoming more concentrated. Nevertheless, we are not only concerned with the distribution of the scale of embodied oil flows among provinces and sectors, but also interested in the pathways through which embodied oil transfers.

4.2.1. The Structure of Sources

According to the research, there are three primary sources of embodied oil transported across provinces in China: oil imported from overseas, oil sourced from other domestic provinces, and oil produced within the province itself. The structures of sources of interprovincial transferred embodied oil in 2012, 2015, and 2017 are shown in Figure 3, where IVA represents embodied oil from region s, OVA represents embodied oil from other regions in China (excluding region s), RWC represents embodied oil originating from countries and regions outside of China, and PDC represents repeated calculation items. On average, approximately 5% of the oil transferred out of a province originates from foreign sources, while the majority (around 77%) comes from within the province itself. The remaining 18% is sourced from neighboring provinces. Notably, in 2017, there were six provinces with more than 80% of their oil coming from within the province itself: Qinghai, Gansu, Sichuan, Hubei, Shanxi, and Shandong. These provinces demonstrated a high level of self-sufficiency in their usage of oil for both production and commerce. In contrast, provinces such as Beijing, Jiangsu, Zhejiang, and Chongqing source about 30% of their embodied oil from other provinces, which is a comparatively high proportion. This is attributed to their advanced economies, complex industrial structures, and great demand for oil consumption, which fosters strong economic and oil-related ties with other regions. Meanwhile, Liaoning, Heilongjiang, and Fujian provinces have a higher dependence on foreign-sourced embodied oil, making them more susceptible to the global oil market.

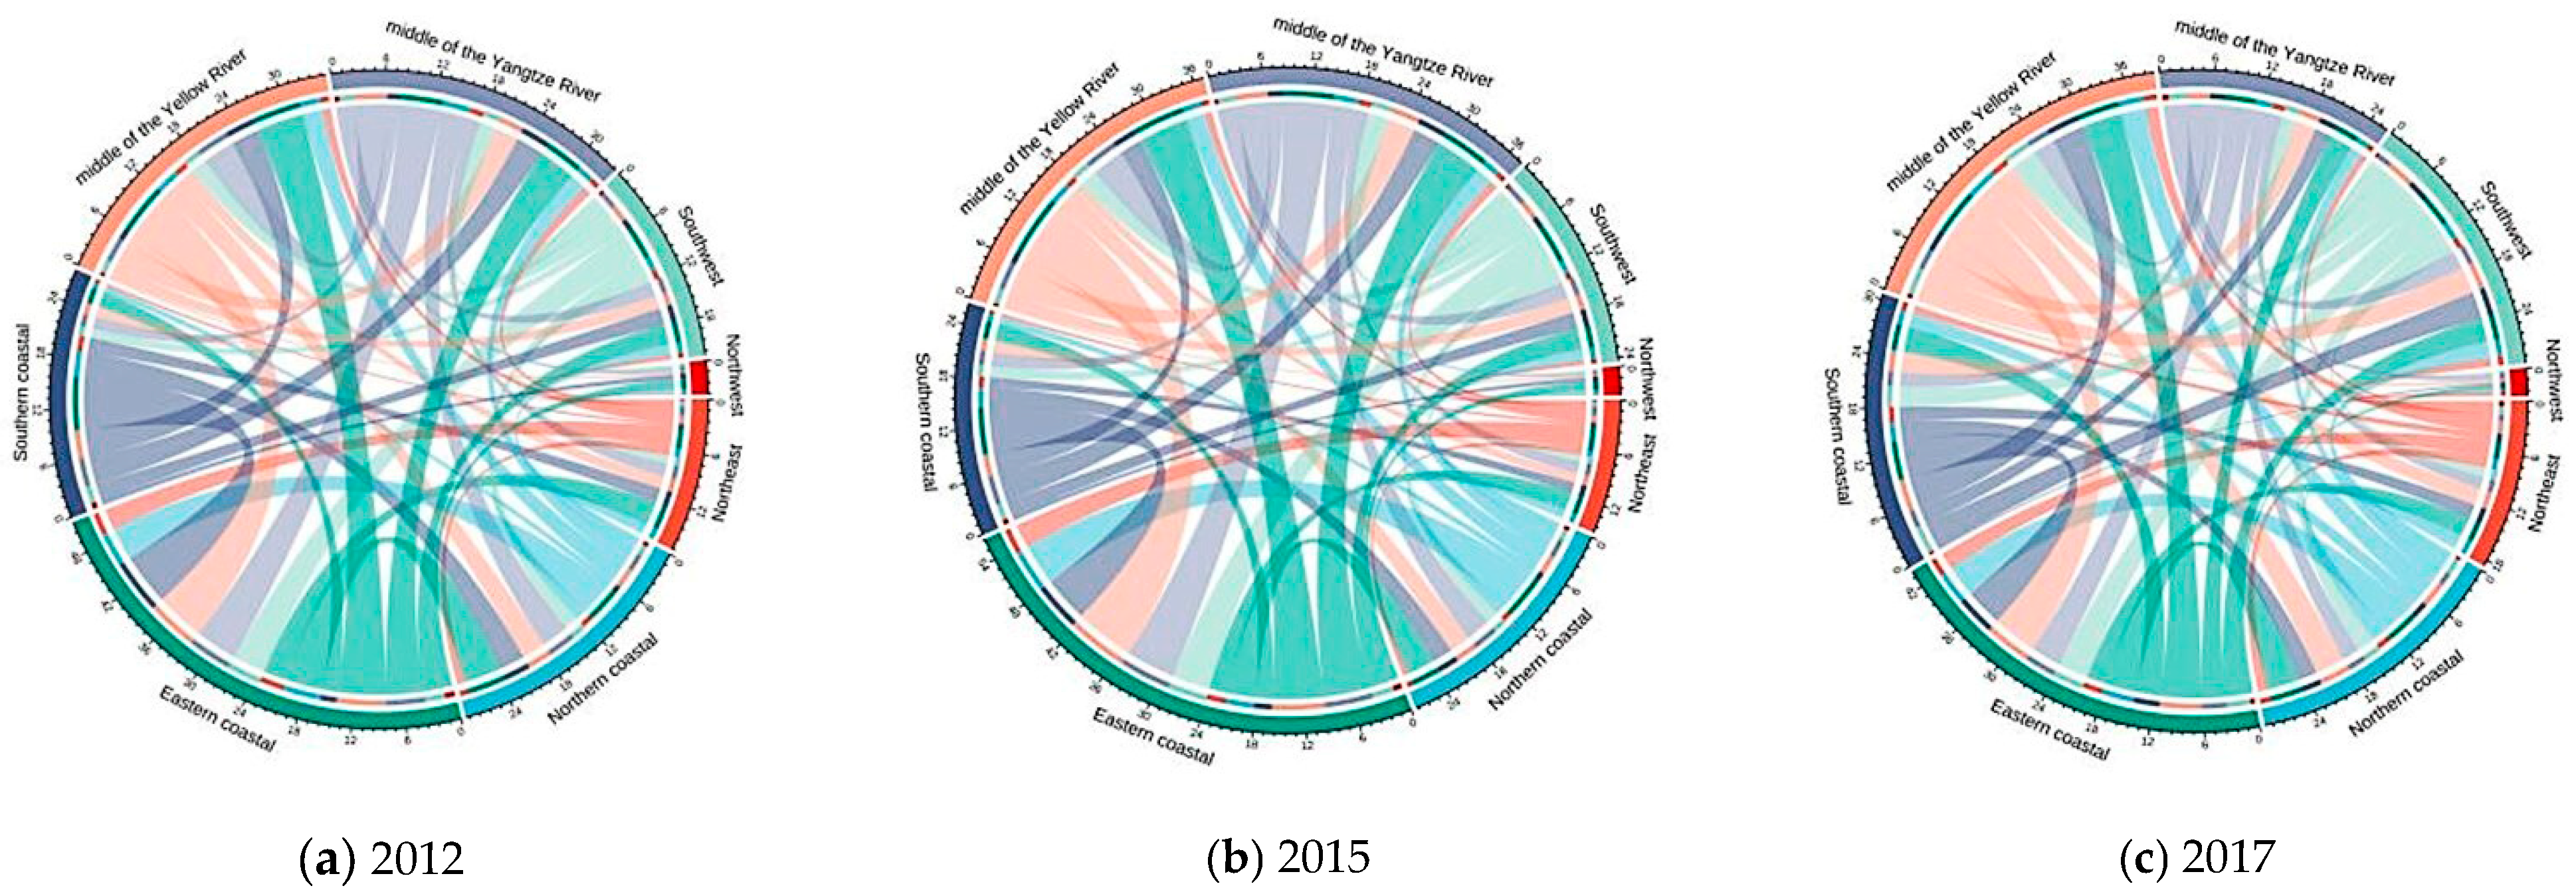
4.2.2. The Structure of Supply and Demand

The dependence on other areas of the outflow of embodied oil from eight areas in China is displayed in Figure 4. It demonstrates that other parts of China rely heavily on the eastern coastal areas’ inherent oil consumption, especially the regions in the middle of the Yellow River and the middle of the Yangtze River. Interestingly, the eastern coastal area is mostly dependent on regions including the southern coastal and middle of the Yellow River. The eastern coastal region, as a more developed area of our economy, maintains close economic ties with the inland. However, between 2012 and 2017, other regions’ reliance on the eastern coastline area and the eastern coastal area’s dependence on the middle of the Yellow River decreased a little bit.
According to the geographical distribution ratio of embodied oil outflow shown in Figure 5, embodied oil predominantly flows from interior sites to coastal areas. To be specific, the eastern coastal area is the main beneficiary of embodied oil and among all the suppliers, the regions of middle of the Yellow River and the northeast stand out. Between 2012 and 2017, the proportion of embodied oil outflow from the three coastal zones increased, with the largest rise occurring in the southern coastal areas. While the northwest region’s share of supply to the eastern and southern beaches has decreased, more embodied oil has been used for supply to the nearby northeast region.

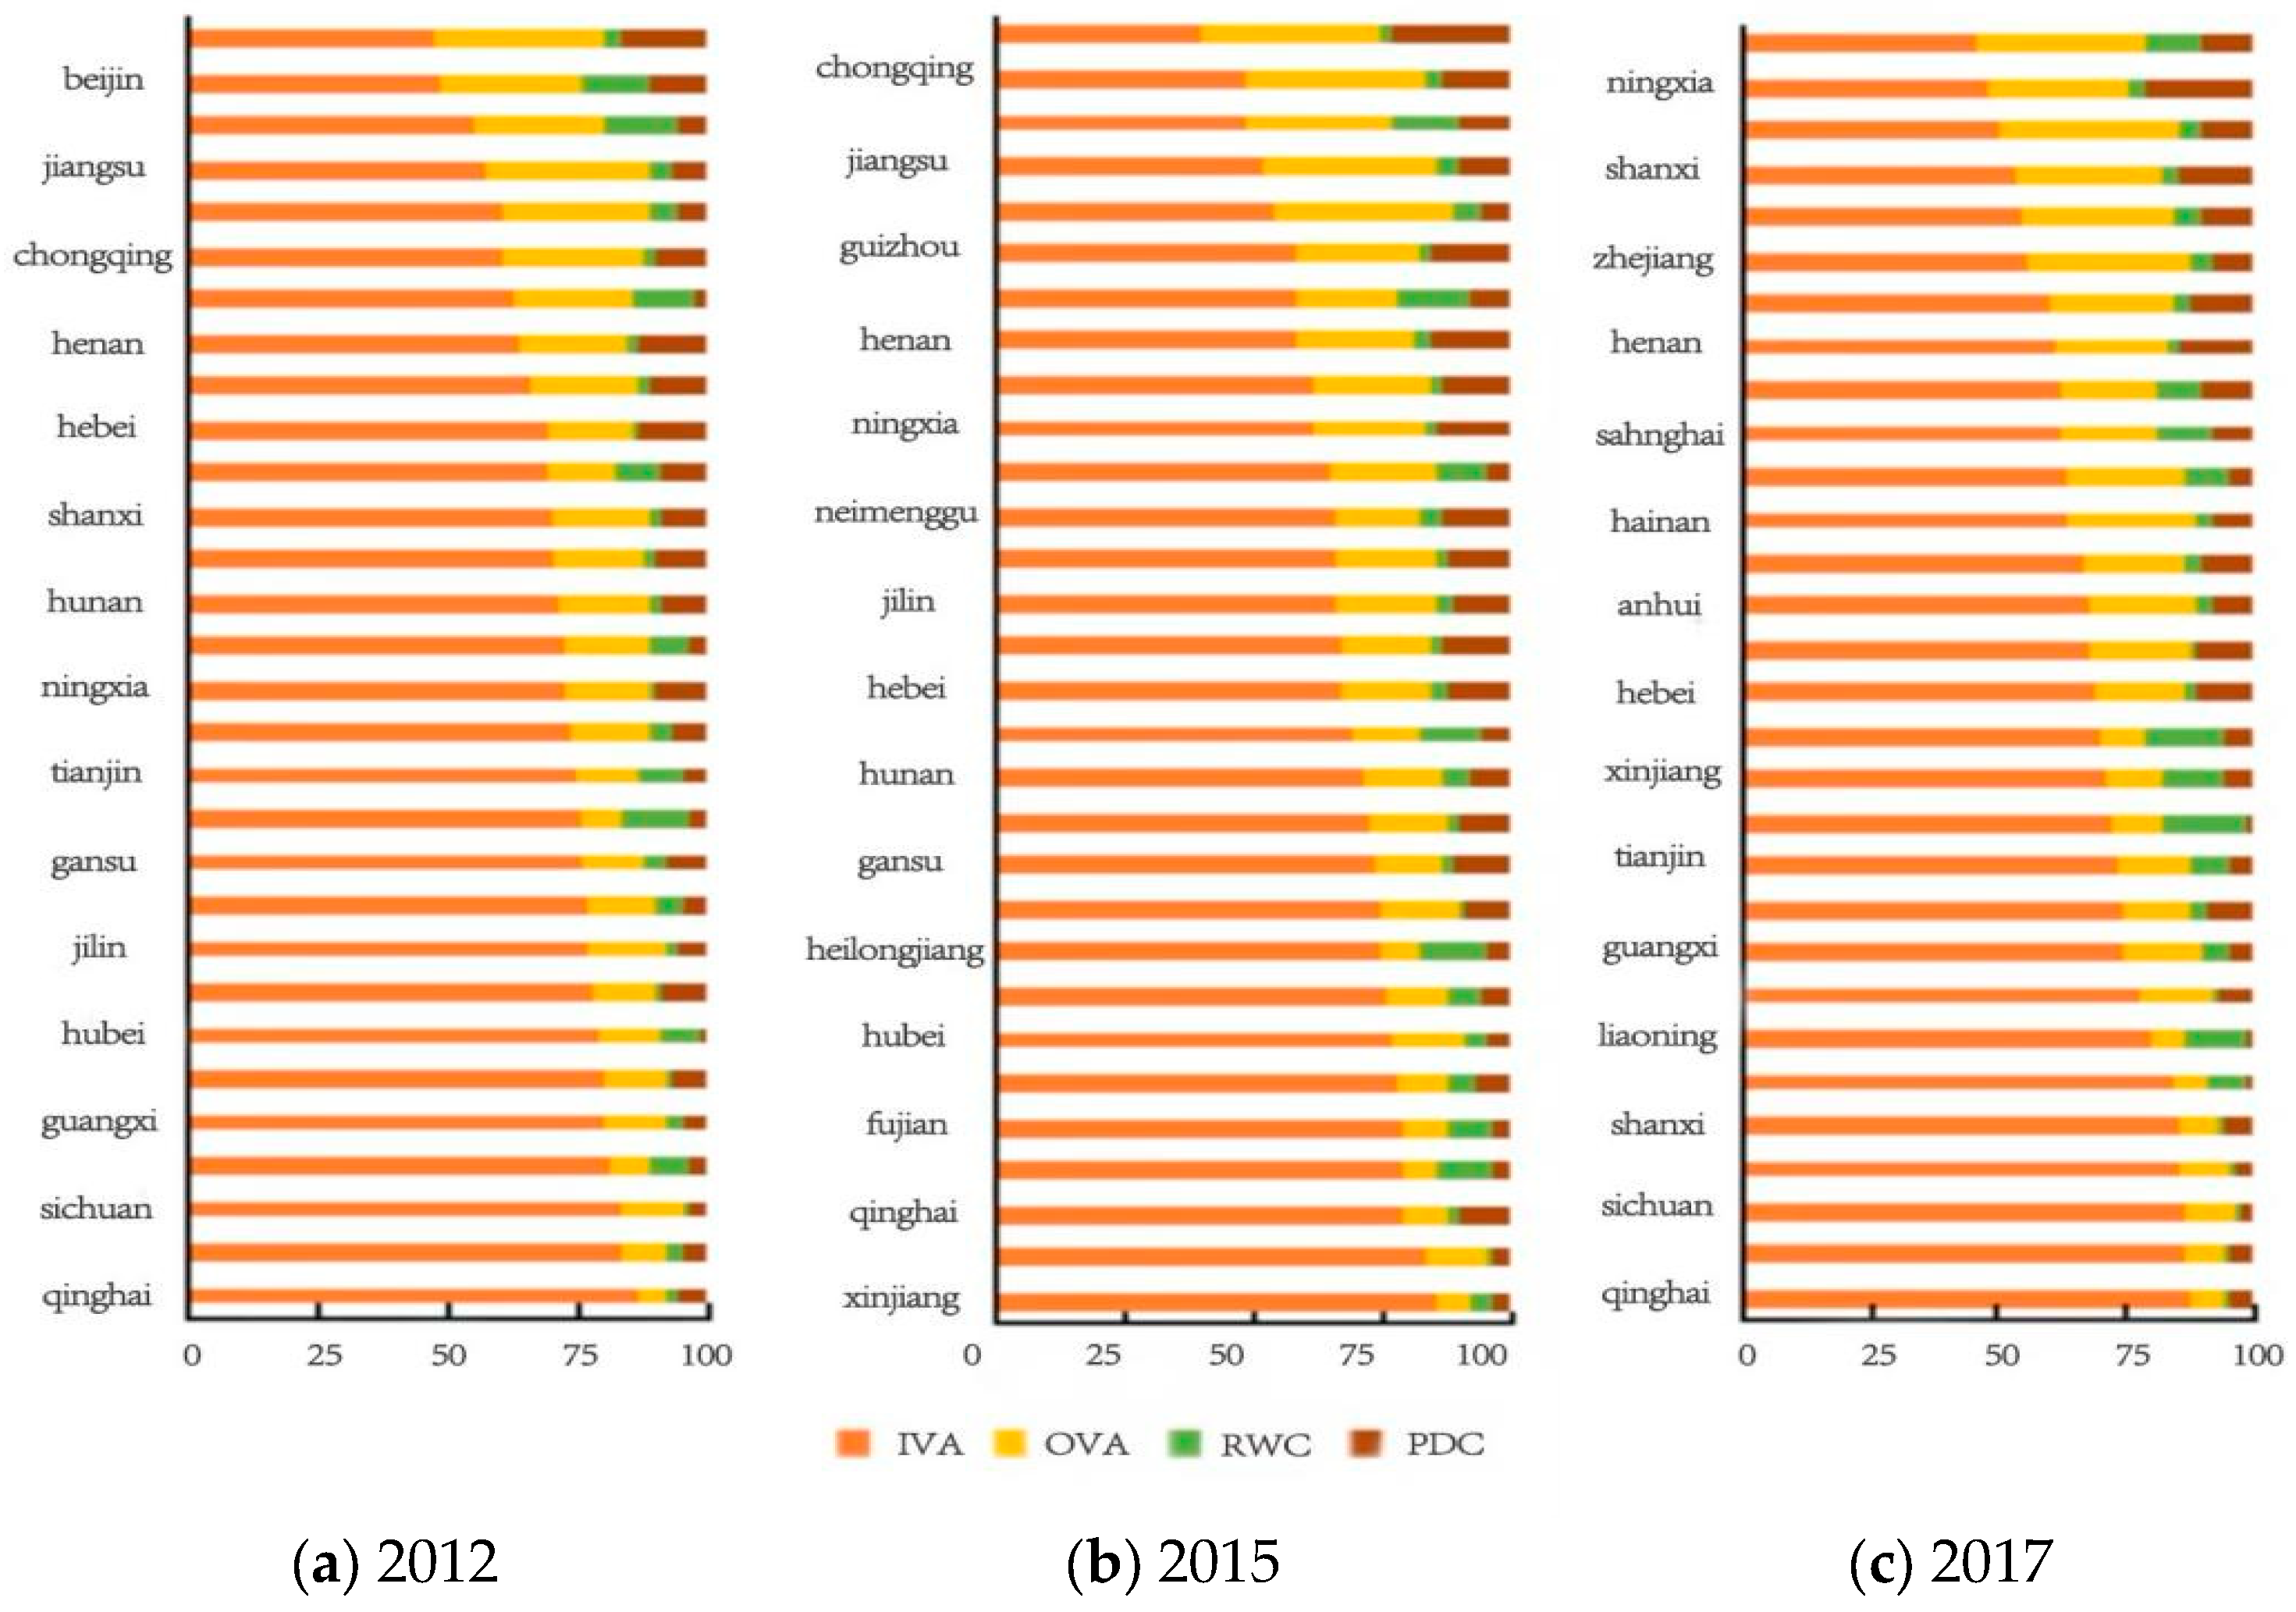
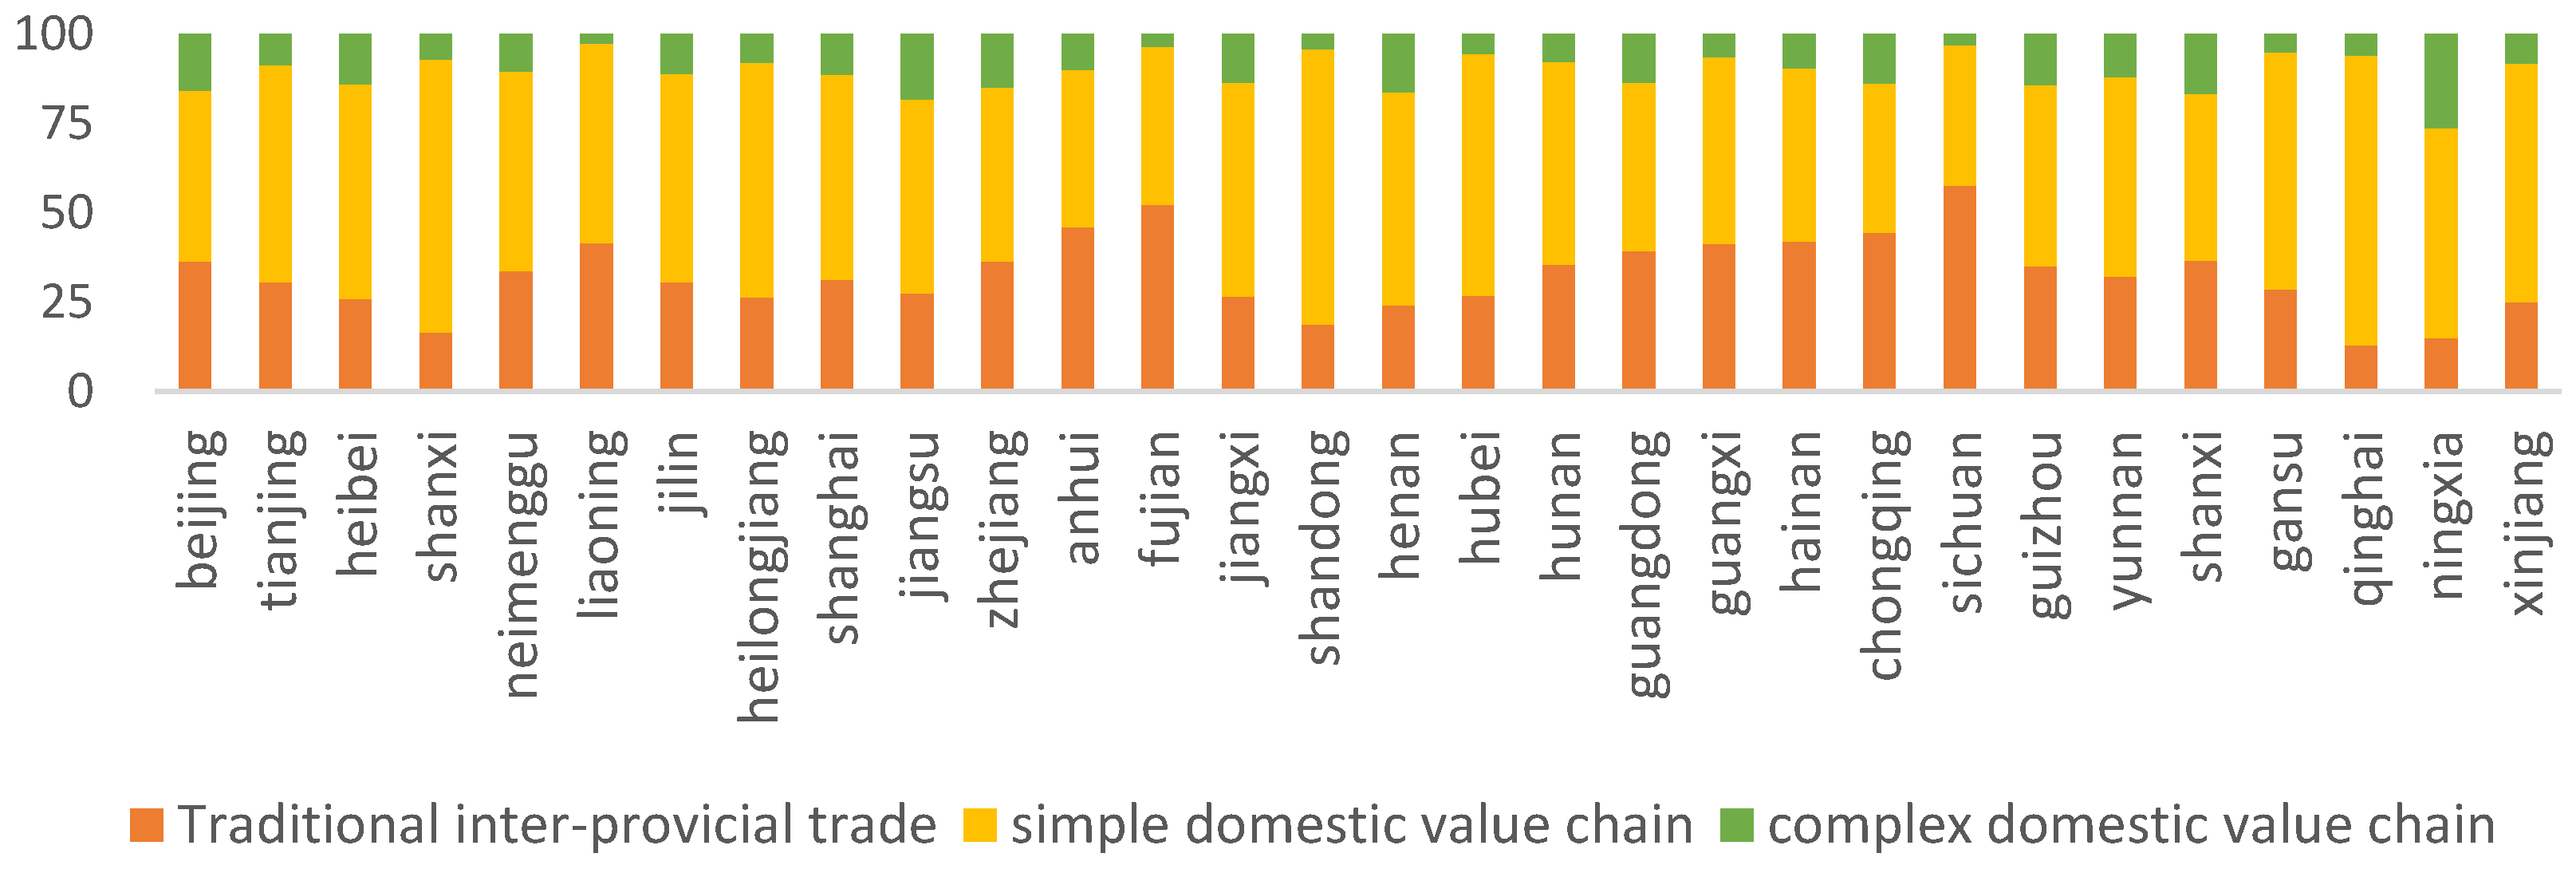
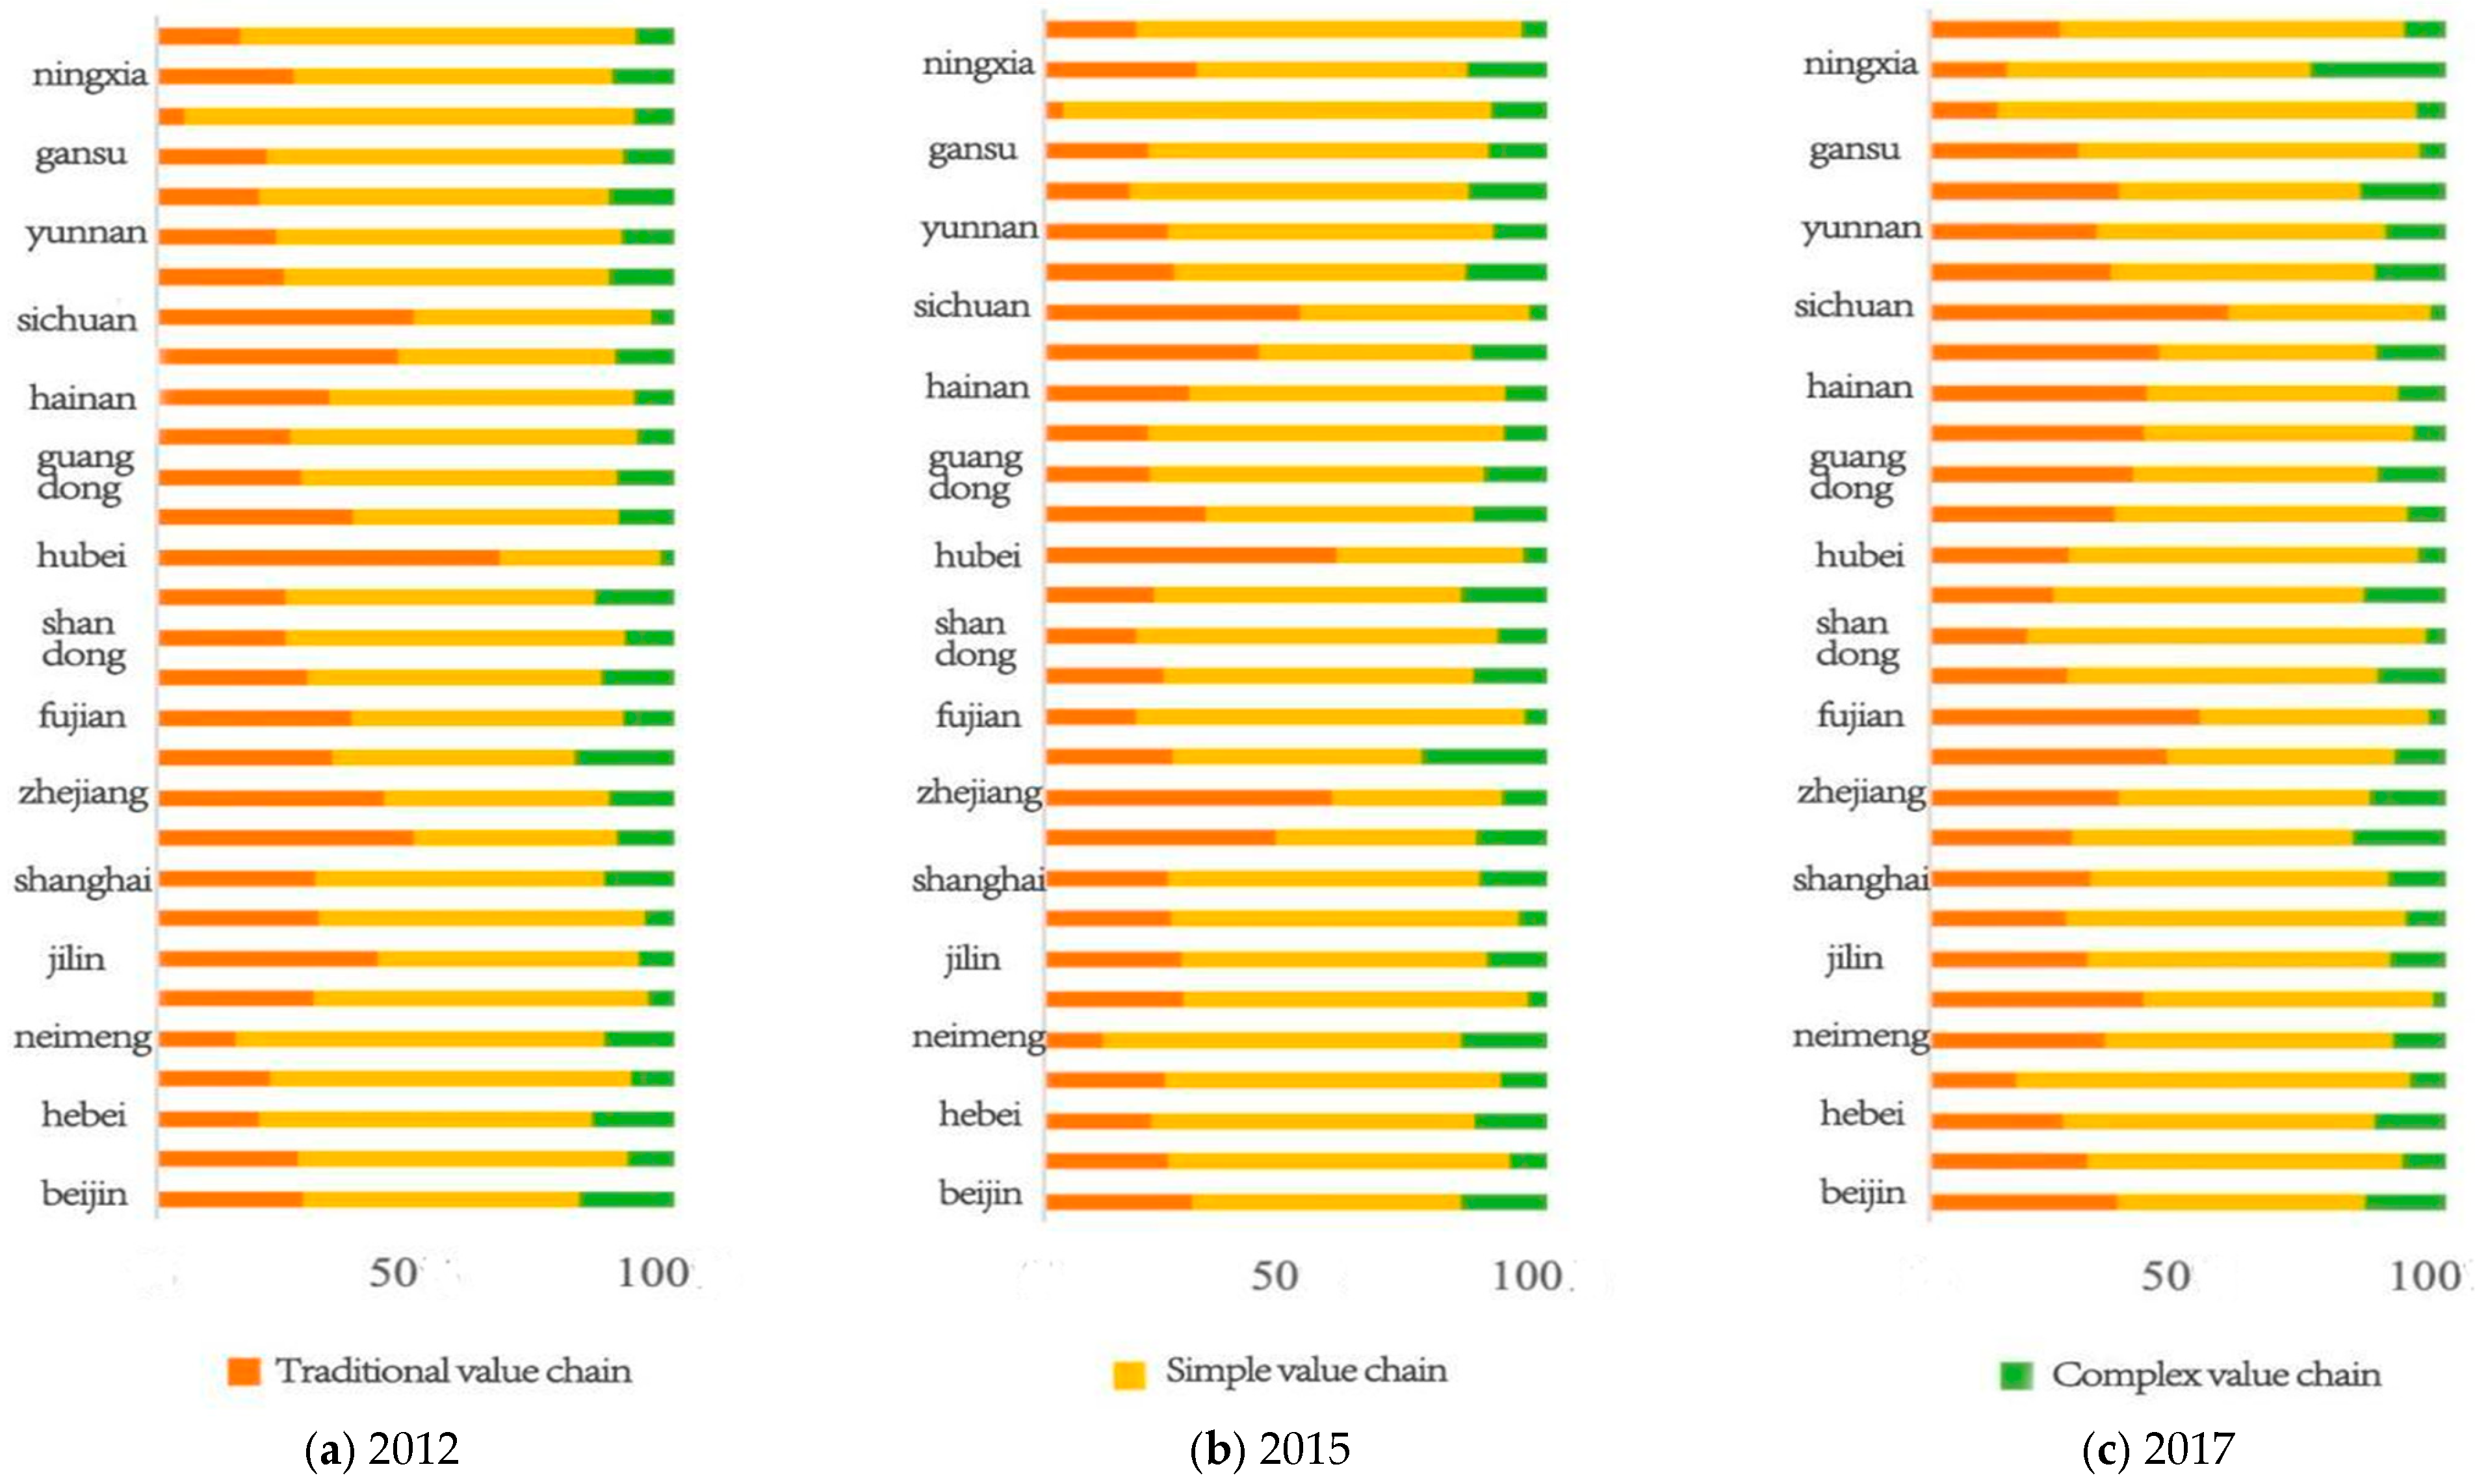
4.2.3. The Structure of Distribution in National Value Chains

In general, coastal regions serve the threefold purposes of supplying, absorbing, and transporting oil to interior regions. In the interregional connection between embodied oil supply and demand, inland areas are dependent on coastal areas for both supply and demand. Inland and coastal areas exhibit clear reciprocity and this phenomenon is similar to China’s interactive mode of value-added trade [29]. However, it differs from the earlier research finding that inland areas provide energy to support economic development in coastal areas [22].
Figure 6 illustrates the oil outflow from 30 provinces in China to international markets. Globally speaking, the national value chain path decomposition results show that the average embodied oil outflow for each region decreased initially before increasing between 2012 and 2017.
When examining the embodied oil transferred abroad from these 30 provinces, coastal provinces exhibit the highest outflows, with Guangdong leading the way and demonstrating continuous growth in its embodied oil outflow. The significant proportion of embodied oil outflow from each province underscores the severity of China’s oil outflow issue. However, the overall decrease in the proportion of embodied oil outflow suggests that this problem has been alleviated, and the importance of interprovincial trade in embodied oil transfers has been further strengthened.
As shown in Figure 7, when it comes to the national value chain structure in interprovincial trade, a simple national value chain transfers more than half of the embodied oil, a traditional national value chain transfers about 30%, and a complex national value chain transfers less than 10%.
Figure 8 shows the decomposition of the value chain path for embodied oil transfers in each province. It is seen that only Sichuan, Fujian, Chongqing, and Anhui transfer embodied oil to other provinces, mostly through the traditional value chain, implying that these provinces’ exports to other provinces are predominantly final products. In contrast, more than 80% of embodied oil flows out via the simple domestic value chain in Qinghai and more than 70% in Shandong and Shanxi, which indicates that these provinces mostly use intermediary products to transfer embodied oil to other regions. This pattern suggests that the interprovincial production division in China can be further optimized by forming a more complete embodied oil transfer network with complex value chains embedded.

5. Discussion

5.1. Balanced Interprovincial Transfers and Concentrated Interindustrial Transfers

At the provincial level, there is a clear correlation between the scale of embodied oil flows and economic development level of the region. For instance, the embodied oil exchanges among northwestern provinces such as Gansu, Qinghai, Ningxia, and Xinjiang are relatively limited, while coastal areas like Shanghai, Jiangsu, and Zhejiang, which enjoy more prosperous economies, are tending to transfer embodied oil on a larger scale and in more varied ways. Provinces with thriving economies typically have a higher frequency and a larger magnitude of interprovincial economic exchanges and as a result, the volume of their embodied oil flows is greater. Besides, China’s interprovincial embodied oil transfers are becoming increasingly balanced, with stronger interprovincial interactions. More precisely, the pattern is shifting from a one-way flow, where oil flows unidirectionally from impoverished provinces to other regions, to a more reciprocal model, where developed provinces mutually support one another.
At the sector level, compared to the balanced interprovincial embodied oil transfer pattern, the interindustrial one exhibits a higher degree of concentration. The volume of embodied oil flowing from the transportation, storage, and postal services sector (S26) to the construction sector (S25) has consistently ranked first and shown an increasing trend, reaching 56.09 million tons in 2017. Moreover, the gap between this figure and the transfer volumes of most other intersector pathways has gradually widened. The oil, coking, and nuclear fuel processing industry (S11), as a major energy-consuming sector, also directs its oil flows primarily to the construction sector and service industries. This shift may be related to the ongoing adjustment of China’s economic structure and the continuous strengthening of environmental protection policies. The optimization of our economic structure and the expanded implementation of oil-saving and emission-reduction policies have generally led to a decline in intersector embodied oil transfers; however, with the prosperous development and rapid expansion of industries such as transportation and construction, the embodied oil consumption within these sectors and their transfers to other industries have also increased significantly. At the same time, this change implies that policymakers need to pay closer attention to the disparities in intersector embodied oil transfers in terms of oil resource utilization and allocation. This will help better meet the needs of various industries and ensure the rational distribution and use of resources.

5.2. Critical Demanders, Suppliers, and Intermediaries in Interregional Embodied Oil Transfers

Regions in China have played different roles in interregional embodied oil transfers. For instance, inland areas are dependent on coastal areas for both supply and demand. To be specific, other parts of China have the largest reliance on the eastern coastal areas for embodied oil, while the eastern coastal areas rely most heavily on the southern coastal and middle of the Yellow River. However, between 2012 and 2017, other regions’ reliance on the eastern coastline areas’ inherent oil consumption and the eastern coastal areas’ dependence on the middle of the Yellow River decreased. The eastern region’s progressive promotion of industrial upgrading and transformation in recent years may be the cause of this phenomenon, as it has altered the energy consumption structure of the area and decreased its reliance on embodied oil. Meanwhile, the economic cooperation between the eight regions is growing closer because of China’s regional coordinated development strategy, and the supply channels for embodied oil are becoming more diverse. This lessens the reliance of other regions on the eastern region and the eastern region on the middle of the Yellow River.
Generally, coastal regions serve the threefold purposes of supplying, absorbing, and transporting oil to inland regions. Because coal is the primary energy source in inland areas while oil and gas are the main sources in coastal regions, the consumption of embodied oil is primarily concentrated in coastal zone, which may reflect the structural disparities of embodied energy in different locations. However, the distribution of oil supply and demand may be spatially dislocated due to the strong demand for oil in coastal areas. Since more than 70% of China’s oil is imported, coastal regions have the chance to be the first to consume imported oil before it is transformed into primary goods and shipped to the mainland through interprovincial commerce. Nonetheless, the strong consumption of coastal provinces must drive the economic development of inland provinces. As a result, the majority of their processed intermediate products are sold to coastal provinces along with the primary products produced in this region, changing the coastal areas from “suppliers” of embodied oil to “demanders”, and inland areas into “intermediaries” for the transportation of embodied oil abroad.

5.3. The Importance of Interregional Trade in the Transfer of Embodied Oil

In general, regarding the national value chain structure in interprovincial trade, a simple national value chain transfers more than half of the embodied oil, a traditional national value chain transfers approximately 30%, and a complex national value chain transfers less than 10%. This could be attributed to the lower transaction costs and quicker turnover associated with simple national value chains, making them the preferred conduit for the flow of oil resources. Regarding the latter two chains, the traditional national value chain, which involves only a single cross-border transfer, tends to be more concentrated in basic industries with high oil consumption compared to the complex value chain. As a result, it facilitates a greater transfer of embodied oil.
As previously stated, the four regions of Sichuan, Fujian, Chongqing, and Anhui primarily transfer embodied oil via the traditional value chain. This can be mainly ascribed to the substantial share of traditional industries in these areas, where their trade with other regions mainly revolves around final products. For instance, Sichuan’s chemical industry and Anhui’s iron and steel industry are of great significance in such trade models. In contrast, the goods traded between Qinghai and other provinces mainly consist of chemical raw materials like potash fertilizers and potassium salts, along with primary non-ferrous metal products. This circumstance explains why more than 80% of the embodied oil flow in Qinghai takes place through the simple value chain.
In conclusion, because the transfer path is mainly based on simple national value chains, the domestic flow of oil resources predominantly follows a direct supply chain model. With this approach, oil resources travel directly from the site of production to the site of consumption, reducing the number of intermediary linkages and increasing efficiency.
Meanwhile, established value networks also assist the integrated transit of oil between provinces. These value chains typically contain additional intermediary links, such as processing, distribution, and other phases, which may be more common in specific industries or regions. However, the volume of embodied oil flowing through complex national value chains is quite low. Although this value chain only makes up a minor percentage of the movement of embodied oil across provinces due to its complexity, it cannot be disregarded because of its unique functions in the global energy supply chains and trade.

6. Conclusions and Policy Implications

This study employed a multiregional input–output (MRIO) model to quantify interprovincial embodied oil flows in China. Through a value-added decomposition framework, we further analyzed the structural characteristics of these transfers, including their spatial origins, supply–demand distribution, and value-chain pathways. Key findings reveal the following three critical insights:
Transfer Scale: Coastal provinces function as dual hubs, serving as both primary suppliers and consumers of embodied oil. The construction, transportation, warehousing, and postal sectors emerge as central nodes in this network.
Spatial Composition: Coastal regions exhibit a tripartite role—acting as oil suppliers, absorbers, and intermediaries channeling flows to inland provinces.
Value-Chain Dynamics: Interprovincial embodied oil transfers are predominantly mediated through simple national value chains, supplemented by traditional chains. Complex national value chains play a comparatively minor role. These findings offer critical insights for designing spatially differentiated oil conservation strategies and advancing China’s “dual carbon” objectives through value-chain optimization.
One important policy implication from our findings is the urgent need to reduce interprovincial disparities in oil production and utilization while enhancing interregional oil redistribution, particularly through strategic north-to-south transfers. To advance the North-to-South Oil Project, policymakers should prioritize the following measures:
Expand pipeline infrastructure by increasing the scale of existing oil pipelines and optimizing nationwide network connectivity.
Strengthen logistical capacity through modernizing northern oil-export hubs and southern receiving terminals to improve handling efficiency.
Ensure operational safety by implementing systematic, comprehensive inspections of transportation equipment, storage facilities, and critical infrastructure to guarantee system-wide stability.
The second significant policy implication is to enhance the efficiency of oil utilization within high-oil-consuming industries, such as transportation and construction. The construction industry stands out as the main consumer of embodied oil, while transportation, warehousing, and postal services play pivotal roles as key transporters. To cut down on oil consumption per unit of output, it is essential to implement industry-specific, effective fuel-saving strategies and innovative technologies. In the transportation, warehousing, and manufacturing sectors, imposing a fuel tax can incentivize the use of fuel-efficient and new energy-powered transport vehicles. Regarding the construction industry, a consumption control system should be designed for each construction phase. Simultaneously, promoting energy-efficient construction equipment and green construction techniques is crucial. Additionally, the energy-saving service industry needs to be developed vigorously.
The third policy implication underscores the necessity of embedding value-chain dynamics into embodied oil governance to craft targeted strategies for oil conservation and emissions reduction. China’s interprovincial trade has gradually transitioned from traditional value-chain frameworks to hybrid models integrating both simple and complex chains. Notably, this shift has paradoxically amplified embodied oil transfers through traditional pathways, elevating associated costs. To reconcile this challenge, policymakers must do the following:
Decouple industrial upgrading from oil intensity by systematically reducing oil costs embedded in traditional value-chain mechanisms.
Prioritize regions reliant on legacy systems, such as Sichuan, Fujian, and Chongqing, where traditional chains dominate embodied oil flows, for tailored regulatory and infrastructural interventions.
Align policies with chain-specific oil flow patterns, leveraging structural disparities in supply–demand dynamics across chains to establish provincially differentiated, evidence-based targets that balance operational feasibility with distributive equity.
However, this study has limitations. First, the MRIO model’s assumptions of industry homogeneity and fixed coefficients may yield inaccurate analyses of industrial structures and economic linkages, especially in long-term and dynamic research. In reality, industries vary and evolve, and these static assumptions cannot capture such changes well. Second, due to the lack of Tibet’s energy emission data in the database, we excluded its input–output data, which compromises result accuracy. Aggregating 56 industries to 28 for easier analysis and presentation also caused a loss of details, obscuring industry relationships. Third, despite using the latest database data, there is a notable lag. With China’s rapid regional economic development and focus on the domestic cycle, the embodied oil flow pattern may have changed. Interprovincial embodied oil flows may have grown with more frequent economic exchanges in some areas, while in others, they might have declined due to energy-saving and emission-reduction policies. This warrants further exploration in future research.

Author Contributions

Conceptualization, S.Z. and X.Y.; Methodology, X.Y.; Validation, R.S.; Formal analysis, S.Z.; Investigation, C.Z. and X.Y.; Data curation, S.Z. and R.S.; Writing—original draft, X.Y.; Visualization, R.S.; Supervision, C.Z.; Project administration, C.Z.; Funding acquisition, C.Z. All authors have read and agreed to the published version of the manuscript.

Funding

This research was supported by the National Social Sciences Fund of China (No. 24AJL007).

Data Availability Statement

The original contributions presented in this study are included in the article. Further inquiries can be directed to the corresponding author.

Conflicts of Interest

The authors declare no conflict of interest.

References

  1. Chen, B.; Li, J.S.; Wu, X.F.; Han, M.Y.; Zeng, L.; Li, Z.; Chen, G.Q. Global energy flows embodied in international trade: A combination of environmentally extended input-output analysis and complex network analysis. Appl. Energy 2018, 210, 98–107. [Google Scholar] [CrossRef]
  2. Wang, Q.; Jiang, F. Drivers of United States oil footprints trajectory: A global assessment. J. Clean. Prod. 2019, 240, 118150. [Google Scholar] [CrossRef]
  3. Zhang, W.; Wei, R.; Peng, S. The oil-slick trade: An analysis of embodied crude oil in China’s trade and consumption. Energy Econ. 2020, 88, 104763. [Google Scholar] [CrossRef]
  4. Zhang, C.; Dong, M. China’s embodied oil outflow: Estimation and structural path analysis. Environ. Dev. Sustain. 2022, 25, 14861–14885. [Google Scholar] [CrossRef]
  5. Ji, Q.; Zhang, H.-Y.; Fan, Y. Identification of Global Oil Trade Patterns: An Empirical Research Based on Complex Network Theory. Energy Convers. Manag. 2014, 85, 856–865. [Google Scholar] [CrossRef]
  6. Jia, X.; An, H.; Sun, X.; Huang, X.; Wang, L. Evolution of world crude oil market integration and diversification: A wavelet-based complex network perspective. Appl. Energy 2017, 185, 1788–1798. [Google Scholar] [CrossRef]
  7. Yang, Y.; Poon, J.P.H.; Liu, Y.; Bagchi-Sen, S. Small and flat worlds: A complex network analysis of international trade in crude oil. Energy 2015, 93, 534–543. [Google Scholar] [CrossRef]
  8. Costanza, R. Embodied Energy and Economic Valuation. Science 1980, 210, 1219–1224. [Google Scholar] [CrossRef]
  9. Odum, H.T. Self-Organization, Transformity, and Information. Science 1988, 242, 1132–1139. [Google Scholar] [CrossRef]
  10. Chen, J.; Zhou, W.; Yang, H. Is Embodied Energy a Better Starting Point for Solving Energy Security Issues?—Based on an Overview of Embodied Energy-Related Research. Sustainability 2019, 11, 4260. [Google Scholar] [CrossRef]
  11. Liu, B.; Zhang, L.; Sun, J.; Wang, D.; Liu, C.; Luther, M.; Xu, Y. Analysis and comparison of embodied energies in gross exports of the construction sector by means of their value-added origins. Energy 2020, 191, 116546. [Google Scholar] [CrossRef]
  12. Tang, X.; Zhang, B.; Feng, L.; Snowden, S.; Höök, M. Net oil exports embodied in China’s international trade: An input–output analysis. Energy 2012, 48, 464–471. [Google Scholar] [CrossRef]
  13. Wiedmann, T.O. A review of recent multi-region input–output models used for consumption-based emission and resource accounting. Ecol. Econ. 2009, 69, 211–222. [Google Scholar] [CrossRef]
  14. Hong, J.; Tang, M.; Wu, Z.; Miao, Z.; Shen, G.Q. The evolution of patterns within embodied energy flows in the Chinese economy: A multi-regional-based complex network approach. Sustain. Cities Soc. 2019, 47, 101500. [Google Scholar] [CrossRef]
  15. Su, B.; Ang, B.W. Input–output analysis of CO2 emissions embodied in trade: The effects of spatial aggregation. Ecol. Econ. 2010, 70, 10–18. [Google Scholar] [CrossRef]
  16. Hong, J.; Gu, J.; Liang, X.; Liu, G.; Shen, G.Q. Characterizing embodied energy accounting with a multi-dimensional framework: A study of China’s building sector. J. Clean. Prod. 2019, 215, 154–164. [Google Scholar] [CrossRef]
  17. Su, B.; Ang, B.W.; Li, Y. Structural path and decomposition analysis of aggregate embodied energy and emission intensities. Energy Econ. 2019, 83, 345–360. [Google Scholar] [CrossRef]
  18. Jiang, L.; He, S.; Tian, X.; Zhang, B.; Zhou, H. Energy use embodied in international trade of 39 countries: Spatial transfer patterns and driving factors. Energy 2020, 195, 116988. [Google Scholar] [CrossRef]
  19. Su, B.; Ang, B.W. Structural decomposition analysis applied to energy and emissions: Some methodological developments. Energy Econ. 2012, 34, 177–188. [Google Scholar] [CrossRef]
  20. Gao, C.; Su, B.; Sun, M.; Zhang, X.; Zhang, Z. Interprovincial transfer of embodied primary energy in China: A complex network approach. Appl. Energy 2018, 215, 792–807. [Google Scholar] [CrossRef]
  21. Shi, J.; Li, H.; Guan, J.; Sun, X.; Guan, Q.; Liu, X. Evolutionary features of global embodied energy flow between sectors: A complex network approach. Energy 2017, 140, 395–405. [Google Scholar] [CrossRef]
  22. Tang, M.; Hong, J.; Liu, G.; Shen, G.Q. Exploring energy flows embodied in China’s economy from the regional and sectoral perspectives via combination of multi-regional input–output analysis and a complex network approach. Energy 2019, 170, 1191–1201. [Google Scholar] [CrossRef]
  23. Kan, S.; Chen, B.; Chen, G. Worldwide energy use across global supply chains: Decoupled from economic growth? Appl. Energy 2019, 250, 1235–1245. [Google Scholar] [CrossRef]
  24. Wu, X.F.; Chen, G. Global primary energy use associated with production, consumption and international trade. Energy Policy 2017, 111, 85–94. [Google Scholar] [CrossRef]
  25. Wu, X.F.; Chen, G.Q. Global overview of crude oil use: From source to sink through inter-regional trade. Energy Policy 2019, 128, 476–486. [Google Scholar] [CrossRef]
  26. Song, Z.; Zhu, Q.; Han, M. Tele-connection of global crude oil network: Comparisons between direct trade and embodied flows. Energy 2021, 217, 119359. [Google Scholar] [CrossRef]
  27. Zhang, X.; Su, B.; Yang, J.; Cong, J. Analysis of Shanxi Province’s energy consumption and intensity using input-output framework (2002–2017). Energy 2022, 250, 123786. [Google Scholar] [CrossRef]
  28. Wang, Z.; Wei, S.-J.; Zhu, K. Quantifying International Production Sharing at the Bilateral and Sector Levels; National Bureau of Economic Research Working Paper Series No. 19677; National Bureau of Economic Research: Cambridge, MA, USA, 2013. [Google Scholar]
  29. Pan, W.; Li, G. National Value Chain and Global Value Chain in Chinese Regions: Regional Interaction and Value-Added Gains. Econ. Res. J. 2018, 3, 171–186. [Google Scholar]
  30. Koopman, R.; Wang, Z.; Wei, S.-J. Tracing Value-Added and Double Counting in Gross Exports. Am. Econ. Rev. 2014, 104, 459–494. [Google Scholar] [CrossRef]
  31. Wang, Z.; Wei, S.; Zhu, K. Gross Trade Accounting Method: Official Trade Statistics and Measurement of the Global Value Chain. China Soc. Sci. 2015, 9, 108–127, 205–206. [Google Scholar]
  32. Ran, C.; Xu, X.; Zhang, S. Embodied carbon emissions transfers via inter-regional trade: Evidence from value-added extended decomposition model in China. Heliyon 2022, 8, e10521. [Google Scholar] [CrossRef]
  33. Wang, Z.; Wei, S.-J.; Yu, X.; Zhu, K. Measures of Participation in Global Value Chains and Global Business Cycles; National Bureau of Economic Research Working Paper Series No. 23222; National Bureau of Economic Research: Cambridge, MA, USA, 2017. [Google Scholar]
Figure 1. Interprovincial transferred embodied oil in China. Data source: China Emission Accounts and Datasets (CEADs). Note: The segments of varying colors along the outer perimeter of the circle stand for the 30 provinces in China. Their lengths are proportional to the scale of embodied oil outflow from each respective province. Within the circle, colored lines, each representing a province’s embodied oil, stretch out towards other provinces. The thickness of each line corresponds to the volume of embodied oil transferred from the province of the line’s color to the province at which the line is directed.
Energies 18 02070 g001
Figure 2. Interindustrial transferred embodied oil. Data source: China Emission Accounts and Datasets (CEADs). Note: Different colors denote the 28 classified industries. The significance of the color and size of the line segments, along with that of the colored lines connecting different industries, is identical to that in Figure 1.
Energies 18 02070 g002
Figure 3. The proportion of different sources of interprovincial transferred embodied oil (%). Data source: China Emission Accounts and Datasets (CEADs).
Energies 18 02070 g003
Figure 4. The dependence on other areas of the outflow embodied oil from eight areas in China (%). Data source: China Emission Accounts and Datasets (CEADs). Note: Different colors denote the eight areas in China. The thickness of every line indicates the dependence of the province corresponding to the color on the embodied oil transferred from the province the line points to.
Energies 18 02070 g004
Figure 5. Regional distribution ratio of embodied oil outflow from eight areas (%). Data source: China Emission Accounts and Datasets (CEADs). Note: Different colors denote the eight areas in China. The significance of the color and size of the line segments, along with that of the colored lines connecting different regions, is identical to that in Figure 1.
Energies 18 02070 g005
Figure 6. The embodied oil outflow abroad from 30 provinces in China. Data source: China Emission Accounts and Datasets (CEADs).
Energies 18 02070 g006
Figure 7. The path decomposition of interprovincial trade value chain in 2017 (%). Data source: China Emission Accounts and Datasets (CEADs).
Energies 18 02070 g007
Figure 8. The value chain path decomposition of transferred embodied oil chain (%). Data source: China Emission Accounts and Datasets (CEADs).
Energies 18 02070 g008
Table 1. The decompositions terms of embodied oil outflow from region s in Formula (20).
TermsMeanings
V1The embodied oil contained in the final products exported from region s to region r.
V2The embodied oil contained in the intermediate products that flow from region s to region r and are finally consumed in the non-s region.
V3The embodied oil contained in the intermediate products that flow from region s to region r and return to region s for consumption.
V4The embodied oil contained in the intermediate products that flow from region s to region r and then return to region s to produce final products for export, which belongs to double counting.
V5Double counting of the embodied oil contained in the intermediate products flowing from region s to region r.
V6The embodied oil contained in the intermediate products exported to foreign countries after flowing from region s to region r.
V7The embodied oil from China’s non-s region contained in the final products flowing from region s to region r.
V8The embodied oil from China’s non-s region contained in the intermediate products flowing from region s to region r.
V9Repeated calculation of the embodied oil from China’s non-s region.
Table 2. The sources of decomposition terms.
Decomposition TermsIndex Meanings
V1, V2, V3, V6, V10IVAEmbodied oil from region s
V7, V8, V11OVAEmbodied oil from other regions in China
M1-M3, M6-M8, M10, M11RWCEmbodied oil from overseas
V4, V5, M4, M5, V9, M9PDCDouble measurement terms
Table 3. Value chain decomposition.
Decomposition TermsIndex
V3Flow back to original region
V1, V7Traditional value chain
V2, V8Simple national value chain
V4, V5, V9Complex national value chain
V6, V10, V11Exports to overseas
Table 4. Industry classification.
CodeIndustry NameCodeIndustry Name
S1Agriculture, Hunting, Forestry and FishingS15Metal Products
S2Coal Mining and DressingS16Ordinary Machinery
S3Petroleum and Natural Gas ExtractionS17Equipment for Special Purpose
S4Ferrous Metals Mining and DressingS18Transportation Equipment
S5Nonferrous Metals and Other Minerals Mining and DressingS19Electric Equipment and Machinery
S6Food, Beverage and Tobacco ProcessingS20Electronic and Telecommunications Equipment
S7Textile IndustryS21Other Manufacturing Industry, Scrap and Waste
S8Garments and Other Fiber Products, Leather, Furs, Down and Related ProductsS22Electric Power, Steam and Hot Water Production and Supply
S9Timber Processing, Bamboo, Cane, Palm and Straw Products and Furniture ManufacturingS23Gas Production and Supply
S10Papermaking and Paper Products, Printing, Record Medium Reproduction, and Cultural, Educational and Sports ArticlesS24Tap Water Production and Supply
S11Petroleum Processing and CokingS25Construction
S12Raw Chemical Materials and Chemical ProductsS26Transport, Storage, Postal and Telecommunications Services
S13Nonmetal Mineral ProductsS27Wholesale, Retail Trade, and Catering Service
S14Smelting and Pressing of MetalsS28Other Services
Data source: China Emission Accounts and Datasets (CEADs).
Disclaimer/Publisher’s Note: The statements, opinions and data contained in all publications are solely those of the individual author(s) and contributor(s) and not of MDPI and/or the editor(s). MDPI and/or the editor(s) disclaim responsibility for any injury to people or property resulting from any ideas, methods, instructions or products referred to in the content.

