Article

Equilibrium Analysis of Electricity Market with Multi-Agents Considering Uncertainty

1
School of Automation, Guangdong University of Technology, Guangzhou 510006, China
2
School of Materials and Energy, Guangdong University of Technology, Guangzhou 510006, China
*
Author to whom correspondence should be addressed.
Energies 2025, 18(8), 2006; https://doi.org/10.3390/en18082006
Submission received: 17 March 2025 / Revised: 11 April 2025 / Accepted: 11 April 2025 / Published: 14 April 2025
(This article belongs to the Section A1: Smart Grids and Microgrids)

Abstract

:
The engagement of emerging market participants in electricity markets exerts dual influences on price formation mechanisms and operational dynamics. To quantify the impacts on locational marginal prices and stakeholders’ economic interests when EV aggregators (EVAs), cloud energy storage operators (CESSOs), and load aggregators (LAs) collectively participate in market competition, this study develops a bi-level game-theoretic framework for market equilibrium analysis. The proposed architecture comprises two interdependent layers: The upper-layer Stackelberg game coordinates strategic interactions among EVA, LA, and CESSO to mitigate bidding uncertainties through cooperative mechanisms. The lower-layer non-cooperative Nash game models competition patterns to determine market equilibria under multi-agent participation. A hybrid solution methodology integrating nonlinear complementarity formulations with genetic algorithm-based optimization was developed. Extensive numerical case studies validate the methodological efficacy, demonstrating improvements in solution optimality and computational efficiency compared to conventional approaches.

1. Introduction

With the rapid development of the power industry, the existing power market system struggles to accommodate the evolving grid environment [1,2,3]. To establish an efficient and competitive electricity market, many countries have implemented varying degrees of reforms on the supply side [4]. This has led to the emergence of new market participants alongside traditional power producers. Among these emerging entities, energy producers and sellers represented by electric vehicle aggregator (EVA), cloud energy storage system operator (CESSO), and load aggregator (LA) constitute the primary components. These entities are primarily formed through the integration of adjustable resources on the user side.
With the advancement of EV technology, the large-scale uncontrolled charging and discharging of EVAs has posed significant challenges to power system stability and reliability [5]. EVAs aggregate a large number of EVs, participating in grid operations and electricity market transactions through unified coordination and control strategies [6]. This enables EVs to achieve bidirectional energy exchange with the grid while performing peak shaving, valley filling, and providing ancillary services [7,8,9].
The increasing penetration of distributed generation (DG) and energy storage (ES) resources has made them excellent flexible resources for mitigating the volatility of distributed power generation [10]. However, the rapid cost escalation of distributed energy storage due to environmental constraints has prompted CESSOs to adopt sharing-economy principles [11]. By establishing centralized ES facilities, CESSO provides cloud-based virtual storage services that replace physical user-side installations, supported by large-scale centralized storage infrastructure. This approach offers distributed ES services and enhanced operational flexibility for numerous electricity market participants [12,13].
Demand response (DR), as a crucial component of power market reform, has attracted significant attention. However, the dispersed distribution patterns of residential customers and their consumption behaviors make it challenging to utilize scattered flexible load-side resources. LA addresses this issue by aggregating and quantifying demand-side resources, participating in grid regulation through clustered operations. This mechanism provides ancillary services for the grid while enabling flexible load management for users, ultimately reducing system peak–valley differentials [14].
The above analysis demonstrates that the three emerging market participants—EVA, LA, and CESSO—can attain operational scale through user-side resource aggregation, thereby engaging in strategic competition in electricity markets. The existing literature has preliminarily investigated their participation mechanisms as individual market entities and corresponding grid impacts.
For EVA, ref. [15] investigates a game-theoretic bidding approach for EVA in day-ahead markets to optimize power purchase costs. Rahmani et al. developed a comprehensive risk-constrained model using conditional value-at-risk for EVA operations across day-ahead and real-time markets [16]. Beaudin et al. demonstrated EVA’s positive impact on power system stability when participating as price-making entities in market bidding [17]. Ref. [18] explored synergistic cooperation between EVA and wind power generation in market competition, establishing new paradigms for EVA participation in market games.
Regarding distributed energy storage (DES), ref. [19] aggregated user-side DES resources to deliver cost-effective electricity services. Germany’s Green2Store project exemplifies this approach by coordinating local grid ES units into large-scale DES systems [20]. An et al. proposed cloud energy storage (CES) applications for mitigating wind power fluctuations, with detailed analysis of CESSO-wind power cooperative strategies in energy markets [21].
In LA research, ref. [22] incorporated demand response willingness factors to develop optimal day-ahead bidding strategies, simultaneously optimizing user-side ES resources. Li et al. addressed load response uncertainties through robust optimization frameworks for LA bidding and scheduling [23]. Ref. [24] established a cooperative game-based day-ahead market equilibrium model between LA and wind power providers using the Shapley Method for benefit allocation, though the absence of interactive pricing mechanisms may reduce LA’s market participation incentives. Cherenkov et al. designed response quantity-based bidding mechanisms and formulated intra-day trading strategies for LAs [25].
In summary, current research predominantly examines scenarios where the three emerging market entities engage in electricity market competition individually. Nevertheless, with ongoing power market reforms globally and the gradual relaxation of market entry criteria, these three categories of market participants are now permitted to compete concurrently in electricity markets. Under such circumstances, the strategic behaviors of diversified market entities and their interactive dynamics will inevitably impose multifaceted challenges on the market bidding mechanisms and the secure/reliable operation of power grids. This necessitates comprehensive investigation into electricity market operations involving the co-participation of these heterogeneous entities. Furthermore, inherent uncertainties associated with EVA and LA participation in market bidding processes [6,13] may introduce systematic bid deviations during auction implementation, consequently distorting market competition equilibria. These technical considerations highlight the critical need for developing effective uncertainty mitigation strategies as a key research direction requiring further investigation.
In multi-agent electricity markets within modern power systems, equilibrium analysis is critical for ensuring market efficiency and sustainability. It optimizes resource allocation and price stability by modeling interactions among diverse participants, while identifying market power risks and informing regulatory policies. This methodology provides theoretical foundations for designing adaptive market mechanisms in evolving energy landscapes.
To address the bidding uncertainty inherent in market entities’ participation, these participants typically procure relatively stable reserve resources, such as thermal power, hydropower, or energy storage systems. Among these options, energy storage resources have emerged as the superior alternative for market participants due to their rapid response characteristics. As a derivative market entity evolving from energy storage resources, CESSO can leverage the bidding uncertainty risks associated with other market entities to develop novel revenue streams.
Against this backdrop, the research objective of this paper is twofold.
First, we develop an electricity market equilibrium analysis framework to characterize the differentiated strategic behaviors of EVA, CESSO, and LA during their concurrent market participation, with particular focus on quantifying their collective impacts on market clearing mechanisms. This framework aims to provide regulatory agencies with evidence-based guidelines for market supervision while establishing decision-making paradigms that enable participants to effectively hedge against systemic risks.
Second, targeting the inherent uncertainty mitigation challenge arising from EVA and LA’s bidding activities, this study specifically proposes to exploit CESSO’s rapid response attributes as a technical solution for stabilizing market interactions.
The main contributions of this study are outlined as follows:
  • We propose an electricity market framework incorporating EVA, CESSO, and LA, investigating the operational paradigm under coordinated participation of heterogeneous customer-side energy aggregators.
  • We characterize the operational uncertainties inherent in EVA and LA scheduling processes, employing leased cloud-based energy storage to mitigate uncertainties.
  • We develop a stochastic optimization framework for EVA and LA decision-making in cloud-based energy storage leasing markets. An equilibrium model integrating EVA, CESSO, LA, and TG is established, with a hybrid solution methodology combining nonlinear complementarity principles and genetic algorithms.

2. Basic Framework and Method

2.1. Market Trading Framework

The electricity market trading framework incorporating traditional generator (TG), EVA, CESSO, and LA is illustrated in Figure 1, where all participants operate with mutually independent interests while pursuing individual benefit maximization.
Stochastic variables including EV users’ travel patterns, charging station access periods, real-time SOC levels, and demand-side users’ response quantities under fixed incentive pricing collectively introduce operational uncertainties. These uncertainties impair the operational dispatchability and bidding reliability of both EVA and LA. To address this, EVA and LA procure cloud-based energy storage services from CESSO to mitigate uncertainties through storage flexibility.
EVA and LA collaboratively determine the leasing pricing scheme with CESSO through bilateral agreements, securing access rights to the cloud storage infrastructure. The lessees maintain operational autonomy in charge/discharge scheduling of their allocated storage capacity. When actual generation exceeds bid quantities, surplus energy can be stored in the cloud system; conversely, storage discharge compensates for generation deficits. This mechanism effectively mitigates bidding deviations while enhancing profitability. Furthermore, EVA and LA are obligated to internalize the operational degradation costs associated with frequent storage cycling.
Beyond providing storage leasing services to EVA and LA, CESSO strategically deploys residual storage capacity in day-ahead market bidding to capture arbitrage gains through strategic bidding. Consequently, CESSO’s revenue streams comprise both arbitrage profits and leasing service income.

2.2. Model Assumptions

Consider a day-ahead electricity market with n conventional power producers, an EVA, a CESSO, and an LA participating in competitive bidding. The leased capacity of cloud storage by EVA and LA remains independent of the CESSO’s market participation strategy, establishing a non-cooperative game framework for electricity market competition. The operational horizon T is discretized into 24 hourly intervals. The aggregated load demand comprises fixed and controllable components, expressed as follows:
D t = D sta + D var
where D t represents the total system load demand at time interval t, D sta denotes the fixed baseline load, and D var corresponds to the flexible demand managed by the LA. This controllable load component enables the LA to execute demand response strategies, including load curtailment or temporal shifting, in accordance with the higher-level system requirements while participating in the market bidding process.
The generation cost of a conventional generator is typically modeled by a quadratic function [15,20].
C i , t Gen ( x i , t Gen ) = a i Gen x i , t Gen + 0.5 b i Gen ( x i , t Gen ) 2
where C i , t Gen denotes the generation cost of the ith generator at time t; x i , t Gen represents its power output level. Coefficients a i Gen and b i Gen (both non-negative) are the quadratic and linear cost coefficients, respectively.
The traditional generators participate in electricity market competition through supply function bidding [8]. The supply function for generator i is formulated as follows:
x i , t Gen = δ i , t Gen p t
where δ i , t Gen denotes the non-negative weighting factor of the supply function, and p t represents the wholesale electricity price at time t.
The EVA coordinates EV participation in market competition while satisfying basic travel demands. The net power injection of EVA at time t is expressed as follows:
x EVA , t = P EVA , t out P EVA , t in L EVA , t
where x EVA , t denotes the net power injection (positive for discharge, negative for charge); P EVA , t out and P EVA , t in represent the arbitrage charging/discharging power, respectively; and L EVA , t indicates the inelastic load for basic mobility needs.
The LA participates through flexible load adjustment. The net load expression under demand response is as follows:
D var , t = x LA , t up x LA , t down + L LA , t
where x LA , t up and x LA , t down , respectively, denote the load increment and load curtailment controlled by LA, while L LA , t represents the non-responsive variable load portion during time interval t. Furthermore, to ensure mutually exclusive operations between load increment and curtailment as per standard DR protocols [15], the following constraint applies:
x LA , t up 0 x LA , t down 0 x LA , t up x LA , t down = 0
Following [23], the electricity utility function for LA at time t is defined as follows:
u LA , t ( D var , t ) = v LA , t ( D var , t ) 0.5 ξ LA , t ( D var , t ) 2 = v LA , t ( x LA , t up x LA , t down + L LA , t ) 0.5 ξ LA , t ( x LA , t up x LA , t down + L LA , t ) 2
where u LA , t and ξ LA , t are non-negative utility coefficients. To ensure the non-decreasing property of the utility function, we derive the marginal utility by taking the derivative with respect to D var , t .
u LA , t ( D var , t ) D var , t = v LA , t ξ LA , t D var , t
Equation (8) represents the marginal benefit function of LA, so the constraint by the LA’s electricity consumption benefit function at the time point becomes u LA , t ( D var , t ) D var , t 0 or D var , t v LA , t ξ LA , t .
The CESSO participates in market arbitrage using residual cloud storage capacity after fulfilling EVA and LA contracts. Its net market participation is modeled as follows:
x CESSO , t = P CESSO , t out P CESSO , t in
where P CESSO , t out and P CESSO , t in denote the discharge and charge power allocated for market arbitrage, respectively.
According to the aforementioned assumptions (Equations (1)–(9)), the electricity market clearing condition with the participation of EVA, LA, and CESSO can be derived as follows:
i = 1 N gen x geni , t + P EVA , t out P EVA , t out L EVA , t + P CESSO , t out P CESSO , t in + x LA , t up x LA , t down + L LA , t = a t b t p t
where N gen denotes the number of conventional generators; p t denotes the market price of electricity at time t; and a t and b t are positive constants.

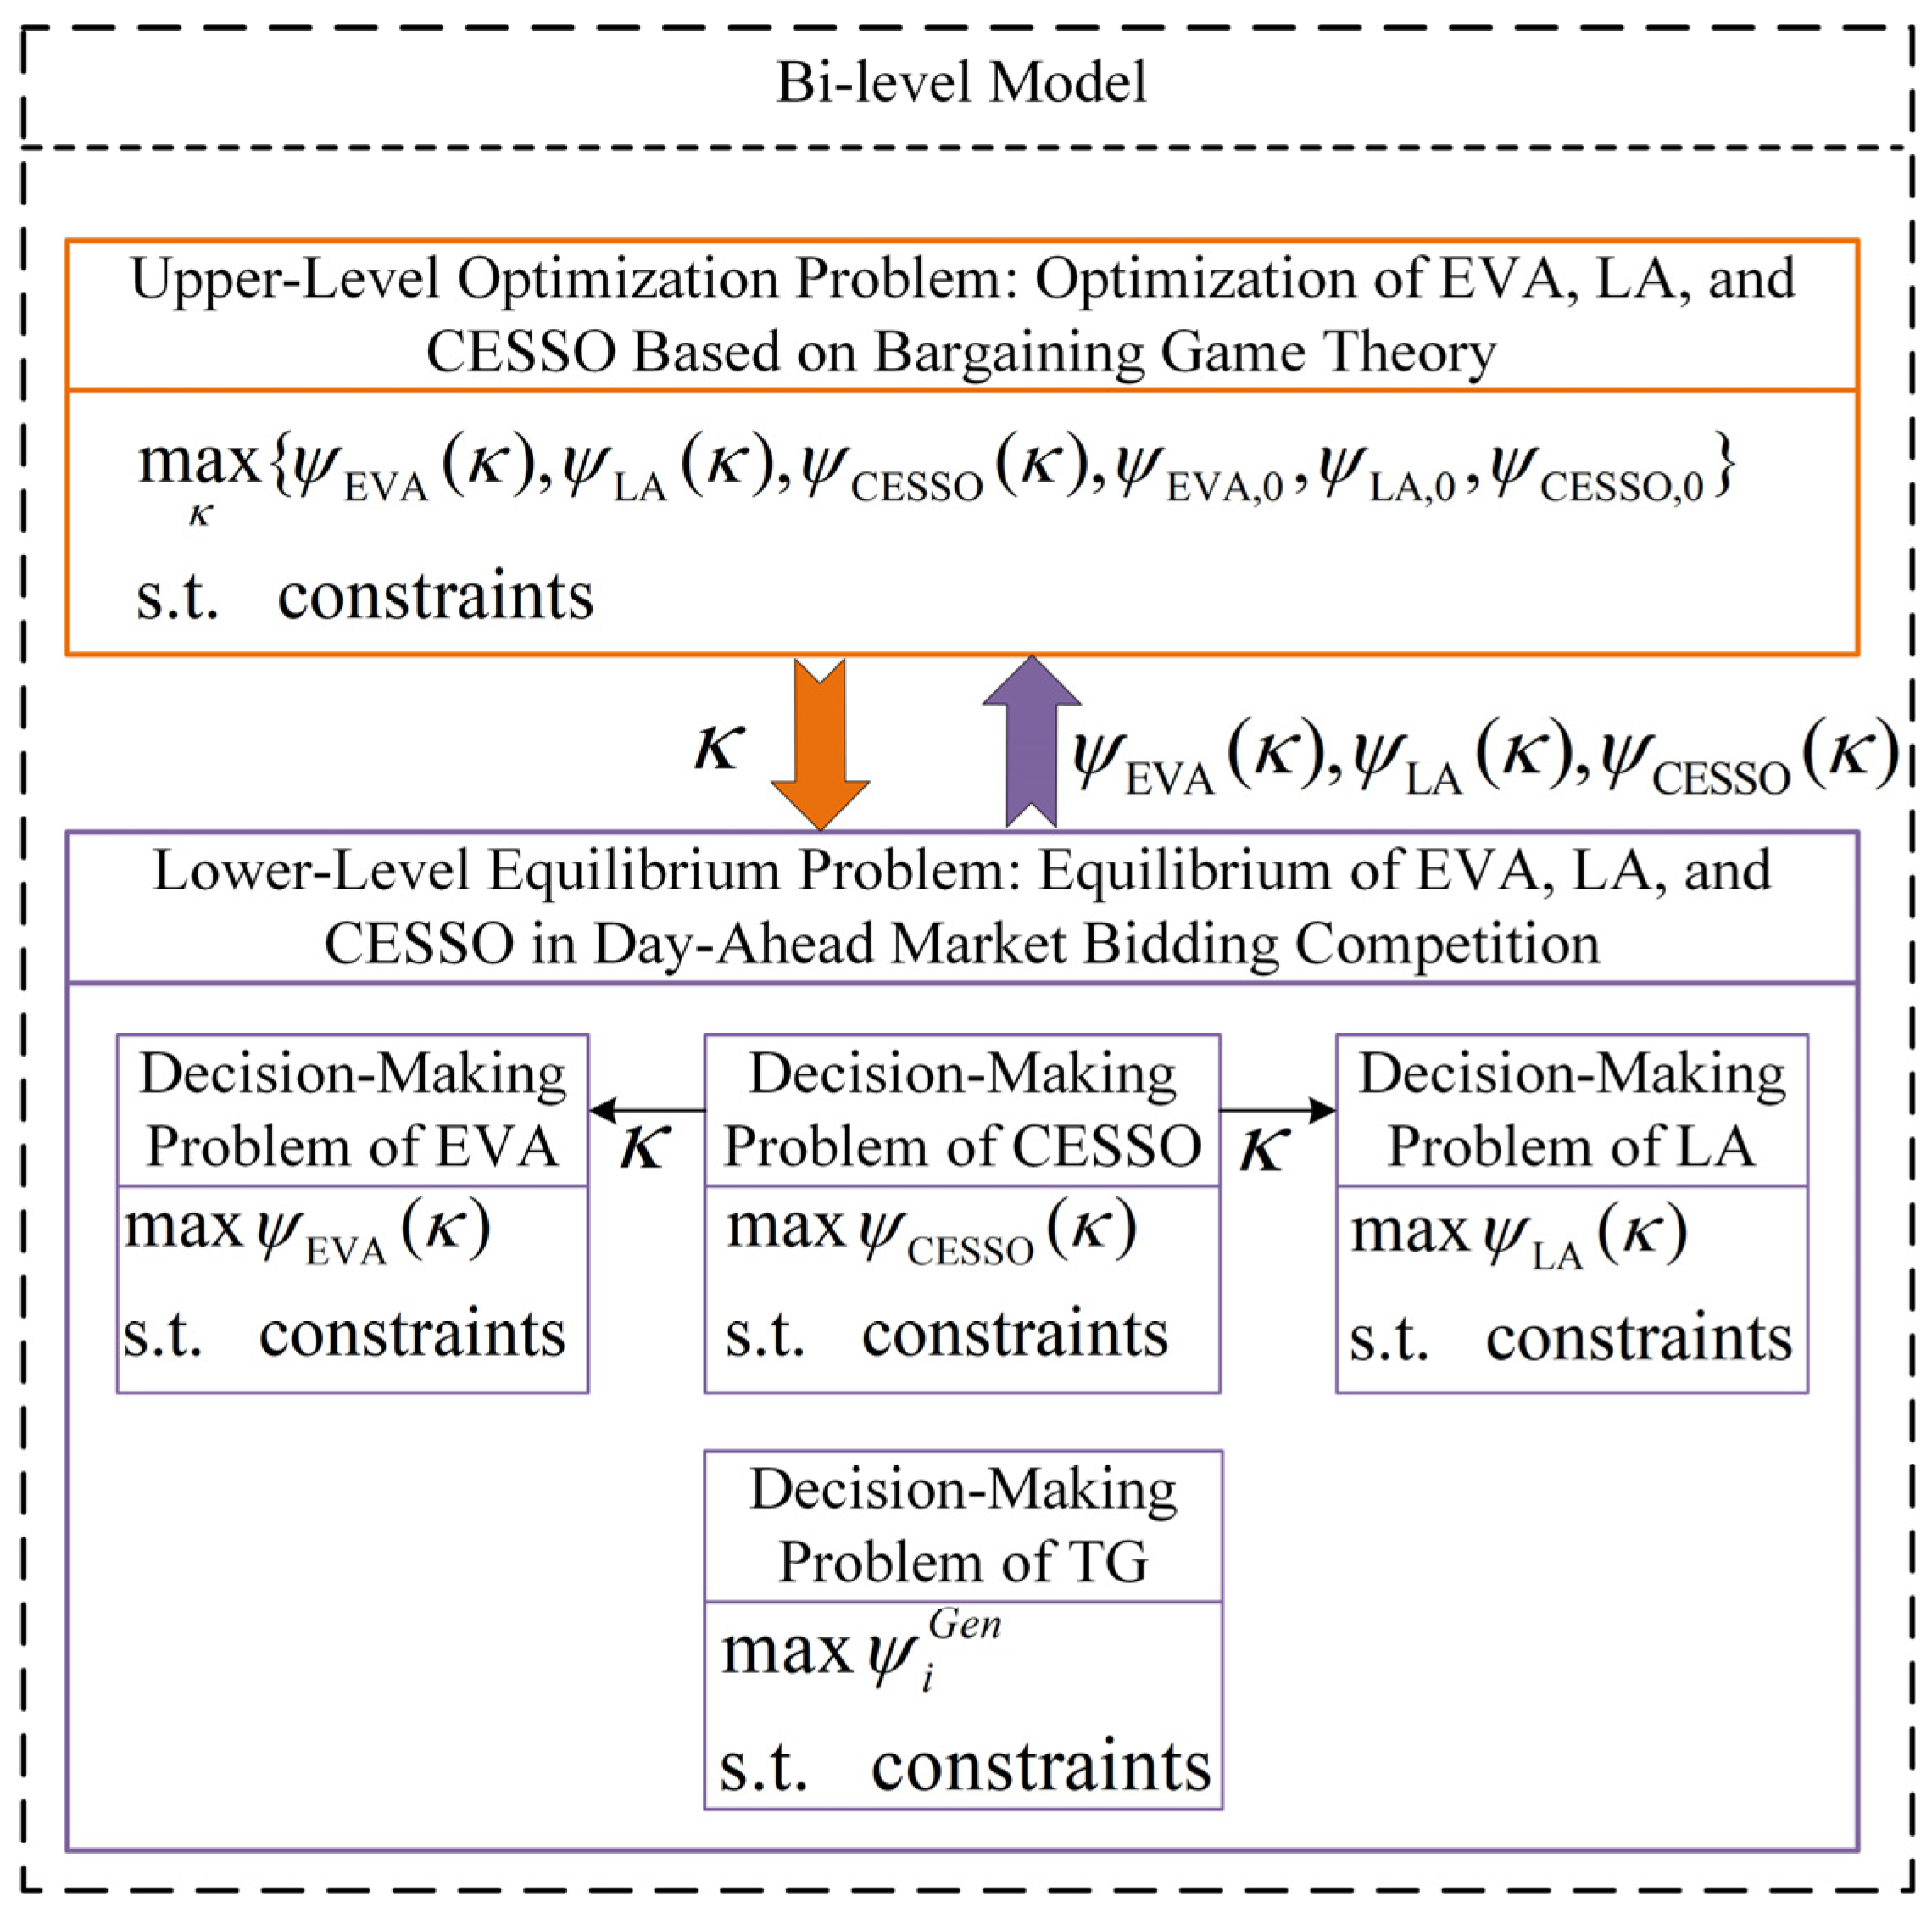
2.3. Bi-Level Gaming Framework

Considering the oligopolistic market structure characteristics inherent in practical electricity markets, all participants engage in market competition as autonomous entities that prioritize individual profit maximization as rational economic agents. Consequently, the formation of leasing cooperation agreements between EVA/LA and CESSO must satisfy the Pareto improvement criterion relative to non-cooperative game scenarios where these entities compete independently. Rational participants would reject unfavorable terms that fail to enhance their individual payoffs. Thus, within the framework presented in Figure 1, the electricity market equilibrium analysis requires simultaneous consideration of both the market-level competition and the strategic interactions regarding cloud storage leasing prices among EVA, LA, and CESSO, collectively forming a bi-level hierarchical game-theoretic structure.
Figure 2 depicts the bi-level Stackelberg game framework governing the participation of TG, EVA, CESSO, and LA in day-ahead electricity market competition.
The upper-level constitutes an optimization problem where EVA, LA, and CESSO determine the cloud storage leasing price κ through Nash bargaining game formulation. The lower-level involves a non-cooperative Nash equilibrium problem where TG, EVA, LA, and CESSO engage in strategic bidding within the day-ahead electricity market. In the upper-level problem, the decision variable κ is optimized to maximize the Nash product of profit increments for all bargaining parties, calculated from the equilibrium outcomes of the lower-level problem.
Within the lower-level problem, each market entity strategically maximizes its individual profits: EVA and LA determine their leased storage capacities based on the optimized κ from the upper-level, while coordinating with CESSO and TG through Cournot competition mechanisms in market bidding. The Stackelberg equilibrium solution of this bi-level programming model is attained when the optimal leasing price κ and its corresponding lower-level equilibrium outcomes satisfy mutual consistency conditions.

3. Uncertainty Smoothing with Cloud Energy Storage

3.1. Output Uncertainty Analysis for EVA and LA

For EVA, according to the statistical analysis in ref. [26], key operational parameters including the population of EVA-controlled EVs, grid connection time, disconnection time, and daily travel distance exhibit specific statistical characteristics at any given system operation moment. These parameters can be effectively characterized through probability density functions (PDFs), as detailed below.
  • EVs’ grid access time
    Considering the bidirectional interaction requirements between EVs and the power grid, all parked EVs are assumed to be grid-connected. The grid connection time can therefore be defined as the termination instant of an EV’s final daily trip. As reported in [27], the distribution of this time parameter follows a lognormal distribution.
    f ( x ) = 1 ( x μ ) 2 π e ( ln ( x μ ) ) 2 2 σ 2
    where f ( x ) refers to the corresponding probability density function, μ represents the mean value, and σ indicates the standard deviation. Normally, μ = 17 , σ = 1 .
  • EV off-grid time
    During EV mobility periods, charging/discharging operations and dispatch participation are technically infeasible. Therefore, the disconnection time is logically defined as the initiation instant of the first daily trip. According to travel pattern statistics from the FHWA 2009 National Household Travel Survey [23], the first departure time also conforms to a lognormal distribution.
    f ( x ) = 1 σ 2 π e ( x μ ) 2 2 σ 2
    where f ( x ) refers to the corresponding probability density function. Normally, μ = 8.92 and σ = 3.24 .
  • EV daily traveling distance distribution
    The daily travel distance was identified to follow a gamma distribution [16]. The mathematical expressions for this distribution are given in Equations (13) and (14).
    f ( x ) = 1 Γ ( α ) λ α 1 e λ x
    Γ ( α ) = 0 + x α 1 e x d x
    where Γ ( α ) refers to the gamma function, λ denotes the parameter of the scale, and α represents the parameter of the shape. As the conclusion, α = 1.2 and λ = 0.0383 .
The Monte Carlo simulation method is employed to generate multiple stochastic scenarios based on the PDFs defined in Equations (11)–(14). By integrating grid-connected status, state of charge (SOC), dispatch cost expectations, and user willingness coefficients, the aggregate dispatchable capacity of EV clusters can be determined across different scenarios. This multi-scenario simulation framework forms the basis for EVA’s bidding strategy formulation, with the complete simulation workflow illustrated in Figure 3.
In Figure 3, the grid-connected status is modeled as a binary state variable: when z i ( t ) = 1 , the EV remains dispatchable. Under this condition, the controllable margin K is calculated considering grid connection time, disconnection time and minimum energy requirement for mobility, as follows:
K = T SET T min
where T SET denotes the time length of charging EV [18], as follows:
T SET = sgn ( T in T out )
where T min is used to satisfy the most basic travel energy needs of EVs [18], and the following occurs:
T min = ( T out T in ) C B η P N
When an EV satisfies the controllable scheduling margin, its scheduling cost expectation and user willingness can be calculated to assess whether the EV can derive certain economic benefits while possessing schedulable potential. Only when the EV satisfies all specified conditions will it be classified as part of the schedulable capacity. In this study, the willingness of EV users to participate in scheduling is quantitatively characterized using the Logit model from ref. [28], which yields the mathematical expression presented in Equation (18).
y i = α + β 1 S O C i + β 2 K i + β 3 C i + u = ln P i ( Y = 1 ) P i ( Y = 0 )
where P i ( Y = 1 ) and P i ( Y = 0 ) respectively represent the probability of EV users accepting dispatch scheduling and rejecting dispatch scheduling. Hence, y i denotes the probability ratio between these two states. α represents the baseline value of the probability coefficient. β 1 , β 2 , and β 3 are the weighting coefficients that reflect the proportional influence of different variables. To account for stochastic factors, the corresponding error control variable u is introduced.
The cost expectation of EVA for scheduling EV is as follows:
E ( C i ) = 1 + e a i ( t ) β 3 ( ln ( 1 + e a i ( t ) ) a i ( t ) )
where a i ( t ) is a constant term.
Through this computational framework combined with historical EV operational data, the EVA can estimate the dispatchable capacity during the day-ahead phase, thereby preparing for subsequent market participation as a market entity. Reference [29] demonstrated through comparative experiments that residential users’ participation in DR is influenced by multiple factors including baseline load profiles, previous response quantities, current time-period incentive pricing, and psychological considerations. These factors lead to uncertainty in users’ DR amount at time t, which approximately follows a normal distribution. Therefore, under a determined incentive policy, the probability density function for users’ DR quantity during a single dispatch event can be expressed as follows:
f ( P LA ) = 1 2 π H e 2 exp [ ( P LA E n ) 2 2 H e 2 ]
where E n and H e denote the expectation as well as the standard deviation of the probability density function.
Accordingly, LA utilizes Equation (20) to obtain the amount of user DR for multiple scenarios through Monte Carlo simulation.

3.2. Scene Reduction Methods

In this paper, the scenario analysis method is employed to determine the charging/discharging power magnitude and capacity configuration of the cloud storage. Considering that the Monte Carlo sampling method generates an excessive number of samples leading to computational inefficiency, the scenario reduction technique is implemented to select representative typical scenarios.
The scenario reduction methods include clustering reduction, backward reduction, and forward reduction [30]. This work adopts the backward reduction method with multi-iteration processing. Let the initial total number of scenarios be denoted as N whole . During each iteration, ensure the following:
(1)
Identify the scenario pair with the smallest Kantorovich distance.
(2)
Calculate the distance product U C for this scenario pair.
(3)
Determine the minimum Kantorovich distance product value U C min among all scenario pairs.
(4)
Eliminate scenarios associated with U C min and update remaining scenario probabilities.
This iterative process continues until achieving the predefined number of scenarios. The final reduced scenario set preserves the statistical characteristics of the original Monte Carlo samples while maintaining computational tractability.

3.3. Cloud Energy Storage Leasing Model Based on Scenario Analysis Approach

In the day-ahead market, the EVA leases cloud energy storage to mitigate potential mismatches between the dispatchable capacity of the EV fleet and the required charging/discharging strategies during real-time operation. Let P cab , t bid represent the dispatchable capacity of the EV fleet at time t, and P cab , t i denote the dispatchable capacity under scenario i. The required charging/discharging power of the cloud energy storage leased by the EVA can be formulated as follows:
P rent i , t = P rent , cha i , t , P cab , t bid P cab , t i P rent , dis i , t , P cab , t bid P cab , t i
where P rent , cha i , t and P rent , dis i , t correspond to the cloud storage charging and discharging power requirements, respectively. Equation (21) reveals that when the predicted dispatchable capacity of the EV fleet exceeds the actual required capacity at time t, the EVA should lease additional charging capacity from the cloud storage [31]. Conversely, insufficient dispatchable capacity necessitates discharging power leasing to compensate for the deficit. The total cloud energy storage charging/discharging requirement is expressed as follows:
P tol , EVA rent , cha = j T i N EVA ξ i EVA P cab , t bid P cab , t i , P cab , t bid P cab , t i
P tol , EVA rent , dis = j T i N EVA ξ i EVA P cab , t bid P cab , t i , P cab , t bid P cab , t i
where N EVA denotes the set of dispatchable capacity scenarios for the EV cluster obtained through scenario reduction techniques, and ξ i EVA indicates the probability of scenario i occurrence.
Analogous to the EVA’s strategy, the LA can leverage cloud storage leasing in the day-ahead market to mitigate uncertainties in user load response [32]. As analyzed in Section 3, the LA’s load response at time t can be classified into two distinct scenarios: load increase response ( x LA , t up ) and load curtailment response ( x LA , t down ).
When LA participates in the day-ahead market bidding, let the load increase response and load curtailment response at time t during bidding be denoted as x LA , t up , bid and x LA , t down , bid , respectively. In scenario i, the load increase response and load curtailment response of LA at time t are x LA , t up , i and x LA , t down , i , respectively. Then, the total charging and discharging power of cloud energy storage that LA needs to lease over the entire dispatch period to mitigate the impact of uncertainty factors is given by Equations (24) and (25).
P tol , LA rent , cha = j T i N LA ξ i LA ( x LA , t up , bid x LA , t up , i + x LA , t down , bid x LA , t down , i ) , x LA , t up , bid x LA , t up , i ;   x LA , t down , bid x LA , t down , i
P tol , LA rent , dis = j T i N LA ξ i LA ( x LA , t up , bid x LA , t up , i + x LA , t down , bid x LA , t down , i ) , x LA , t up , bid x LA , t up , i ;   x LA , t down , bid x LA , t down , i
where N LA denotes the set of feasible dispatchable capacity scenarios for the EV fleet considered by the LA, and ξ i LA represents the probability associated with scenario i of the load demand response.
The required cloud energy storage capacity can be determined based on the leased charging/discharging power profiles for uncertainty mitigation by both EVA and LA, following the methodology outlined in ref. [33]. Let C o EVA rent and C o LA rent denote the total cost associated with charging/discharging power leasing and the required cloud energy storage capacity, respectively. The detailed computational procedures for these parameters are consistent with established methodologies and thus omitted for brevity.

4. Methods for Construction and Solution of Bi-Level Game Models

4.1. Rental Price Optimization Model

According to the bi-level game-theoretic framework illustrated in Figure 2, the upper-level model adopts bargaining game theory to maximize both the coalition’s collective benefits and individual gains for each participant. The equilibrium solutions ψ CESSO ( κ ) , ψ EVA ( κ ) , and ψ LA ( κ ) derived from solving the lower-level equilibrium model serve as input parameters for the upper-level formulation. Following the standard Nash bargaining problem definition [16,23], the decision objective of the upper-level model is formulated to maximize the product of profit increments for EVA, LA, and CESSO, expressed as follows:
max κ ( ψ CESSO ( κ ) ψ CESSO , 0 ) ( ψ EVA ( κ ) ψ EVA , 0 ) ( ψ LA ( κ ) ψ LA , 0 )
s . t . ψ CESSO ( κ ) ψ CESSO , 0 ψ EVA ( κ ) ψ EVA , 0 ψ LA ( κ ) ψ LA , 0
where
  • ψ EVA ( κ ) , ψ LA ( κ ) , and ψ CESSO ( κ ) denote the respective profits of EVA, LA, and CESSO under the lease-sharing agreement.
  • ψ CESSO , 0 , ψ EVA , 0 , and ψ LA , 0 represent the disagreement point corresponding to the profits obtained when the entities independently participate in day-ahead market competition through non-cooperative game strategies.
  • ψ CESSO ( κ ) ψ CESSO , 0 , ψ EVA ( κ ) ψ EVA , 0 , and ψ LA ( κ ) ψ LA , 0 indicate the profit increments resulting from the lease-sharing cooperation.
The fundamental constraint for establishing the lease-sharing agreement requires that all participants achieve higher profits through cooperation compared to non-cooperative scenarios, as formalized in Equation (27). The optimal cloud energy storage leasing price κ can be determined by solving this upper-level optimization problem.

4.2. Optimization Decision Modeling for Conventional Power Producers

Based on the assumptions for the conventional generator in Section 2, the generator competes in the electricity market through its supply function weighting factor. The profit is equal to the total revenue from power generation during dispatch cycle minus the total power generation cost [34]. The optimal decision-making model can be formulated as follows:
max δ i , t Gen t = 1 , 2 , T ψ i Gen = t = 1 T [ ( δ i , t Gen p t ) p t C i , t Gen ( δ i , t Gen p t ) ]   s . t . 0 δ i , t Gen p t x i Gen , max E q . ( 10 )
where ψ i Gen denotes the profit of conventional power producer i obtained through market bidding, and x i Gen , max represents the maximum output capacity of conventional power producer i during the scheduling period.

4.3. Optimized Decision Model for EVA

The EVA optimizes its decision-making to satisfy the base electricity demand for mobility of all EV types, then participates in electricity market through charge/discharge arbitrage. To mitigate penalties induced by EV users’ behavioral uncertainty, leasing from CESSO is required. The profit equals arbitrage revenue minus power purchase cost, battery degradation cost, and cloud ES leasing cost. The EVA optimization model is formulated as follows:
max P EVA , t out , P EVA , t in , L EVA , t ψ EVA = t = 1 T [ ( P EVA , t out P EVA , t in L EVA , t ) p t c s P EVA , t out ] C o EVA rent
s . t . t = 1 T L EVA , t L d = 0
P EVA , t in + L EVA , t p ¯ in 0
P EVA , t out p ¯ out 0
τ = 1 t P EVA , τ out τ = 1 t 1 P EVA , τ in η 0
τ = 1 t P EVA , τ in η s ¯ cap ( τ = 1 t 1 P EVA , τ in η τ = 1 t 1 P EVA , τ out )
P EVA , t out 0 , P EVA , t in 0 , L EVA , t 0
where ψ EVA denotes EVA’s profit, c s represents EV battery degradation coefficient, and L d indicates base travel demand. Equation (30) enforces EVA’s obligation to satisfy user’s basic electricity demand during scheduling. Parameters p ¯ in and p ¯ out define maximum charge/discharge rates of EV fleet, with Equations (31) and (32) constraining aggregate charge/discharge quantities. The conversion efficiency η characterizes charge/discharge round-trip efficiency. Equation (33) bounds EVA’s arbitrage capacity, while Equation (34) establishes temporal coupling between successive arbitrage actions. s ¯ cap is the upper capacity limit of EV. Equation (35) enforces non-negativity of the decision variables.

4.4. Optimized Decision Model for LA

LA participates in the electricity market by providing demand response (DR) services [35]. As specified in previous sections, all EV categories must procure a predetermined amount of charging/discharging capacity from CESSO to mitigate penalty risks associated with load uncertainty from DR participants. The profit function is formulated as the total electricity consumption benefit minus the corresponding electricity procurement costs and cloud ES charging/discharging capacity leasing expenses. The LA’s optimization model is expressed as follows:
max x LA , t up , x LA , t down t = 1 , 2 , T ψ LA = t = 1 T [ v LA , t ( x LA , t up x LA , t down + L LA , t ) 0.5 ξ LA , t ( x LA , t up x LA , t down + L LA , t ) 2 ] t = 1 T [ ( x LA , t up x LA , t down + L LA , t ) p t ] C o LA rent
s . t . x LA , t up L LA max L LA , t
x LA , t down L LA , t
ς t = 0 T x LA , t down t = 0 T x LA , t up t = 0 T x LA , t down
where ψ LA represents LA’s profit margin. L LA max denotes the maximum variable load capacity within the LA. Constraints (37) and (38) define the operating boundaries for variable load increase/curtailment magnitudes. ς is a constant of proportionality between 0 and 1. Equation (39) ensures that the loads in the LA must be restored to a certain proportion.

4.5. Optimized Decision Model for CESSO

Within the power system operational framework, both EVA and LA introduce dispatch volume uncertainties during real-time operations. To address this challenge, a cloud energy storage approach is employed to mitigate the combined uncertainty impacts from these entities.
CESSO engages in electricity market operations through energy storage arbitrage and cloud ES service leasing. The profit formulation combines revenue streams from charging/discharge arbitrage and cloud ES service provision. The CESSO optimization model is defined as follows:
max P CESSO , t in , P CESSO , t in t = 1 , 2 , T ψ CESSO = t = 1 T ( P CESSO , t out P CESSO , t in ) p t + C o EVA rent + C o LA rent C CESSO
s . t . E CESSO CAP S O C CESSO min E CESSO t E CESSO CAP S O C CESSO max
E CESSO t = E CESSO t 1 + ( η CESSO C P CESSO C , t P CESSO D , t / η CESSO D )
0 P CESSO C , t P CESSO , max C
0 P CESSO D , t P CESSO , max D
where ψ CESSO denotes the value of the profit. C CESSO is a series of costs. E CESSO t denotes the remaining storage capacity at the moment t. E CESSO CAP denotes the maximum value of the storage capacity of the cloud energy storage. S O C CESSO min and S O C CESSO max denote the minimum and maximum charging state of the cloud energy storage. I LAandADN and η CESSO D denote the charging/discharging efficiencies of the cloud energy storage, respectively. Equations (41) and (42) are the power limit constraints. P CESSO , max C and P CESSO , max D denote the maximum value of the charging and discharging power. Like EVA, CESSO cannot perform charging and discharging operations at the same time.

4.6. Solution Methods for Equilibrium Models in Electricity Markets

According to the analysis of ref. [33], we adopt the nonlinear complementary method to solve the electricity market equilibrium model constructed above. The solution flow chart is shown in Figure 4.
In the specific solution process, the first-order optimality conditions (Karush–Kuhn–Tucker (KKT) conditions) for each market participant’s decision-making problem are formulated by analytically solving the coupled Equations (22)–(25) and (28)–(44), and the complementary conditions in each model are replaced equivalently via nonlinear complementary function [33], as follows:
ψ ( a , b ) = a + b a 2 + b 2
Subsequently, the KKT conditions can constitute a system of nonlinear equations. Then, by incorporating the KKT conditions of all market participants as constraints into the upper-level optimization problem, the bi-level game-theoretic model is reformulated as a single-level optimization formulation. Finally, based on Equations (25) and (26), the transformed single-level optimization problem is solved by employing genetic algorithms. This computational procedure yields the equilibrium solutions of the bi-level game-theoretic framework, encompassing both the optimal cloud storage leasing price in the upper-level game and the market equilibrium state derived from the lower-level non-cooperative game formulation.

5. Simulation and Analysis

5.1. Parameter Setting

This paper investigates the competitive scenario where multiple emerging energy aggregators jointly participate in electricity market operations, which necessitates governmental authorization for market access eligibility. Furthermore, each market entity is required to possess adequate capacity to engage in electricity market competition. Given that the research focuses on three emerging energy aggregators—EVA, LA, and CESSO—and considering the current global development status of electric vehicles, demand response, and energy storage systems, the controllable resource capacities of these aggregators typically range from 10 WM to 100 WM [36]. This capacity range aligns with the characteristic parameters of small-to-medium electricity markets. Consequently, both the market assumptions established in this study and the subsequent numerical case analyses are developed under the framework of moderately liberalized small-to-medium electricity markets. Therefore, in this context, we establish a competitive electricity market environment comprising two conventional generators, an EVA, a CESSO, and an LA. Based on comprehensive cost analyses of conventional thermal power producers, their generation cost coefficients primarily consist of a (quadratic term), b (linear term), and c (constant term). For computational simplification, the constant term coefficient c can be neglected in this formulation.
Based on the application context described above, the maximum bidding capacity for conventional generators in small- and medium-sized electricity markets generally ranges from 50 to 300 MW. In accordance with this operational constraint and reference [19], the fundamental parameters of the two conventional generators in this study are configured as presented in Table 1.
The upper charge/discharge limits p ¯ in and p ¯ out of the EVA-controlled EV cluster at each moment are set as 25 WM, the total effective capacity of cluster batteries, s ¯ cap = 50 WMh. The charge/discharge conversion factors of EVs are 0.85. The probability distributions of uncertainty for EV clusters in EVA differ to some extent according to different types of users. For the sake of convenience, they are set as ref. [34]. v LA , t and ξ LA , t are fixed and set as 120 and 0.2. The maximum load demand L LA max = 150 WM. Considering the described framework, a Stackelberg game process exists between LA and end-users, where heterogeneous demand response behaviors emerge. The probability distribution parameters for user DR in LA are similarly adopted from ref. [34].
CESSOs must account for energy storage system losses during operation, which primarily stem from energy conversion during charging/discharging processes. Additionally, battery self-discharge effects contribute to capacity degradation and accelerate electrochemical aging. Building upon the parameter configuration of traditional generation companies in highly deregulated market environments, and with reference to the data from [23], the operational parameters of CESSOs are detailed in Table 2.

5.2. Analysis of Operational Results Under Different Scenarios

To verify the effectiveness and superiority of the proposed method, five different sets of arithmetic scenarios are set up for comparative, as follows:
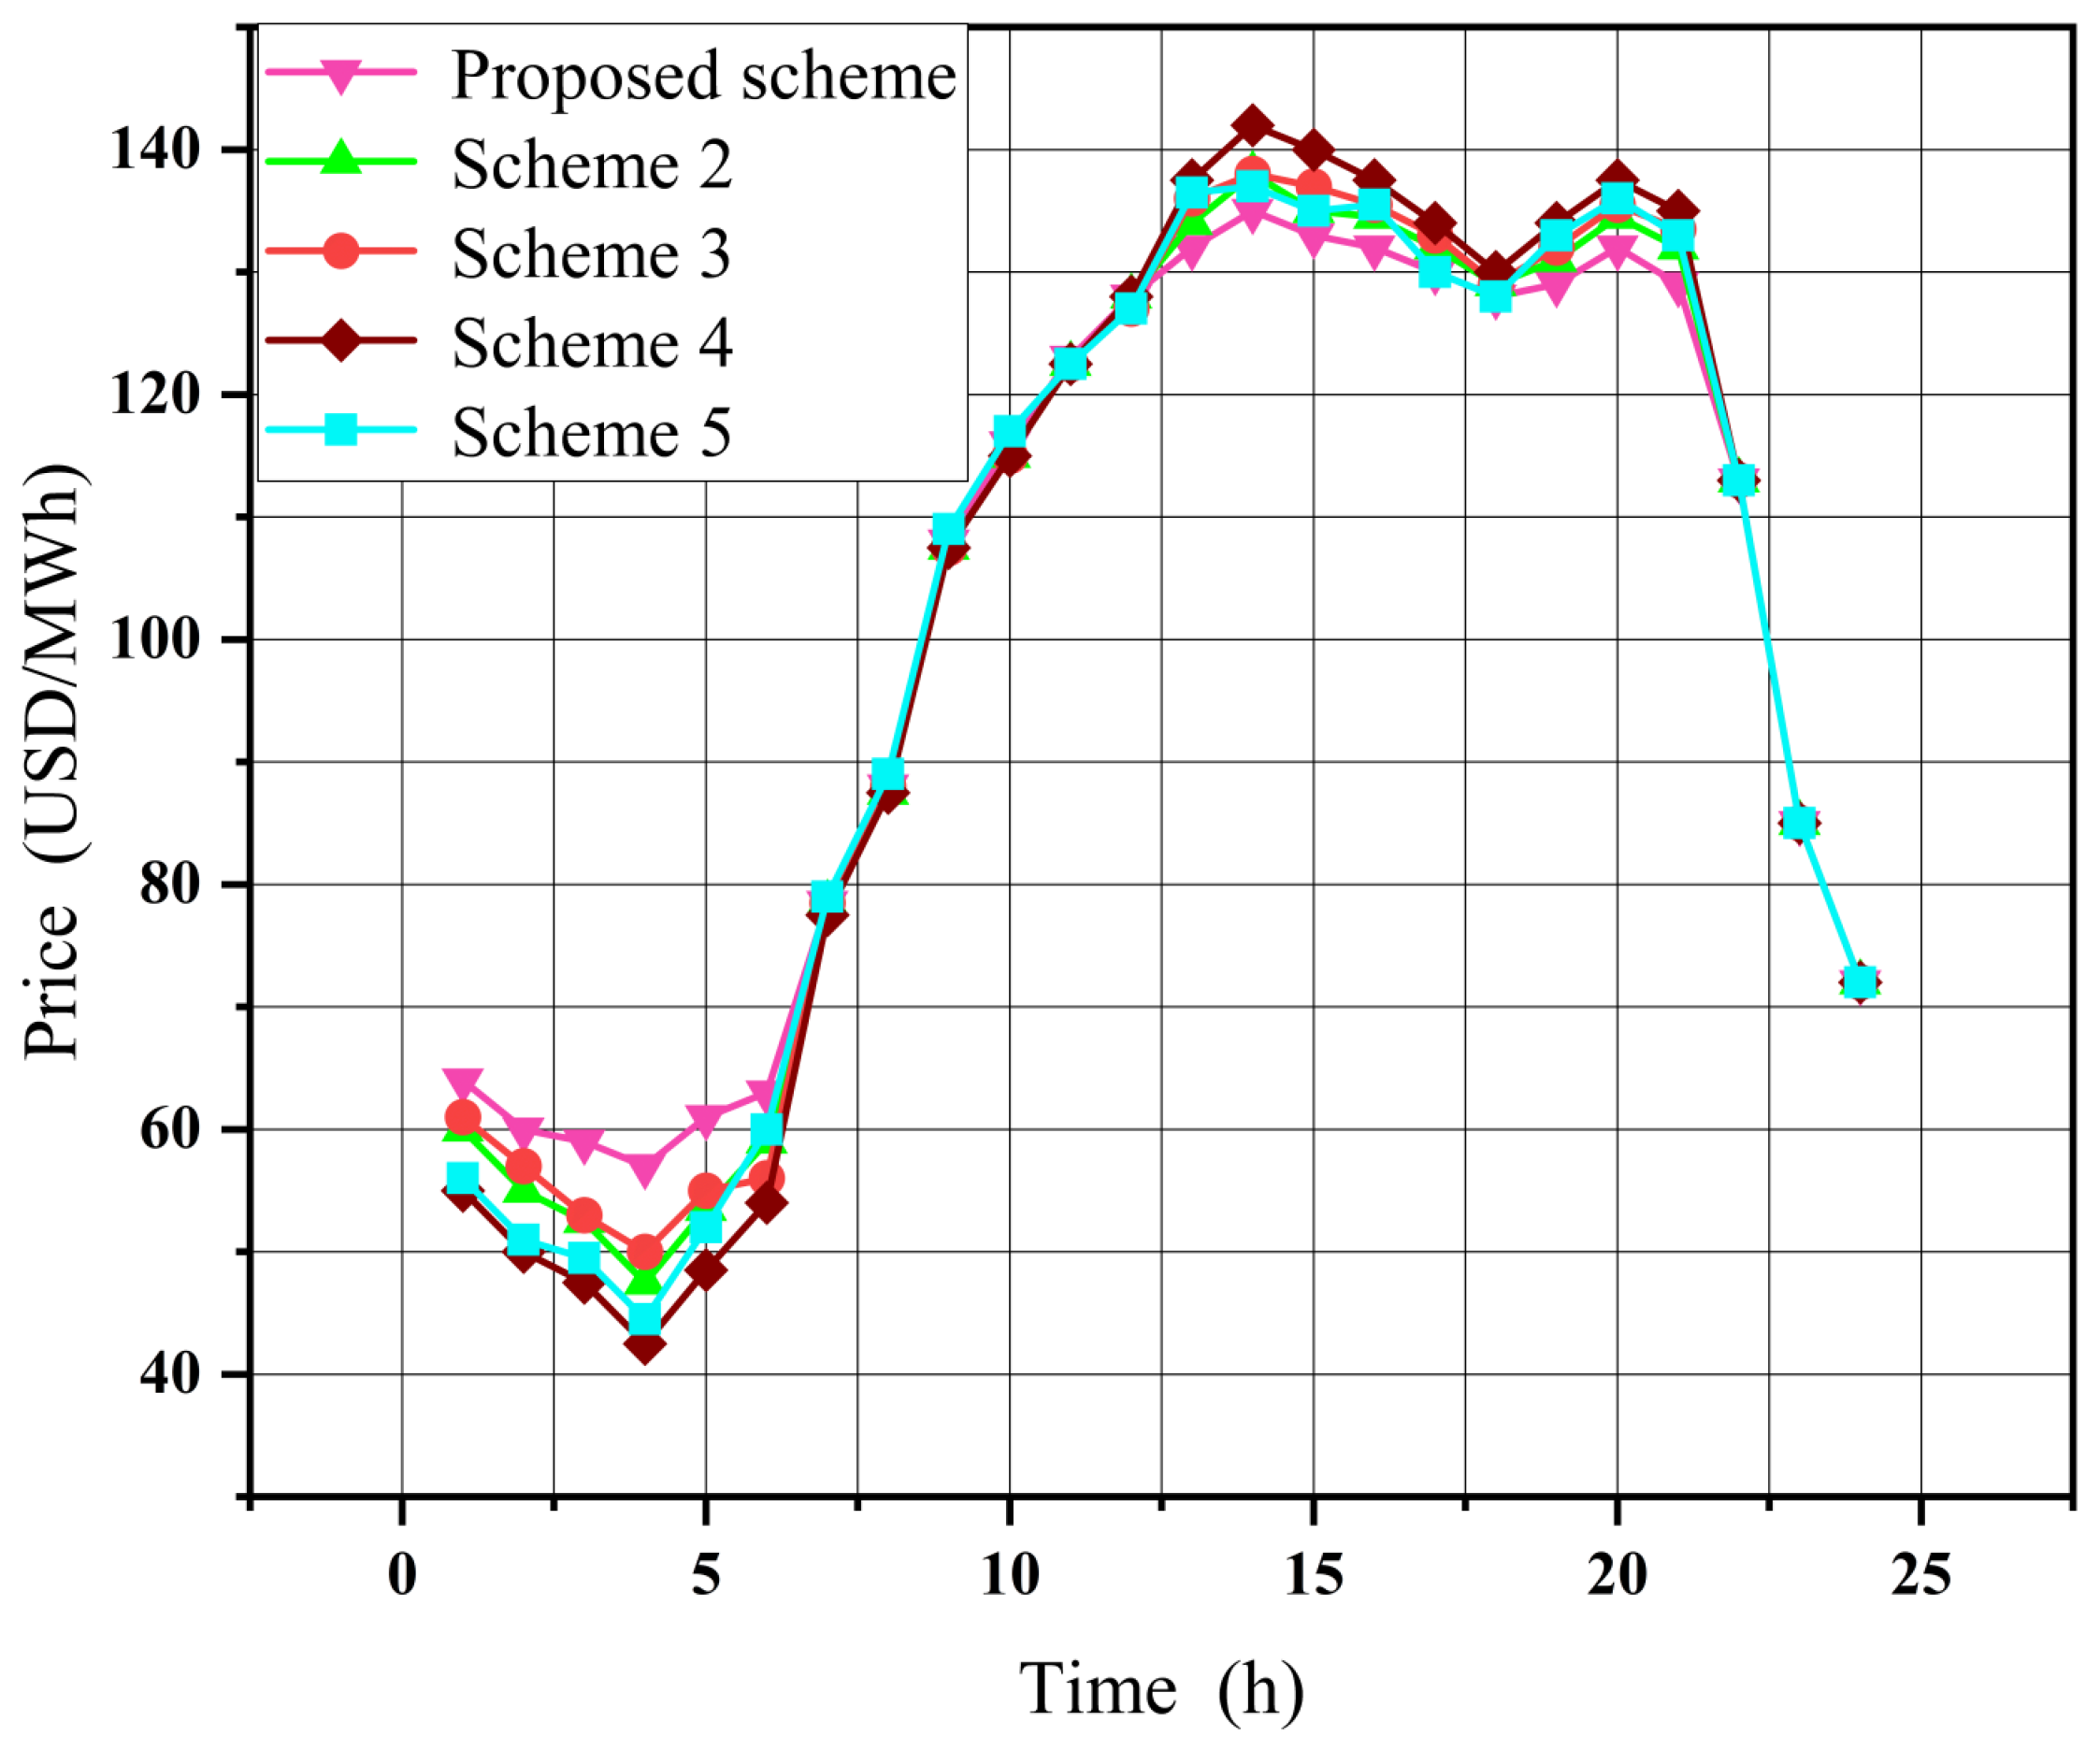
  • Proposed scheme: EVA, LA, and CESSO participate in a competition in the electricity market, and CESSO rents out cloud energy storage services to EVA and LA to help the two market players to mitigate the impacts of the uncertainty.
  • Scheme 2: EVA, LA, and CESSO participate in the competition in the electricity market, but they do not interfere with each other, and CESSO does not rent cloud energy storage services to other interested parties.
  • Scheme 3: EVA and LA compete together in the electricity market.
  • Scheme 4: EVA and CESSO compete in the electricity market together and CESSO and EVA do not interfere with each other; CESSO does not lease cloud energy storage services to EVA.
  • Scheme 5: LA and CESSO compete in the electricity market together and they do not interfere with each other. CESSO does not lease cloud energy storage services to LA.
Following the solution procedure outlined in Section 4.6, the proposed methodology allows for the determination of all market participants’ economic benefits and the calculation of expected penalty costs for EVA and LA, under the technical condition that CESSO assists in mitigating bidding uncertainties associated with EVA and LA operations. The results are shown in Table 3.
Compared with Scheme 2, the profits of traditional generators in the proposed scheme have decreased, whereas the profits of EVA, LA, and CESSO increased by approximately 10.38%, 8.65%, and 39.47%, respectively. This phenomenon primarily arises from CESSO’s provision of cloud storage services to EVA and LA, which enhances their strategic flexibility in market bidding operations. Specifically, EVA can employ large-scale electricity procurement during off-peak pricing periods and strategically release stored energy during peak demand periods. The CESSO cloud ES service effectively amplifies the market competitiveness of these participants, consequently diminishing the profit margins of conventional generators. Notably, both EVA and LA achieve zero expected penalty costs under the proposed scheme, demonstrating that cloud ES implementation successfully eliminates additional expenses associated with scheduling uncertainties for both entities.
The following analysis examines scenarios where multiple energy aggregators with different portfolio configurations participate in electricity market competition. When the CESSO’s cloud energy storage leasing service is excluded from consideration and only non-cooperative game interactions exist among market participants, the market equilibrium solution can be derived by simultaneously solving the equation set of (28)–(44) according to the solution methodology described in Section 4.6. This requires the removal of cloud energy storage leasing cost terms from each market participant’s decision-making model. Subsequently, the equilibrium solution under this configuration can be determined by employing the nonlinear complementarity method combined with a genetic algorithm. The detailed optimization results for this scenario are presented in Table 4.
As shown in Table 4, Schemes 3–5 each contain an energy aggregation entity that abstains from market participation. While these three schemes demonstrate improved profitability for individual participants compared to Scheme 2, none surpass Scheme 2 in terms of overall social welfare, with the other three schemes exhibiting 1.3%, 1.4%, and 1.7% lower overall social welfare than Scheme 2, respectively. This discrepancy stems from the market power wielded by EVA, LA, and CESSO, which enables strategic electricity price depression during specific market intervals. Although this pricing strategy benefits individual participants, it fails to optimize collective social welfare. The observed phenomenon suggests that the strategic withholding of particular market actors creates suboptimal resource allocation patterns.

5.3. Impact of Energy Aggregation Agents on Market Equilibrium Prices

The electricity market equilibrium prices under different scenarios can be determined through the integration of the solution methodology outlined in Section 4.6 and the modeling approach presented in Section 5.2 for cases excluding CESSO’s cloud energy storage leasing service. These equilibrium price results, corresponding to various operational scenarios, are graphically depicted in Figure 5.
As shown in Figure 5, the proposed scheme demonstrates superior market influence when three types of energy aggregators participate concurrently in market competition, particularly when EVA and LA utilize cloud storage services for uncertainty mitigation. This configuration achieves optimal peak shaving and valley filling performance while maximizing social welfare enhancement. In contrast, comparative schemes exhibit diminished market effectiveness due to insufficient participation of key market actors, resulting in suboptimal utilization of available market mechanisms.
During the periods of 06:00–08:00 and 22:00–24:00, electricity market equilibrium prices exhibit convergence across all considered scenarios. This convergence stems from the characteristic low consumer demand and diminished system load levels during these off-peak intervals. Under such conditions, market participants encounter heightened challenges in exercising market power due to reduced price elasticity of demand. Within the proposed framework, both EVA and LA experience reduced operational constraints from uncertainty factors during low-demand periods, thereby decreasing their dependence on CESSO’s cloud storage services. Consequently, the strategic behaviors observed in Scenarios 3–5 demonstrate alignment with those in Scenario 2.
In conclusion, the coordinated participation of user-side energy aggregators establishes a market mechanism that enhances competitive dynamics. This structure effectively stimulates participation from latent market players while mitigating the dominant position of traditional generation companies, thereby improving overall social welfare. The demonstrated mechanisms hold significant implications for fostering sustainable evolution in electricity market structures through enhanced demand-side flexibility integration.

6. Conclusions

This paper investigates the strategic interactions of emerging energy aggregators—including EVA, LA, and CESSO—in electricity markets. A bi-level game-theoretic model is developed to analyze market equilibrium outcomes, explicitly considering the uncertainties in EVA and LA bidding strategies. The model captures both cooperative and competitive relationships between EVA/LA and CESSO, while revealing the mutual influence between cloud storage leasing prices and competition strategies.
The upper-level problem employs a bargaining game framework to determine cloud storage leasing prices between EVA/LA and CESSO. The lower-level formulates a multi-period non-cooperative game in the day-ahead electricity market, where EVA, LA, CESSO, and conventional generators act as price-making participants. Through comparative case studies, the following conclusions are obtained:
(1)
The proposed cloud storage leasing mechanism effectively reduces bidding deviations of EVA and LA, thereby enhancing their market competitiveness. Compared with independent market participation by EVA, LA, and CESSO, the collaborative scheme increases profits by 10.38%, 8.65%, and 39.47% for the three parties, respectively, demonstrating their willingness to establish leasing agreements.
(2)
When CESSO participates in electricity market competition within a non-cooperative game framework while refraining from providing cloud energy storage leasing services to other market participants, its market power demonstrates a significant decline. Compared with the scenario where cloud energy storage leasing services are commercially available, under the independent operation mode, the profit margins of all market entities (including CESSO itself) exhibit measurable reductions. This empirical evidence suggests that introducing cloud energy storage leasing services into non-cooperative game-theoretic electricity markets can yield Pareto improvements among multiple stakeholders.
(3)
The three types of emerging energy aggregation entities proposed in this study exhibit discernible market power when participating in electricity market competition. By employing their respective arbitrage strategies, these entities collectively contribute to peak shaving and valley filling effects on electricity prices. This mechanism effectively diminishes the market dominance of conventional power generators. Moreover, the mutually constraining interactions among these entities demonstrate significant potential for enhancing social welfare and promoting sustainable development in electricity markets.
The findings of this study hold practical significance for multiple stakeholders. Electricity market regulatory agencies can utilize the multi-agent game-theoretic competition model developed in this study, along with the corresponding market equilibrium analysis outcomes, to establish more effective market access criteria and regulatory frameworks. This approach ensures enhanced market openness while maintaining operational reliability and stability. Emerging market participants may leverage research findings to evaluate their competitiveness in liberalized electricity markets and refine their strategic decision-making processes during market engagements. Furthermore, participants with significant output volatility can adopt the proposed cooperative mechanisms to collaborate with other market entities, thereby mitigating uncertainty impacts and offsetting potential economic losses arising from generation intermittency.
This study has certain limitations that warrant further investigation. Specifically, the analysis of three emerging energy aggregation entities participating in electricity market competition solely considers their roles as price makers. In practice, market participants with limited influence can only act as price takers. Therefore, future research should aim to extend the framework by incorporating scenarios in which market entities act as price takers, with a particular focus on conducting comparative analyses with the price maker paradigm. Furthermore, in modern power systems, renewable energy generators represent a crucial category of market participants that were not addressed in this work. Subsequent studies should, in particular, provide consideration of the integration of renewable energy generation into the analytical framework, with a focus on investigating the associated challenges and potential cooperative mechanisms among diverse market entities.

Author Contributions

Conceptualization, Z.S. and J.Y.; methodology, Z.S. and C.Y.; software, R.P. and C.Y.; validation, Z.S., J.Y. and C.Y.; formal analysis, Z.S. and R.P.; investigation, Z.S. and R.P.; writing—original draft preparation, Z.S., C.Y. and X.C.; writing—review and editing, J.Y., C.Y. and X.C.; supervision, X.C. and C.Y.; project administration, J.Y.; funding acquisition, C.Y. and X.C. All authors have read and agreed to the published version of the manuscript.

Funding

This research is supported in part by the Natural Science Foundation of Guangdong Province under Grants 2023A1515011290, 2024A1515011701, 2024A1515012745 and 2025A1515012994.

Data Availability Statement

The original contributions presented in this study are included in the article. Further inquiries can be directed to the corresponding author(s).

Conflicts of Interest

The authors declare no conflict of interest.

References

  1. Sarker, M.R.; Dvorkin, Y.; Ortega-Vazquez, M.A. Optimal Participation of an Electric Vehicle Aggregator in Day-Ahead Energy and Reserve Markets. IEEE Trans. Power Syst. 2016, 31, 3506–3515. [Google Scholar] [CrossRef]
  2. Shafie-Khah, M.; Moghaddam, M.P.; Sheikh-El-Eslami, M.K.; Catalão, J.P.S. Optimised performance of a plug-in electric vehicle aggregator in energy and reserve markets. Energy Convers. Manag. 2015, 97, 393–408. [Google Scholar] [CrossRef]
  3. Cao, Y.; Huang, L.; Li, Y.; Kittisak, J.; Ahmadi-Nezamabad, H. Optimal scheduling of electric vehicles aggregator under market price uncertainty using robust optimization technique. Int. J. Electr. Power Energy Syst. 2019, 117, 105628. [Google Scholar] [CrossRef]
  4. Liu, J.; Zhang, N.; Kang, C. Research Framework and Basic Models for Cloud Energy Storage in Power System. Proc. CSEE 2017, 37, 3361–3371+3663. [Google Scholar]
  5. Liu, J.; Zhang, N.; Kang, C.; Kirschen, D.S.; Xia, Q. Decision-Making Models for the Participants in Cloud Energy Storage. IEEE Trans. Smart Grid 2018, 9, 5512–5521. [Google Scholar] [CrossRef]
  6. Zeng, K.; Liu, J.; Wang, H.; Zhou, Y.; Zhou, S. The Improved Model of the Deep Peak Regulation Market Considering the Load Aggregator Participation. IOP Conf. Ser. Earth Environ. Sci. 2021, 811, 012015. [Google Scholar] [CrossRef]
  7. Vaya, M.G.; Andersson, G. Optimal bidding strategy of a plug-in electric vehicle aggregator in day-ahead electricity markets. In Proceedings of the 10th International Conference on European Energy Market, Stockholm, Sweden, 27–31 May 2013. [Google Scholar]
  8. Yang, H.; Zhang, S.; Jing, Q.; Qiu, D.; Lai, M.; Dong, Z. CVaR-Constrained Optimal Bidding of Electric Vehicle Aggregators in Day-Ahead and Real-Time Markets. IEEE Trans. Ind. Inform. 2017, 13, 2555–2565. [Google Scholar] [CrossRef]
  9. Yao, E.; Wong, V.; Schober, R. Optimization of Aggregate Capacity of PEVs for Frequency Regulation Service in Day-Ahead Market. IEEE Trans. Smart Grid 2018, 9, 3519–3529. [Google Scholar] [CrossRef]
  10. Hasan, M.M.; Rahman, M.A.; Manshaei, M.H.; Saad, W. A Game-Theoretic Analysis of Pricing Competition Between Aggregators in V2G Systems. In Proceedings of the 2019 IEEE 43rd Annual Computer Software and Applications Conference (COMPSAC), Milwaukee, WI, USA, 15–19 July 2019. [Google Scholar]
  11. Rahmani-Andebili, M. Spinning reserve supply with presence of electric vehicles aggregator considering compromise between cost and reliability. IET Gener. Transm. Distrib. 2013, 7, 1442–1452. [Google Scholar] [CrossRef]
  12. Rahmani-Andebili, M.; Venayagamoorthy, G. Investigating effects of changes in power market regulations on demand-side resources aggregators. In Proceedings of the 2015 IEEE Power & Energy Society General Meeting, Denver, CO, USA, 26–30 July 2015. [Google Scholar]
  13. Wu, H.; Shahidehpour, M.; Alabdulwahab, A.; Abusorrah, A. A Game Theoretic Approach to Risk-Based Optimal Bidding Strategies for Electric Vehicle Aggregators in Electricity Markets with Variable Wind Energy Resources. IEEE Trans. Sustain. Energy 2017, 7, 374–385. [Google Scholar] [CrossRef]
  14. Beaudin, M.; Zareipour, H.; Schellenberg, A.; Rosehart, W. Energy Storage for Mitigating the Variability of Renewable Electricity Sources. In Energy Storage for Smart Grids; Academic Press: Oxford, UK, 2015; pp. 1–33. [Google Scholar]
  15. Wang, Q.; Zhang, C.; Ding, Y.; Xydis, G.; Wang, J.H.; Østergaard, J. Review of real-time electricity markets for integrating Distributed Energy Resources and Demand Response. Appl. Energy 2015, 138, 695–706. [Google Scholar] [CrossRef]
  16. Liu, J.; Zhang, N.; Kang, C.; Kirschen, D.; Xia, Q. Cloud energy storage for residential and small commercial consumers: A business case study. Appl. Energy 2017, 188, 226–236. [Google Scholar] [CrossRef]
  17. Liu, Z.; Yang, J.; Song, W.; Xue, N.; Li, S.; Fang, M. Research on cloud energy storage service in residential microgrids. IET Renew. Power Gener. 2019, 13, 3097–3105. [Google Scholar] [CrossRef]
  18. Nagill, N.; Reddy K., S.; Kumar, R.; Panigrahi, B.K. Feasibility analysis of heterogeneous energy storage technology for cloud energy storage with distributed generation. J. Eng. 2019, 2019, 4970–4974. [Google Scholar] [CrossRef]
  19. Xia, Y.; Xu, Q.; Zhao, J.; Yuan, X. Two-stage robust optimisation of user-side cloud energy storage configuration considering load fluctuation and energy storage loss. IET Gener. Transm. Distrib. 2020, 14, 3278–3287. [Google Scholar] [CrossRef]
  20. Verkade, N.; Johanna, H. Collective Energy Practices: A Practice-Based Approach to Civic Energy Communities and the Energy System. Sustainability 2019, 11, 3230. [Google Scholar] [CrossRef]
  21. Hoffman, S.; High-Pippert, A. From private lives to collective action: Recruitment and participation incentives for a community energy program. Energy Policy 2010, 38, 7567–7574. [Google Scholar] [CrossRef]
  22. van Summeren, L.F.; Wieczorek, A.J.; Bombaerts, G.J.; Verbong, G.P. Community energy meets smart grids: Reviewing goals, structure, and roles in Virtual Power Plants in Ireland, Belgium and the Netherlands. Energy Res. Soc. Sci. 2020, 63, 101415. [Google Scholar] [CrossRef]
  23. Nguyen, D.; Long, B. Risk-Constrained Profit Maximization for Microgrid Aggregators with Demand Response. IEEE Trans. Smart Grid 2015, 6, 135–146. [Google Scholar] [CrossRef]
  24. Wang, X.; Gong, Y. Air conditioner fast dispatching model based on load aggregator and direct load control. J. Eng. 2017, 2017, 2535–2538. [Google Scholar] [CrossRef]
  25. Zamani, A.; Zakariazadeh, A.; Jadid, S. Day-ahead resource scheduling of a renewable energy based virtual power plant. Appl. Energy 2016, 169, 324–340. [Google Scholar] [CrossRef]
  26. Vuelvas, J.; Ruiz, F.; Gruosso, G. A time-of-use pricing strategy for managing electric vehicle clusters. Sustain. Energy Grids Netw. 2021, 25, 100411. [Google Scholar] [CrossRef]
  27. Amirioun, M.; Kazemi, A. A new model based on optimal scheduling of combined energy exchange modes for aggregation of electric vehicles in a residential complex. Energy 2014, 69, 186–198. [Google Scholar] [CrossRef]
  28. Chao, P.; Zou, J.; Lian, L. Dispatching strategies of electric vehicles participating in frequency regulation on power grid: A review. Renew. Sustain. Energy Rev. 2017, 68, 147–152. [Google Scholar]
  29. Wang, X.; Zhang, H.; Zhang, S. Impacts of joint operation of wind power with electric vehicles and demand response in electricity market. Electr. Power Syst. Res. 2021, 201, 107513. [Google Scholar] [CrossRef]
  30. Kamyab, F.; Amini, M.; Sheykhha, S. Demand response program in smart grid using supply function bidding mechanism. IEEE Trans. Smart Grid 2016, 7, 1277–1284. [Google Scholar] [CrossRef]
  31. Soares, J.; Ghazvini, M.; Borges, N. A stochastic model for energy resources management considering demand response in smart grids. Electr. Power Syst. Res. 2017, 143, 599–610. [Google Scholar] [CrossRef]
  32. Baringo, L.; Amaro, R. A stochastic robust optimization approach for the bidding strategy of an electric vehicle aggregator. Electr. Power Syst. Res. 2017, 146, 362–370. [Google Scholar] [CrossRef]
  33. Chen, T.; Yang, J.; Jiang, W. Optimal configuration of energy storage capacity in wind farms based on cloud energy storage service. IET Renew. Power Gener. 2022, 16, 211–222. [Google Scholar] [CrossRef]
  34. Wen, F.; David, A.K. Optimal bidding strategies and modeling of imperfect information among competitive generators. IEEE Trans. Power Syst. 2001, 16, 15–21. [Google Scholar]
  35. Shafie-Khah, M.; Moghaddam, M.; Sheikh-El-Eslami, M. Modeling of interactions between market regulations and behavior of plug-in electric vehicle aggregators in a virtual power market environment. Energy 2012, 40, 139–150. [Google Scholar] [CrossRef]
  36. Moshari, A.; Ebrahimi, A.; Fotuhi-Firuzabad, M. Short-Term Impacts of DR Programs on Reliability of Wind Integrated Power Systems Considering Demand-Side Uncertainties. IEEE Trans. Power Syst. 2016, 31, 2481–2490. [Google Scholar] [CrossRef]
Figure 1. Basic framework of electricity market under participation of multiple subjects.
Energies 18 02006 g001
Figure 2. Framework of bi-level game model.
Energies 18 02006 g002
Figure 3. Calculation flow chart of schedulable capacity of EV cluster based on Monte Carlo method.
Energies 18 02006 g003
Figure 4. Flow chart of equilibrium model solution.
Energies 18 02006 g004
Figure 5. Equilibrium price of electricity market under different schemes.
Energies 18 02006 g005
Table 1. Parameters of traditional generators.
Generator x g e n i m a x (MW) a g e n i ($/MWh) b g e n i ($/MW2h)
1140101.5
2160151
Table 2. Operating parameters of cloud energy storage facilities.
Operating Parameter x g e n i m a x (MW)
Self-loss factor (%)0.001
Charge/discharge loss factor0.02
Maximum charge/discharge power (MW)60
Cloud Energy Storage Facility Capacity (MWh)100
The peak of the state of charge0.9
The valley of the state of charge0.15
Table 3. Market participants’ profits under service of cloud of energy.
ScenarioProfits of Generator ($)Profits of EVA ($)Expected Penalty Cost of EVA ($)Profits of LA ($)Expected Penalty Cost of LA ($)Profits of CESSO ($)
Proposed scheme98,5628743010,23609827
Scheme 295,321792153294214267046
Table 4. The profit of market members under the participation of different market entities.
ScenarioProfits of Generator 1 ($)Profits of EVA ($)Profits of LA ($)Profits of CESSO ($)Social Welfare ($)
Scheme 295,321792194217046214,827
Scheme 398,672853210,4560212,045
Scheme 499,763883409865211,876
Scheme 597,321099869244211,097
Disclaimer/Publisher’s Note: The statements, opinions and data contained in all publications are solely those of the individual author(s) and contributor(s) and not of MDPI and/or the editor(s). MDPI and/or the editor(s) disclaim responsibility for any injury to people or property resulting from any ideas, methods, instructions or products referred to in the content.

