


Dynamic Investigation of Thermochemical Heat Upgrade and Alternative Industrial Heating Technologies

 ,
,  , , , ,
 and
and 
Abstract
1. Introduction
2. Materials and Methods
2.1. The Examined Industrial Case Study and the Methodology Used
2.2. The Thermochemical Heat Upgrade Design
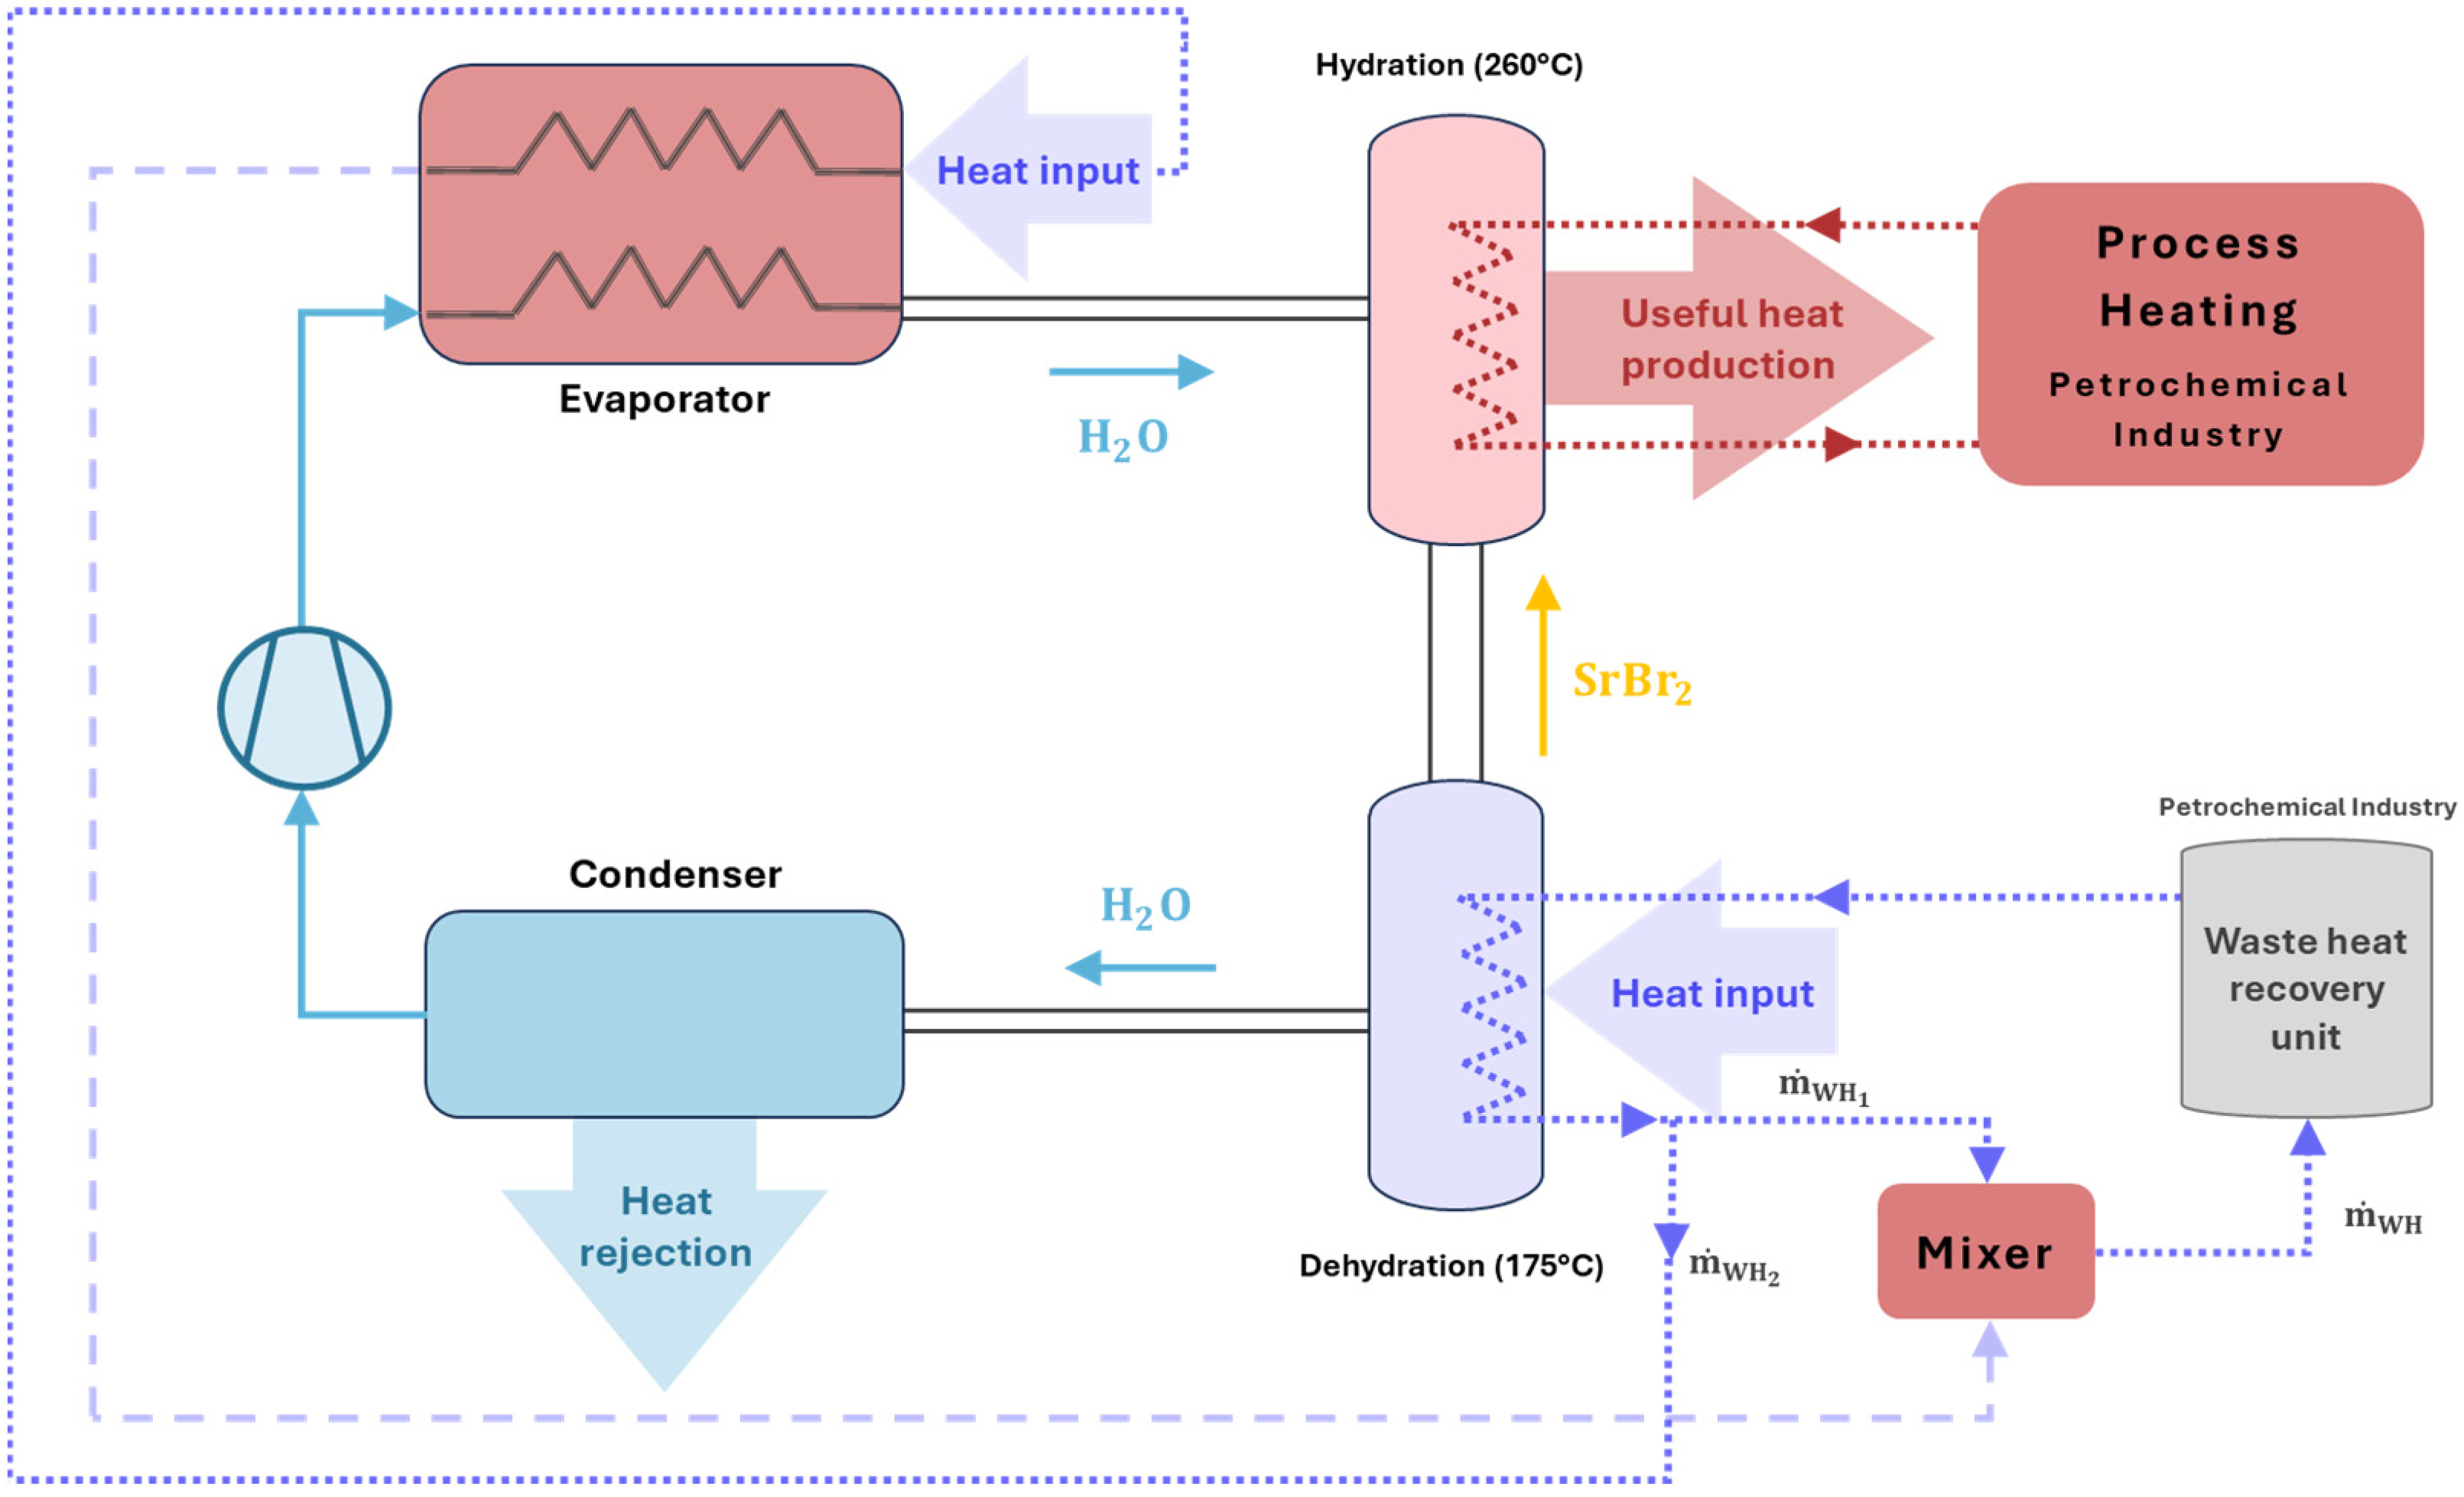
2.2.1. Description of the Thermochemical Configuration
2.2.2. Basic Mathematical Modeling of the Thermochemical Configuration
2.3. Scenario with Natural Gas Boiler
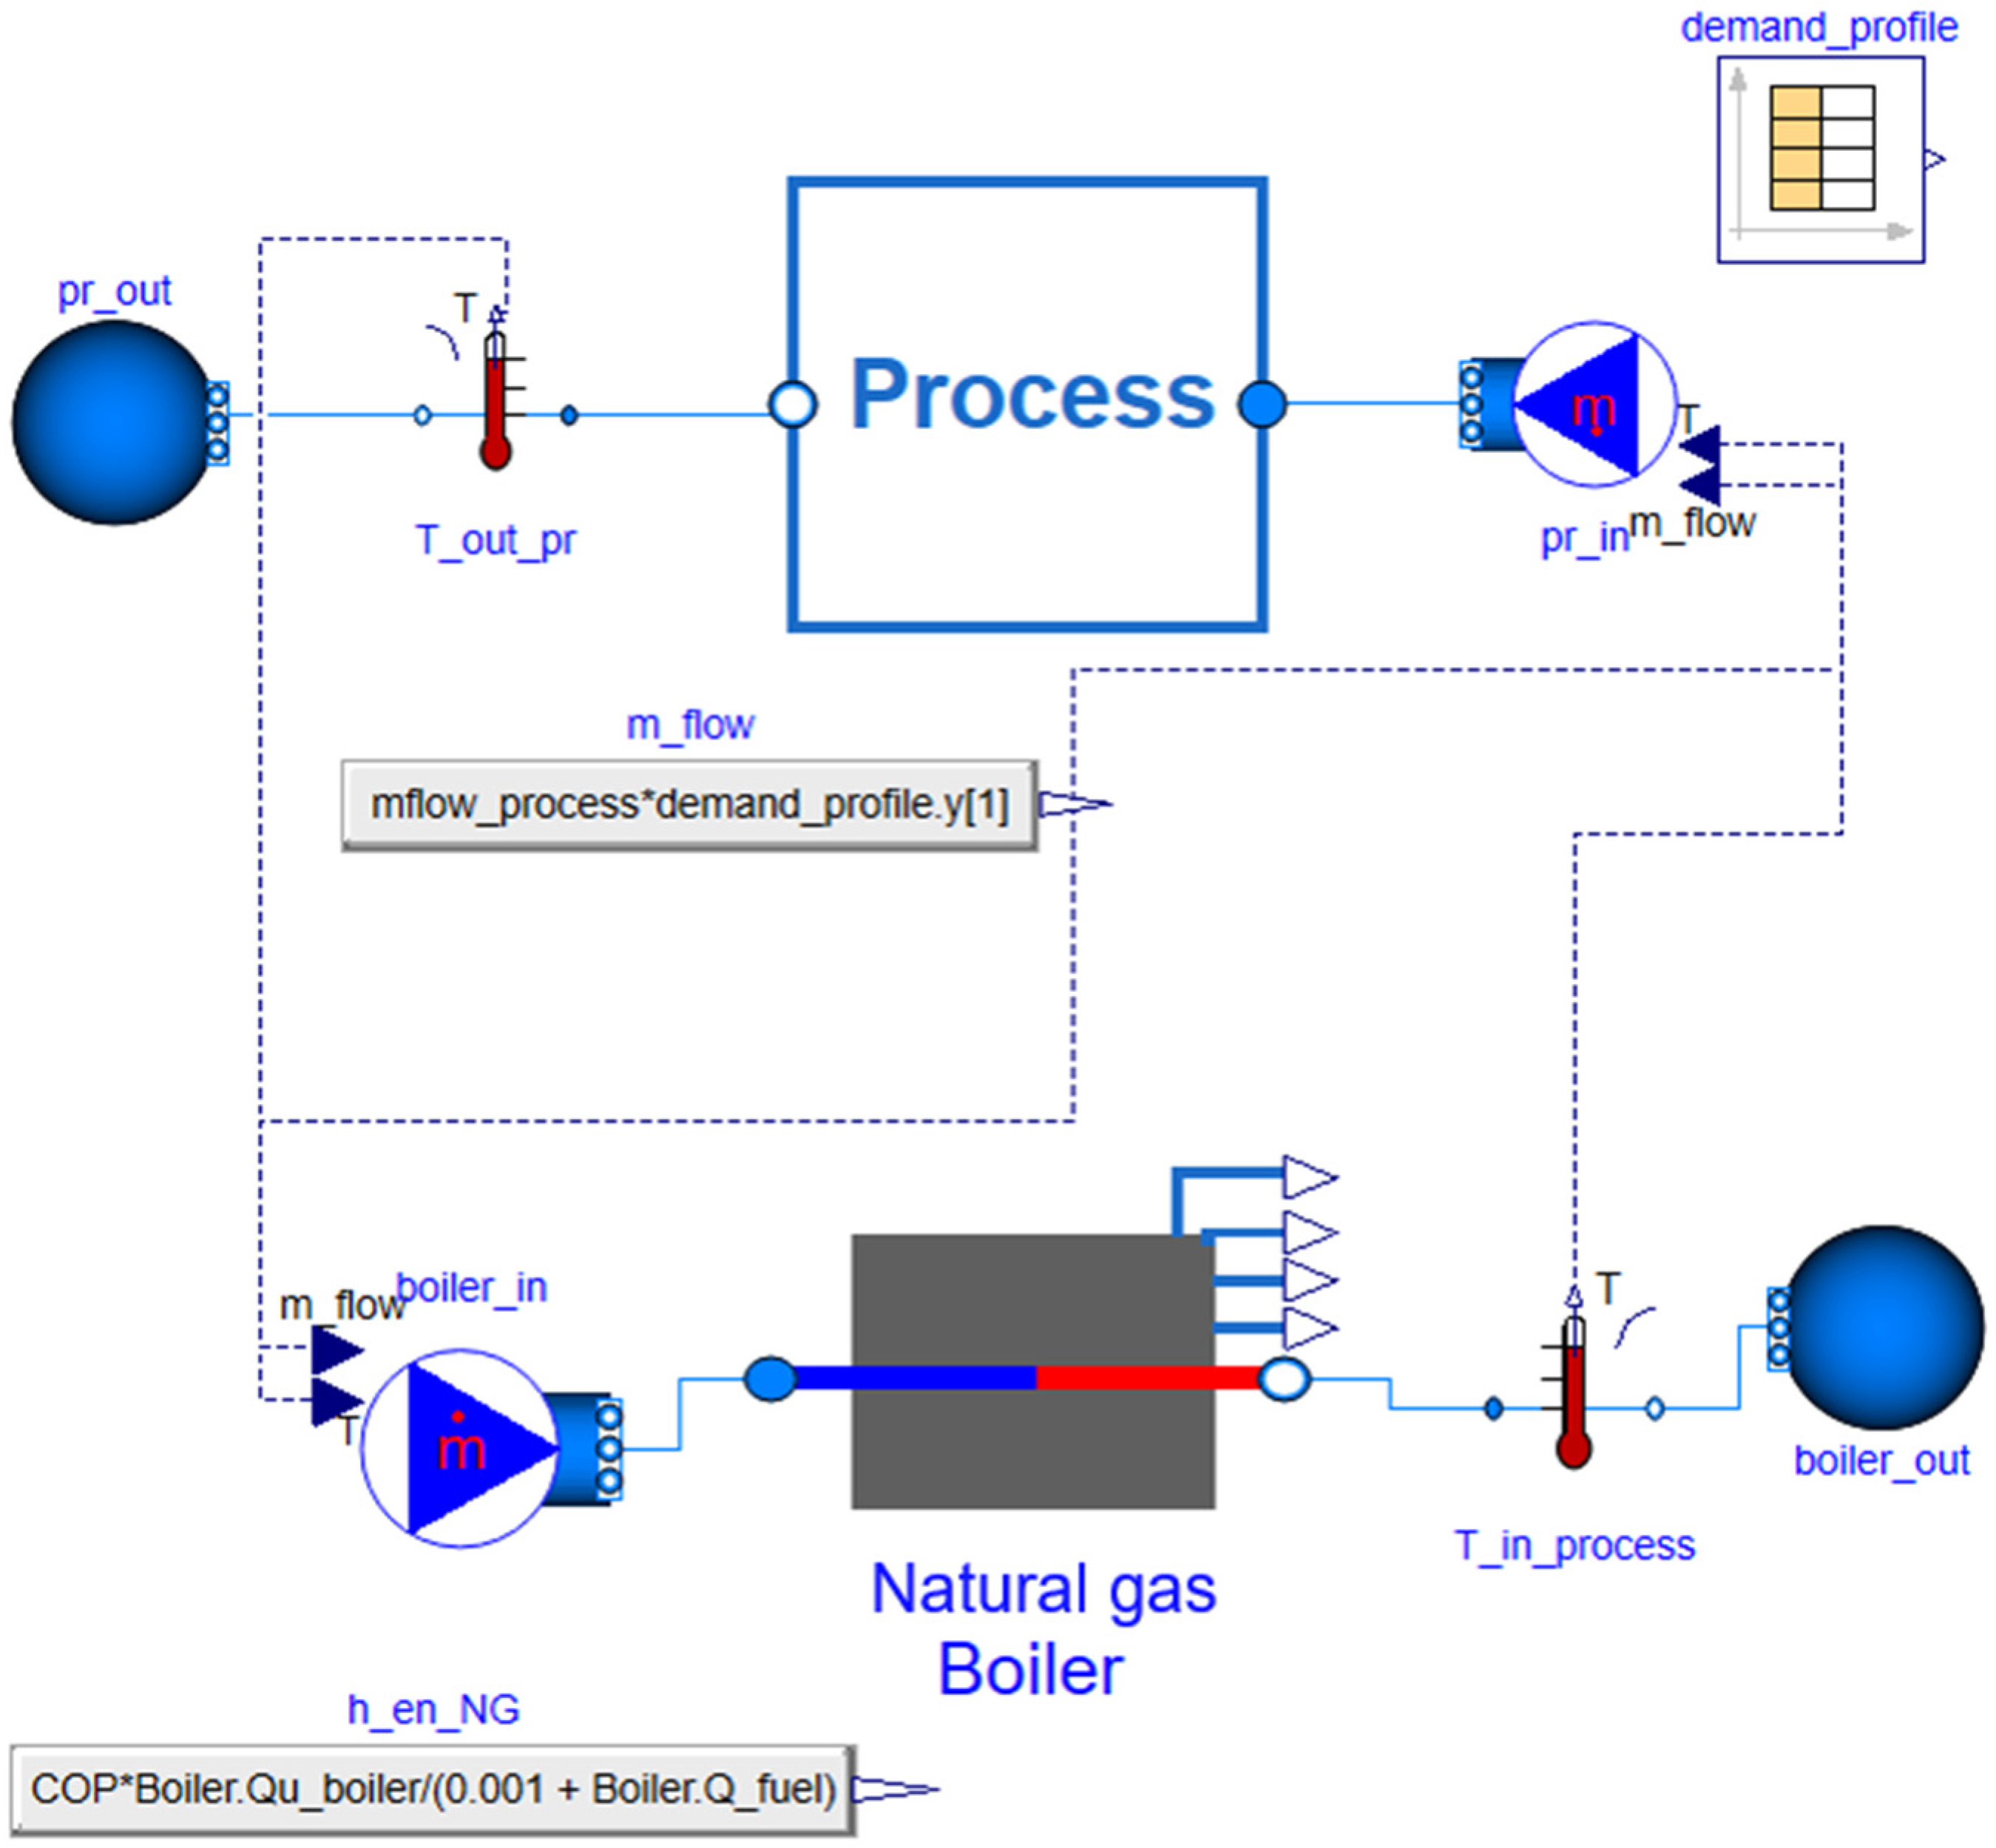
2.3.1. Description of the Natural Gas Boiler Configuration
2.3.2. Basic Mathematical Modeling of the Natural Gas Boiler Configuration
2.4. Scenario with the Hybrid Solar and Auxiliary Natural Gas Boiler System
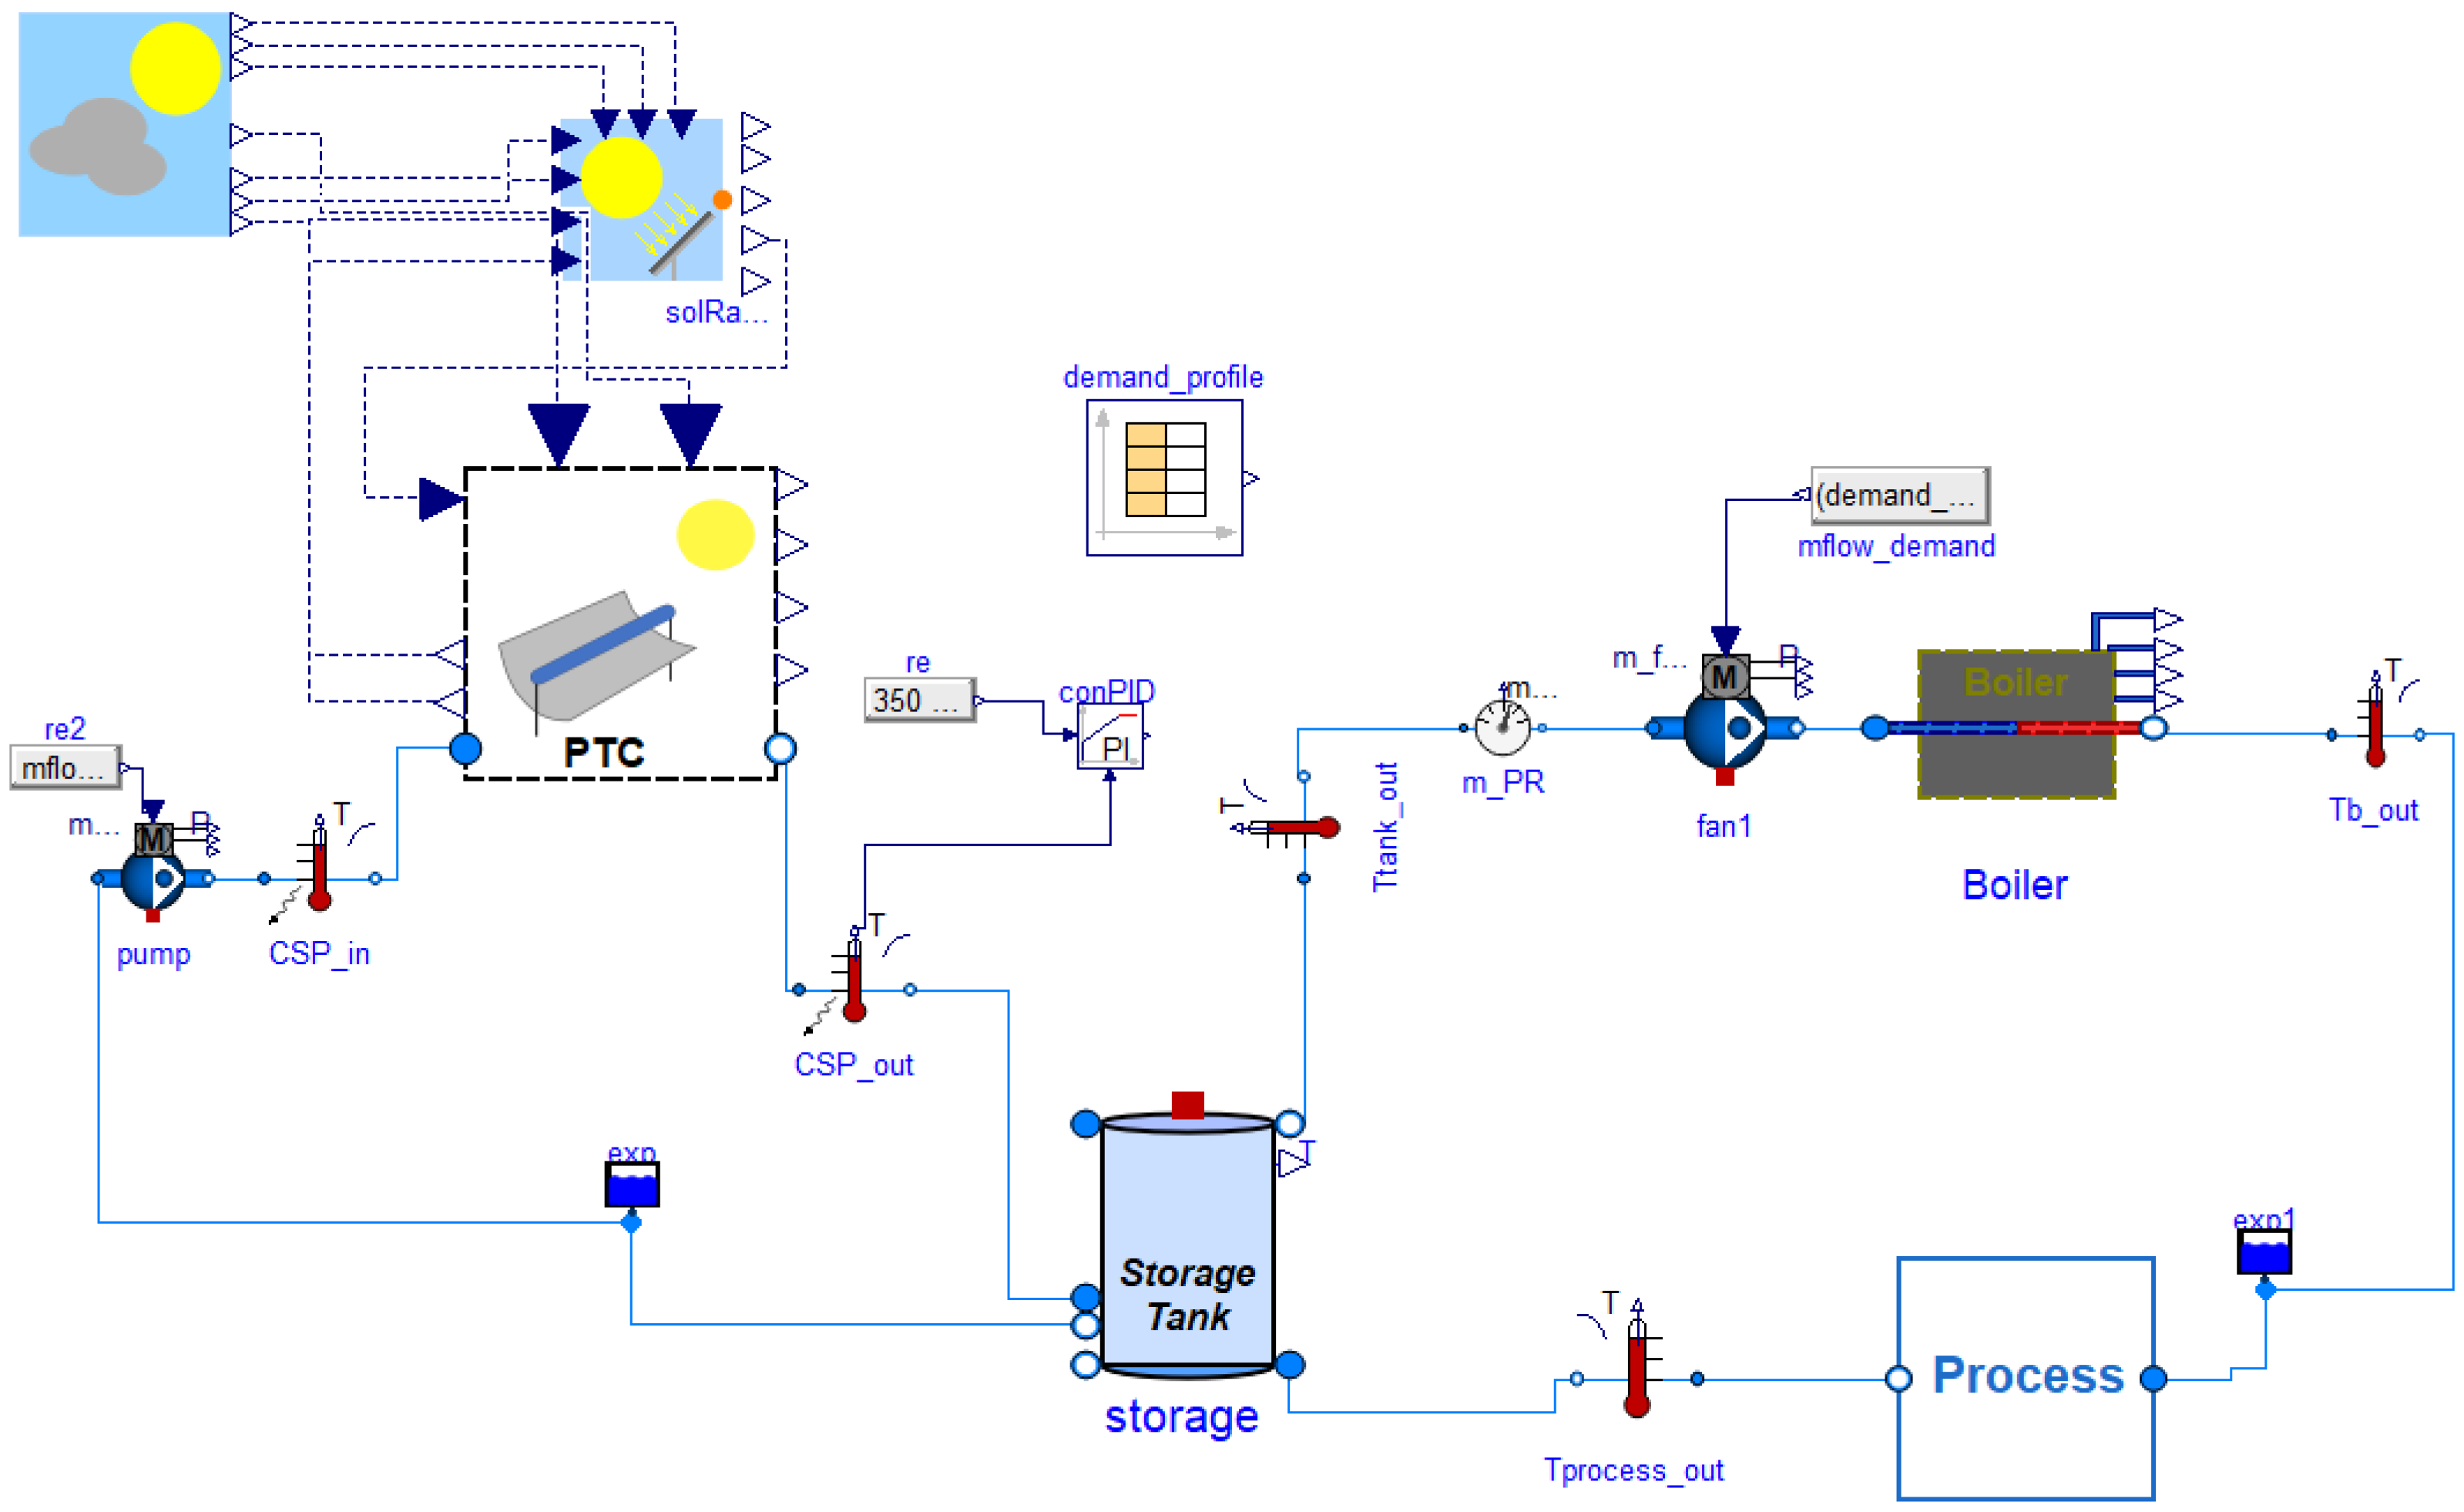
2.4.1. Description of the Hybrid Solar–Gas Boiler Configuration
2.4.2. Basic Mathematical Modeling of the Hybrid Solar–Gas Boiler Configuration
2.5. Scenario with High-Temperature Heat Pump
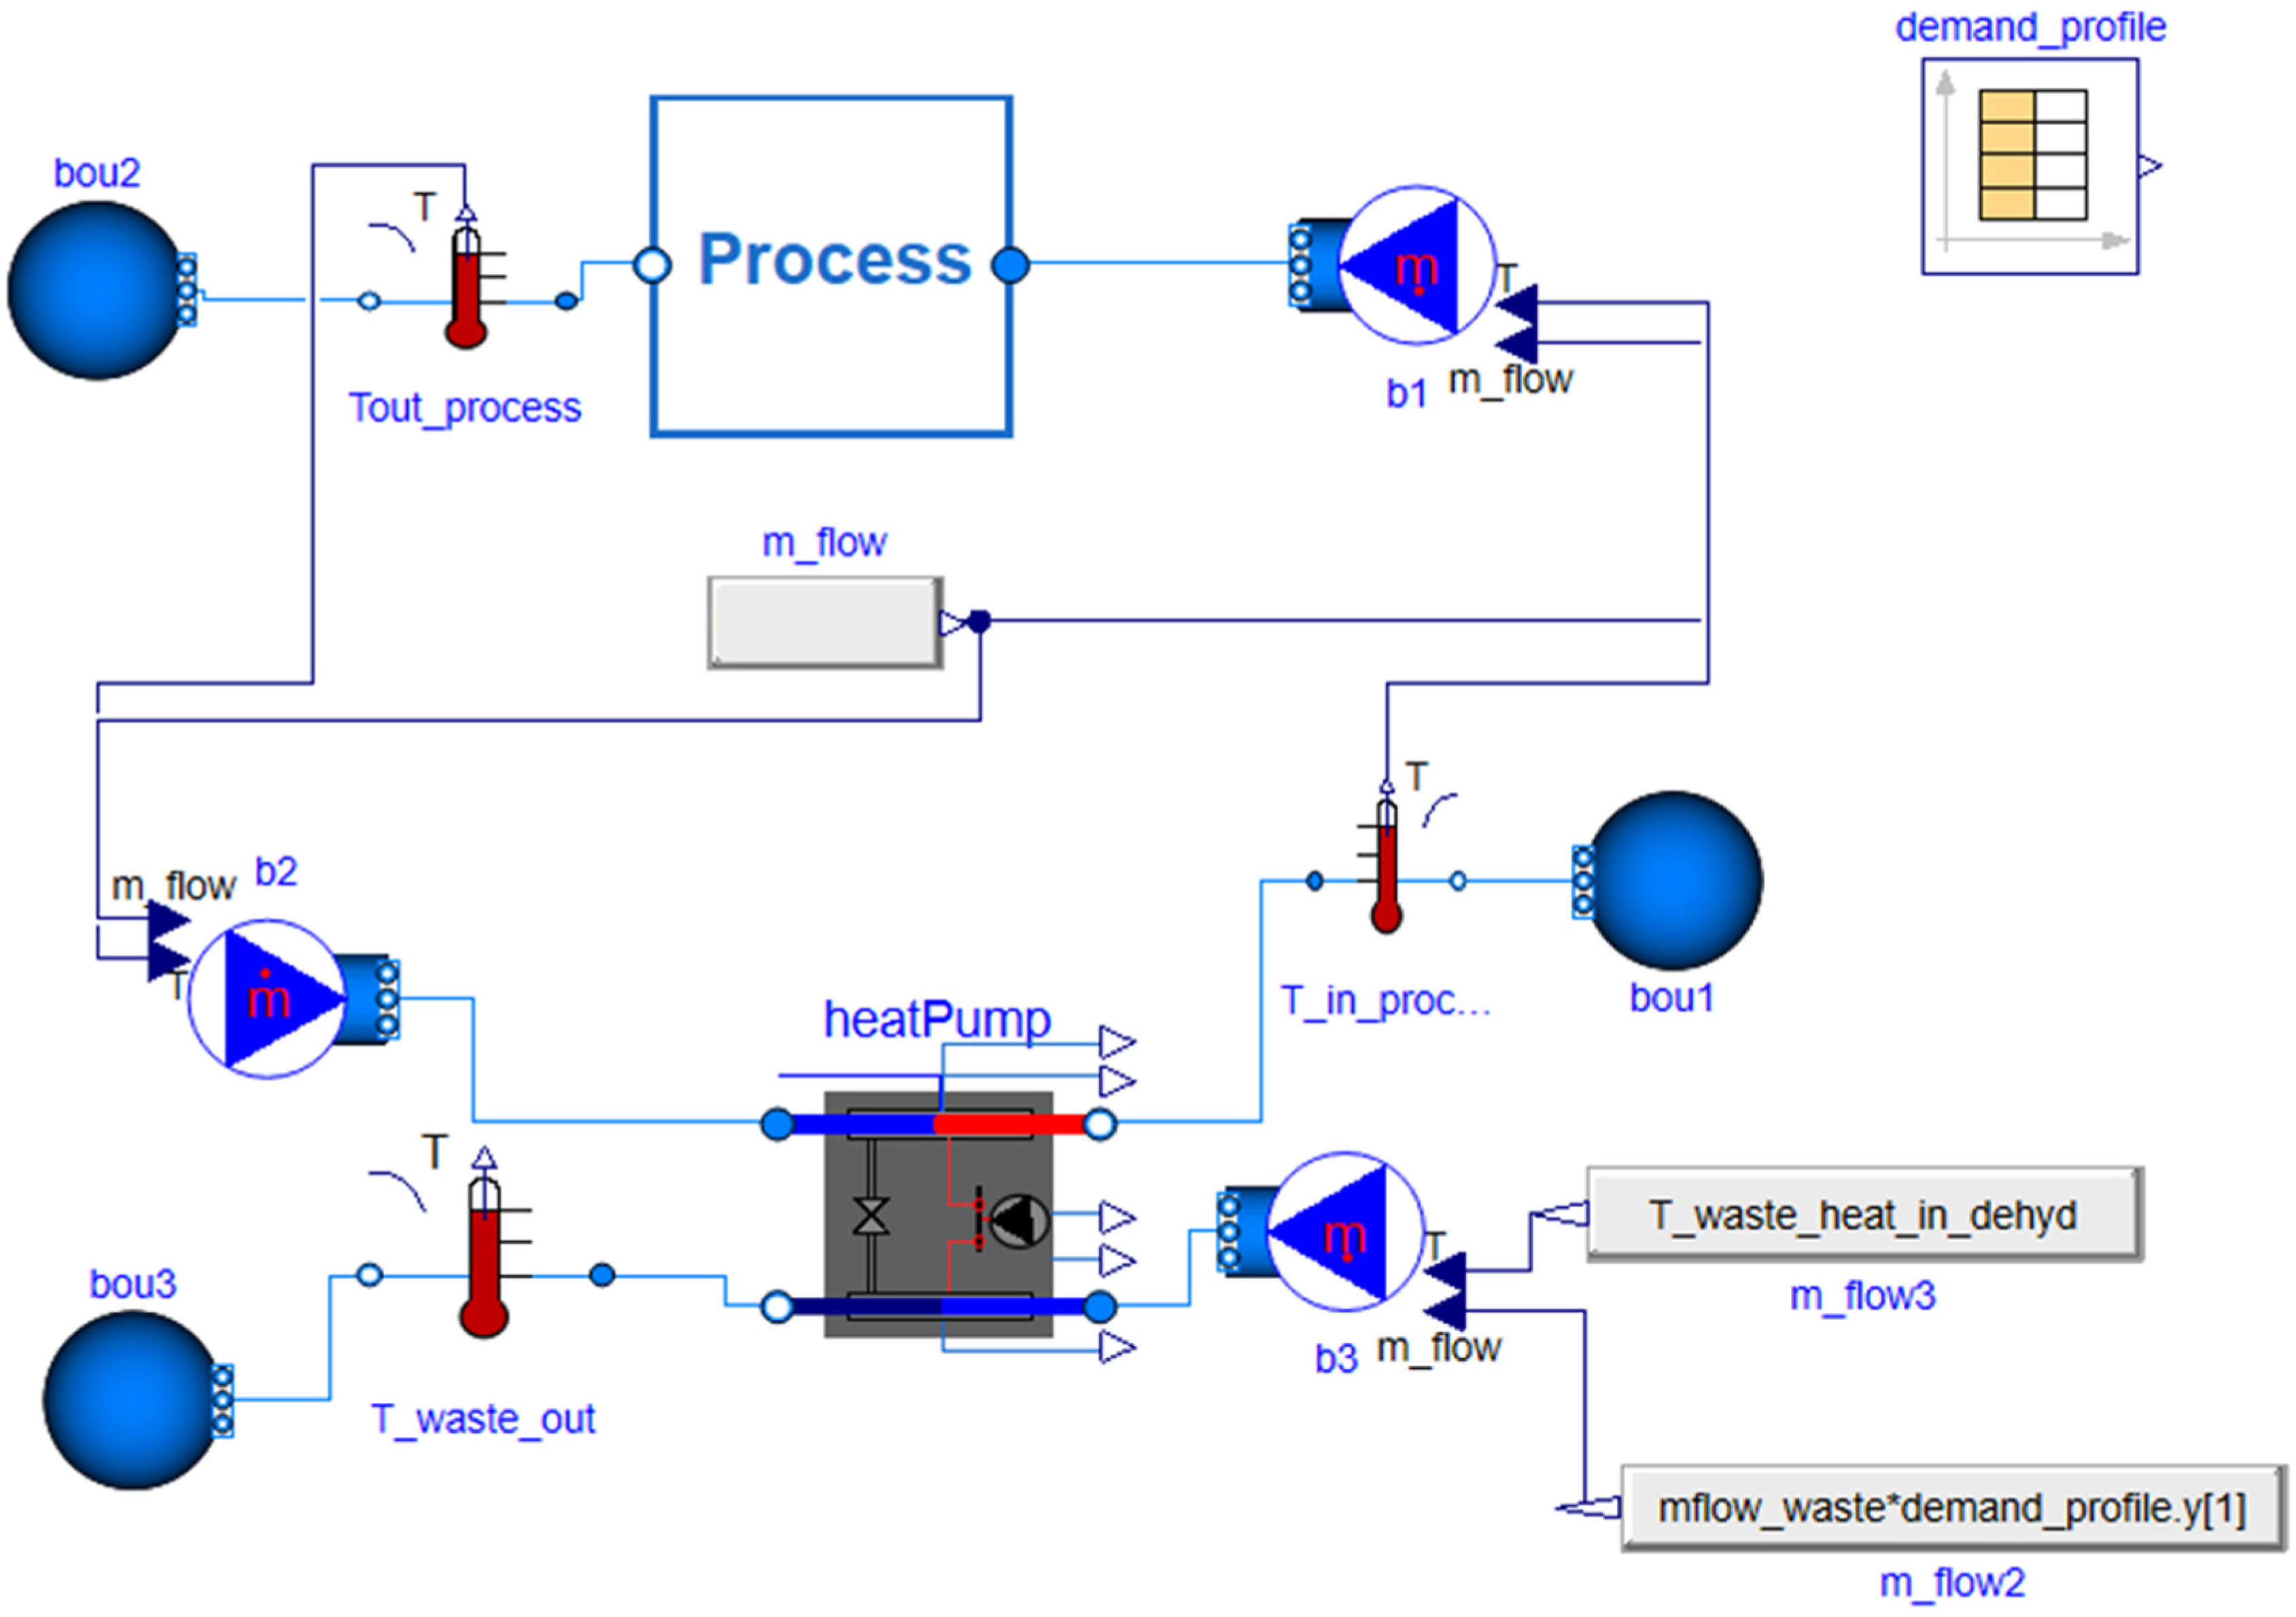
2.5.1. Description of the High-Temperature Heat Pump Configuration
2.5.2. Basic Mathematical Modeling of the High-Temperature Heat Pump Configuration
3. Results and Discussion
3.1. Dynamic Analysis of the Thermochemical Heat Upgrade Scenario
3.2. Dynamic Analysis of the Natural Gas Boiler Scenario
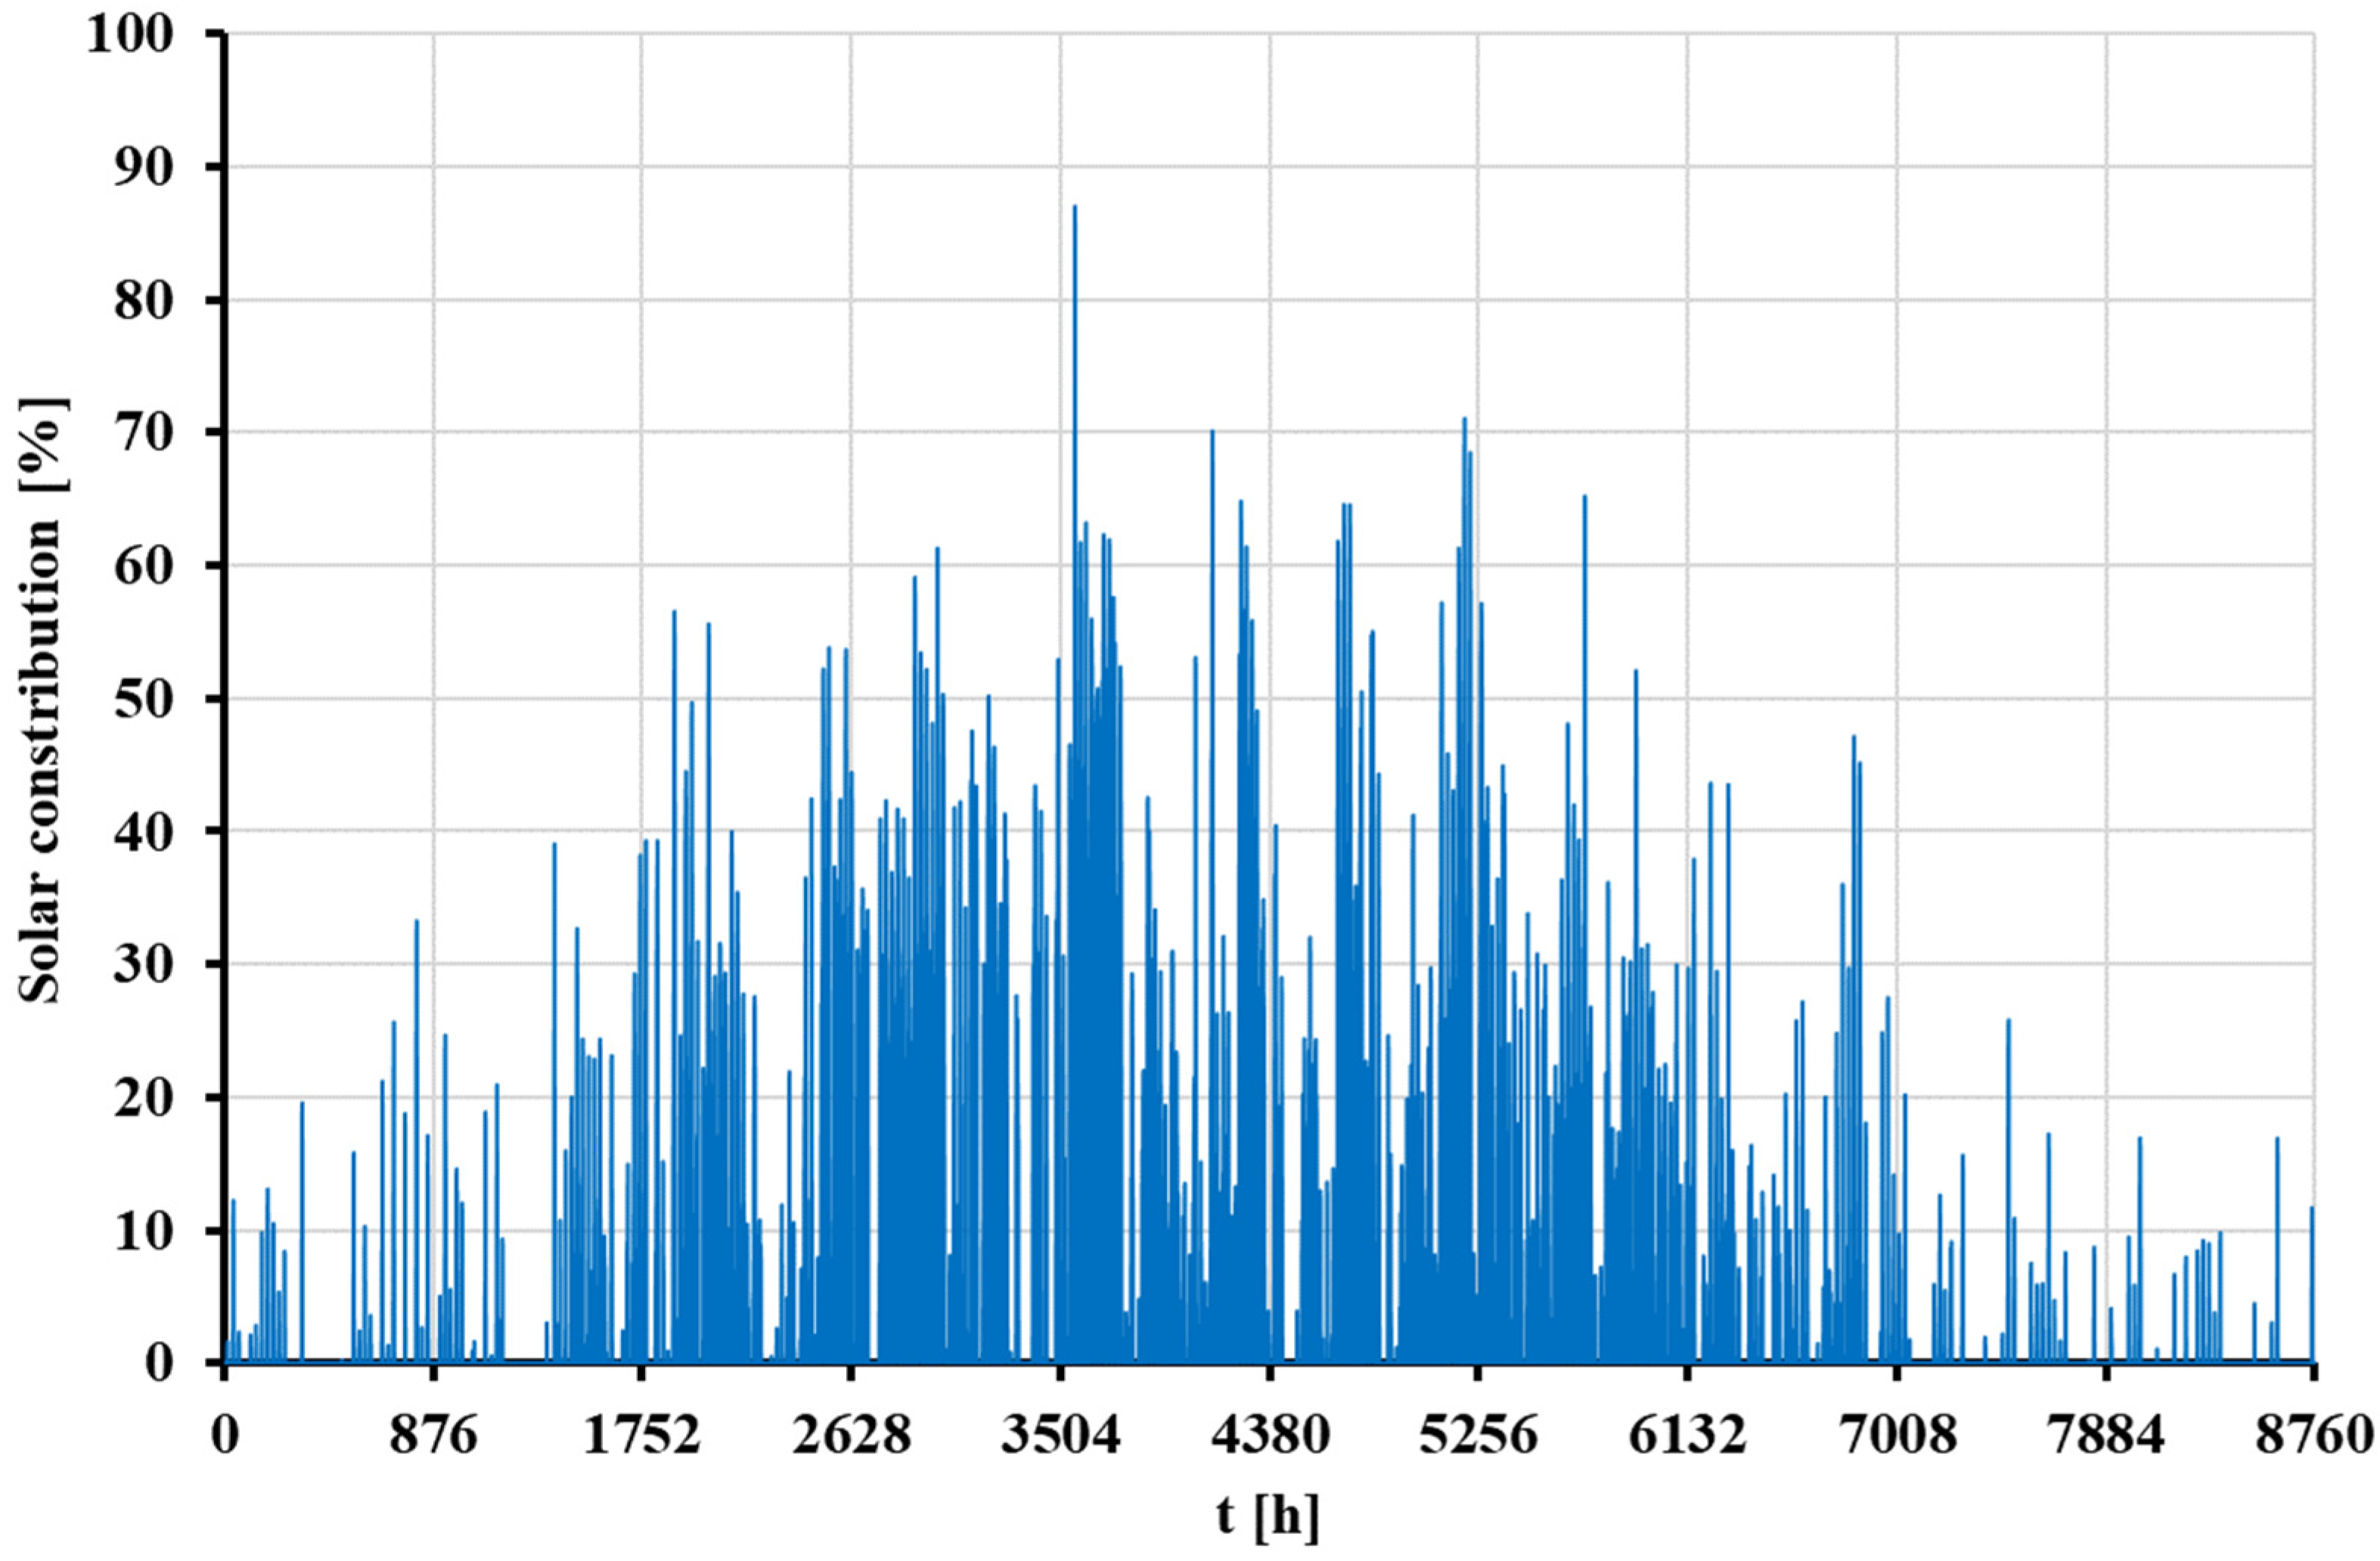
3.3. Dynamic Analysis of the STS with Auxiliary Natural Gas Boiler Scenario
3.3.1. Basic Analysis
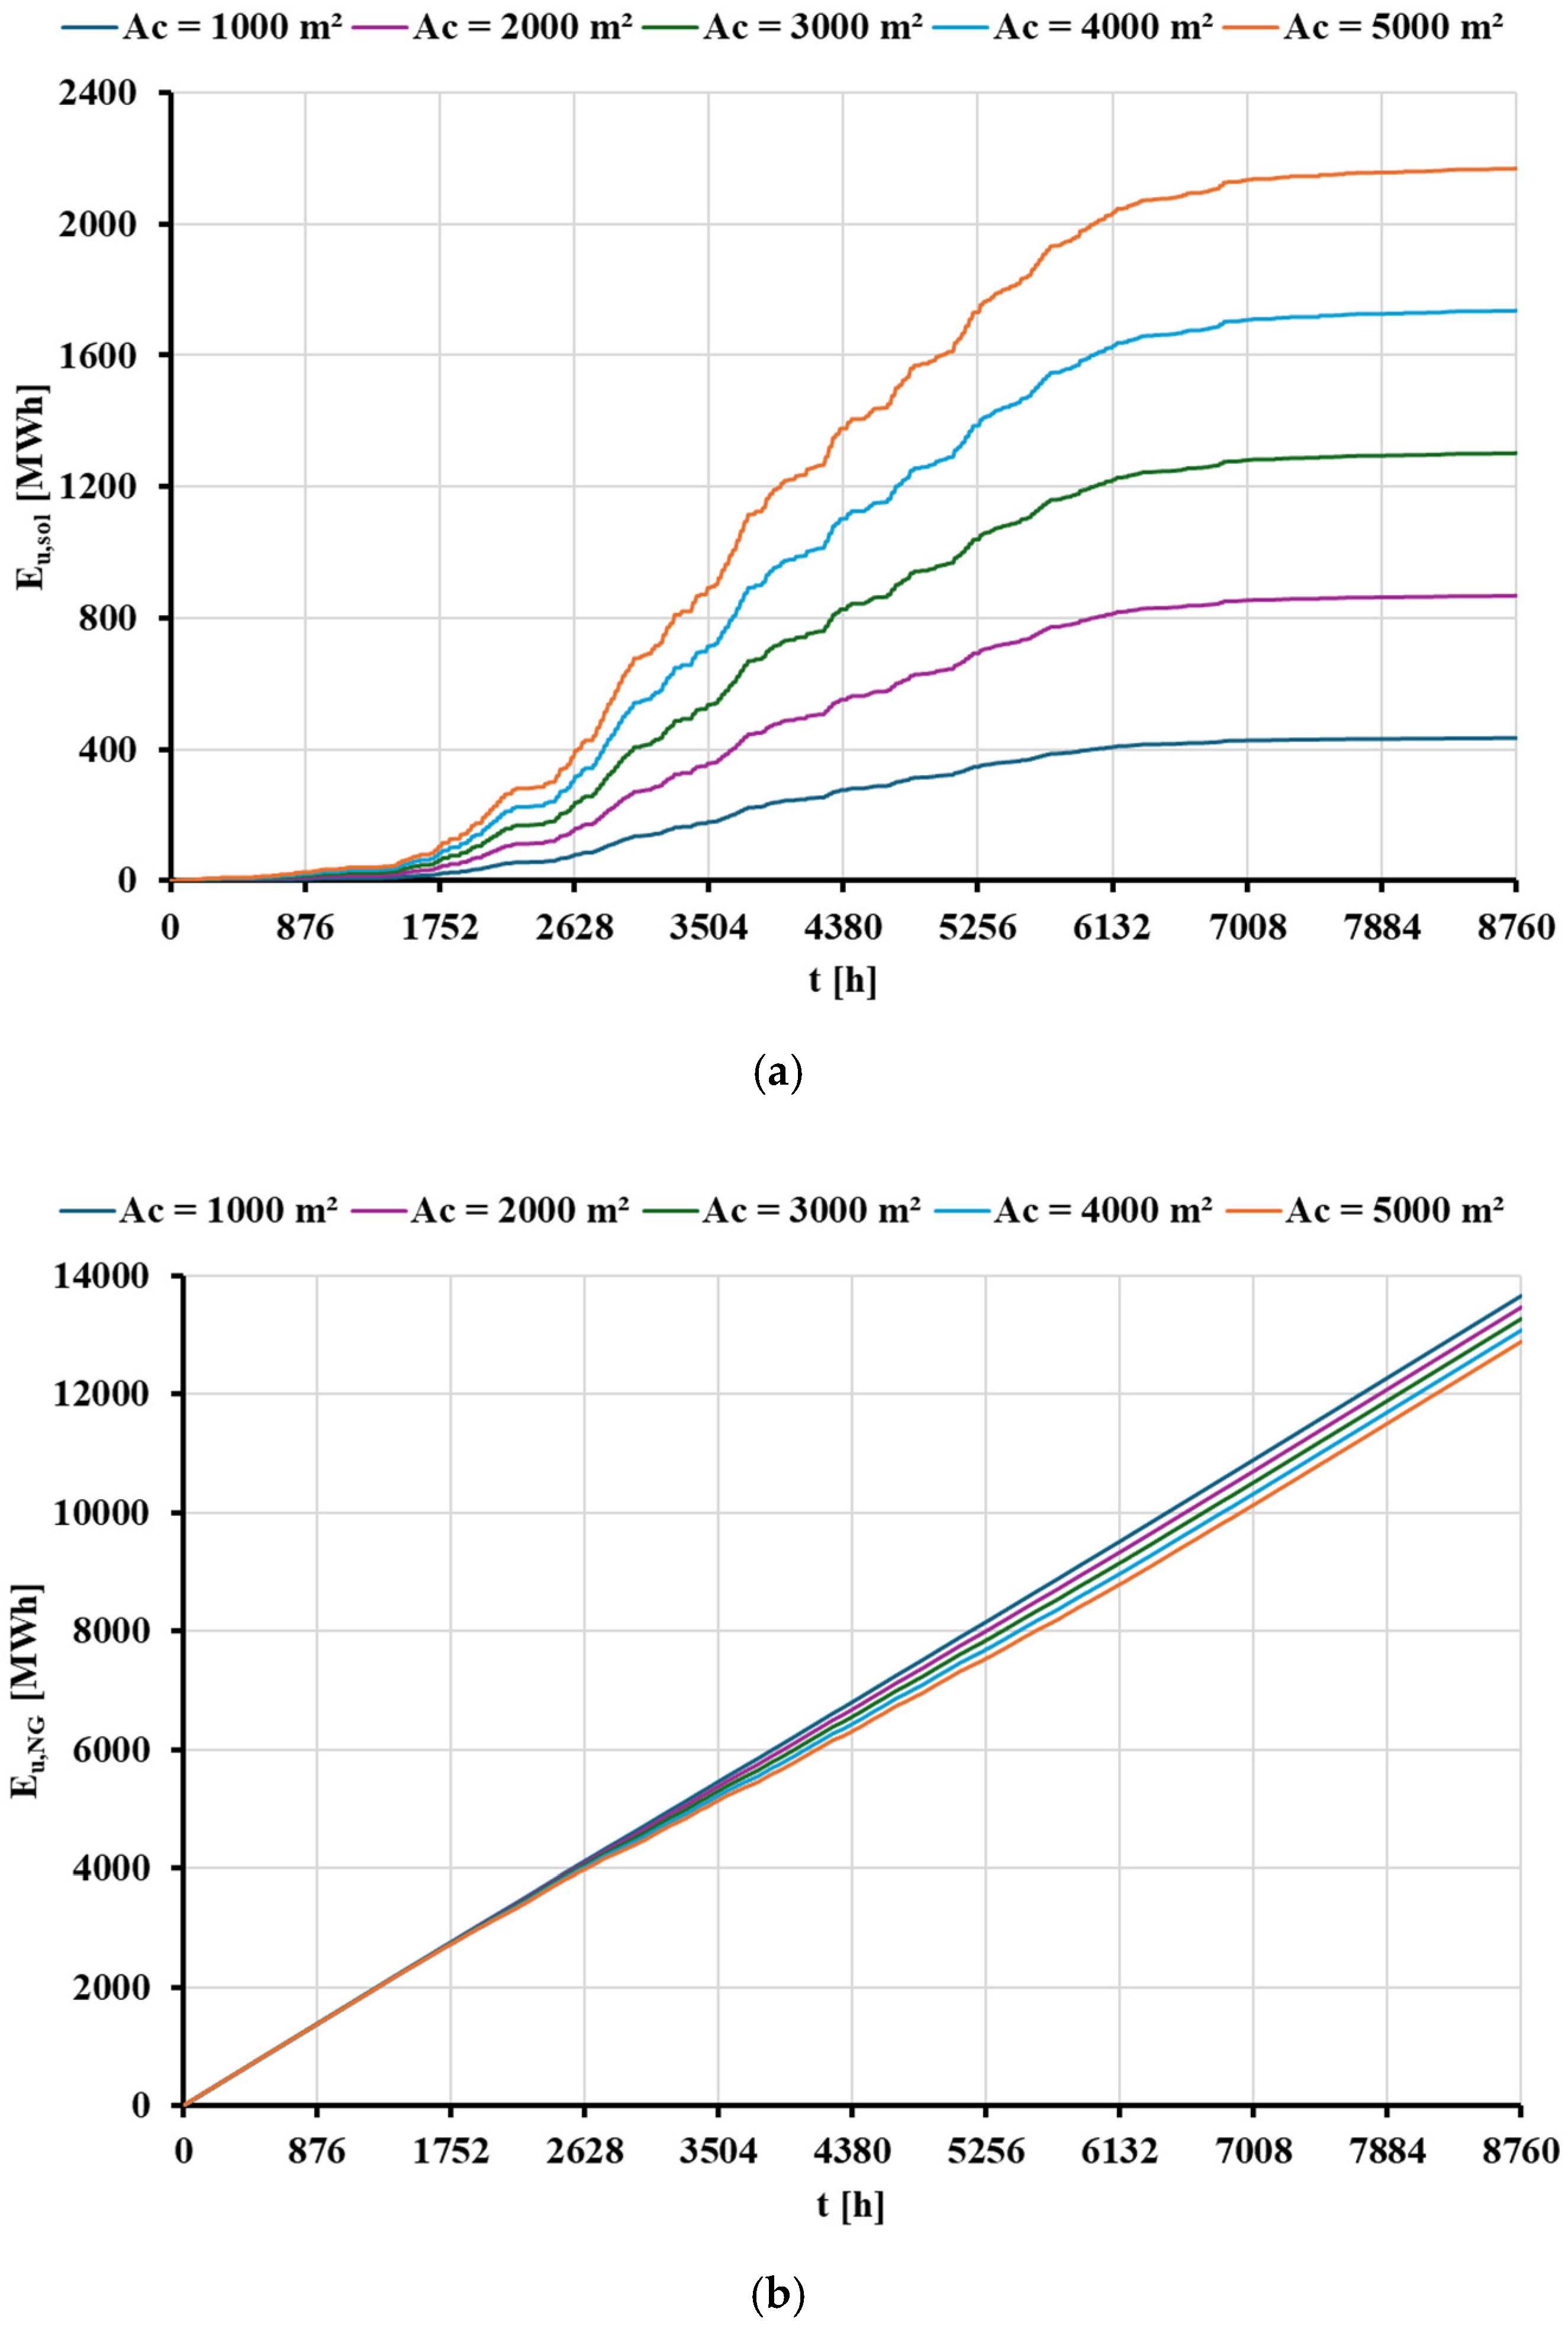
3.3.2. Parametric Analysis
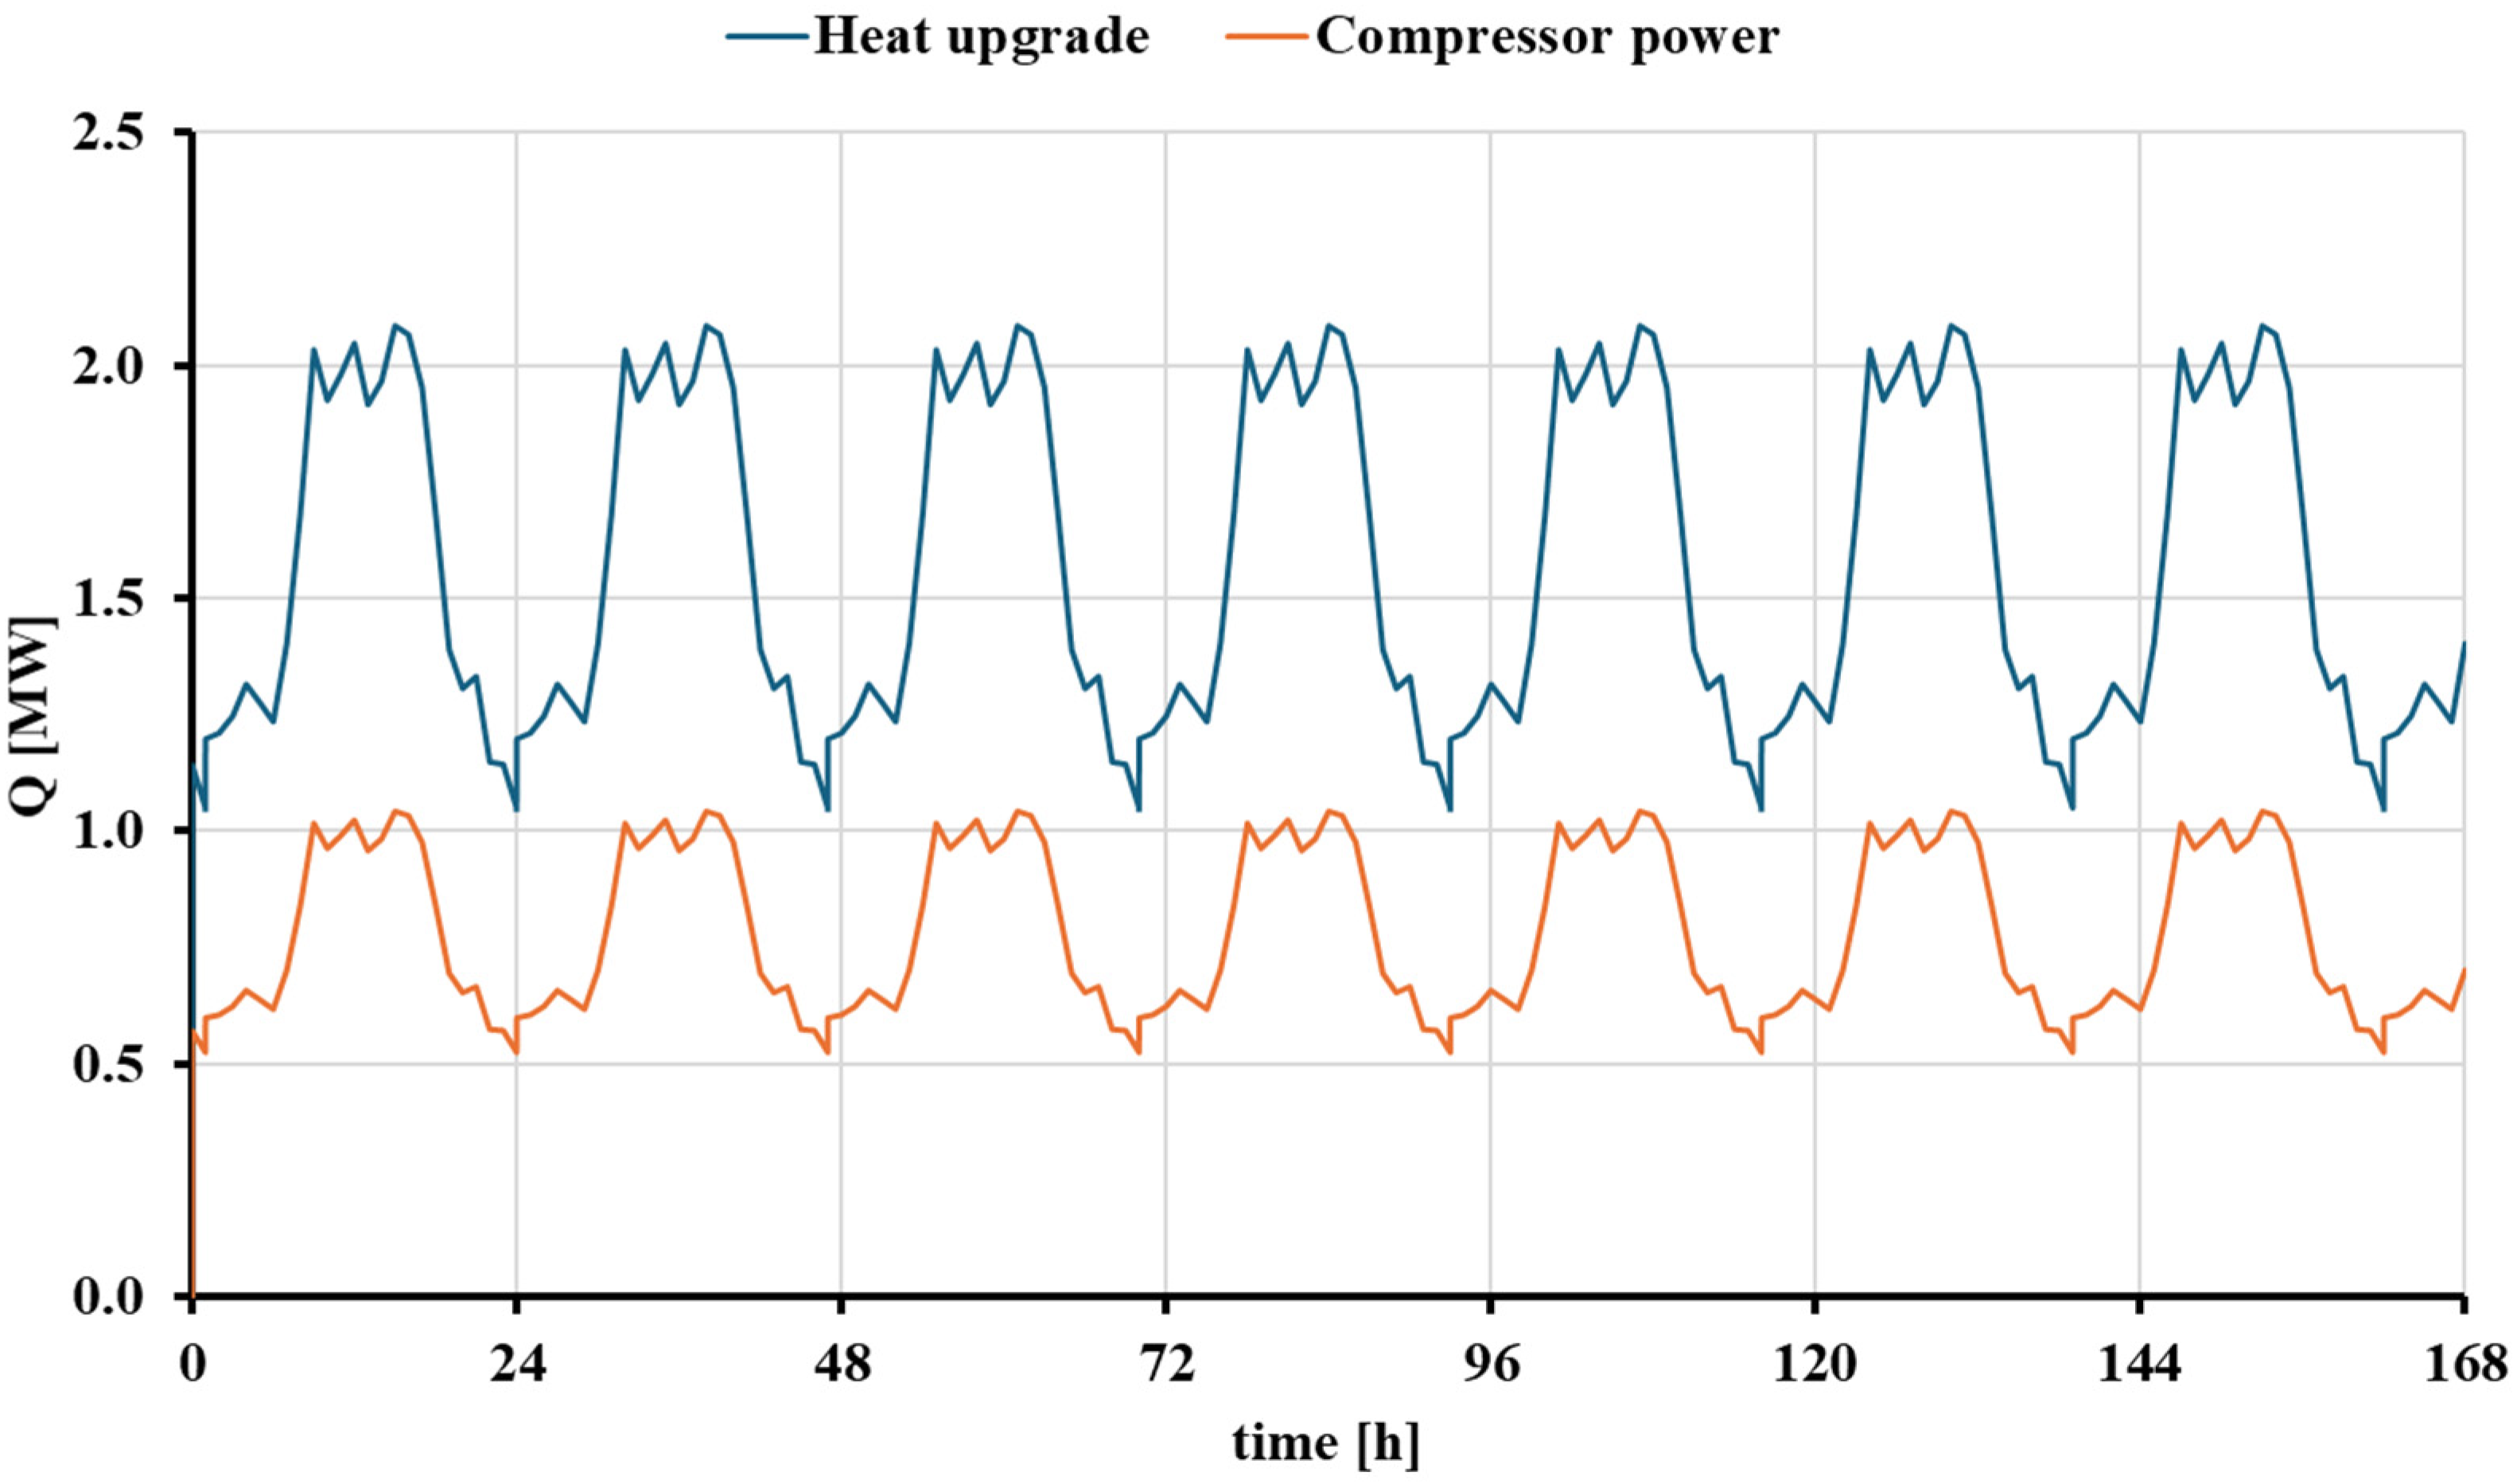
3.4. Dynamic Analysis of the High-Temperature Heat Pump Scenario
3.5. Summary and Discussion
4. Conclusions
- Utilizing an NGB system is a more cost-effective solution than employing a high-temperature heat pump. Notably, the hybrid solution incorporating solar thermal collectors and an NGB achieves the lowest operational cost in Denmark and Greece, resulting in an annual operating cost of EUR 1,080,751 and EUR 1,025,710, respectively.
- The HTHP is the most environmentally friendly option in Denmark, contributing the least to global warming at 812.36 tCO2eq. In Greece, where the integration of renewable sources into the electricity grid is lower, the most environmentally friendly option is the hybrid solution, which results in 952.45 tCO2eq.
- The hybrid system presents lower annual operational costs than the stand-alone NGB system, since the STS contributes to the petrochemical industry’s industrial heat demand in Greece and Denmark.
- The contribution of solar energy in Greece is higher than in Denmark, enhancing its performance in economic and environmental terms, as the available solar irradiation levels are higher in Greece. The annual useful heat produced by the concentrating solar system is determined at 1.30 GWh and 2.82 GWh for the weather data of Denmark and Greece, respectively.
- The energy utilized from the STS does not equal the useful energy generated by the solar thermal subsystem of the hybrid model. The main reasons for this discrepancy are the analyzed industrial heat demand profile and the lack of contribution from the STS during nighttime hours. Additionally, the thermal tank increases the contribution of the STS.
Author Contributions
Funding
Data Availability Statement
Conflicts of Interest
Nomenclature
| A | Area [m2] |
| Cp | Specific heat capacity at constant pressure [J/(kg·K)] |
| E | Energy [kWh] |
| Gb | Incident solar irradiation [W/m2] |
| Hu | Lower heating value [kJ/kg] |
| h | Specific enthalpy [kJ/kg] |
| K | Incident angle modifier |
| Mass flow rate [kg/s] | |
| P | Power [W] |
| p | Pressure [kPa] |
| Q | Heat [W] |
| T | Temperature [°C] |
| t | Time [s] |
| U | Overall heat transfer coefficient [W/(m2·K)] |
| V | Volume [m3] |
| Greek symbols | |
| η | Efficiency [-] |
| θ | Incident angle [°] |
| ρ | Density [kg/m3] |
| Subscripts and superscripts | |
| am | ambient |
| B | natural gas fuel |
| col | collector |
| comp | compressor |
| deh | dehydration |
| el | electrical |
| en | energy |
| evap | evaporator |
| f | fluid |
| hd | heat demand |
| heat | heat sink |
| hybr | hybrid |
| hyd | hydration |
| in | inlet |
| L | longitudinal direction |
| lift | lift |
| load | load |
| loss | losses |
| out | outlet |
| proc | process |
| T | transversal direction |
| tank | thermal storage tank |
| th | thermal |
| u | useful |
| sol | solar |
| st | stored |
| sys | system |
| waste | waste heat stream |
| Abbreviations | |
| AHP | Absorption Heat Pump |
| AHT | Absorption Heat Transformer |
| COP | Coefficient of Performance |
| HTHP | High-temperature Heat Pump |
| NG | Natural Gas |
| NGB | Natural Gas Boiler |
| PD | Proportional Derivative |
| PTC | Parabolic Trough Collector |
| PVGIS | Photovoltaic Geographical Information System |
| STS | Solar Thermal System |
| THT | Thermochemical Heat Transformer |
| WHS | Waste Heat Source |
References
- Sechi, S.; Giarola, S.; Leone, P. Taxonomy for Industrial Cluster Decarbonization: An Analysis for the Italian Hard-to-Abate Industry. Energies 2022, 15, 8586. [Google Scholar] [CrossRef]
- Eurostat. Database. Available online: https://ec.europa.eu/eurostat/data/database (accessed on 3 July 2023).
- Agathokleous, R.; Bianchi, G.; Panayiotou, G.; Aresti, L.; Argyrou, M.C.; Georgiou, G.S.; Tassou, S.A.; Jouhara, H.; Kalogirou, S.A.; Florides, G.A.; et al. Waste Heat Recovery in the EU Industry and Proposed New Technologies. Energy Procedia 2019, 161, 489–496. [Google Scholar] [CrossRef]
- Brückner, S.; Liu, S.; Miró, L.; Radspieler, M.; Cabeza, L.F.; Lävemann, E. Industrial Waste Heat Recovery Technologies: An Economic Analysis of Heat Transformation Technologies. Appl. Energy 2015, 151, 157–167. [Google Scholar] [CrossRef]
- Samuel, V.B.; Agamuthu, P.; Hashim, M.A. Indicators for Assessment of Sustainable Production: A Case Study of the Petrochemical Industry in Malaysia. Ecol. Indic. 2013, 24, 392–402. [Google Scholar] [CrossRef]
- Saha, B.K.; Chakraborty, B.; Dutta, R. Estimation of Waste Heat and Its Recovery Potential from Energy-Intensive Industries. Clean Technol. Environ. Policy 2020, 22, 1795–1814. [Google Scholar] [CrossRef]
- Su, Z.; Zhang, M.; Xu, P.; Zhao, Z.; Wang, Z.; Huang, H.; Ouyang, T. Opportunities and Strategies for Multigrade Waste Heat Utilization in Various Industries: A Recent Review. Energy Convers. Manag. 2021, 229, 113769. [Google Scholar] [CrossRef]
- Jia, T.; Huang, J.; Li, R.; He, P.; Dai, Y. Status and Prospect of Solar Heat for Industrial Processes in China. Renew. Sustain. Energy Rev. 2018, 90, 475–489. [Google Scholar] [CrossRef]
- Tsoumalis, G.I.; Bampos, Z.N.; Chatzis, G.V.; Biskas, P.N. Overview of Natural Gas Boiler Optimization Technologies and Potential Applications on Gas Load Balancing Services. Energies 2022, 15, 8461. [Google Scholar] [CrossRef]
- Barma, M.C.; Saidur, R.; Rahman, S.M.A.; Allouhi, A.; Akash, B.A.; Sait, S.M. A Review on Boilers Energy Use, Energy Savings, and Emissions Reductions. Renew. Sustain. Energy Rev. 2017, 79, 970–983. [Google Scholar] [CrossRef]
- Chen, Q.; Finney, K.; Li, H.; Zhang, X.; Zhou, J.; Sharifi, V.; Swithenbank, J. Condensing Boiler Applications in the Process Industry. Appl. Energy 2012, 89, 30–36. [Google Scholar] [CrossRef]
- Jiang, J.; Hu, B.; Wang, R.Z.; Deng, N.; Cao, F.; Wang, C.-C. A Review and Perspective on Industry High-Temperature Heat Pumps. Renew. Sustain. Energy Rev. 2022, 161, 112106. [Google Scholar] [CrossRef]
- Hamid, K.; Sajjad, U.; Ulrich Ahrens, M.; Ren, S.; Ganesan, P.; Tolstorebrov, I.; Arshad, A.; Said, Z.; Hafner, A.; Wang, C.-C.; et al. Potential Evaluation of Integrated High Temperature Heat Pumps: A Review of Recent Advances. Appl. Therm. Eng. 2023, 230, 120720. [Google Scholar] [CrossRef]
- Jensen, J.K.; Markussen, W.B.; Reinholdt, L.; Elmegaard, B. On the Development of High Temperature Ammonia–Water Hybrid Absorption–Compression Heat Pumps. Int. J. Refrig. 2015, 58, 79–89. [Google Scholar] [CrossRef]
- Wu, X.; Xing, Z.; He, Z.; Wang, X.; Chen, W. Performance Evaluation of a Capacity-Regulated High Temperature Heat Pump for Waste Heat Recovery in Dyeing Industry. Appl. Therm. Eng. 2016, 93, 1193–1201. [Google Scholar] [CrossRef]
- Hassan, A.H.; O’Donoghue, L.; Sánchez-Canales, V.; Corberán, J.M.; Payá, J.; Jockenhöfer, H. Thermodynamic Analysis of High-Temperature Pumped Thermal Energy Storage Systems: Refrigerant Selection, Performance and Limitations. Energy Rep. 2020, 6, 147–159. [Google Scholar] [CrossRef]
- Kashif Shahzad, M.; Ding, Y.; Xuan, Y.; Gao, N.; Chen, G. Performance Analysis of a Novel Double Stage Multifunctional Open Absorption Heat Pump System: An Industrial Moist Flue Gas Heat Recovery Application. Energy Convers. Manag. 2022, 254, 115224. [Google Scholar] [CrossRef]
- Cudok, F.; Giannetti, N.; Ciganda, J.L.C.; Aoyama, J.; Babu, P.; Coronas, A.; Fujii, T.; Inoue, N.; Saito, K.; Yamaguchi, S.; et al. Absorption Heat Transformer—State-of-the-Art of Industrial Applications. Renew. Sustain. Energy Rev. 2021, 141, 110757. [Google Scholar] [CrossRef]
- Stengler, J.; Linder, M. Thermal Energy Storage Combined with a Temperature Boost: An Underestimated Feature of Thermochemical Systems. Appl. Energy 2020, 262, 114530. [Google Scholar] [CrossRef]
- Li, W.; Zhang, L.; Ling, X. Thermo-Economic Assessment of Salt Hydrate-Based Thermochemical Heat Transformer System: Heat Upgrade for Matching Domestic Hot Water Production. Energy Convers. Manag. 2023, 277, 116644. [Google Scholar] [CrossRef]
- Stengler, J.; Bürger, I.; Linder, M. Thermodynamic and Kinetic Investigations of the SrBr2 Hydration and Dehydration Reactions for Thermochemical Energy Storage and Heat Transformation. Appl. Energy 2020, 277, 115432. [Google Scholar] [CrossRef]
- Modelica. Available online: https://modelica.org (accessed on 4 September 2024).
- Dymola. Available online: https://www.3ds.com/products/catia/dymola (accessed on 5 September 2024).
- Thermochemical Heat Recovery & Upgrade for Industrial Processes. Available online: https://techupgrade.eu/ (accessed on 15 November 2024).
- Song, J.; Li, Y.; Gu, C.; Zhang, L. Thermodynamic Analysis and Performance Optimization of an ORC (Organic Rankine Cycle) System for Multi-Strand Waste Heat Sources in Petroleum Refining Industry. Energy 2014, 71, 673–680. [Google Scholar] [CrossRef]
- THERMINOL VP-1 Heat Transfer Fluid. Available online: https://www.therminol.com/product/71093459 (accessed on 4 September 2024).
- Mirzaei, M.; Vahidi, B. Feasibility Analysis and Optimal Planning of Renewable Energy Systems for Industrial Loads of a Dairy Factory in Tehran, Iran. J. Renew. Sustain. Energy 2015, 7, 063114. [Google Scholar] [CrossRef]
- Schenk, H.; Dieckmann, S.; Berger, M.; Zahler, C.; Stoppok, O.; Schulz, D.; Krüger, D. SolSteam—Innovative Integration Concepts for Solar-Fossil Hybrid Process Steam Generation. Energy Procedia 2015, 69, 1676–1687. [Google Scholar] [CrossRef]
- Hasanbeigi, A.; Price, L. Industrial Energy Audit Guidebook: Guidelines for Conducting an Energy Audit in Industrial Facilities; Brekeley Lab: Berkeley, CA, USA, 2010; p. LBNL-3991E. [Google Scholar]
- Sandhaas, A.; Kim, H.; Hartmann, N. Methodology for Generating Synthetic Load Profiles for Different Industry Types. Energies 2022, 15, 3683. [Google Scholar] [CrossRef]
- Buildings. Available online: https://build.openmodelica.org/Documentation/Buildings.html (accessed on 4 September 2024).
- BuildingSystems. Available online: https://modelica-buildingsystems.de/index.html (accessed on 4 September 2024).
- European Commission. JRC Photovoltaic Geographical Information System (PVGIS). Available online: https://re.jrc.ec.europa.eu/pvg_tools/en/#api_5.1 (accessed on 10 January 2024).
- F-Chart Software: Engineering Software. EES: Engineering Equation Solver. Available online: https://fchartsoftware.com/ees/ (accessed on 31 March 2023).
- Statistics Denmark. ENERGI1: Prices of Electricity for Households by Annual Consumption, Price Definition and Energy Unit. Available online: https://www.statbank.dk/statbank5a/selectvarval/define.asp?PLanguage=1&subword=tabsel&MainTable=ENERGI1&PXSId=236157&tablestyle=&ST=SD&buttons=0 (accessed on 30 October 2024).
- Eurostst. Shedding Light on Energy in Europe—2024 Edition. Available online: https://ec.europa.eu/eurostat/web/interactive-publications/energy-2024?etrans=el#electricity-gas-prices (accessed on 10 January 2024).
- Eurostat. Greenhouse Gas Emission Intensity of Electricity Generation in Europe. Available online: https://www.eea.europa.eu/en/analysis/indicators/greenhouse-gas-emission-intensity-of-1 (accessed on 31 October 2024).
- DAPEEP. Available online: https://www.dapeep.gr/dimosieuseis/eguiseis-proeleusis-energeiako/ (accessed on 10 January 2024).
- Kazulis, V.; Vigants, H.; Veidenbergs, I.; Blumberga, D. Biomass and Natural Gas Co-Firing—Evaluation of GHG Emissions. Energy Procedia 2018, 147, 558–565. [Google Scholar] [CrossRef]
- Eurostat. Natural Gas Price Statistics. Available online: https://ec.europa.eu/eurostat/statistics-explained/index.php?title=Natural_gas_price_statistics (accessed on 10 January 2024).
- Stengler, J.; Bürger, I.; Linder, M. Performance Analysis of a Gas-Solid Thermochemical Energy Storage Using Numerical and Experimental Methods. Int. J. Heat Mass Transf. 2021, 167, 120797. [Google Scholar] [CrossRef]
- Che, D.; Liu, Y.; Gao, C. Evaluation of Retrofitting a Conventional Natural Gas Fired Boiler into a Condensing Boiler. Energy Convers. Manag. 2004, 45, 3251–3266. [Google Scholar] [CrossRef]
- Qu, M.; Abdelaziz, O.; Yin, H. New Configurations of a Heat Recovery Absorption Heat Pump Integrated with a Natural Gas Boiler for Boiler Efficiency Improvement. Energy Convers. Manag. 2014, 87, 175–184. [Google Scholar] [CrossRef]
- Bhatia, A. Improving Energy Efficiency of Boiler Systems; Continuing Education and Development, Inc.: Woodcliff Lake, NJ, USA, 2015; p. 70. [Google Scholar]
- Extension. Test and Qualification of Eurotrough from 4 to 6 Segments at Plataforma Solar de Almería. Available online: https://cordis.europa.eu/docs/projects/files/ERK6/ERK6-CT-1999-00018/66682891-6_en.pdf (accessed on 10 January 2024).
- Bellos, E.; Tzivanidis, C.; Belessiotis, V. Daily Performance of Parabolic Trough Solar Collectors. Sol. Energy 2017, 158, 663–678. [Google Scholar] [CrossRef]
- El Samad, T.; Żabnieńska-Góra, A.; Jouhara, H.; Sayma, A.I. A Review of Compressors for High Temperature Heat Pumps. Therm. Sci. Eng. Prog. 2024, 51, 102603. [Google Scholar] [CrossRef]
- Xiaohui, Y.; Yufeng, Z.; Na, D.; Chengmin, C.; Lijun, M.; Lipin, D.; Yan, Z. Experimental Performance of High Temperature Heat Pump with Near-Azeotropic Refrigerant Mixture. Energy Build. 2014, 78, 43–49. [Google Scholar] [CrossRef]
- Bell, I.H.; Wronski, J.; Quoilin, S.; Lemort, V. Pure and Pseudo-Pure Fluid Thermophysical Property Evaluation and the Open-Source Thermophysical Property Library CoolProp. Ind. Eng. Chem. Res. 2014, 53, 2498–2508. [Google Scholar] [CrossRef] [PubMed]
- Bellos, E.; Tsimpoukis, D.; Lykas, P.; Kitsopoulou, A.; Korres, D.N.; Vrachopoulos, M.G.; Tzivanidis, C. Investigation of a High-Temperature Heat Pump for Heating Purposes. Appl. Sci. 2023, 13, 2072. [Google Scholar] [CrossRef]


| Industrial Process | Temperature Range [°C] |
|---|---|
| Waste Heat Sources | |
| Bottom oil of xylene | 80–215 [7] |
| Xylene products | 80–205 [7] |
| Production of sodium hydroxide | 75–200 [6] |
| Evaporation processes | 147 [7] |
| Catalytic processes | 140 [7] |
| Sewage | 110 [7] |
| Reforming | 104 [7] |
| Benzene production | 98 [7] |
| Heat demand processes | |
| Steam boiler | 200–300 [4] |
| Distilling | 100–300 [8] |
| Source of Waste Heat for the Dehydration Part | |
|---|---|
| Heat transfer fluid | Thermal Oil |
| Inlet temperature [°C] | 200 |
| Outlet temperature [°C] | 185 |
| Mass flow rate [kg/s] | 78.5 |
| Specific heat capacity [kJ/(kg·K)] | 1.87 |
| Heat input in the dehydrator [kW] | 2200 |
| Source of waste heat for the evaporation process (including preheating) | |
| Heat transfer fluid | Thermal Oil |
| Inlet temperature [°C] | 185 |
| Outlet temperature [°C] | 112 |
| Mass flow rate [kg/s] | 10.52 |
| Specific heat capacity [kJ/(kg·K)] | 1.87 |
| Heat input in the evaporator [kW] | 1437.2 |
| The heat demand for the distillation process | |
| Heat transfer fluid | Thermal Oil |
| Inlet temperature [°C] | 230 |
| Outlet temperature [°C] | 250 |
| Mass flow rate [kg/s] | 58.8 |
| Specific heat capacity [kJ/(kg·K)] | 1.87 |
| Heat production in the hydrator [kW] | 2200 |
| Parameter | Value |
|---|---|
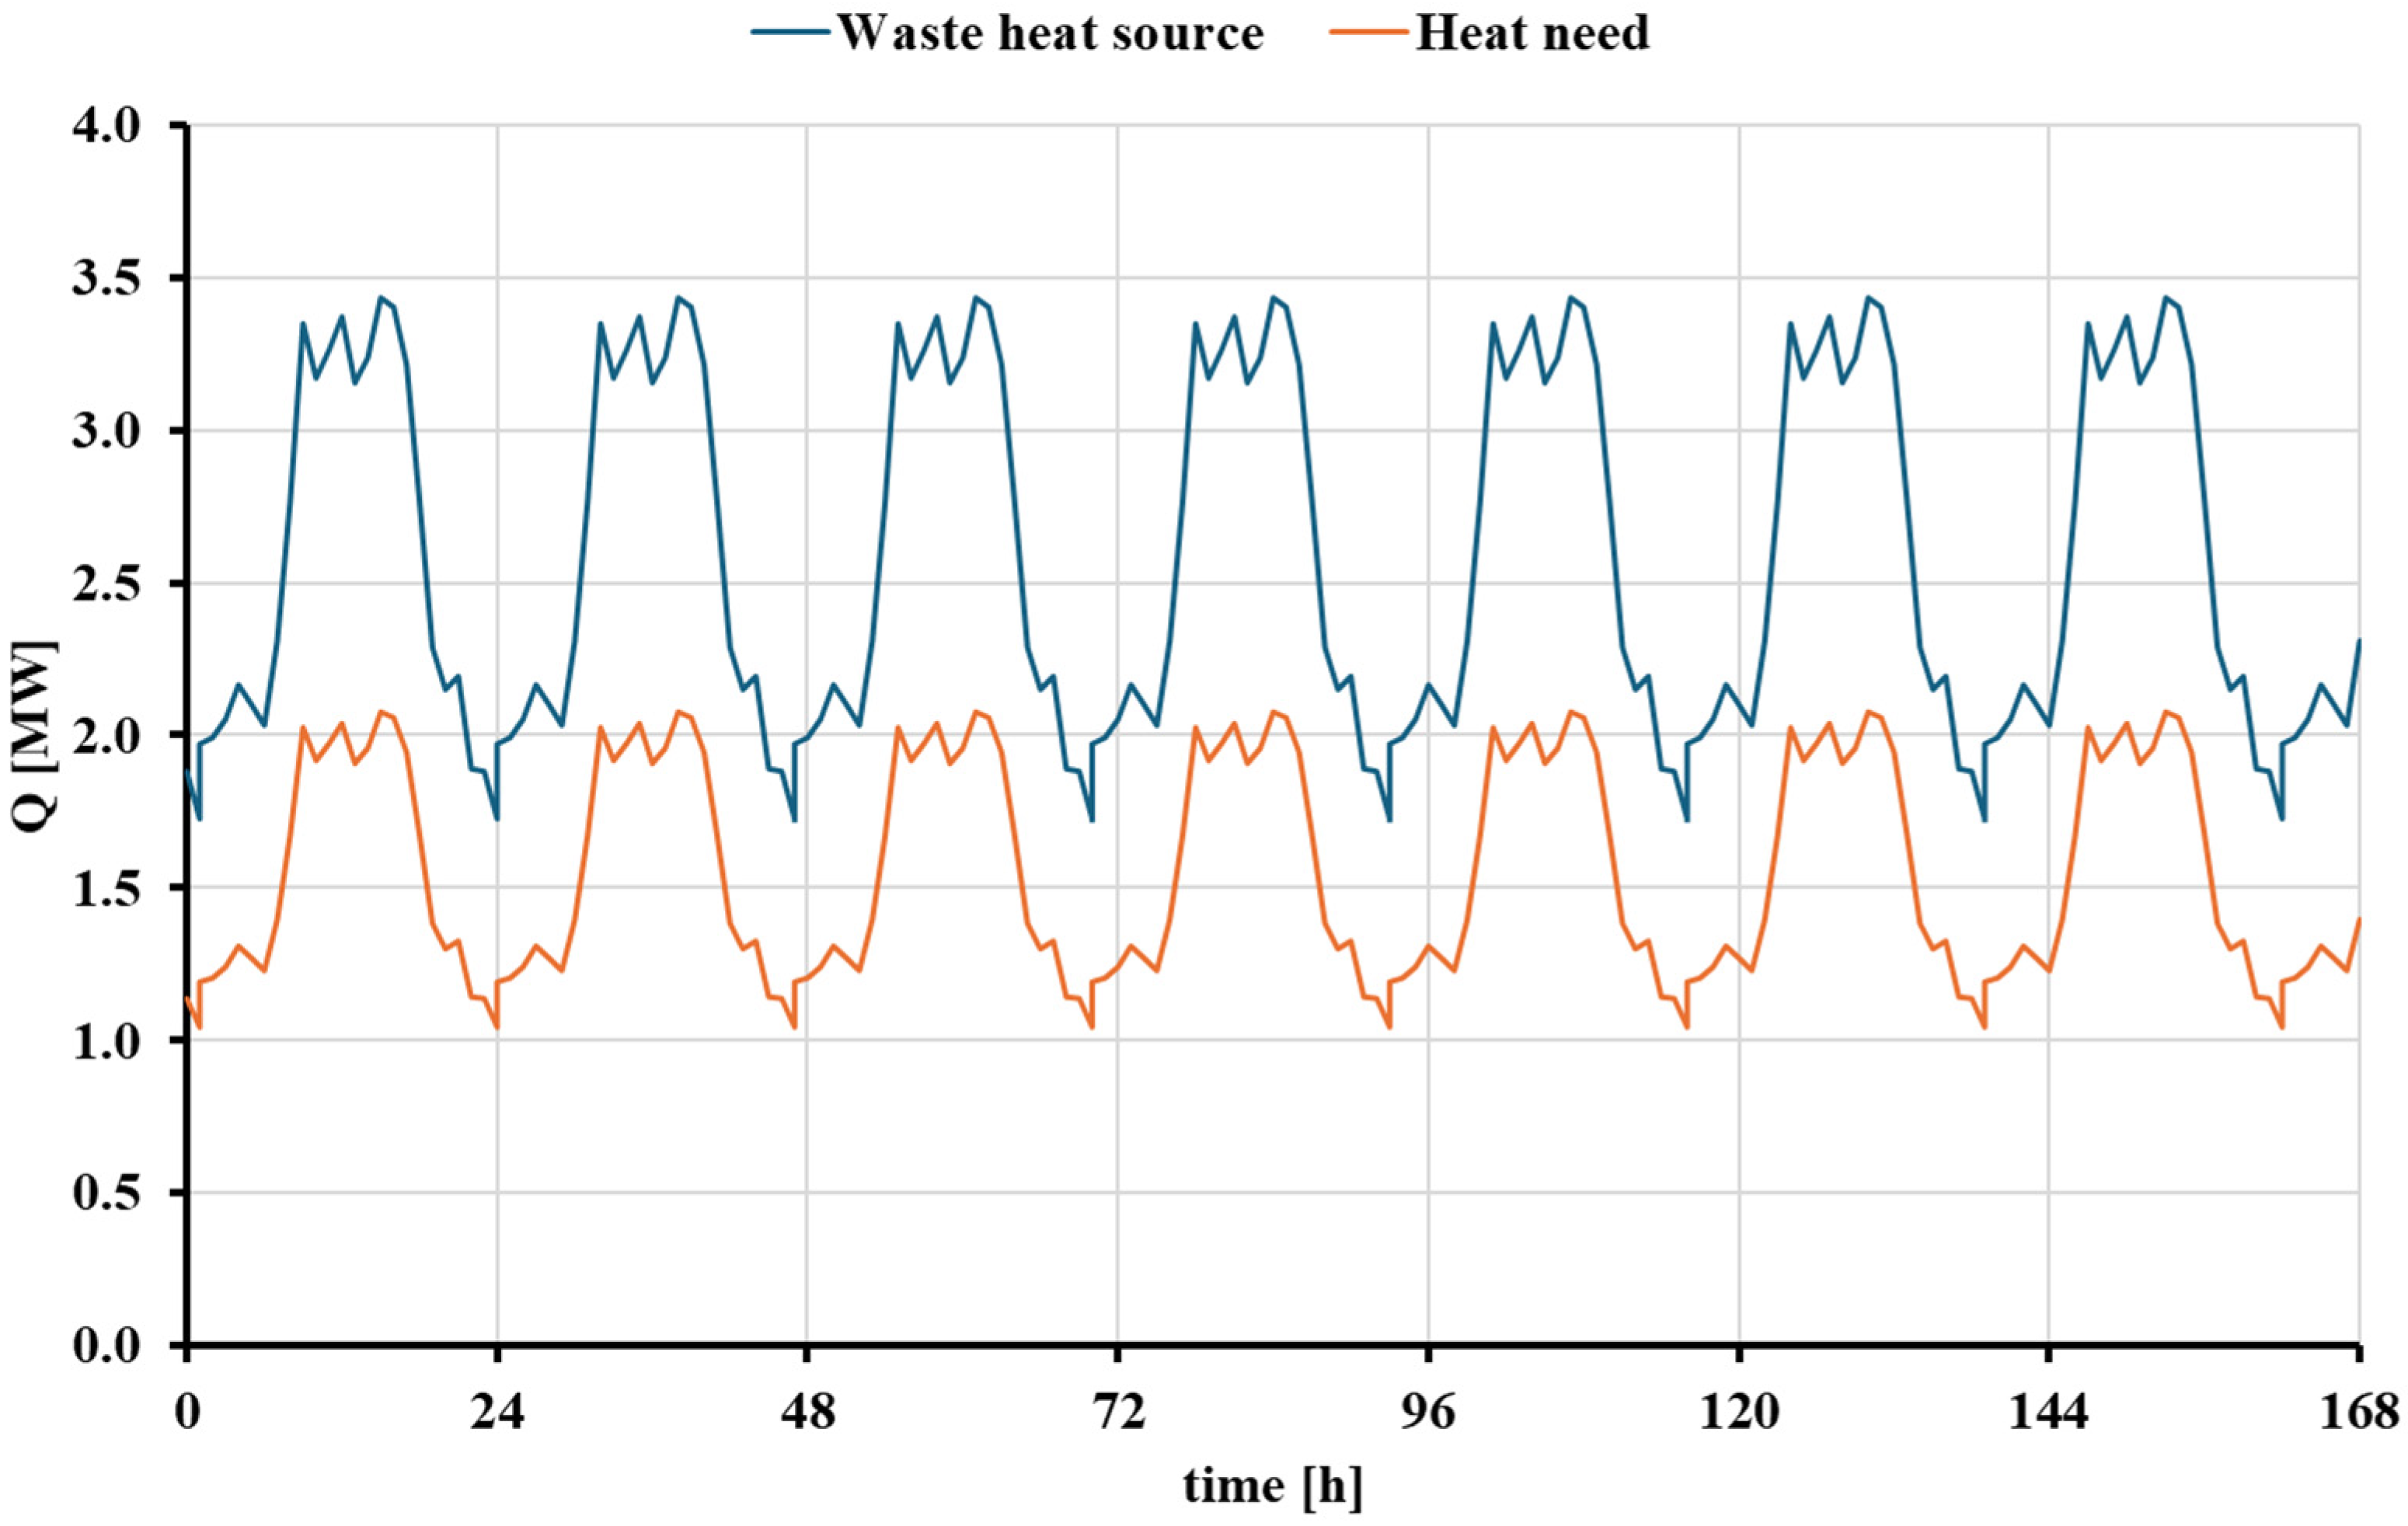
| Energy of waste heat source (Ewaste) | 22.87 GWh |
| Energy of heat demand (Ehd) | 13.83 GWh |
| Energy produced by natural gas boiler (Eu,NG) | 13.86 GWh |
| Energy consumed by natural gas boiler (EB,NG) | 16.12 GWh |
| Annual equivalent CO2 emissions | 1,047,611.5 kgCO2eq/year |
| Annual operational cost | EUR 1,128,197.0/year |
| Ac [m2] | 1000 | 2000 | 3000 | 4000 | 5000 |
|---|---|---|---|---|---|
| Eu,sol [MWh] | 434.51 | 868.22 | 1302.27 | 1736.60 | 2169.56 |
| Eu,NG [MWh] | 13,665.70 | 13,471.90 | 13,277.80 | 13,083.70 | 12,892.30 |
| EB,NG [MWh] | 15,890.30 | 15,665.00 | 15,439.30 | 15,213.60 | 14,991.00 |
| Ac [m2] | 1000 | 2000 | 3000 | 4000 | 5000 |
|---|---|---|---|---|---|
| Eu,sol [MWh] | 939.87 | 1877.69 | 2819.16 | 3757.44 | 4691.91 |
| Eu,NG [MWh] | 13,440.90 | 13,022.40 | 12,601.60 | 12,182.30 | 11,774.10 |
| EB,NG [MWh] | 15,628.90 | 15,142.30 | 14,653.00 | 14,165.50 | 13,690.80 |
| Ac [m2] | 1000 | 2000 | 3000 | 4000 | 5000 |
|---|---|---|---|---|---|
| Eu,sol [MWh] | 434.51 | 868.22 | 1302.27 | 1736.60 | 2169.56 |
| EB,NG [MWh] | 15,890.30 | 15,665.00 | 15,439.30 | 15,213.60 | 14,991.00 |
| Emissions [tCO2eq/year] | 1032.87 | 1018.23 | 1003.56 | 988.89 | 974.42 |
| Costs [EUR/year] | 1,112,321 | 1,096,550 | 1,080,751 | 1,064,952 | 1,049,370 |
| Ac [m2] | 1000 | 2000 | 3000 | 4000 | 5000 |
|---|---|---|---|---|---|
| Eu,sol [MWh] | 939.87 | 1877.69 | 2819.16 | 3757.44 | 4691.91 |
| EB,NG [MWh] | 15,628.90 | 15,142.30 | 14,653.00 | 14,165.50 | 13,690.80 |
| Emissions [tCO2eq/year] | 1015.88 | 984.25 | 952.45 | 920.73 | 889.90 |
| Costs [EUR/year] | 1,094,023 | 1,059,961 | 1,025,710 | 991,585 | 958,356 |
| Parameter | Lyngby (Denmark) | Athens (Greece) |
|---|---|---|
| Electrical energy consumed [MWh/year] | 6943.24 | 6943.24 |
| CO2 emission on a yearly basis [kgCO2eq/year] | 812,359 | 1,752,761 |
| Annual cost [EUR/year] | 1,666,378 | 1,617,775 |
| Indexes | Lyngby (Denmark) | Athens (Greece) |
|---|---|---|
| Natural gas boiler | ||
| Fuel energy consumption [MWh] | 16,117.10 | 16,117.10 |
| Equivalent CO2 emissions [tCO2eq] | 1047.61 | 1047.61 |
| Annual operational cost [EUR] | 1,128,197 | 1,128,197 |
| Hybrid solar thermal and auxiliary natural gas boiler system | ||
| Useful energy of the solar thermal system [MWh] | 1302.27 | 2819.16 |
| Energy consumed by the natural gas boiler [MWh] | 15,439.30 | 14,653.00 |
| Equivalent CO2 emissions [tCO2eq] | 1003.56 | 952.45 |
| Annual operational cost of the natural gas boiler [EUR] | 1,080,751 | 1,025,710 |
| High-temperature heat pump | ||
| Energy consumed by the compressor [MWh] | 6943.24 | 6943.24 |
| Equivalent CO2 emissions [tCO2eq] | 812.36 | 1752.76 |
| Annual operational cost [EUR] | 1,666,378 | 1,617,775 |
Disclaimer/Publisher’s Note: The statements, opinions and data contained in all publications are solely those of the individual author(s) and contributor(s) and not of MDPI and/or the editor(s). MDPI and/or the editor(s) disclaim responsibility for any injury to people or property resulting from any ideas, methods, instructions or products referred to in the content. |
© 2025 by the authors. Licensee MDPI, Basel, Switzerland. This article is an open access article distributed under the terms and conditions of the Creative Commons Attribution (CC BY) license (https://creativecommons.org/licenses/by/4.0/).
Share and Cite
Sammoutos, C.; Kitsopoulou, A.; Lykas, P.; Gonidaki, D.; Vidalis, E.; Korres, D.; Rahbari, H.R.; Tzivanidis, C.; Bellos, E. Dynamic Investigation of Thermochemical Heat Upgrade and Alternative Industrial Heating Technologies. Energies 2025, 18, 1990. https://doi.org/10.3390/en18081990
Sammoutos C, Kitsopoulou A, Lykas P, Gonidaki D, Vidalis E, Korres D, Rahbari HR, Tzivanidis C, Bellos E. Dynamic Investigation of Thermochemical Heat Upgrade and Alternative Industrial Heating Technologies. Energies. 2025; 18(8):1990. https://doi.org/10.3390/en18081990
Chicago/Turabian StyleSammoutos, Christos, Angeliki Kitsopoulou, Panagiotis Lykas, Dimitra Gonidaki, Evangelos Vidalis, Dimitrios Korres, Hamid Reza Rahbari, Christos Tzivanidis, and Evangelos Bellos. 2025. "Dynamic Investigation of Thermochemical Heat Upgrade and Alternative Industrial Heating Technologies" Energies 18, no. 8: 1990. https://doi.org/10.3390/en18081990
APA StyleSammoutos, C., Kitsopoulou, A., Lykas, P., Gonidaki, D., Vidalis, E., Korres, D., Rahbari, H. R., Tzivanidis, C., & Bellos, E. (2025). Dynamic Investigation of Thermochemical Heat Upgrade and Alternative Industrial Heating Technologies. Energies, 18(8), 1990. https://doi.org/10.3390/en18081990