Article

A Photovoltaics and Battery-Based End-to-End Direct-Current Power Network for Community Solar

1
Holcombe Department of Electrical and Computer Engineering, Clemson University, Clemson, SC 29634, USA
2
Department of Automotive Engineering, Clemson University, Greenville, SC 29607, USA
3
Milwaukee Tool, Milwaukee, WI 53203, USA
*
Author to whom correspondence should be addressed.
Energies 2025, 18(8), 1971; https://doi.org/10.3390/en18081971
Submission received: 17 January 2025 / Revised: 9 April 2025 / Accepted: 9 April 2025 / Published: 11 April 2025
(This article belongs to the Section D: Energy Storage and Application)

Abstract

:
Eliminating fossil fuel as early as possible and electrifying everything by green sustainable electric power are some of the primary solutions for tackling the climate emergency. Solar electricity generated by photovoltaics is now the cheapest source of electric power generation. The cost of electrochemical storage batteries is plummeting and the combination of photovoltaics and batteries at a utility scale can provide a lower cost than electrical power generated by fossil fuel in many parts of the world. Thus, today, we nearly have a solution in sustainable green electrical power generation and storage. Globally, we have adopted alternating-current electric power infrastructure over direct-current power due to the invention of the transformer. However, due to the advancements in power electronics and loads based on semiconductors, the situation is totally different today. Except for induction motors running at rated speed, all loads using variable-frequency drive are direct-current loads. Photovoltaics, batteries, and virtually all loads are based on direct-current power. Considering power generation, transmission, distribution, and utilization as a single entity, we are wasting a large amount of power by using our alternating-current power electricity infrastructure. By using end-to-end direct-current power networks, we can save energy and capital investment in electricity infrastructure as well as the cost of the loads, as compared to the existing power infrastructure. Based on an end-to-end direct-current power network, a new concept for community solar is proposed in this paper. Without connecting to the existing grid, community solar can provide 24 × 7 electric power to residents. The proposed infrastructure concept can also have a transformative role in areas which are providing very high growth of green electric power. This concept can have an immediate profound impact on any new constructions in most parts of the world.

1. Introduction

Climate-related effects such as flooding [1], extreme-heat-related deaths [2], hurricanes [3], high food prices [4], etc., all over the world can be attributed to the climate emergency [5]. The primary solution for the climate emergency is to electrify everything by green electrical power for all energy applications [6]. Thus, to address the climate emergency, we have to expedite the green energy transition. The cost of electricity generation by photovoltaics (PV) has become so low that there is nothing cheaper than the generation of electrical power by PV [7]. At the utility scale, PV-generated electricity has reached as low a price as USD 0.0104/kWh [8]. This is mainly due to the falling prices of silicon modules [9]. For storing green electric power, lithium-ion batteries (LIBs) are emerging as a practical low-cost solution [10]. Improvements in technology and large-scale manufacturing are reducing the cost and improving the performance of LIBs, similar to PV [11]. A recent report of a battery energy storage system costing USD 66/kWh in China indicates that soon, almost all over the world, the cost of LIBs for storing electric power will be lower than the cost of pumped hydro. The emergence of PV and LIBs as a low-cost source for generating electricity indicates that, in addition to existing applications of PV, new applications of PV should be developed. In a previous review paper on community solar [12], we proposed a new concept for community solar where PV and a battery-based power system can serve an entire community without connecting to the grid. Our proposed concept [12] considers energy efficiency and the cost of power systems as design criteria to achieve the goal of sustainability and to mitigate the aftereffects of the climate emergency. In our approach, for the new construction of a subdivision of houses, the community solar project is a group of houses in close vicinity with solar panels on their rooftops. In addition, there has to be a nearby solar farm connected to the subdivision houses and next to its battery energy storage system to store the excess energy.
The primary objective of this paper is to show that the electricity generated by a carbon-free fuel energy source, namely, solar, and stored in a battery storage system meets the demands of the load around the clock. In Section 2, we provide the background material related to the necessity of an end-to-end direct-current (DC) power system. The re-designing and manufacturing of DC loads in houses are covered in Section 3. The methodology, which includes the proposed design and the details of the design for an end-to-end DC (EEDC) power network along with an evaluation of the EEDC system losses, is discussed in Section 4. The results are illustrated in Section 5. Lastly, the conclusion of the paper is described in Section 6.

2. Background of DC Versus AC Power Networks

The introduction of the direct-current (DC) grid was first announced on 4 September 1882, by Thomas Edison. He wanted to electrify the city of New York by installing metal wires on poles above the city streets to carry the power to every house. Since there would be a loss of power in those wires, the power could not be transported a long distance from the generator. Thomas Edison thought placing an electric power generator in every neighborhood would solve the issue of power loss in the wires and that creating such a network should not be an issue [13].
Due to the discovery of alternating-current (AC) transformer systems, voltages can be shifted easily from one level to another to allow the power to be transferred over a long distance at a high level of voltage with some power losses. When the electricity reaches the designated destination, the voltage is changed to a low level to be used locally, such as by homes and businesses. Due to the techniques for shifting the voltage level from low to high and then high to low, the transmission losses are minimized. In addition to the voltage-level-shifting techniques, the ease of extraction, transportation, and utilization and the low-cost features of fossil fuel made the electricity generated by AC systems more desirable. Therefore, the entire current global electricity infrastructure is based on an AC system.
With the discovery of the transistor in 1947, solar cells in 1955, and the first commercial use of lithium-ion batteries in 1991, we have a world now that is very different from when Thomas Edison introduced his DC grid for the first time in 1882. A large number of publications have advocated for and provided data to show the energy savings and system cost reduction features of DC power systems [14,15,16,17,18,19,20,21,22,23].

2.1. Fundamental Issues of AC Power Grid

The existing infrastructure of the AC power system network is an extremely complex interconnected network. Except for induction motors running at 100% speed, virtually all our loads powered by the AC electricity infrastructure are DC loads. This is due to the fact that, within each load, we convert AC power into DC power, and a variable-frequency device (VFD) is used in most of the loads. Therefore, employing a DC power network could save more than 30% in energy and capital [24]. The loss of power in Texas, USA, due to hurricane Beryl, which lasted several days, confirmed the fundamental weaknesses of the AC power system network [25]. Since the electric power utilities use AC power, they have to employ different techniques such as spinning reserves, load leveling, peak shaving, black start capability, energy arbitrage, and other grid ancillary services. On the contrary, renewable energy and especially photovoltaics systems generate DC power and battery storage systems store DC power. The components of the AC power system are based on active (P) and reactive (Q) power flows, frequency, voltage, and phase balance for grid stability. Renewable energy sources generate various DC voltages and current profiles. In order for AC sources to be connected, they first have to be synchronized to the same frequency level, which is standardized by the electricity grid. Doing that requires adding additional unnecessary components, such as inverter stages for grid synchronization, which result in DC power wastage. All synchronization grid issues and conversion component issues (DC to AC or AC to DC) can be avoided when the localized DC power infrastructure is applied. In a world where our power generation, storage, and utilization need DC power, we have AC power for transmission and distribution as an unnecessary broker. We are wasting a huge amount of energy and resources by continuing to use an AC power infrastructure in the 21st century. The future grid infrastructure should be resilient to obtain the maximum potential of renewable energy, specifically PV generation, as well as advance sensing, real-time decision making, and contingency planning. Some of the advantages that DC power systems offer are higher system energy efficiency, simplified control, high power quality, and better stability due to the absence of the synchronization, reactive power, frequency control, skin effect, and harmonic issues associated with AC grids.

2.2. Baseload Power Technique

Baseload power is the minimum amount of electricity generated that is needed to supply the electric grid at any given time, and the meaning of the term “baseload power” is the low-cost electricity available all the time to satisfy the minimum load demand. The daily demand for electricity has to be met by power plants, but it is not ideal or economically feasible for the power plants to generate the maximum electricity needed at all times. Thus, there are baseload electric power plants utilizing fossil fuel, such as coal-fired power plants and nuclear power plants, that can provide the minimum electricity power needed. Currently, this way of thinking is changing rapidly due to renewable energy integrations and dynamic loads. Renewable energy sources, such as solar and wind power, can be dispatched on demand and hence are made reliable by appropriately sizing the plant and the usage of a battery energy storage system (BESS) which can store the power until the load demands it. Due to the continuing reduction in prices for solar and wind power along with BESSs, the electricity generated from them is cheaper than building a new baseload power plant, and, also, it can effectively serve the bulk of loads [26]. One of the issues related to baseload coal and nuclear power plants is their limited ability to provide flexible services, such as the ability to ramp up and down quickly to satisfy the changing load demand, which, however, can easily be supplied by PV and wind generation [27]. All conventional techniques used such as generation, transmission and distribution planning, security-constrained power flows, and contingency analysis are designed and calculated specifically for baseload plant operation. With the introduction of virtual power plants, increased renewable penetration, smart algorithms for demand-response management, and dynamic loads, there is a need to upgrade all power flow analyses to real-time generation–load balancing techniques. This only can be carried out when we abandon the idea of using baseload power plants and incorporate a DC grid infrastructure, which is very suitable for PV and wind generation with battery storage, and which can ensure grid robustness, resilience, and reliability while reducing carbon emissions and electricity prices [28]. The idea of baseload power plants is outdated, not compatible with the current dynamic loads, and has severe flaws. As we progress towards localized DC power generation, it is crucial to have modern techniques rather than accepting the old techniques such as baseload power.

2.3. Energy Consumption

According to a 2019 study, by 2050, the global population is estimated to rise to 9.7 billion from 7.7 billion [29], and, over the same period of time, the global economy is expected to more than double [30]. As a result of urbanization, automation, and the rise of living standards, the energy demand will increase globally [31]. One estimate states that the global energy demand will increase by 48% in the next two decades [32]. If the world continues with business as usual, the acceleration of climate change and degradation of air quality will happen sooner than we anticipated. To protect our planet for generations to come and without tempering the growth of the world economy, we need to aggressively redouble our commitment to energy efficiency and increase the utilization of renewable energy, especially PV.

2.4. Curtailment Technique

Curtailment, in the electricity industry, refers to the deliberate reduction of the production of electricity generated in order to maintain the balance between supply and demand operations or due to transmission constraints in the grid, which is crucial for avoiding power outages. When energy is curtailed today, it almost always means the reduction of the infeed power that comes from renewable energy sources, namely, solar and wind, which has zero fuel cost and emits less greenhouse gas than fossil fuels. Curtailment is used in the AC electricity grid to solve various issues for grid management, such as restoring the frequency of the grid in the transmission level or helping bypass local bottlenecks in the distribution level [33]. The main reason for the curtailment technique to be utilized is not the surplus of electricity generated from renewable sources, but rather the inability of the current power grid to transport this excess power to the consumers. For the current situation of the electricity grid, curtailment is a vital but wasteful technique that uses renewable sources for balancing the AC grid, and, to eliminate the use of this technique, on-site energy storage should be available, the AC grid should be expanded, and localized DC power and a DC grid should be established since PV produce DC power and energy storage stores DC power.

2.5. Power Wastage in Inverter Sizing

As is common knowledge, the existing infrastructure of the electricity grid is based on an AC power system. If PV systems, such as solar farms, which provide DC power systems are utilized, along with battery storage, there will be a need for the usage of inverters which convert the DC power to AC power to supply the loads. The size of the inverter should be considered as the major factor of power wastage. Therefore, if the size of the inverter increases, the amount of power wastage rises as well. For instance, a 150 kW solar panel array connected to a 100 kW inverter that has a 1.5 sizing factor was simulated, and the estimated loss of energy due to the oversizing of the inverters yielded the result in Figure 5 of reference [34].

2.6. Role of Battery Energy Storage Systems in the Sustainable DC Power Grid

Lithium-ion battery energy storage systems (BESSs) play a major part in the transition toward a clean, renewable, and sustainable grid through electrification. Based on advancements in manufacturing as well as the rapidly declining costs, lithium-ion battery chemistry is dominating the BESS market. As an example of advancement in BESS manufacturing technology, the lithium-ion battery manufacturer CATL announced in April of 2024 the latest grid-scale BESS product with zero degradation over the first five years, which is the world’s first of its kind, and the battery size is 6.25 MWh [35]. For the remainder of this paper, BESS always refers to a lithium-ion grid-scale BESS. The value of integrating a BESS into the bulk power grid is already well established and is being implemented by many utilities all over the world [36]. In the US, most of the utility-scale BESS is utilized to provide operating reserves and ancillary services to the grid, and several other applications include energy arbitrage, renewable energy curtailment reduction, load leveling, peaking capacity, black start capabilities, and transmission and distribution upgrade deferrals [37]. As we know by now, all these applications are designed to be used in AC grid interactions, and, as a result, the maximum potential use of BESSs will be reduced. For AC grids, the operation of BESSs is mostly limited to 4–6 h for supplying peak shaving. Since the capital and operational costs are high, most of the time, the demand for hours of operation is low. However, this is a misunderstanding. As the fuel of BESSs is free (mostly from PV farms) and the hours of operation for BESSs increase beyond 8–16 or 16–18 h, the operation costs of BESSs will fall, as outlined in reference [38]. For obtaining the highest energy efficiency in the power grid, as well as ultra-low-cost power, an end-to-end DC power network is necessary. In our proposed design architecture, the BESS will play a significant role and will be very essential to the resiliency of the stand-alone infrastructure network since it will supply the utilization site with 24 × 7 green electric power.

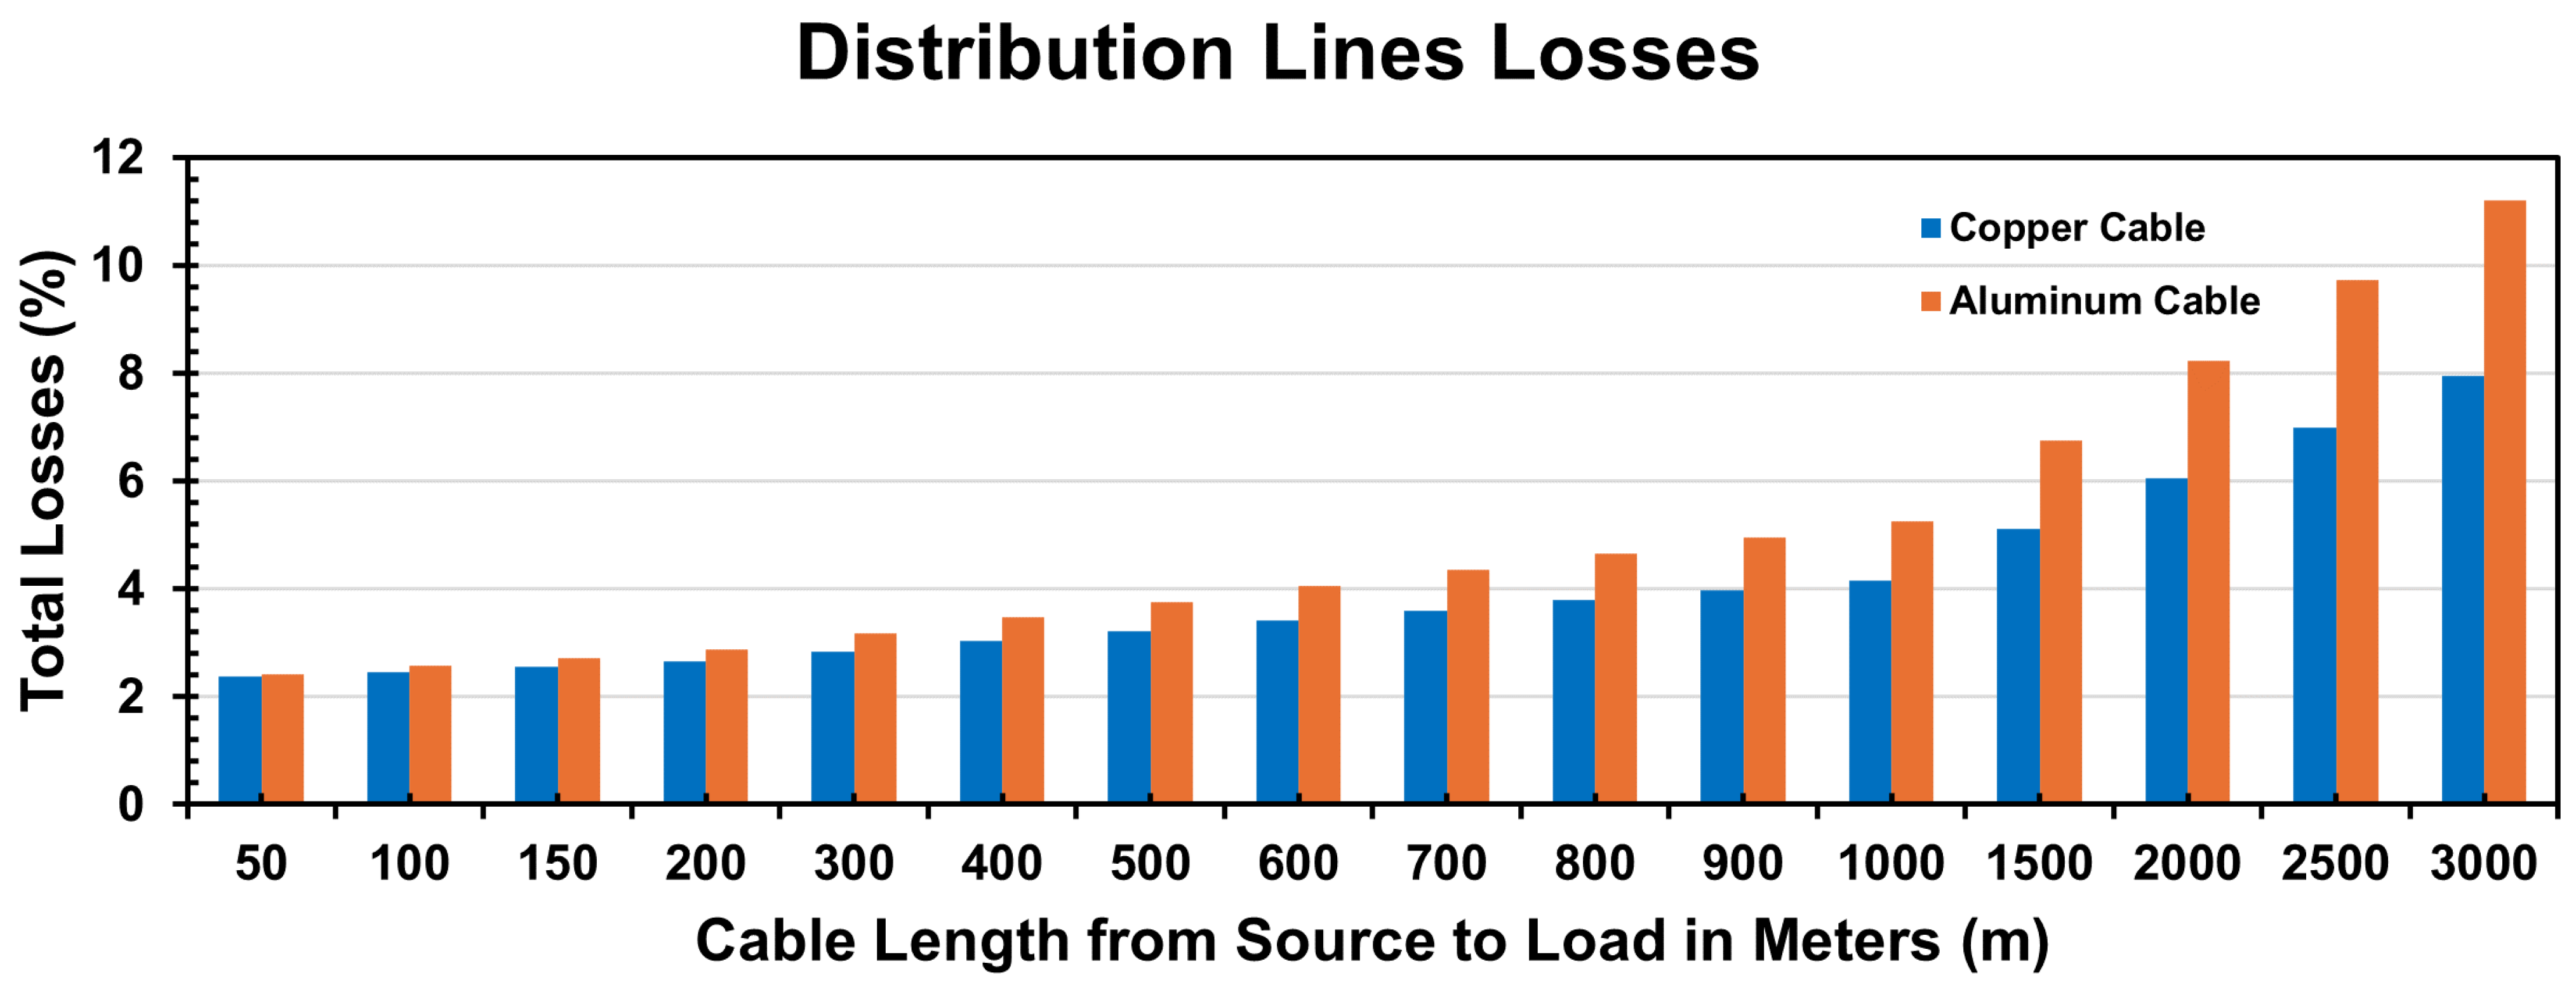
2.7. Role of Distribution Lines in the Sustainable DC Power Grid

It is very important to construct a transmission or distribution lines network to connect the distant solar or wind generation sites and their BESSs with urban or suburban load centers such as the subdivision considered in this paper. The technology of DC transmission and distribution lines has several advantages over the AC technology, and they are outlined in reference [39]. By employing a DC power network, the conversion losses will be minimized with several high-efficiency DC-to-DC converters. Thus, in our case, the distribution lines are constructed from the ground up, and our proposed conceptual design for the converters is LVDC-MVDC-LVDC. The proposed design architecture of the community solar project will utilize silicon carbide (SiC)-power-electronics-based converters for converting LVDC power from solar and battery storage farms to MVDC distribution lines and back to the LVDC utilization site.

2.8. Role of Community EV Charging Station in the Sustainable DC Power Grid

Globally, the demand for electric vehicles (EVs) is on the rise since it is a practical solution for the environmental concerns that are associated with the usage of fossil fuel in the transportation sector. Locally, the lack of widespread public EV charging station infrastructure prevents acceleration toward the EV transition. Thus, there is an urgent need for adopting the idea of constructing community EV charging stations with multiple chargers in any new construction of a subdivision to support the surge of electrification and help with decarbonization. In our proposed design, we have accounted for community extremely fast (XF) EV charging stations as a future expansion since they play an important role in energy transition, as well as to help sustain the ever-growing EV demand and reduce the impact on the existing AC grid and the environment. In the community XF EV charging stations, the implementation of a DC power network will allow for fast charging times and high well-to-wheels efficiency, and there is no need for power conversion.

3. Re-Designing and Manufacturing DC Loads

For EEDC power networks, there is no need for internal conversion of power from AC to DC within the load. As shown in reference [40], within the load (e.g., an EV charger), the purpose of many components in the load is simply to change the AC power obtained from the grid, to convert AC into DC power with the DC power network. As compared to an AC grid, for an EEDC power network, the cost of an EV extremely fast charger is reduced by 25–30% [41]. In addition to cost reduction, due to lesser number of components in DC loads serving an EEDC power network, system reliability will be improved. The adaptation of loads for a DC power grid requires the re-design of the printed circuit board used in the design of load as well as rearranging the machines within the manufacturing facility, resulting in a change of layout for the factory [42]. Without a change of policies that mostly requires tax reduction or subsidies, the load manufacturer may not be interested in making any changes. Thus, policies in each country become very important for the adoption of EEDC power networks.

4. Methodology

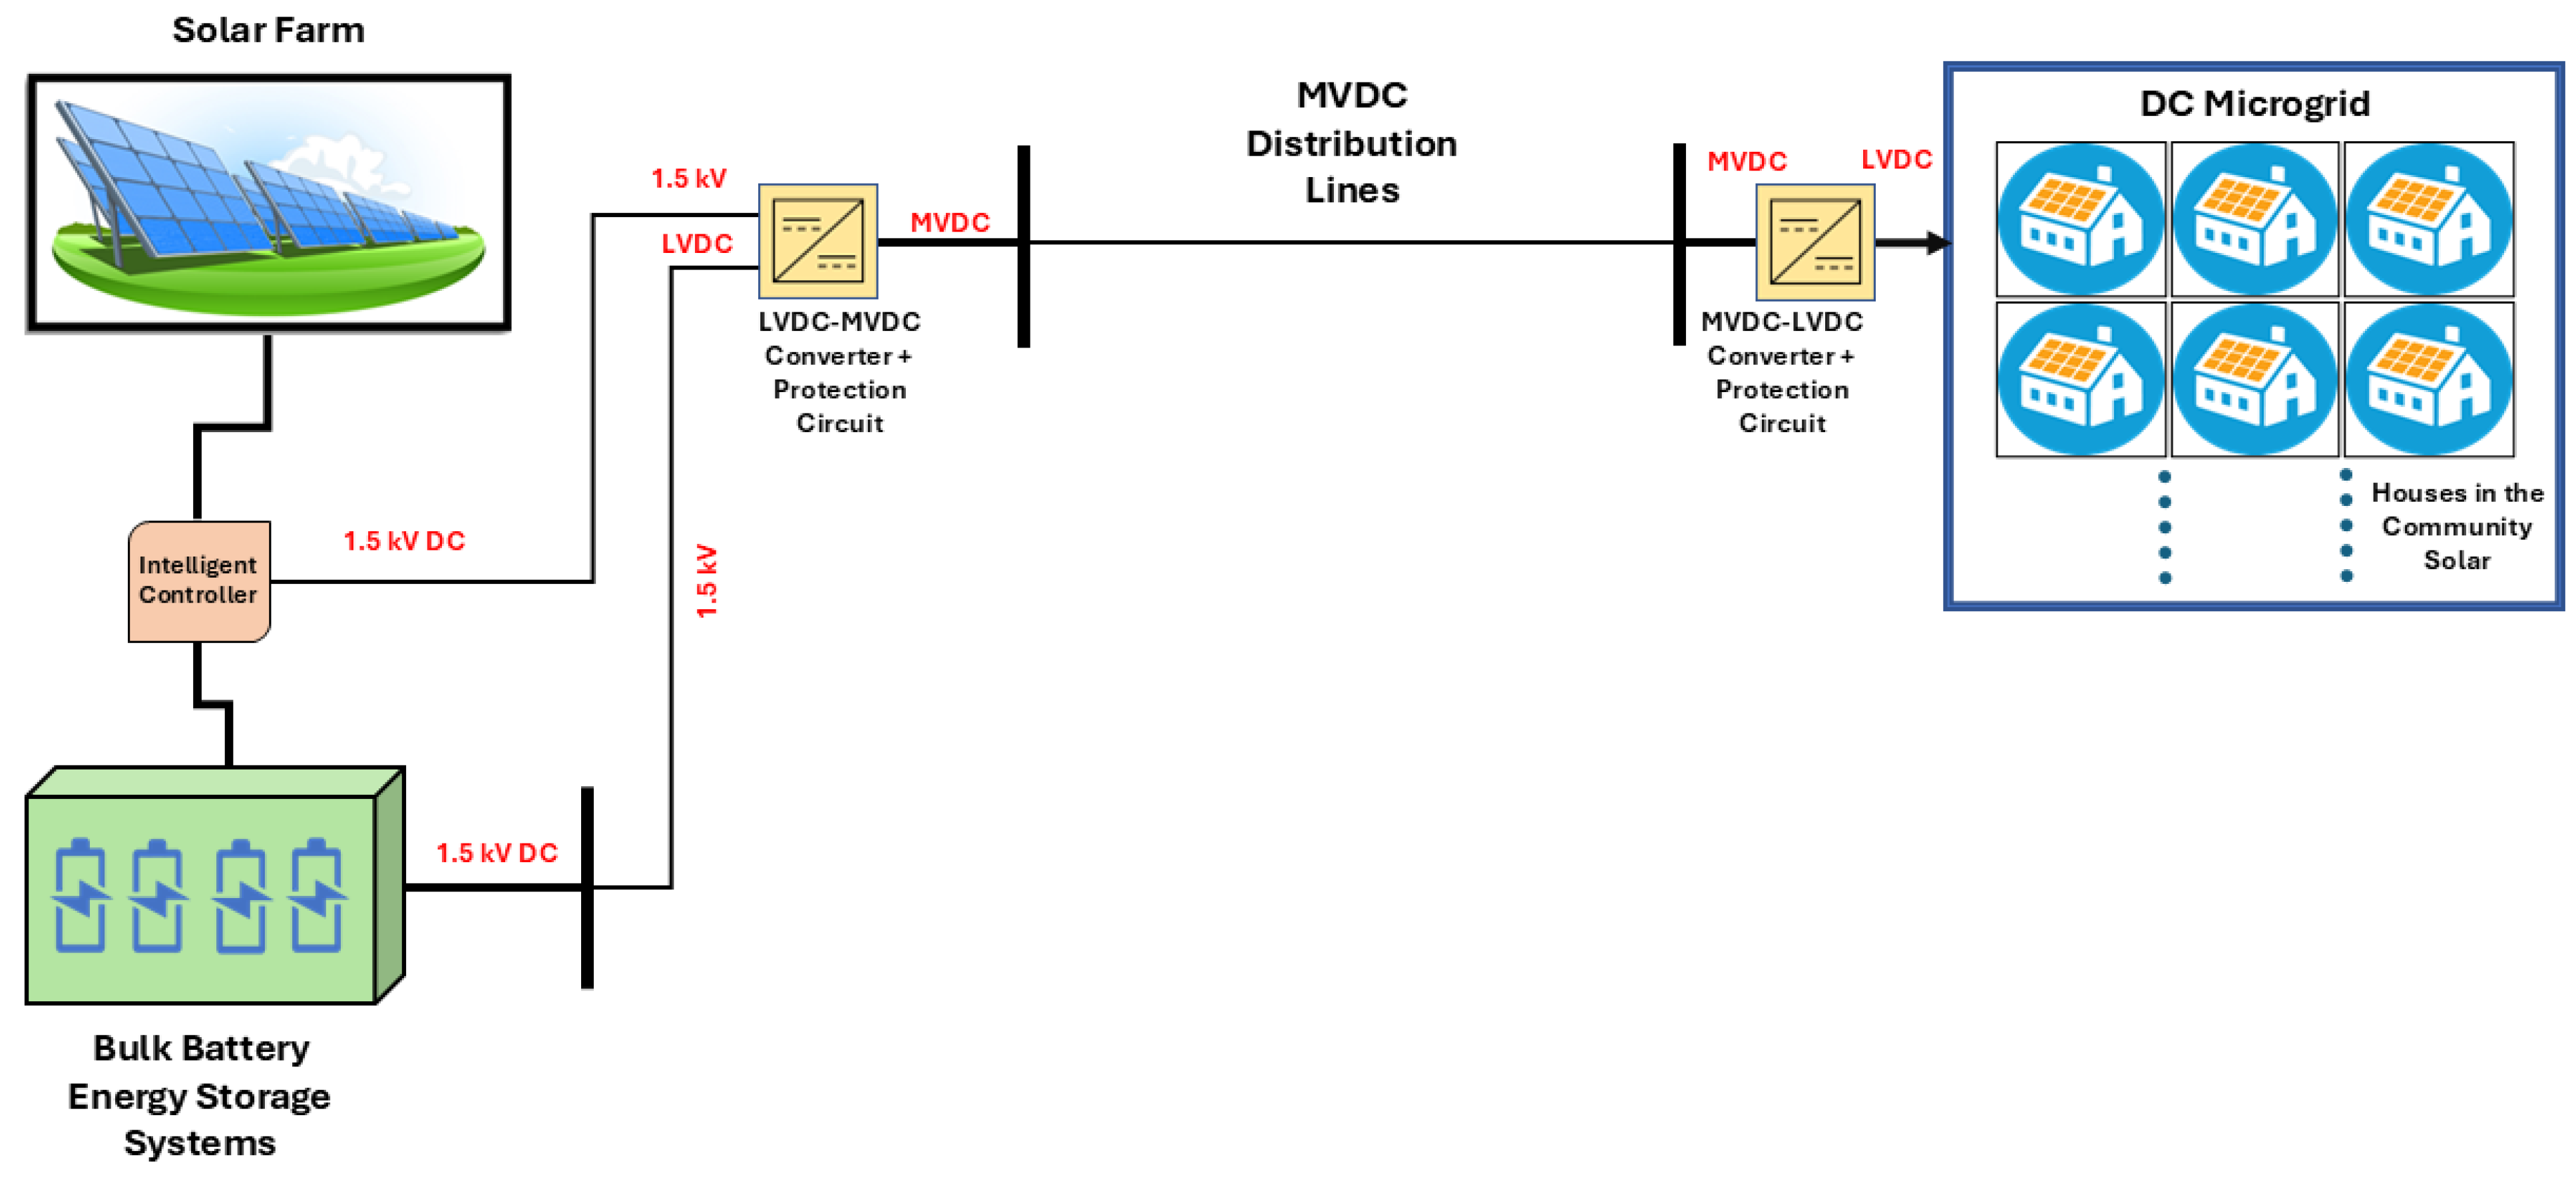
4.1. Proposed Sustainable EEDC Power Network for Community Solar

The current emerging concept of community solar has a limited role, and the current and most popular model for community solar is a utility-sponsored model [12]. That model has limited scope and value, and it will continue to grow at a very slow pace because it is connected to the AC grid [12]. Community solar has a very insignificant role and presently does not contribute significantly to the total installed solar PV capacity. For instance, in the United States, the total installed PV at the end of 2023 for community solar was 6496.5 MWdc, as compared to utility-scale solar, which was 118,557.8 MWdc, residential solar, which was 36,268.2 MWdc, and commercial solar, which was 18,875.5 MWdc [43]. Due to the limited role of the current community solar concept mentioned above, we present a new concept for community solar based on an EEDC power network which can cause significant growth in the total installed solar PV capacity not just in the United States but also in other countries. The proposed design of the community solar is illustrated in Figure 1. The architecture design consists of a sustainable DC power network with solar farm generation and co-located battery energy storage connected to a medium-voltage DC (MVDC) distribution bus. For the community solar, we assumed that there are 50 houses in the subdivision. The proposed design can be implemented globally as a sustainable EEDC power network without affecting the AC infrastructure grid since it is a stand-alone system. Depending on the distance between the solar farm and the load, both low-voltage (<1500 V) DC (LVDC) [14] or MVDC (2 kV–100 kV) can be used in designing the EEDC power network. The solar farm and co-located BESS will provide 24 × 7 electric power. The community solar will be powered directly by rooftop solar panels, a solar farm, and a BESS around the clock.

4.2. Design and Implementation of Direct-Current Power Network for Community Solar

The overall view of the proposed design architecture, which is depicted in Figure 1, divides the power network infrastructure into several familiar zones—namely, DC power generation using a distant solar farm with co-located BESSs, transmission lines with LVDC-MVDC-LVDC distribution lines, and, lastly, community solar with a subdivision of 50 houses. In this section, the discussion will be mainly about the selection of location and geographical considerations, design concepts, and sizing decisions for the solar farm generation and solar rooftop generation.

4.2.1. The Selection of Location

As stated previously, this proposed design architecture for community solar can be implemented in most parts of the world as a new construction. To eliminate the geo-spatial and temporal variability, this study is conducted in the town of Summerville, Berkeley County, SC, USA. Since the start of the pandemic in 2020, the state of South Carolina has experienced strong growth in the population that has outpaced most of the states in the US, and, in 2023, the state of South Carolina was number one in terms of inflow-to-outflow ratio, with a rate of 2.11 [44]. In addition, two cities (Myrtle Beach and Greenville) were among the top 10 cities nationwide for most favorable inflow-to-outflow ratio in 2023 [44]. The location of Summerville is 35 min from Charleston, which is on the coast, and 140 min from Myrtle Beach, which is also on the coast. This designated location is perfect since it is far enough from the coast. Due to the increase in population, there will be a need for constructing new houses to accommodate the flows of newcomers without affecting the existing AC grid. This proposed design project could be implemented along or near to a major highway or interstate such as interstate 26 (I-26) to provide easy access to the designated project location. For the reasons explained above, this state is an ideal place to implement the proposed design architecture.

4.2.2. Power Network

All the load requirements will be met by the rooftop solar of 50 houses in the community solar, the solar farm, and batteries located close to the designated project location. The BESS is co-located with the solar farm since the power generated by rooftop solar is consumed by the load during daytime. Thus, there is no need to locate batteries in the house. This may not be true in all community solar cases. In that case, the batteries can be located in every individual home.

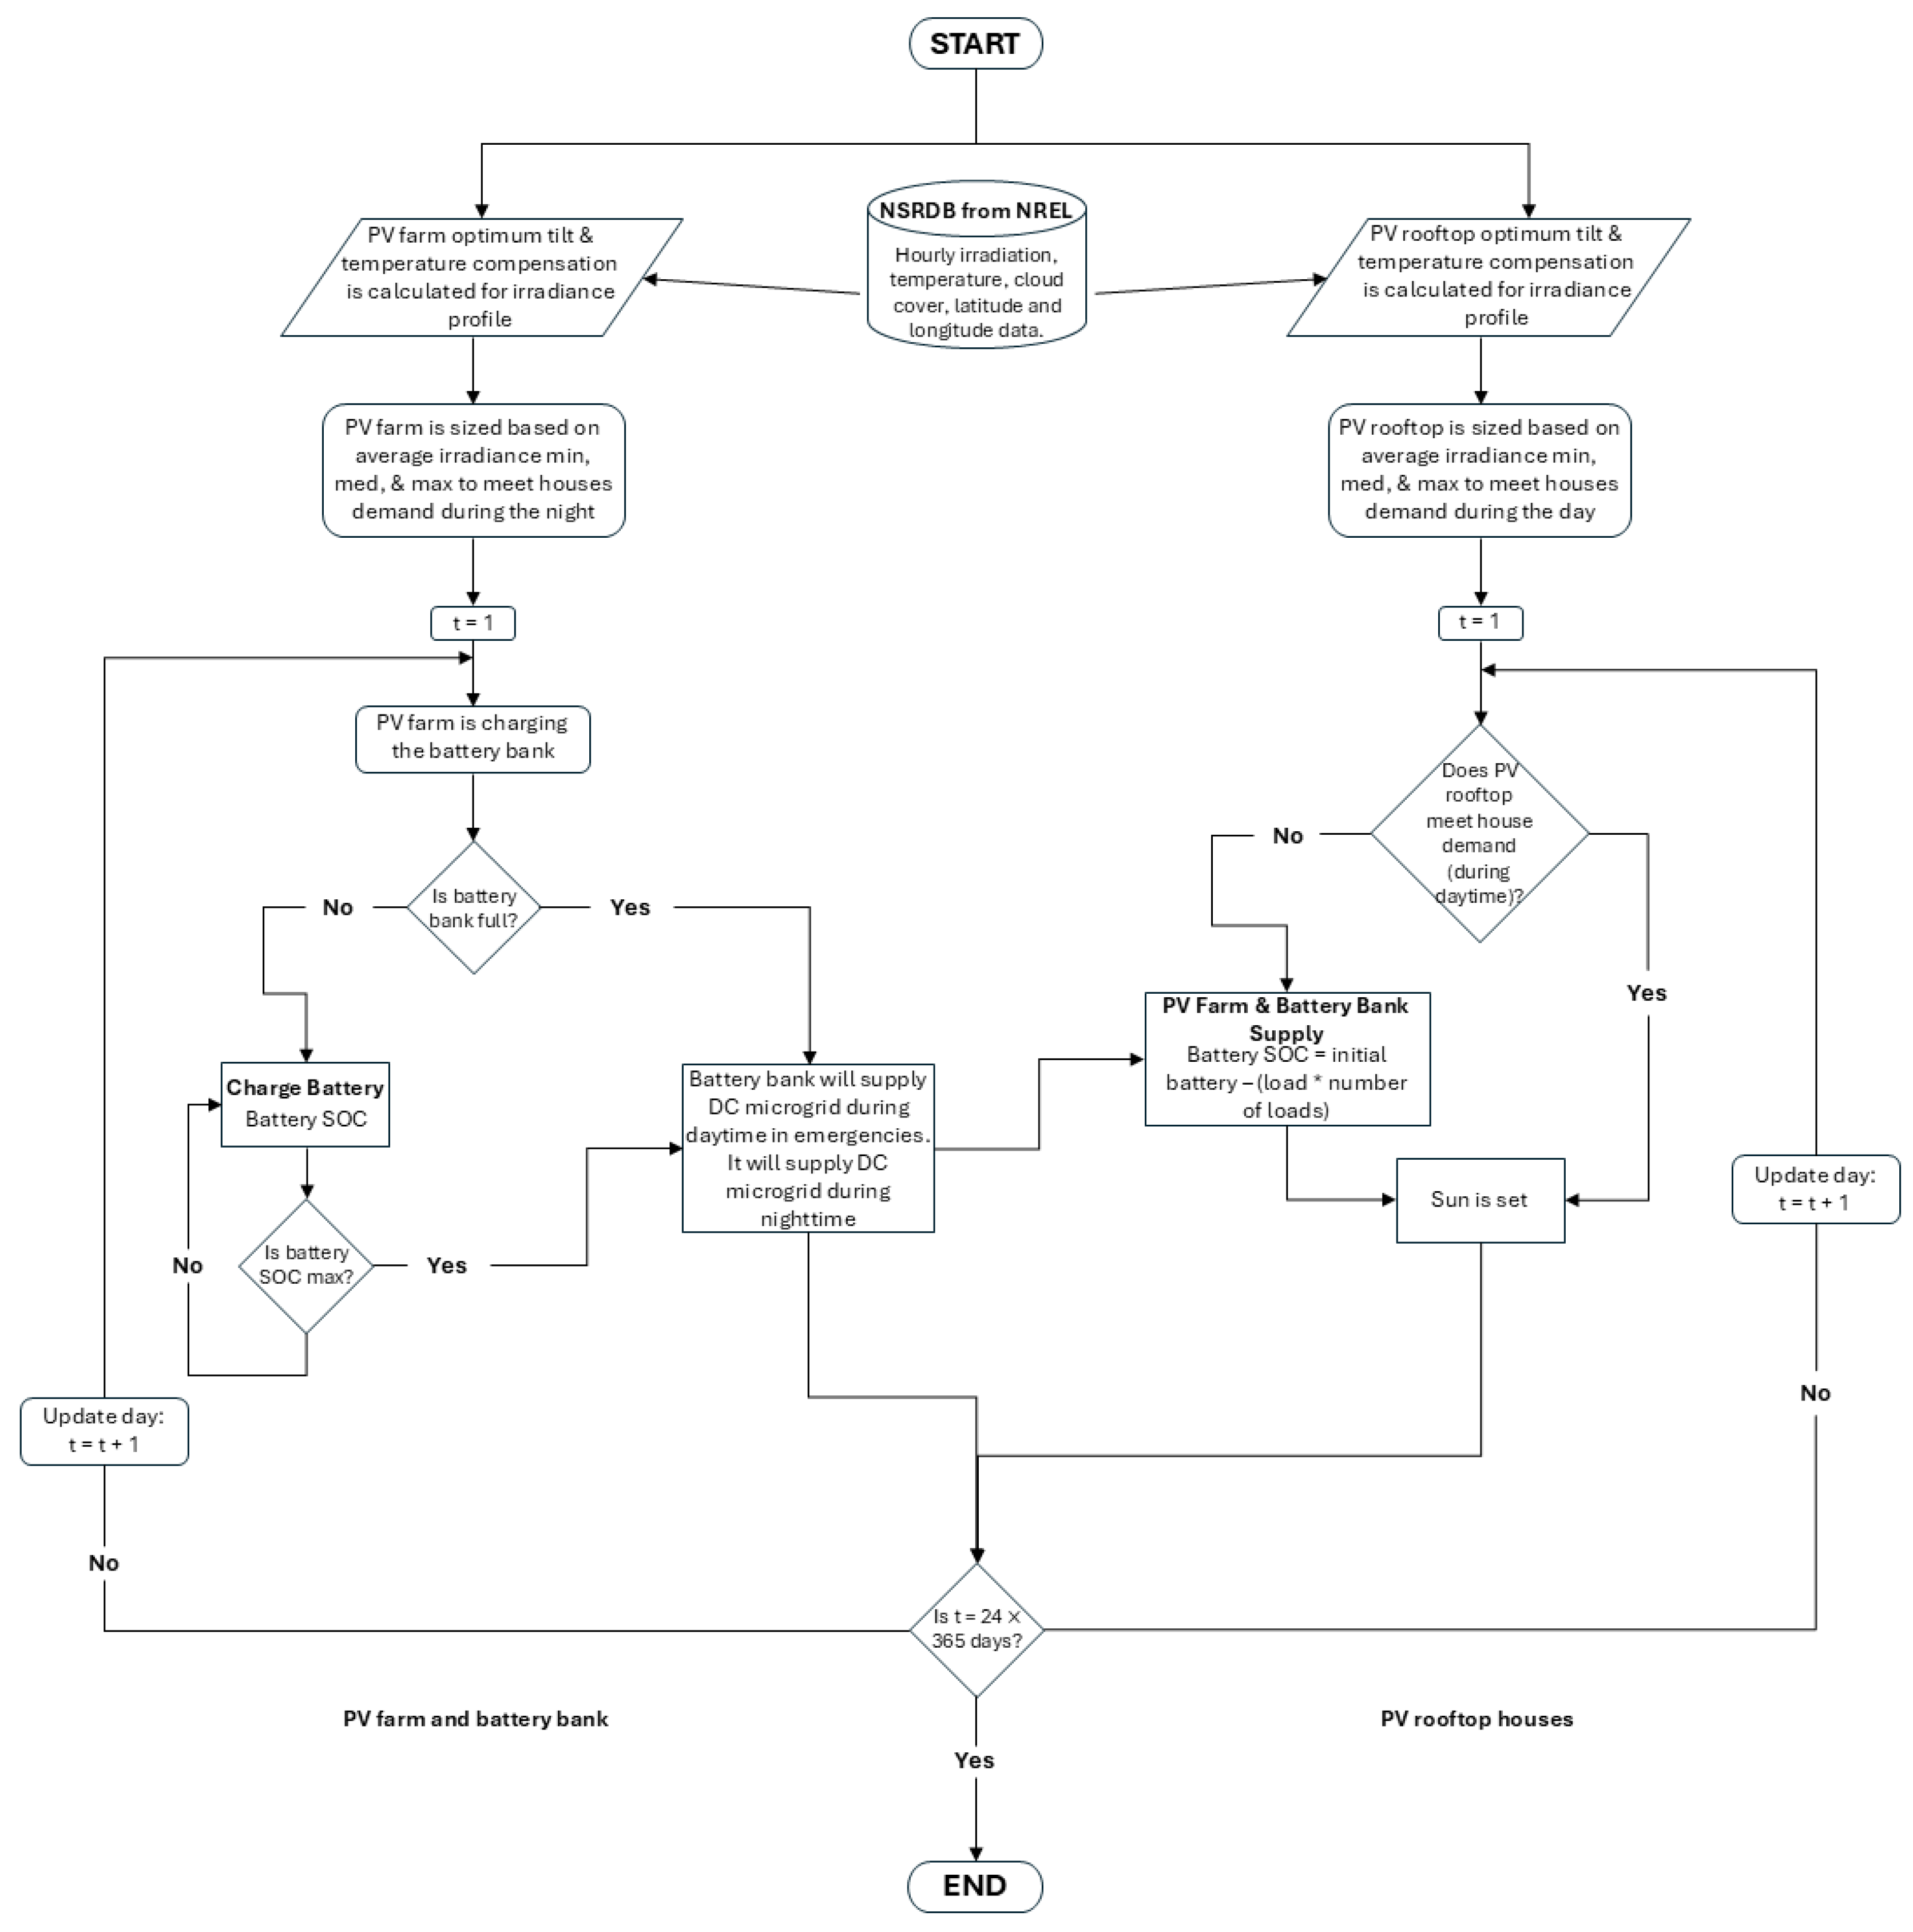
4.2.3. Optimal Power Supply Control

The power demand at the MVDC line’s user side includes loads from residential users of community solar. For simplicity, we only focus on the power supply control from the PV farm and battery storage to the MVDC system. That is, we consider only the power split control problem so that power flow among the PV farm, battery storage, and the MVDC distribution line (i.e., demand) will be optimally decided to meet the load demand and minimize energy discard at the PV farm.

4.2.4. Community Solar of 50 Houses

Each single-family dwelling unit of the 50 units has an equal number of square feet or square meters of living area, which includes any space that is cooled or heated. To guarantee maximum solar power generation, each rooftop orientation of the 50 houses, which face the south direction, is exploited for roof-mounted PV. The adequate size area of each rooftop is calculated to be 33 square meters or 355.209 square feet. The optimum tilt of the mounted PV panel is found to be 35 degrees. The installed roof-mounted PV modules are the state of the art for residential solar modules with a high efficiency of 23.8%, maximum power output of 465 W, and pure black aesthetics for the external appearance [45]. This type of solar panel was selected because it was designed to be utilized on top of the roof of residential houses [46]. The weight of a single panel is 20.5 kg [45]. Based on the technical sheet generated by the manufacturer [45], the first-year degradation is less than 1% and the annual degradation for year 2 until year 30 is less than 0.35%. Figure 2 shows the performance of the PV module for an installed solar panel and Table 1 presents the solar PV panel characteristics [45]. Each house among the 50 houses has a distinguished load profile for the entire year, but all 50 houses contain the same electrical appliances which make up the load profile. The list of the electrical appliances in any single-family dwelling unit of the 50 units is provided in Table 2 [47].

4.2.5. Mathematical Formulation and Sizing of the Solar Farm and BESS

The preliminary step for designing a solar farm is sizing the solar farm by obtaining the solar irradiation profile for the desired geographical location which is under test. Taking into consideration that the 50 houses will be close to other houses in nearby urban or suburban localities, the land area for the solar farm is limited. Thereby, the location of the localized solar farm is assumed to be several kilometers from the designated location of the community solar. The selected PV module to be installed in the solar farm is the state of the art for utility-scale PV panels with a high efficiency of 25% and maximum output power of 675 W [48]. This model of solar panel was chosen because it was designed to be installed in a solar farm as utility-scale PV [46] and the weight of a single panel is 33 kg [48]. Based on the technical sheet generated by the manufacturer [48], the first-year degradation is less than 1% and the annual degradation for year 2 until year 30 is less than 0.35%. Table 3 presents the utility-scale solar PV panel characteristics. The land-use feasibility and environmental impact study for the designated location are already approved. Thus, the solar farm is shovel ready and not in interconnection queues. The designing and sizing of the solar farm are illustrated in the subsections below.

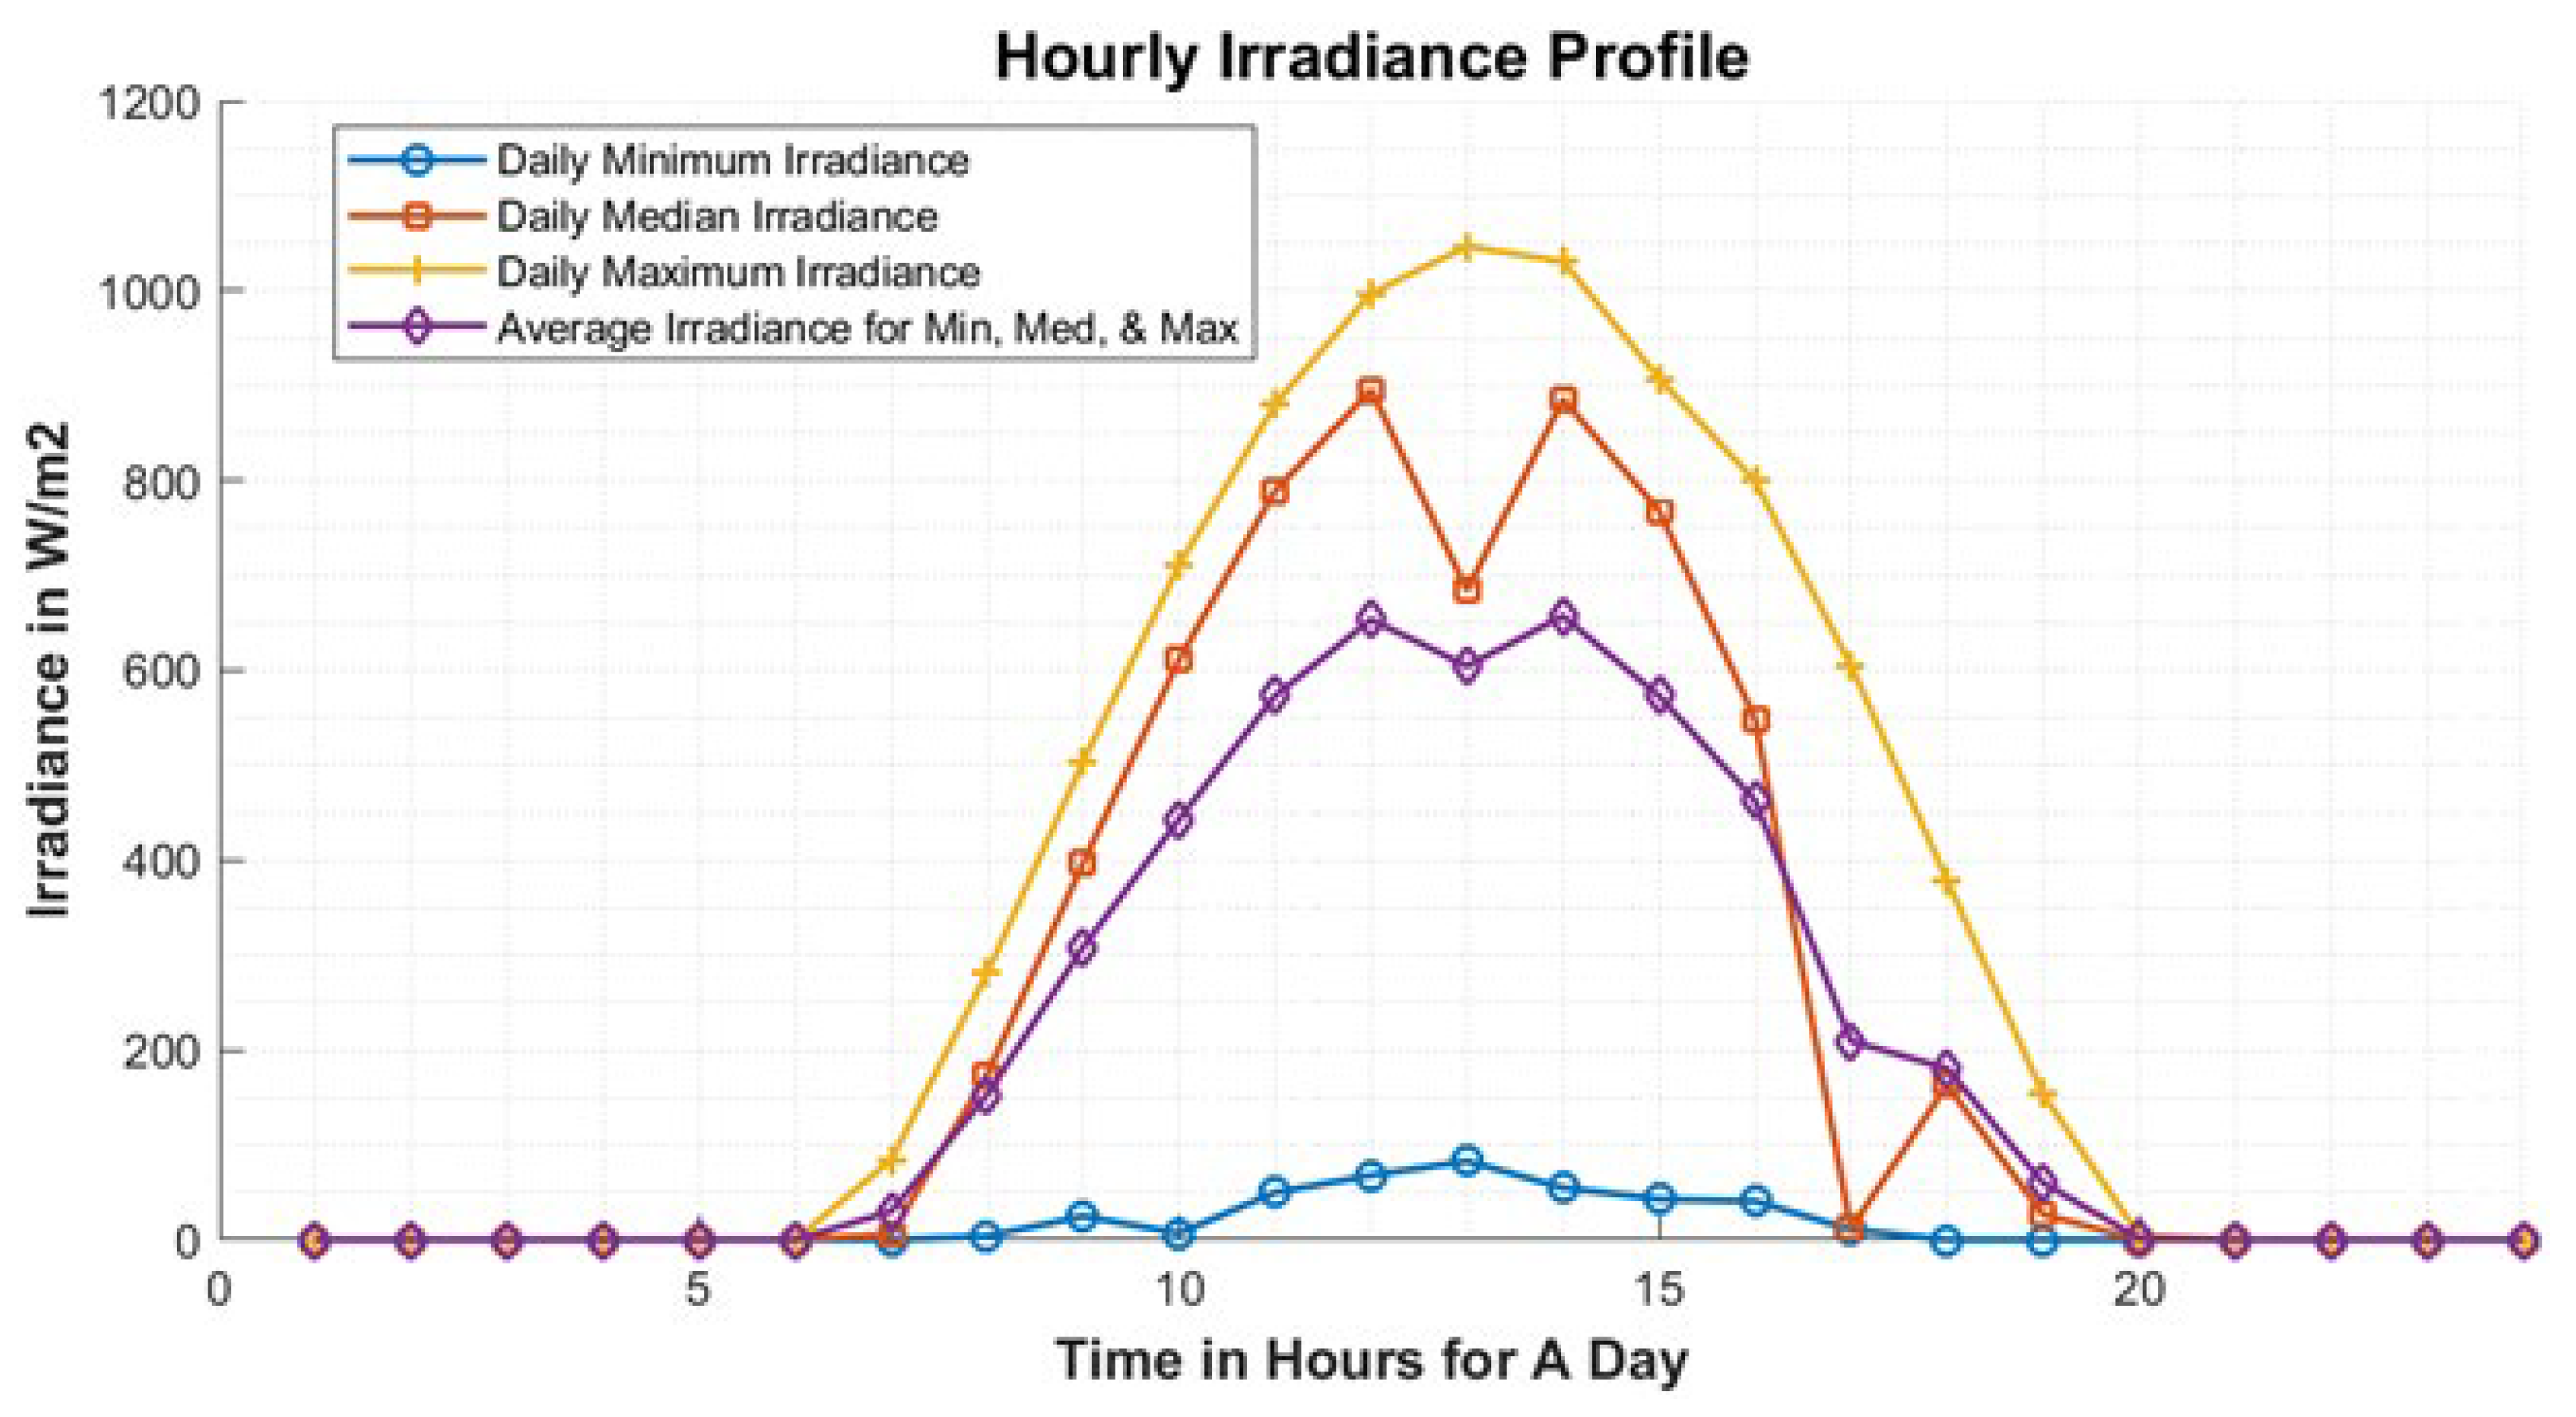
Solar Farm Irradiation Profile

The data for the hourly solar irradiation profile were gathered based on the National Renewable Energy Laboratory’s (NREL’s) National Solar Radiation Database (NSRDB) for the year 2022, which is the latest update at the time of writing the results of this study. The annual irradiation profile for the solar farm location mentioned above was downloaded from the NSRDB for the year 2022 on an hourly basis [49]. To account for a realistic design in the irradiation profile of the solar farm, our model includes the direct normal irradiance, the diffused horizontal irradiance, and the global horizontal irradiance components. The solar farm is oversized, based on the average irradiance for minimum, median, and maximum irradiances, such that the maximum load demand for the utilization site is easily satisfied with the solar generation, even during a cloudy day. Therefore, the reliability of meeting the yearly demand of the load is ensured. The output profile for the solar panel was temperature compensated and the optimum tilt angle for solar panels was also calculated every four months (spring, summer, and winter), which ensures better irradiance as compared to one tilt angle for the entire year. Since the designated farm location generates sufficient tilted and temperature-compensated irradiance, single-axis or double-axis trackers were not utilized. MATLAB software version R2023b was used to calculate the optimum tilt angle and the temperature-compensated solar panel output for the desired solar farm location. Figure 3 shows the hourly irradiation profiles for three random different days of sunshine in the year 2022 at the solar farm location and the average of all three of them.

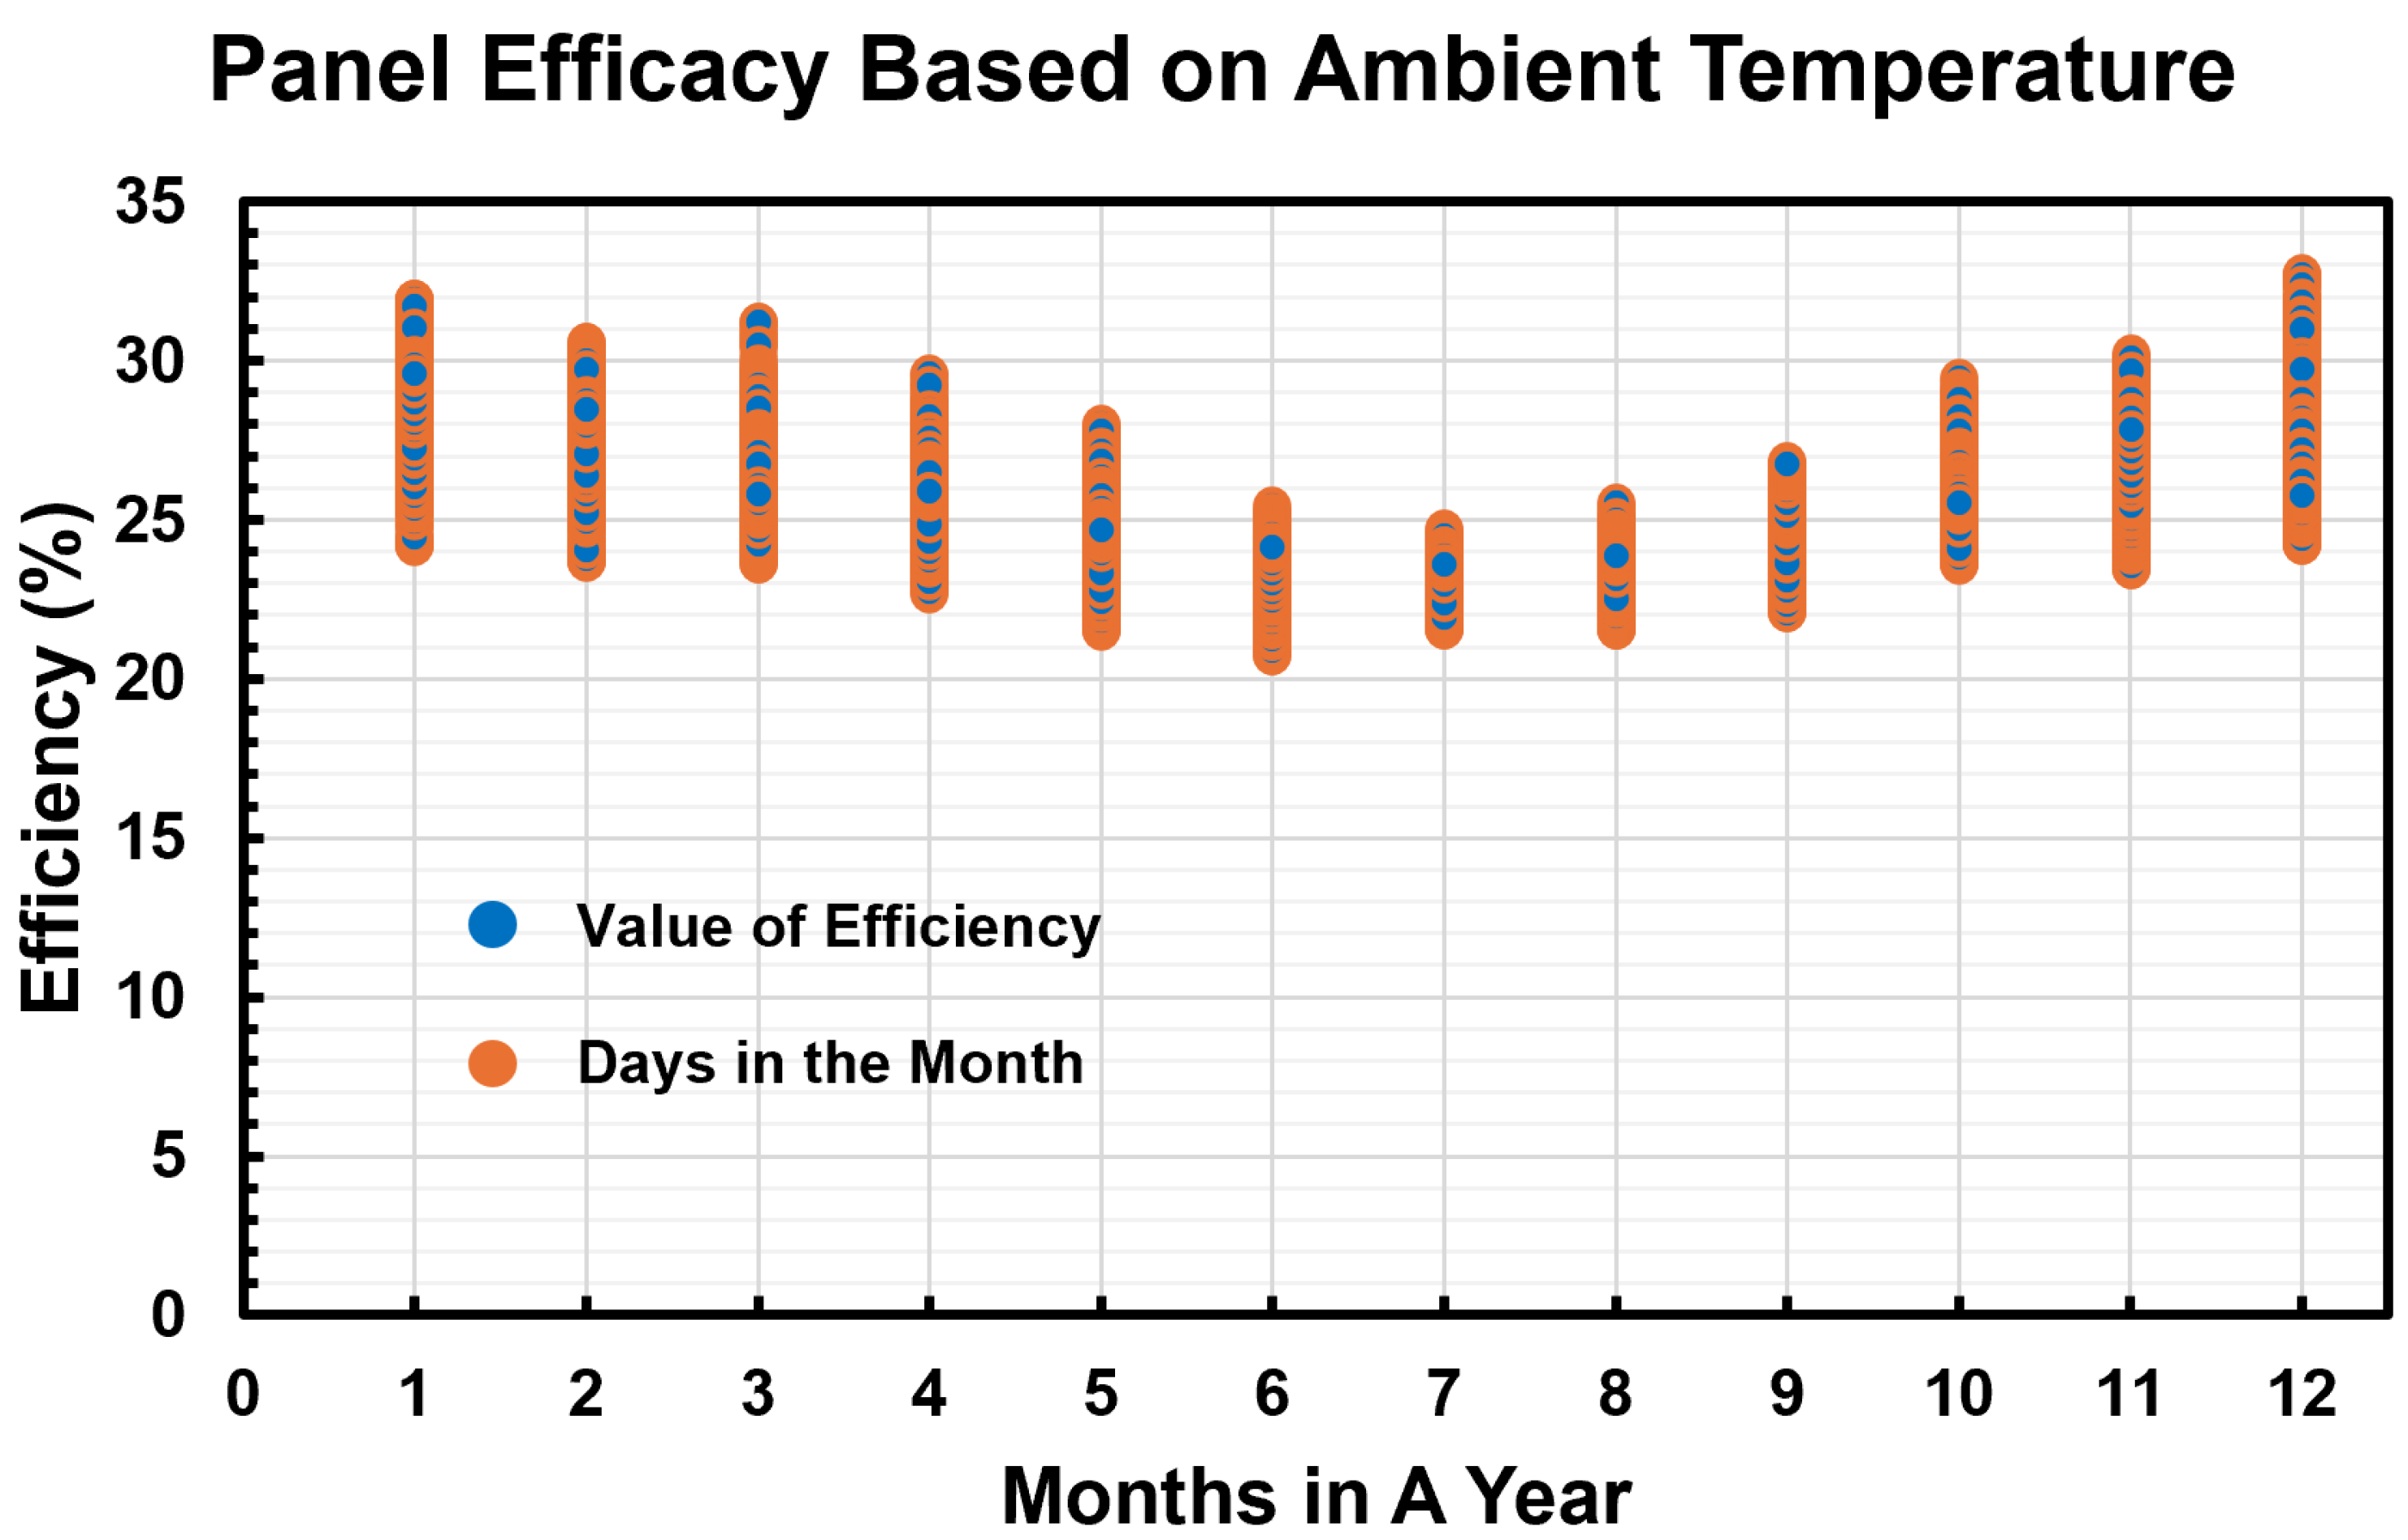
Temperature Compensation Calculations

The formula which is used to find the temperature compensation of the solar panels (solar farm panels and solar residential panels) is as follows [38]:
Compensated   Panel   Efficiency = Panel   Efficiency + T t e s t T a m b i e n t × T p o w e r   d e r a t e   f a c t o r
where solar farm panel efficiency is assumed to be 25.0% for AIKO STELLAR 3N + 72 Dual-Glass [48];
T t e s t = 25 °C, assuming the standard testing conditions (STC);
T a m b i e n t = ambient temperature for the location from the NSRDB;
T p o w e r d e r a t e f a c t o r = −0.26% per rise from T t e s t .
The solar residential panel efficiency is given as 23.8% for AIKO NEOSTAR 1P Mono-Glass [45].
After the calculations of temperature compensation, an interesting observation is made. During the winter, with low temperature, the power derate factor decreases, which leads to high solar panel efficiency during the sunlight hours in the wintertime. On the other hand, during the summer, with high temperature, the power derate factor increases, which leads to low solar panel efficiency. As a result, it is not an optimal condition for the panel efficiency. Thus, the solar panel output shows improved power during low-temperature days. Figure 4 presents the compensated panel efficiency during the year. In Figure 4, the blue dot represents the value of efficiency for the panel on a day and the orange vertical line represents the days in the month. For instance, if you look at the month of January, which is 1 in the figure, the coldest day in the month has the highest value of efficiency, which is the highest blue dot in the orange line, while the least cold day in the month has the lowest value of efficiency, which is the lowest blue dot in the orange line.

Optimum Tilt Angle Calculations

The equation which is used to find the optimum tilt angle for the solar panels is as follows [38]:
GHI   ( on   tilted   solar   panel   surface ) = DHI + DNI × cos θ
For the optimum tilt angle of the PV panels, the model is estimated based on hourly direct normal irradiance (DNI), diffused horizontal irradiance (DHI), and global horizontal irradiance (GHI). The reflected or ground-reflected radiation is ignored in the optimum tilt angle calculations. In the above GHI formula, cos θ is estimated by using the equations below:
cos θ = sin δ × sin ϕ × cos β sin δ × cos ϕ × sin β × cos ψ + cos δ × cos ϕ × cos β × cos + cos δ × sin ϕ × sin β × cos ψ × cos + cos δ × sin ψ × sin × sin β
where
δ = declination angle, evaluated by
δ = 23.45 ° × sin 360 / 365 × d a y 81 ;
ϕ = latitude of designated location, and, in our case, the generation and utilization sites are the same;
ϕ = 33.01867;
ψ = panel azimuth angle, and ψ = 0 since, in the northern hemisphere, the solar panels are orientated toward the south, assumed to be 0 ° facing the equator;
β = panel tilt daily, and its value is evaluated by
β = 90 α
and the elevation angle value is evaluated by
α = 90 ϕ + δ ;
= hour angle where the value of can be evaluated using the relations
Equation   of   Time   ( EoT ) = 9.87   ×   sin   { 2   ×   ( 360 / 365 )   ×   ( day 81 ) } 7.53   × cos   { ( 360 / 365 )   ×   ( day 81 ) } 1.5   × sin   { ( 360 / 365 ) × ( day 81 ) }
Time   Correction   Factor   ( TCF ) = 4 × Longitude   Local   Standard   Time   Meridian ) + EoT
= 15 ° × ( Local   Time + ( TCF / 60 ) 12 ) .
As mentioned above, the optimum tilt angle for the solar farm was divided annually into three seasons, each spanning four months, to accommodate the seasonal variations in the irradiation profiles, resulting in a high generated power output overall. Based on the calculations above, the tilt of each season was used to calculate the tilted global horizontal irradiance (GHI) profile. Then, the power output was calculated based on the tilted values of the GHI profile and the compensated panel efficiency. The values of the optimum tilt angles that maximize the solar panels’ output are 41°, 14°, and 49° for spring, summer, and winter, respectively. MATLAB software was used to calculate the optimum tilt angle and the temperature-compensated value of the solar panel output for the designated solar farm location.

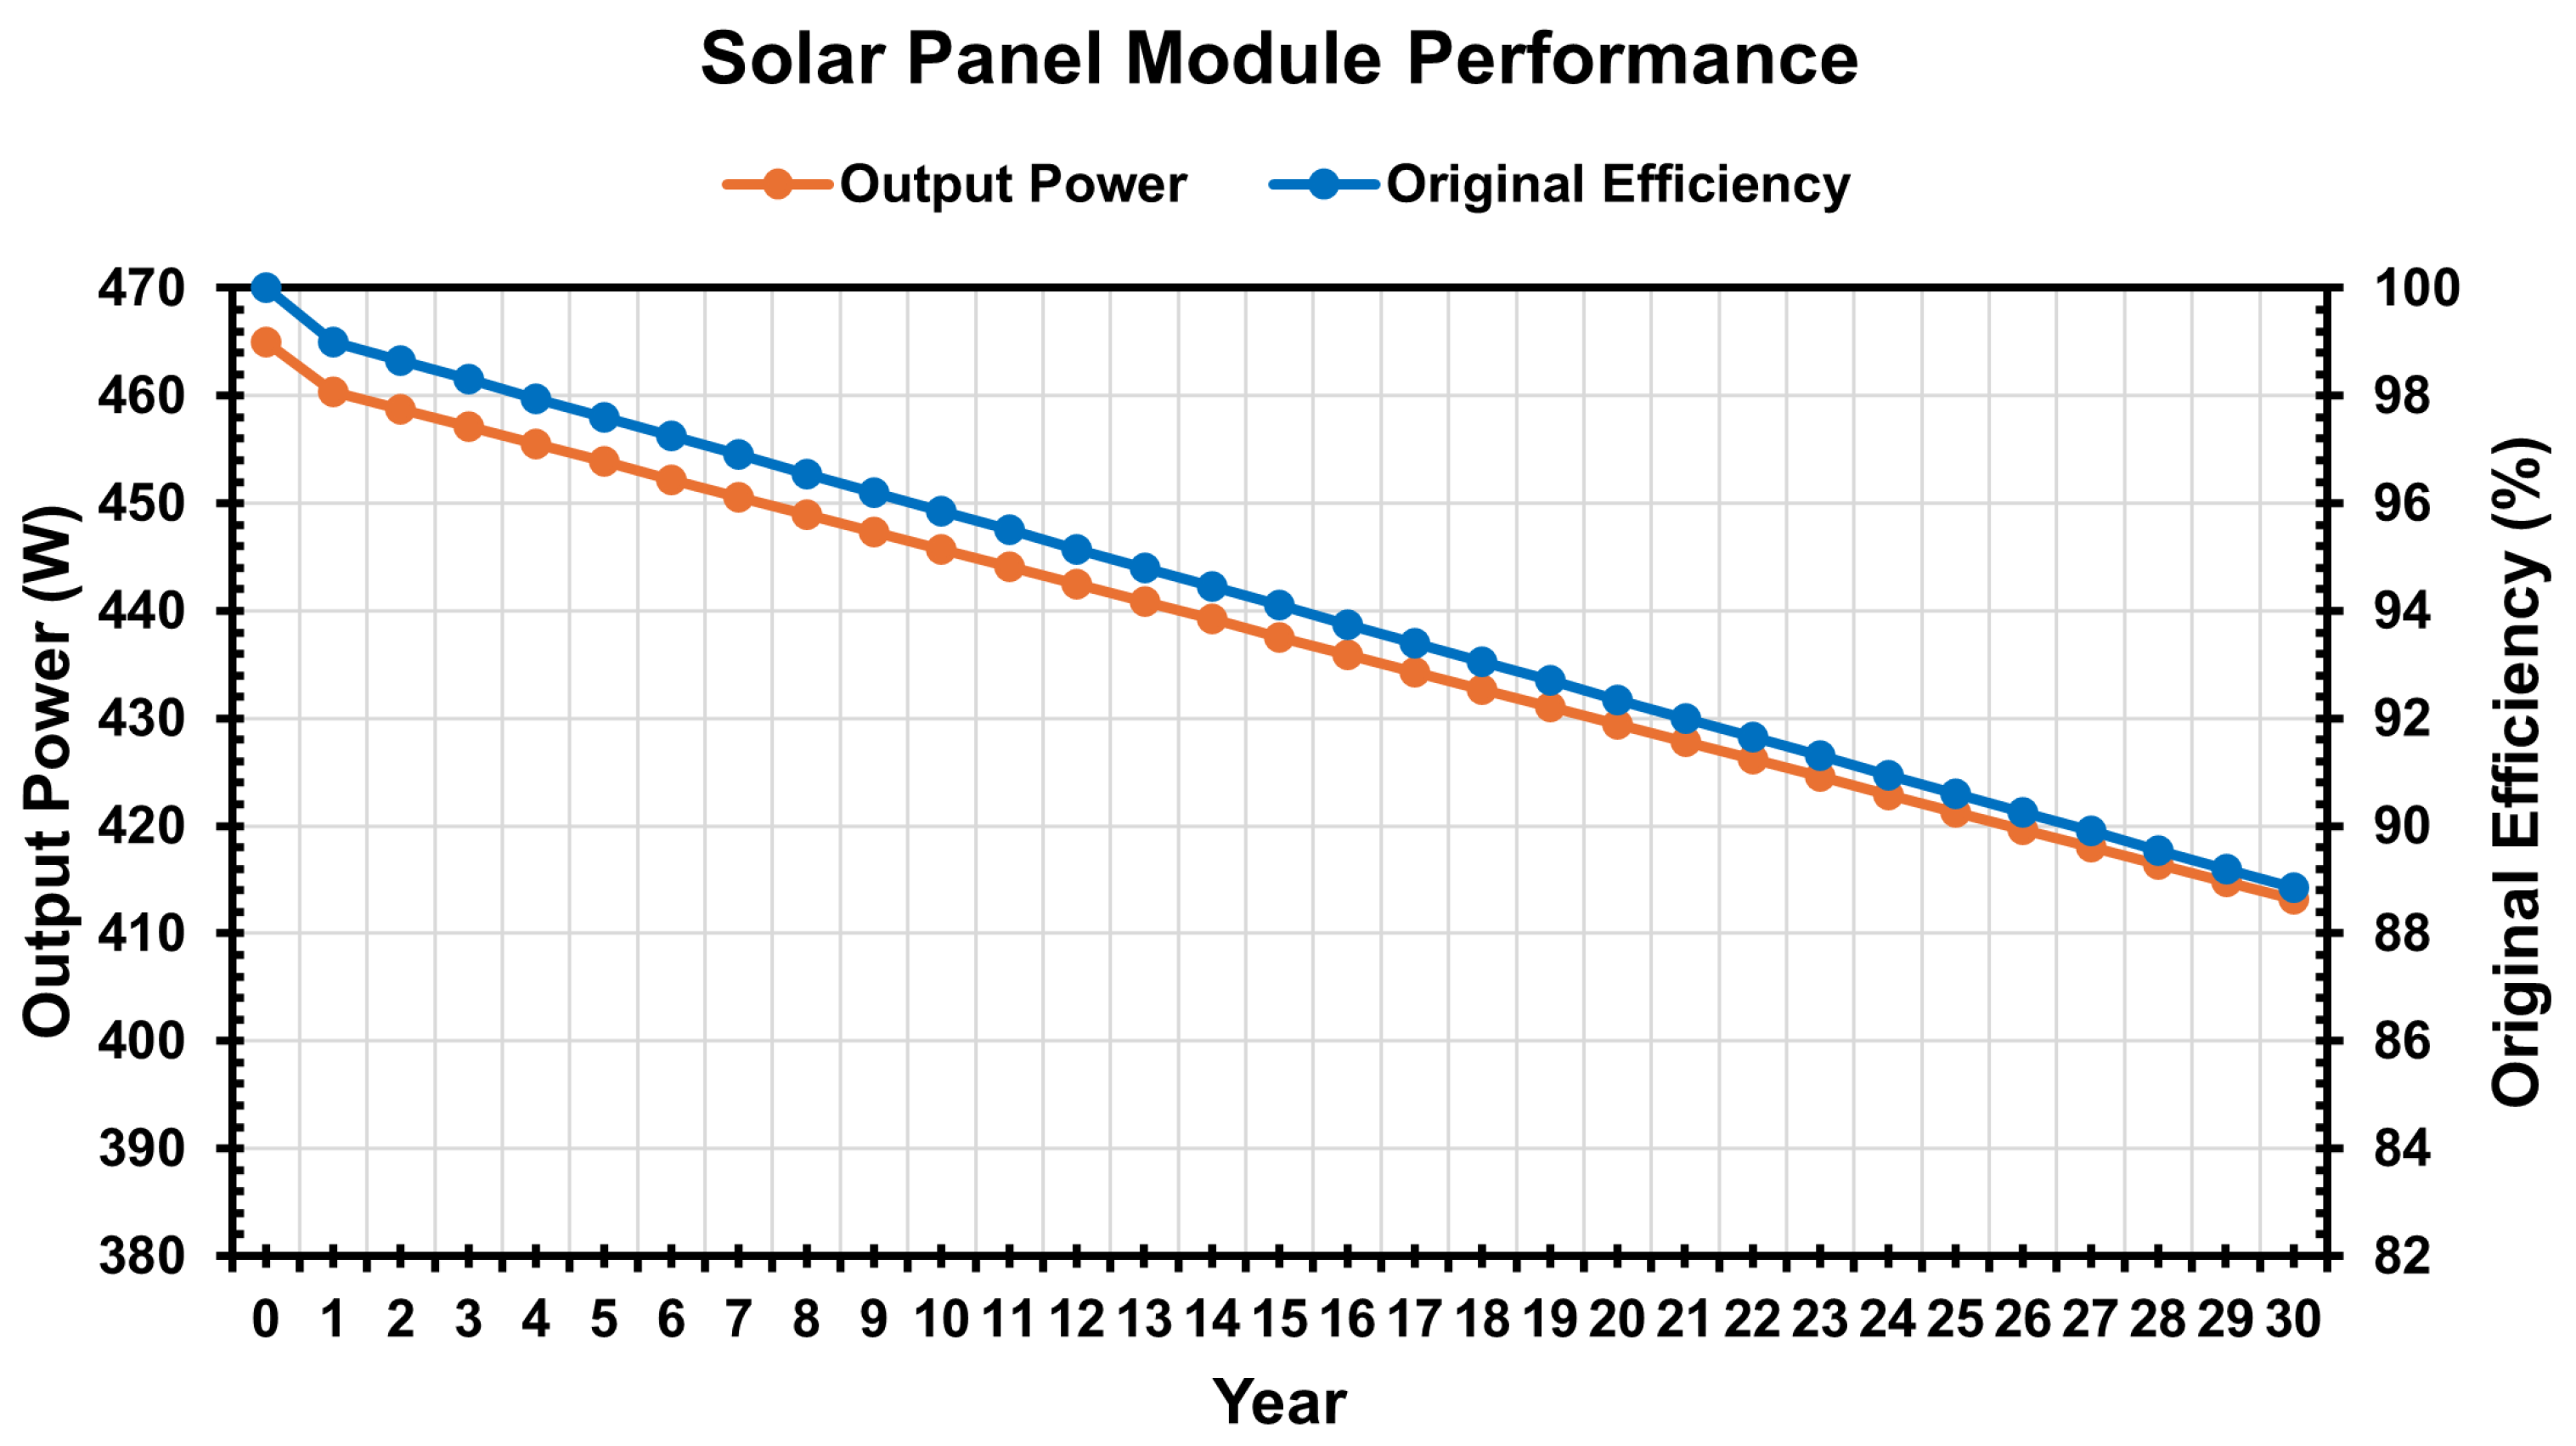
Solar Farm Sizing Considerations

The solar farm is sized to overcome all deficit days during the year and generate enough electric power to be stored in the BESS to meet the demand of the utilization sites at all times. The solar farm is oversized to satisfy the dynamic load nature of the utilization sites during extreme cloudy days. From a resilience perspective, in the design, the area size of the solar farm also accounts for the adequate size for the co-located battery storage systems, as well as for any expansion of the solar farm and the battery storage in the future to accommodate any new loads. Further, the area of the solar farm takes into consideration distribution connection and losses, DC-DC connection and conversion losses, and battery efficiency losses. The total capacity of the solar farm, which generates enough electric power to always satisfy the load requirements, is 12 MW. The optimum tilt angle and the temperature-compensated values are multiplied by the area of the farm, which is estimated to be 50,000 m2, to generate the hourly solar farm output, and the total land area designated for the project is 55,000 m2. The solar farm capacity can adequately meet the daily load demand for the utilization sites during the 365 days. Last, the MATLAB flowchart logic implementing the complete power flow of the proposed design architecture is presented in Figure 5.

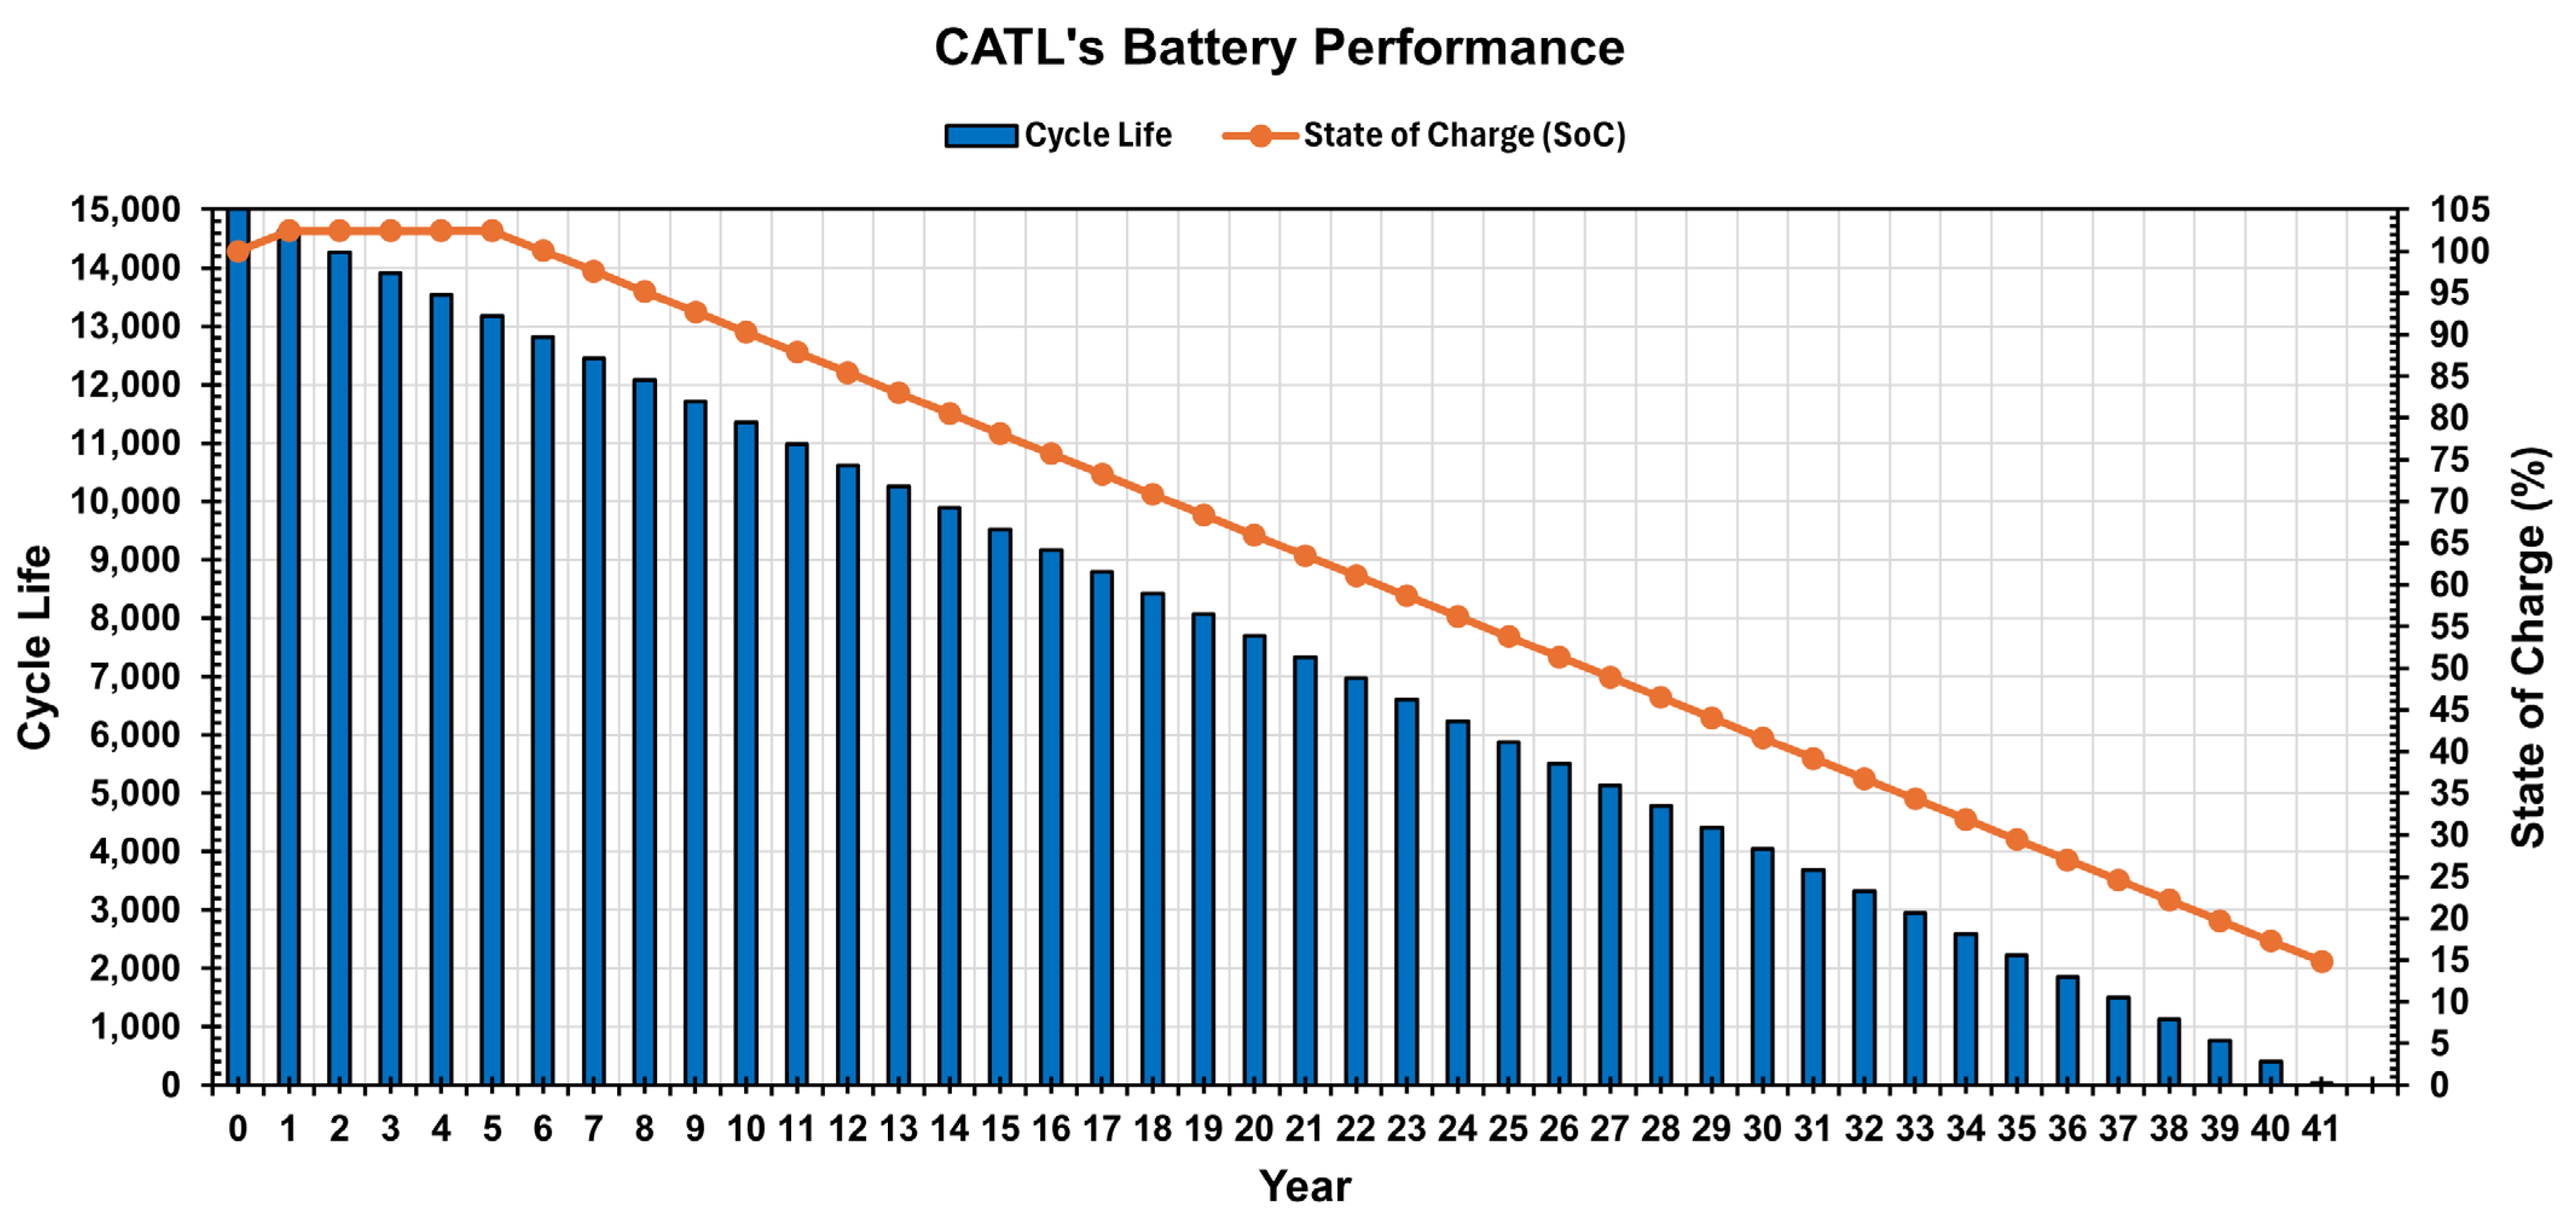
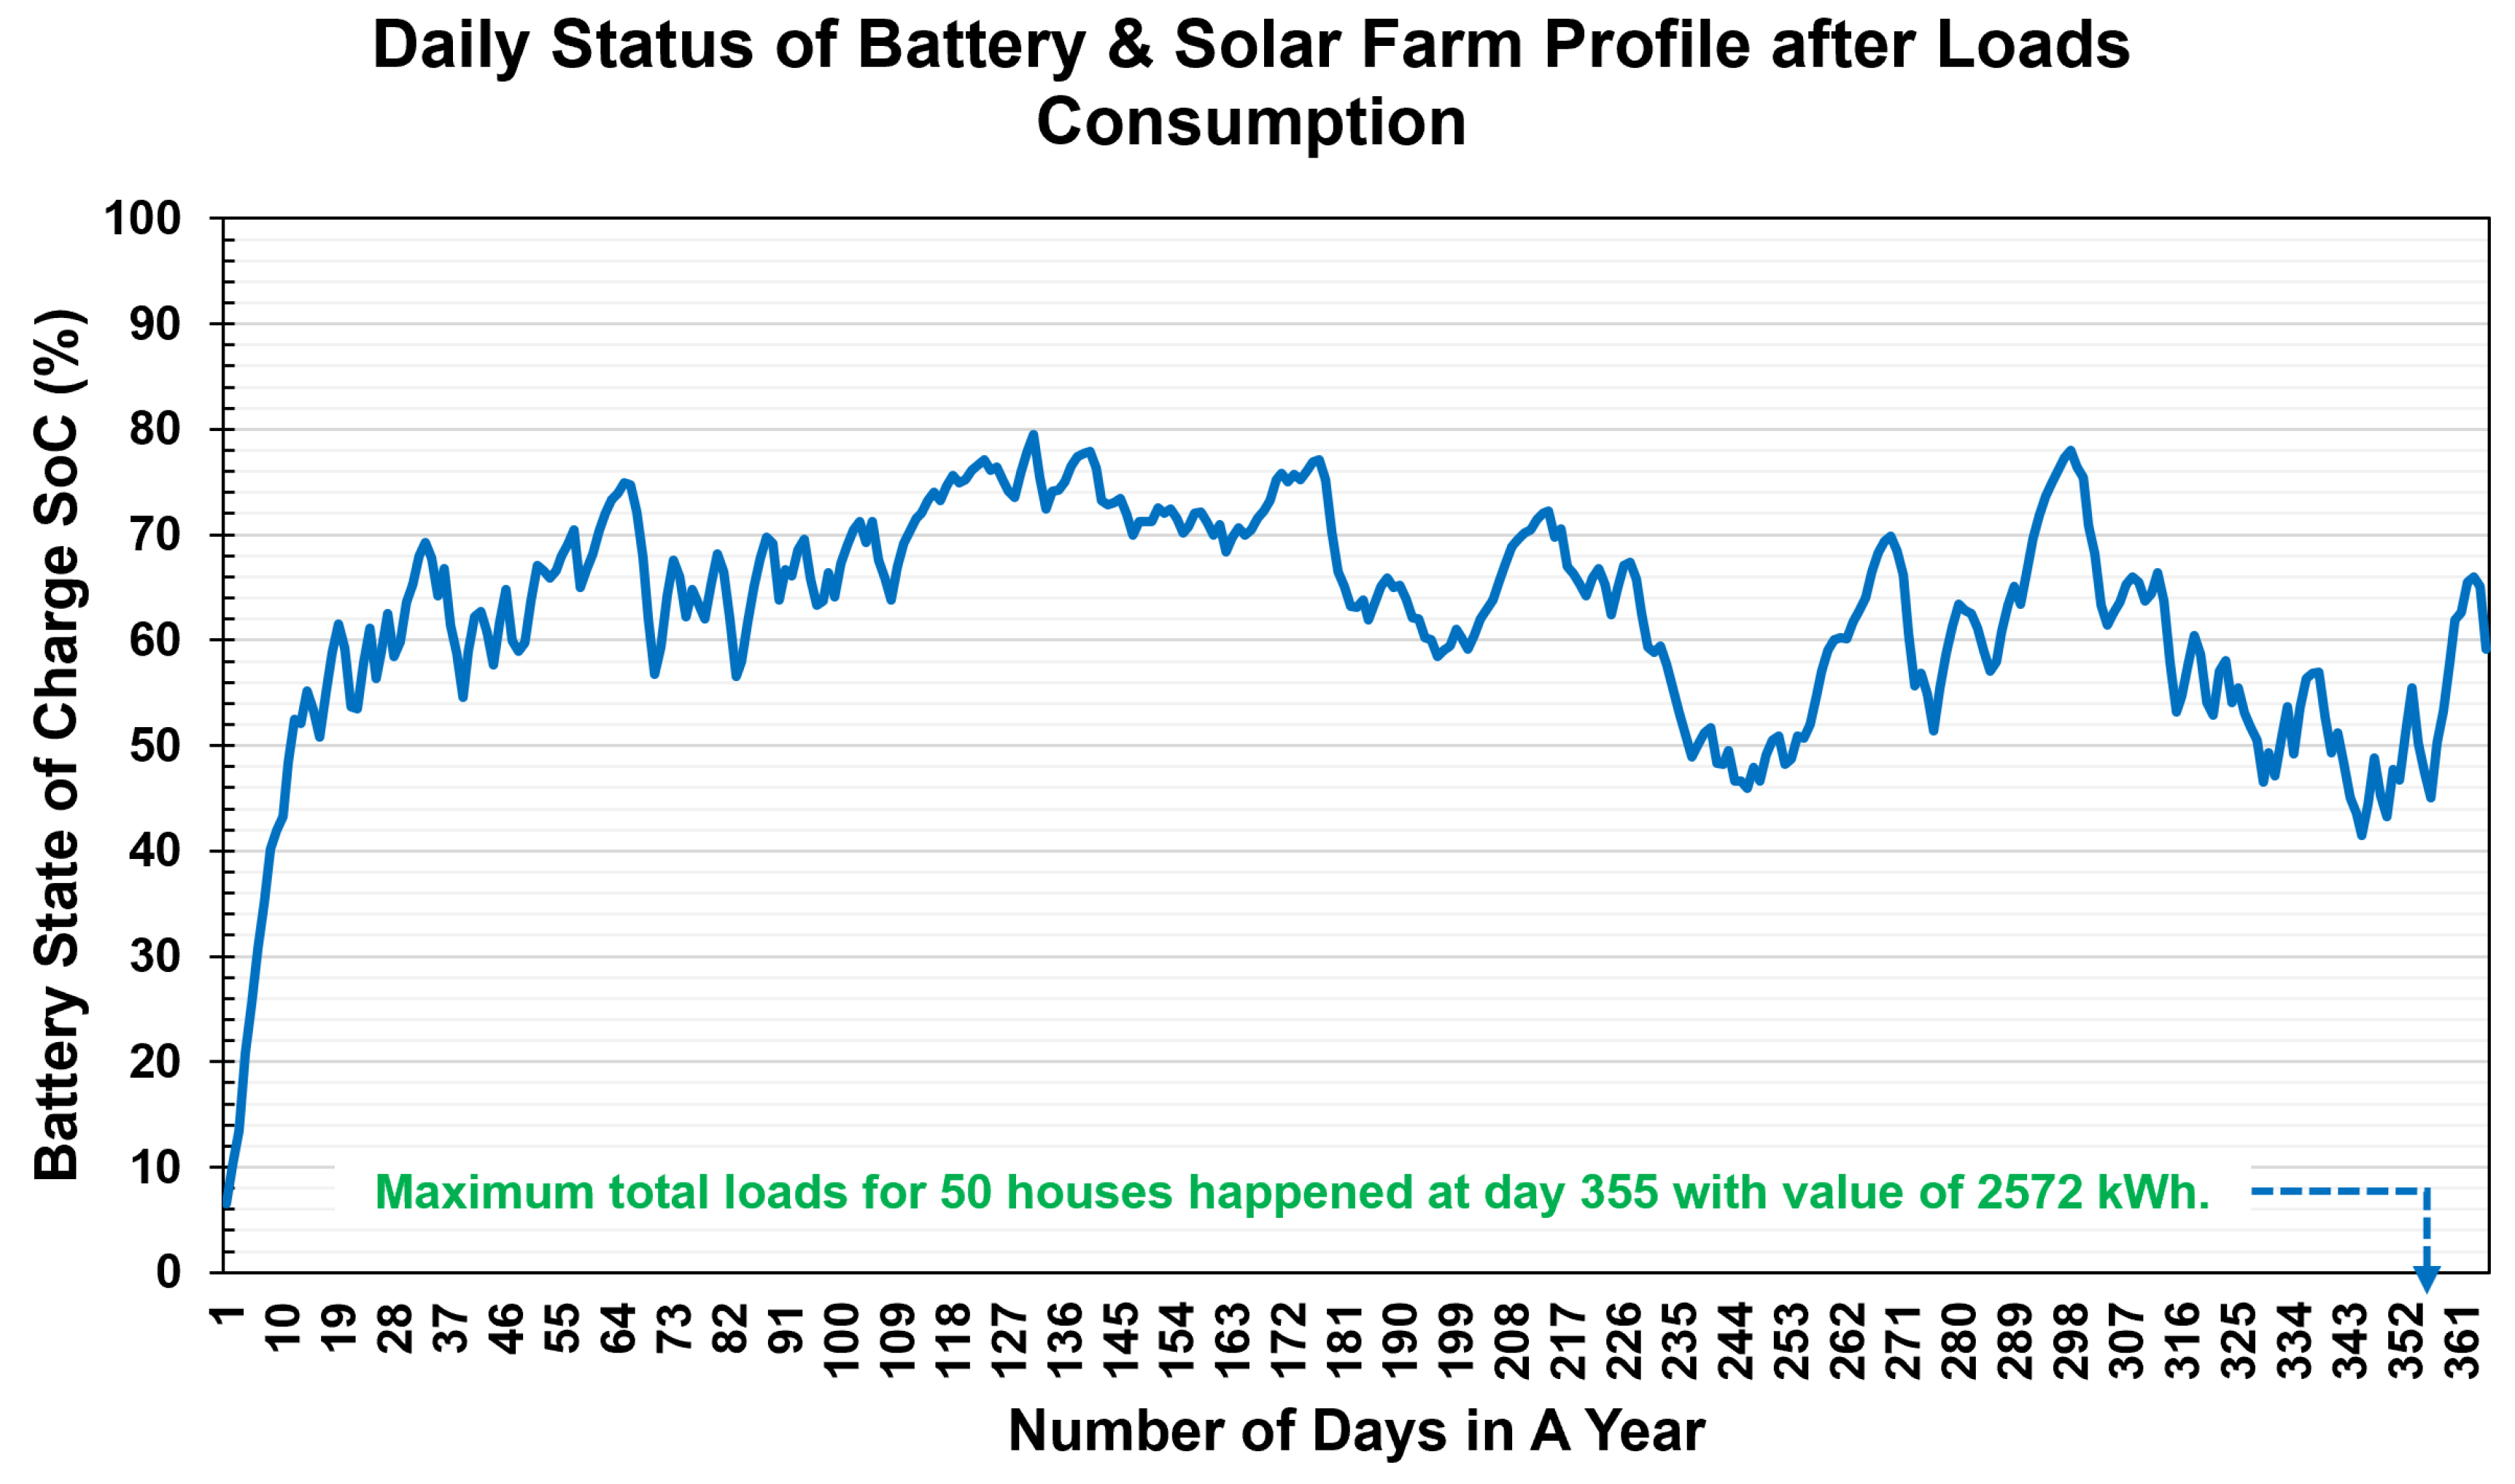
Battery Storage System Profile

From the resiliency viewpoint, the battery storage system is an essential part in the stand-alone proposed community solar design model which ensures the continuous supply of electric power 24/7/365. As mentioned previously, the battery energy storage system that will be utilized in this proposed design model is the state of the art in the field of battery storage. This BESS is the latest grid-scale battery product with zero degradation over the first five years, which is the world’s first of its kind, and a capacity of 6.25 MWh [35]. The zero-degradation feature will allow the battery to live longer than any other battery product, resulting in financial savings. Figure 6 shows the battery storage performance [50,51]. The hourly profile of the battery is evaluated in order to ensure the load balance. Since there are two sources of power generation, the battery storage initially charges as solar power generated from the solar farm is available immediately after sunrise. This is preferred over supplying solar power directly to the utilization sites. This is performed to reduce distribution losses as well as minimal DC-to-DC conversion losses for battery charging. Rooftop solar, which is the second source of power generation on each house, supplies the houses with electric power during the daytime. During the early hours of sun or on any cloudy days, when there is not sufficient sun irradiance to satisfy the demand of the load, the battery begins to discharge to meet the load demand. When the load demand is satisfied by its source of electric power, the power generated by the solar farm is directed to the battery storage. At that stage, the battery enters charging mode and is charged by the power from the solar farm until it reaches the maximum state of charge (SOC). The battery is sized to ensure that the load is satisfied during the 15–18 h of operation every day. Also, the battery is sized to undergo one charge–discharge cycle per day to ensure the battery longevity. An experimental study has shown that, compared to AC power as input, DC power saves about 6% of energy during battery charging [52].

4.3. Evaluation of the EEDC System Losses

The transmission and distribution networks are an essential part of the electric power system since they control the supply of electricity from the generation site to the utilization site. As electricity is being transported via transmission lines or distribution lines, electrical losses will occur. The electrical losses increase as the length of the transmission line increases, as well as due to the type of material used in the lines, such as aluminum or copper, and it will vary based on the amount of power that is being transported. The number of power losses may differ from year to year based on network configuration, load profile, and other aspects. The reduction in power system losses leads to voltage stability improvement, resulting in an uninterruptible and consistent supply of electricity to consumers. The assessment of power system losses has many benefits, such as economic and environmental benefits, but the critical benefits are the reliability and the functionality of the electrical network, whether that network is an AC network or DC network.
In our proposed design model, the DC power network has the capability to fulfill the load demand of the utilization site by fully employing solar and battery power without violating the physical limits of its components or losing system stability. Ease of power flow control, no skin effect losses, reduced right of way (ROW), avoidance of unnecessary frequency and reactive power synchronization, and improved distribution and transmission efficiency are some features that support an end-to-end DC power network. Due to those reasons, the assessment of distribution system losses in the proposed DC power network design is described below.
In the DC power network, there are multiple system losses. The line losses account for the ohmic distribution or transmission losses, which are dependent on resistance per unit distance, type of cables, ambient temperature, and amperage. The losses of the DC-DC converter are included in the losses calculation. In the generation site, either the solar farm or the BESS, there also will be some losses, which include shading and soling, wiring and mismatch loss, and light degradation loss from the solar farm, but there will not be degradation loss from the battery since, for the first five years, it has zero degradation, as mentioned previously. The charging/discharging loss and idle sitting losses comprise the BESS’s losses. A modular DC coupled system with intelligent control and DC optimizers can minimize the PV source losses and reduce the BESS charging/discharging losses. By optimally sizing the solar–BESS system, the sitting losses are minimized. In our proposed DC power network, the solar farm and BESS are oversized to satisfy the load demand of the utilization site during the day, night, and the worst cloudy days. Thus, the losses on the source side have been ignored in our model.
In this case, the localized DC network, based on Thomas Edison’s original concept, is incorporated in this proposed design. Our case assumes that the solar farm and the BESS are located in close vicinity to the utilization site. The solar farm and BESS are connected to the load center via distribution lines, as shown in Figure 1. To ensure design reliability, the distribution lines are constructed to transmit the hourly maximum load profile of the utilization site during the worst cloudy days. The maximum load profile is estimated to be 105 kW with a per hour average. Taking into consideration the futuristic growing loads, the design of the two typical AC three-phase parallel overhead distribution lines is implemented in our proposed network topology. However, in the current case, it is evaluated with parallel runs of conductors in order to increase the power transmitted capacity to satisfy the average hourly load demand. For diversified and realistic comparison in the distribution system network, a study of two types of cable materials, aluminum and copper, used to supply the same power in a single cable run, was conducted. The details for the cable specifications are in references [53,54]. At first, the rating of the localized LVDC network was designed to match the solar farm and BESS voltage of 1.5 kV, since DC power protection and regulation schemes already exist for that voltage. However, the voltage later was adjusted to match the cable characteristics and allow for reduction in power losses. The cumulative line and power losses are calculated based on the following equation: P = I 2 × R , where I is the current in the DC network and R is the cable resistance for the aluminum and copper. A comparative graph for varying cable distances and material types in the proposed DC network topology is shown in Figure 7. As shown in the graph, the total losses based on the two types of cables did not show significant differences at first, but, as the distance between the source and the load increased, the total losses for the aluminum cable increased compared to the copper cable by 3%. Thus, the copper cable is better to be used in a long-distance distribution line than the aluminum cable. Figure 9 in reference [55] shows a comparative graph for LVAC vs. LVDC, and the graph proves that DC power networks have better power-carrying capacity and significantly low total losses even over long distances compared to AC power networks.

5. Results

As presented in Figure 8, the daily status of the solar farm plus the BESS after accounting for load consumption showed an energy surplus. Thus, the result of the proposed design model, which is presented in Figure 8, proves that our model does not have any energy deficit during the entire year; instead, the model always shows a surplus in energy for the entire year. Even during days with extreme cloud cover, such as the last day of 2022, shown in Figure 9, when there is not sufficient sun irradiance to produce enough energy from the solar farm or the rooftop solar to satisfy the demand of the utilization site or charge the battery, there is sufficient energy stored in the battery storage from the day before which will satisfy the load demand of the community solar. Furthermore, Figure 10 illustrates the total loads for the 50 single-family dwelling units in the community solar project for the whole year, and the maximum total load for the 50 houses was 2572 kWh, which happened on day 355. By observing Figure 8, it can be seen that the daily status of the battery shows that there is no power deficit on the day of the maximum total load of the utilization site. Therefore, this modeling study of the proposed design shows that any stand-alone system with ample energy production based on design knowledge can be constructed.

6. Conclusions

There is an urgency to replace fossil fuels in the shortest possible time to handle the climate emergency. Electrification of all energy sources is the only practical solution to the climate-related challenges. Photovoltaics based on solar energy as free fuel have emerged as the cheapest source of electricity generation. For storing electrical power, lithium-ion batteries are emerging as the cost-effective solution. The market forces are in favor of PV and battery energy storage systems as the current dominant source of electric power generation for all applications. Based on the nature of power sources and mostly semiconductor-component-based loads, the AC infrastructure developed at the beginning of last century is becoming an obstacle to finding a cost-effective solution to the climate emergency. In this paper, we have provided details of the key advantages of an EEDC power network over an AC grid. The EEDC power system has the potential to provide a source of sustainable green electric power for all. As compared to the use of community solar based on an AC grid, we have provided details of a new concept for community solar based on an EEDC power network. Without involving a utility, the emerging concept can provide high growth for community solar. As per the results, we have illustrated that there is no shortage of energy for the entire year even during extreme weather events such as cloudy days, which can definitely affect the production of energy whether at the generation site or the utilization site. On the contrary, the status of the battery during the whole year showed a surplus of energy after the consumption of loads for the 50 single-family dwelling units in the community solar project, and that proves the resiliency of this proposed design. The proposed concept can play a major role in providing green sustainable electrical power for new loads that also include the charging of electrical vehicles. In this paper, we have shown the emerging concept of community solar for generating and distributing electricity in close vicinity to a group of houses by utilizing green electric power and applying the concept of an EEDC-based stand-alone network. In essence, this paper is expanding the concept of community solar, which can have an immediate profound impact on the new construction of houses in most parts of the world.

Author Contributions

Conceptualization, R.S. and E.A.; methodology, R.S. and E.A.; software, E.A.; validation, R.S. and E.A.; formal analysis, R.S. and E.A.; investigation, R.S. and E.A.; resources, R.S. and E.A.; data curation, E.A.; writing—original draft preparation, R.S. and E.A.; writing—review and editing, R.S., J.Z., V.P. and E.A.; visualization, R.S. and E.A.; supervision, R.S. All authors have read and agreed to the published version of the manuscript.

Funding

This research received no external funding.

Data Availability Statement

The data presented in this study are available on request from the corresponding author.

Acknowledgments

The authors would like to thank the anonymous reviewers for their feedback that has improved the quality of the paper.

Conflicts of Interest

Author Vishwas Powar was employed by the company Milwaukee Tool. The remaining authors declare that the research was conducted in the absence of any commercial or financial relationships that could be construed as a potential conflict of interest.

References

  1. Storm Dumps Heaviest Rain Ever Recorded in Desert Nation of UAE, Flooding Roads and Dubai’s Airport. Available online: https://apnews.com/article/uae-oman-rains-flooding-fatalities-7bf3881efbea998dfa4c1ed8d538217c (accessed on 18 March 2025).
  2. Summer Heat Hits Asia Early, Killing Dozens as One Expert Calls It the “Most Extreme Event” in Climate History. Available online: https://www.cbsnews.com/news/heat-wave-asia-2024-deaths-india-severe-weather-climate-change/ (accessed on 18 March 2025).
  3. 2.7 Million Without Power as Beryl Unleashes High Winds, Heavy Rains in Texas. Available online: https://www.nbcdfw.com/weather/weather-connection/hurricane-beryl-texans-without-power/3585939/ (accessed on 18 March 2025).
  4. Extreme Weather Is Driving Food Prices Higher. These 5 Crops Are Facing the Biggest Impacts. Available online: https://www.weforum.org/agenda/2024/02/climate-change-food-prices-drought/ (accessed on 18 March 2025).
  5. Facts about the climate emergency. Available online: https://www.unep.org/facts-about-climate-emergency (accessed on 18 March 2025).
  6. Decarbonization: Why We Must Electrify Everything Even Before the Grid Is Fully Green. Available online: https://www.nrdc.org/stories/why-we-must-electrify-everything-even-grid-fully-green#:~:text=To%20put%20a%20point%20on,the%20worst%20of%20climate%20change (accessed on 8 April 2025).
  7. Solar Is Now ‘Cheapest Electricity in History’, Confirms IEA. Available online: https://www.carbonbrief.org/solar-is-now-cheapest-electricity-in-history-confirms-iea/#:~:text=The%20world’s%20best%20solar%20power,Agency’s%20World%20Energy%20Outlook%202020 (accessed on 18 March 2025).
  8. With Record Low Cost, Saudi Arabia Leads Middle East’s Solar Revolution. Available online: https://globalbusinessoutlook.com/energy/with-record-low-cost-saudi-arabia-leads-middle-easts-solar-revolution/ (accessed on 18 March 2025).
  9. Solar Power Is Going to Be Huge. Available online: https://www.economist.com/interactive/essay/2024/06/20/solar-power-is-going-to-be-huge (accessed on 18 March 2025).
  10. How Lithium Is Powering the Renewable Energy Revolution. Available online: https://lithiumharvest.com/knowledge/green-energy-transition/how-lithium-is-powering-the-renewable-energy-revolution/#:~:text=Lithium%2C%20primarily%20through%20lithium%2Dion,%2C%20reliability%2C%20and%20backup%20power (accessed on 8 April 2025).
  11. The Rise of Batteries in Six Charts and Not Too Many Numbers. Available online: https://rmi.org/the-rise-of-batteries-in-six-charts-and-not-too-many-numbers/ (accessed on 18 March 2025).
  12. Aldarsi, E.; Singh, R. Review of Community Solar in the United States of America. New Energy Exploit. Appl. 2024, 3, 67–88. [Google Scholar] [CrossRef]
  13. History of Power: The Evolution of the Electric Generation Industry. Available online: https://www.powermag.com/history-of-power-the-evolution-of-the-electric-generation-industry/ (accessed on 18 March 2025).
  14. Singh, R.; Powar, V. The Future of Generation, Transmission, and Distribution of Electricity. In The Advancing World of Applied Electromagnetics; Lakhtakia, A., Furse, C.M., Mackay, T.G., Eds.; Springer: Cham, Switzerland, 2024. [Google Scholar] [CrossRef]
  15. Using DC Power to Save Energy—And End the War on Currents. Available online: https://trellis.net/article/using-dc-power-save-energy-and-end-war-currents/ (accessed on 18 March 2025).
  16. Direct Current Power Systems Can Save Energy, So Building Developers are Getting a New Incentive to Incorporate Them. Available online: https://www.ase.org/blog/direct-current-power-systems-can-save-energy-so-building-developers-are-getting-new-incentive (accessed on 18 March 2025).
  17. AC Power vs DC Power: A Comprehensive Comparison of Transmission Technologies. Available online: https://www.chintglobal.com/global/en/about-us/news-center/blog/ac-power-vs-dc-power.html (accessed on 18 March 2025).
  18. Power Grids: AC vs DC. Available online: https://electronics.stackexchange.com/questions/10773/power-grids-ac-vs-dc (accessed on 18 March 2025).
  19. 5 Reasons DC Electricity Should Replace AC Electricity in Buildings. Available online: https://www.cencepower.com/blog-posts/5-reasons-dc-electricity-should-replace-ac-electricity-in-buildings (accessed on 18 March 2025).
  20. AC/DC: The Push for Better Home Energy Efficiency. Available online: https://www.cmu.edu/epp/news/2016/acdc-the-push-for-better-home-energy-efficiency.html (accessed on 18 March 2025).
  21. DC-AC Conversion; What a Waste. Available online: https://forums.mikeholt.com/threads/dc-ac-conversion-what-a-waste.97048/ (accessed on 18 March 2025).
  22. Cost Study of AC, VS. DC Data Center Power Topologies Based on System Efficiency. Available online: https://www.eltek.com/globalassets/media/downloads/white-papers_case-studies/cost-study-on-ac-vs-dc-data-center-based-on-system-efficiency---an-eltek-white-paper.pdf (accessed on 18 March 2025).
  23. What can DC power do for your building? Available online: https://www.buildings.com/building-systems-om/lighting/article/55257329/what-can-dc-power-do-for-your-building (accessed on 18 March 2025).
  24. Singh, R.; Shenai, K. DC Microgrids and the Virtues of Local Electricity. IEEE Spectrum Online. 2014. Available online: http://spectrum.ieee.org/green-tech/buildings/dc-microgrids-and-the-virtues-of-local-electricity (accessed on 18 March 2025).
  25. Hurricane Beryl Is Another Example of Why the Power Grid Needs to Be More Resilient. Available online: https://www.npr.org/2024/07/11/nx-s1-5035024/hurricane-beryl-is-another-example-of-why-the-power-grid-needs-to-be-more-resilient (accessed on 18 March 2025).
  26. The End of the Era of Baseload Power Plants. Available online: https://www.greentechmedia.com/articles/read/the-end-of-the-era-of-baseload-power-plants (accessed on 18 March 2025).
  27. Debunking Three Myths About “Baseload”. Available online: https://www.nrdc.org/bio/kevin-steinberger/debunking-three-myths-about-baseload (accessed on 18 March 2025).
  28. Dispelling the Nuclear Baseload Myth: Nothing Renewables Can’t Do Better. Available online: https://theecologist.org/2016/mar/10/dispelling-nuclear-baseload-myth-nothing-renewables-cant-do-better#:~:text=The%20main%20claim%20used%20to,nuclear%20power%20really%20is%20redundant (accessed on 18 March 2025).
  29. United Nations, Department of Economic and Social Affairs, Population Division. “World Population Prospects 2019: Highlights”. Available online: https://population.un.org/wpp/assets/Files/WPP2019_Highlights.pdf (accessed on 18 March 2025).
  30. Guillemette, Y.; Turner, D. The Long View: Scenarios for the World Economy to 2060; OECD Economic Policy Papers, No. 22; OECD Publishing: Paris, France, 2018. [Google Scholar] [CrossRef]
  31. White Paper, Achieving the Paris Agreement the Vital Role of High Efficiency Motors and Drives in Reducing Energy Consumption. Available online: https://www.energyefficiencymovement.com/wp-content/uploads/2023/01/ABB_EE_2021-01-WhitePaper.pdf (accessed on 18 March 2025).
  32. Global Energy Demand: Today’s Landscape and a Look Towards the Future. Available online: https://energysavings.com/blog/new-trends/global-energy-demand-the-future/ (accessed on 18 March 2025).
  33. What Is Curtailment of Electricity? Available online: https://www.next-kraftwerke.com/knowledge/curtailment-electricity (accessed on 18 March 2025).
  34. Paniyil, P.; Singh, R.; Asif, A.; Powar, V.; Bedi, G.; Kimsey, J. Transformative and Disruptive Roles of Direct Current Power Networks in Power and Transportation Sectors. Electron. Energetics 2019, 32, 387–402. [Google Scholar] [CrossRef]
  35. CATL Unveils TENER, the World’s First Five-Year Zero Degradation Energy Storage System with 6.25MWh Capacity. Available online: https://www.catl.com/en/news/6232.html (accessed on 18 March 2025).
  36. Clean Energy’s Next Trillion-Dollar Business. Available online: https://www.economist.com/business/2024/09/01/clean-energys-next-trillion-dollar-business (accessed on 18 March 2025).
  37. Bowen, T.; Chernyakhovskiy, I.; Denholm, P. Grid-Scale Battery Storage: Frequently Asked Questions. NREL 2019. Available online: https://www.nrel.gov/docs/fy19osti/74426.pdf (accessed on 18 March 2025).
  38. Powar, V.; Singh, R. Stand-Alone Direct Current Power Network Based on Photovoltaics and Lithium-Ion Batteries for Reverse Osmosis Desalination Plant. Energies 2021, 14, 2772. [Google Scholar] [CrossRef]
  39. Reed, L.; Morgan, M.G.; Vaishnav, P.; Armanios, E.D. Converting existing transmission corridors to HVDC is an overlooked option for increasing transmission capacity. Proc. Natl. Acad. Sci. USA 2019, 116, 13879–13884. [Google Scholar] [CrossRef] [PubMed]
  40. Deb, N.; Singh, R.; Bai, H. Transformative Role of Silicon Carbide Power Electronics in Providing Low-cost Extremely Fast Charging of Electric Vehicles. In Proceedings of the 2021 IEEE Fourth International Conference on DC Microgrids (ICDCM), 18–21 July 2021; pp. 1–6. [Google Scholar] [CrossRef]
  41. Powar, V.; Morankar, C.; Singh, R.; Banavath, S.N.; Chakravathi, A.; Sultana, S. Business Case of Green Energy Based End-to-End DC power Networks: Extremely Fast Charging of Electric Vehicles Near Highways. In Proceedings of the 6th IEEE International Conference on DC Microgrids (ICDCM), Columbia, SC, USA, 5–8 August 2024. [Google Scholar] [CrossRef]
  42. Singh, R.; Asif, A.A.; Venayagamoorthy, G.K. Transformative role of photovoltaics in phasing out alternating current based grid by local DC power networks for sustainable global economic growth. In Proceedings of the IEEE 43rd Photovoltaic Specialists Conference (PVSC), Portland, OR, USA, 5–10 June 2016; pp. 3345–3350. [Google Scholar] [CrossRef]
  43. Center for Sustainable Systems, University of Michigan. U.S. Renewable Energy Factsheet.” Pub. No. CSS03-12. 2024. Available online: https://css.umich.edu/publications/factsheets/energy/us-renewable-energy-factsheet (accessed on 18 March 2025).
  44. Strong In-Migration to South Carolina in Recent Years. Available online: https://dew.sc.gov/index.php/labor-market-information-blog/2024-01/strong-migration-south-carolina-recent-years#:~:text=moveBuddha%20concluded%2C%20using%20its%20proprietary,the%20healthcare%20and%20tech%20industries (accessed on 18 March 2025).
  45. AIKO NEOSTAR 1P Mono-Glass 450W-465W. Available online: https://aikosolar.com/wp-content/uploads/2024/04/AIKO-A-MAH54Mw-450-465W-30-black-frame-PL-EN-V5.3.pdf (accessed on 18 March 2025).
  46. AIKO, Module. Available online: https://aikosolar.com/en/products/ (accessed on 18 March 2025).
  47. Home Energy Use Guide. Available online: https://www.nyseg.com/documents/40132/5899296/NYSEG+RGE+Home+Energy+Use+Guide+03.2023.pdf/2c6e5b08-da95-2f40-fef7-d10dfa671232 (accessed on 18 March 2025).
  48. AIKO STELLAR 3N+72 Dual-Glass 650W-675W. Available online: https://aikosolar.com/wp-content/uploads/2024/06/Stellar-3N_Plus_72_AIKO-A-MDE72Dw-650W-675W.pdf (accessed on 18 March 2025).
  49. NREL’s NSRDB Data Viewer. Available online: https://maps.nrel.gov/nsrdb-viewer/ (accessed on 18 March 2025).
  50. CATL Launches Tener Energy Storage System with 5-Year 0-Attenuation. Available online: https://cnevpost.com/2024/04/10/catl-launches-tianheng-energy-storage-system/ (accessed on 18 March 2025).
  51. CATL Launches New EV Battery Cells With Zero Degradation After the First 1,000 Cycles. Available online: https://www.autoevolution.com/news/catl-launches-new-ev-battery-cells-with-zero-degradation-after-the-first-1000-cycles-231918.html# (accessed on 18 March 2025).
  52. Qureshi, J.A.; Lie, T.T.; Gunawardane, K.; Kularatna, N.; Qureshi, W.A. AC source vs DC source: Charging efficiency in battery storage systems for residential houses. In Proceedings of the 2017 IEEE Innovative Smart Grid Technologies—Asia (ISGT-Asia), Auckland, New Zealand, 4–7 December 2017; pp. 1–6. [Google Scholar] [CrossRef]
  53. Aluminum XHHW-2 600V/1000V RW90 600V. Available online: https://www.prioritywire.com/specs/Aluminum%20XHHW-2.pdf (accessed on 18 March 2025).
  54. Southwire. Cable Ratings Datasheet for 1/C CU 1000V XLPE XHHW-2 Power Cable. Available online: http://media.industrial.southwire.com/spec/spec45000/SPEC45001.pdf (accessed on 18 March 2025).
  55. Powar, V.; Singh, R. End-to-End Direct-Current-Based Extreme Fast Electric Vehicle Charging Infrastructure Using Lithi-um-Ion Battery Storage. Batteries 2023, 9, 169. [Google Scholar] [CrossRef]
Figure 1. Proposed community solar concept.
Energies 18 01971 g001
Figure 2. Output power and efficiency of PV modules by day as a function of time [45].
Energies 18 01971 g002
Figure 3. Hourly irradiance profiles for various cases.
Energies 18 01971 g003
Figure 4. Temperature correction used in calculating PV panel efficiency, taken from reference [38].
Energies 18 01971 g004
Figure 5. Logical flowchart implementing the complete power flow of the proposed design model.
Energies 18 01971 g005
Figure 6. Battery storage performance as a function of time [50,51].
Energies 18 01971 g006
Figure 7. Distribution line losses as a function of distance with two different cable materials as a variable.
Energies 18 01971 g007
Figure 8. Power system shows no power shortage even during cloudy days.
Energies 18 01971 g008
Figure 9. Energy produced from rooftop of a single-family dwelling unit.
Energies 18 01971 g009
Figure 10. Load consumption of 50 single-family dwelling units.
Energies 18 01971 g010
Table 1. Rooftop solar panel characteristics [45].
Category NameValue
Output Power465 W
Panel Efficiency23.8%
Better Temperature Coefficient−0.26%/
First-Year DegradationLess than 1%
Annual Degradation (Years 2–30)Less than 0.35%
Table 2. List of electrical appliances in a house [47].
Time of UseSr. No.AppliancesPower (W)Hours Used Per DayWatt-Hour (Wh)
24/7/3651.Refrigerator233245592
2.Security/fire alarm2024480
3.Modem2024480
Per Day4.Central A/C 48,000 BTU (cooling and heating)4800733,600
5.Coffee maker—drip12250.5612.5
6.Microwave14630.25365.75
7.Electric cooking range and oven12,133112,133
8.Toaster11490.2229.8
9.Dishwasher107511075
10.Electric water heater450029000
11.Fan—ceiling1007700
12.Fan—attic38251910
13.Desktop computer and monitor25071750
14.Laptop computer507350
15.Lighting607420
16.Television34031020
17.Video game device13226
18.Hair dryer11250.25281.25
19.Garage door opener3731373
20.Can opener1500.2537.5
Per Week21.Clothes dryer5000210,000
22.Washing machine50021000
23.Vacuum cleaner63721274
Table 3. Solar panel module characteristics for the solar farm [48].
Category NameValue
Output Power475 W
Panel Efficiency25.0%
Better Temperature coefficient−0.26%/
First-Year DegradationLess than 1%
Annual Degradation (Years 2–30)Less than 0.35%
Disclaimer/Publisher’s Note: The statements, opinions and data contained in all publications are solely those of the individual author(s) and contributor(s) and not of MDPI and/or the editor(s). MDPI and/or the editor(s) disclaim responsibility for any injury to people or property resulting from any ideas, methods, instructions or products referred to in the content.

