Article

Reliability of High-Frequency Earth Meters in Measuring Tower-Footing Resistance: Simulations and Experimental Validation

by
Renan Segantini
1,*,
Rafael Alipio
2,3,* and
José O. S. Paulino
1
1
Graduate Program in Electrical Engineering, Universidade Federal de Minas Gerais, Av. Antônio Carlos 6627, Belo Horizonte 31270-901, MG, Brazil
2
Department of Electrical Engineering, CEFET-MG—Federal Center of Technological Education of Minas Gerais, Av. Amazonas 7675, Nova Gameleira, Belo Horizonte 31270-901, MG, Brazil
3
Electromagnetic Compatibility Laboratory, Swiss Federal Institute of Technology Lausanne (EPFL), 1015 Lausanne, Switzerland
*
Authors to whom correspondence should be addressed.
Energies 2025, 18(8), 1959; https://doi.org/10.3390/en18081959
Submission received: 12 December 2024 / Revised: 22 February 2025 / Accepted: 5 March 2025 / Published: 11 April 2025

Abstract

:
This paper presents a comprehensive assessment of the accuracy of high-frequency (HF) earth meters in measuring the tower-footing ground resistance of transmission line structures, combining simulation and experimental results. The findings demonstrate that HF earth meters reliably estimate the harmonic grounding impedance ( R 25 k H z ) at their operating frequency, typically 25 kHz, for a wide range of soil resistivities and typical span lengths. For the analyzed tower geometries, the simulations indicate that accurate measurements are obtained for adjacent span lengths of approximately 300 m and 400 m, corresponding to configurations with one and two shield wires, respectively. Acceptable errors below 10% are observed for span lengths exceeding 200 m and 300 m under the same conditions. While the measured R 25 k H z does not directly represent the resistance at the industrial frequency, it provides a meaningful measure of the grounding system’s impedance, enabling condition monitoring and the evaluation of seasonal or event-related impacts, such as damage after outages. Furthermore, the industrial frequency resistance can be estimated through an inversion process using an electromagnetic model and knowing the geometry of the grounding electrodes. Overall, the results suggest that HF earth meters, when correctly applied with the fall-of-potential method, offer a reliable means to assess the grounding response of high-voltage transmission line structures in most practical scenarios.

1. Introduction

The grounding system is a key element impacting the lightning performance of transmission lines (TLs), especially in cases of direct strikes to towers or shield wires [1]. When lightning strikes a tower or the shield wires, the lightning current is conducted to the ground through the towers closest to the point of incidence. This current is dispersed into the ground via the tower-footing grounding electrodes, causing a ground potential rise (GPR) that propagates through the tower body, including its crossarms. Additionally, the portion of the lightning current traveling along the shield wires induces voltages in the phase conductors. The resulting overvoltages across each line insulator string are determined by the difference between the crossarm voltage and the voltage coupled to the phase conductor from the shield wires [2]. As a result, the GPR has direct impacts on both the magnitude and rise rate of these overvoltages, making the tower-footing grounding system a key factor in the lightning performance of the line [3,4,5].
In practice, the primary parameter used to qualify the performance of the TL grounding system is the tower-footing ground resistance: the lower this value, the better the grounding system performance and its ability to mitigate lightning overvoltages [5]. The tower-footing ground resistance can be determined through simulations using computational tools, as commonly performed during the design phase, based on soil resistivity and the electrode arrangement configuration [6,7,8]. However, a direct measurement of the tower-footing resistance is important for several reasons—for example, to account for seasonal variations, during routine maintenance to assess the condition of grounding electrodes, and after a transmission line outage to evaluate the grounding conditions of the faulted tower [9].
A survey of different methods for measuring the resistance and impedance of grounding systems can be found in [10]. Among these methods, the most widely used for measuring tower-footing ground resistance is the fall-of-potential (FOP) method [11], whose measurement setup is illustrated in Figure 1. The FOP method consists of injecting a current between the grounding system under test (G) and an auxiliary current-return probe (CP), while measuring the resulting voltage drop between G and a potential probe (PB). To reduce interelectrode influence caused by mutual resistance, the current-return probe is typically placed at a considerable distance from G, generally several times the largest dimension of the grounding electrodes under test [10].
Field measurements of grounding resistance face intrinsic challenges [10], but measuring the grounding resistance of TL structures introduces additional difficulties [11]. When applying the FOP method, depending on the dimensions of the tower-footing grounding electrodes, the current probe must be placed at a substantial distance. This requires long test leads to inject a current into the grounding system under test and to measure the resulting ground potential rise relative to remote earth [10]. However, many TL structures are located in areas with difficult access or dense vegetation, making the deployment of long test leads laborious or, in some cases, unfeasible. As reported in [12], the relative positioning of the current and voltage measurement circuits may also influence the results.
An alternative to using long current and voltage test leads is proposed in [13], where a method is introduced to measure grounding resistance using fast impulse currents and very short leads. This is achieved by replacing conventional test leads with the so-called Artificial Infinite Line (LIA), a transmission line constructed with a thin insulated wire wrapped around a non-conductive polyvinyl chloride (PVC) pipe. The propagation velocity can be adjusted by modifying the number of turns per unit length. Taking advantage of the reduced propagation velocity, this alternative lead can emulate conventional test leads several hundred meters long. Promising results from this methodology are reported in [13,14].
An additional challenge in measuring the tower-footing grounding system of high voltage TLs is the presence of shield wires [11]. Since transmission line towers are interconnected via shield wires, measurements using the fall-of-potential method with a conventional earth tester (here referred to as a “low-frequency earth tester”) result in only a fraction of the instrument’s current flowing through the grounding system under test. A significant portion of the current travels up the tower, flows through the shield wires, and is dispersed into the grounding systems of adjacent structures, as schematically illustrated in Figure 2. Consequently, the measured resistance reflects the parallel resistance of multiple interconnected grounding systems rather than the resistance of the individual structure under test.
One possible solution to the aforementioned challenge consists of directly measuring the true current injected into the tower-footing electrodes. This can be achieved using an external current transformer placed around the down conductor connected to the grounding electrode, as shown in Figure 2 on one of the tower legs [11]. If the tower-footing grounding system is symmetrical and the current can be assumed to be equally divided among the tower legs, this technique can be efficiently applied. Otherwise, the current should be measured individually at each leg, followed by a post-processing step to determine the grounding resistance. Alternatively, a single measurement can be performed using four current transformers, capturing the total injected current directly. The complexity of the technique increases in the case of guyed towers, where the current injected through each guy wire must also be measured. In practical applications, special attention should be given to ensuring that the diameter of the current transformer is compatible with high-voltage TL towers.
Among the techniques described, the most commonly used solution by power utilities for measuring tower-footing grounding resistance is the traditional FOP method combined with the so-called high-frequency earth meters, which eliminate the need to disconnect shield wires or grounding electrodes from the tower, enabling safer and more practical measurements. The operation of these meters is based on the principle that, at the frequency of the injected current—typically 25 kHz for commercial instruments—the inductive reactance of the shield wires is much higher than the tower-footing resistance, effectively preventing current diversion to the shield wires. However, recent studies have raised questions about the use of high-frequency earth testers, suggesting that they may lead to significant errors, with increased deterioration in the quality of measurements, particularly in cases of structures with two or more shield wires and transmission lines installed in regions with high-resistivity soils [15].
Considering the aforementioned context, the main contribution of this work is to present a comprehensive analysis of the accuracy of the measurement results provided by high-frequency earth testers based on extensive simulation results covering various tower configurations, span lengths, and soil resistivities, as well as field measurements of a real TL tower-footing grounding system. Contrary to what has been suggested, as long as proper precautions are taken in the application of the FOP method, high-frequency earth testers can accurately characterize the tower-footing grounding impedance at the instrument’s operating frequency. This holds true for towers with adjacent span lengths of approximately 300 m to 400 m or greater, depending on the number of shield wires present in the structure under test, and for a wide range of soil resistivities. To the best of the authors’ knowledge, the presented results and analyses are novel and provide valuable guidelines for using high-frequency earth testers to evaluate the performance of tower-footing grounding systems.
This paper is organized as follows: Section 2 describes the tower geometries analyzed in this study. Section 3 presents the tower-footing grounding configurations and describes the electromagnetic model used in calculations. Section 4 discusses the characterization of tower-footing grounding systems for lightning performance studies of transmission lines. Section 5 evaluates the accuracy of high-frequency earth testers through simulations, considering line structures with one and two shield wires, a wide range of span lengths, and varying soil resistivities. Section 6 presents experimental results of tower-footing ground resistance measurements, complementing the findings obtained from the simulations. Finally, a summary and the main conclusions are presented in Section 7. Additionally, 
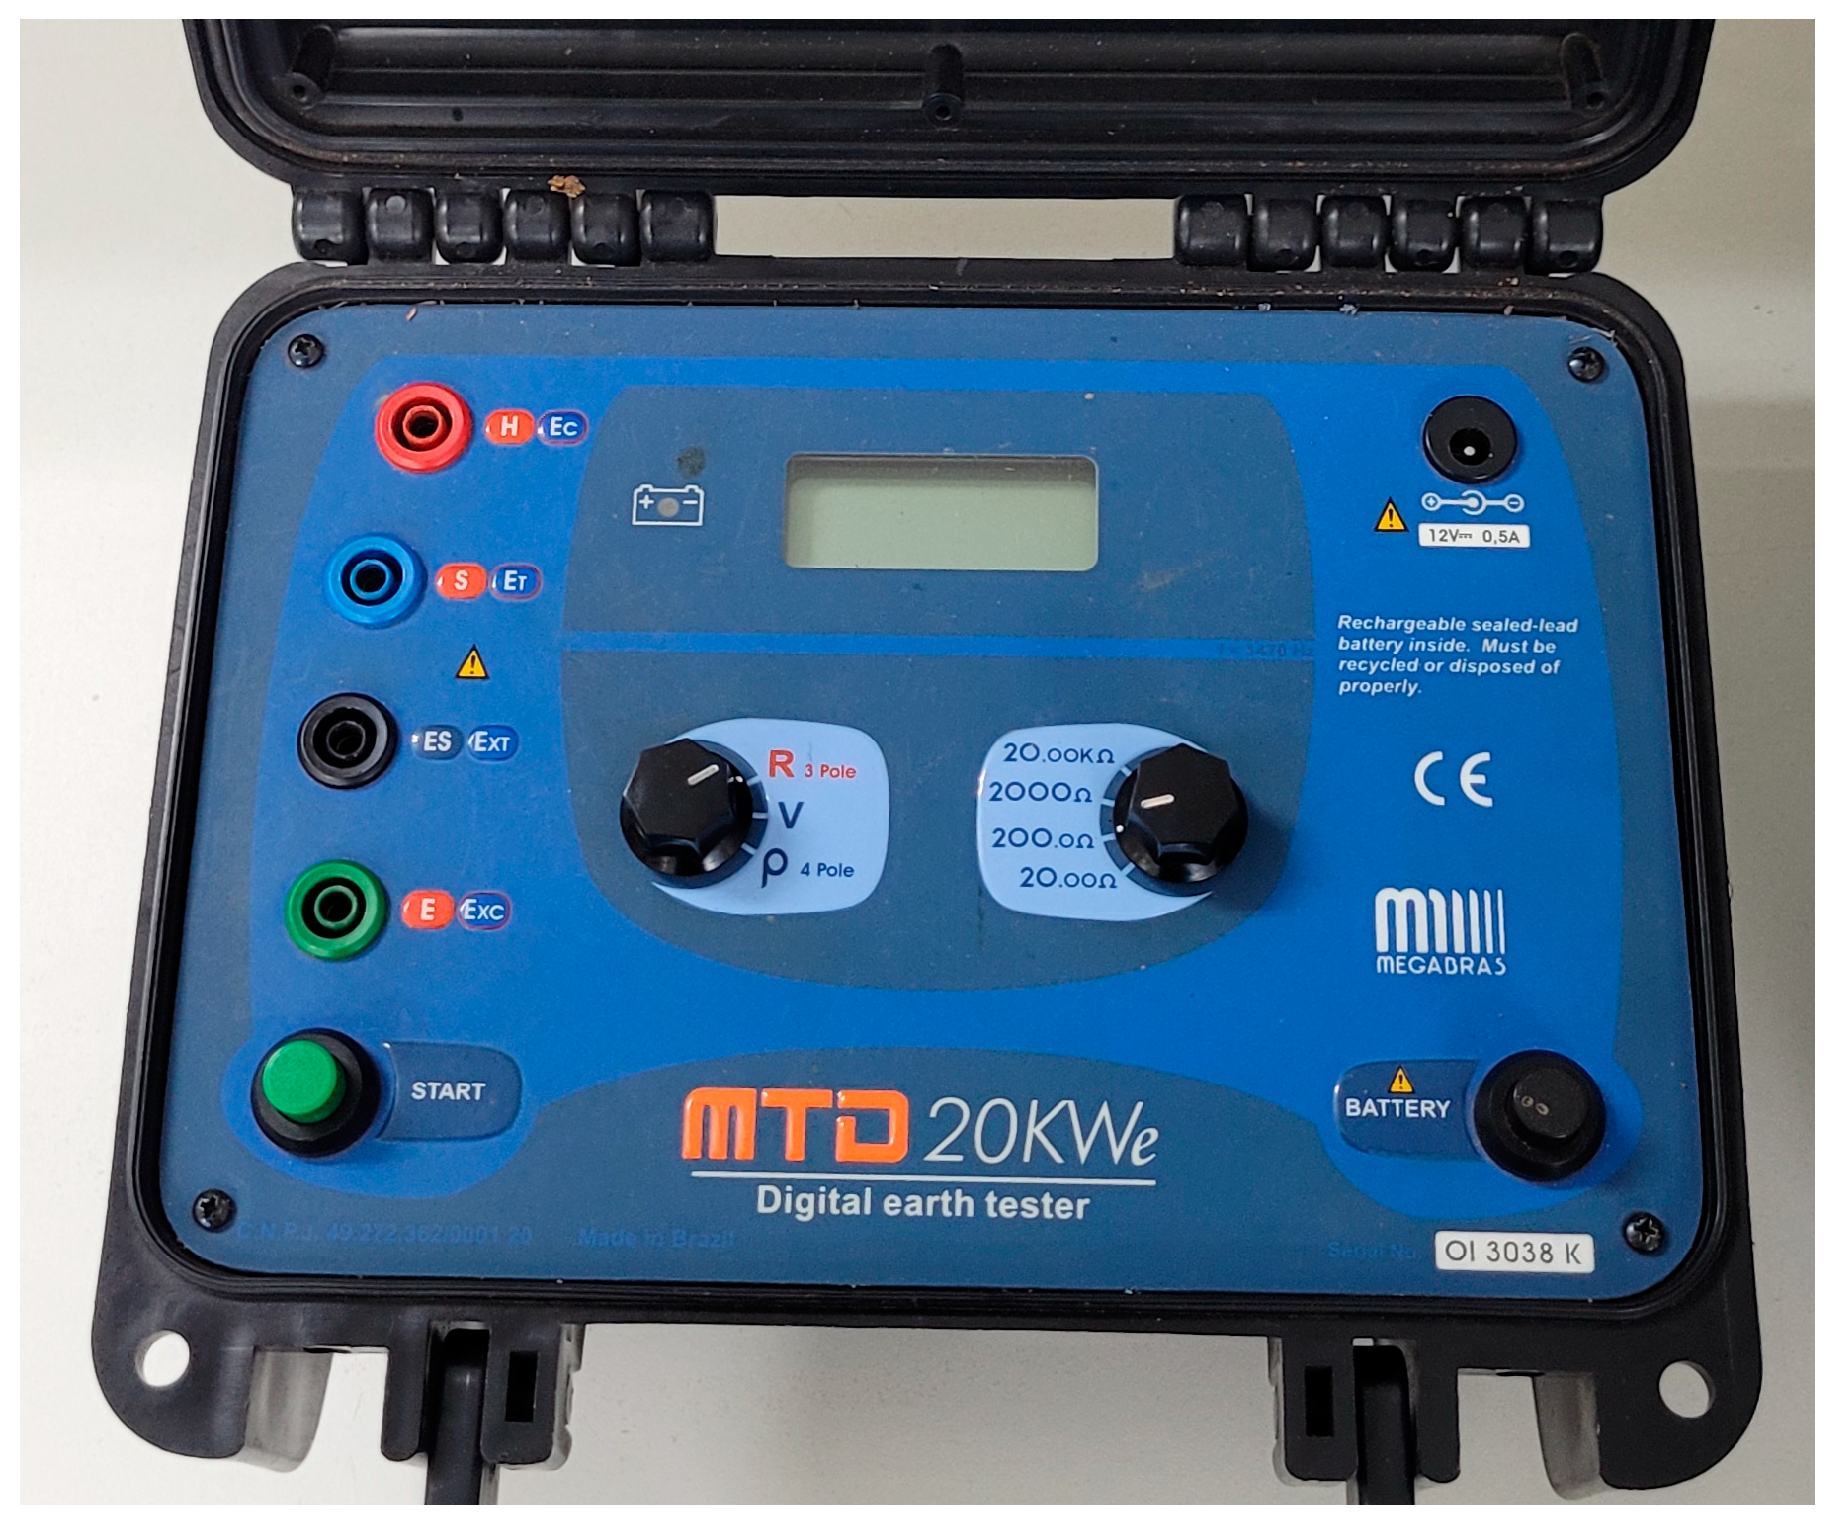
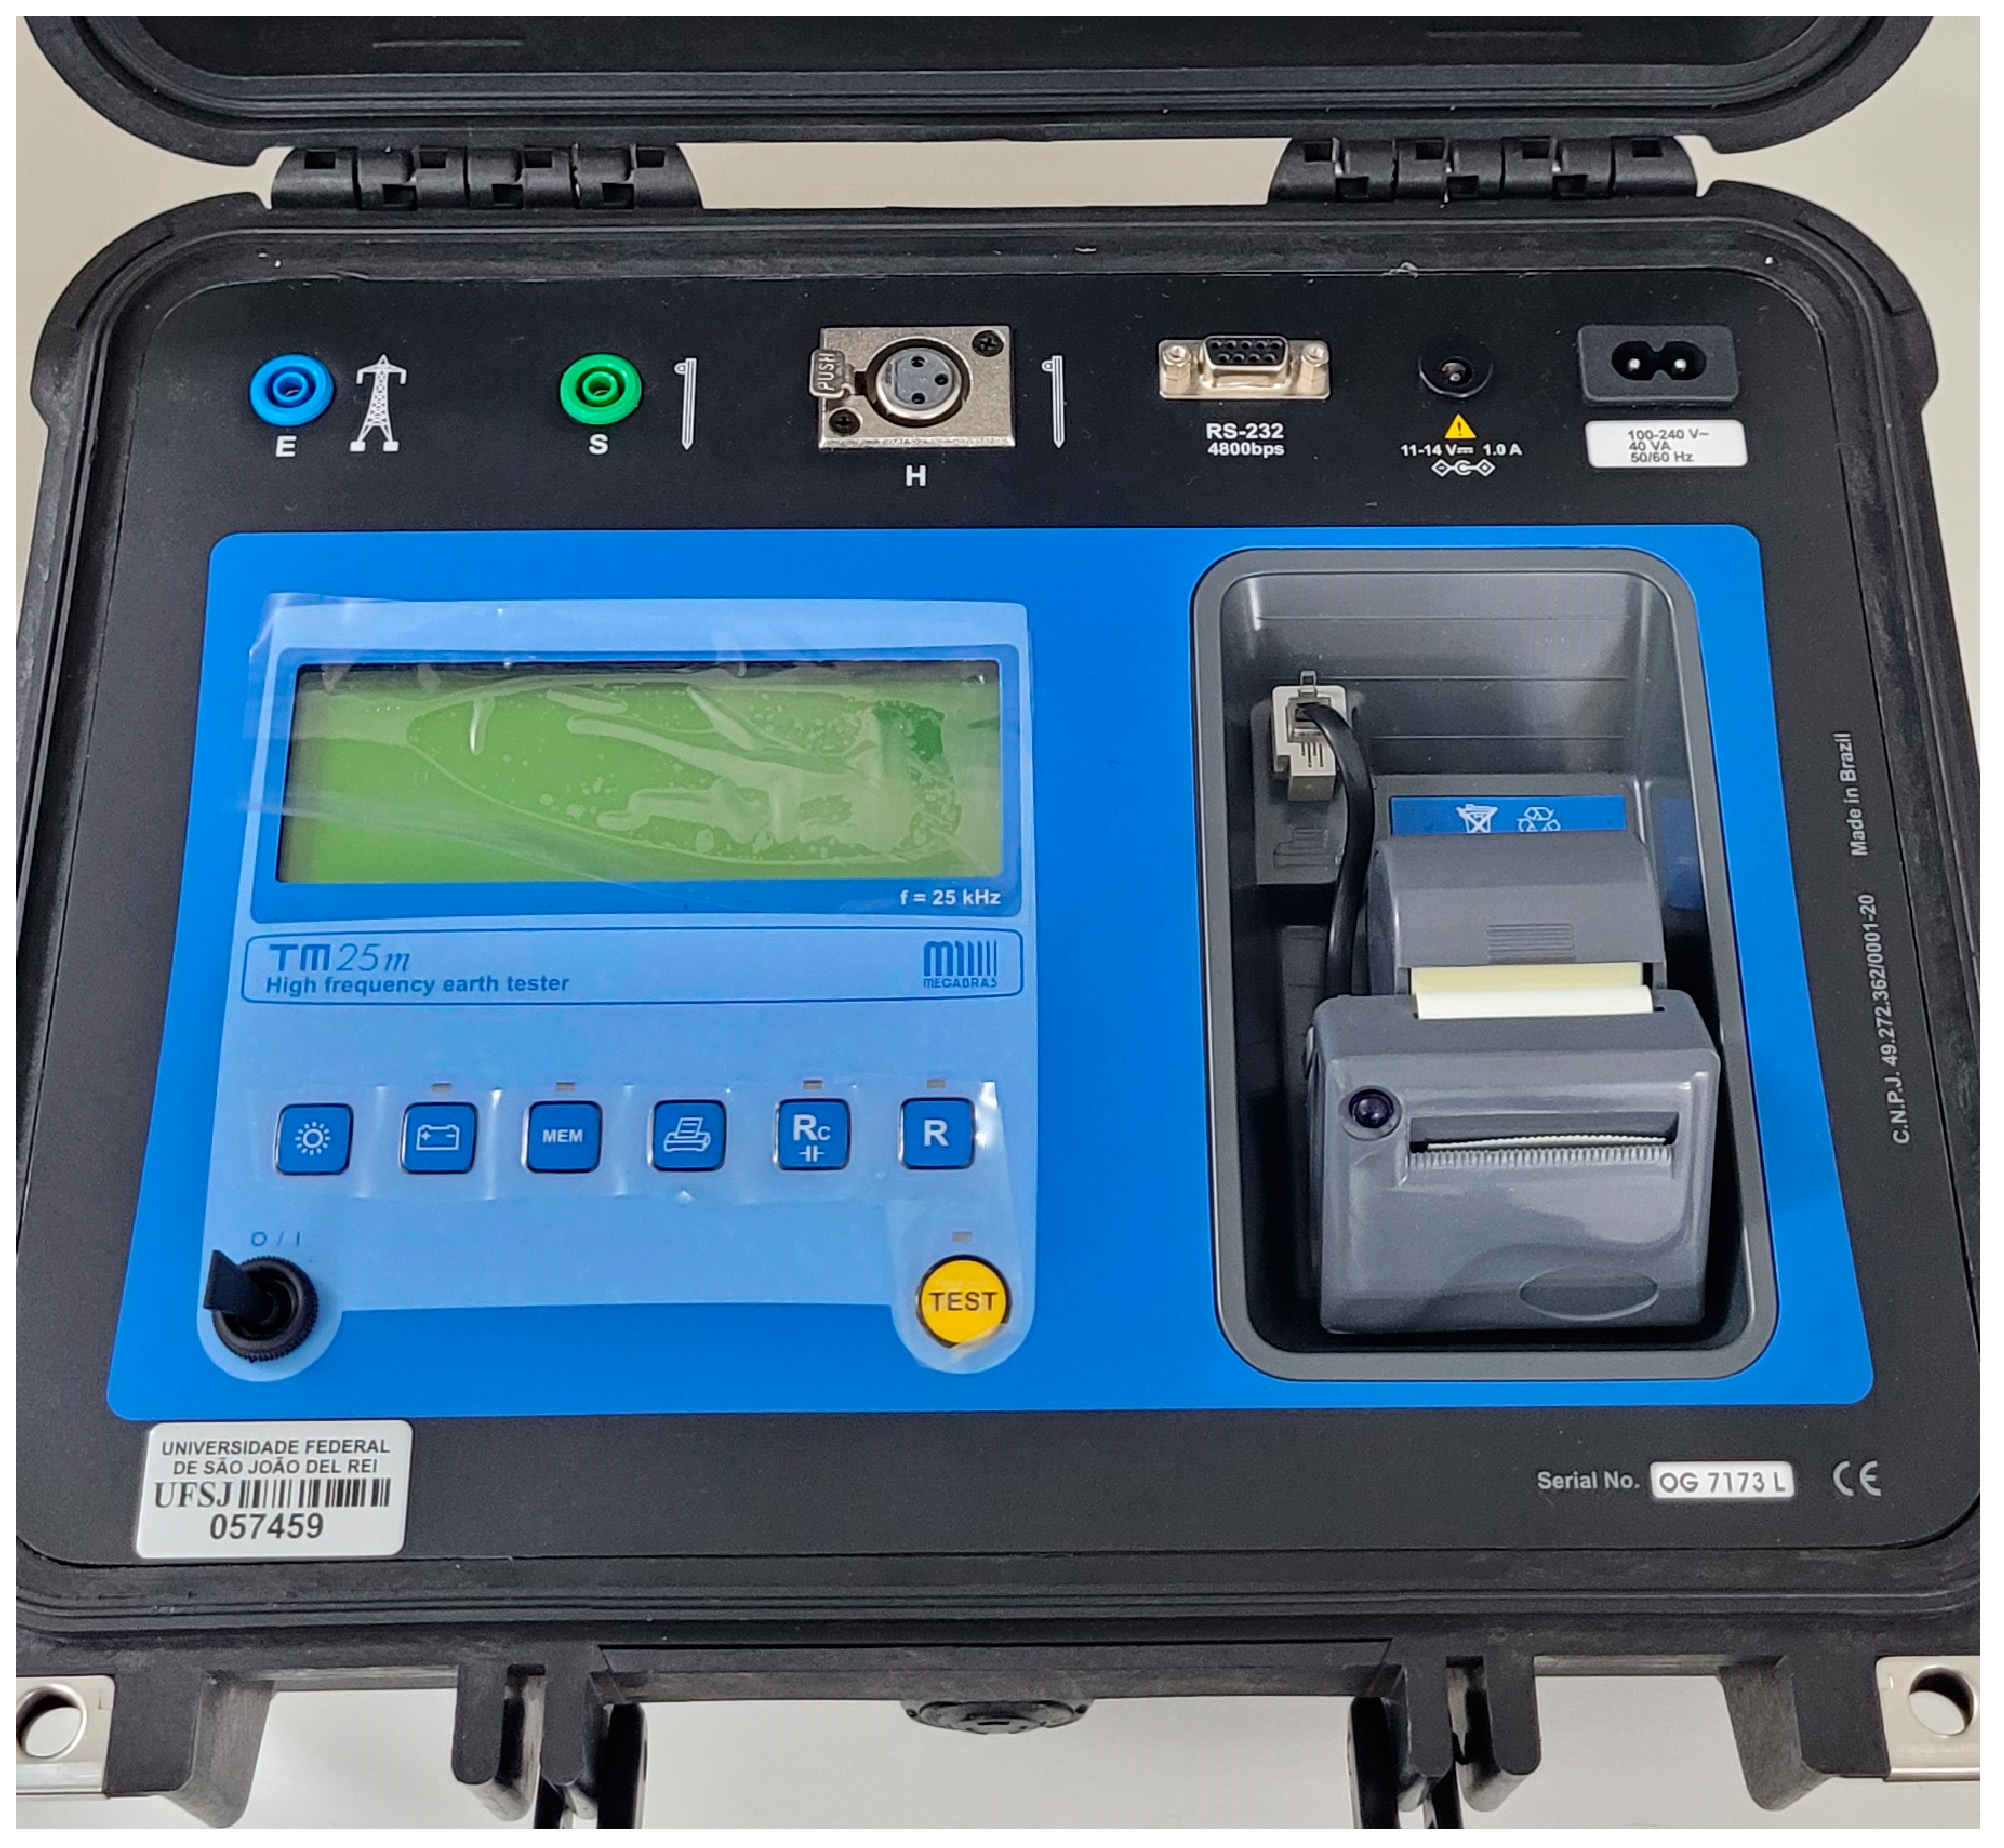
Appendix A provides information on earth testers used in the measurements.

2. Analyzed Transmission Lines

To investigate the accuracy of the measurement results obtained from high-frequency earth meters, we considered two typical transmission lines, one of 138 kV and the other of 230 kV, each containing one and two shield wires, respectively. Figure 3a illustrates the tower geometry of the 138 kV line, which features one ACSR (aluminum conductor steel reinforced) conductor per phase (LINNET) and one 3/8″ EHS (extra-high-strength) shield wire. Similarly, Figure 3b depicts the tower geometry of the 230 kV line, which includes one ACSR conductor per phase (RAIL) and two 3/8″ EHS shield wires. The height of the towers and the corresponding vertical positions of the line cables will vary in the analyses presented in the paper, as will be further detailed in Section 5.

3. Tower-Footing Grounding Configurations and Electromagnetic Modeling

The tower-footing grounding system of the towers is illustrated in Figure 4 (where b is 6 m or 7 m, and d is 20 m or 30 m for the 138 kV and 230 kV lines, respectively). It consists of four counterpoise wires of length l with a diameter of 0.9525 cm and buried at a depth of 0.5 m.
Different approaches are found in the literature for modeling grounding electrodes based on circuit theory [16,17], transmission line theory [8,18], and electromagnetic field theory [7,19,20,21,22]. In this paper, the Hybrid Electromagnetic Model (HEM) is used to model the tower-footing grounding electrodes [7]. The HEM is a computational method developed for the numerical analysis of lightning-related problems [23]. The HEM follows a hybrid electromagnetic circuit approach, employing electromagnetic theory to compute the coupling among system elements through a numerical implementation of fundamental EM equations, including propagation effects, with the results expressed in circuital quantities such as voltages and currents. Computations are performed in the frequency domain, and time-domain results can be obtained through inverse Fourier or Laplace transforms.
The HEM model discretizes grounding electrodes into several filamentary segments, associating two distinct types of electromagnetic field sources with each segment: (i) transversal current and (ii) longitudinal current. The transversal current is a leakage current that crosses the segment surface and spreads into the surrounding medium—the soil in the case of grounding electrodes. It is associated with a conservative electric field, which produces a potential rise on the segment itself and on all other segments relative to remote earth. It is responsible for self and mutual conductive and capacitive coupling between the discretized segments of the grounding electrodes. The longitudinal current, which flows along the segment, is associated with a non-conservative electric field that establishes a voltage drop along the segment itself and contributes to the voltage drop in all other segments. It is responsible for self and mutual inductive coupling between the segments.
The electromagnetic couplings described above, including propagation effects, which become increasingly relevant at higher frequencies, are computed using the electric scalar potential and the magnetic vector potential. The final solution is expressed in terms of the following system of linear equations, computed for each frequency:
Y G · U N = I N ,
where U N is the vector of nodal voltages, I N is the vector of nodal injected currents, and Y G is the grounding admittance matrix, which expresses the electromagnetic coupling between the grounding system elements.
In the simulations, the injected current is assumed to be equally divided between the ends of the counterpoise wires, which are connected to the tower base. Once the system in Equation (1) is solved for each frequency, the nodal voltages are computed, and the harmonic grounding impedance is obtained as the ratio between the resulting nodal voltage and the injected current, considering a range of frequencies relevant to the phenomenon under investigation. It is worth noting that, at DC, the harmonic impedance converges to the so-called low-frequency grounding resistance, R L F . Additionally, the soil resistivity and permittivity were assumed to be frequency-dependent according to the model proposed by Alipio and Visacro in [24] and recommended for lightning-related studies by CIGRE [25].
Comprehensive details on the HEM can be found in [7,23], with its experimental validation—considering different grounding electrode configurations—thoroughly documented in [26,27,28,29,30].
Although the grounding system is more appropriately represented by an impedance in lightning performance studies, in most cases, transmission line utilities determine the total length of each counterpoise leg based on a threshold value of the low-frequency grounding resistance ( R L F ) [5]. In this context, for a given soil resistivity, the total length of grounding electrodes is typically increased until either the threshold value of grounding resistance is reached or a maximum counterpoise wire length is achieved. In this paper, the following criterion based on typical engineering practices was considered: for a given soil resistivity, the counterpoise length l increased from a minimum of 10 m in 5 m increments until the grounding resistance was equal to 20 Ω or less, or until a length of 120 m was reached. To cover a wide range of soil resistivities, ranging from low to high values, eight resistivities were considered: 250 Ωm, 500 Ωm, 1000 Ωm, 2000 Ωm, 3000 Ωm, 5000 Ωm, 7500 Ωm, and 10,000 Ωm. Table 1 shows the lengths l defined for each soil resistivity and for both the 138 kV and 230 kV lines, along with the grounding resistance values (indicated in parentheses), which were obtained through simulations using the HEM.
According to Table 1, the length of counterpoise wire required to achieve the 20 Ω grounding resistance criterion increases with increasing soil resistivity. Also, note that in the case of soils with higher resistivity, the value of R L F was greater than 20 Ω, indicating that four counterpoise wires of 120 m were not sufficient to reach the threshold value. It is also observed in Table 1 that, for the same counterpoise wire length, the grounding resistance for the 230 kV line was slightly lower than that obtained for the 138 kV line. This occurs because, although the grounding electrode arrangement was the same, the tower base dimensions ( b in Figure 4) of the 230 kV line are larger, as well as the distance between counterpoise wires when running in parallel ( D in Figure 4). The increases in both b and D reduces the electromagnetic coupling effect between electrodes, resulting in a slightly lower grounding resistance.

4. Characterization of the Tower-Footing Grounding for Studies of the Lightning Performance of Transmission Lines

Due to the impulse nature of lightning currents, which exhibit a broad frequency range from DC to several MHz [31], the behavior of grounding systems varies across these frequencies. Notably, capacitive and inductive effects become significant, requiring the representation of the grounding system by a frequency-dependent impedance known as harmonic impedance [32]. Despite this, the quality of tower-footing grounding systems in practical transmission line projects is often evaluated using compact parameters, typically either the low-frequency grounding resistance or resistance measured at 25 kHz [15]. This practice is largely justified by the commercial availability of both ordinary and high-frequency earth testers and their widespread application alongside the established fall-of- potential method.
This section outlines the differences between the harmonic grounding impedance, Z j ω , the low-frequency grounding resistance, R L F , and the 25 kHz resistance, R 25 kHz . To clarify these distinctions, the harmonic impedance of the grounding configuration depicted in Figure 4 was calculated across a frequency spectrum from 10 Hz to 1 MHz using the electromagnetic model described in Section 3.

4.1. Harmonic Impedance, Low-Frequency Resistance and 25-kHz Resistance

Figure 5 illustrates the harmonic grounding impedance computed in a frequency range from 10 Hz to 1 MHz, showing both the magnitude (blue line, y-axis on the left) and phase (red line, y-axis on the right) of the grounding system depicted in Figure 4, and assuming soil resistivities of (a) 250 Ωm, (b) 500 Ωm, (c) 1000 Ωm, (d) 2000 Ωm, (e) 3000 Ωm, (f) 5000 Ωm, (g) 7500 Ωm, and (h) 10,000 Ωm. The results in Figure 5 consider the dimensions of the 138 kV tower, i.e., b = 6 m and d = 20 m, along with the lengths indicated in Table 1. Qualitatively similar results were observed when considering the dimensions of the 230 kV tower.
According to the results, up to about 1 kHz, the harmonic impedance exhibits a nearly constant value and a zero-phase angle; that is, it behaves as a pure resistance, which corresponds to the so-called low-frequency grounding resistance, R L F . As the frequency increases, a decrease in the magnitude of Z ( j ω ) is observed. As detailed in [33], such a decrease is attributed to two main effects. The first is the capacitive effect due to the dispersion of displacement currents from the electrode to the earth, as can be identified by the negative phase angle of the impedance in Figure 5. The second is the frequency dependence of the soil parameters, notably the decrease in soil resistivity with increasing frequency. After further increasing the frequency, the inductive behavior begins to influence the grounding behavior, and in the higher frequency range, the inductive effect prevails, as indicated by the dominance of a positive phase angle of the impedance. In general, the capacitive effect is beneficial for the performance of the grounding system, while the inductive effect tends to impair it.
It is worth mentioning that, assuming typical/practical grounding configurations of transmission towers, both the capacitive effect and the decrease in soil resistivity with frequency become more pronounced as the low-frequency soil resistivity increases. This explains the more significant relative decrease in harmonic impedance for soils with higher resistivity in the frequency range where the capacitive effect dominates. Additionally, it is generally observed that the magnitude of the impedance at 25 kHz—referred to here for simplicity as the 25-kHz resistance, R 25 kHz —is lower than the low-frequency grounding resistance, i.e., R L F < R 25 kHz .

4.2. Comparison Between Low-Frequency Resistance and 25-kHz Resistance

Table 2 summarizes the values of R L F and R 25 kHz for both the 138 kV and 230 kV lines and percentage ratio between these quantities, computed as Δ = R 25 k H z R L F × 100 . Confirming the results of Section 4.1, for both TLs, it is observed that R 25 k H z < R L F , and that the percentage difference becomes more significant as the soil resistivity increases. Additionally, the ratio R 25 k H z / R L F decreases with increasing soil resistivity, indicating that the 25 kHz resistance becomes relatively smaller than the low-frequency resistance.
A key conclusion drawn from the results is that the resistance measured at 25 kHz using a high-frequency earth tester differs from the traditional low-frequency resistance, which is typically measured with ordinary earth testers that are commonly used to assess the grounding systems of other electrical installations, such as substations. In the case of high-voltage TLs, the low-frequency resistance can be measured using an ordinary earth tester, provided that the shield wires are disconnected from the tower or, alternatively, the grounding electrodes are disconnected from the base of the tower.
A question that may arise is why was there an expectation that using high-frequency meters would yield a value similar to the low-frequency resistance? Presumably, this expectation stems from a misunderstanding that the high-frequency behavior of grounding electrodes is dominated solely by the inductive effect, neglecting the capacitive effect. Indeed, CIGRE Technical Brochure 275—Methods for Measuring the Earth Resistance of Transmission Towers Equipped with Earth Wires—states that “the earthing can be simply described as a resistance in series with an inductance” [11]. According to the same reference, the grounding impedance is a pure resistance and remains constant and equal to its DC resistance up to a cutoff frequency located around several tens to hundreds of kHz, after which it increases due to the inductive effect. Thus, assuming the typical frequency of 25 kHz used in commercial high-frequency earth testers, there would be an expectation that the grounding impedance would be essentially flat from low frequencies up to the range of several kHz. However, this occurs only in specific cases, notably long grounding electrodes buried in soils with low or very low resistivity [32].
A second important point is that, contrary to the claims sometimes made by earth tester manufacturers, the value measured at 25 kHz is not necessarily more representative for lightning performance studies of the line simply because it employs a higher frequency signal. In fact, lightning currents do not present a single representative frequency but a spectrum of frequencies ranging from DC up to several MHz, depending on the rise time of the current. It is also a common belief in practice that the 25 kHz frequency is representative of the standardized 10/350 µs waveform, which several guidelines [34,35,36] assume to represent the first positive lightning impulse. This idea is based on the fact that, assuming a sinusoidal waveform of 25 kHz, the time interval from zero to the maximum value would be equal to T/4 = 10 µs, where T is the period given by T = 1/25 kHz. However, it is important to stress again that actual lightning currents contain a broad frequency spectrum and not a single frequency. Moreover, for the purposes of assessing the lightning performance of transmission lines, negative lightning is much more significant than positive lightning, with the front-time of typical negative downward first strokes being on the order of 4 µs [1,37,38].

5. Assessing the Accuracy of High-Frequency Earth Testers

5.1. Methodology

The accuracy of the measurements performed using high-frequency earth testers depends on several factors, primarily the value of the resistance being measured, the length of the adjacent spans to the tower whose grounding resistance is being measured, and the number of shield wires present in the structure [11]. These three factors are directly related to the operating premise of a high-frequency earth tester, which assumes that the equivalent impedance of the adjacent spans to the tower under measurement should be significantly higher than the grounding impedance being measured.
To assess the accuracy of high-frequency earth testers, the following simulation setup in the Alternative Transients Program (ATP)—ATPDraw version 7.5p6—was proposed [39]. For both the 138 kV and 230 kV lines depicted in Figure 3, a 25 kHz sinusoidal current—representing the internal source of the high-frequency earth tester—is injected at the base of a central tower, which has 10 adjacent spans on each side. Each span is represented as an untransposed line section with distributed/frequency-dependent parameters using Marti’s model implemented in ATP. The coordinates of the conductors, as well as their electrical characteristics, are entered in the Line and Cable Constants (LCC) routine of ATP, according to the details of both TLs presented in Section 2.
The tower-footing grounding system is modeled by considering its frequency-dependent harmonic impedance, as shown in Figure 5. In this work, from the harmonic impedance Z j ω , a pole-residue model of the associated admittance Y j ω = 1 / Z j ω is obtained using the vector fitting technique [40]. Finally, an equivalent circuit is synthesized from the pole-residue model and incorporated in the ATP time-domain simulations, as detailed in [21,41].
Figure 6 depicts a schematic representation of the simulation setup. In each simulation, the injected current from the current generator and the ground potential rise at the tower-footing grounding systems are measured. From the relationship between these quantities, the grounding impedance that would be measured by the earth tester is determined.
In simulations for each TL and soil resistivity and the associated tower-footing grounding configuration (see Table 1), the span length was varied from 100 m to 1000 m in order to cover different scenarios encountered in practice. To consider realistic practical cases, the height of the towers shown in Figure 3 was varied according to the span length. Minimum ground clearance heights of 7.5 m and 8.5 m were assumed, respectively, for the 138 kV and 230 kV lines, in accordance with Brazilian practices. The sags were estimated based on typical ACSR phase conductor and steel shield wire weights, strung at 20% rated tensile strength (RTS), using Equations (2) and (3), respectively, for the shield wires and phase conductors, as taken from Annex B of IEEE Std. 1243 [37]:
s a g S W = 7.0 × 10 5 · l s p a n 2 ,
s a g P h C = 4.5 × 10 5 · l s p a n 2 ,
where l s p a n is the span length in meters.
It is worth mentioning that, although the wavelength (12,000 m) in free space associated with the instrument’s operational frequency (25 kHz) is much greater than the span lengths analyzed in the paper, the LCC routine and ATP line models were used to account for the coupling between line conductors, particularly the inductive coupling, which may influence the results. Additionally, the use of the LCC subroutine allowed the authors to more easily and effectively handle the various configurations analyzed, including varying tower heights (and, consequently, the geometric positioning of the conductors) and span lengths.
Finally, it is important to note that the total inductance of a transmission tower is considerably lower than that of the line span. This is because the tower height is much smaller than the span length—on average, at least ten times shorter in the cases analyzed in this paper—and because the per-unit-length inductance of the line span is typically at least three times greater than that of the tower, considering standard tower heights and geometries [42]. Therefore, in ATP simulations, the tower inductance was neglected, as its influence on the results is minimal compared to that of the transmission line conductors.

5.2. Results for the 138 kV Line

Figure 7 presents the results obtained, showing the value of R 25 k H z that would be measured using the HF earth tester—determined from the ATP simulations—as a function of the span length, considering soil resistivities of (a) 250 Ωm, (b) 500 Ωm, (c) 1000 Ωm, (d) 2000 Ωm, (e) 3000 Ωm, (f) 5000 Ωm, (g) 7500 Ωm, and (h) 10,000 Ωm, along with the associated tower-footing grounding systems (see Table 1). A dotted line was included in the graphs to emphasize that the measured value tends to stabilize with increasing span length. Indeed, as shown Table 2, it is evident that the value measured for a span of 1000 m closely matches the R 25 k H z value computed through simulations with a negligible difference. It is worth noting that the values of R 25 k H z in the graphs in Figure 7 correspond to the magnitude of the harmonic grounding impedance computed at 25 kHz—which is typically the value provided by commercial HF earth testers—and thus does not include the phase angle.
According to the results, in general, the value measured using the high-frequency earth testers is lower than the real value of R 25 k H z for shorter span lengths. This presumably stems from the fact that, for shorter span lengths, the span inductive impedance at 25 kHz is not much higher than the grounding impedance. Thus, a non-negligible part of the current injected by the earth tester is diverted to the shield wires, leading to a lower measured value compared to the real one. As the span length increases, the span inductive impedance also increases, and most of the current supplied by the earth tester is effectively injected into the tower-footing grounding system. As a result, the measured value using the high-frequency earth tester tends to approach the real value of R 25 k H z . According to Figure 7, for the considered 138 kV line, the value obtained using the HF earth tester closely matches that obtained through simulations for span lengths between 400 m and 500 m or greater.
Figure 8 summarizes the results showing the errors in the values that would be measured using the HF earth tester. The errors were computed based on the measurements for the 1000 m span, since in practical scenarios, these values closely match the R 25 k H z value computed through simulations. Thus, assuming the value obtained for the 1000 m span as the true 25-kHz resistance, R 25 k H z t r u e , and the value of R 25 k H z obtained in each ATP simulation, R 25 k H z A T P , for each span length (which emulates the real application of the HF earth tester in field conditions), the error was computed as e r r o r % = R 25 k H z t r u e R 25 k H z A T P R 25 k H z t r u e × 100 . It is seen that, regardless of soil resistivity, the curves show a trend of decreasing errors as the span length increases. The specific error value for each soil resistivity and span length depends on both the magnitude and phase of the grounding harmonic impedance at 25 kHz, which influences the current division at the point of connection of the HF earth tester. In general, the average error value is around 25% for the 100 m span, decreasing to about 10% and 5%, respectively, for the 200 m and 300 m spans. Considering the inherent challenges in measuring tower-footing ground resistance, it may be stated that an error of 5% is quite reasonable in practical terms.

5.3. Results for the 230 kV Line

Figure 9 shows similar results for the value of R 25 k H z that would be measured using an HF earth tester as a function of the span length, assuming the same soil resistivities. Again, it should be noted that the values of R 25 k H z in the graphs in Figure 9 correspond to the magnitude of the harmonic grounding impedance computed at 25 kHz. The primary structural difference is the presence of two shield wires in the 230 kV line compared to one in the 138 kV line, which affects the current division during measurements. A dotted line was also included in the graphs to emphasize the stabilization of the measured value with increasing span length. Similar to the 138 kV line, the results for a 1000 m span show excellent agreement with the R 25 k H z values computed through simulations, confirming the method’s reliability for long spans.
In general, the presence of two shield wires causes the measured value of R 25 k H z to deviate from the real value for shorter span lengths more significantly than for the 138 kV line. This is because the additional shield wire further reduces the span inductive impedance at 25 kHz, leading to a higher portion of the current being diverted through the shield wires instead of the grounding system. However, as the span length increases, the inductive impedance of the span rises, resulting in a reduced diversion of current to the shield wires and a measured value that aligns more closely with the real R 25 k H z . For the 230 kV line, this alignment is observed for spans between 500 m and 600 m or greater, as shown in Figure 9.
Figure 10 summarizes the errors in the values measured using the HF earth tester for the 230 kV line, which were computed similarly to the 138 kV case using the 1000 m span as the reference. The trends remain consistent: the errors decrease as the span length increases. However, the presence of two shield wires slightly modifies the error magnitude, particularly for shorter spans. For the 100 m span, the average error is approximately 40%, decreasing to 20% and 10% for the 200 m and 300 m spans, respectively. These values reflect the combined effects of the shield wire configuration and soil resistivity. Despite the increased complexity introduced by the two shield wires, the observed errors remain within reasonable limits for practical applications, especially for spans exceeding 400 m, where the error is consistently of the order of 5% or less.

6. Experimental Results

Measurements of the tower-footing ground resistance for a few towers of a 500-kV transmission line located in the northeast region of Brazil were conducted. For confidentiality reasons, not all these measurements can be disclosed, and, therefore, this section focuses on one of these measurements involving the guyed structure shown in Figure 11a, which corresponds to the dominant structure of the mentioned transmission line. It is worth noting that, despite the difference in tower topology between the one used for measurements and those considered in the simulations, the most relevant factor in analyzing the accuracy of HF earth tester measurements is the number of shield wires, as it directly affects the current division between the tower-footing grounding system and the shield wires. Therefore, the results obtained from this measurement campaign can be considered representative of those from simulations for self-supporting towers with two shield wires. The grounding configuration of the tower, along with the dimensions of the grounding electrodes, is shown in Figure 11b. The connections of the central mast and the guy wires to the grounding systems are depicted in Figure 11c and Figure 11d, respectively. The length of the spans adjacent to the tested tower were 435 m and 465 m.
To measure the tower-footing ground resistance, the fall-of-potential (FOP) method was used [10]. As briefly described in the Introduction, this method involves applying a current to the grounding system under test through a current-return probe and recording the voltage drop between the grounding system and a potential probe. To prevent electromagnetic coupling between the grounding system under test and the current probe, the latter should be placed at a sufficiently large distance from the former. Additionally, the placement of the potential probe is critical, as it must be located in a region free from interference from both the grounding system under test and the current-return probe. A practical approach to verify whether the potential probe is unaffected by other electrodes is to take multiple resistance measurements while repositioning it between the grounding system under test and the current probe. If two or three consecutive readings show negligible variation, the mean value of these readings can be considered representative of the true grounding resistance (flat slope method).
Considering the details described for the consistent application of the FOP method, the experimental setup depicted in Figure 12 was assembled. The current circuit was laid out perpendicular to the line axis, and the current probe—composed of four ground rods in parallel, each one meter in length—was placed 200 m away from the tower’s central mast. The voltage circuit was also laid out perpendicular to the line axis, and the potential probe was placed at three positions: 119 m, 132 m, and 145 m from the mast. For each position, the grounding resistance was measured. If the difference between the measurements did not exceed 5%, the average of the three values was assumed as the true resistance (flat slope method) [10]. A shielded cable was used for the current lead in all measurements.
Measurements were conducted using the fall-of-potential method under two distinct conditions:
  • Using a commercial high-frequency earth tester, without disconnecting the grounding electrodes from the central mast and the guy wires;
  • Using the same high-frequency earth tester and a conventional low-frequency earth tester, with the grounding electrodes disconnected from both the central mast and the guy wires, as depicted in Figure 13. Under this condition, the connection cables to the grounding electrodes were routed overhead and connected to the current injection terminals of the instruments (see Figure 13a).
  • The measurement results are presented in Table 3. Additionally, a description of the high-frequency and conventional low-frequency earth testers used is provided in the Appendix A.
The resistivity at the location where the tower-footing grounding electrodes were buried was determined from the measured low-frequency resistance based on the relationship R L F = ρ a · K g e o , where K g e o is a constant related to the electrode geometry, which is known since the tower-footing grounding geometry is available (Figure 11b). The parameter ρ a represents the so-called apparent resistivity, that is, the resistivity of a homogeneous equivalent soil in which the tower-footing grounding system would present the same low-frequency grounding resistance. Based on the measured R L F , the apparent soil resistivity was estimated to be approximately 7715 Ωm.
It is observed that the R 25 k H z value measured with the grounding electrodes disconnected is approximately 8% higher than the value measured without disconnection. This discrepancy is presumably due to a small current that is still diverted to the shield wires instead of being injected into the grounding system under test. In addition, part of the difference between the two measured values can be attributed to the fact that, when measuring with the grounding electrodes disconnected, the resistance value tends to be higher than the actual value, as the contribution of the structure’s foundations is not considered. This percentage difference of ~8% is considered acceptable in practical terms, given the uncertainties involved in tower-footing grounding measurements. These findings align with the conclusions from Section 5 and confirm that, considering that the tested tower has two shield wires, the high-frequency earth tester provides a reliable estimate of R 25 kHz for the considered lengths of adjacent spans (>400 m).
Comparing the values of R L F and R 25 k H z , both measured with the grounding electrodes disconnected from the tower mast and guy wires, R 25 k H z is approximately 47% of R L F . This result aligns well, within the measurement uncertainties, with the same ratio found through simulations presented in Table 2 for high-resistivity soils.
To further analyze the measurements, Figure 14 shows the computed magnitude of the harmonic grounding impedance for the arrangement depicted in Figure 11b. The harmonic grounding impedance was computed using the HEM model, considering the grounding electrode arrangement of the tested tower depicted in Figure 11b and assuming the determined apparent soil resistivity of 7715 Ωm. Additionally, frequency-dependent soil parameters were considered according to the Alipio–Visacro model, as described in Section 3. The diamond marker in the same figure represents the measured R 25 k H z value. It can be observed that the computed harmonic impedance exhibits a behavior similar to that shown in Figure 5: it remains nearly constant up to a few kHz (equal to the low-frequency resistance, R L F ), then decreases with increasing frequency due to capacitive effects, and finally increases at higher frequencies due to inductive behavior. Notably, an impressive outcome from Figure 14 is the excellent agreement between the computed and measured harmonic impedance at 25 kHz.

7. Summary and Conclusions

This paper presented a comprehensive assessment of the accuracy of the results provided by widely used high-frequency earth meters for measuring the tower-footing ground resistance of transmission line structures based on both simulations and experimental results.
The simulations presented in this work, supported by experimental data, demonstrate that high-frequency earth meters consistently provide reliable estimates of the tower-footing resistance/impedance at the instrument’s operating frequency, considering typical span lengths and a wide range of soil resistivities. For the tower geometries analyzed in this study, high-frequency earth meters were shown to deliver accurate measurements for towers with adjacent span lengths of approximately 300 m and 400 m, corresponding to configurations with one and two shield wires, respectively. Furthermore, acceptable results (errors below 10%) were observed for span lengths exceeding 200 m and 300 m under the same conditions. Although the conclusions drawn cannot necessarily be considered valid for all line configurations, they provide a very good first set of guidelines.
It is worth mentioning that these conclusions were obtained under the assumption of good engineering practices in the design of the tower-footing grounding system, ensuring that the grounding resistance remains below a reasonable threshold. In cases where the tower-footing ground resistance is excessively high, poor measurement accuracy is expected when using high-frequency earth meters, particularly for structures with two shield wires. Additionally, such meters are not recommended for very short spans, as the inductive reactance of the span may be comparable to the grounding resistance of the tower under test.
As discussed, considering the frequency used by the earth tester, what is measured is not the tower-footing resistance at the industrial frequency but rather the magnitude of the harmonic impedance at the instrument’s operating frequency, typically 25 kHz when assuming commercial instruments. As demonstrated through simulations using an accurate electromagnetic model and typical grounding system conditions for transmission lines, due to the capacitive effect and the frequency dependence of soil parameters, the impedance value at 25 kHz—referred to in this paper simply as the 25-kHz resistance ( R 25 k H z )—is expected to be lower than the tower-footing resistance at the industrial frequency.
Although the value provided by high-frequency earth meters is not the resistance at the industrial frequency, its significance lies in providing an accurate measure of the grounding impedance at the instrument’s operating frequency, which can be used to evaluate the condition of the tower-footing grounding system. Additionally, measurements taken by the HF earth meter at different times of the year can help evaluate the impacts of seasonal variations through comparisons of the values measured across different periods. Furthermore, measuring the grounding system after an outage can reveal any underlying issues or damage, such as corrosion, that might have contributed to the outage itself. Finally, using an electromagnetic model and knowing the geometry of the electrode arrangement of the tower-footing grounding system, the resistance at industrial frequency can be estimated from the measured R 25 k H z value through an inversion process if required or deemed necessary.
In general, it can be concluded that, provided that the fall-of-potential method is properly applied, high-frequency earth meters can be used to effectively assess the performance of tower-footing grounding systems in high-voltage transmission lines in most practical cases.

Author Contributions

Conceptualization, R.S., R.A. and J.O.S.P.; methodology, R.S., R.A. and J.O.S.P.; software, R.S. and R.A.; validation, R.S. and R.A.; formal analysis, R.S., R.A. and J.O.S.P.; investigation, R.S., R.A. and J.O.S.P.; resources, R.S., R.A. and J.O.S.P.; data curation, R.S. and R.A.; writing—original draft preparation, R.S. and R.A.; writing—review and editing, R.S., R.A. and J.O.S.P.; visualization, R.S., R.A. and J.O.S.P.; supervision, R.A. and J.O.S.P.; project administration, R.A. and J.O.S.P.; funding acquisition, R.S., R.A. and J.O.S.P. All authors have read and agreed to the published version of the manuscript.

Funding

This study was financed in part by the Coordenação de Aperfeiçoamento de Pessoal de Nível Superior—Brasil (CAPES)—Finance Code 001. This paper was also supported by the National Council for Scientific and Technological Development (CNPq) through grant 314849/2021-1.

Data Availability Statement

The original contributions presented in this study are included in the article. Further inquiries can be directed to the corresponding author.

Conflicts of Interest

The authors declare no conflicts of interest.

Appendix A. Measurement Equipment

The measurements of the tower-footing grounding resistance, as described in Section 6, were conducted using two different devices: a conventional low-frequency earth tester, with the grounding electrodes disconnected from the tower, and a high-frequency earth tester, with the electrodes both connected and disconnected from the tower.

Appendix A.1. Low-Frequency Earth Tester

The low-frequency earth tester used was the MTD-20KWe model manufactured by Megabras, as depicted in Figure A1. This digital earth tester allows for the measurement of earth resistance and soil resistivity in a range from 0.01 Ω to 20 kΩ [43]. The device is powered by a rechargeable internal battery.
Figure A1. Conventional low-frequency earth tester—MTD-20KWe model.
Energies 18 01959 g0a1
The current injected by this equipment operates at 1470 Hz to avoid interference with industrial frequency components and their harmonics. Additionally, it features an internal system of active and passive filters, providing high immunity to electrical interference, ensuring reliable measurements even in the presence of spurious voltages.
It is worth mentioning that, although the measurement frequency of this conventional earth tester is 1470 Hz, for most typical soil resistivities encountered in practice, the grounding system behaves as a pure resistance without a significant capacitive or inductive influence. Detailed technical specifications of the MTD-20KWe earth tester can be found in [43].

Appendix A.2. High-Frequency Earth Tester

The high-frequency earth tester used was the TM25m model, also manufactured by Megabras, depicted in Figure A2. This digital earth tester is primarily used for measuring the grounding resistance of high-voltage transmission line towers. Its operation is based on the injection of a high-frequency measurement current (25 kHz), at which the inductive impedance of ground wires—considering a typical span length—is sufficiently high to reduce the influence of adjacent towers, eliminating the need to disconnect the counterpoise wires from the tower.
Figure A2. High-frequency earth tester—TM25m model.
Energies 18 01959 g0a2
The displayed value corresponds to the ratio between the magnitude of the measured voltage drop and the injected current, thus representing the magnitude of the harmonic impedance at 25 kHz. The TM25m earth tester is also powered by a rechargeable internal battery. Detailed technical specifications of the TM25m earth tester can be found in [44].

References

  1. Engelbrecht, C.; Podkoritnik, S. CIGRE TB 839: Procedures for Estimating the Lightning Performance of Transmission Lines—New Aspects; Working Group C4.23: Paris, France, 2021. [Google Scholar]
  2. Anderson, J.G. Lightning Performance of Transmission Lines. In Transmission Line Reference Book, 345 kV and Above; Electric Power Research Institute (EPRI): Palo Alto, CA, USA, 1982; pp. 545–597. [Google Scholar]
  3. Visacro, S.; Silveira, F.H. Lightning Performance of Transmission Lines: Requirements of Tower-Footing Electrodes Consisting of Long Counterpoise Wires. IEEE Trans. Power Deliv. 2016, 31, 1524–1532. [Google Scholar] [CrossRef]
  4. Datsios, Z.G.; Mikropoulos, P.N.; Tsovilis, T.E. Closed-Form Expressions for the Estimation of the Minimum Backflashover Current of Overhead Transmission Lines. IEEE Trans. Power Deliv. 2021, 36, 522–532. [Google Scholar] [CrossRef]
  5. Vasconcellos, F.; Alípio, R.; Moreira, F. Evaluation of the Impact of Including the Frequency-Dependent Behavior of Grounding Systems on the Lightning Performance of Transmission Lines and on Grounding Systems Design. J. Control Autom. Electr. Syst. 2022, 33, 531–540. [Google Scholar] [CrossRef]
  6. Grcev, L.; Dawalibi, F. An Electromagnetic Model for Transients in Grounding Systems. IEEE Trans. Power Deliv. 1990, 5, 1773–1781. [Google Scholar] [CrossRef]
  7. Visacro, S.; Soares, A. HEM: A Model for Simulation of Lightning-Related Engineering Problems. IEEE Trans. Power Deliv. 2005, 20, 1206–1208. [Google Scholar] [CrossRef]
  8. He, J.; Gao, Y.; Zeng, R.; Zou, J.; Liang, X.; Zhang, B.; Lee, J.; Chang, S. Effective Length of Counterpoise Wire Under Lightning Current. IEEE Trans. Power Deliv. 2005, 20, 1585–1591. [Google Scholar] [CrossRef]
  9. Alipio, R.; Duarte, N.; Karami, H.; Rubinstein, M.; Rachidi, F. Assessment of the Feasibility of Applying the Electromagnetic Time Reversal Theory to Locate Defects in Grounding Electrodes. Energies 2023, 16, 5104. [Google Scholar] [CrossRef]
  10. Institute of Electrical and Electronics Engineers (IEEE). IEEE Std 81—IEEE Guide for Measuring Earth Resistivity, Ground Impedance, and Earth Surface Potentials of a Grounding System; IEEE: New York, NY, USA, 2012. [Google Scholar]
  11. Working Group C4.2.02. CIGRE TB 275: Methods for Measuring the Earth Resistance of Transmission Towers Equipped with Earth Wires; Working Group C4.2.02: Paris, France, 2005. [Google Scholar]
  12. Raizer, A.; Elias, E.P.; da Luz, M.V.F.; Coelho, V.L.; Raupp, V.M.A.; Telló, M.; Giannini Júnior, J.M. Traditional and Alternative Grounding System’s Impedance and Resistance Measurements of a 138 KV Transmission Line Tower. Electr. Power Syst. Res. 2024, 231, 110358. [Google Scholar] [CrossRef]
  13. Lima, A.B.; Caetano, C.E.F.; Paulino, J.O.S.; Boaventura, W.C.; Lopes, I.J.S.; Barbosa, C.F. An Original Setup to Measure Grounding Resistances Using Fast Impulse Currents and Very Short Leads. Electr. Power Syst. Res. 2019, 173, 6–12. [Google Scholar] [CrossRef]
  14. Lima, A.B.; Paulino, J.O.S.; Boaventura, W.C.; Lopes, I.J.S.; Guimarães, M.F.; Chisholm, W.A.; Jamali, B.; Bologna, F. Transient Grounding Impedance and Transient Resistivity Measurements Using a Very Short Current Lead. Electr. Power Syst. Res. 2015, 118, 69–75. [Google Scholar] [CrossRef]
  15. Visacro, S.; Silveira, F.H.; Oliveira, C.H.D. Measurements for Qualifying the Lightning Response of Tower-Footing Electrodes of Transmission Lines. IEEE Trans. Electromagn. Compat. 2019, 61, 719–726. [Google Scholar] [CrossRef]
  16. Otero, A.F.; Cidras, J.; del Alamo, J.L. Frequency-Dependent Grounding System Calculation by Means of a Conventional Nodal Analysis Technique. IEEE Trans. Power Deliv. 1999, 14, 873–878. [Google Scholar] [CrossRef]
  17. Gatta, F.M.; Geri, A.; Lauria, S.; Maccioni, M. Simplified HV Tower Grounding System Model for Backflashover Simulation. Electr. Power Syst. Res. 2012, 85, 16–23. [Google Scholar] [CrossRef]
  18. Liu, Y.; Theethayi, N.; Thottappillil, R. An Engineering Model for Transient Analysis of Grounding System Under Lightning Strikes: Nonuniform Transmission-Line Approach. IEEE Trans. Power Deliv. 2005, 20, 722–730. [Google Scholar] [CrossRef]
  19. Grcev, L.D. Computer Analysis of Transient Voltages in Large Grounding Systems. IEEE Trans. Power Deliv. 1996, 11, 815–823. [Google Scholar] [CrossRef]
  20. Tsumura, M.; Baba, Y.; Nagaoka, N.; Ametani, A. FDTD Simulation of a Horizontal Grounding Electrode and Modeling of Its Equivalent Circuit. IEEE Trans. Electromagn. Compat. 2006, 48, 817–825. [Google Scholar] [CrossRef]
  21. Alemi, M.R.; Sheshyekani, K. Wide-Band Modeling of Tower-Footing Grounding Systems for the Evaluation of Lightning Performance of Transmission Lines. IEEE Trans. Electromagn. Compat. 2015, 57, 1627–1636. [Google Scholar] [CrossRef]
  22. Schroeder, M.A.d.O.; de Moura, R.A.R.; Machado, V.M. A Discussion on Practical Limits for Segmentation Procedures of Tower-Footing Grounding Modeling for Lightning Responses. IEEE Trans. Electromagn. Compat. 2020, 62, 2520–2527. [Google Scholar] [CrossRef]
  23. Working Group C4.37. CIGRE TB 785: Electromagnetic Computation Methods for Lightning Surge Studies with Emphasis on the FDTD Method; Working Group C4.37: Paris, France, 2019. [Google Scholar]
  24. Alipio, R.; Visacro, S. Modeling the Frequency Dependence of Electrical Parameters of Soil. IEEE Trans. Electromagn. Compat. 2014, 56, 1163–1171. [Google Scholar] [CrossRef]
  25. Working Group C4.33. CIGRE TB 781: Impact of Soil-Parameter Frequency Dependence on the Response of Grounding Electrodes and on the Lightning Performance of Electrical Systems; CIGRE: Paris, France, 2019. [Google Scholar]
  26. Visacro, S.; Alipio, R.; Murta Vale, M.H.; Pereira, C. The Response of Grounding Electrodes to Lightning Currents: The Effect of Frequency-Dependent Soil Resistivity and Permittivity. IEEE Trans. Electromagn. Compat. 2011, 53, 401–406. [Google Scholar] [CrossRef]
  27. Alipio, R.; Visacro, S. Impulse Efficiency of Grounding Electrodes: Effect of Frequency-Dependent Soil Parameters. IEEE Trans. Power Deliv. 2014, 29, 716–723. [Google Scholar] [CrossRef]
  28. Visacro, S.; Alipio, R.; Pereira, C.; Guimaraes, M.; Schroeder, M.A.O. Lightning Response of Grounding Grids: Simulated and Experimental Results. IEEE Trans. Electromagn. Compat. 2015, 57, 121–127. [Google Scholar] [CrossRef]
  29. Visacro, S. A Comprehensive Approach to the Grounding Response to Lightning Currents. IEEE Trans. Power Deliv. 2007, 22, 381–386. [Google Scholar] [CrossRef]
  30. Alipio, R.; Coelho, V.L.; Canever, G.L. Experimental Analysis of Horizontal Grounding Wires Buried in High-Resistivity Soils Subjected to Impulse Currents. Electr. Power Syst. Res. 2023, 214, 108761. [Google Scholar] [CrossRef]
  31. Rakov, V.A.; Uman, M.A. Lightning: Physics and Effects, 1st ed.; Cambridge University Press: Cambridge, UK, 2003. [Google Scholar]
  32. Grcev, L. Impulse Efficiency of Ground Electrodes. IEEE Trans. Power Deliv. 2009, 24, 441–451. [Google Scholar] [CrossRef]
  33. Alipio, R.; Visacro, S. Frequency Dependence of Soil Parameters: Effect on the Lightning Response of Grounding Electrodes. IEEE Trans. Electromagn. Compat. 2013, 55, 132–139. [Google Scholar] [CrossRef]
  34. IEC 62305; Protection Against Lightning. International Electrotechnical Commission: Geneva, Switzerland, 2010.
  35. IEC 60060; High-Voltage Test Techniques. International Electrotechnical Commission: Geneve, Switzerland, 2010.
  36. IEC 61400-24; Wind Energy Generation Systems—Part 24: Lightning Protection. IEC: Geneva, Switzerland, 2019; ISBN 978-2-8322-6599-4.
  37. IEEE Std 1243-1997; IEEE Guide for Improving the Lightning Performance of Transmission Lines. IEEE Standards Association: New York, NY, USA, 1997.
  38. Working Group 01 (Lightning)—Study Committee 33 (Overvoltages and Insulation Coordination). CIGRE TB 63: Guide to Procedures for Estimating the Lightning Performance of Transmission Lines; Working Group 01 (Lightning)—Study Committee 33 (Overvoltages and Insulation Coordination): Paris, France, 1991. [Google Scholar]
  39. Høidalen, H.K.; Prikler, L.; Peñaloza, F. ATPDraw Version 7.5 for Windows: Users’ Manual; Norwegian University of Science and Technology (NTNU): Trondheim, Norway, 2023. [Google Scholar]
  40. Gustavsen, B.; Semlyen, A. Rational Approximation of Frequency Domain Responses by Vector Fitting. IEEE Trans. Power Deliv. 1999, 14, 1052–1061. [Google Scholar] [CrossRef]
  41. Alipio, R.; De Conti, A.; de Miranda, A.S.; Correia de Barros, M.T. Lightning Overvoltages Including Frequency-Dependent Soil Parameters in the Transmission Line Model. In Proceedings of the International Conference on Power Systems Transients (IPST2019), Perpignan, France, 17–20 June 2019; pp. 1–6. [Google Scholar]
  42. Stracqualursi, E.; Pelliccione, G.; Celozzi, S.; Araneo, R. Tower Models for Power Systems Transients: A Review. Energies 2022, 15, 4893. [Google Scholar] [CrossRef]
  43. Megabras Technical Specifications of the MTD-20KWe Earth Tester. Available online: https://www.megabras.com/en/pdf/manual/MTD20KWe/MTD20KWe_UM_en-es_F.220-240V_2011-11-17.pdf (accessed on 4 March 2025).
  44. Megabras Technical Specifications of the TM25m Earth Tester. Available online: https://www.megabras.com/en/pdf/manual/TM25m/TM25m_UM_en_100-240V_2007-08-30.pdf (accessed on 4 March 2025).
Figure 1. Fall-of-potential (FOP) method setup.
Energies 18 01959 g001
Figure 2. Division of the injected current by the ground tester in a transmission line configuration with shield wires.
Energies 18 01959 g002
Figure 3. Tower geometries of the transmission lines: (a) 138 kV line with one shield wire; (b) 230 kV line with two shiel wires. The dimensions are in centimeters.
Energies 18 01959 g003
Figure 4. Tower-footing grounding system configuration.
Energies 18 01959 g004
Figure 5. Harmonic grounding impedance computed in a frequency range from 10 Hz to 1 MHz of the grounding system depicted in Figure 4, and assuming soil resistivities of (a) 250 Ωm, (b) 500 Ωm, (c) 1000 Ωm, (d) 2000 Ωm, (e) 3000 Ωm, (f) 5000 Ωm, (g) 7500 Ωm, and (h) 10,000 Ωm. The results consider the dimensions of the 138 kV tower, i.e., b = 6 m and d = 20 m, along with the lengths indicated in Table 1.
Energies 18 01959 g005
Figure 6. Schematic representation of the simulation setup used to assess the accuracy of high-frequency earth testers.
Energies 18 01959 g006
Figure 7. R 25 k H z values that would be measured using the HF earth tester as a function of the span length for the 138 kV line, considering soil resistivities of (a) 250 Ωm, (b) 500 Ωm, (c) 1000 Ωm, (d) 2000 Ωm, (e) 3000 Ωm, (f) 5000 Ωm, (g) 7500 Ωm, and (h) 10,000 Ωm.
Energies 18 01959 g007
Figure 8. Errors in the values that would be measured using the HF earth tester as a function of the span length for the 138 kV line.
Energies 18 01959 g008
Figure 9. R 25 k H z that would be measured using the HF earth tester as a function of the span length, for the 230 kV line considering soil resistivities of (a) 250 Ωm, (b) 500 Ωm, (c) 1000 Ωm, (d) 2000 Ωm, (e) 3000 Ωm, (f) 5000 Ωm, (g) 7500 Ωm, and (h) 10,000 Ωm.
Energies 18 01959 g009
Figure 10. Errors in the values that would be measured using the HF earth tester as a function of the span length for the 230 kV line.
Energies 18 01959 g010
Figure 11. (a) The 500-kV tower structure under test, (b) grounding configuration of the tested tower, (c) grounding electrode connection with the central mast, and (d) grounding connection with the guy wire.
Energies 18 01959 g011
Figure 12. Setup for measuring the tower-footing resistance of the structure depicted in Figure 11a using FOP.
Energies 18 01959 g012
Figure 13. Setup for measurements with the grounding electrodes disconnected from the central mast and guy wires. (a) Disconnection of the grounding electrodes from the central mast and their overhead connection for current injection. (b) Disconnection of the guy wire from the grounding electrodes.
Energies 18 01959 g013
Figure 14. Simulated harmonic impedance of the grounding system depicted in Figure 11b and measured R 25 k H z .
Energies 18 01959 g014
Table 1. Counterpoise lengths ( l ) defined according to soil resistivity for both the 138 kV and 230 kV lines, and the corresponding values of grounding resistance (in parenthesis).
Soil Resistivity (Ωm) l (m) and R L F (Ω) in Parenthesis
138 kV Line230 kV Line
25010 (11.3)10 (11.1)
50015 (16.8)15 (16.4)
100030 (19.8)30 (19.3)
200080 (18.3)70 (19.6)
3000120 (19.8)115 (19.7)
5000120 (33.0)120 (31.7)
7500120 (49.4)120 (47.5)
10,000120 (65.8)120 (63.2)
Table 2. Computed values of low-frequency resistance, R L F , and the magnitude of the harmonic impedance at 25 kHz, R 25 k H z . The parameter Δ indicates the percentage difference between these two parameters and is computed as Δ = R 25 k H z R L F × 100 .
Soil Resistivity (Ωm)138 kV Line230 kV Line
R L F (Ω) R 25 k H z (Ω) Δ (%) R L F (Ω) R 25 k H z (Ω) Δ (%)
25011.39.987.611.19.787.4
50016.814.184.016.413.883.9
100019.815.276.719.314.876.5
200018.311.763.619.612.664.2
300019.811.256.519.711.055.8
500033.015.747.731.715.047.4
750049.420.441.347.519.541.0
10,00065.824.236.863.223.236.6
Table 3. Measurement results of the tower-footing resistances R L F and R 25 kHz .
Measured Quantity and ConditionMeasured Value (Ω)
R 25 kHz (without grounding cables disconnected)19.6 ± 0.6
R 25 kHz (with grounding cables disconnected)21.5 ± 0.6
R L F (with grounding cables disconnected)45.2 ± 1.1
Disclaimer/Publisher’s Note: The statements, opinions and data contained in all publications are solely those of the individual author(s) and contributor(s) and not of MDPI and/or the editor(s). MDPI and/or the editor(s) disclaim responsibility for any injury to people or property resulting from any ideas, methods, instructions or products referred to in the content.

