Abstract
There are numerous idle electric vehicle (EV) resources in urban distribution networks, which hold significant potential for emergency power supply support following network failures. Based on this, a proactive power supply support strategy is proposed, integrating urban idle resources and emergency resources under extreme scenarios. First, an emergency dispatch model is established for EVs in public parking lots and electric power supply vehicles (EPSVs), considering the impact of road congestion. Next, the costs of various emergency resources are analyzed, and a multi-source collaborative power restoration strategy is proposed. This strategy includes EPSVs, EVs, photovoltaics, line repair teams, and other resources, with load shedding loss costs incorporated into the optimization framework. Finally, the proposed strategy is validated through simulations using an IEEE 33-node distribution network and a 32-node transportation network. The results demonstrate that the line topology of the faulty distribution network is restored to normal after the repair team’s intervention. Moreover, the strategy enables efficient utilization and economic dispatch of urban idle and emergency resources while improving system reliability.
1. Introduction
In recent years, extreme events and natural disasters have led to widespread power outages, severely disrupting the normal electricity supply for distribution network users. For instance, in 2022, Hurricane Fiona caused damage to more than 54% of Puerto Rico’s nearly 1000 distribution feeders [1]. Similarly, in 2024, Hurricanes Helen and Milton struck Florida, affecting more than 4.2 million households, causing extensive power outages across the region [2]. Given these challenges, enhancing the resilience of urban distribution networks to withstand extreme scenarios and actively support power supply has become a critical trend. This is essential for ensuring the stable operation of modern power systems [3].
The active support of power supply in distribution networks has been widely discussed in existing research. For example, network reconfiguration [4] and intelligent soft switching [5] have been employed to achieve dynamic topology changes and load shifting, thereby meeting the short-term power demand of local users. However, these strategies fail to address the power supply needs of all users when the main distribution lines are severely damaged. In fact, with the rapid development of public infrastructure and new energy electric vehicles (EVs), a significant number of idle urban resources can be utilized for emergency power supply [6]. For instance, public parking lots equipped with EV charging piles can dispatch private EVs to participate in emergency power supply through vehicle-to-grid (V2G) technology [7]. This approach not only maximizes the use of existing idle resources but also reduces the need for dedicated emergency energy storage investments. Nevertheless, current scheduling strategies often focus on utilizing a limited number of resources individually or sporadically, failing to fully explore the potential of these idle resources to collaborate with other emergency resources for comprehensive power supply support.
Currently, researchers have carried out relevant work for the collaborative participation of emergency resources in emergency power support. Research [8] presents a scheduling model for emergency power supply vehicles (EPSVs) and proposes a microgrid dynamic reconfiguration strategy. This strategy incorporates EPSVs to provide emergency power support and ensure power supply for critical loads in the distribution network. Other research [9] proposes a cooperative repair scheduling strategy between the distribution network and broken roads, which incorporates the repair of key roads by the broken road repair team into the route scheduling model of the faulty line repair team to improve the power supply reliability of the distribution system. However, scheduling time is not considered in the above resource synergistic model, which will be affected by the actual traffic flow, and the power supply restoration effect is not realistic. Therefore, the scheduling of mobile emergency resources needs to consider the road resistance model to reflect the traffic factors in the actual scheduling situation. In addition, various emergency resources involved in active power supply support differ in multiple aspects. For example, stationary resources, such as distributed photovoltaics [10], wind turbines [11], and energy storage systems [12], participate in power supply restoration through local access to the distribution network [13,14]. However, their power supply is limited in scope and flexibility. In contrast, mobile resources, such as EPSVs [15,16,17] and EVs, can be spatially transferred through urban roads, enabling cross-regional power restoration. In terms of output characteristics, PV output is larger during the day, and public parking lots have more idle EVs participating in the output at night. In resource scheduling costs, existing synergistic strategy considerations are incomplete, and emergency resources are usually individually or sequentially involved in power supply support. Thus, synergistic cooperation between the emergency resources of urban distribution networks needs to consider output characteristics, power supply flexibility, and scheduling economies, in order to fully fulfil the emergency power supply demand of the distribution network.
In order to solve the above problems, this study provides a power supply active support strategy that synergizes urban idle resource studies and emergency resources under extreme scenarios. First, an emergency dispatch model is established for EVs in public parking lots and for EPSVs, considering the impact of road congestion. Then, an active support strategy for power supply with EPSVs, EVs, PVs, and repair teams is proposed by considering the cost of various types of emergency resources and the cost of load shedding losses. Finally, the scheduling strategy of this study is validated and analyzed with a 33-node distribution network and a 32-node transportation network. The results show that the power supply strategy provided in this study can realize efficient coordination between urban idle resources and emergency resources, while supporting the recovery of the power supply for important loads and reducing the loss of common load reduction.
2. Modeling of Urban Idle and Mobile Emergency Resources
This subsection focuses on modeling urban idle resources and mobile EVs. First, a probability density function is used to fit the travel data of EVs in urban idle resources. Then, a road resistance model is established by considering the impact of traffic congestion on emergency power vehicle dispatch in extreme scenarios. Finally, the emergency repair team model is established by considering the repair of the line.
2.1. Dispatch Model for Participation of Urban Idle Resources in Emergency Power Supply
The public idle resources considered in this study are mainly EVs in public parking lots. Under extreme scenarios, EVs that remain parked for extended periods can participate in power restoration for the distribution network through tariff compensation incentives. The overall power supply support process is illustrated in Figure 1.
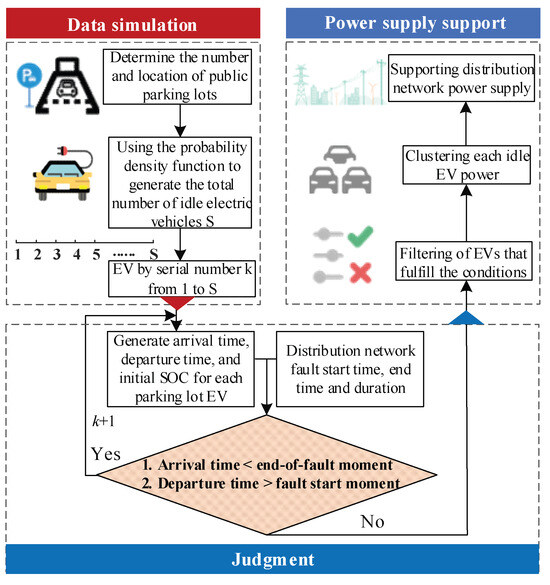
Figure 1.
Flow chart of public parking lot idle EV participation in power supply support.
In this study, a stationary energy storage module is considered that interacts with the distribution grid in real time through vehicle to power grid technology. Since both the number of EVs and battery residual energy in the public parking lot vary with time, EV public parking lot power data are obtained by modeling the EV probability density function in order to fit the arrival and departure time and initial SOC of each EV.
2.1.1. Simulation of Idle EV Data in Public Parking Lots
In data modeling and prediction, normal distribution is suitable for symmetric continuous data distribution and statistical inference [18], and the Weibull distribution can describe the probability distribution of time-dependent events [19]. While travel data, including the number of EVs S arriving at the parking lot during the fault period and the initial charge state Soc, conform to continuous data distribution, the time variables tar and tle of EVs arriving and leaving the parking lot have temporal characteristics. Therefore, in this study, normal and Weibull distribution functions are used to fit the data related to EVs:
where μ, σ, k, and λ denote the mean, standard deviation, shape parameter, and scale parameter of the distribution function, respectively, and x denotes the first EV. f(x) fits the total number of EVs arriving at the parking lot, S, and the initial state of charge, Soc, to be fitted, and h(x) fits the time of the EVs’ arrival and departure from the parking lot.
2.1.2. Emergency Dispatch Model for Idle EVs in Public Parking Lots
Based on the aforementioned data, each EV undergoes a conditional judgment to determine whether its arrival time is earlier than the fault end time and whether its departure time is later than the fault start time. This process filters out idle EVs that can participate in emergency support, followed by scheduling modeling for these vehicles. The details are as follows:
where tst and ted denote the start and end time of the distribution network fault, respectively, through the time judgment, only EV that meets the power supply time conditions can participate, otherwise is 0. The binary variables and are introduced into the model as the charging and discharging identifiers of the EV, of 1 denotes the charging, and of 1 denotes the discharging. , , and are the EV’s active charging and discharging and the best corresponding boundary values, respectively. Ωp is the set of idle EVs that can be involved in the support. ηch, ηdis are the charging and discharging efficiencies of the EVs, and , , and are the charging and discharging efficiencies of the ith EV at t moment of time and the upper and lower limits of the energy storage capacity, as well as the total capacity.
2.2. Emergency Power Vehicle Scheduling Model Considering Road Congestion
In extreme scenarios, EPSVs are dispatched to participate in the active support of the power supply within the distribution network. As a kind of mobile resource, the emergency dispatch of emergency power vehicles cannot be separated from the establishment of urban road networks. In this section, we first construct the road structure, reflect the road congestion by introducing the real-time change of the road flow, establish the road resistance model to quantify the actual passage time for the mobile resource, and finally establish the emergency power vehicle scheduling model.
2.2.1. Roadway Resistance Modeling Considering Real-Time Traffic
The urban transportation network mainly includes road section parts and traffic intersections, and this study constructs the road resistance model through the real-time flow change for the road, where S(t) is the road congestion degree, as shown in Table 1.

Table 1.
Road congestion at different volumes.
The road resistance model can be represented by Equation (3), which takes into account both the road section impedance Lij(t) and the intersection impedance Ni(t), which can be represented by Equations (4) and (5), respectively, where Wij(t) denotes the roadway weight [20], which in this thesis denotes the passage time of emergency power vehicles:
expanded as follows:
where Wij(t) represents the time required for the EPSVs to pass through the road, Lij(t) describes the resistance between the road sections ij, and Ni(t) represents the resistance at intersection i. t0 is the baseline travel time when there is no vehicle congestion, and α and β are coefficients for adjusting the road section resistance. Additionally, b represents the length of the complete cycle of the traffic signal. c is the proportion of green effective time to signal cycle (i.e., the green ratio), and d reflects the frequency of vehicle arrivals on the roadway.
2.2.2. Emergency Power Vehicle Dispatch Model
When the distribution network encounters a fault, the dispatch center quickly assesses the fault condition and sends dispatch instructions to each emergency power vehicle based on the instantaneous passage time of the city’s road network under congested conditions. The related dispatch model construction process is summarized as follows:
The scheduling variables, initial positions and urban road network nodes of the emergency power vehicles are defined in Equaiton are the scheduling variables of the kth emergency power vehicle at the initial moment t0, n is the set of emergency power vehicles, and is the initial position of the kth EPSVs. Ωd is the set of urban road network nodes, and T is the power supply restoration time.
2.3. Emergency Response Team Model
After the extreme scenario, the distribution network lines will be down, so emergency repair teams will need to be dispatched to make repairs and quickly restore the distribution network topology. The main constraints are repair state constraints and spatio-temporal scheduling constraints.
2.3.1. Repair Team Maintenance Status Constraints
The emergency team repair model is specified below:
where Nr is the set of faulty lines. is the repair state of the emergency repair team repairing the mth faulty line at moment t, its value is 1 when repair is performed, and 0 otherwise, and D is the upper limit of the number of lines to be repaired. uij is a 0 or 1 variable indicating whether line ij is through or not, and indicates that line ij is connected when the value is 1. The state of the faulty line will change to 1 after it is repaired by the emergency repair team.
2.3.2. Spatio-Temporal Scheduling Constraints for Emergency Teams
The spatio-temporal scheduling constraints for the repair team primarily focus on the rational deployment of the team in both time and space. This ensures that the faulty line can be repaired in the shortest possible time, restoring the normal operation of the distribution network. These spatio-temporal scheduling constraints are consistent with those applied to the EPSVs.
3. Multi-Source Synergistic Power Supply Active Support Strategy
3.1. Objective Function
In this study, load loss cost is used to weigh the importance of load preservation and, at the same time, the dispatch cost of each type of emergency resource under power supply priority is considered. The power supply active support strategy including load curtailment loss, distributed photovoltaic output cost, emergency power vehicle support power supply cost, and public parking lot EV output subsidy cost for the synergistic power supply of idle resources and emergency resources in the city, is constructed, and its objective function is established as follows:
where f cut is the cost of lost load, fPV is the cost of distributed PV output, fEPSV is the cost of supplying power to EPSVs, and fEV is the cost of subsidizing unused EV output in public parking lots. The specific model components are as follows:
In the formula, the cost coefficients of important and ordinary load reduction are expressed by and , respectively, and the power reduction of their important and ordinary loads are expressed by and , respectively. λ1, λ2, and λ3 are the output subsidy coefficients of distributed photovoltaic, emergency power vehicle, and public parking lot EV, respectively, and c(t) is the price of electricity.
3.2. Supporting Power Supply Constraints
After the occurrence of extreme events, multiple resources, including idle EVs, will be actively mobilized to participate in fault power restoration in accordance with power supply priorities, while also requiring constraints on resource output and distribution network operation, which are modeled as follows.
3.2.1. Emergency Power Vehicle Output Constraints
3.2.2. Idle Electric Vehicles’ Output
3.2.3. Distributed Power Output
Distributed power is primarily local distributed PV, which is modeled for emergency output as follows:
where is the distributed PV output, and are the upper and lower limits of PV output, respectively, and Npv is the set of distributed PV access points.
3.2.4. Load Reduction Constraints
When a fault occurs, the lack of supply from the higher grid and the interruption of other lines will result in the loss of power supply to some loads. However, the amount of load loss must not exceed the original actual load demand, necessitating constraints on load curtailment:
where and are the load curtailment and actual demand at node i at time t, respectively, and Nl is the load node.
3.2.5. Radial Constraints on the Distribution Network
The distribution network remains radial before and after a fault occurs and is constrained using the single commodity flow method:
where Hjs and Hij are the virtual power flows. M is a larger constant. Nb and NDG are the number of distribution nodes and distributed power sources, respectively.
3.2.6. Distribution Network Current Constraints
In addition, the Ohm’s law constraints are included as follows:
3.3. Second-Order Cone Relaxation
The above model contains a large number of 0 or 1 integer variables as well as quadratic constraints and quadratic objective functions, which is a mixed-integer nonlinear programming problem that cannot be solved by applying conventional solution methods. Therefore, an effective means of downscaling or relaxation is required to solve it. In this study, the second-order cone relaxation technique is chosen to optimize the relaxation of the model [21], and the specific practices are as follows.
The majority of all nonlinear terms in the objective function and constraints are the squared terms of line currents and node voltages. Therefore, new variables , and are constructed to replace the squared terms of voltage and current in the above constraints and objective functions, respectively. Thus Equation (19) can be transformed to Equation (20):
where rij, xij are the line impedance. For the nonlinear part of the constraints, a second order cone relaxation is required and the relaxed constraints are as follows:
4. Case Analysis
4.1. Parameterization
In this study, a modified IEEE 33-node power distribution system and a 32-node transportation network model are used as case studies for detailed analysis. The architecture of the distribution and road networks is illustrated in Figure 2. Five groups of photovoltaic systems are deployed in the system, and their predicted power profiles are shown in Figure 3. For load valuation, the interruption cost factor is set at 15 Yuan/kWh for critical loads and 5 Yuan/kWh for ordinary loads. To ensure that the distribution system voltage operates within the safety threshold, the voltage fluctuation range is maintained between 0.9 and 1.10 per unit (p.u.). Additionally, this study references the time-of-day tariff implemented in a specific region for economic dispatch and optimization analysis, as shown in Figure 4. The power supply restoration period for the distribution network is set from 9:00 to 15:00, totaling 7 h. The roadway impedance parameters in this study are α = 0.15, β = 4. The mean values for the total number of EVs and the initial state of charge in public parking lots are 100 and 50, respectively, with standard deviations of 25 and 15. The parameters related to emergency resources are provided in Table 2.

Figure 2.
Distribution network—road network structure.
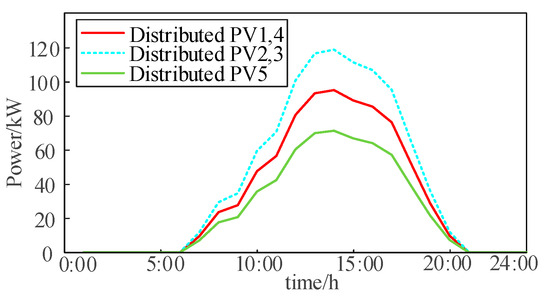
Figure 3.
Distributed photovoltaic forecast output.
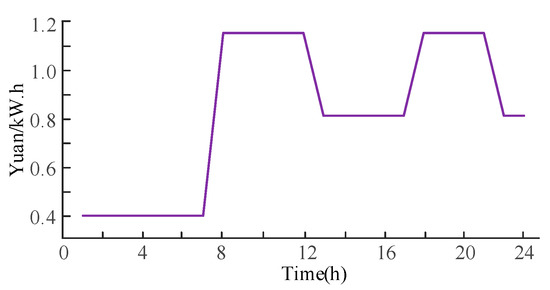
Figure 4.
Time-of-use tariffs for the region.

Table 2.
Parameters related to emergency resources.
This study validates the effectiveness of the method proposed in this study by comparing the following four cases:
Case 1: Emergency support through stationary resources, i.e., local distributed PV, and scheduling of repair teams to repair the faulty lines.
Case 2: Collaborative recovery through local distributed PV and EPSVs, and scheduling repair teams to repair the faulty lines.
Case 3: Collaborative recovery through local distributed PV and public parking lot EVs, and scheduling of repair teams to repair the faulty lines.
Case 4: Considering the power supply priority of emergency resources, the distribution network undergoes collaborative power restoration using local distributed PVs, EPSVs, and public parking lot EVs. Simultaneously, line repair teams are dispatched to restore the faulty lines.
4.2. Analysis of Results
4.2.1. Economic Analysis
The power supply active support model for the synergy of urban idle and emergency resources proposed in this study is compared with the other cases, as shown in Table 3.

Table 3.
Cost of different scenarios (CNY).
From the above table, it can be seen that, compared to Case 1, Case 2 and Case 3 reduce the lost load curtailment cost by 29% and 44.79%, respectively. This study’s case can further reduce the lost load cost by 74.92%, and the overall cost is reduced by 65.47%. In addition, relative to case 3, although this study’s solution costs 991 (CNY) more in EV subsidy cost, the lost load cost of the distribution network is reduced by 18,822 (CNY), which ultimately reduces the total cost by 41.59%. This study’s case provides a strong support for active power supply by synergistically utilizing idle EVs and other emergency resources in the parking lot, thus demonstrating a more superior economy overall.
In this study, the importance of load is demonstrated through load curtailment losses, and Figure 5 shows the load curtailment comparisons under the four groups of cases during power restoration.
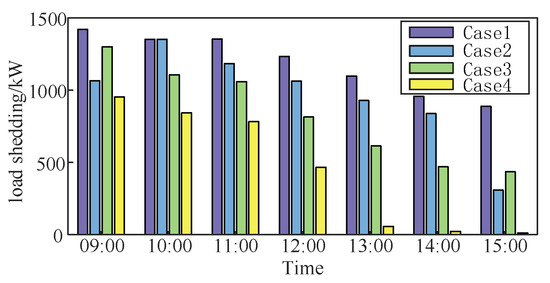
Figure 5.
Load reductions under different scenarios.
As can be seen from the above figure, Case 1, which only provides power supply support and line repair through distributed PV, has the largest load curtailment among the four groups of cases, with the most severe economic losses. Compared with case 1, the load curtailment of cases 2 and 3 are both significantly reduced. In addition, the load curtailment of this study’s case maintains the smallest curtailment at all moments among the four groups of cases. Among these, at the moment of 15:00, the load curtailment of this study’s case goes down to close to 0. It can be seen that this study’s case has the optimal load support capability from the overall point of view, and has the highest level of power supply restoration.
In order to reflect the load recovery of the loads during the fault period, the recovery rate is also compared between the critical loads and the normal loads in the system, as shown in Figure 6.
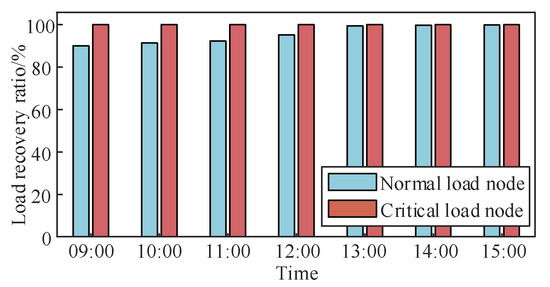
Figure 6.
Proportion of distribution network load restoration.
After the collaborative powering of multiple resources as in the case of this study, the critical loads of the distribution network are able to maintain a high percentage of load recovery from the very beginning of the fault. For the recovery rate of ordinary loads, this study’s case gradually rises with the running time, and always stays above 90%, and finally reaches 100% recovery at 15:00.
4.2.2. Mobile Resource Scheduling Analysis
The mobile resource scheduling process is shown in Figure 7. EPSVs are dispatched from the initial parking point with the goal of cutting load loss and power cost. EPSV1 starts transferring at 10:00 and accesses node 13 for emergency power supply through a single dispatch. EPSV2 departs from node 4 and node 24 at 10:00 and 12:00, respectively, and accesses node 24 and node 19 for emergency power supply after transferring. It can be seen that the EPSVs can supplement the load demand deficit and realize power supply support by accessing different locations of the distribution network at different times.
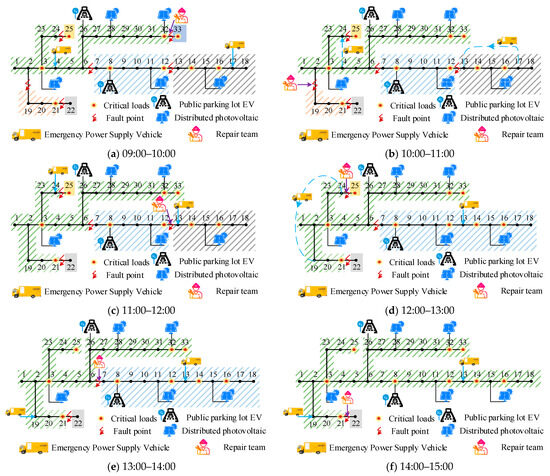
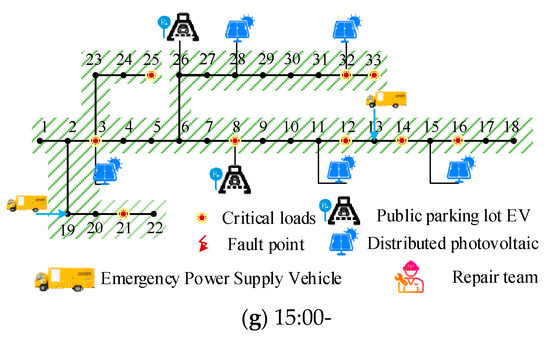
Figure 7.
Restoration diagram.
4.2.3. Analysis of Emergency Resource Capacity
For the multi-resource emergency coordination case proposed in this study, the resources’ output is specifically analyzed. The dispatching outpouring of each resource is shown in Figure 8. The EVs in the two groups of public parking lots are discharged on-site to support the restoration of power supply to the distribution network during the power restoration period, their outputs are shown in Figure 8a, and the power discharged by the EVs to the distribution network is positive. According to Figure 8b, during 10:00–12:00 when the power supply is restored, the emergency power vehicles have less output, the load demand deficit of the distribution network is mainly supplemented by the EVs in the public parking lot, and the PVs are fully discharged at this time. From 8a, it can be seen that the EV output of public parking lot 2 has a small negative value at 14:00, which is due to the fact that the total output of emergency power vehicles and EVs at that moment is larger than the load demand of the distribution network, resulting in the excess power being absorbed by EV charging. Eventually, the power supply can be complementary between the emergency resources, thus meeting the load demand of the users.

Figure 8.
Emergency resource active output.
Finally, to validate the effectiveness of the multi-resource power supply prioritization proposed in this study, the actual output of each resource was analyzed relative to its capacity. As shown in Figure 9, distributed PV, which has the lowest subsidy cost, operates at 100% output capacity. In contrast, the two public parking lot EVs, with moderate subsidy cost coefficients, exhibit lower output than PVs but higher than EPSVs, representing the second tier of power supply priority. Meanwhile, EPSVs, with higher compensation cost coefficients, provide supplementary output to meet the demands of the first two priority tiers, forming the third tier of power supply priority. The results demonstrate that emergency resources participate in power supply restoration in descending order of priority: PVs, public parking lot EVs, and EPSVs. This ensures the economic and rational utilization of emergency resources.
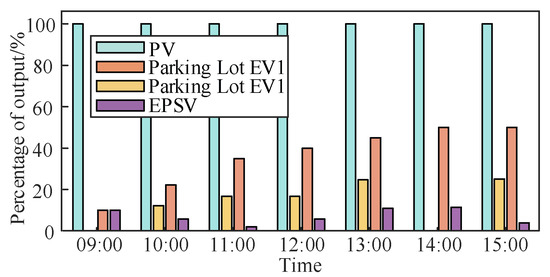
Figure 9.
Chart showing the proportion of emergency resources contributed by each category.
5. Conclusions
In this study, we address the problems of insufficient flexibility, low scheduling synergy, and poor economy of existing emergency resource power supply in extreme cases for distribution networks. It proposes a power supply active support strategy that synergizes urban idle resources and emergency resources to realize the cooperative scheduling of multiple emergency resources. The following conclusions can be obtained through the comparative analysis of arithmetical examples:
(1) A power supply active support strategy of multi-source coordination reduces load reduction loss during power supply restoration by 74.92% compared with power supply restoration by distributed PV alone, and the reliability of the distribution network is effectively improved. At the same time, compared with the separate dispatch of EPSVs or parking lot EVs to participate in power supply restoration, the total cost of this study’s case can be further reduced by 53.81% and 41.59%, respectively, and it is therefore more economical and reasonable from the point of view of resource scheduling and power supply cost.
(2) The multi-resource scheduling model developed in this study enables the active dispatch of mobile emergency resources to participate in power supply support during extreme scenarios. EPSVs can provide localized power supply support within the distribution network, while emergency repair teams can fully restore damaged lines, ultimately bringing the load back to normal levels.
It is worth noting that the EVs in this study were discharged via V2G for emergency purposes, and their vehicle scheduling efforts as well as the planning of V2G charging pile configurations can be further explored in the future.
Author Contributions
Conceptualization, R.Z. and J.L. (Junhao Li); methodology, J.L. (Jiangang Lu) and J.L. (Junhao Li); software, Y.C.; validation, R.Z., J.L. (Junhao Li) and Y.C.; formal analysis, Y.G.; investigation, M.L.; resources, M.L.; data curation, C.W.; writing—original draft preparation, J.L. (Junhao Li); writing—review and editing, J.L. (Junhao Li). All authors have read and agreed to the published version of the manuscript.
Funding
This research was funded by China Southern Power Grid Company Limited, grant [031200KK52222026 (GDKJXM20222220)].
Data Availability Statement
The original contributions presented in this study are included in the article. Further inquiries can be directed to the corresponding author.
Acknowledgments
The authors acknowledge the support of the Hunan University.
Conflicts of Interest
Author Ruifeng Zhao and Jiangang Lu were employed by the company Power Dispatch Control Center of Guangdong Power Grid Co., Ltd.; Author Yizhe Chen and Yifan Gao were employed by the company Zhaoqing Power Supply Bureau of Guangdong Power Grid Co., Ltd. Author Ming Li and Chengzhi Wei were employed by the company Southern Power Grid Scientific Research Institute Co., Ltd.; The remaining authors declare that the research was conducted in the absence of any commercial or financial relationships that could be construed as a potential conflict of interest.
Abbreviations
The following abbreviations are used in this manuscript:
| EPSVs | Emergency Power Supply Vehicles |
| EV | Electric Vehicle |
| SOC | State of Charge |
| μ | Mean of the distribution function |
| σ | Standard deviation of the distribution function |
| λ | Shape parameters of the distribution function |
| k | Proportionality parameter of a distribution function |
| tst | Start time of the distribution network fault |
| ted | End time of the distribution network fault |
| Charging identifiers of the EV at time t | |
| Discharging identifiers of the EV at time t | |
| EV’s charging active at time t | |
| EV’s discharging active at time t | |
| Maximum EVs power | |
| Minimum EVs power | |
| Ωp | Set of idle EVs that can be involved in the support |
| S(t) | Road congestion degree at time t |
| Wij | Roadway weight |
| Lij | Road section impedance |
| Ni | Intersection impedance |
| α | Coefficients for adjusting the road section resistance |
| β | Coefficients for adjusting the road section resistance |
| b | Length of the complete cycle of the traffic signal |
| c | Proportion of the green effective time to the signal cycle |
| d | Frequency of vehicle arrivals on the roadway |
| Scheduling variables of the kth EPSVs at the initial moment t0 | |
| n | Set of EPSVs |
| Initial position of the kth EPSVs | |
| Ωd | Set of urban road network nodes |
| T | Power supply restoration time |
| Nr | Set of faulty lines |
| D | Upper limit of the number of lines to be repaired |
| uij | Line Connection Status Variables |
| fPV | Cost of distributed PV output |
| fEPSV | Cost of supplying power to EPSV |
| fEV | Cost of subsidizing unused EV output in public parking lots |
| Critical load reduction cost factor | |
| Ordinary load reduction cost factor | |
| λ1 | Distributed PV Output Subsidy Factor |
| λ2 | Distributed EPSVs Output Subsidy Factor |
| λ3 | EV Output Subsidy Factor for Public Parking Lots |
| c(t) | Price of electricity |
| Active charging power of EPSVs at time t | |
| Active discharging power of EPSVs at time t | |
| EPSVs Charge Marking at time t | |
| EPSVs Discharge Marking at time t | |
| Maximum EPSVs Discharge | |
| Maximum EPSVs Charge | |
| Electricity of the ith EPSVs at moment t | |
| Minimum EPSVs Electricity at time t | |
| Maximum EPSVs Electricity at time t | |
| ηch | Charging identifiers of the EPSVs |
| ηdis | Discharging identifiers of the EPSVs at time t |
| EPSVs scheduling variable at time t | |
| Active power after aggregation of the kth public parking lot at time t | |
| Distributed PV Output at time t | |
| Maximum Distributed PV Output | |
| Minimum Distributed PV Output | |
| Np | Public parking lot Collection |
| Npv | Distributed PV Access Point Collection |
| Nl | Load node |
| Load reduction at node i at time t | |
| Actual Load demand at node i at time t | |
| Hjs | Virtual power flow |
| Hij | Virtual power flow |
| Nb | Number of distribution nodes |
| NDG | Number of distributed power sources |
| Square of node i voltage at time t | |
| Square of node j voltage at time t | |
| Square of line current ij at time t | |
| Pij,t | Active power flowing through branches ij at time t |
| Pki,t | Active power flowing through branches ki at time t |
| Qij,t | Reactive power flowing through branches ij at time t |
| Qki,t | Reactive power flowing through branches ki at time t |
| Iij,t | Current flowing through the branch ij at time t |
| Vi,t | Square of node voltage at time t |
| rij | Resistance of branch ij |
| xij | Reactance of branch ij |
References
- Xu, L.; Zeng, H.; Lin, N.; Yang, Y.; Guo, Q.; Poor, H.V. Entropic Value-at-Risk Constrained Optimal Power Flow Considering Distribution Network Outages During Extreme Events. IEEE Trans. Power Syst. 2025, 40, 1184–1187. [Google Scholar] [CrossRef]
- Lee, J.; Paal, S.G. Knowledge Transfer Predictive Models for Power Outage Caused by Various Types of Extreme Weather Events. In Proceedings of the IEEE International Conference on Big Data (BigData), Washington, DC, USA, 15–18 December 2024; pp. 8227–8229. [Google Scholar] [CrossRef]
- Deng, Y.; Jiang, W.; Hu, F.; Sun, K.; Yu, J. Resilience-Oriented Dynamic Distribution Network With Considering Recovery Ability of Distributed Resources. EEE J. Emerg. Sel. Top. Circuits Syst. 2022, 12, 149–160. [Google Scholar] [CrossRef]
- Chang, W.; Shou, G.; Liu, Y.; Guo, Z.; Hu, Y.; Liu, J. An efficient topology reconfiguration algorithm under targeted attacks and failures. In Proceedings of the NOMS 2018—2018 IEEE/IFIP Network Operations and Management Symposium, Taipei, Taiwan, 23–27 April 2018; pp. 1–5. [Google Scholar] [CrossRef]
- Kim, J.-E.; Hong, C.-H. A Study on Methodology of Digital-SOP System for Effective Disaster Response. In Proceedings of the 2019 IEEE International Smart Cities Conference (ISC2), Casablanca, Morocco, 14–17 October 2019; pp. 741–746. [Google Scholar] [CrossRef]
- Hu, Y.; Dong, A. Research on Vehicle Resource Allocation Strategy Assisted by Idle Resources in Complex Urban Channel Environments. In Proceedings of the 2024 7th International Conference on Computer Information Science and Application Technology (CISAT), Hangzhou, China, 12–14 July 2024; pp. 1398–1402. [Google Scholar] [CrossRef]
- Tetik, A.F.; Yigit, H.; Erenoglu, A.K.; Erdinc, O.; Boynuegri, A.R. Optimizing Parking Lot Management with Mobile Energy Suppliers for Electric Vehicles. In Proceedings of the 2024 Global Energy Conference (GEC), Batman, Turkiye, 4–6 December 2024; pp. 6–11. [Google Scholar] [CrossRef]
- Gao, Z.; Wu, X.; Zhou, S.; Du, Q.; Peng, L.; Ji, Q. Dynamic Reconfiguration of Microgrids Considering Mobile Energy Storage System. In Proceedings of the 2023 IEEE 7th Conference on Energy Internet and Energy System Integration (EI2), Hangzhou, China, 15–18 December 2023; pp. 5087–5092. [Google Scholar] [CrossRef]
- Huang, Z.; Sun, L.; Yi, K.; Jin, X. Cooperative Repair Scheduling Strategy of Distribution Systems and Traffic Roads. In Proceedings of the 2023 IEEE 6th International Electrical and Energy Conference (CIEEC), Hefei, China, 12–14 May 2023; pp. 960–965. [Google Scholar] [CrossRef]
- Keerthisinghe, C.; Ahumada-Paras, M.; Pozzo, L.D.; Kirschen, D.S.; Pontes, H.; Tatum, W.K.; Matos, M.A. PV-Battery Systems for Critical Loads During Emergencies: A Case Study from Puerto Rico After Hurricane Maria. IEEE Power Energy Mag. 2019, 17, 82–92. [Google Scholar] [CrossRef]
- Qi, Z.; Zhang, Y.; Li, S.; Gu, X. Research on Power System Restoration Strategy with Collaborative Participation of Multi-Pumped Storage and Wind Power. In Proceedings of the 2024 9th Asia Conference on Power and Electrical Engineering (ACPEE), Shanghai, China, 11–13 April 2024; pp. 1722–1726. [Google Scholar] [CrossRef]
- Gholami, A.; Aminifar, F.; Shahidehpour, M. Front Lines Against the Darkness: Enhancing the Resilience of the Electricity Grid Through Microgrid Facilities. IEEE Electrif. Mag. 2016, 4, 18–24. [Google Scholar] [CrossRef]
- Shi, J.; Chen, Y.; Xie, X.; Gao, Y. Two-stage Power Supply Restoration Strategy of Urban Distribution Network Based on Local Flexible Resources. In Proceedings of the 2024 9th Asia Conference on Power and Electrical Engineering (ACPEE), Shanghai, China, 11–13 April 2024; pp. 796–800. [Google Scholar] [CrossRef]
- Yang, Z.; Martí, A.; Chen, Y.; Martí, J.R. Optimal Resource Allocation to Enhance Power Grid Resilience Against Hurricanes. IEEE Trans. Power Syst. 2022, 38, 2621–2629. [Google Scholar] [CrossRef]
- Xu, Y.; Wang, Y.; He, J.; Su, M.; Ni, P. Resilience-Oriented Distribution System Restoration Considering Mobile Emergency Resource Dispatch in Transportation System. IEEE Access 2019, 7, 73899–73912. [Google Scholar] [CrossRef]
- Kim, J.; Dvorkin, Y. Enhancing Distribution System Resilience With Mobile Energy Storage and Microgrids. IEEE Trans. Smart Grid 2018, 10, 4996–5006. [Google Scholar] [CrossRef]
- Lei, S.; Chen, C.; Zhou, H.; Hou, Y. Routing and Scheduling of Mobile Power Sources for Distribution System Resilience Enhancement. IEEE Trans. Smart Grid 2019, 10, 5650–5662. [Google Scholar] [CrossRef]
- Cain, S.R. Distinguishing between lognormal and Weibull distributions [time-to-failure data]. IEEE Trans. Reliab. 2002, 51, 32–38. [Google Scholar] [CrossRef]
- Anderson, C.L.; Davison, M. An aggregate Weibull approach for modeling short-term system generating capacity. IEEE Trans. Power Syst. 2005, 20, 1783–1789. [Google Scholar] [CrossRef]
- Yu, Q.; Hu, F.; Ye, Z.; Chen, C.; Sun, L.; Luo, Y. High-Frequency Trajectory Map Matching Algorithm Based on Road Network Topology. IEEE Trans. Intell. Transp. Syst. 2022, 23, 17530–17545. [Google Scholar] [CrossRef]
- Soofi, A.; Manshadi, F.S.D.; Liu, G.; Dai, R. A SOCP Relaxation for Cycle Constraints in the Optimal Power Flow Problem. IEEE Trans. Smart Grid 2021, 12, 1663–1673. [Google Scholar] [CrossRef]
- Wu, C.; Han, H.; Gao, S.; Liu, Y. Coordinated scheduling for multimicrogrid systems considering mobile energy storage characteristics of electric vehicles. IEEE Trans. Transp. Electrif. 2023, 9, 1775–1783. [Google Scholar] [CrossRef]
- Yao, S.; Wang, P.; Liu, X.; Zhang, H.; Zhao, T. Rolling Optimization of Mobile Energy Storage Fleets for Resilient Service Restoration. IEEE Trans. Smart Grid 2020, 11, 1030–1043. [Google Scholar] [CrossRef]
- Bhat, P.K.; Wu, Z.; Chen, B. Long Trip Charging Planning of Battery Electric Vehicle Considering Vehicle Waiting Time Forecast at Fast Charging Stations: A Mixed-Integer Dynamic Programming Approach. IEEE Access 2025, 13, 52100–52113. [Google Scholar] [CrossRef]
- More Than 17,000 Vehicle Trips to Participate in Shenzhen to Start a Large-Scale Car Network Interaction Test. Xinhua News. Available online: https://www.news.cn/local/20250329/80dc0392658f4f09b144a327c8b3d50f/c.html (accessed on 29 March 2025).
Disclaimer/Publisher’s Note: The statements, opinions and data contained in all publications are solely those of the individual author(s) and contributor(s) and not of MDPI and/or the editor(s). MDPI and/or the editor(s) disclaim responsibility for any injury to people or property resulting from any ideas, methods, instructions or products referred to in the content. |
© 2025 by the authors. Licensee MDPI, Basel, Switzerland. This article is an open access article distributed under the terms and conditions of the Creative Commons Attribution (CC BY) license (https://creativecommons.org/licenses/by/4.0/).