1. Introduction
Renewable Energy Communities (RECs) and self-consumption (SC) concepts included in Directive (EU) 2023/2413 [
1] and Directive (EU) 2024/1711 [
2] are being transposed to national regulations by the EU members to adapt national legislations to these entities. These regulations define the main concepts of individual and collective self-consumption (ISC and CSC, respectively) and the operational rules of these structures such as the proximity requirements, the electricity sharing mechanisms allowed, the treatment of the electricity surplus, the grid tariffs to be paid by the SC, and other organizational aspects, such as asset sizing and licensing rules, metering requirements, data to be exchanged, and parties’ responsibilities [
3]. In addition, [
4] proposes a novel multi-objective optimal power flow algorithm to assess the trade-off between ISC and CSC, minimizing individual energy costs and mitigating distribution grid constraints, especially in low-voltage networks. Moreover, the very recent reform proposal of the EU [
5] states that end consumers should have the right to share renewable electricity directly, without the need for creating energy communities, trying to reduce barriers and incentivize the development of self-consumption structures and further empowering consumers to become active participants of the energy system. A comprehensive review regarding REC concepts, challenges, and recommendations is presented in [
6].
The 2019 European Clean Energy Package brought to RECs a new level of autonomy. “Regulatory sandboxes” as a limited-time real-world testing environment might allow for the testing of REC incentives and the necessary business models to uncover best practices for overcoming issues caused by incompatibility with present legal and regulatory frameworks [
7]. Under this context, tools are needed to incentivize and facilitate the development of self-consumption structures and energy communities [
8,
9], in particular for investment decisions on new distributed energy resources (DERs), for the economic assessment of business models, or digital platforms for the operation of collective self-consumption. Collective self-consumption within RECs enables local energy trading among participants, with studies illustrating various configurations and tools to optimize energy sharing. A French test case implementing a two-stage approach to separate energy management and contractual settlement yielded an 11.7% reduction in overall community energy costs, promoting individual savings [
10].
In Spain, a specialized tool using genetic algorithms for multi-objective optimization of solar energy allocation achieved high self-consumption, reduced energy excess, and shorter payback periods, boosting both economic and environmental benefits of REC participation [
11]. Sizing and economic assessment tools optimize individual or collective benefits depending on the selected business models [
12,
13]. Business models depend on the financing mechanisms available to the potential members, their profiles in terms of active investors, or the energy-sharing rules that vary among different national transpositions of the EU directives on SC [
3]. Several public and private ways of financing investments in RECs are detailed in [
14]. Various studies are exploring RECs’ economic, environmental, and operational optimization. One approach analyzes the economic feasibility of energy communities with different investment options, revealing that third-party investments are profitable with a 15-year payback, while joint investment benefits households despite higher initial costs [
15]. Another study [
16] introduces a novel bilevel programming framework combined with reinforcement learning for managing community microgrids, demonstrating up to 40% reduction in the levelized cost of energy (LCOE) and improved supply quality in a real-world case. Complementing this, a mixed-integer linear programming approach quantifies the benefits of complementarity between prosumers’ generation and demand, with cost reductions of up to 50% through price-based demand-response programs and fair cost allocation methods [
17]. Additionally, a thermal–electric co-simulation method applied to an Italian REC shows significant economic and environmental gains from optimizing energy sharing and self-consumption, especially regarding photovoltaic systems and storage [
18]. A case study of a residential complex in Romania demonstrates the integration of photovoltaics, energy storage, and car-charging stations, highlighting the potential for creating sustainable and efficient energy [
19].
Several other studies evaluate the accessible, risk-insured community investment options across Europe to unlock citizens’ social potential for investing in community renewable energy [
20], as well as options in specific countries such as Italy [
21], India [
22], Canada [
23], Spain [
24], and Australia [
25].
There are numerous business initiatives that might promote small and medium enterprise (SME) participation in European renewable energy communities: long-term purchase agreements for local renewable power between an SME and an electricity provider or a local developer; leasing and servicing contracts for energy infrastructure offered by traditional electricity providers to a group of geographically close SMEs; aggregator services involving demand flexibility aggregation and peer-to-peer trading facilitation, potentially developed as “white label” by international technology companies [
26]. For RECs to function well and be efficiently integrated into the electricity grid, planning of renewable energy management systems is required [
27]. Renewable energy communities are a powerful tool for this collective decentralization, democratization, and decarbonization of the energy system. How its members engage in the deployment of the community, the way they interact with each other, and the decision-making power each one has within the community are highly dependent on their investment participation, the REC’s governance or operation’s rules, and the business models adopted [
14].
In the end, the business model defines the objective function of the optimization process and the costs and benefits to be considered, such as the investments costs, the costs of the electricity exchanges with the grid [
28,
29], the annual equivalent investment costs [
30,
31], the costs related to demand management and demand utility [
32], or even penalties to consider other objectives such as reliability [
33,
34].
REC operation can be addressed with several strategies, such as market-based approaches, sometimes blockchain supported, where peers freely decide the amounts they are willing to buy or to sell in the local market and the prices [
35,
36], post-delivery market approaches, well suited to simplify and automate members’ processes, especially when no flexibility is dispatched [
37], or centralized optimization approaches when there exist flexible resources that can be dispatched. Under this last category, if collective benefits sharing is also addressed, then an internal price must be defined, either with ad hoc pricing mechanisms or relying on the dual variables of the internal energy balance constraints [
38,
39]. Without a defined price, facilitating electricity sharing alongside demand response (DR) becomes challenging [
40], and optimality conditions are then derived to determine various pricing conditions.
In particular, blockchain’s integration in RECs enables secure, decentralized energy sharing, as explored in [
41], offering a foundational review of P2P energy trading, proposing agent-based pricing schemes and optimization tools to enhance fairness and efficiency. The authors of [
42] operationalize this vision, demonstrating in an industrial case study how Ethereum-based smart contracts enable automated, GDPR-compliant, decentralized transactions. The study [
43] shifts focus to user behavior, showing that trading preferences in P2P communities are shaped by electricity prices, storage levels, and autarky aspirations—crucial for aligning system design with user engagement. Complementing the technical and behavioral insight, [
44,
45] extend this by reviewing blockchain’s role in decentralization, central authorities, privacy, and compliance with EU energy directives. Technological overviews by [
46] emphasize microgrid design and energy certification, while [
47] demonstrates blockchain’s application in EV charging using PV surplus.
This work presents an enhanced REC planning model that builds on previous research [
48] where REC configurations were restricted to a single investing member. Key advancements and contributions of this model, based on past literature, include: (a) enabling all REC members to act as potential investors, supporting investments in both solar PV and wind generation for self-consumption at both individual and collective levels; (b) broadening investment capabilities to promote a more collaborative and flexible REC structure that accommodates diverse member profiles and objectives; (c) structuring the model as a cost-minimization problem to reduce the total annualized cost of electricity supply for the REC; (d) incorporating revenue generation from electricity surplus sales to the day-ahead market. Additionally, the model accounts for renewable generation installed “behind-the-meter” for each investing member, ensuring that individually self-consumed electricity is exempt from self-consumption tariffs, thereby optimizing cost efficiency for each participant.
To achieve the objectives of this study, several steps were followed:
Extension of the model presented in [
48] to incorporate the possibility of investment by multiple REC members, as well as the management costs associated with managing the REC.
Application of the extended model to a case study of a real REC comprising four members. Specifically, the actual annual consumption profiles of REC members were used, along with solar PV and wind production profiles for their location, based on average resource availability for an average year.
Analysis of case study results for two scenarios: one where electricity is not shared among REC members (ISC) and another where sharing takes place (CSC). This step aims to (i) assess the economic benefits of CSC compared to ISC and (ii) evaluate the impact of CSC on encouraging investment in renewable resources, specifically wind and solar PV, in contrast to ISC.
Investigation of sensitivity to cost variations, by analyzing whether the insights from the previous step hold when capital costs for wind and solar PV, as well as grid electricity tariffs, change.
Additional economic analysis, exploring the rationale behind the amount of solar PV and wind capacity invested in by REC members. This assessment considers LCOE and the concept of the marginal realized price (MRP) of each technology.
The remainder of this paper is organized as follows:
Section 2 describes the model used for REC optimal decision;
Section 3 presents the four member REC case study; and
Section 4 draws the main conclusions.
2. Model Description
The model presented in this study evolves from [
48] where a planning model for a REC with a single investing member is proposed. In the current upgraded model, REC members are potential investors, so that they can invest in renewable generation capacity, such as solar PV and wind, for individual and collective self-consumption. The model is based on a real REC, where members differ in their demand profile and on-site specific conditions to install solar PV. Considering REC 4, given the type of ownership, this member is not allowed to install any renewable generation, standing only as a consumer in the community.
The modifications made to the previous model include extending the set of members allowed to invest and enabling the installation of wind and solar PV to those members. Additionally, the model considers not only the cost reductions from consuming shared electricity produced by other REC members but also the savings from self-consumption of one’s own-produced electricity. Furthermore, the upgraded model realistically incorporates the costs associated with the self-consumption grid tariff and the management costs of the REC manager.
The model is formulated as a minimization problem of the overall annualized costs of electricity supply, considering eventual revenues from selling the electricity surplus to the grid at the day-ahead market (DAM) prices. The objective function includes: (i) the annualized investment costs of the installed renewable capacity of each REC member; (ii) the cost of the electricity supplied by the retailers from the main grid; (iii) the variable costs of sharing electricity among the REC members that include the managing costs of the community manager (EGAC in Portuguese) and the SC tariff; (iv) the fixed cost of the EGAC; and (v) the revenues coming from the surplus of electricity generation that is sold to the grid.
This setting considers the renewable capacity installed behind the meter of each investing REC member, so that the self-consumption tariff does not apply to the individual self-consumed electricity.
The optimal investment and operational decisions are computed as decision variables of the problem of minimizing the sum of the individual costs of each REC member i, as presented in the constrained optimization problems (1) to (7).
is the objective function expressing the total annualized costs of electricity supply of the overall REC members, is the renewable technology (solar PV and wind, in the present case), is the capital recovery factor of technology , is the capital expenditure of technology , is the REC member, is the installed capacity of REC member in renewable technology , is the time period, is the electricity tariff of REC member in period , which includes both the electricity and grid components, is the electricity supplied from the grid to REC member in period , is the self-consumption tariff in period , is the variable cost of the REC management entity (), is the electricity self-consumed locally by REC member in period supplied by other REC members using the public grid, is the fixed cost of the REC management entity, is the DAM price for selling electricity to the grid, is the electricity sold to the grid by REC member in period , is the electricity demand of REC member in period , is the normalized generation profile of renewable technology in period , is the electricity shared by REC member with other REC members in period , is the specific electricity generation profile from renewable technology in period , is the minimum installed capacity of REC member in renewable technology , is the maximum installed capacity of REC member in renewable technology , and is the maximum overall capacity installed by REC member in all renewable technologies.
This optimization problem is subject to constraints (2) to (7). Equation (2) sets the electricity demand of REC member i in period t equal to the renewable self-production, plus the electricity supply from the grid, plus the electricity shared by other REC members, minus the outgoing electricity surplus of REC
i either shared with other REC members or sold to the grid.
Condition (3) limits the outgoing electricity of REC member
i in period
t to its electricity surplus to the excess of its renewable self-production over its demand.
Condition (4) sets that internal electricity exchanges among REC members in each period t must sum zero, that is, the overall incoming electricity supplied to REC members from other REC members period t should equal the overall outgoing electricity supplied from the REC members to other REC members in period
t.
Condition (5) sets the minimum and maximum capacity of each renewable technology that can be installed by REC member i.
Condition (6) sets the maximum overall capacity installed by each REC member
i in all renewable technologies, which is bound by the contracted capacity of each REC member.
Condition (7) sets the non-negative condition for the variables.
The capital recovery factor of each technology,
, is given by (8):
where
α is the discount rate and
is the lifetime of technology
r.Note that, looking into the derivative of the CRF with respect to α defined in (8), it is observed that it is always positive, meaning that an increasing discount rate (α) leads to a monotonically increasing CRF. Initially rising steeply from an undefined value at α = 0, the CRF’s rate of increase gradually diminishes as α increases. Conversely, a decreasing discount rate results in a decreasing CRF. This effect is analogous to a decrease in CAPEX, stimulating increased investment. Therefore, higher discount rates correspond to lower investment levels, while lower discount rates encourage higher investment levels.
3. Case Study
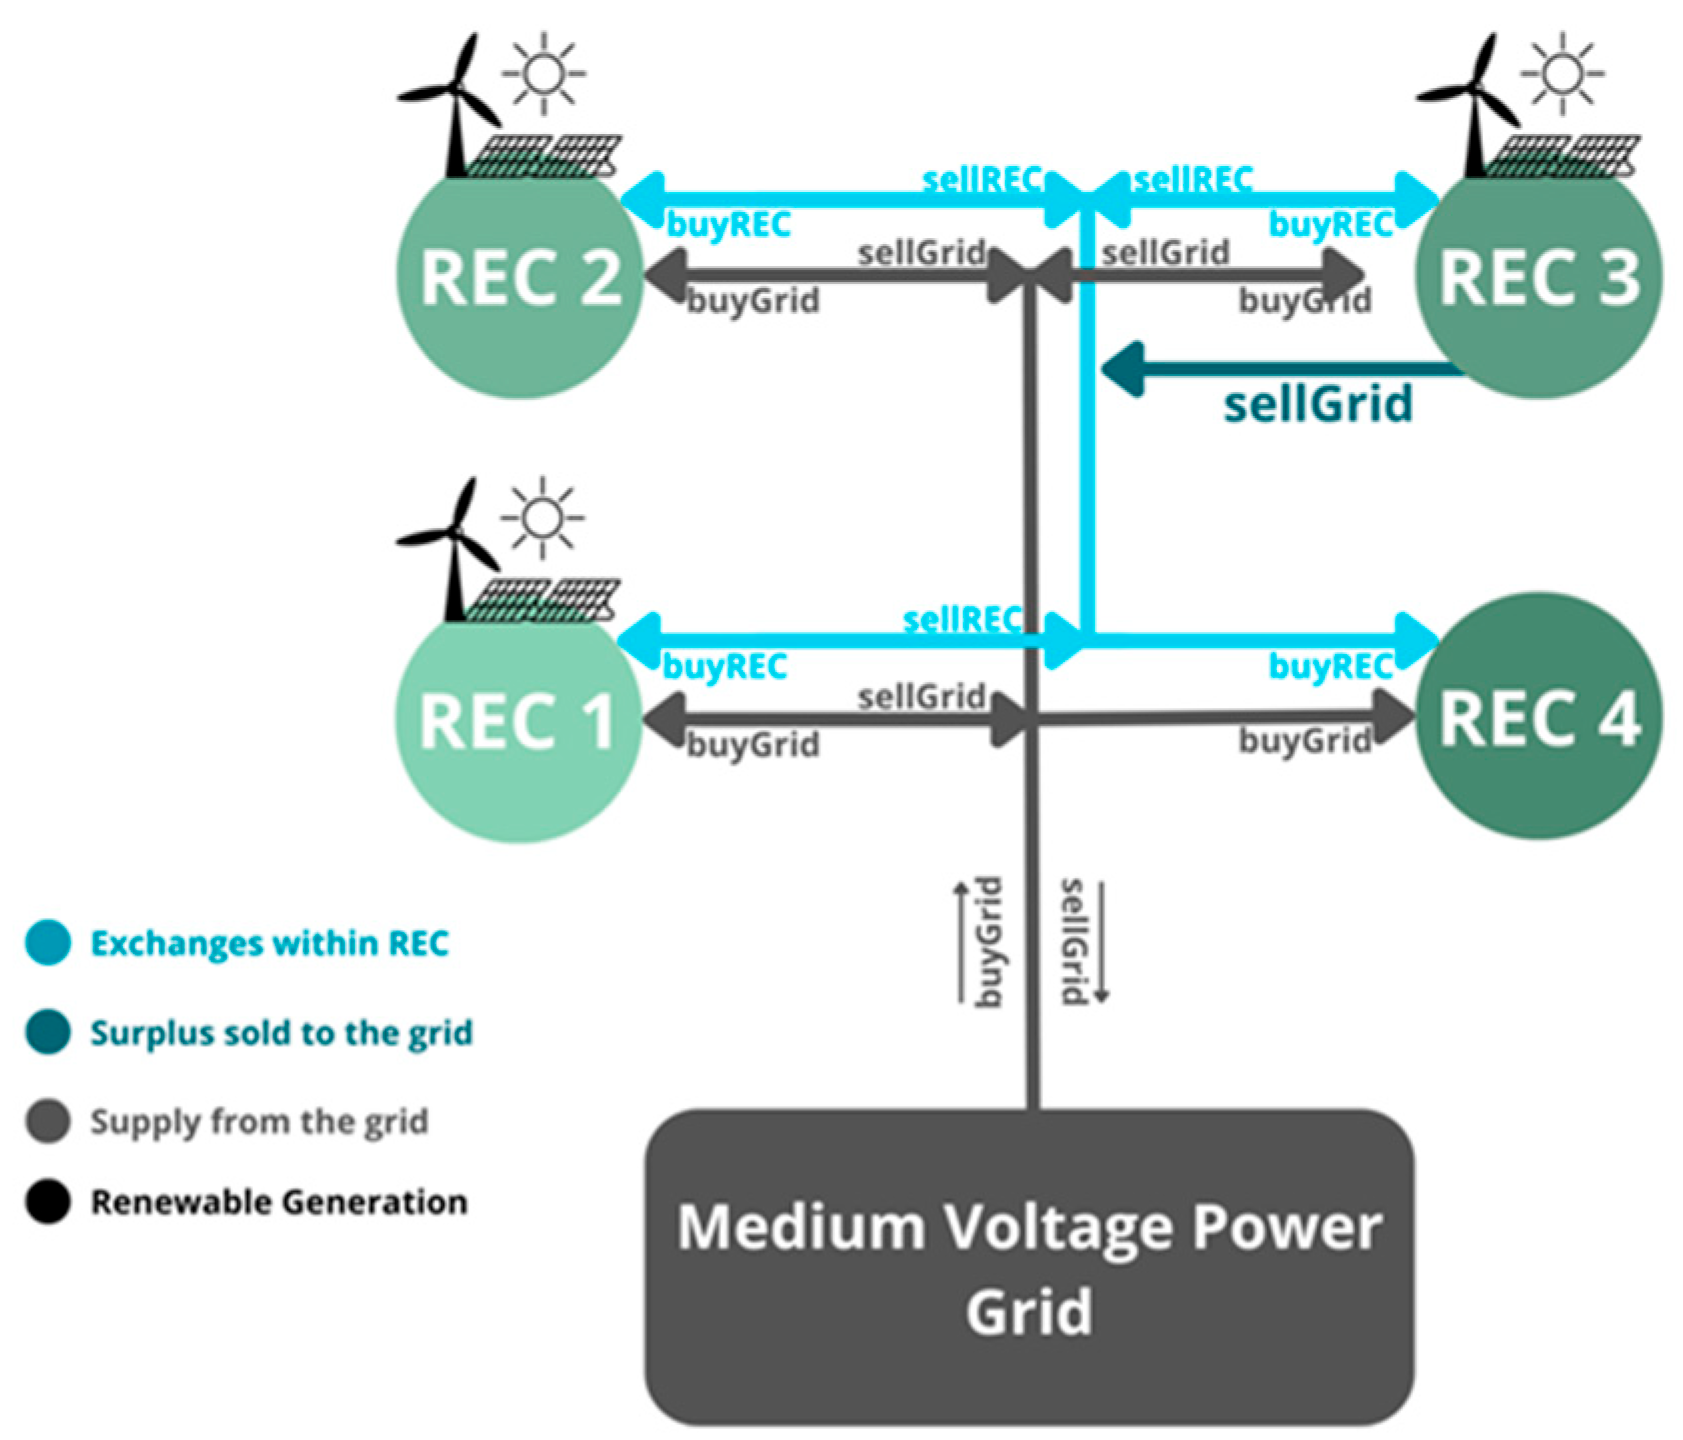
The model described in the preceding section is applied to a real REC with four members, REC 1, REC 2, REC 3, and REC 4, which are connected to the medium-voltage (MV) power grid, represented in
Figure 1. All members, except REC 4, are able invest in renewable generation (solar PV and wind) for self-consumption (individual and collective), the surplus being sold to the grid at the DAM price. Since the model is based on a real REC, where members differ in their demand profile and on-site specific conditions to install renewable sources, REC 4, given its type of ownership, is not allowed to install any renewable energy, standing only as a consumer in the community.
3.1. Input Data
The computation of the REC investment and operational decisions requires to input the demand profile of each member, the characteristics of the renewable technologies that can be installed, and the tariffs and prices of the electricity supplied to and by the grid and shared among REC members.
Table 1 shows the annual electricity demand, the peak demand, and the contracted capacity of each REC member of the case study.
The renewable generation technologies considered for investing are solar PV and wind.
Table 2 shows the capital expenditure (CAPEX) and the lifetime of these technologies.
The electricity generated by the PV and wind technologies is obtained by multiplying the normalized generation profile of each technology by the corresponding installed capacity. To compute the specific generation profile of each technology, hourly data for each renewable resource (solar radiation and wind speed), at the location of the investing REC member facilities, were obtained from the photovoltaic geographical information system (PVGIS) [
49].
Using this information, it is possible to compute the CRF, as given by (8), and the LCOE for each renewable technology. The investment financial indicators are presented in
Table 3.
The integral tariff (including grid and electricity components) applicable to the electricity supplied at the MV was set to 100 €/MWh and the grid tariff for self-consumption that uses the public grid, which is applied to the electricity shared among the REC members, was set to 10 €/MWh. Both tariffs are considered flat rates applicable in all periods. The feed-in price for the electricity surplus sold to the market was set to zero.
Table 4 summarizes the tariffs and prices used in the case study.
3.2. Results
The optimization model described in (1) to (7) was implemented as a linear programming problem using the General Algebraic Modeling System (GAMS). Each simulation runs over one year of operation on an hourly basis, computing the optimal investment decision for each renewable technology and the corresponding renewable generation, the self-consumption of each REC member, the electricity sharing among REC members, and the electricity surplus sold to the grid.
The installed capacity of the renewable technologies is constrained by the site-specific conditions—constraint (5)—and by the contract capacity—constraint (6)—using the values presented in
Table 1.
It is assumed that REC 4 does not invest in renewable technologies, which means that it can only be a consumer of other REC members’ surplus.
Additional to the optimal sizing of the installed solar PV and wind capacity for each REC member, the present study also compares the CSC with the ISC approaches to evaluate the actual benefits of CSC over ISC. In this regard,
Table 5 shows the optimal installed capacity for PV and wind of each REC member for the CSC and ISC approaches computed by the presented model.
Results presented in
Table 5 put in evidence that CSC leads to higher installed renewable capacity per technology for all REC members when compared with the ISC setting. Overall, total renewable capacity accounts for 3631 kW in the CSC and 3134 kW in the ISC, an increase of 497 kW that corresponds to 16% more renewable capacity in CSC compared to the ISC case. The reason for this comes from the increased value of the additional capacity installed that enables more electricity to be shared with the REC members at an opportunity cost equal to their integral tariff (excluding the self-consumption grid tariff), contrary to the ISC where only self-consumption is valued at this tariff. The sources of electricity supplied to each REC member to meet its demand are presented in
Table 6 for the CSC, as the supplier (grid supply), self-consumption (SC) from its own renewable generation, and the electricity shared by other REC members (SC from REC).
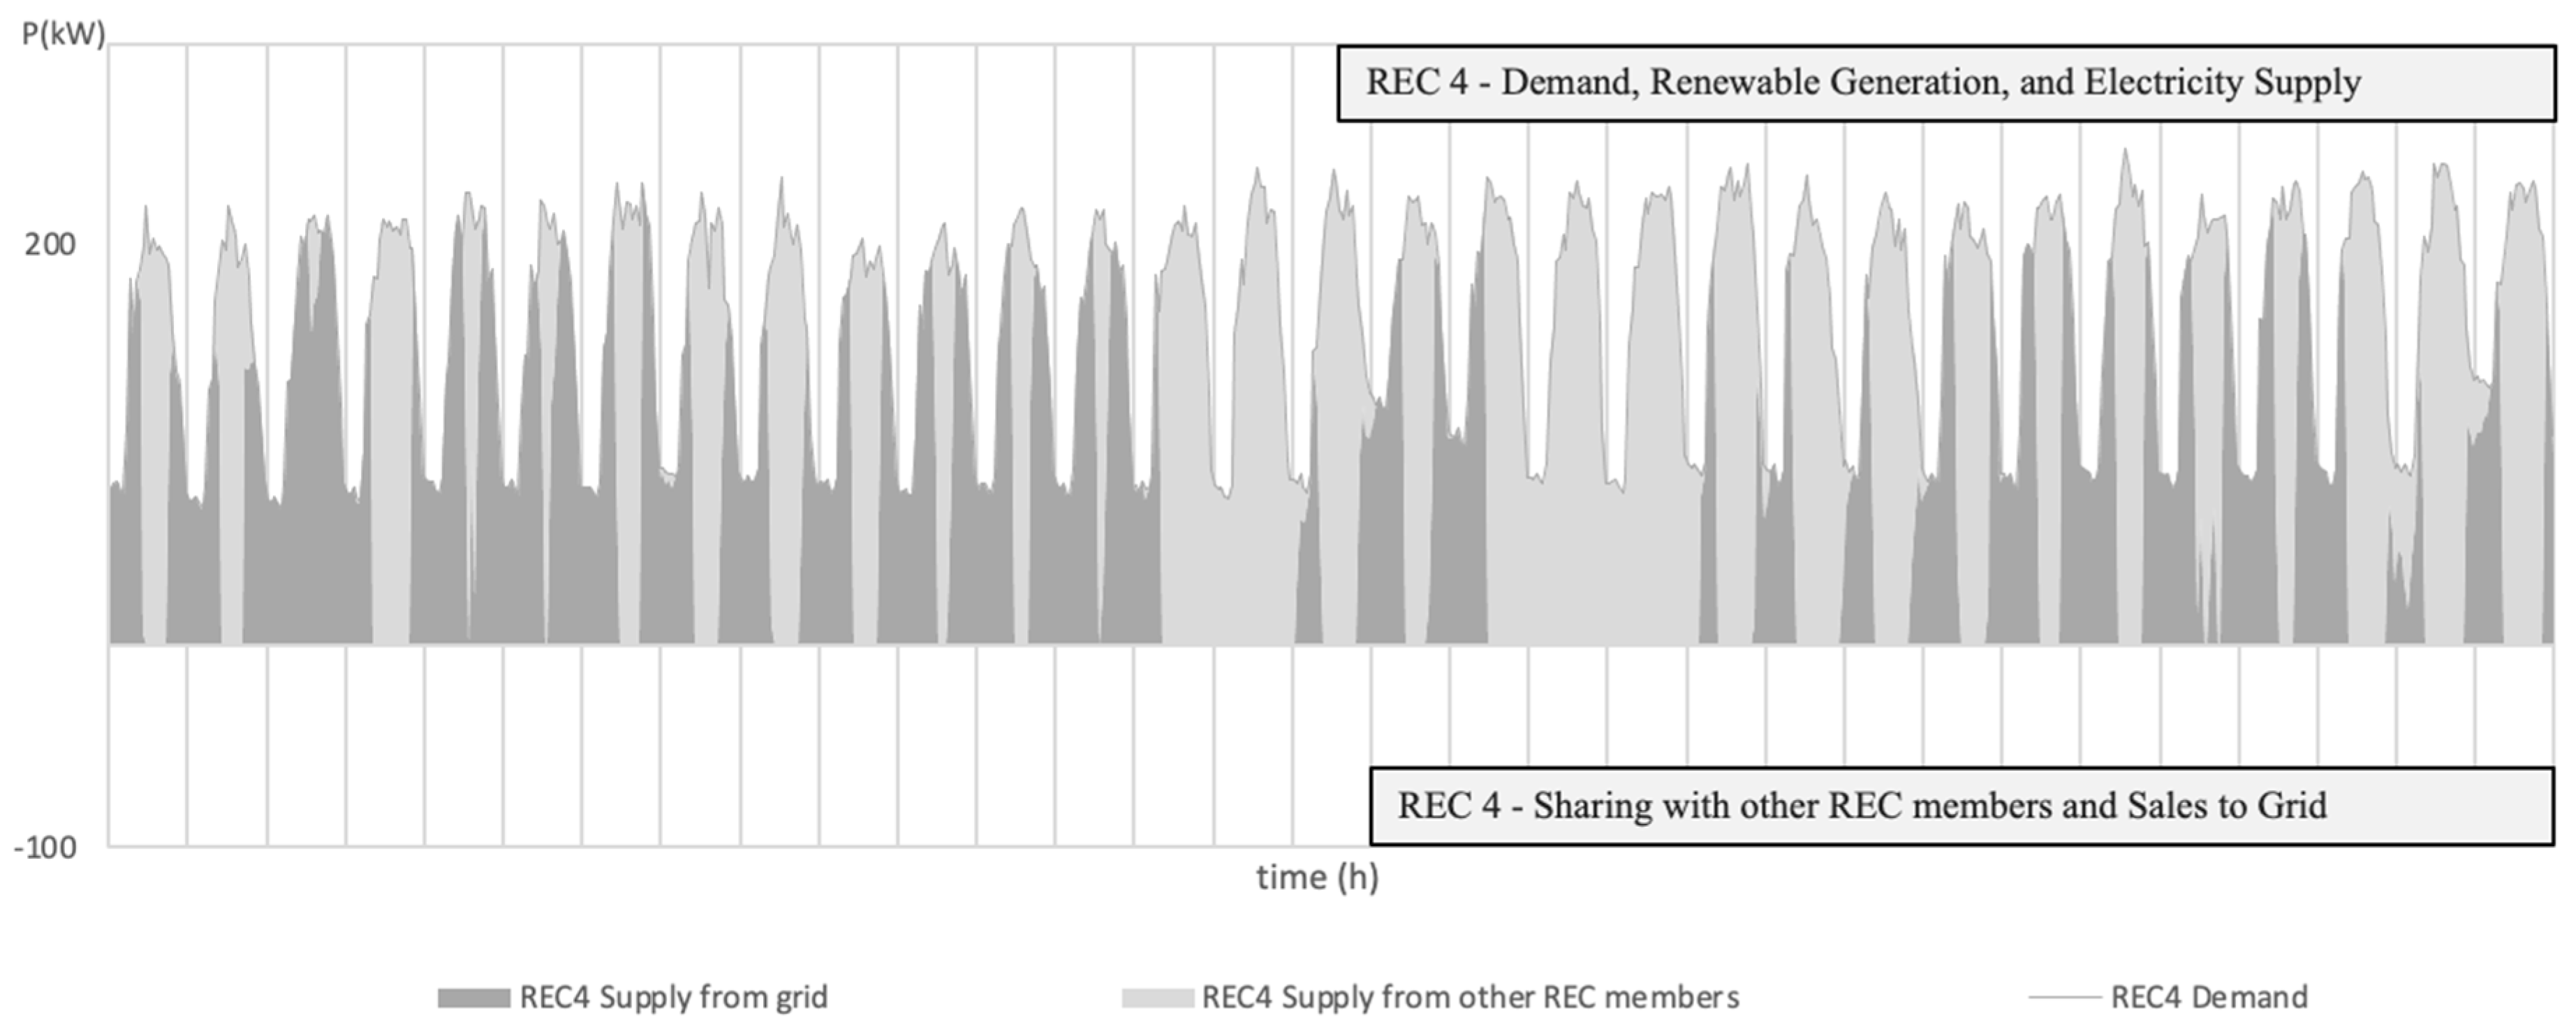
It can be observed that REC 1 is supplied mainly by the grid and by its own generation (45% and 54%, respectively). REC 2 is supplied predominantly by self-generation (56%) and by the grid (44%). REC 3 has a similar sourcing profile to the other two investing members with a balance between the grid supply and self-consumption (47% and 52%, respectively). Finally, REC 4, which is not able to install renewable capacity, is supplied mainly from the grid (64%) but also by the electricity shared by the other REC members (36%).
Table 7 shows how the self-generation of each REC member is used for its self-consumption (SC), shared with other REC members, or injected to the grid.
Renewable generation is mostly used by the facilities’ owners for ISC, which accounts for 77% of the total usage in REC 1, 79% in REC 2, and 60% in REC 3. The electricity shared with other REC members can be as high as 17% (REC 3). Finally, as mentioned previously, REC 4 does not install any renewable capacity and, therefore, it has no self-generation available.
Overall, 69% of the demand of the REC members is supplied from the grid, 28% from self-generation, and 3% from the electricity shared within the REC (
Table 6). From the renewable generation perspective, 77% of the renewable generation is used for the ISC of the REC members, 7% is shared within the REC as CSC, and 16% is surplus injected into the electricity grid (
Table 7).
The amount of 418 MWh of electricity shared among the REC members consists of trades from REC 1, REC 2, and REC 3, which are net sellers, to all the REC members, especially REC 4, which is the major buyer of the electricity shared within the REC, as it does not perform renewable generation.
Table 8 shows how the overall cost of the REC is higher in the ISC approach, when no electricity sharing is allowed. Indeed, the REC adds value to the members’ surplus by reducing the electricity supplied from the grid to other members, reducing the total REC electricity cost.
It should be noted that the total costs comprise both the electricity costs and the annualized investment costs, as presented in (1).
When a REC member is unable to produce its own electricity to meet its consumption, it can acquire it from other REC members sharing their surplus. Although no internal transaction prices were considered for the REC, the internal prices for the transactions to take place should always be lower than the grid supply prices and higher than the feed-in price of selling back to the grid, saving money for all REC members [
37].
Table 9 compares the electricity purchased and sold in both the CSC and ISC approaches.
As expected, the amount of electricity purchased from the grid in the ISC is larger than in the CSC, in which the electricity is partially supplied by the REC members’ electricity surplus, also incentivizing a larger installation of renewable generation capacity. In some cases, although the installed capacity in the ISC approach is lower, the sales to the grid can be higher (e.g., REC 1) as there is no other option for the surplus in the ISC case. Again, REC 4 cannot sell electricity within the REC since it does not install any generation capacity either in the ISC or in the CSC.
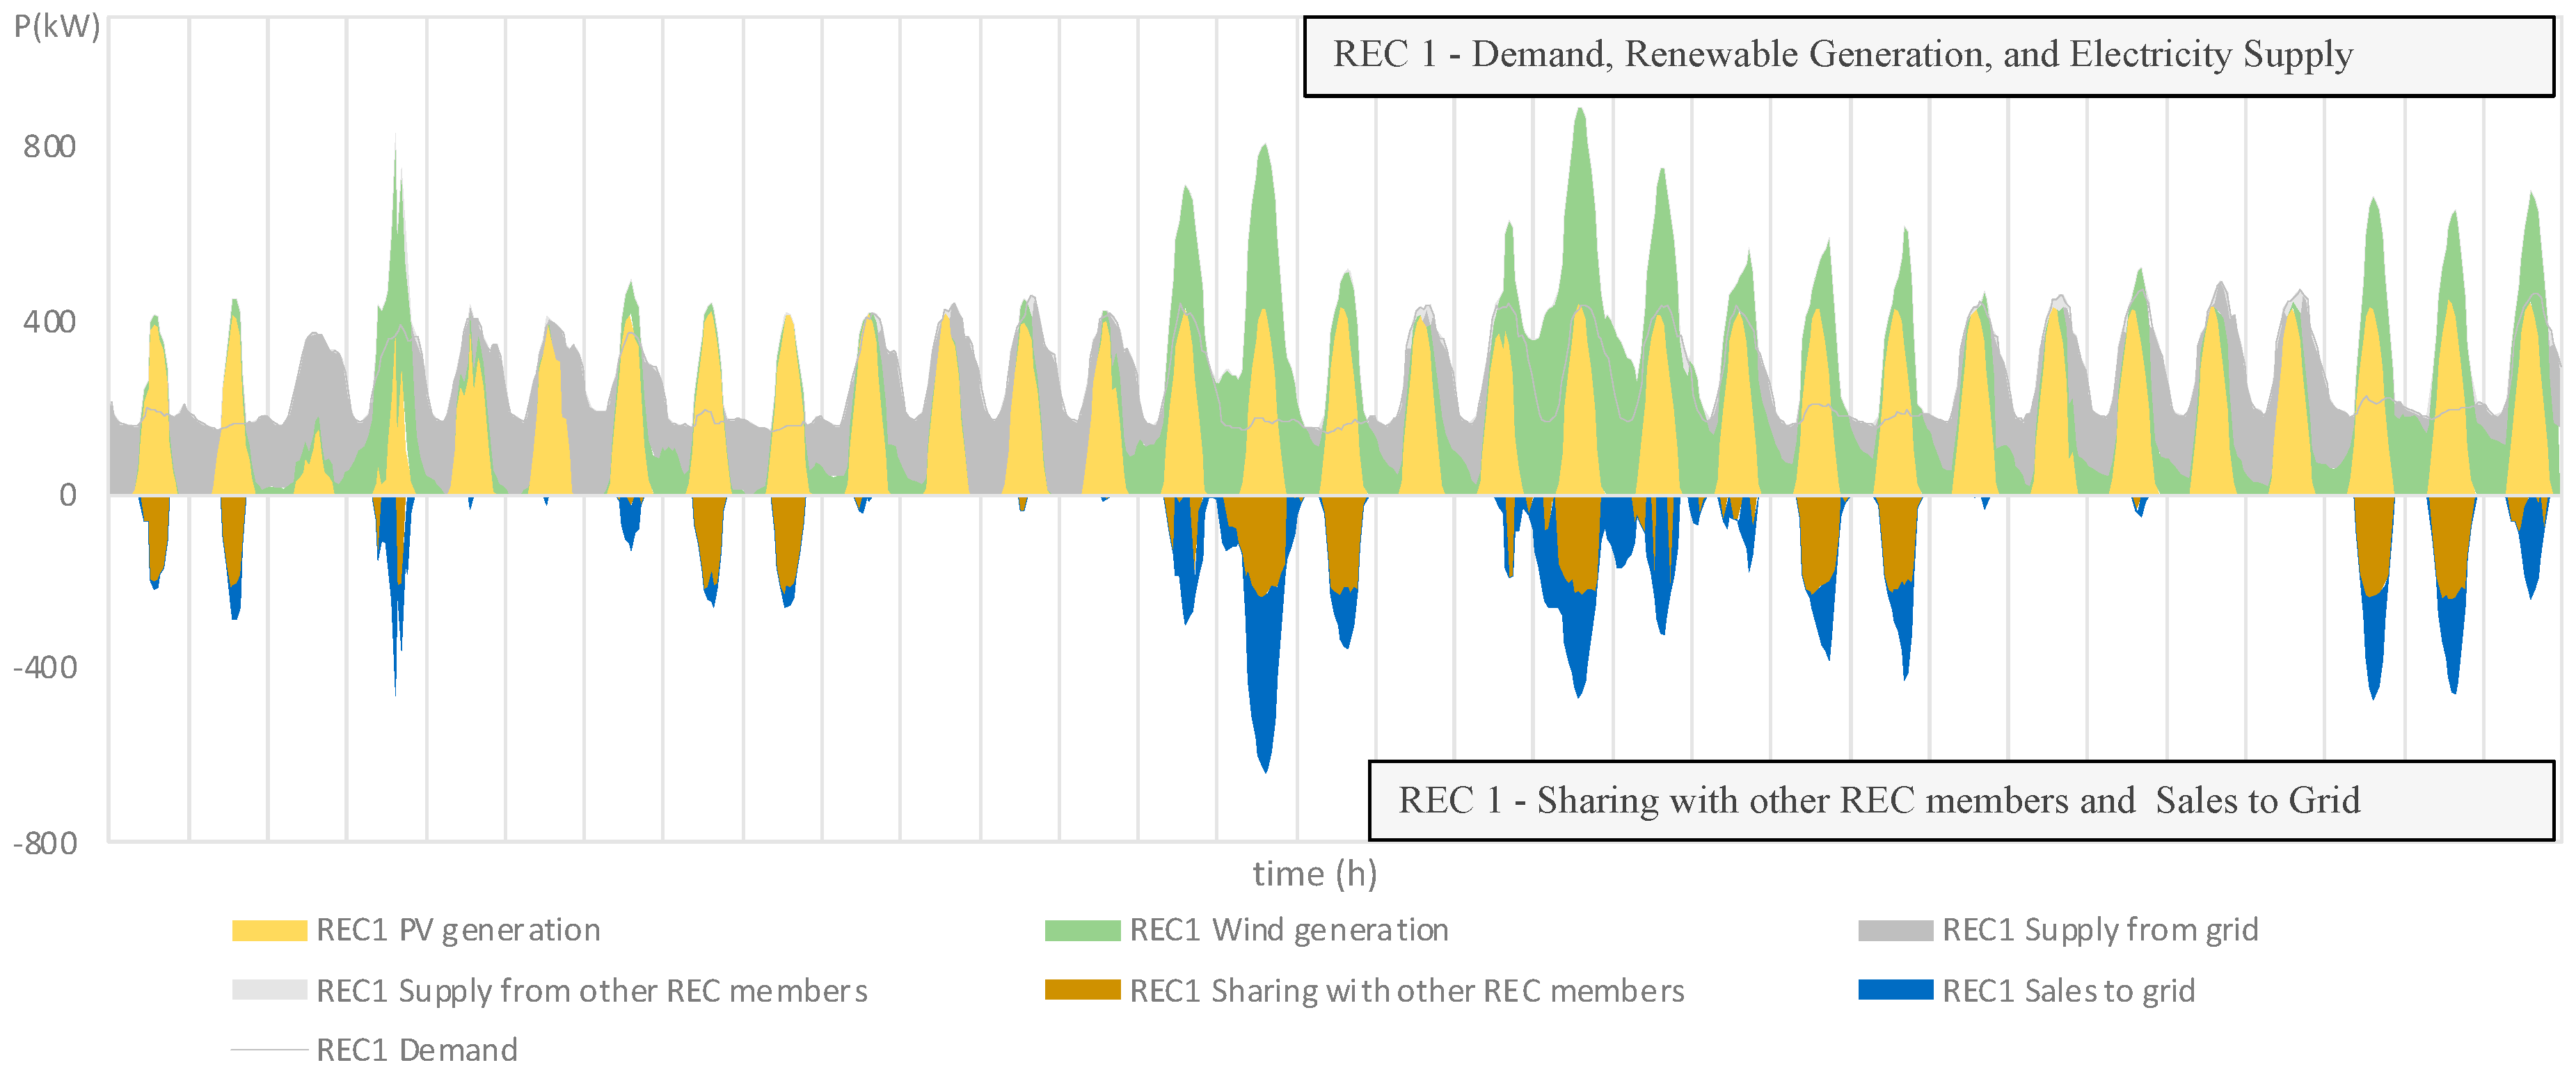
Figure 2,
Figure 3,
Figure 4 and
Figure 5 show, for REC 1 to REC 4, respectively, hourly simulation results for one selected month (May). They present the demand profile, the renewable generation of PV and wind, the electricity supplied from the grid and from other REC members, and the electricity sold to the grid.
Figure 2 shows how REC 1, that performs renewable generation (PV and wind), manages to fully self-supply its demand during some solar hours, shares electricity surplus with other REC members, and sells the remaining surplus to the grid. Note that REC 1 has a profile with very different behavior between weekdays and weekends, which means that, during weekends, the lower demand results in a higher surplus. It is important to emphasize that these profiles are based on real-world case study data. Note also that the contribution of the wind generation is especially useful in periods where solar PV does not generate, helping to increase self-consumption, as is the case of the night periods.
As can be seen in
Figure 3, REC 2 has a more regular profile, with lower differences between weekdays and weekends. It can also be seen that, during sunny hours, the renewable generation completely supplies REC 2 demand and creates a surplus that is mainly sold to the grid. This is because the other members cannot profit from REC 2 surplus since they also have their own surplus during the same periods.
Figure 5 shows how REC 3 produces more electricity than it consumes most of the time, especially during solar hours. Therefore, a large amount of electricity is shared with the other REC members and sold to the grid. This behavior is partly driven by already existing solar PV generation in the underlying demand (shown in
Figure 5 as “REC3 Demand”).
It is also worth noting that, in some days (e.g., May 27th), the renewable generation in solar hours was not enough to supply the entire demand of some REC members (e.g., REC 1, REC 2, as shown in
Figure 2 and
Figure 3), which causes REC 3 to share its surplus (
Figure 4) with them to complement their supply to compensate for this demand/generation gap.
3.3. Capital Costs and Integral Tariff Sensitivity Analysis
To assess the sensitivity of the results to variations in capital costs and the integral tariff, calculations were performed for a 20% increase and a 20% decrease in capital costs compared to the base case assumptions. Similarly, results were obtained for integral tariffs set 20% higher and 20% lower than in the base case. The capital costs and integral tariffs used in the sensitivity analysis are presented in
Table 10 and
Table 11, respectively.
The optimal installed capacities for each renewable generation for each REC member considering a decrease of 20% and an increase of 20% in capital costs are shown in
Table 12 and
Table 13, respectively.
An analysis of
Table 12 and
Table 13, in comparison with
Table 5, reveals that whether in the ISC or CSC approach, a decrease in renewable capital costs leads to increased installed capacity among REC members who can invest. Lower capital costs enhance the benefits of additional renewable generation, incentivizing greater investment. Conversely, an increase in capital costs results in lower installed capacity.
These changes in installed capacity, driven by fluctuations in capital costs, naturally impact the share of electricity sources supplying each REC member.
Table 14 and
Table 15 present the composition of electricity sources used to meet REC members’ demand under scenarios of a 20% decrease and a 20% increase in capital costs, respectively.
Comparing
Table 14 with
Table 6, it is clear that lower capital costs lead to an increase in self-generation to meet the demand of REC members who can invest. The share of self-generated electricity rises to approximately 60%, resulting in reduced grid consumption. In the case of REC 4, there is also a shift towards greater supply from within the REC, further replacing grid consumption.
Conversely,
Table 15 shows that, with higher capital costs, the opposite occurs. REC 1 and REC 3 rely more on grid electricity to meet their demand, as their self-generation capacity is reduced.
To further analyze how self-generated electricity is utilized by REC 1 to REC 3 under varying capital cost scenarios,
Table 16 and
Table 17 are presented.
Table 16 and
Table 17 are compared with
Table 7 for the base case. In
Table 16, the increase in installed capacity leads to higher self-generation. While this results in greater self-consumption and more electricity being shared with other REC members, the most significant increase is in the surplus generation sent to the grid.
In
Table 17, with lower self-generation, the available electricity is still primarily used for self-consumption, followed by supply to other REC members.
Table 18 presents the total costs associated with changes in capital costs for both the ISC and CSC approaches.
Table 18 shows that, even with changes in the capital cost of renewable generation, the CSC approach consistently results in the lowest total cost compared to the ISC approach, with reductions ranging from 4% to 6% across the studied cases. The reason remains the same in all scenarios: by sharing the surplus renewable generation, REC members rely less on grid supply, leading to lower overall costs. Regarding the electricity purchased and sold for the CSC and ISC approaches, results are presented in
Table 19 and
Table 20 for a 20% decrease and a 20% increase, respectively, in capital costs.
Table 19 and
Table 20 show that, like the base case in
Table 9, REC members in the ISC approach purchase more electricity from the grid than in the CSC approach, as they lack the ability to share self-generated electricity within the REC. Moreover, despite the lower installed renewable capacity observed in
Table 12 and
Table 13 due to changes in capital costs, the surplus energy sent to the grid remains higher in the ISC approach than in the CSC approach. This is because REC members with self-generation have no alternative but to export their surplus instead of sharing it. Overall, the results for changes in capital costs confirm that the key insights from the base scenario remain valid.
Now, considering changes in the integral tariff paid by REC members for electricity supplied from the grid,
Table 21 and
Table 22 present the optimal installed capacity of solar PV and wind for each REC member under a 20% decrease and a 20% increase in the integral tariff, respectively.
From
Table 21, it is evident that a lower integral tariff paid by REC members leads to a decrease in renewable installed capacity compared to the base case in
Table 5. This occurs because a reduced tariff makes grid electricity more cost-effective, thereby diminishing the financial advantage of self-generation, which otherwise serves as a substitute for grid supply. An increase in the integral tariff has the opposite effect, as shown in
Table 22, enhancing the benefits of self-generation over grid supply. Regarding the electricity balance per REC member for changes in integral tariff, results are presented in
Table 23 and
Table 24 for a 20% decrease and a 20% increase, respectively, in integral tariff.
With a lower integral tariff, grid supply becomes more cost-effective for REC members, leading to a higher share of grid consumption, as shown in
Table 23, compared to the base case (
Table 6). In fact, there is an inversion in supply shares: while self-generation dominates in the base case, a lower integral tariff results in grid supply taking the larger share. Conversely, as illustrated in
Table 24 the opposite trend occurs when the integral tariff is higher.
The use of self-generation by the investing members is presented in
Table 25 and
Table 26 for a 20% decrease and a 20% increase, respectively, in integral tariff.
From
Table 25 and
Table 26, compared to
Table 7, it is evident that the increase in installed capacity induced by higher tariffs (
Table 26) results not only in greater renewable generation but also in a higher level of self-generation for REC members who can invest. However, the most significant change is the surplus sold to the grid. With increased self-generation, a larger share of the generated electricity is neither self-consumed nor supplied to other REC members, leading to a higher percentage being exported to the grid.
Regarding the total costs of the ISC and the CSC approaches for changes in the integral tariff, they are presented in
Table 27.
As with the changes in capital costs,
Table 27 shows that, despite the changes in the integral tariff, the CSC approach still delivers better results than the ISC approach. This is primarily due to the ability to share the renewable generation surplus, which reduces the need for grid supply and, consequently, lowers costs.
Table 28 and
Table 29 present the electricity purchased and sold for the CSC and ISC approaches for a 20% decrease and a 20% increase, respectively, in the integral tariff.
The results presented in
Table 28 and
Table 29 are closely aligned with those in
Table 9 for the base case. Specifically, in the CSC approach, REC members purchase less from the grid compared to the ISC approach, as the latter does not allow for sharing the self-generation surplus with other REC members.
The results of the sensitivity analysis, considering changes in capital costs and the integral tariff paid by REC members for purchasing electricity from the grid, align with those obtained for the base case. The key takeaway is the increased benefits for REC members when sharing their self-generation surplus with other members, rather than exporting it to the grid.
3.4. Discussion
The results obtained in the previous section concerning the optimal investment portfolio of renewables (PV and wind) and the electricity shared among REC members can be analyzed using the concepts of MRP in comparison with the LCOE of each renewable technology.
The realized price is the average price weighted by the volume of each renewable generation technology for individual self-consumption, collective self-consumption, and surplus sold to the grid. From this concept we derived the MRP for technology
k (
) that measures the change in the realized price when one unit of technology
k capacity is added. Therefore, the
represents the additional revenue that is achieved when investing a marginal unit of capacity in each renewable technology
k (PV and wind), computed by (9).
The LCOE is the average net present cost of electricity generation of a power technology over its lifetime and is calculated as the ratio between all the discounted costs and the discounted sum of the electricity delivered over its lifetime. In our context, the LCOE of each renewable technology
k (
) is given by (10).
Table 30 presents the realized price, the MRP, and the LCOE for the presented case study with four REC members. The relevant indexes are only available for the investing REC members (REC 1, REC 2, and REC 3).
As presented in
Table 30, the MRP of each technology of each investing REC member equals the LCOE of the corresponding technology. The installed capacity at which this occurs varies according to ISC or CSC.
In fact, in line with other studies [
48], as the MRP represents the marginal revenue and LCOE represents the marginal cost of investing in an additional unit of capacity of each renewable technology, the marginal investment is profitable whenever the MRP exceeds the LCOE (43.17 €/MWh for PV and 51.42 €/MWh for wind), and it is unprofitable otherwise. Beyond that level of investment in PV and wind, the additional investment would turn out to be unprofitable as the MRP of both technologies would be lower than the respective LCOE.
As the possibility of sharing electricity among REC members increases the value of the selling electricity, the installed capacity at which the equality of MRP and LCOE occurs is higher for the CSC when compared with the ISC, as the MRP for the same installed renewable capacity would be higher.
4. Conclusions
Renewable Energy Communities, as established by the EU Renewable Energy Directive 2023/2413, are expected to play an important role in providing environmental, economic, and social community benefits for their members and for local areas where they operate. They will also contribute to the energy transition and decarbonization process, as they incentivize the implementation of renewable generation to a level beyond that of individual self-consumption.
Sharing renewable electricity within RECs has the potential to increase the installed renewable capacity and create mutually beneficial self-consumption, profiting from the complementarities among the REC members in terms of their electricity demand and generation patterns. In this sense, selling members within RECs manage to achieve additional revenues by sharing electricity with buying members.
The current work presents a model for the optimal investment and operational decisions within RECs which allows multiple members to invest in solar PV and wind generation technologies. A real-word case study, based on a REC with four members connected to the medium-voltage grid, is used to highlight the model possibilities and to assess the benefits of CSC over ISC in a specific case. The model computes the optimal capacity of each technology for each REC member, namely solar PV and wind, as well as the shared electricity in each period, while considering local constraints such as the available on-site conditions for renewable projects.
The current study emphasizes the benefits of simultaneously modeling investment and operational decisions inside a REC, and sheds light into the basic dynamics of REC renewable power generation and sharing. Moreover, the results achieved from the REC setting that result from the collective self-consumption are compared to the individual self-consumption case. It is shown that, in the presented real-world case study, total renewable capacity accounts for 3631 kW in the REC which compares to 3134 kW of the individual self-consumption setting, an increase of 497 kW that corresponds to 16% more renewable capacity in the REC. This shows the advantage of renewable energy communities as a driver to foster renewable energy generation to a level beyond that of individual self-consumption. The comparison between the MRP and the LCOE for each renewable technology supports the conclusion that incremental investments are profitable whenever the MRP exceeds the LCOE.
When increasing renewable capacity, the MRP decreases due to the surplus of renewable electricity being shared at a lower economic value. This decrease in the MRP is driven by collective self-consumption, which incurs additional costs (e.g., self-consumption grid tariffs). Moreover, excess REC electricity is sold to the grid at market prices, which is lower than the electricity tariffs of REC members.
From the presented discussion, it is also concluded that RECs increase the realized price of renewable generation and enhance investment capacity. Specifically, since the optimal investment criterion is the equality between the MRP and the LCOE, a higher MRP allows for greater investment capacity. Consequently, within a REC, the optimal investment in renewable power is higher than the individual self-consumption outcome for all investing REC members.
Future research in this area will include the extension of the model to include the active participation of RECs in electricity markets by providing flexibility services through demand response and storage including batteries and electric vehicles.


 ,
, 


