Article

Numerical Study of Turbulent Forced Convection in a Square Duct with Discrete X-V Inducing Turbulators (DXVIT)

by
Amnart Boonloi
1 and
Withada Jedsadaratanachai
2,*
1
Department of Mechanical Engineering Technology, College of Industrial Technology, King Mongkut’s University of Technology North Bangkok, Bangkok 10800, Thailand
2
Department of Mechanical Engineering, School of Engineering, King Mongkut’s Institute of Technology Ladkrabang, Bangkok 10520, Thailand
*
Author to whom correspondence should be addressed.
Energies 2025, 18(8), 1906; https://doi.org/10.3390/en18081906
Submission received: 21 March 2025 / Revised: 4 April 2025 / Accepted: 7 April 2025 / Published: 9 April 2025

Abstract

:
This research is an extension study that applies a vortex generator previously developed and tested under laminar flow conditions to investigate its performance under turbulent flow conditions, covering the operating range of various heat exchanger systems. This type of vortex generator is called the discrete X-V inducing turbulator (DXVIT), which is derived from the V-baffle, known for its high heat transfer enhancement efficiency, combined with the structure of an orifice that provides durability and stability when installed in heat exchanger systems. The DXVIT is installed to modify the primary flow structure and disrupt the thermal boundary layer (ThBL), resulting in an increase in the convective heat transfer coefficient. This study examines the effects of DXVIT size, installation spacing, flow direction, and DXVIT type on the heat transfer and flow behavior under turbulent flow conditions with Reynolds numbers ranging from 3000 to 16,000. The investigation is conducted using numerical simulation methods. The results are presented in terms of flow and heat transfer behavior, along with an analysis of thermal performance using dimensionless parameters. The findings indicate that the heat transfer rate increases up to 5.29 times, and the thermal performance factor reaches 2.65 under the same pumping power conditions.

1. Introduction

With the increasing energy demand in the modern era, there has been a drive to develop equipment and systems with sufficient efficiency to meet this growing demand. Heat exchangers are considered one of the most critical systems in engineering, as they are directly related to energy. High-performance heat exchanger systems can help achieve energy management goals. The development of heat exchanger efficiency has gained attention from various organizations, such as the Ministry of Energy, which plays a key role in energy management. In addition, other private organizations and educational institutions have also adopted the improvement of heat exchanger efficiency as a research topic.
In the development of heat exchangers, the passive method is commonly used by altering the properties of working fluids to enhance the heat transfer rate within the system, such as using nanofluids. Another approach involves installing small components that obstruct the flow and modify heat transfer behavior in the heat exchanger. These small components are referred to as turbulators, vortex generators, vortex turbulators, or other similar terms with equivalent meanings. Turbulators installed in heat exchanger systems have been continuously developed to accommodate various heat exchanger applications. Over time, there has been extensive research and development on heat exchangers using turbulators. This study highlights certain types of turbulators that have been widely researched due to their high potential to enhance heat transfer rates and serve as the basis or prototypes for the turbulators presented in this article.
Mukhlif and Abed [1] studied hydrothermal performance in a T-channel with V-broken ribs using numerical modeling under laminar flow conditions (Re = 50–250). They investigated rib orientation angles (30°, 45°, 60°), pitch-to-width ratios (1, 1.5, 2), length-to-width ratios (0.5, 0.75, 1), and height-to-width ratios (0.2, 0.3, 0.4), finding a maximum performance enhancement of 2.42. Kumar and Pathak [2] explored flow and thermal behavior in gas turbine blade channels with V-rib/dimple configurations, comparing V-ribs, broken V-ribs, and spherical dimples over a Reynolds number range of 20,000–80,000. Their results showed the highest thermal performance factor (1.205) with a rib height of 1 mm and dimple depth of 2.0 mm. Sutar et al. [3] studied thermal performance in solar air heaters using parabolic rib turbulators, finding a thermal enhancement ratio of 2.14 at a rib pitch of 16.66, with Reynolds numbers between 3400 and 20,000. Hegde et al. [4] performed energy and exergy analysis on a solar air heater using various V-ribs, showing that staggered multi-V-ribs achieved the highest thermal efficiency (76.63%) at Re = 21,000, while perforated multi-V-ribs reached 74.82%. The staggered multi-V-ribs also had the highest exergy efficiency at 5.17%. Liu et al. [5] conducted an experimental study on heat transfer and flow structure in microencapsulated phase change slurry within microchannels with different rib configurations. They found that a staggered pin/fin microchannel enhanced performance by up to 26% compared to a straight rib microchannel. Wang et al. [6] researched thermal performance enhancement using wavy ribs with various cross-sections in turbine blade ribbed channels. They showed that isosceles triangle and trapezoid wavy ribs increased heat transfer by 14.88% and 20.66%, respectively, with significant increases of 73.29% and 185.31% for large rib heights. Kumar and Abraham [7] studied flow and heat transfer in a double-pipe heat exchanger with rib-turbulated annuli, finding optimal rib diameters of 0.14 and rib-to-rib pitches of 12 for balancing heat transfer enhancement and pressure drop at Re = 7500–10,000. Cao et al. [8] analyzed flow and thermal behavior in a ribbed two-pass channel, achieving a thermal performance increase of 8.7%. Wang et al. [9] investigated discontinuous bionic S-shaped ribs in turbine blade cooling channels and found that they enhanced heat transfer and thermal performance by 35% and 39%, respectively, compared to continuous ribs. Chen et al. [10] conducted a numerical study on V-ribs, focusing on rib height and rib-to-jet distance, and also examined the combination of ribs with impingement jets to enhance heat transfer. Majmader and Hasan [11] analyzed the effect of bidirectional rib arrangements on heat transfer and turbulent flow (Re = 10,000–50,000) in a two-pass channel for turbine blade cooling. They found that bidirectional ribs enhanced thermal performance by up to 69% compared to horizontal-only ribs, with the highest thermohydraulic characteristics at 1.38. Chhaparwal et al. [12] studied the thermal performance enhancement in a solar air heater system with circular detached ribs, investigating the effects of blockage ratio, clearance ratio, and longitudinal pitch ratio on flow structure within a range of Re = 3000–15,000. Their results were presented in terms of heat transfer and pressure using dimensionless variables. Wang et al. [13] analyzed the impact of sinusoidal wavy ribs on thermal and flow changes in turbine blade cooling channels, showing an 80% increase in heat transfer and a 20% improvement in thermal performance compared to the reference case for turbulent flow at Re = 10,000–40,000. Wang et al. [14] used fan-shaped grooves and triangular truncated ribs to enhance thermal performance in a microchannel heat sink, finding that flow disruption and boundary layer disturbance were key factors in improving heat transfer. Fu et al. [15] studied W-shaped micro-ribs in heat exchangers and concluded that the optimal thermal performance occurred with a rib angle of 120°, rib width of 0.1 mm, and rib height of 0.4 mm. Wang et al. [16] explored non-uniform wavy ribs in turbine blade cooling channels, showing a 22.6% increase in the Nu/Nu0 ratio compared to the reference case. Prasad et al. [17] analyzed a solar air heater with offset transverse ribs, demonstrating a 1.52 times increase in heat transfer rate and a maximum thermal enhancement factor of 1.042. Boonloi and Jedsadaratanachai [18] developed an X-V rib vortex generator for heat exchangers, showing an 11.80-fold increase in heat transfer and a maximum thermal enhancement factor of 3.48 under laminar flow (Re = 100–2000). Tamang et al. [19] found that a V-shaped rib with a single break increased heat transfer by 45.07%, achieving a maximum thermal performance factor of 88.57%. Zhu et al. [20] used rectangular rib prisms in a sinusoidal wavy microchannel heat sink and found a maximum Nusselt number of 4.16 and an overall performance factor of 1.88.
From the research examples presented above, it is evident that V-baffles, V-ribs, and other V-shaped turbulators effectively increase the convective heat transfer coefficient in heat exchanger systems. This directly enhances thermal performance and the heat transfer rate. However, the development of V-shaped turbulators continues due to certain limitations in real industrial applications, such as structural instability during actual use, maintenance difficulties, and high pressure drops for certain flow-impingement angles. In previous research conducted by the research team, a turbulator was developed by combining a V-baffle with an orifice to maintain the V-baffle’s efficiency in enhancing heat transfer while increasing the structural strength. This turbulator, referred to as the X-V baffle [18], was created in both continuous and discrete forms (to reduce pressure drop) for the laminar flow regime. Preliminary studies revealed that the X-V baffle significantly improves the thermal performance of heat exchangers, similar to the V-baffle. It is also easy to manufacture. However, most heat exchanger systems operate under transition and turbulent flow conditions. Therefore, this research extends the study by investigating the discrete form of the X-V baffle, referred to as the discrete X-V inducing turbulator (DXVIT), under turbulent flow conditions. The hypothesis is that the X-V baffle should exhibit similar flow and heat transfer characteristics to the V-baffle, enhancing thermal performance while providing greater structural stability during installation. This study employs numerical simulation to gain detailed insights into the heat exchanger’s flow behavior, which will be crucial for further development of heat exchangers and various types of turbulators. Additionally, the use of numerical methods helps reduce research costs.

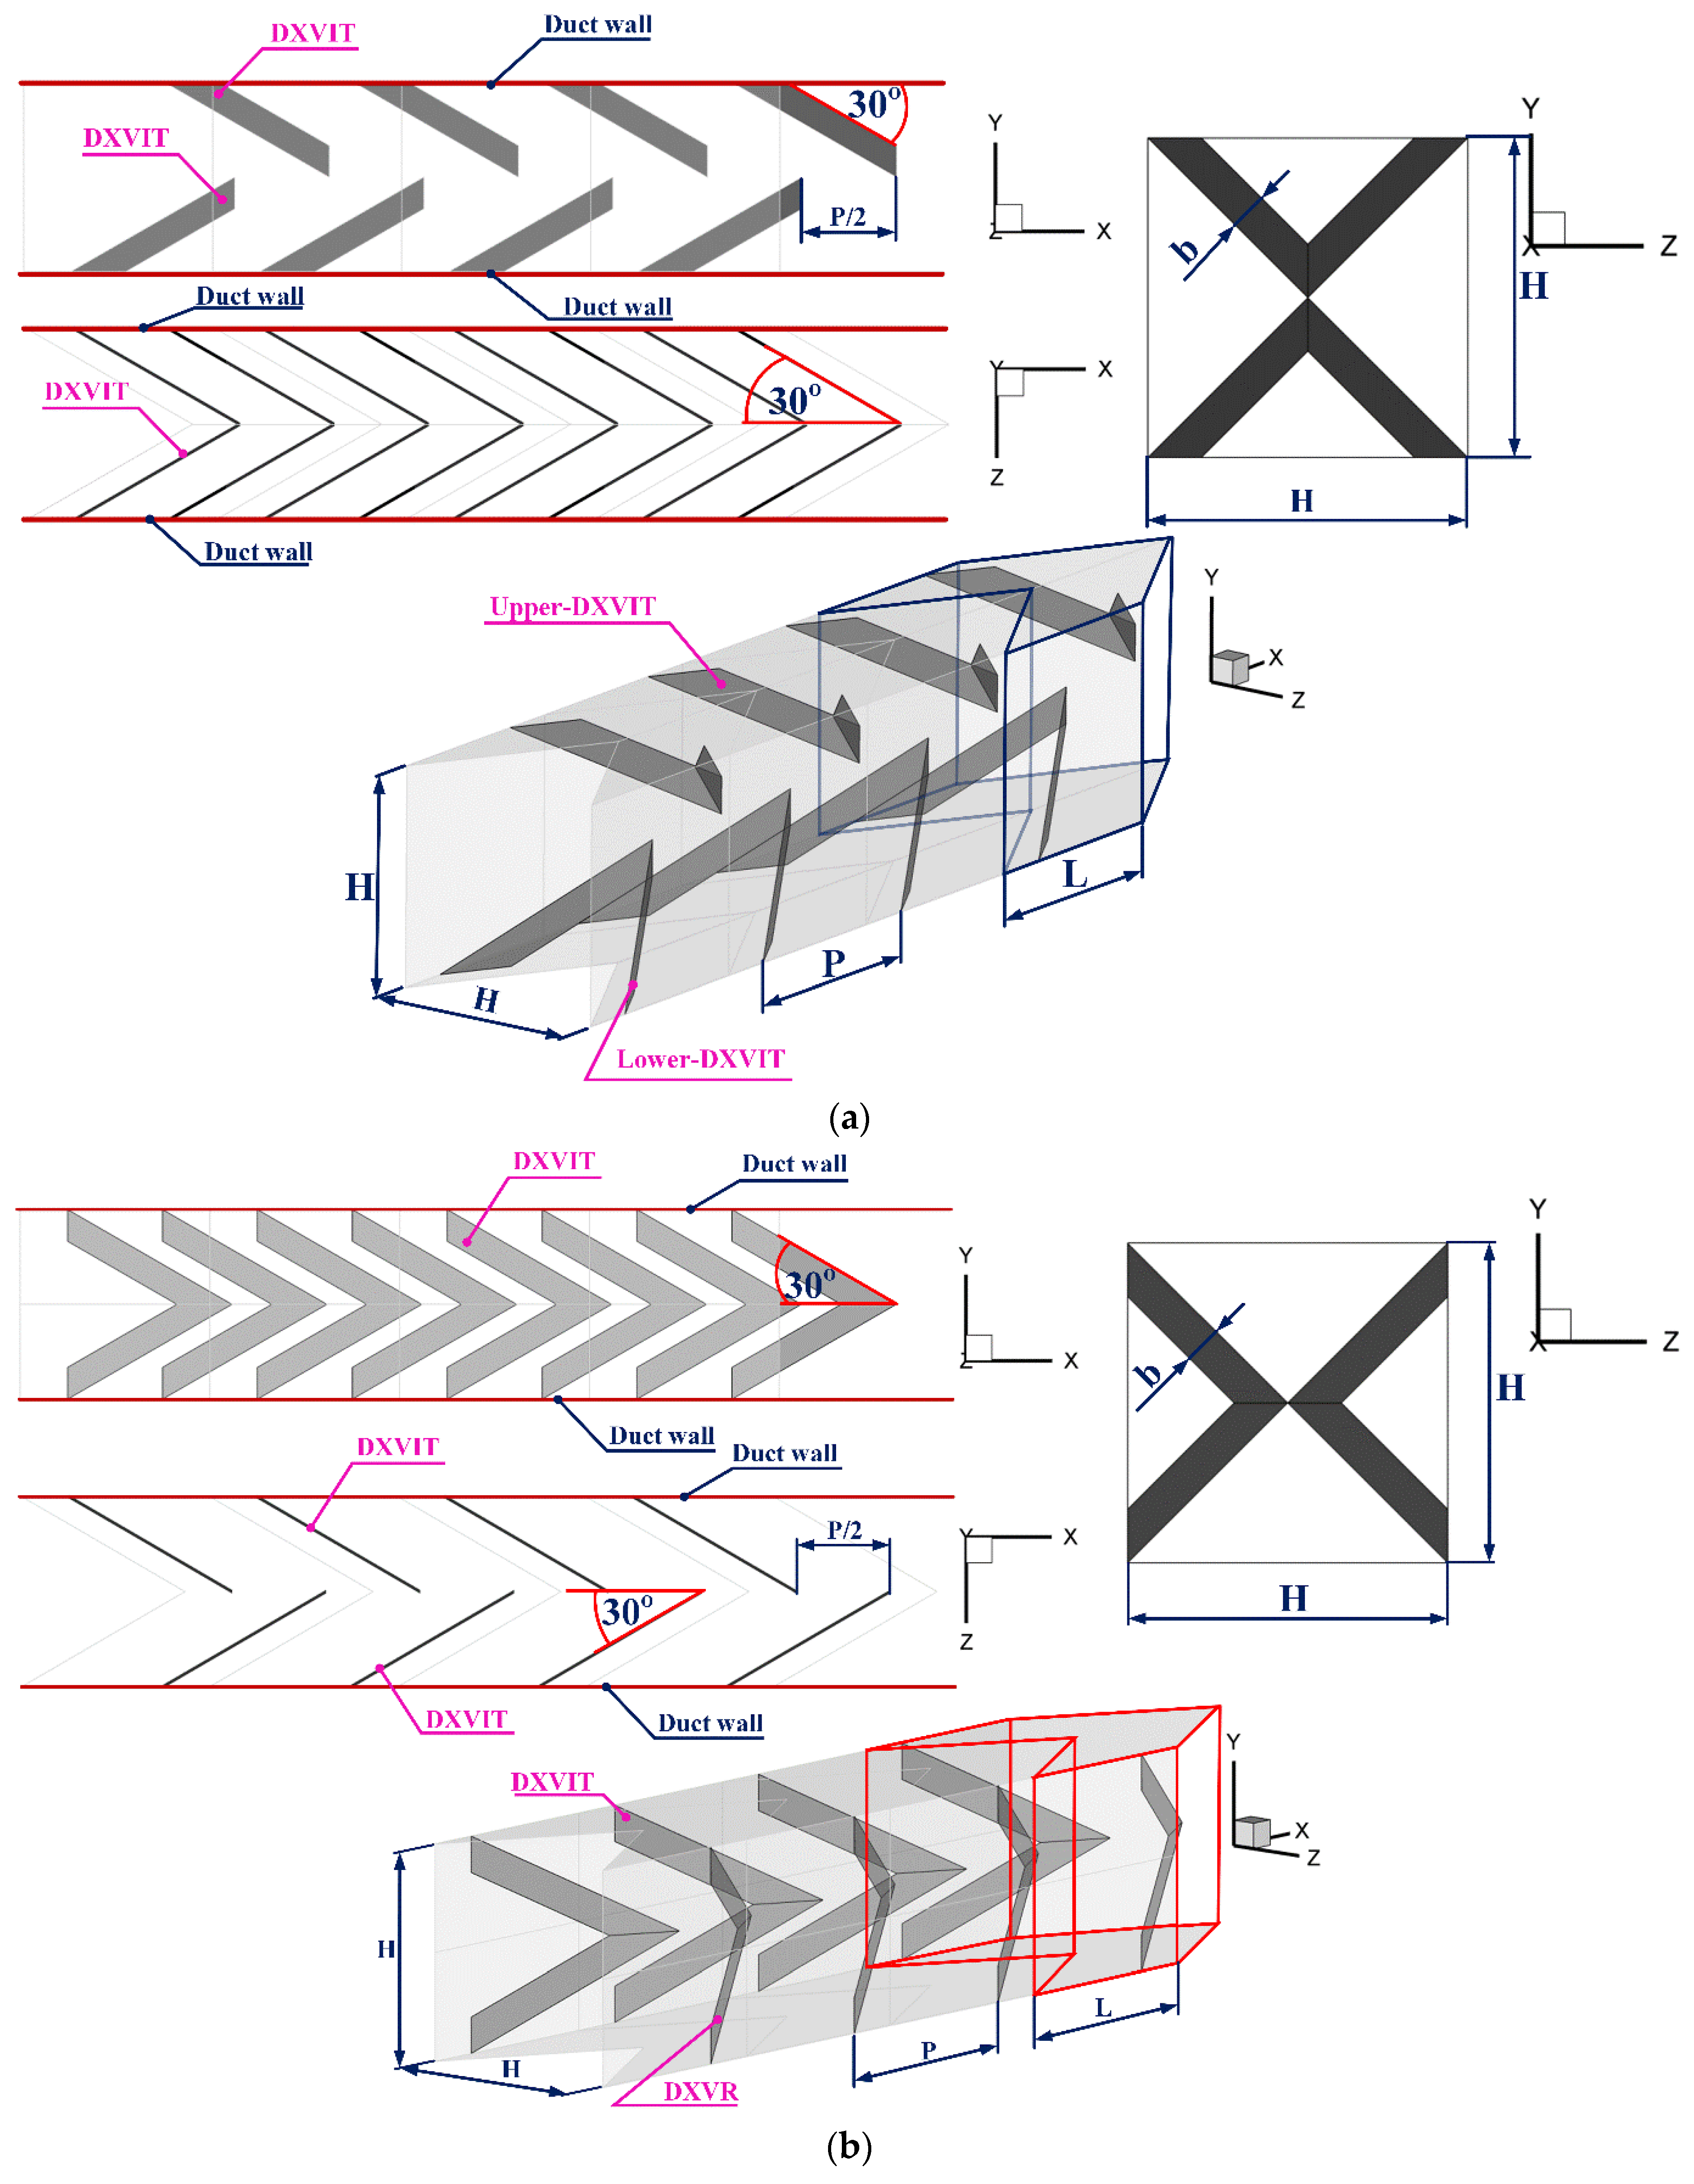
2. Physical Configuration of a Square Duct Heat Exchanger (SQHX) Equipped with DXVIT and Boundary Condition

Figure 1a,b presents the heat exchanger system used in this study. The system under investigation is a square duct heat exchanger (SQHX) with two types of DXVIT, referred to as Type 1 and Type 2. The DXVIT is developed from the V-baffle, which is known for its high heat transfer enhancement efficiency, combined with an orifice structure that provides strength and durability when installed in real heat exchanger systems. The discrete configuration of the DXVIT is selected to reduce the pressure drop that may increase when vortex generators are installed in practical heat exchangers. The thickness of the DXVIT is represented by b, while the height of the SQHX or the side length of the SQHX is denoted by H, which is 0.05 m. The hydraulic diameter of the SQHX is also H. The b/H ratio (the ratio of DXVIT thickness-to-SQHX height, blockage ratio (BKRT)) is set at 0.05, 0.10, 0.15, and 0.20. The distance between DXVITs is denoted by P, and the P/H ratio (the ratio of DXVIT spacing-to-SQHX height, pitch ratio (PRT)) is set at 1, 1.5, and 2. The flow attack angle of the DXVIT is fixed at 30° for all cases. Since this heat exchanger system represents a long duct in real heat exchanger applications, the model is designed in modules. The module length (L) is set to H, 1.5 H, and 2 H, corresponding to P/H values of 1, 1.5, and 2, respectively. The study investigates the effects of flow direction in both the +x and -x directions under turbulent flow conditions, with Reynolds numbers (Re) ranging from 3000 to 16,000, calculated at the SQHX inlet.
The model for this study was developed using a non-uniform mesh with a refined grid near the heat transfer surface, where the mesh density is higher than in other regions. A hexahedral grid was selected as it is well-suited for studying flow and heat transfer in heat exchanger tubes for this research model. The y+ value for the model is approximately 1 in all case studies, following the recommendations for numerical modeling [21].
The boundary conditions for the developed model are specified as follows. At the inlet and outlet planes of the model, periodic conditions [21] are applied to both flow and heat transfer. The use of periodic conditions represents a long-tube heat exchanger system used in industrial plants. The flow and heat transfer behave as fully developed when periodic boundary conditions are applied, and there is no need to create an inlet with a length 10 times the hydraulic diameter for this model. The walls of the SQHX are defined with a constant heat flux, with values ranging from 800 to 1000 W/m2. The thermal properties are assumed to change very little, so they can be approximated as constant. The DXVIT component is defined to have no heat conduction or a heat flux of zero, as the focus is on enhancing the heat convection rate. In real industrial applications, the DXVIT can be modified to include thermal conductivity by using materials with heat conduction properties, which would contribute to increasing the heat transfer rate in the system. However, initial calculations suggest that the heat conduction would be much smaller than the convection heat transfer in the system. All walls are set to no-slip conditions.

3. CFD Model

Referred from Ref. [22], the scope of the research, including the hypotheses for this study, is presented as follows:
  • The flow and thermal configuration are thought to be three-dimensional (3D heat and fluid flow) and constant.
  • The flow is considered incompressible, and the flow regime is turbulent. The Reynolds number is evaluated based on the conditions at the inlet of the SQHX.
  • The working fluid used in the SQHX is air. The temperature variation of the air during the test does not exceed 20 Kelvin/Celsius. Therefore, the thermal properties of the fluid change very little and can be considered constant throughout the test.
  • Body forces and viscous dissipation are not considered in the current study.
  • Only forced convection inside the SQHX is examined in this heat transfer study because the effects of conduction, natural convection, and thermal radiation are insignificant.
From the details of the study presented above, the equations related to this research are as follows:
Continuity equation:
x i ρ u i = 0
Momentum equation:
x i ρ u i u j = p x i + x j μ u i x j ρ u i u j ¯
where ρ, ui, p, µ, and u′ represent air density, mean component of velocity (in the direction xi), pressure, dynamic viscosity, and fluctuating component of velocity, respectively.
Energy equation:
x i ρ u i T = x j Γ + Γ t T x j
where Γ represents molecular thermal diffusivity, while Γt is turbulent thermal diffusivity, and are calculated by
Γ = μ / P r   and   Γ t = μ t / P r t
The Reynolds-averaged approach to turbulent modeling involves that the Reynolds stresses, ρ u i u j ¯ in Equation (2), be modeled. Equation (5) displays that the Boussinesq hypothesis relates the Reynolds stresses to the mean velocity gradients:
ρ u i u j ¯ = μ t u i x j + u j x i 2 3 ρ k + μ t u i x i δ i j
where the turbulent kinetic energy, k, is defined by k = ( u i u i ¯ ) / 2 and δ i j is a Kronecker delta. A benefit of the Boussinesq approach is the relatively low computational cost related to the computation of the turbulent viscosity μ t given μ t = ρ C μ k 2 / ε . The RNG kε model is an example of the two-equation models that use the Boussinesq hypothesis. The RNG kε model is derived from the instantaneous Navier–Stokes equation with the “renormalization group” (RNG) method. The steady-state transport equations are stated as
x i ρ k u i = x j α k μ e f f k x j + G k ρ ε
x i ρ ε u i = x j α k μ e f f ε x j + C 1 ε ε k G k C 2 ε ρ ε 2 k R ε
The α k means the inverse effective Prandtl number for k, while α ε stands for ε . C 1 ε and C 2 ε remain constants. The effective viscosity μ e f f is printed as follows:
μ e f f = μ + μ t = μ + ρ C μ k 2 ε
where C μ is constant and identical to 0.0845.
The governing equations were discretized using the QUICK numerical scheme, decoupled with the SIMPLE algorithm, and solved with a finite volume approach (commercial code/program). When the normalized residual values for all variables were less than 10−5 and for the energy equation less than 10−9, the solutions were taken to be convergent. The Reynolds number, friction factor, local Nusselt number, average Nusselt number, and thermal performance enhancement factor are given by Equations (9)–(13), respectively:
R e = ρ u ¯ D h μ
f = Δ p / L D h 1 / 2 ρ u ¯ 2
Nux represents the local Nusselt number, which is directly proportional to the local heat transfer coefficient, hx, and the hydraulic diameter, Dh, but inversely proportional to the thermal conductivity coefficient, k, as shown in the equation.
N u x = h x D h k
The average Nusselt number, Nu, is obtained by averaging the local Nusselt number, Nux, over the considered heat transfer surface area, A.
N u = 1 A N u x d A
The thermal enhancement factor (TEF) is a variable used to analyze the effectiveness of installing DXVIT. It compares the thermal advantage of the heat exchanger system while considering the same pump power.
T E F = h h 0 p p = N u N u 0 p p = N u / N u 0 f / f 0 1 / 3
where Nu0 and f0 stand for the Nusselt number and friction factor for the smooth SQHX, respectively.

4. Numerical Validation

According to the standards of research studies using numerical models, the developed model must undergo verification and validation. Model validation is an important step that leads to reliable and accurate results, which can be used as references. For numerical studies of flow and heat transfer in turbulent flow conditions, it is necessary to validate the model through three important steps: validating the empty SQHX, verifying the independent grid number, and comparing the results of the model study with experimental results or previously published studies.

4.1. Smooth SQHX Validation

Figure 2 shows the comparison between the Nusselt number and friction factor for this study and the values obtained from the correlation [23]. From the figure, it can be observed that the f0 value tends to decrease as the Re value increases, while the Nu0 value tends to increase with an increase in Re. The results from both parts follow the same trend, with the largest difference being 6% for f0 and 1.575% for Nu0.

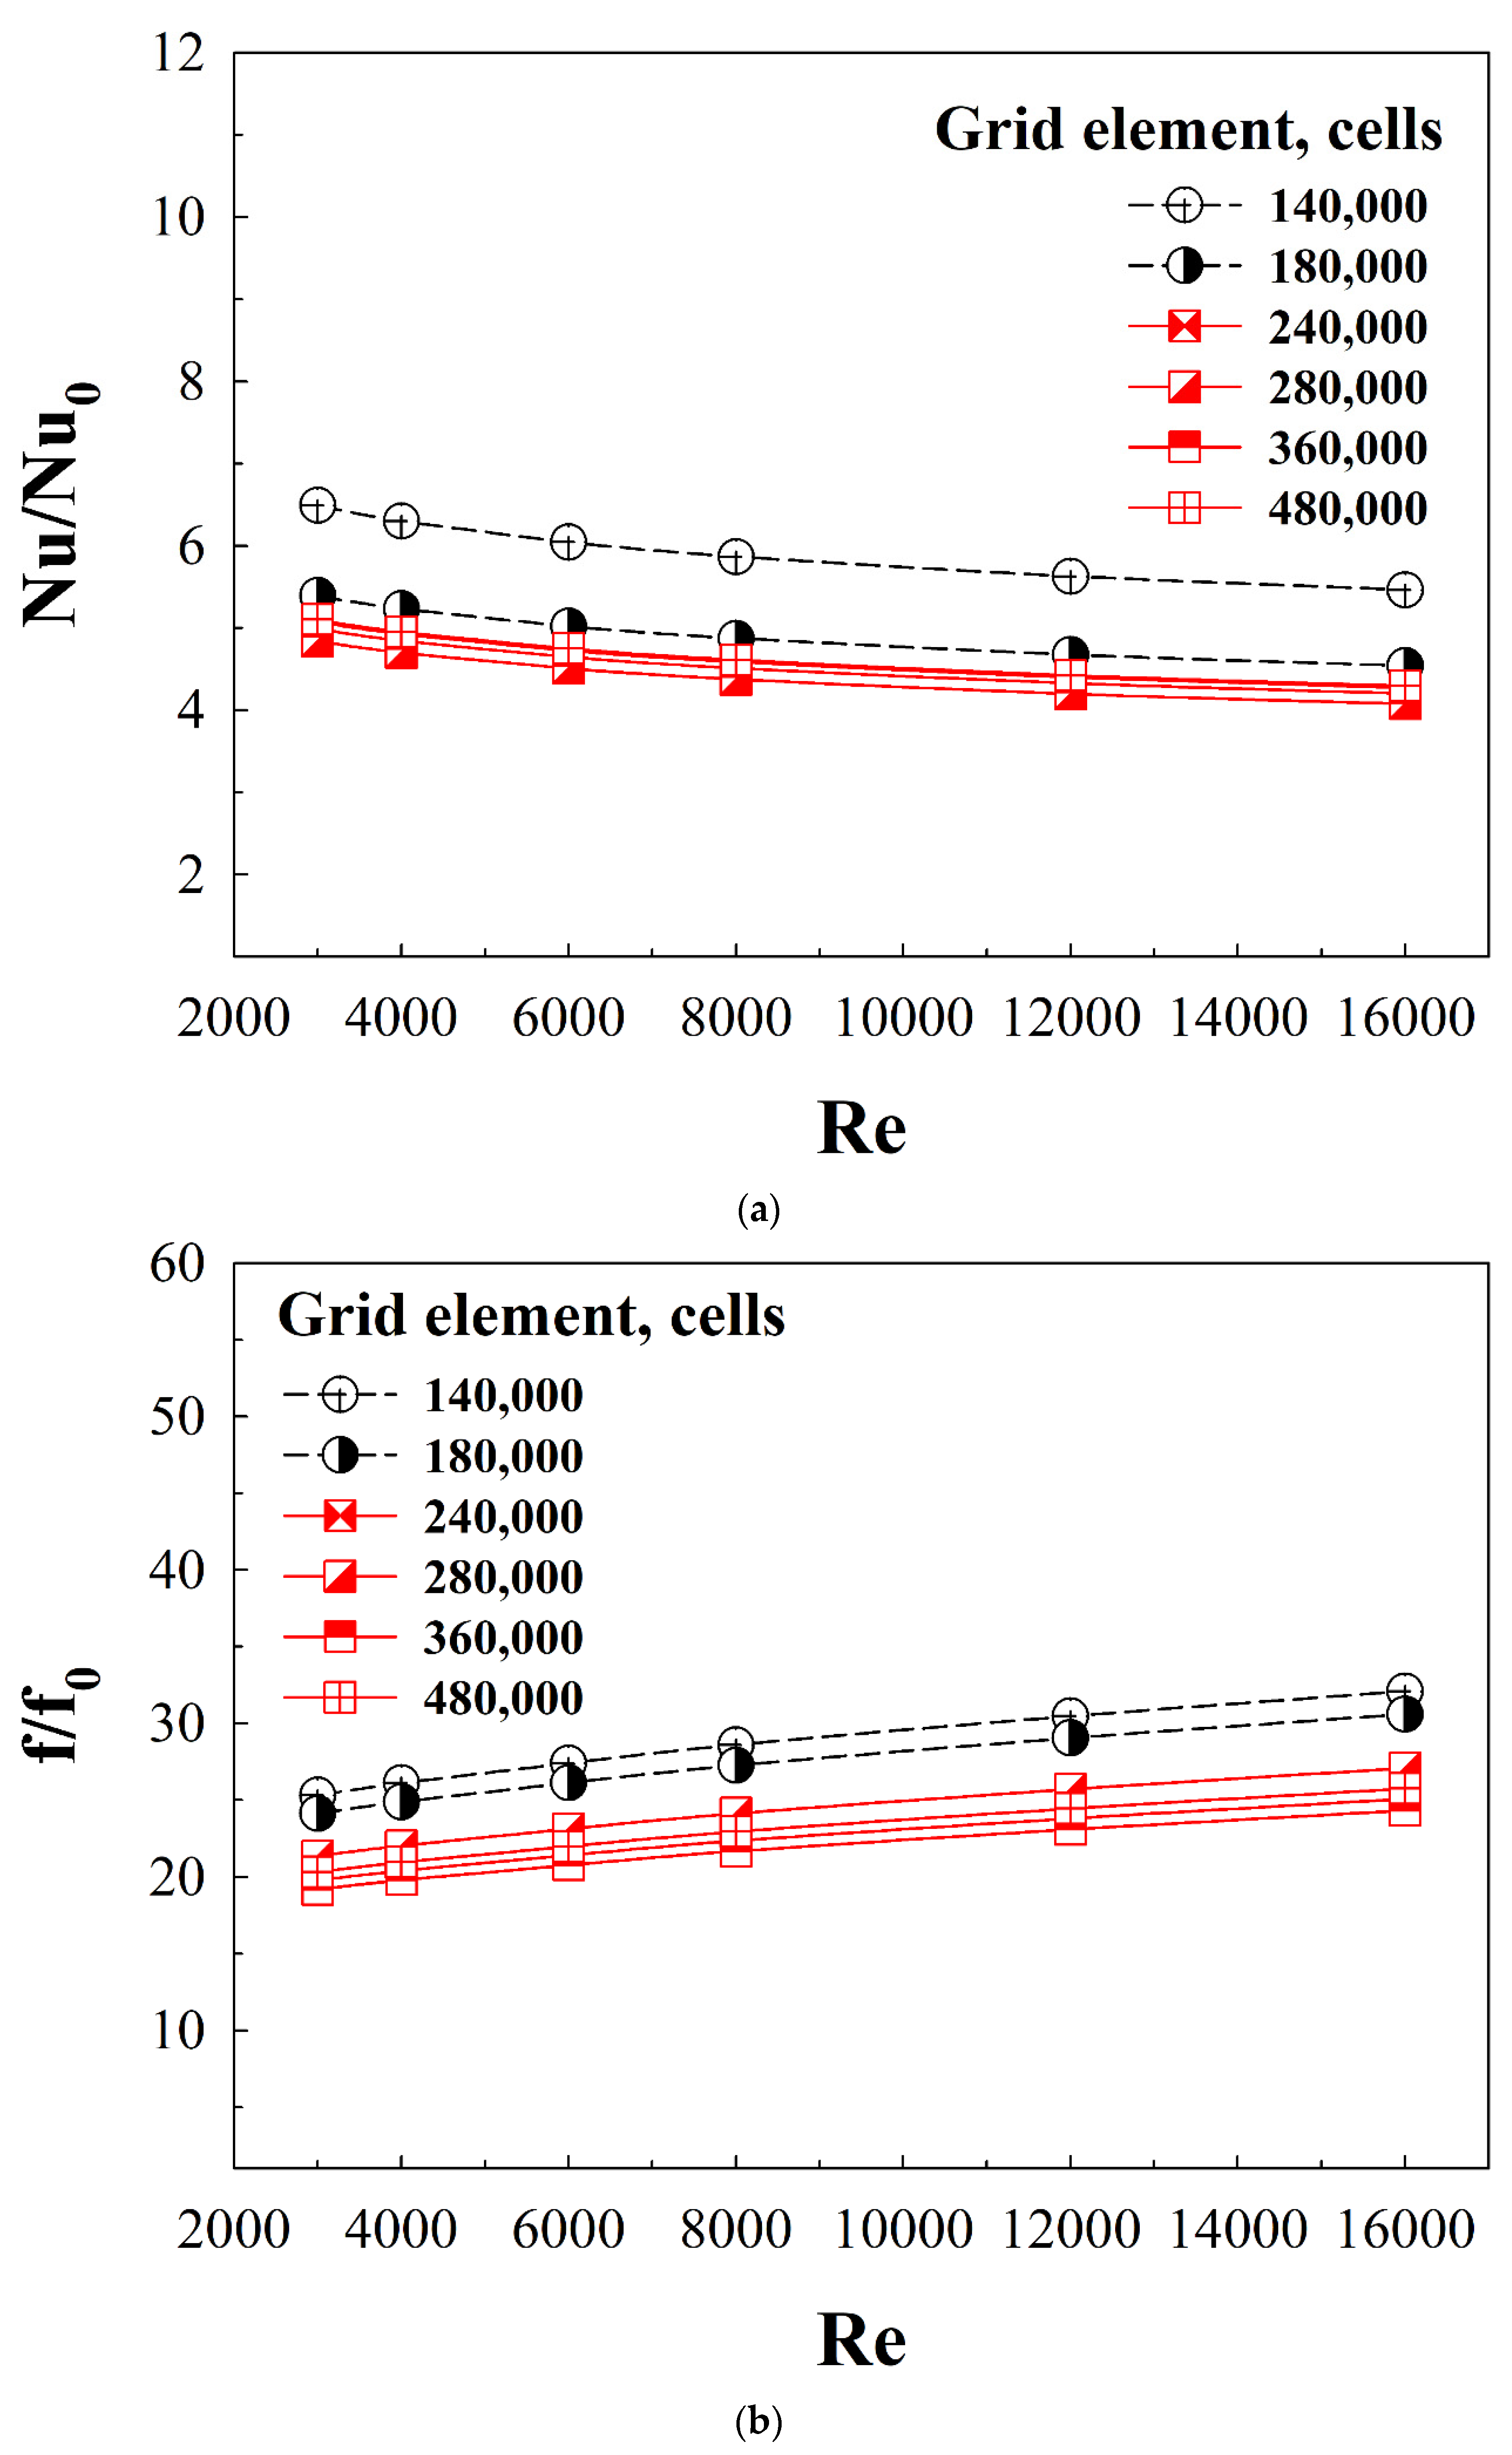
4.2. Grid Independence

Figure 3a,b shows the comparison of the developed model with different grid numbers, specifically 6 values, for Nu/Nu0 and f/f0, respectively. The selected grid numbers for the model include 140,000, 180,000, 240,000, 280,000, 360,000, and 480,000. From the figure, it can be observed that the grid number of 140,000 yields a Nu/Nu0 value that is significantly different from the other grid numbers. When considering the f/f0 value, it was found that the grid numbers 140,000 and 180,000 yield results that are clearly different from models with higher grid numbers. In this case, both Nu/Nu0 and f/f0 must be taken into account. Therefore, the model for this research selects a grid number of 240,000, which provides Nu/Nu0 and f/f0 values close to those from models with larger grid numbers, with the largest difference in Nu/Nu0 being 3% and the largest difference in f/f0 being 8%. Choosing the appropriate grid number not only helps validate the accuracy of the results from the study but also helps reduce the resources required for the study and the time needed for data collection.

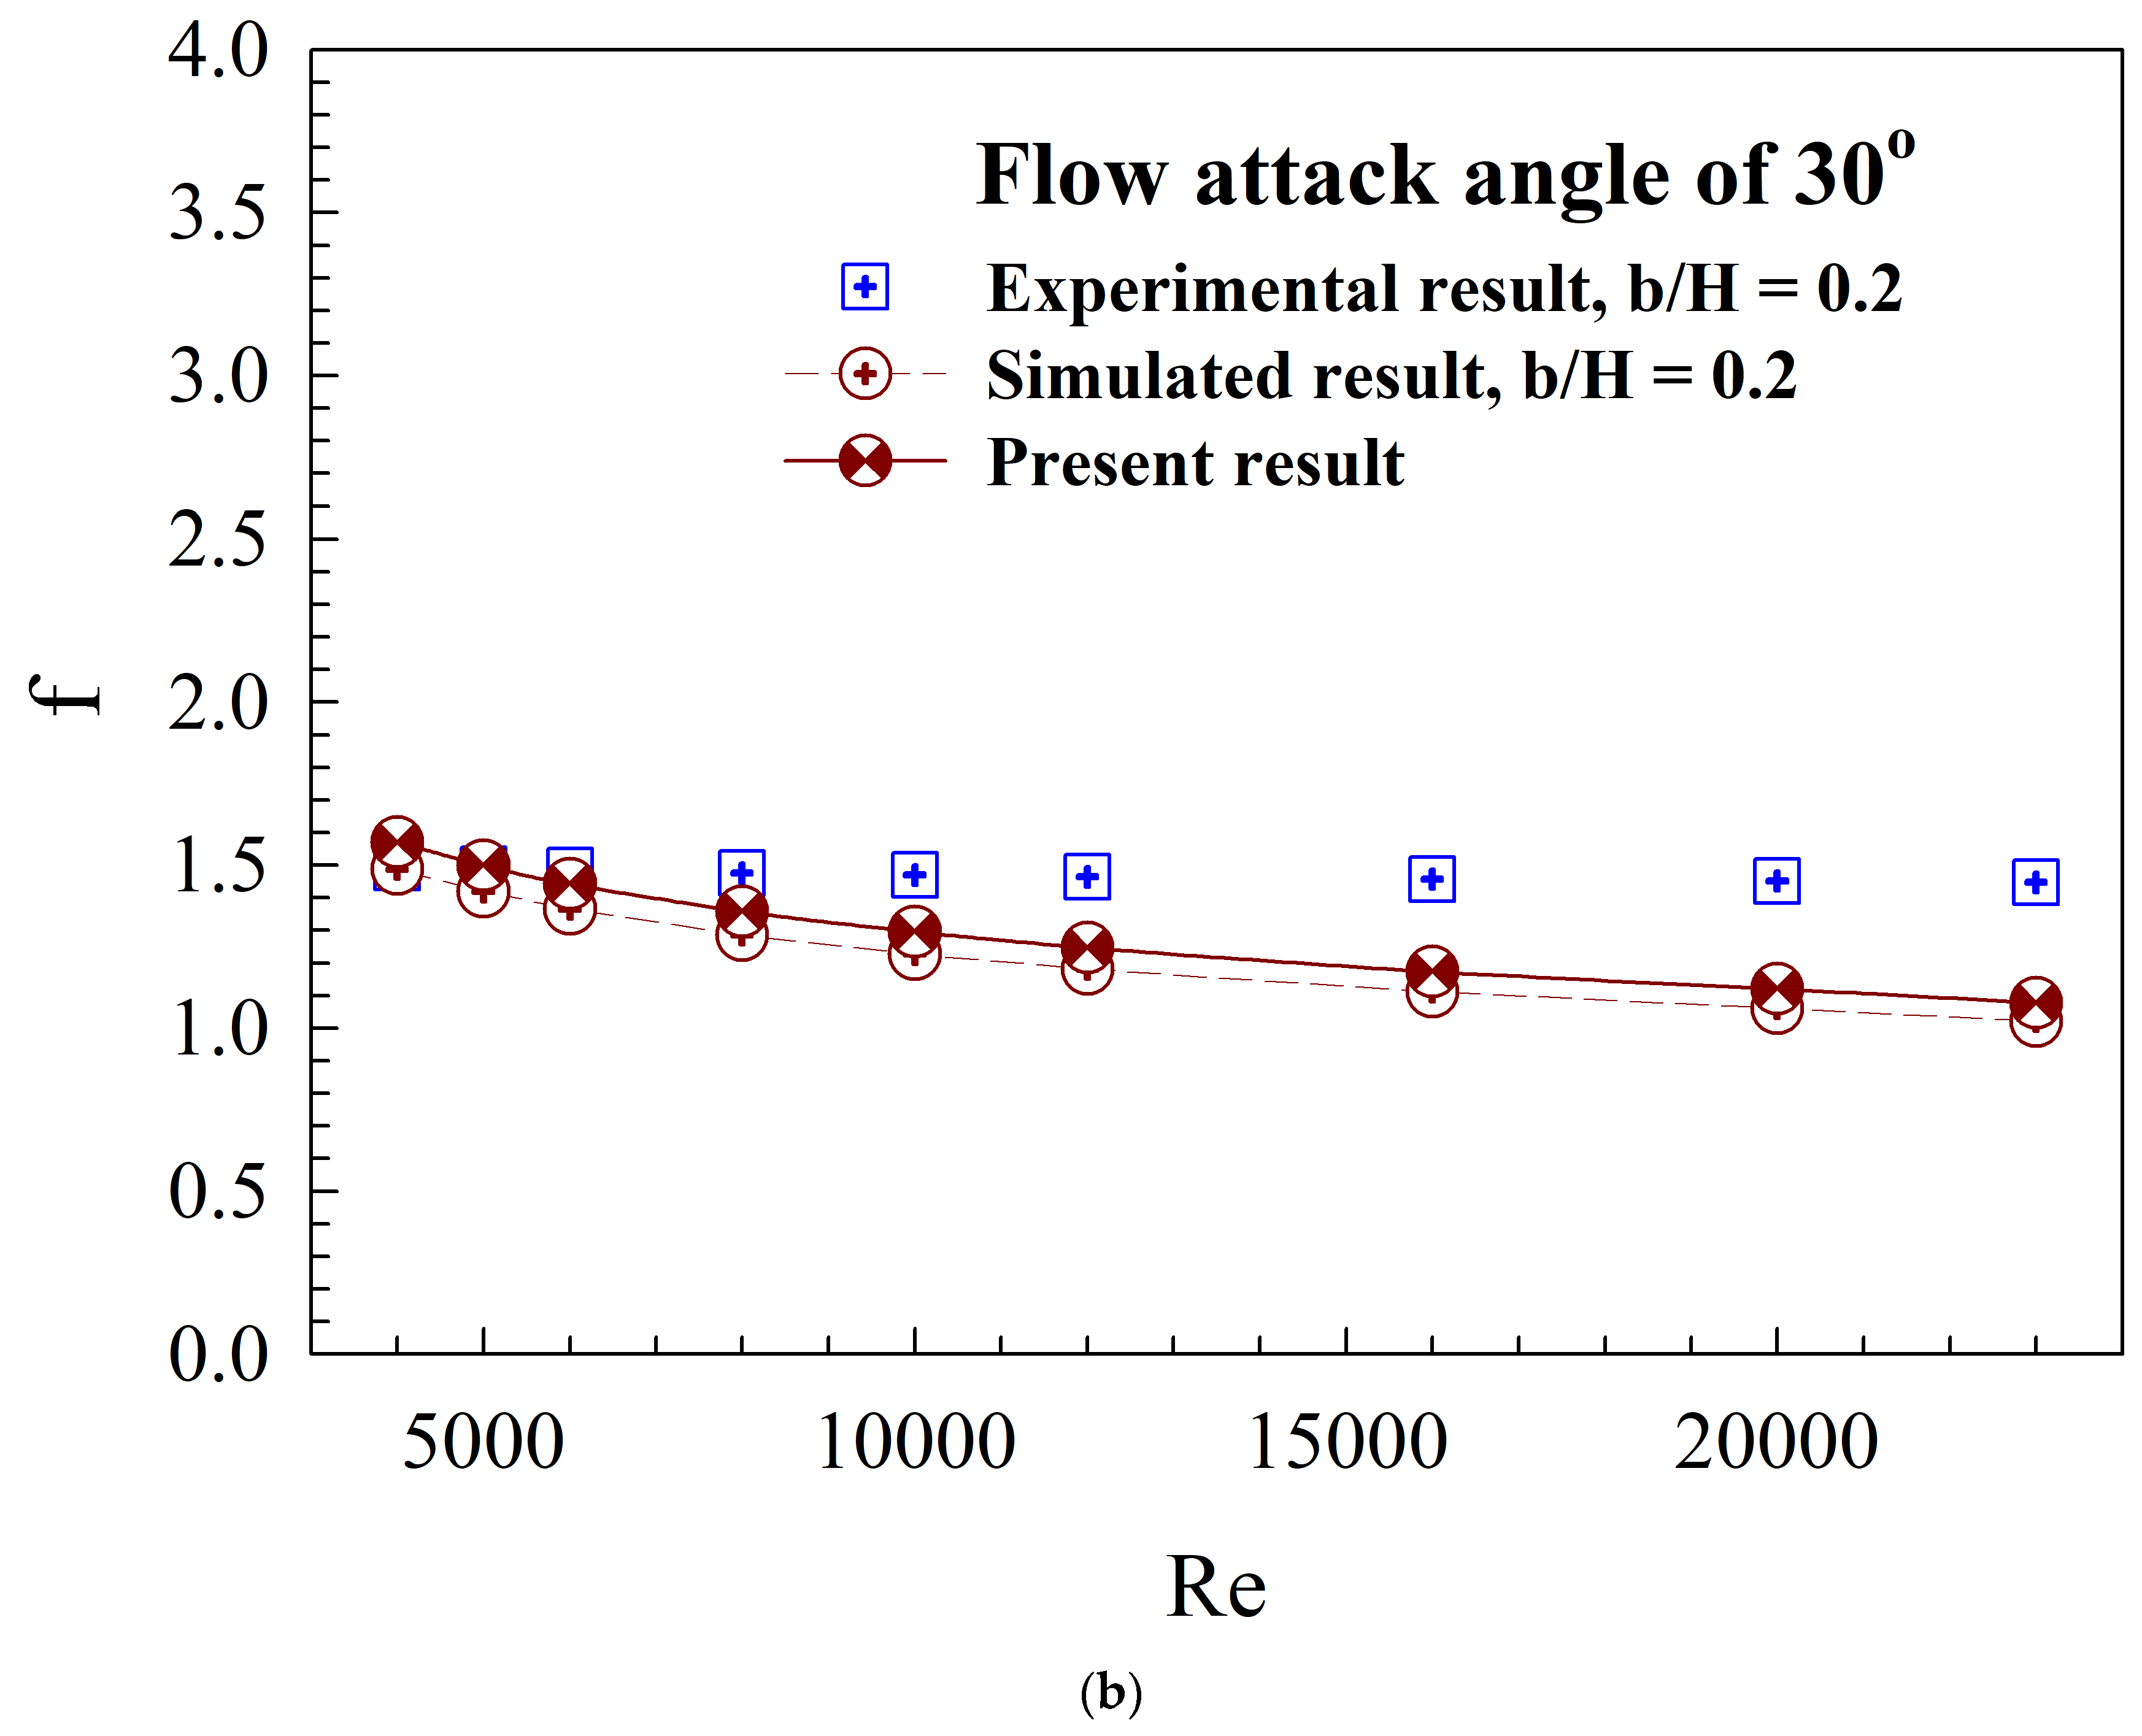
4.3. Validation of the Experimental Result

Figure 4a,b shows the comparison between the developed model and previously published research [24]. This comparison is made because the previous research did not include the creation of a DXVIT. Therefore, a vortex flow generator with similar characteristics was chosen for the comparison. The modeling approach and the assignment of boundary conditions are similar to those used in the current research. The figure shows that the Nu value tends to increase as the Re value increases, while the f value tends to decrease as the Re value increases. The trend is the same for both the current model and the previous research [24]. The largest difference in Nu is 8.21%, while the largest difference in f is 14.30%. The greatest differences are found at a Re value of 24,000 or at higher Re values. From the results of this phase, it can be concluded that the developed numerical model is sufficiently reliable for studying the effects of changes in flow and heat transfer. The results are realistic and similar to experimental data, allowing for significant cost savings in research studies. Additionally, the model helps explain the flow behavior and heat transfer, which is important for the future development of heat exchanger systems.

5. Results and Discussion

The results from the study can be divided into two main parts. Part 1 is used to explain the flow structure and thermal behavior occurring in the SQHX when the DXVIT is installed. This part is important as it will provide guidelines for further development of heat exchange systems. Part 2 presents heat transfer values, pressure, and thermal performance in terms of dimensionless variables for easier comparison with other research or heat exchange systems. The heat transfer values are presented in the form of the Nusselt number, the pressure in the SQHX is presented as a friction factor, and the thermal performance is presented as the thermal enhancement factor.

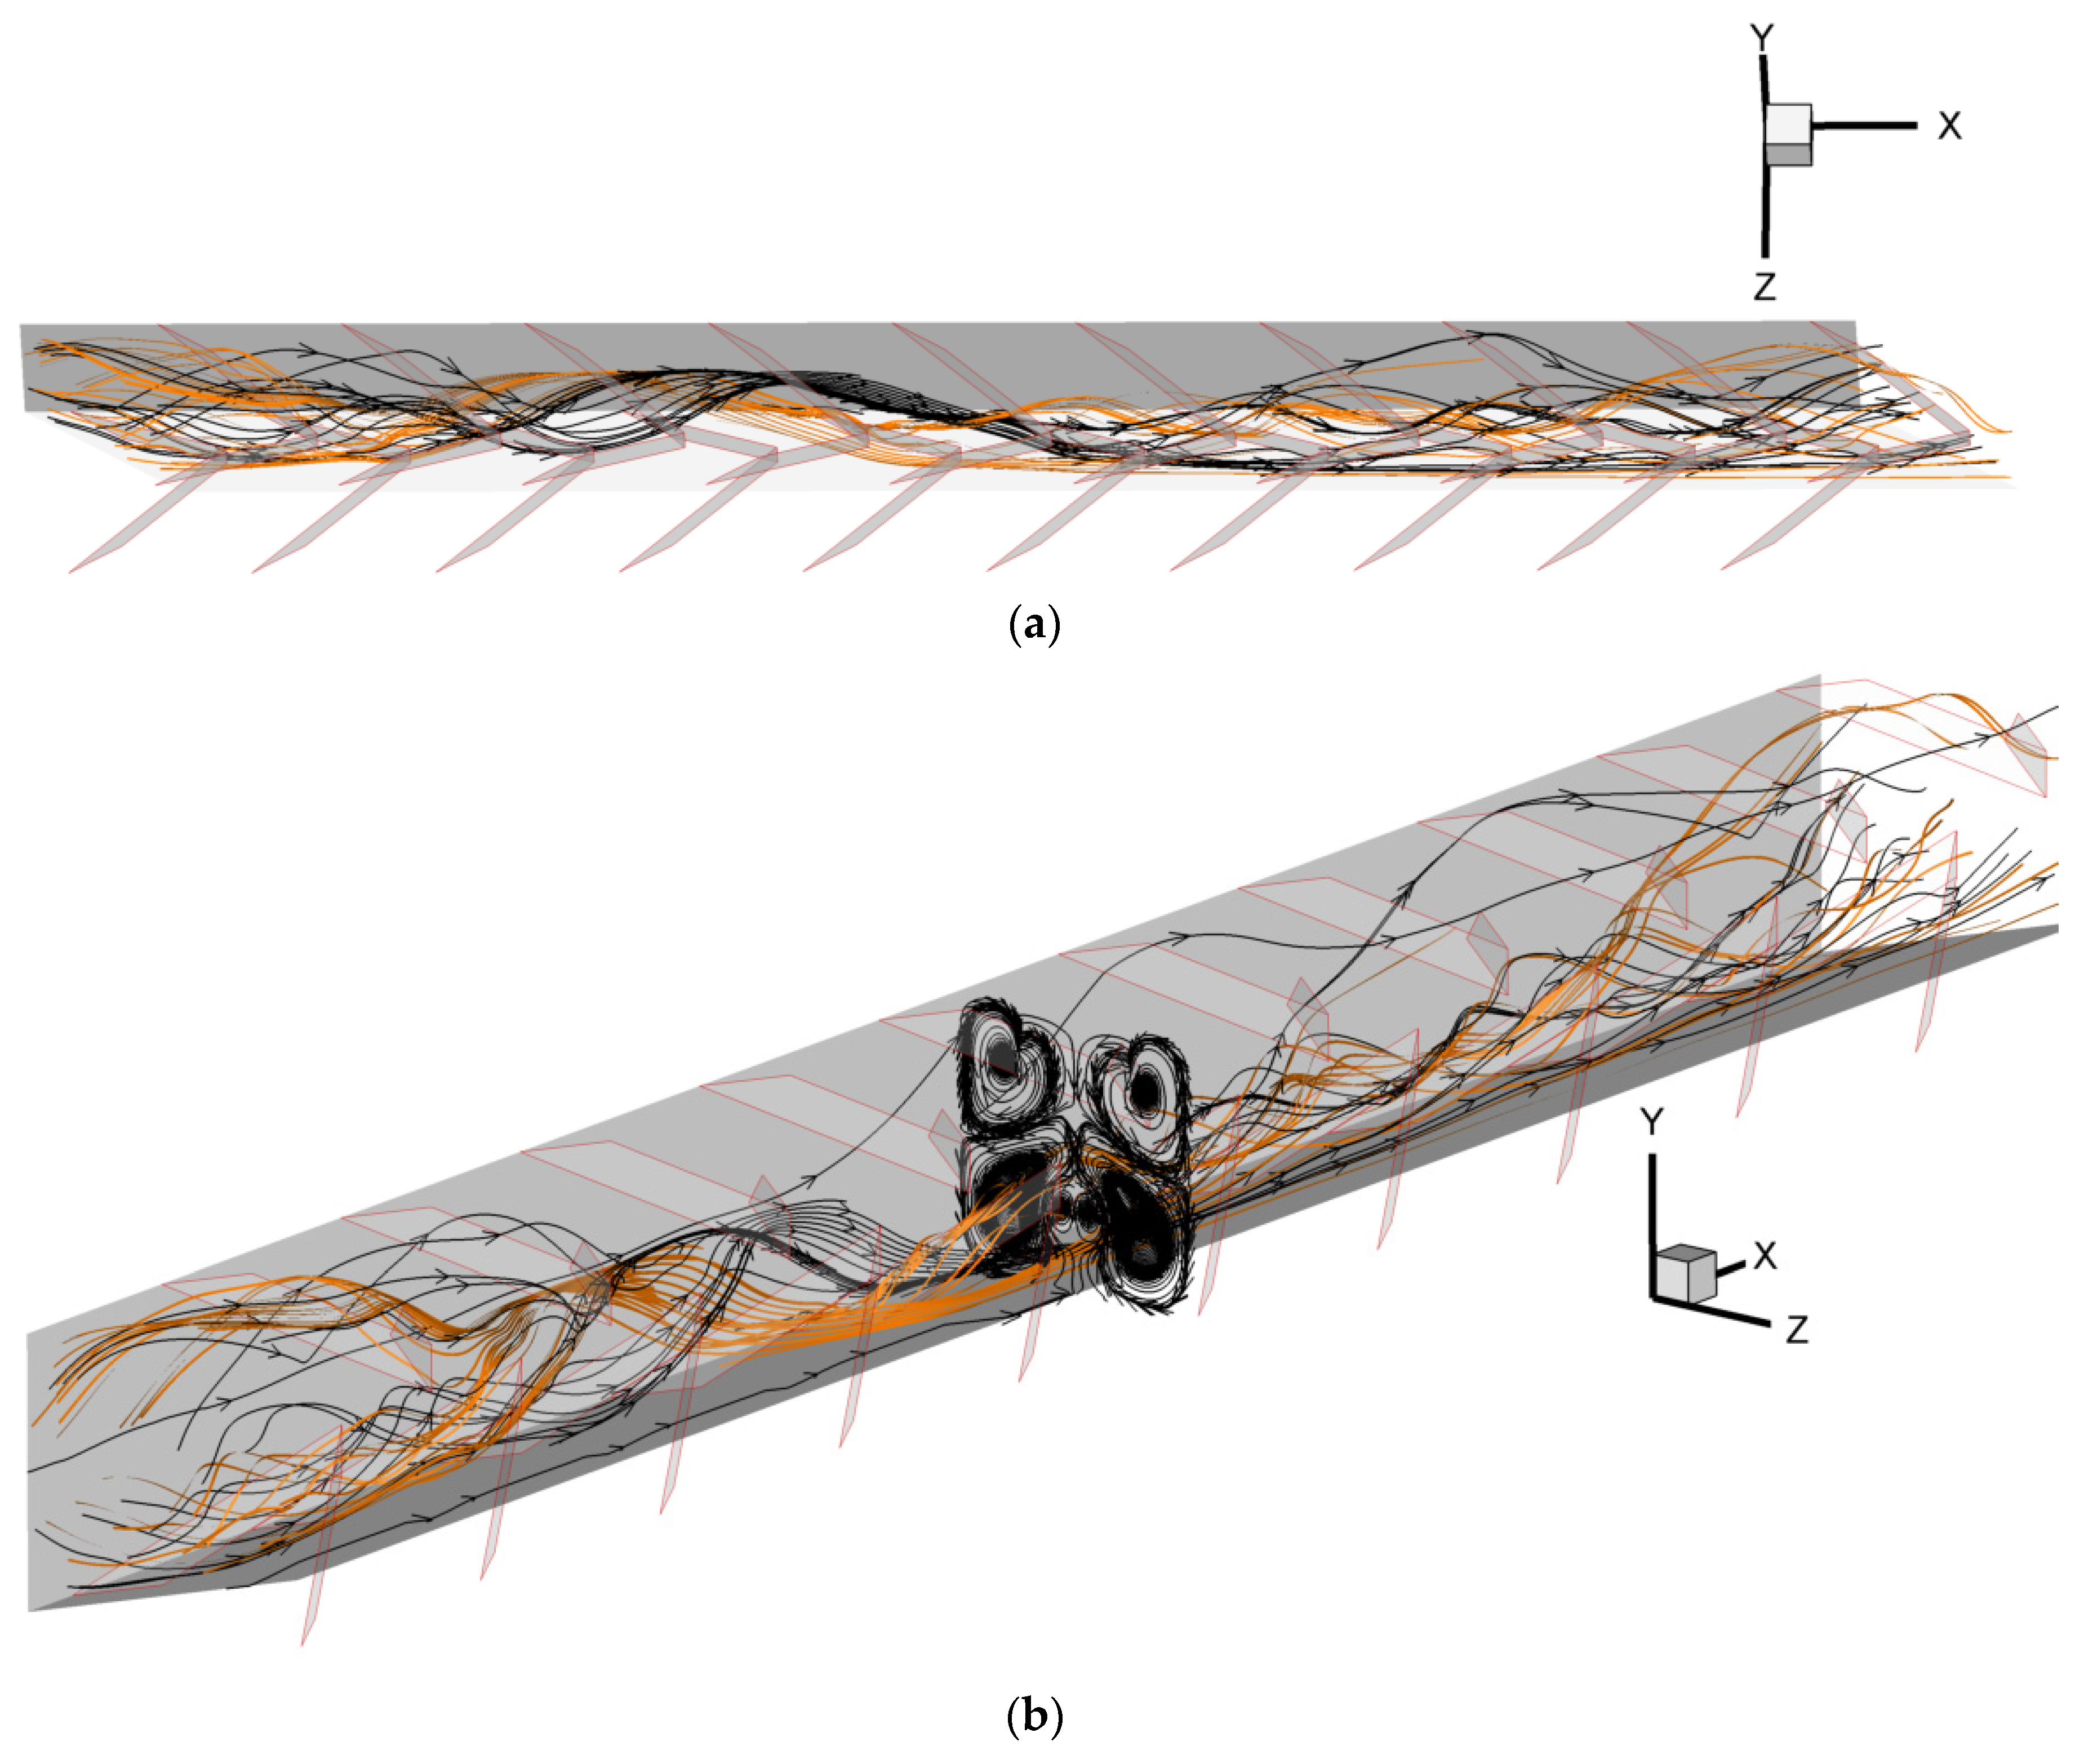
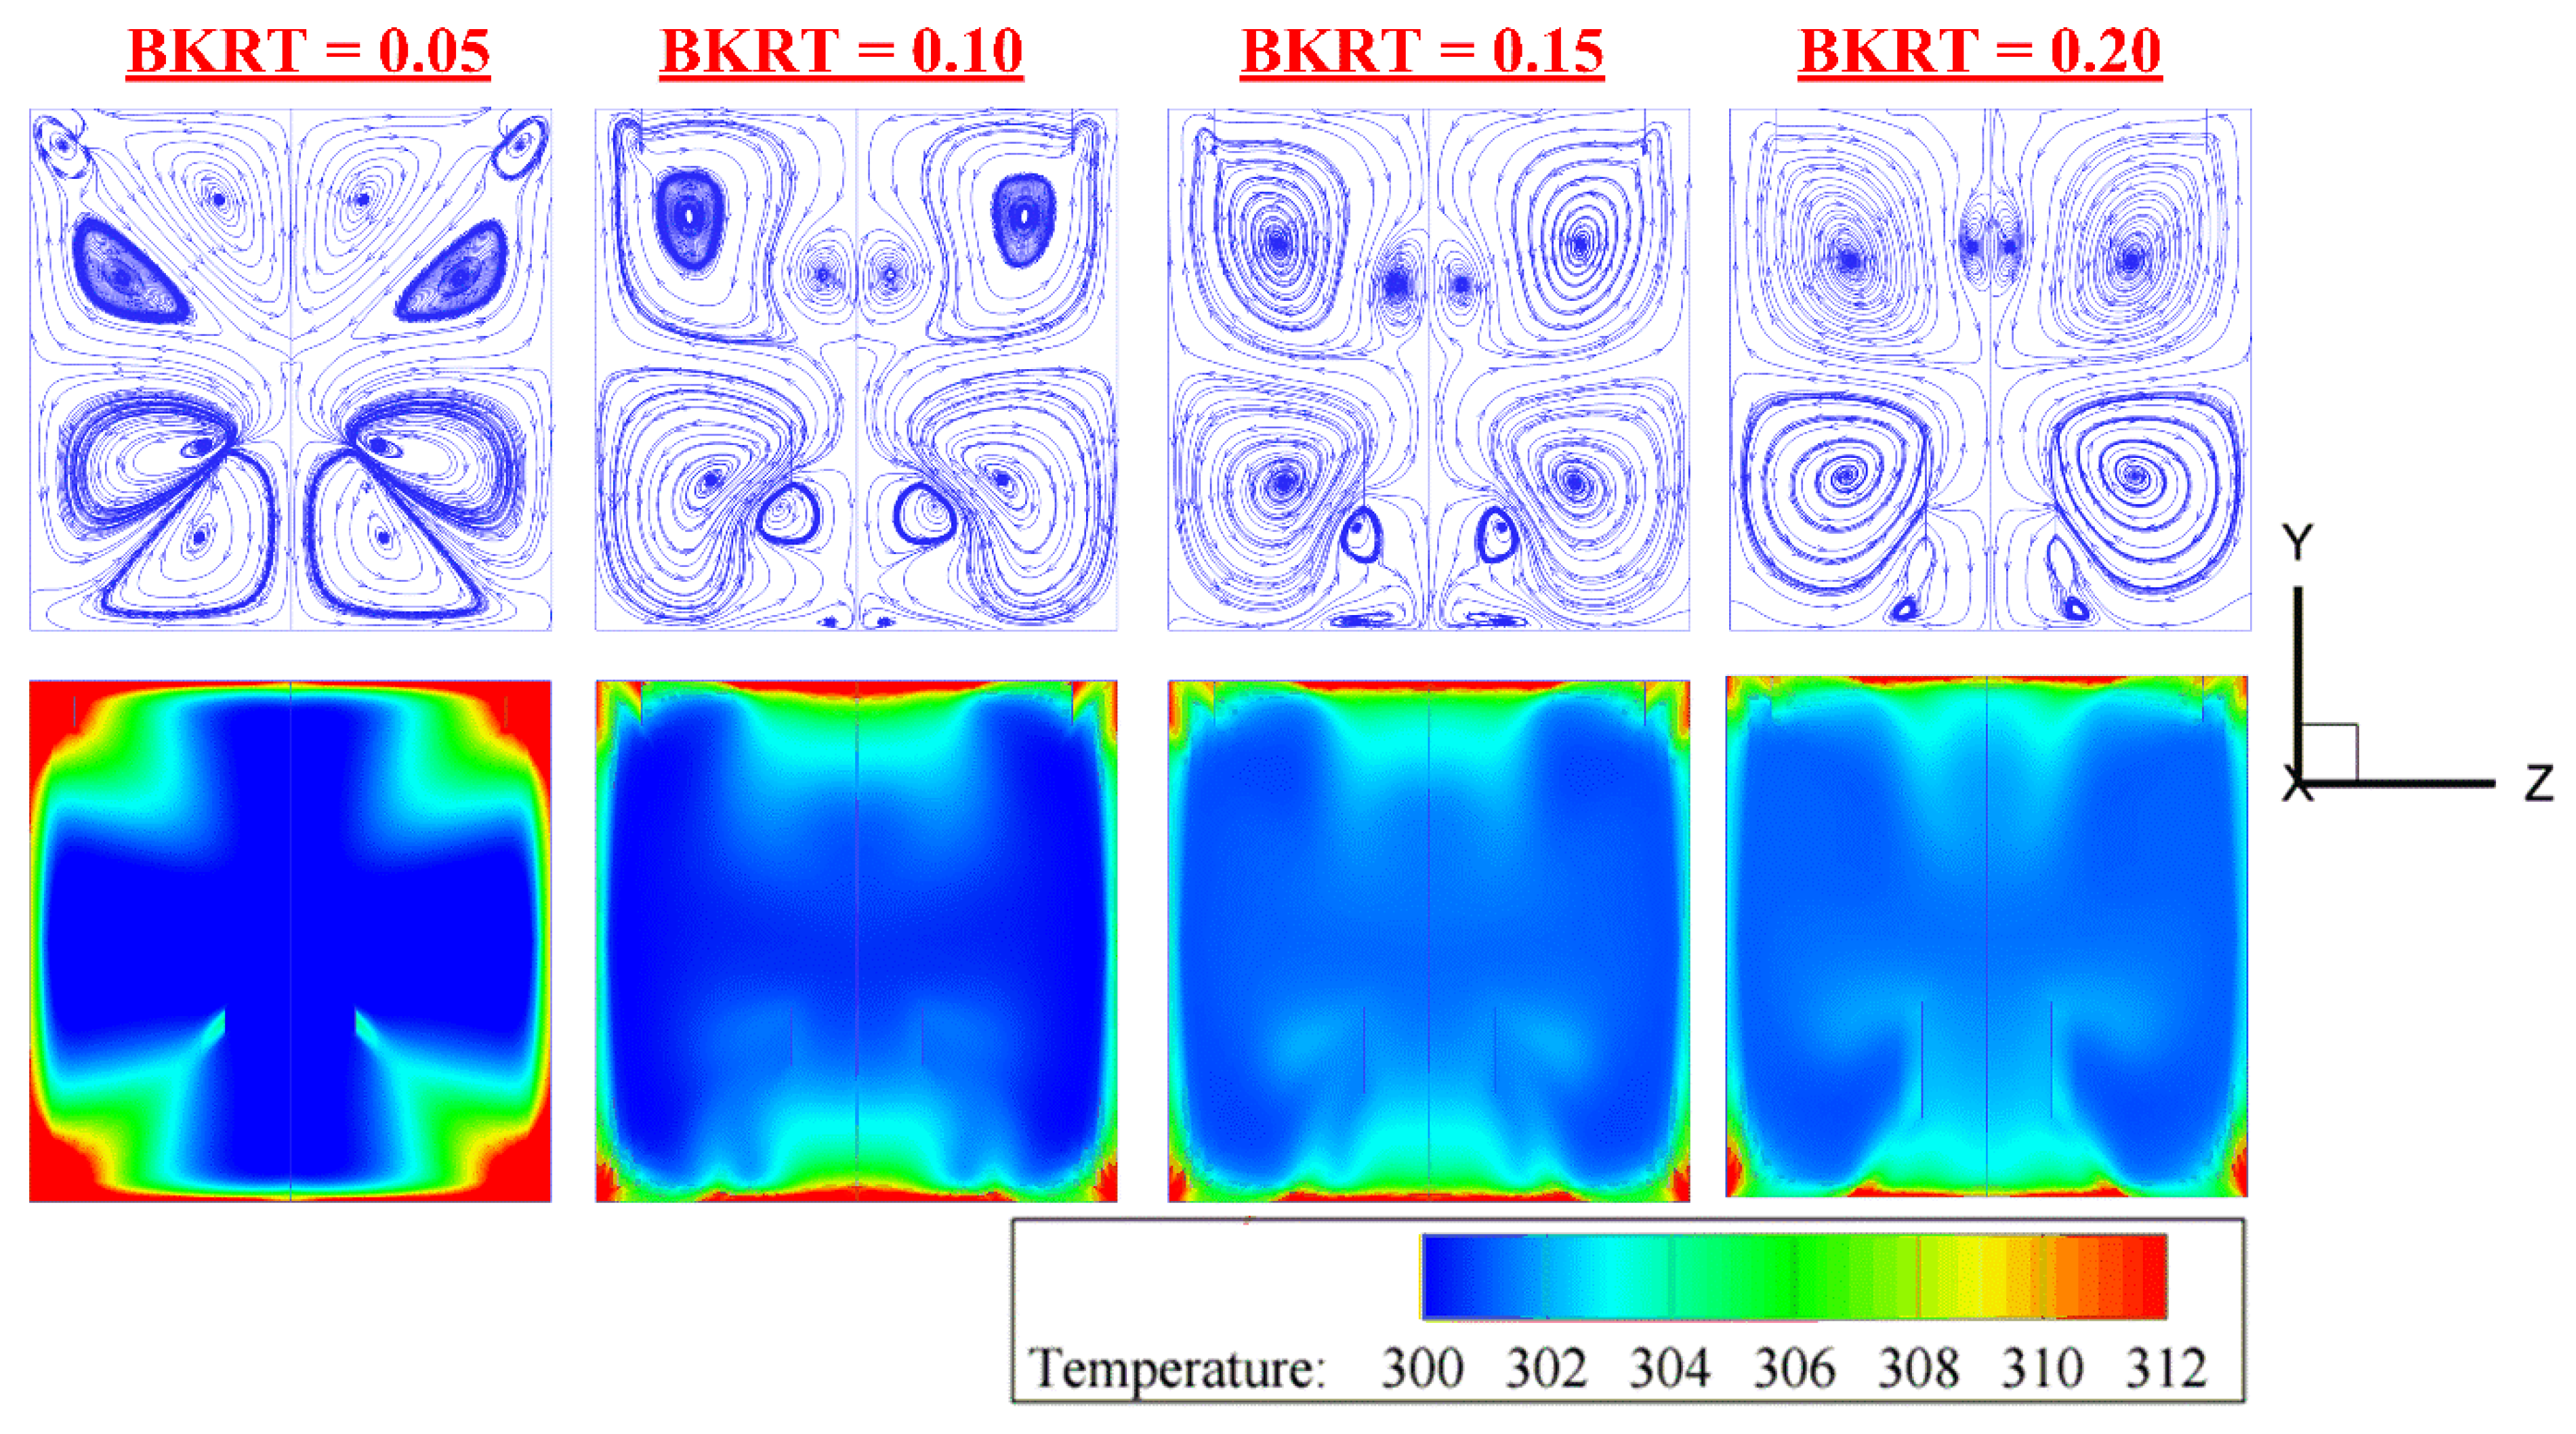
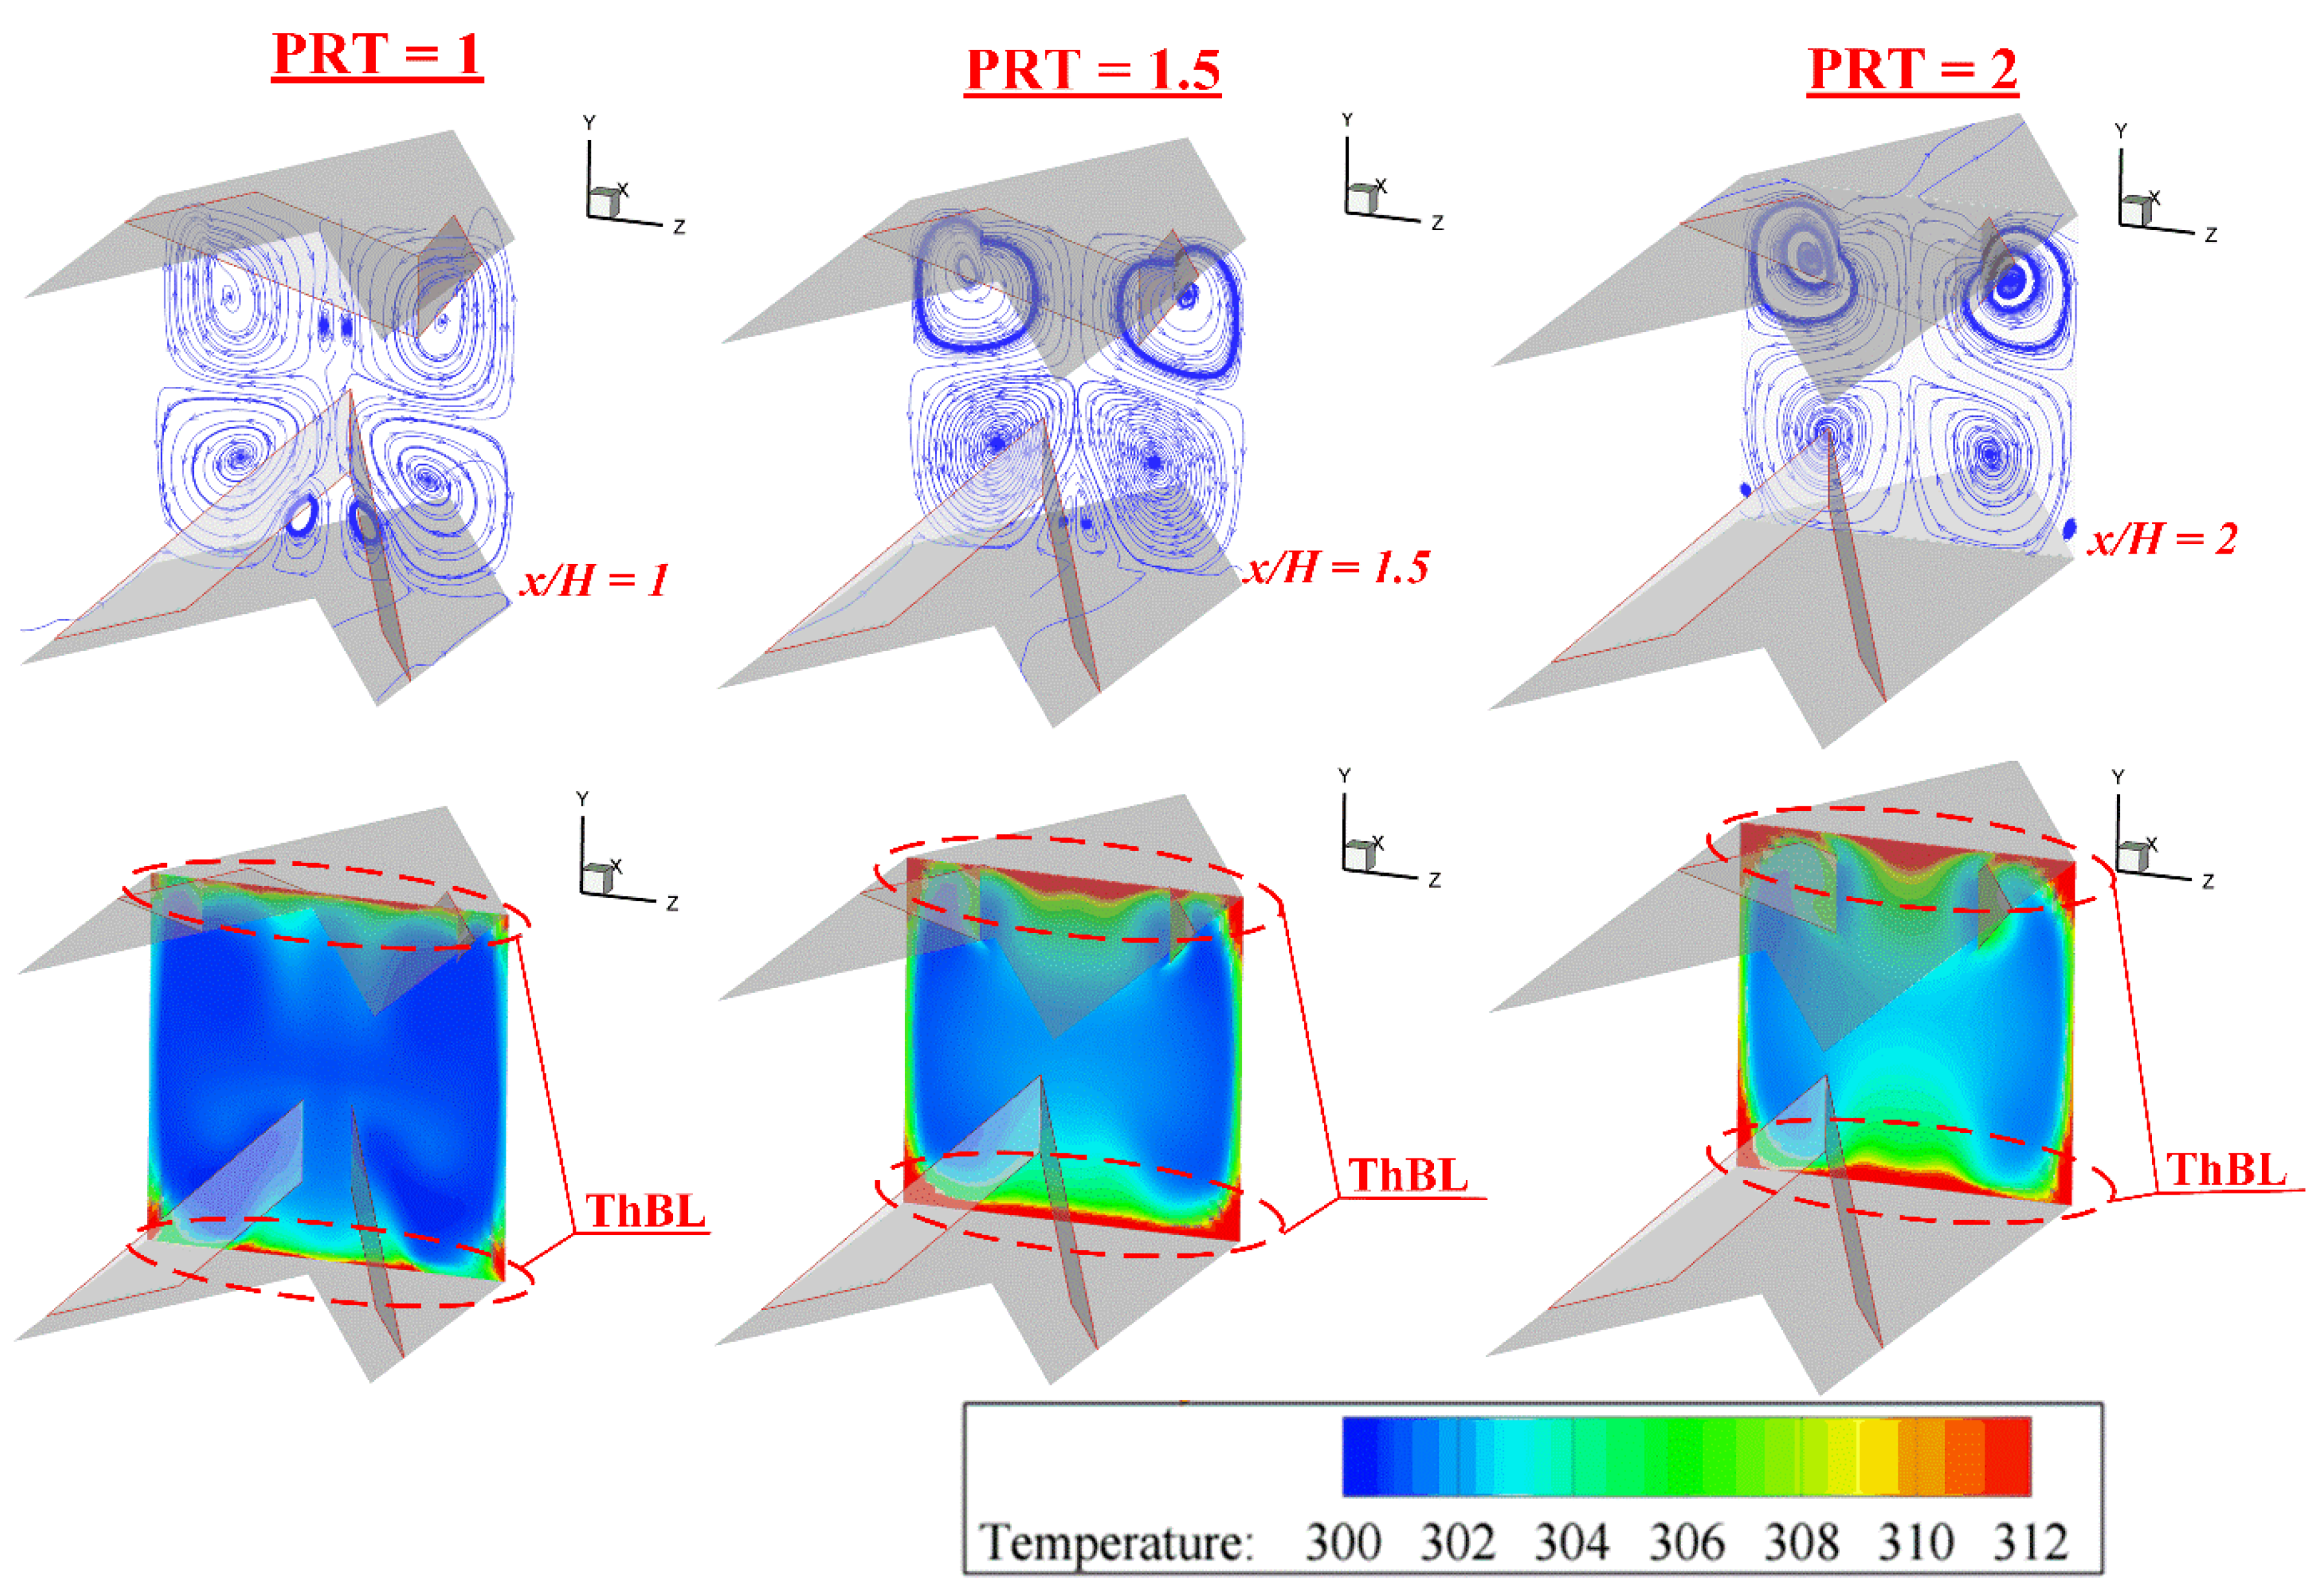
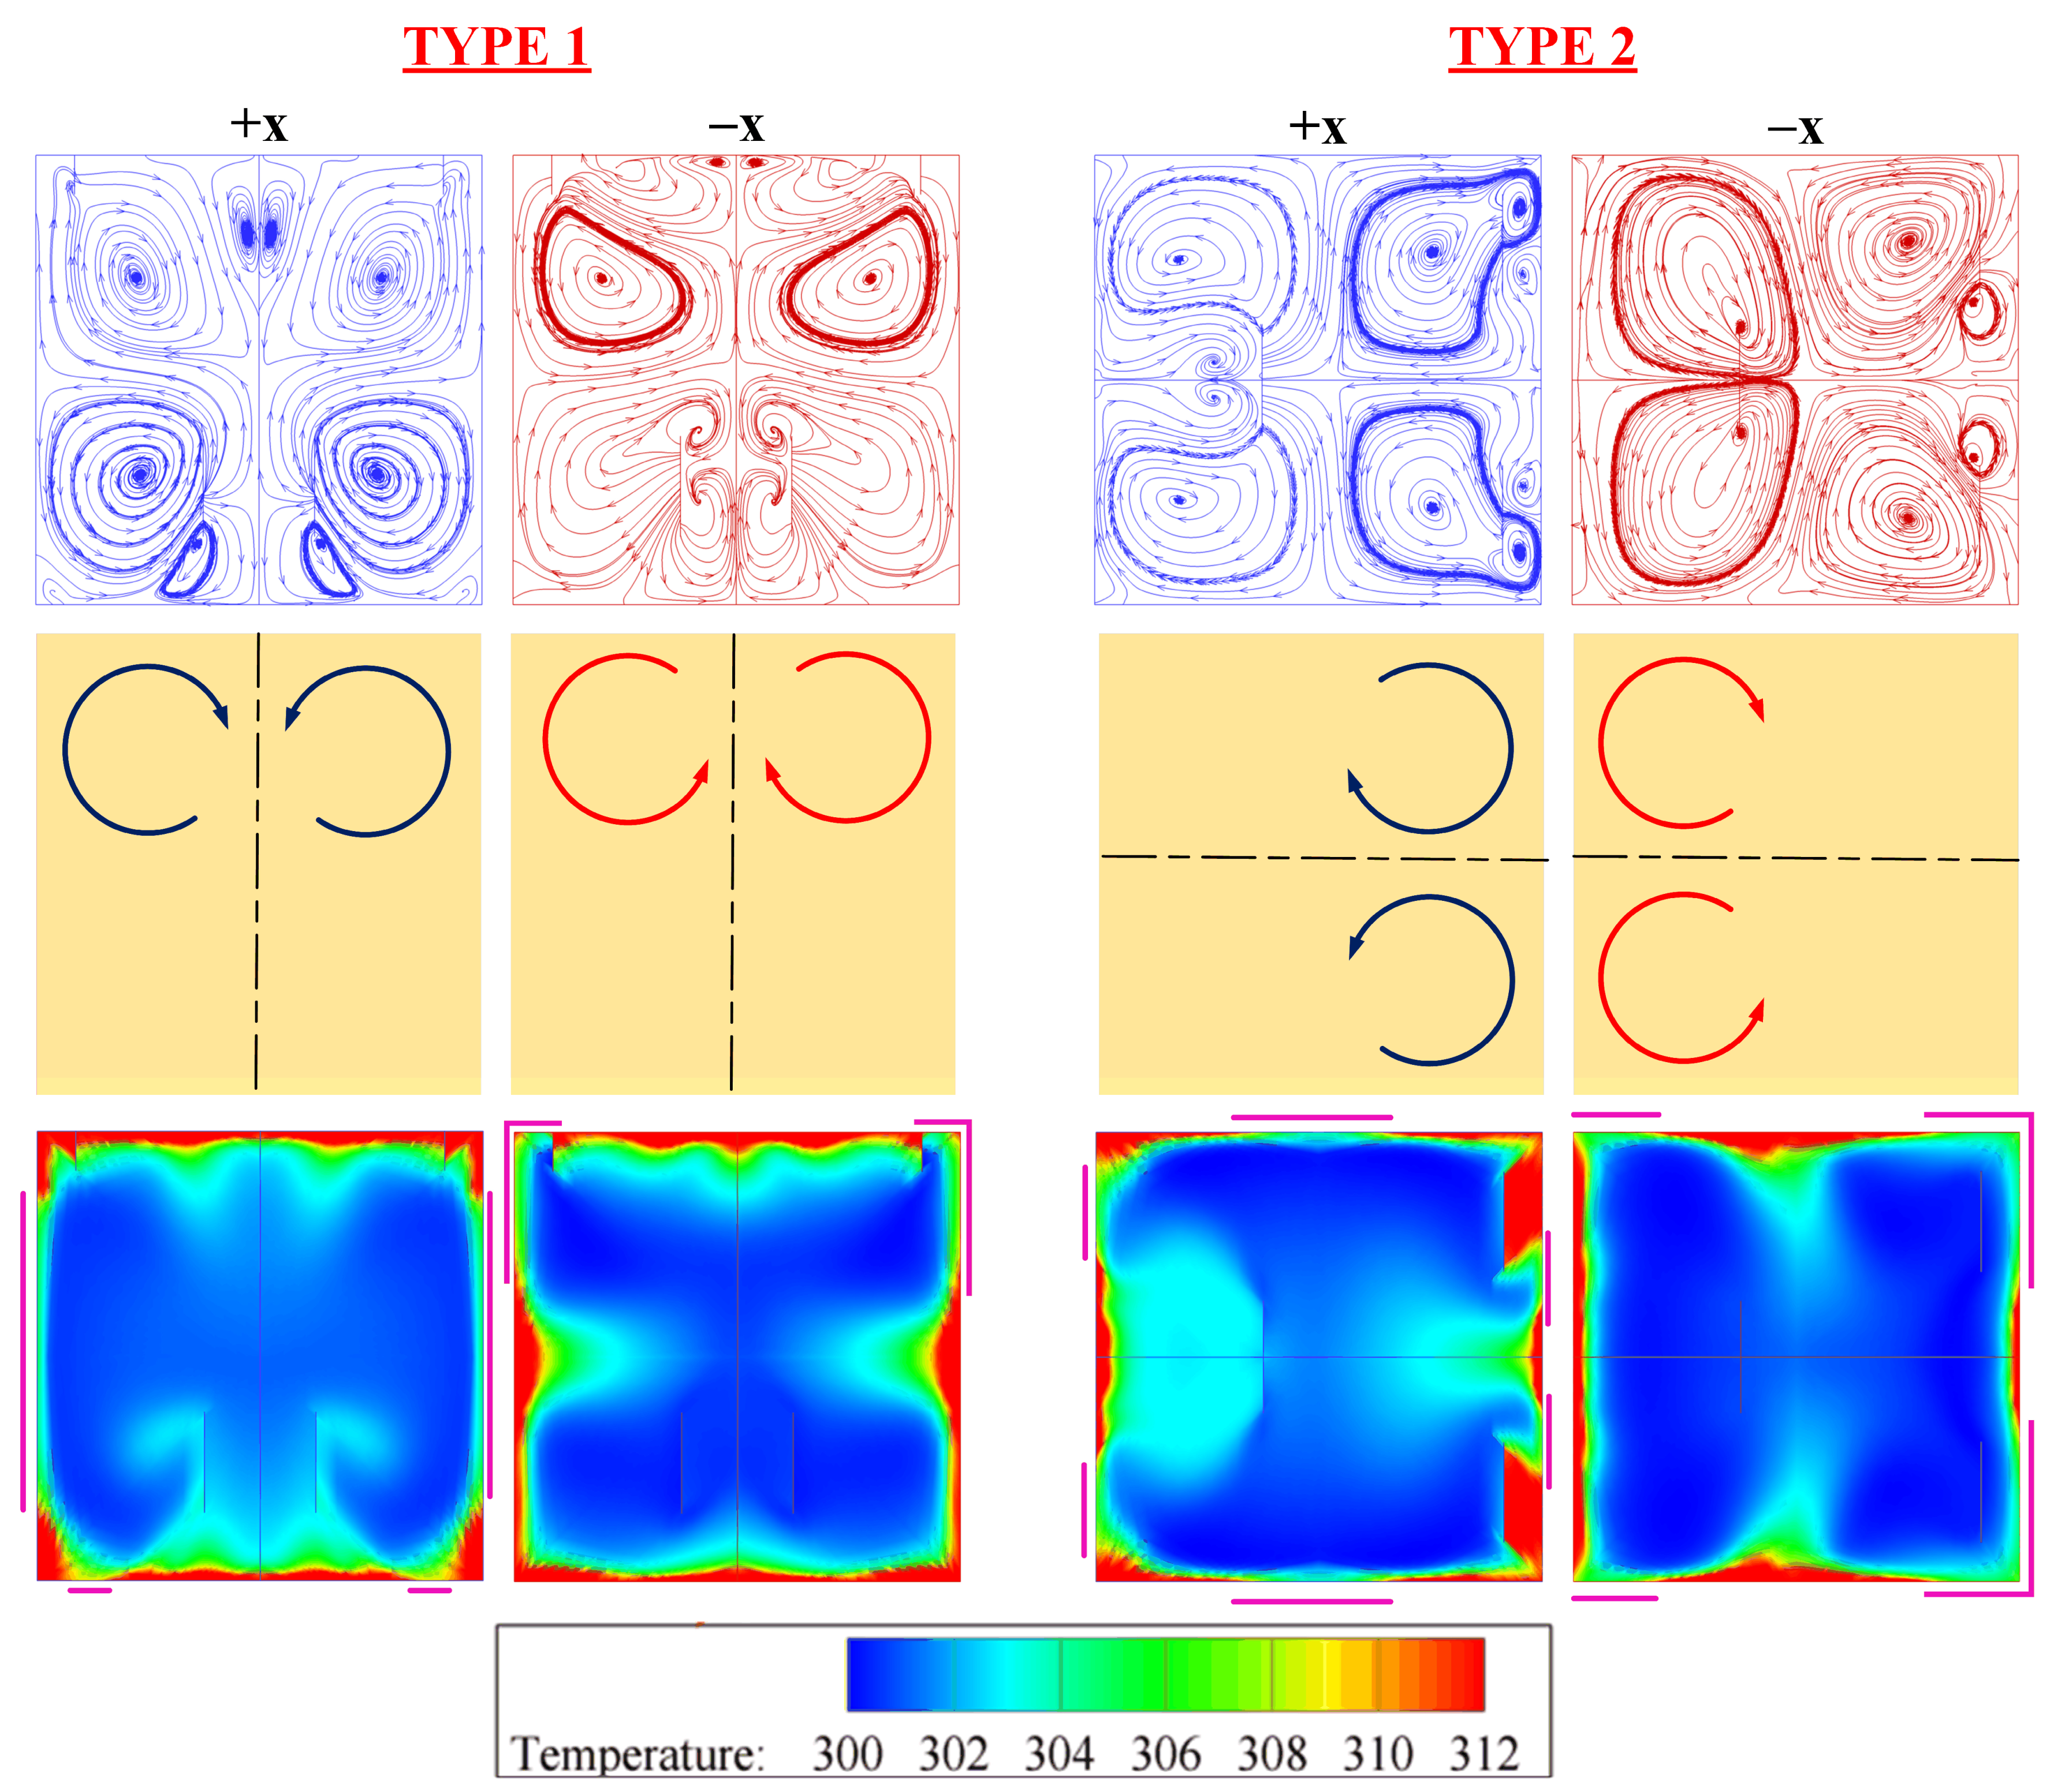
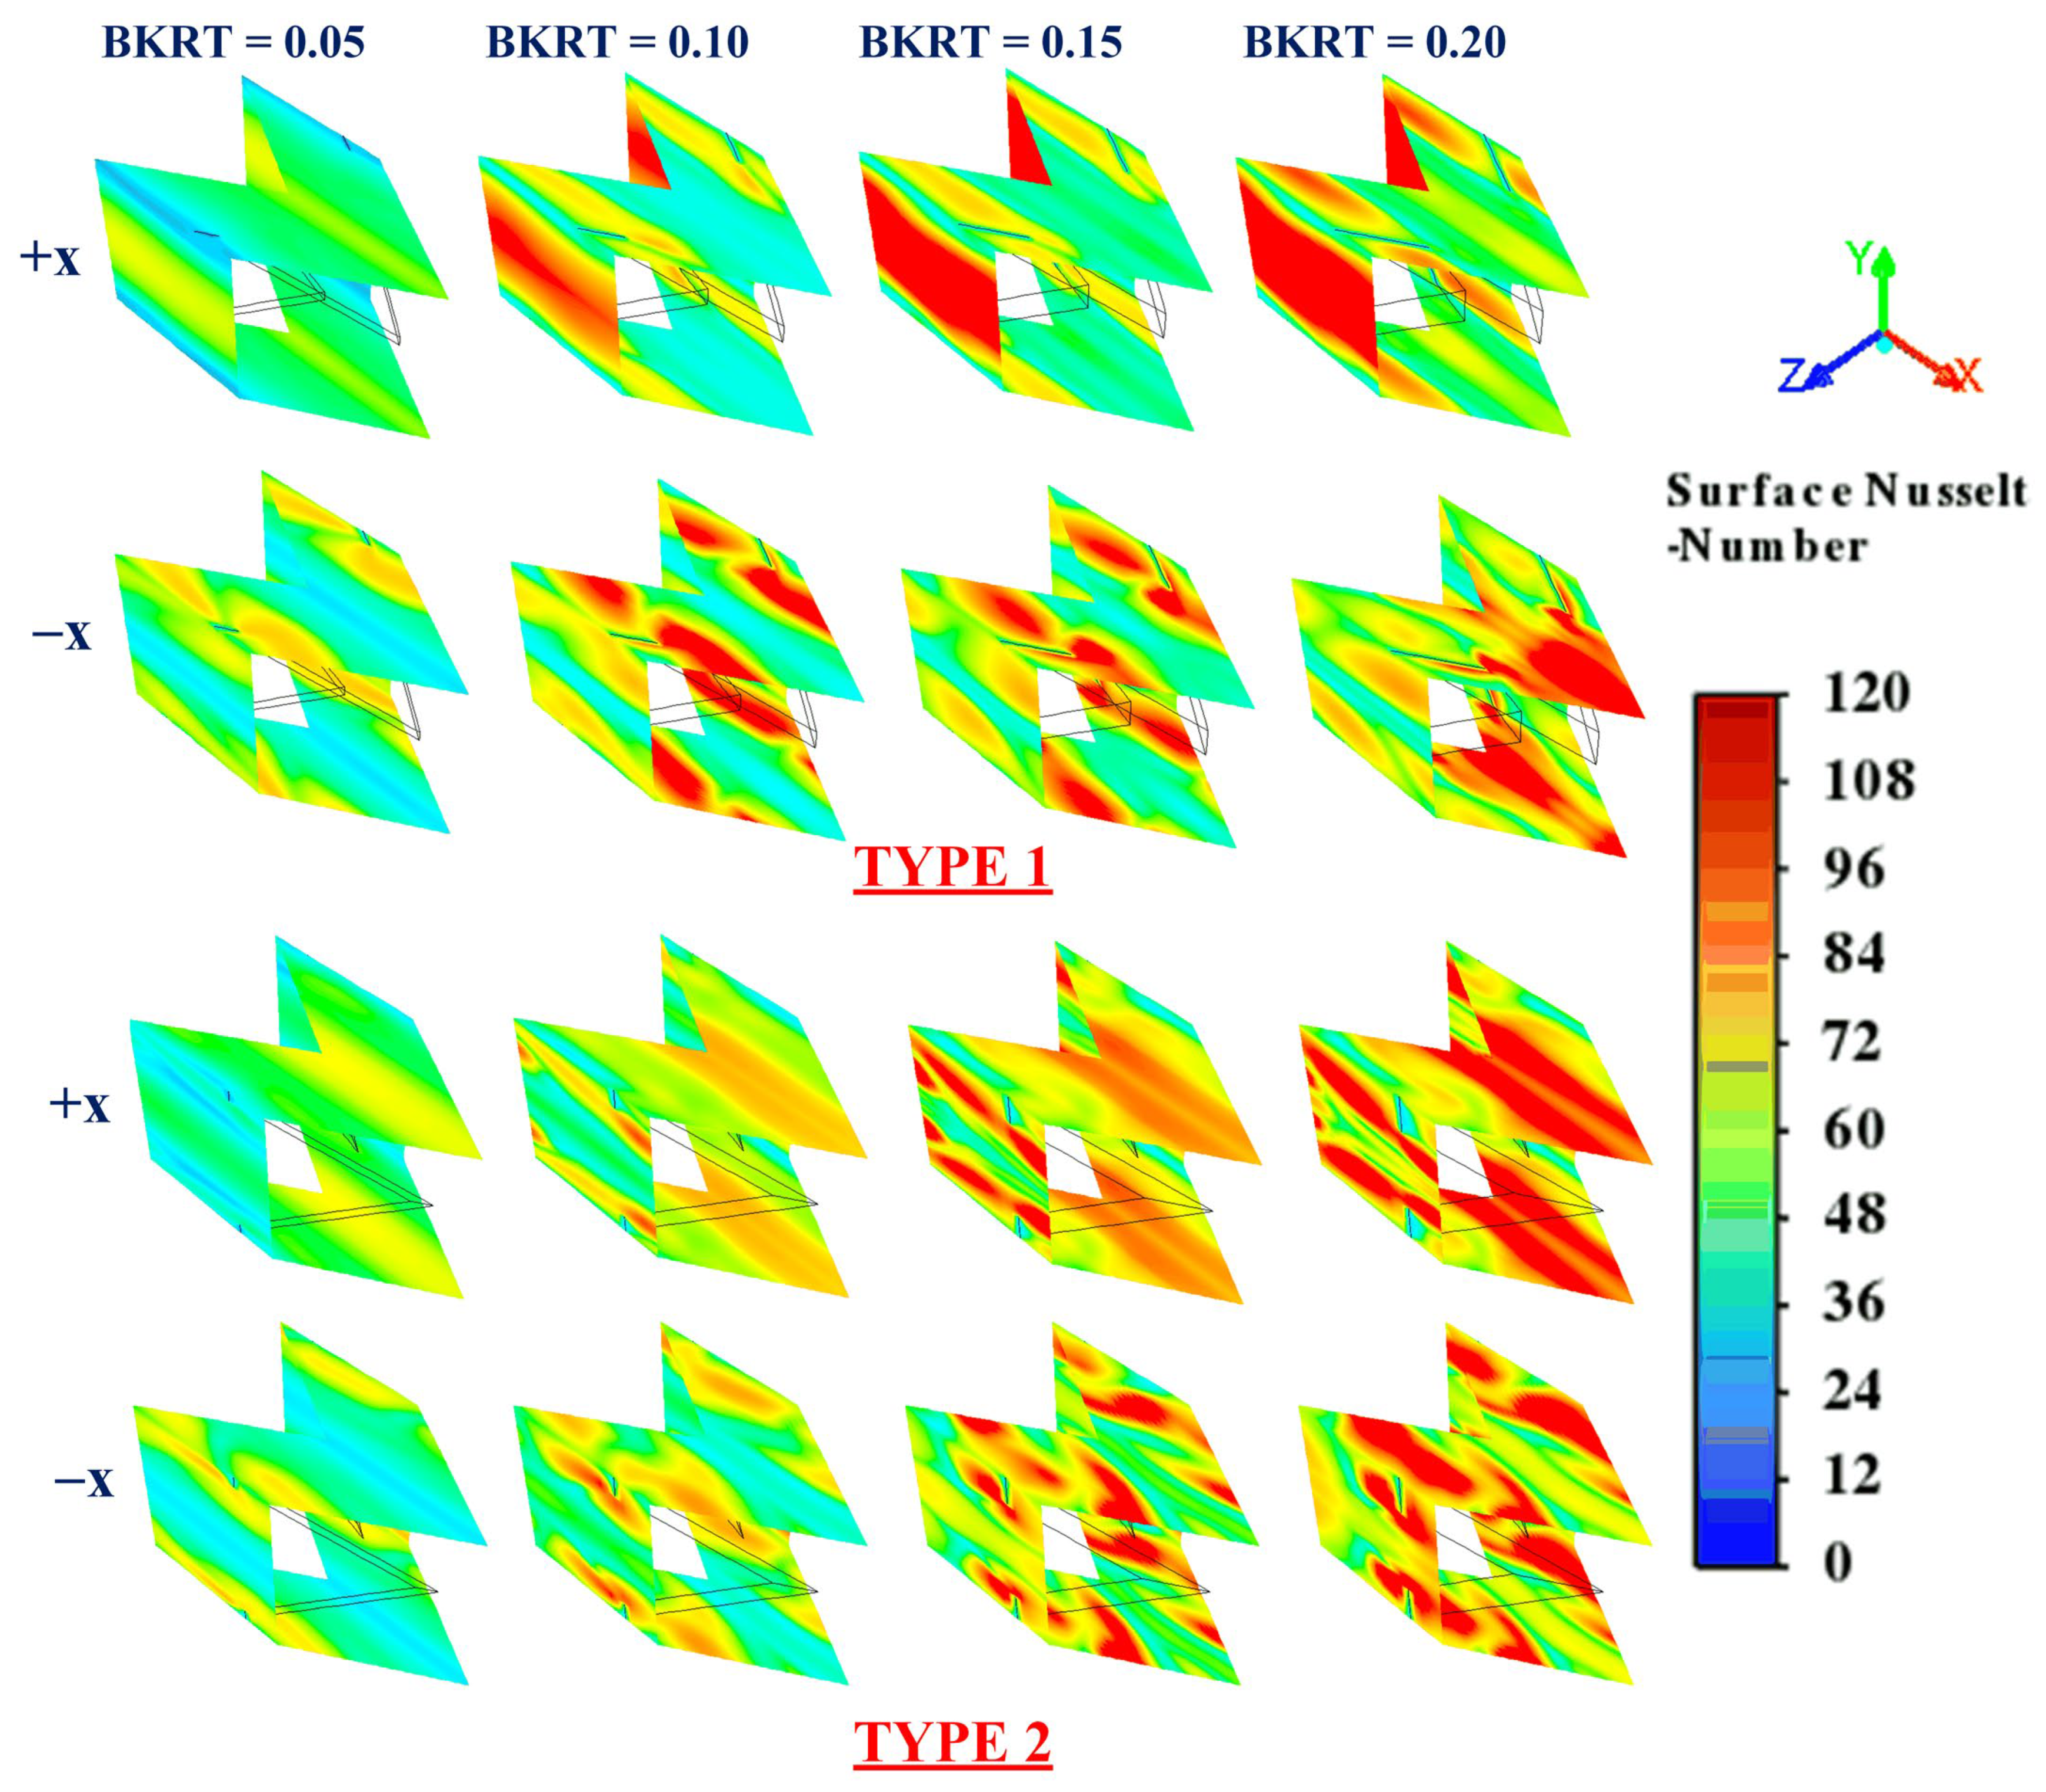
5.1. Flow and Heat Transfer Configurations

Figure 5 shows the streamlines in the cross-sectional plane of the flow and the temperature distribution of the fluid in the cross-sectional plane when the DXVIT is installed. The figure demonstrates that the installation of DXVIT in the SQHX significantly affects the flow structure. This is because the installed DXVIT acts as an obstacle to the flow, causing a pressure difference at the front and rear of the DXVIT. This pressure difference induces a vortex flow. The vortex flow occurs throughout the entire length of the SQHX used in the test. The vortex flow structure consists of 4–8 main vortex cores and smaller vortices at the SQHX edges in certain planes. The flow pattern is symmetrical on both sides, following the symmetry of DXVIT type 1. The vortex cores can be divided into two groups: VC-A and VC-B.
For VC-A, it is a vortex that compresses and impacts the SQHX surface, which disrupts the ThBL. For VC-B, the vortex is located in the center of the SQHX and helps improve the mixing of the hot fluid (near the SQHX surface) and the cooler fluid (in the center of the SQHX). These two mechanisms, VC-A and VC-B, are crucial in increasing the heat transfer coefficient at the SQHX wall. The increased heat transfer coefficient is directly proportional to the Nusselt number and heat transfer rate.
Looking at the temperature distribution of the air in the cross-sectional flow plane, it can be observed that the ThBL is disrupted along the entire length of the SQHX, as seen from the red layer that becomes thinner. However, the thinning of the red layer is uneven. In some regions, the layer thins so much that it becomes indistinguishable (areas where the flow impact and ThBL disruption are most intense). In other regions, the red layer still remains noticeably thick.
Another observed mechanism in the temperature distribution is the quality of fluid mixing. For the empty SQHX without DXVIT, the center of the SQHX is a blue contour (cool air), and layers form gradually until reaching the SQHX surface, where a red layer (hot air) appears. When DXVIT is installed in the system, the blue contour spreads out clearly from the center, with other layers being interspersed with the blue contours. The red layer also thins significantly, which indicates an improvement in mixing quality.
As previously mentioned, the installation of DXVIT causes vortex flow and impacts the SQHX surface, resulting in the disruption of the ThBL. In Figure 6, a plot is created to capture the specific behavior of the flow impact. The figure illustrates streamlines along the length of 1/4 of the module, where the flow impact on the surface is most pronounced. From the figure, it can be observed that the vortex flow occurring is a longitudinal vortex flow. Before the flow impacts the SQHX surface, there is a pitch distance along the longitudinal direction of the vortex flow near the DXVIT, which extends for about 2–3 modules before the impact occurs on the SQHX surface. After the impact at the SQHX surface, some of the flow appears to break up and interact with other flow groups, while some remains grouped and continues to flow along the DXVIT for another 2–3 modules.
Figure 7 shows the changes in flow and heat transfer in the form of streamlines in the cross-sectional flow plane and temperature contours of the fluid in the cross-sectional flow plane with varying BKRT values. From the figure, it is evident that the installation of DXVIT at all BKRT values results in vortex flow. This indicates that there is an improvement in mixing quality and disruption of the ThBL. The main vortex cores still consist of 4–8 vortex cores, but the position of the vortex core centers varies depending on the BKRT value.
A clear observation is that the mixing quality increases with the increase in BKRT values. This is because increasing BKRT results in a higher pressure drop across the front and rear of the DXVIT, which also increases the vortex strength. As the vortex strength increases, the level of disruption of the ThBL also increases. It can be seen that at BKRT = 0.2, the disruption of the ThBL is the most significant, with the red layer clearly thinning. In contrast, at BKRT = 0.05, the vortex strength is the lowest, resulting in the lowest mixing quality of the fluid.
The trend of how the BKRT value affects flow and heat transfer is similar for DXVIT type 2 for both directions of flow across all PRT distances.
When considering the effect of PRT values on flow and heat transfer, as shown in Figure 8, it can be concluded that the main flow structure remains the same with varying PRT values, but the vortex strength changes. It was found that as the PRT value increases, the vortex strength tends to decrease, leading to a reduction in the disruption of the ThBL. From the image, it is clearly observed that the red contour layer near the SQHX wall becomes thicker as the PRT value increases. Therefore, a PRT value of 1 results in the highest vortex strength, while a PRT value of 2 results in the lowest vortex strength.
Figure 9 shows the changes in flow, heat transfer, and disruption of the ThBL for different types of DXVIT and flow directions. The figure indicates that the installation of both types of DXVIT results in vortex flow in both the +x and −x flow directions. This means that there is an improvement in the mixing quality of the fluid, and the disruption of the ThBL occurs as well. The main flow structure consists of 4–8 vortex cores, and the flow pattern is symmetrical along the left and right sides for DXVIT type 1, while it is symmetrical along the top and bottom for DXVIT type 2. This symmetry in the flow pattern can be explained by the symmetrical shape of the DXVIT itself. Type 1 has a left/right symmetry, while type 2 has a top/bottom symmetry.
The different flow directions affect the vortex direction, which can be considered based on the different cross-sectional flow planes, as shown by the yellow planes. The variation in flow pattern and flow direction influences the position where the flow impact occurs and where the ThBL is disrupted. The areas where the flow impact and disruption of the ThBL occur are marked with pink lines. It is clear that for each type of DXVIT and flow direction, the positions of the flow impact and disruption of the ThBL are different.
Figure 10 shows the distribution of Nusselt numbers at the SQHX surface for different BKRT values, DXVIT types, and flow directions. The distribution of Nusselt numbers is a useful tool for explaining the flow impact on the SQHX surface and the disruption of the ThBL. As explained earlier, when the BKRT value increases, the vortex strength also increases, which affects the intensity of the flow impact and the level of disruption of the ThBL. Therefore, as the BKRT value increases, the Nusselt number also increases.
The direction and type of DXVIT affect the position of the flow impact and the location of the disruption of the ThBL. This can be observed from the red contours, which indicate the regions where the ThBL is disrupted. These effects lead to an increase in the heat transfer coefficient and the Nusselt number.

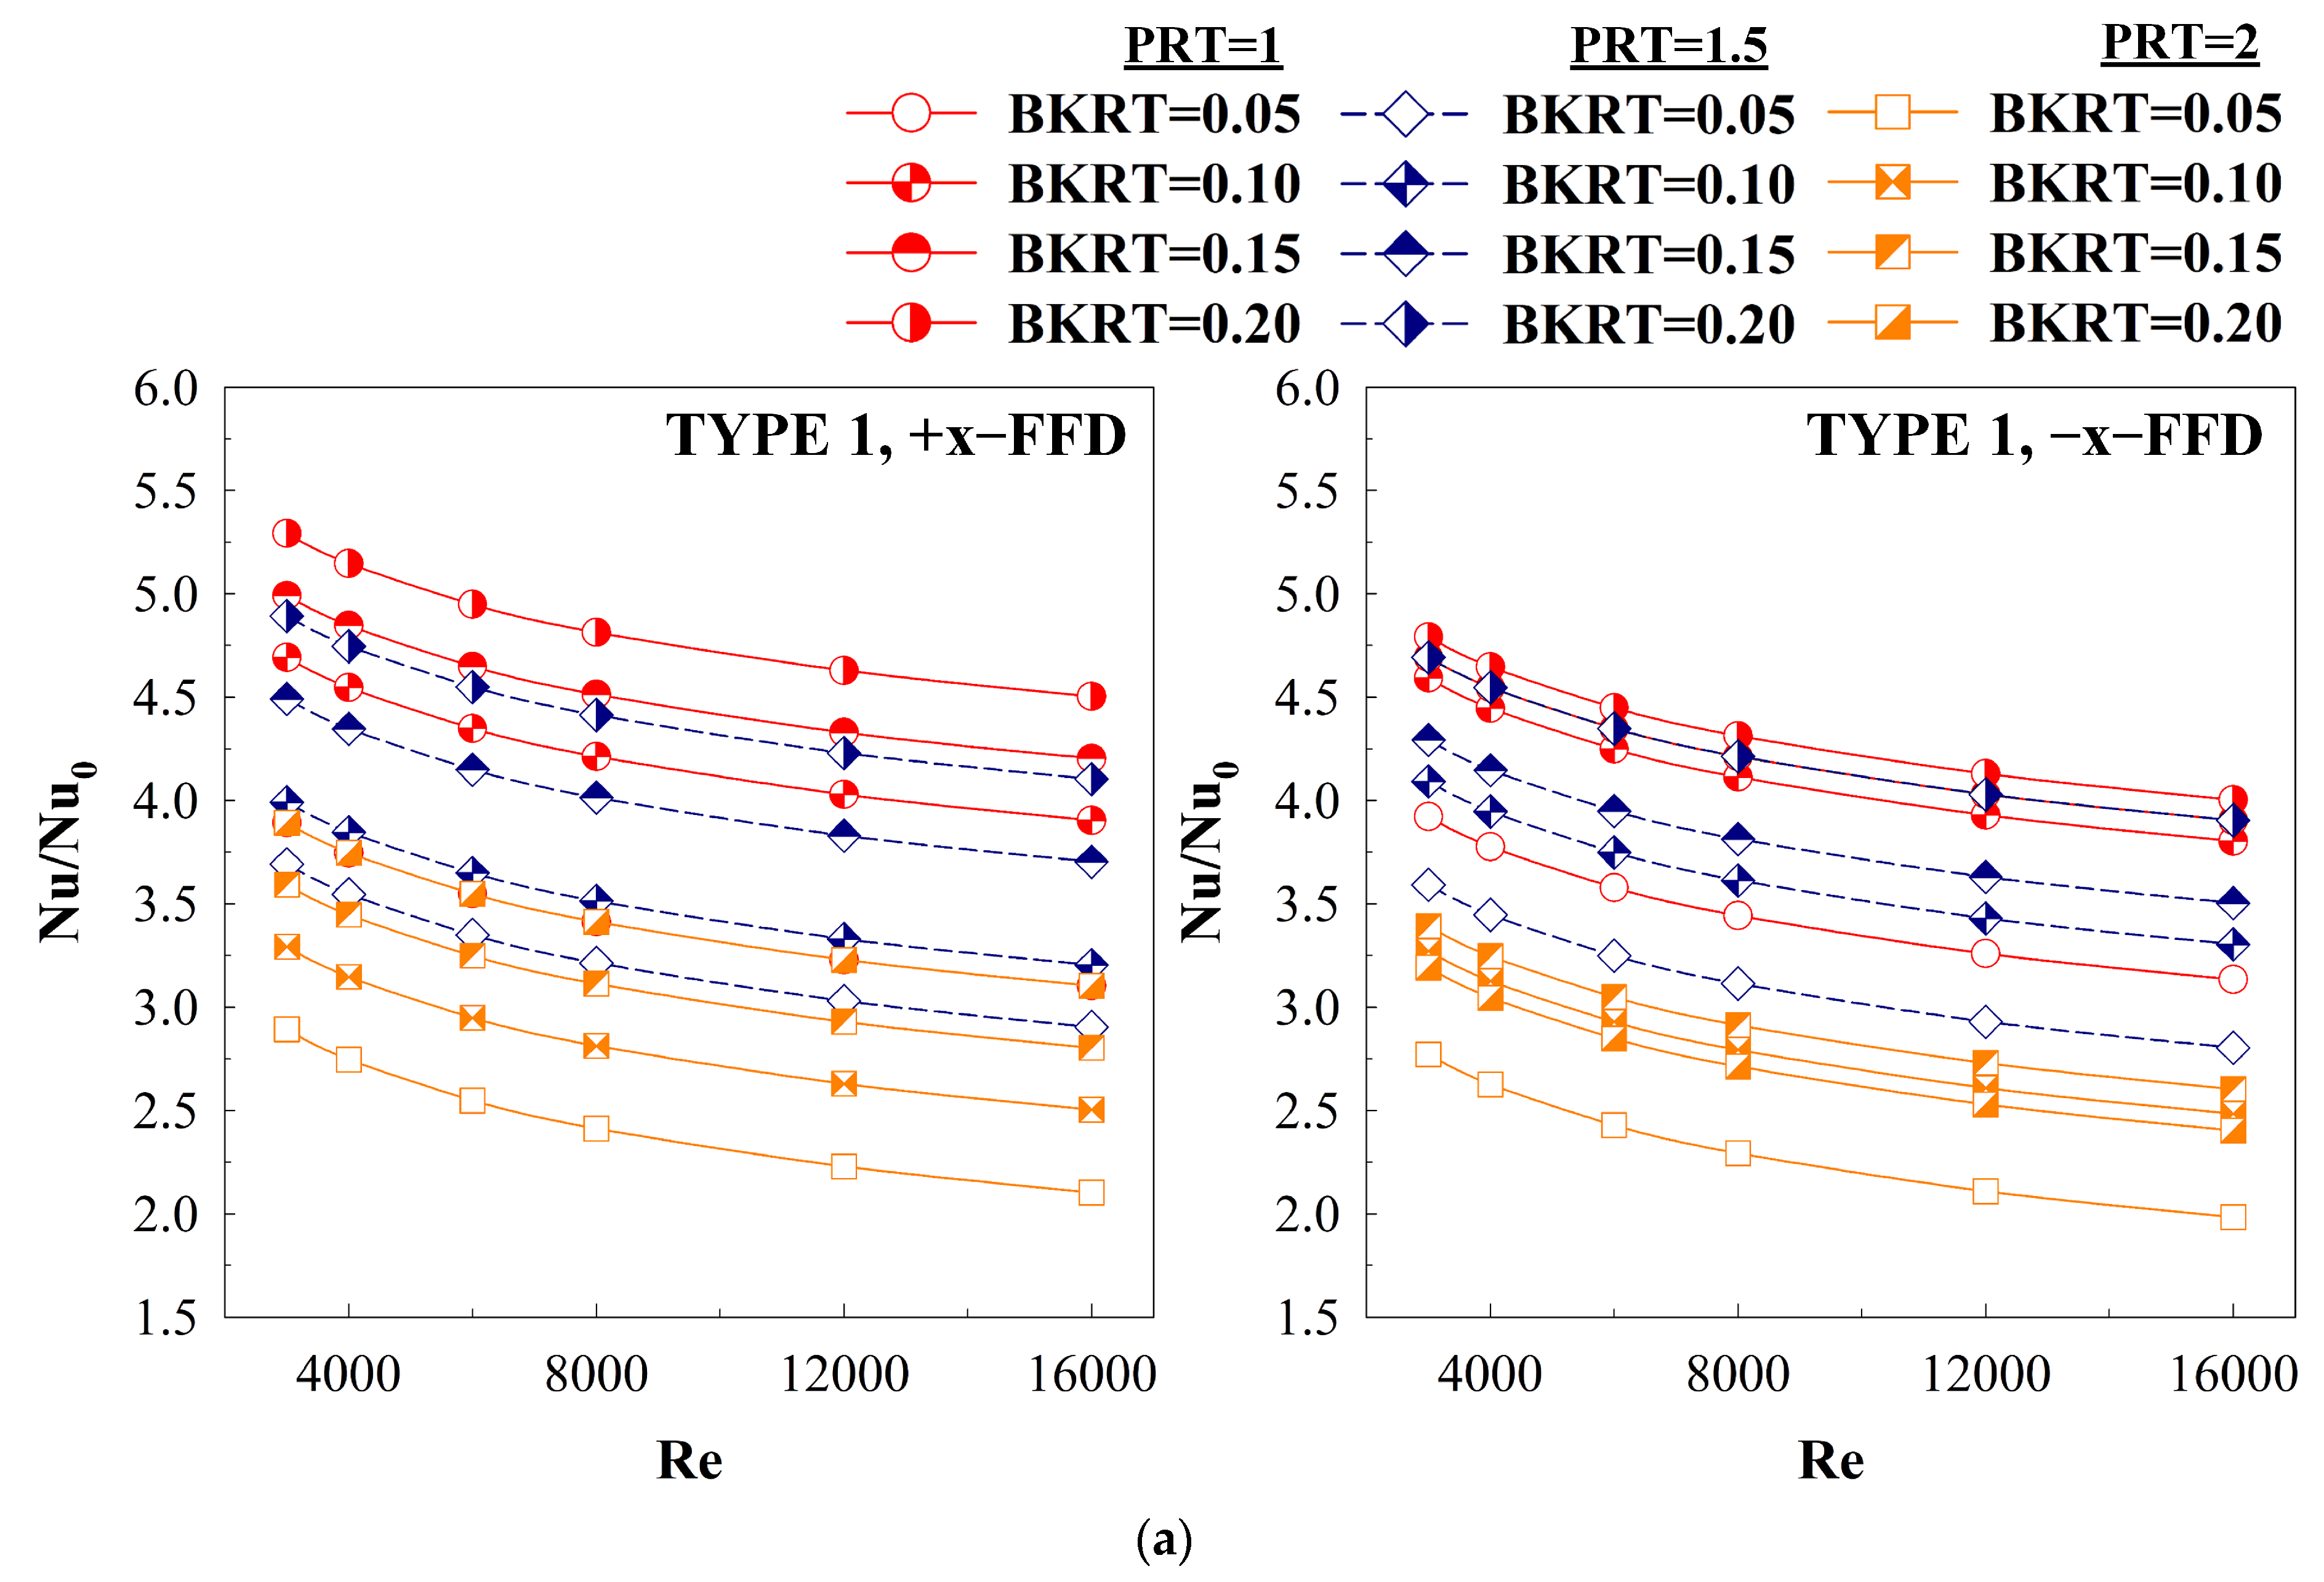
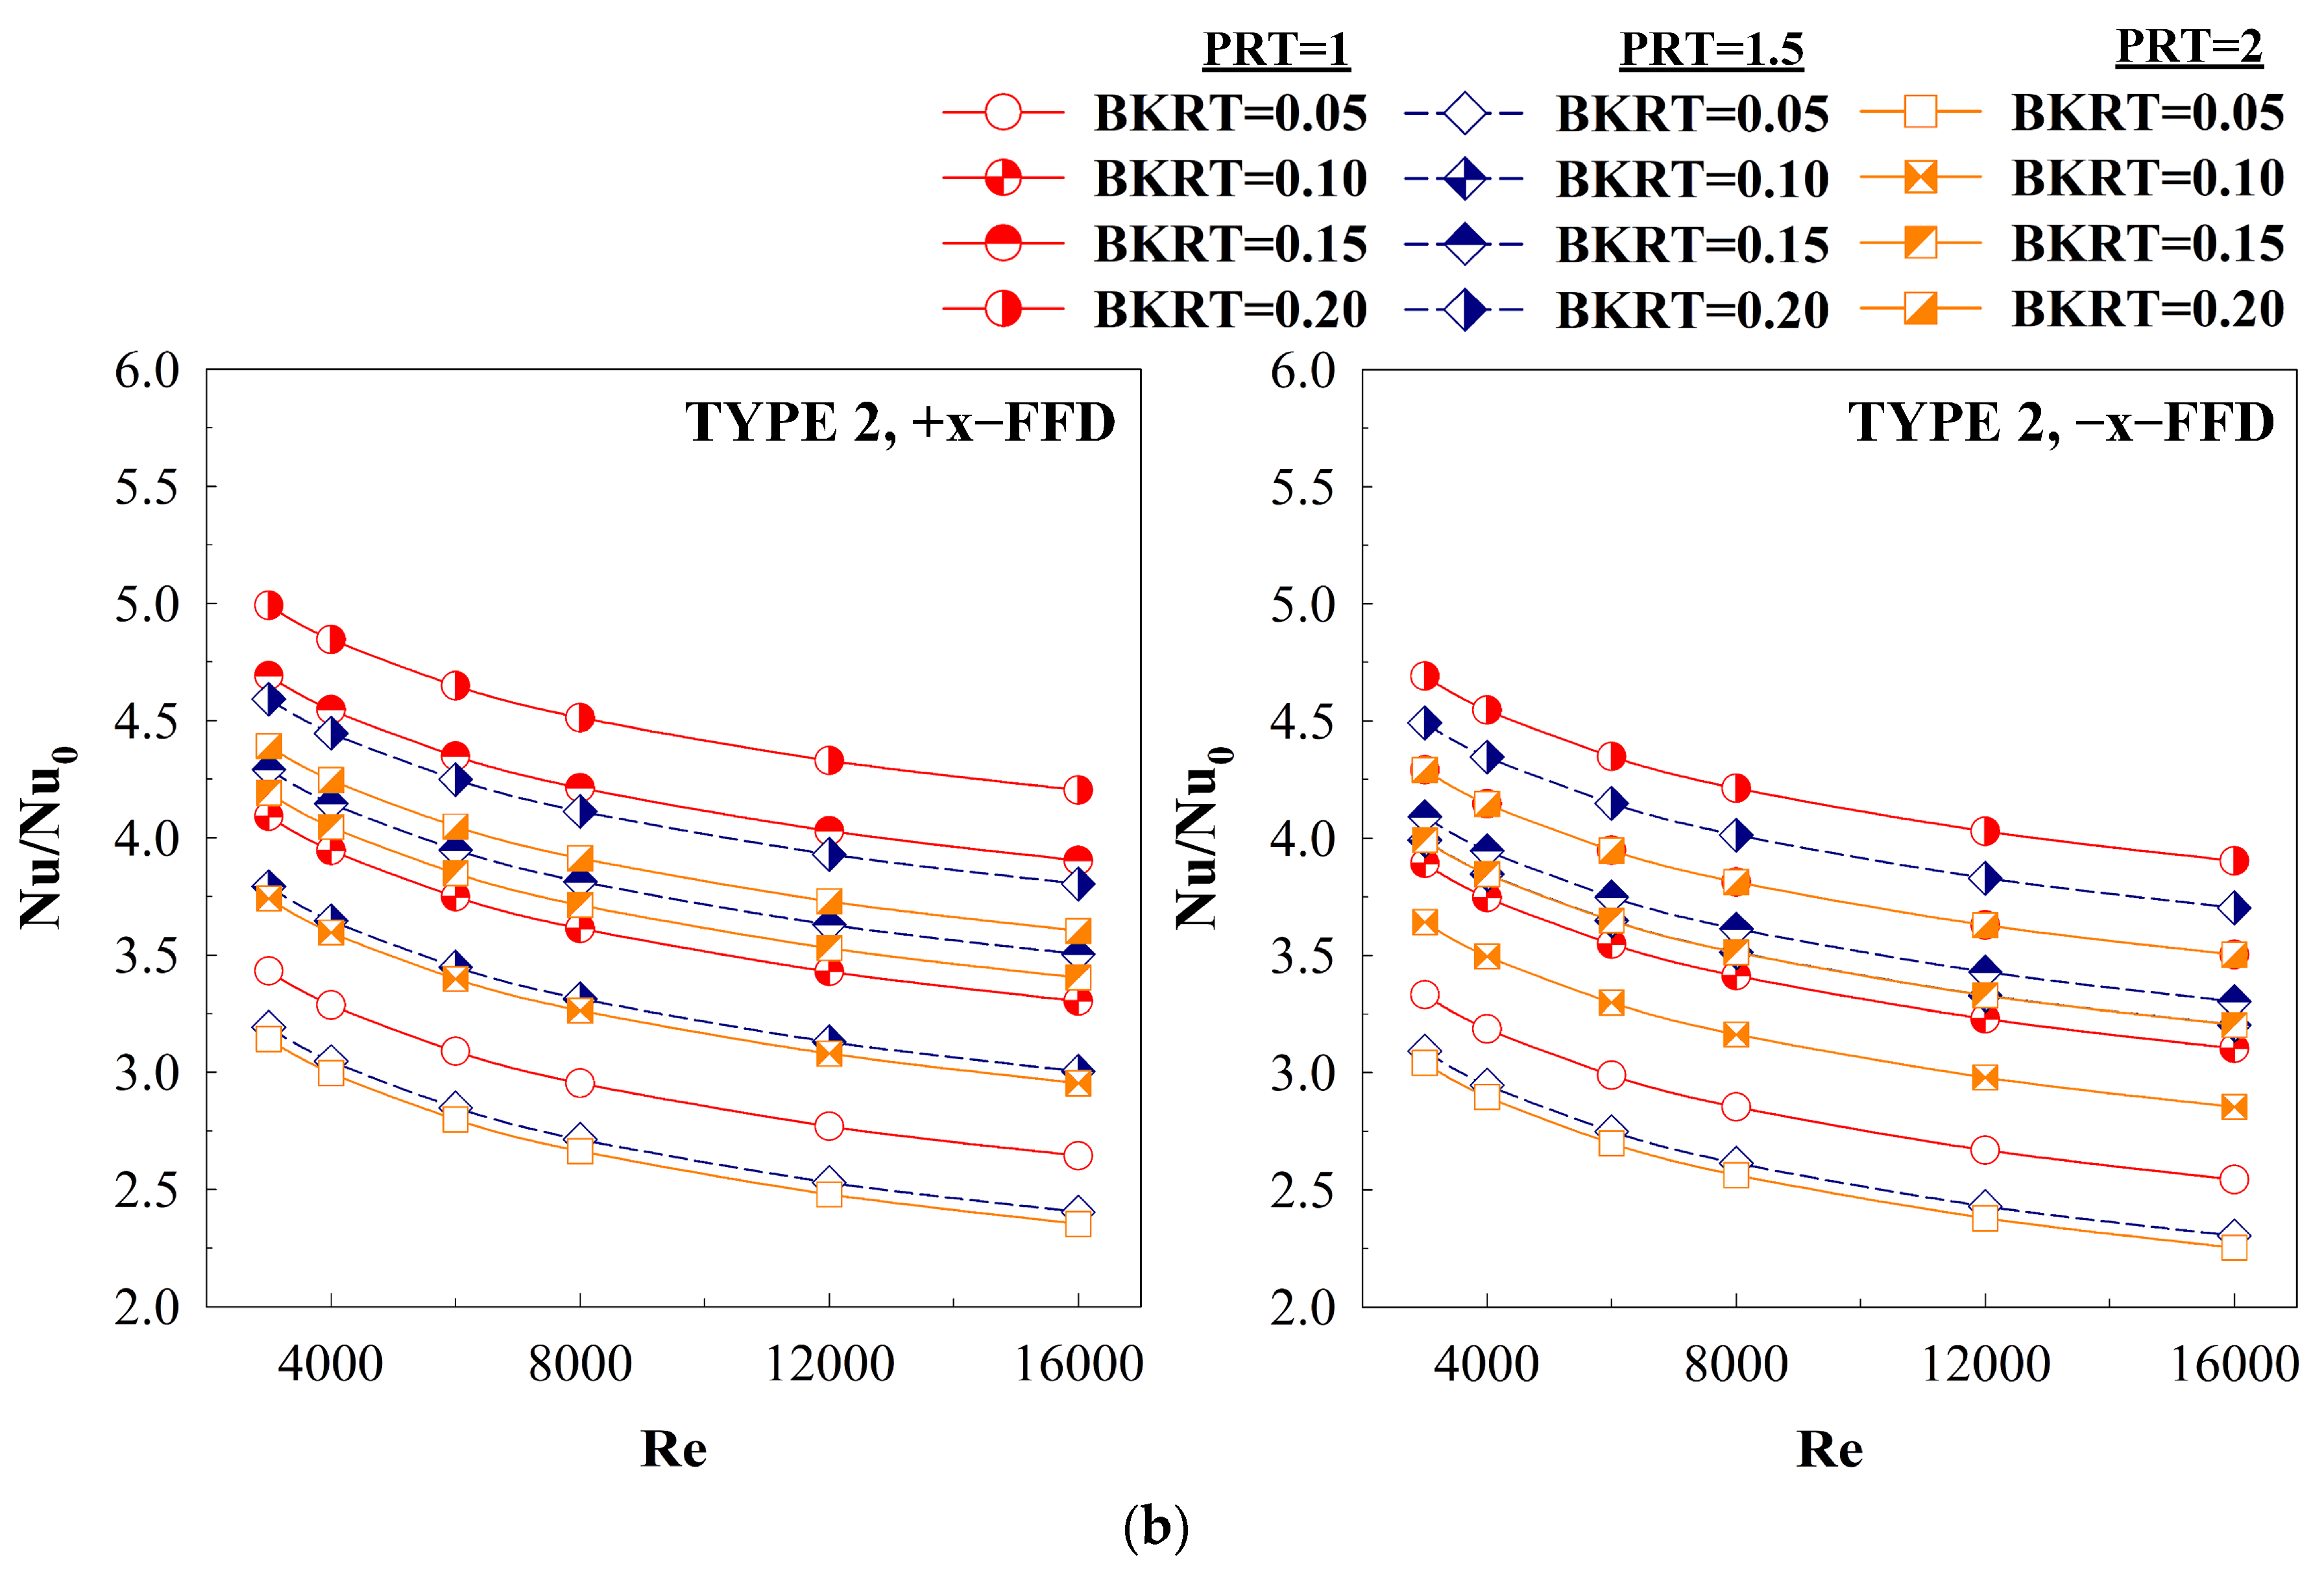
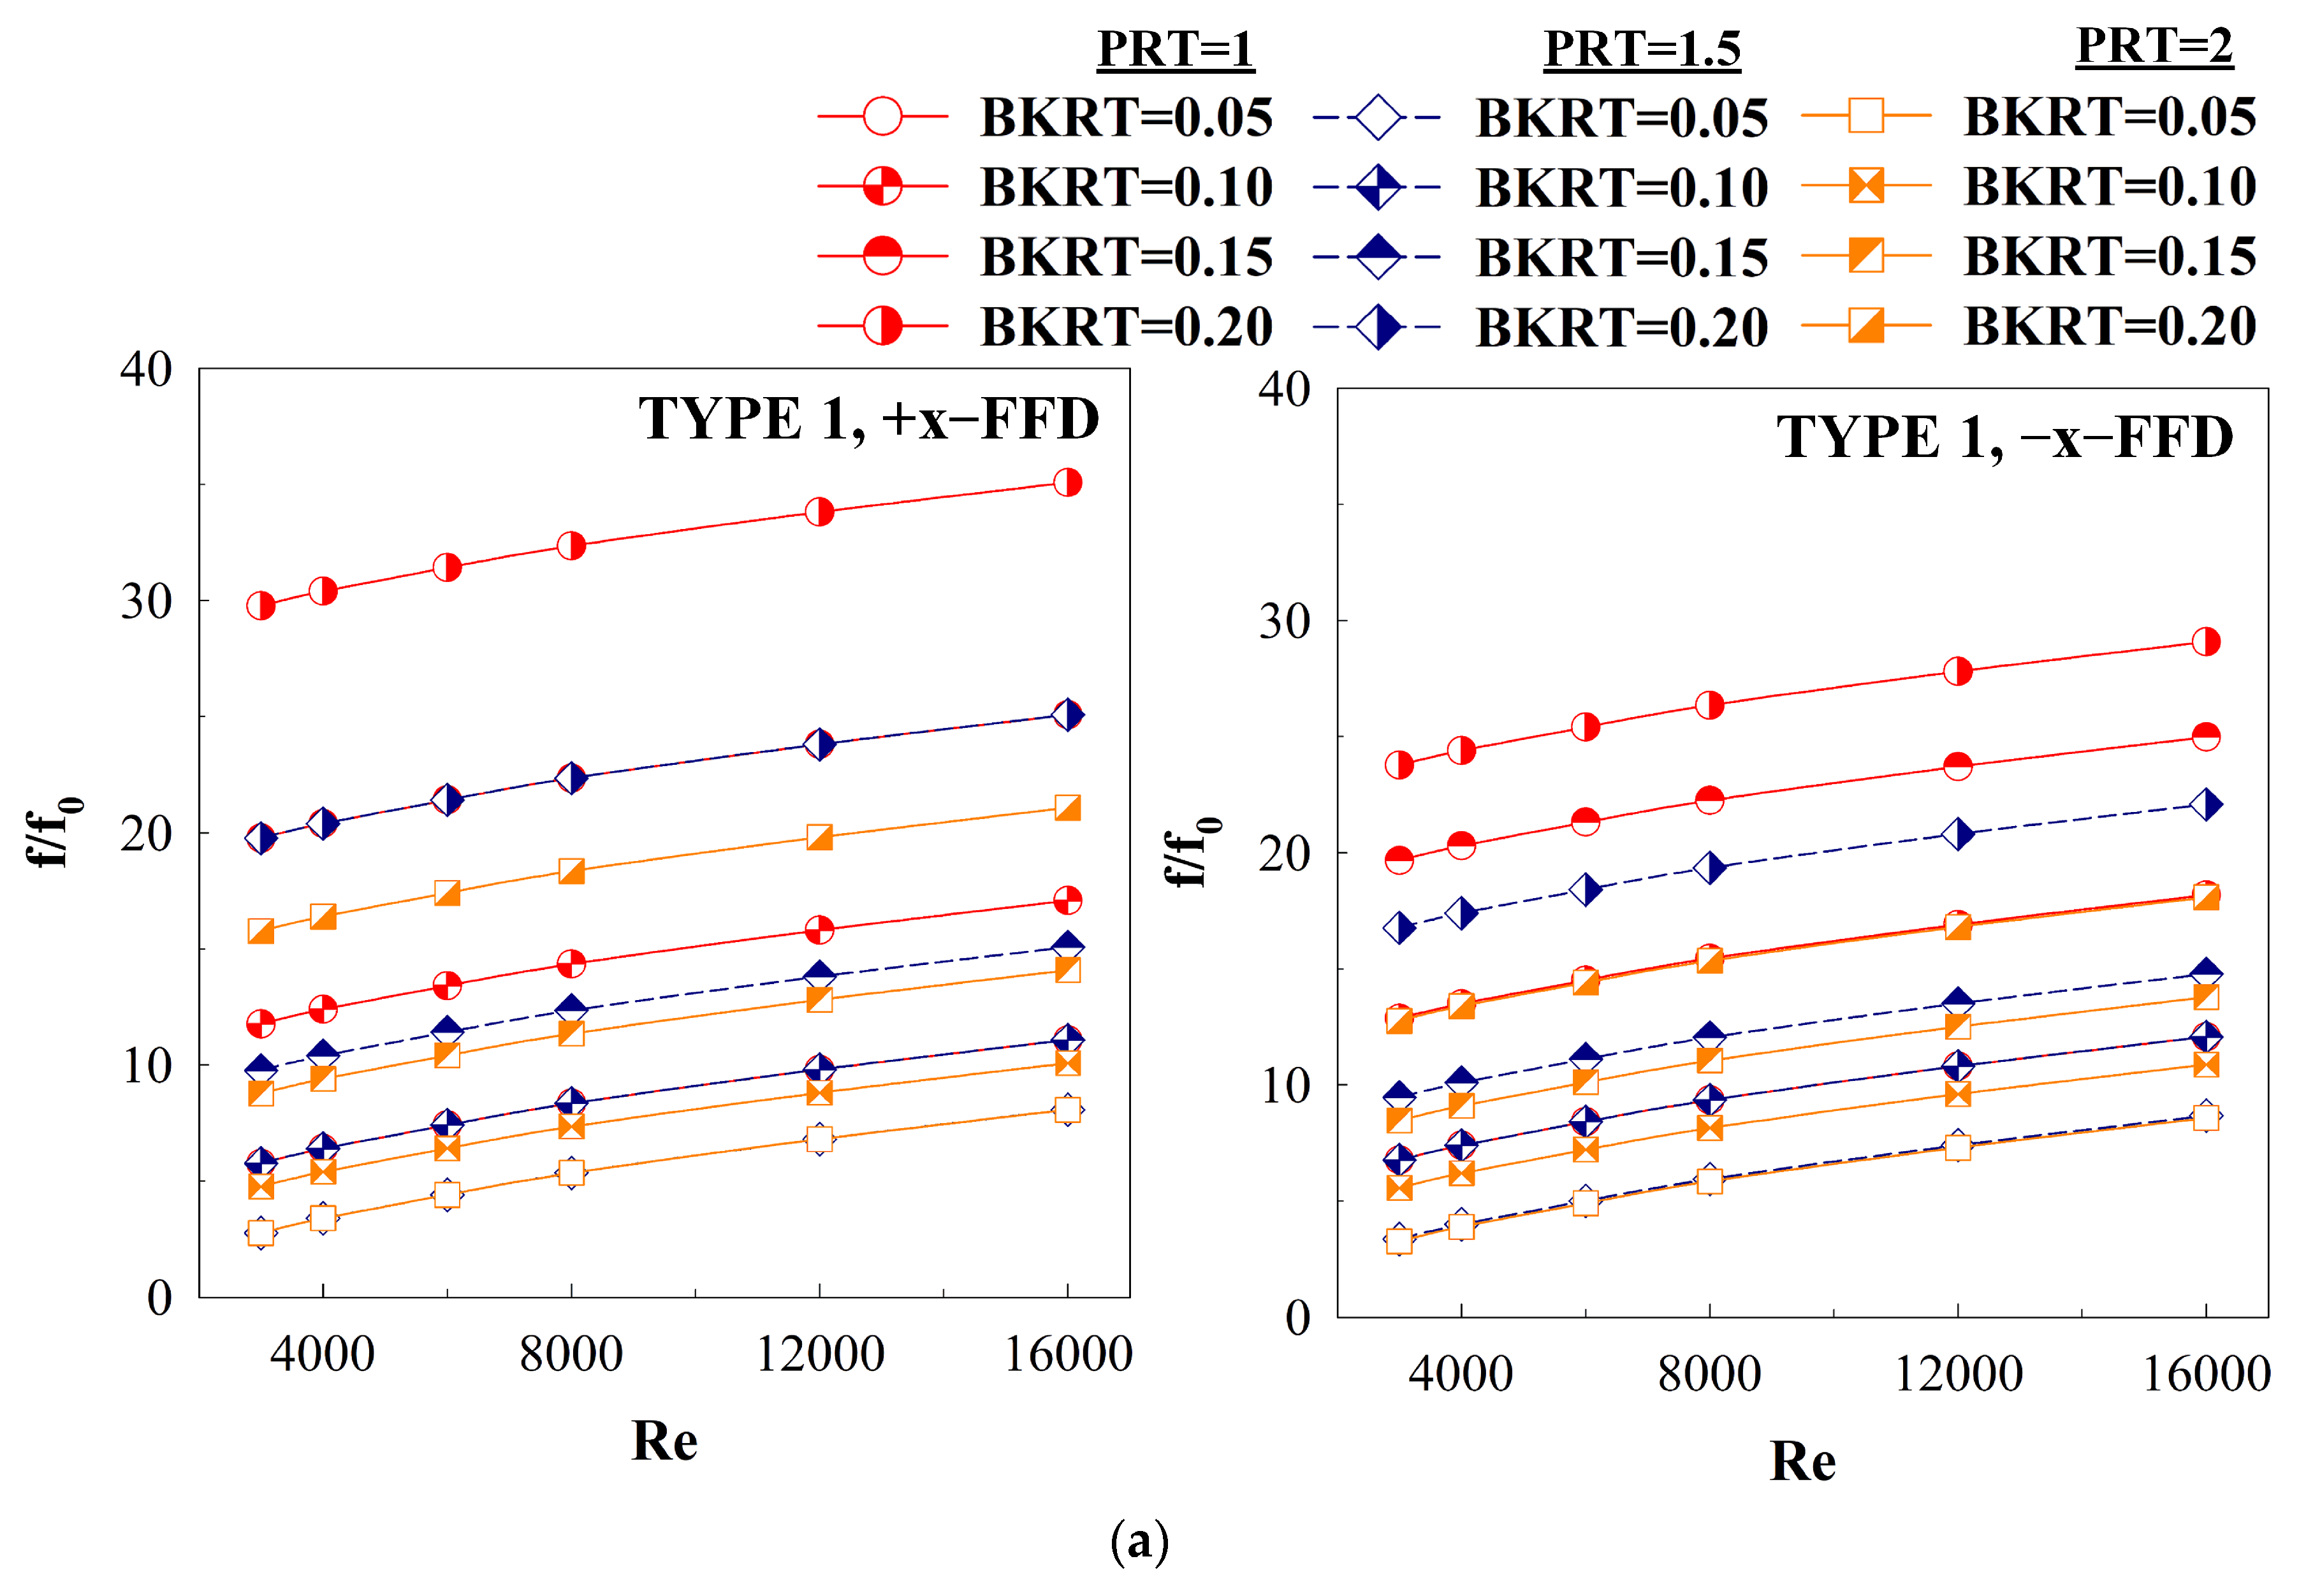
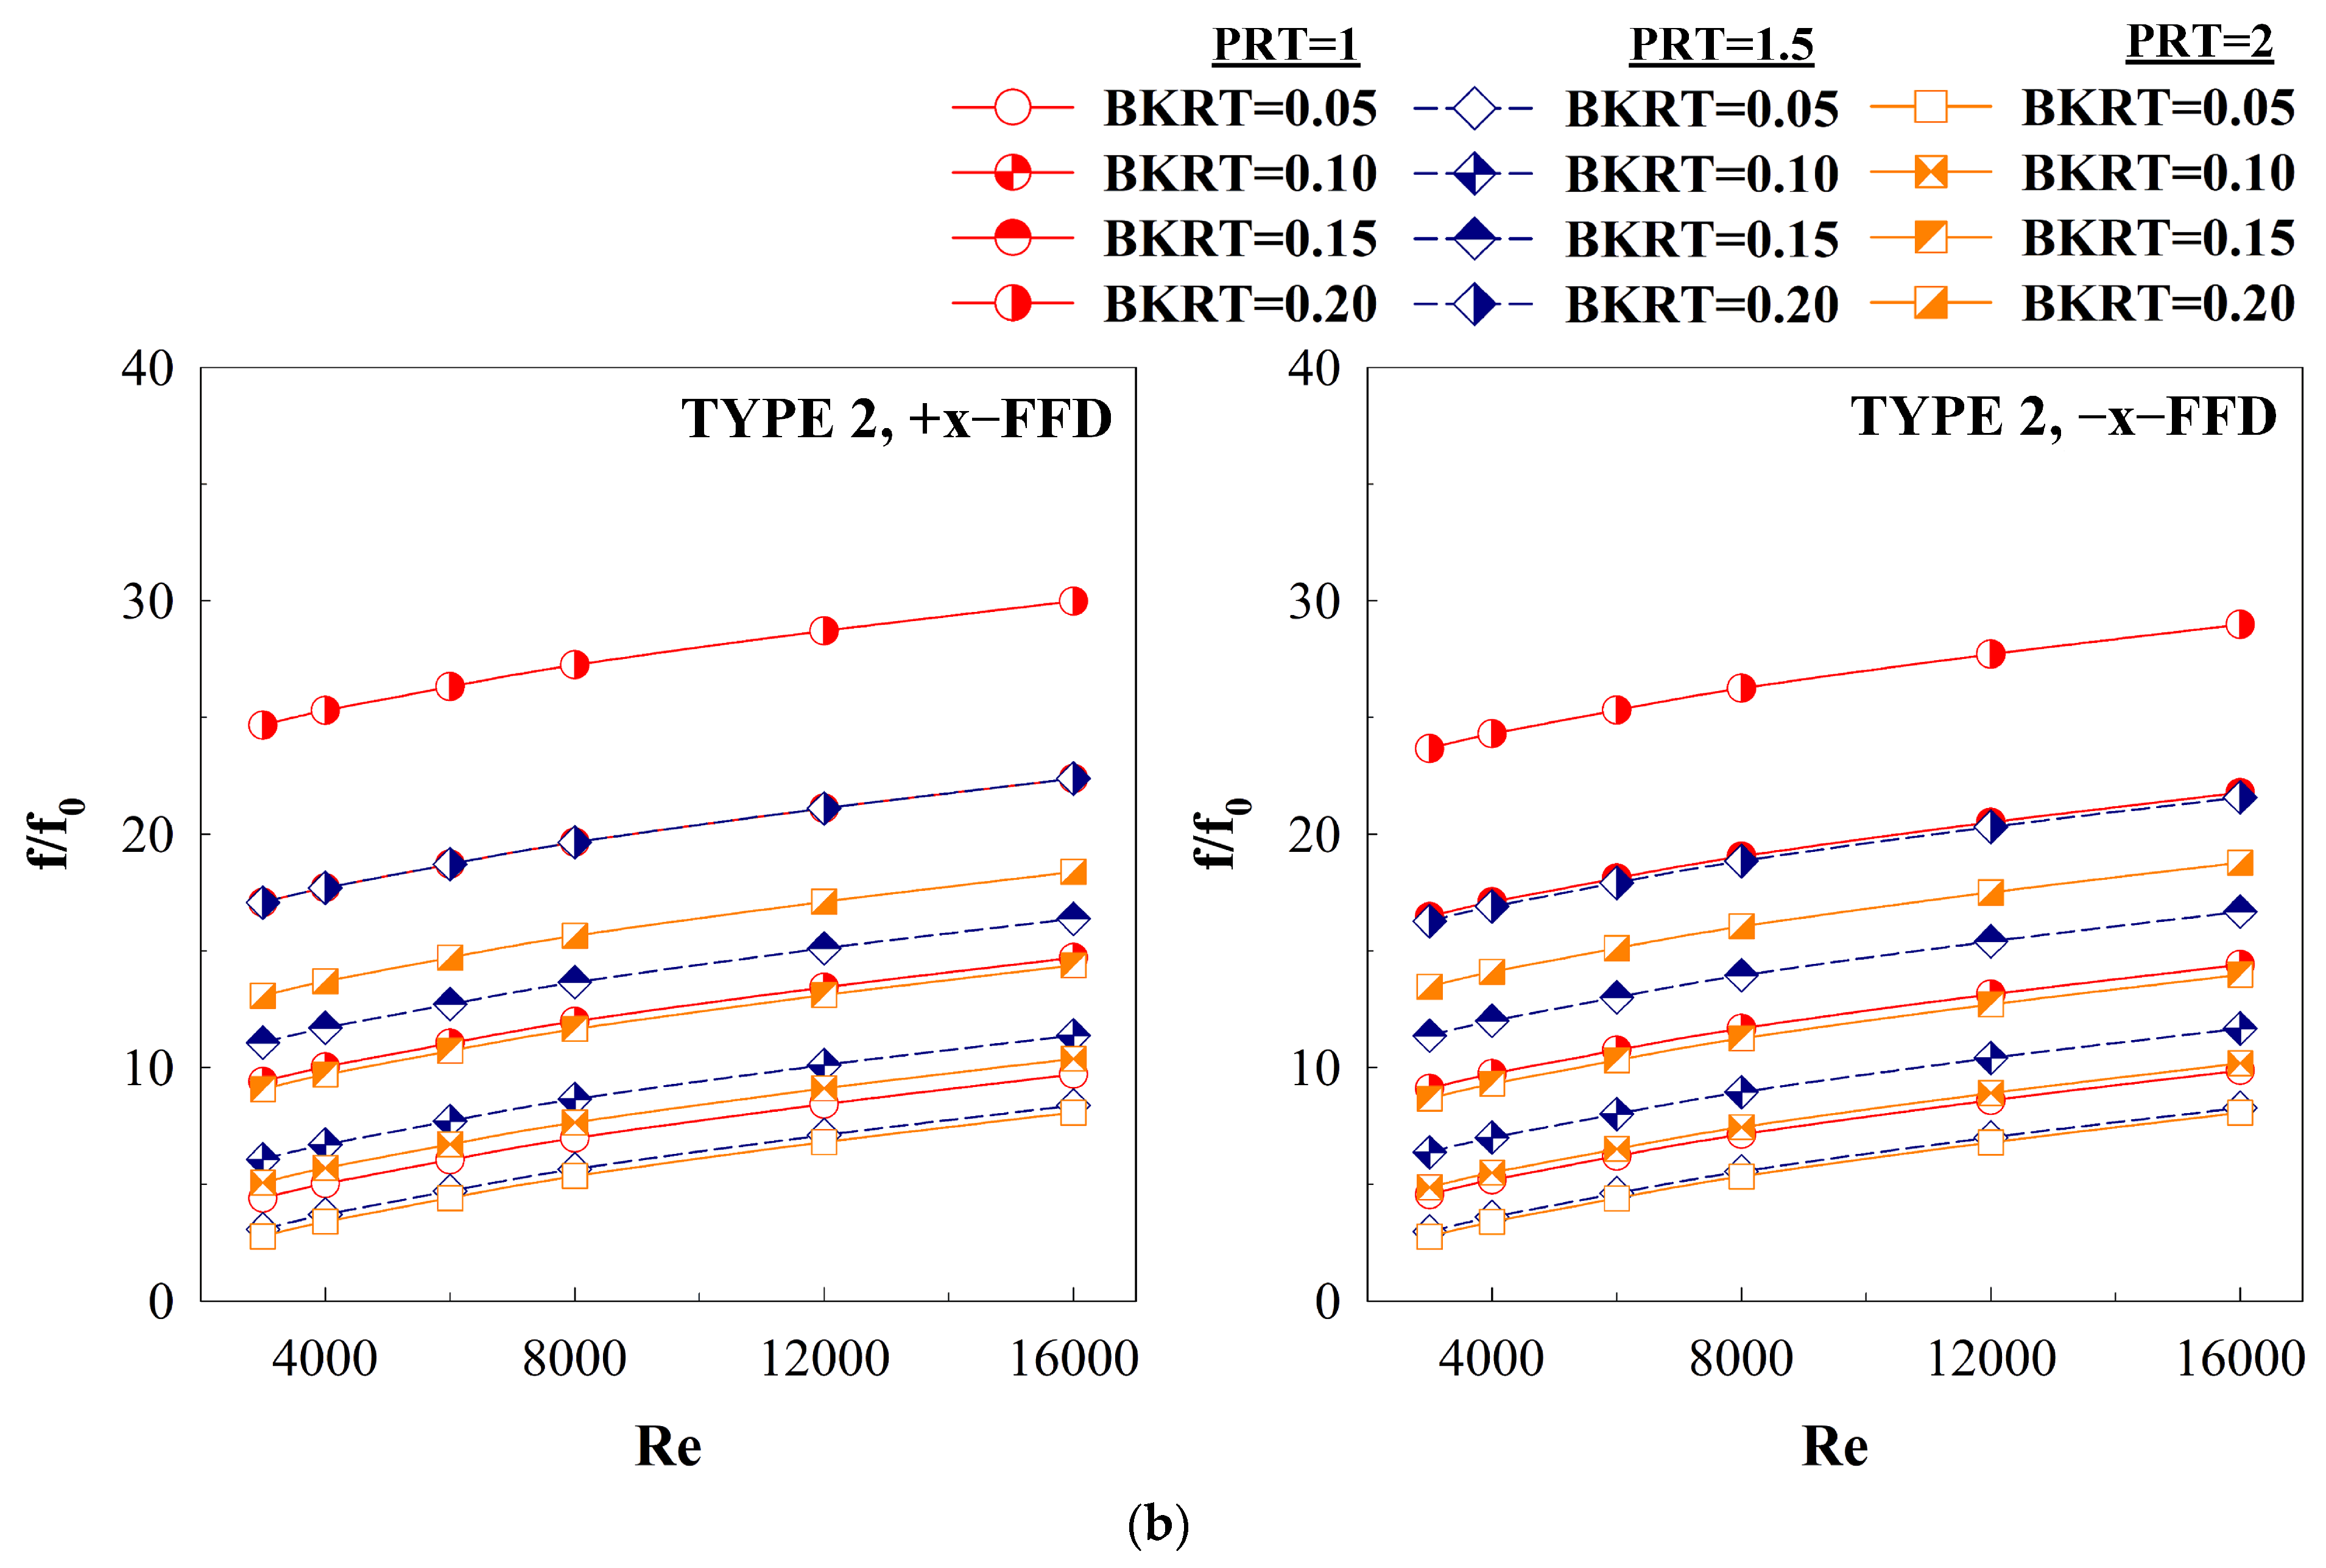
5.2. Performance Assessment

In the previous section, the airflow behavior and heat transfer characteristics within the SQHX equipped with DXVIT were presented. This analysis provided insights into the changes in flow structure and heat transfer as the studied parameters varied. However, to comprehensively explain the observed phenomena, a quantitative summary is required.
In this section, the results of the study are summarized using dimensionless variables, which offer a convenient way to compare with other systems. The dimensionless variable chosen to describe heat transfer is the Nusselt number, while the friction factor is used to represent the pressure drop across the system. To evaluate the performance advantage of installing DXVIT, the thermal enhancement factor is employed. This parameter allows for comparison under identical pumping power conditions, providing insights into whether the DXVIT installation offers a favorable balance between enhanced heat transfer and increased pressure drop.
Figure 11, Figure 12 and Figure 13 show the relationship between Nu/Nu0, f/f0, and TEF with Re for DXVIT types 1 and 2, respectively. The results from the study indicate that an increase in BKRT and a decrease in PRT lead to an increase in Nu/Nu0 and f/f0. This is because increasing BKRT and decreasing PRT raise the pressure drop across the front and rear of the DXVIT. As mentioned in the section describing the behavior in the SQHX, the pressure drop induces vortex flow. Therefore, increasing BKRT and reducing PRT enhance the pressure drop in the system. This increased pressure drop directly correlates with vortex strength, the degree of disturbance in the ThBL, the convective heat transfer coefficient, and the heat transfer rate.
The installation of DXVIT in the SQHX provides a higher heat transfer rate than a smooth tube without DXVIT for both types. This is clearly observed as the Nu/Nu0 value exceeds 1 in all the studied cases. The pressure drop follows the same trend—when DXVIT is added to the SQHX, the f/f0 value is greater than 1, meaning the pressure drop is higher than that of a smooth tube without DXVIT in every case.
When analyzing the Thermal Enhancement Factor (TEF), which compares the benefit of installing DXVIT under the same pump power, it is found that TEF is greater than 1 in most cases. This indicates that installing DXVIT offers a thermal advantage over a smooth tube (where a smooth tube or reference case gives TEF = 1). The trend of TEF consistently decreases as the Re increases. Therefore, the highest TEF is observed at Re = 3000, while the lowest TEF occurs at Re = 16,000.
For DXVIT type 1 with flow direction +x, the Nu/Nu0 values range from 3.10 to 5.29, 2.9 to 4.89, and 2.10 to 3.89 for PRT = 1, 1.5, and 2, respectively. The f/f0 values range from 5.77 to 35.08, 2.77 to 25.08, and 2.77 to 21.08 for PRT = 1, 1.5, and 2, respectively. The maximum TEF for all PRT values is observed at BKRT = 0.05, with values of 2.15, 2.65, and 2.06 for PRT = 1, 1.5, and 2, respectively.
For DXVIT type 1 with flow direction −x, the heat transfer enhancement compared to a smooth tube ranges from 3.13 to 4.79, 2.8 to 4.69, and 1.98 to 3.19 for PRT = 1, 1.5, and 2, respectively. The f/f0 values range from 6.77 to 29.08, 3.37 to 22.08, and 3.27 to 18.08 for PRT = 1, 1.5, and 2, respectively. The maximum TEF is observed at BKRT = 0.05, with values of 2.07, 2.39, and 1.87 for PRT = 1, 1.5, and 2, respectively.
For DXVIT type 2 with flow direction +x, the f/f0 values range from 4.40 to 29.98, 3.07 to 22.38, and 2.77 to 18.38 for PRT = 1, 1.5, and 2, respectively. The Nu/Nu0 values range from 2.64 to 4.99, 2.4 to 4.59, and 2.35 to 4.39 for PRT = 1, 1.5, and 2, respectively. The smallest BKRT value of 0.05 provides the highest TEF, with values of 2.09, 2.19, and 2.24 for PRT = 1, 1.5, and 2, respectively.
For DXVIT type 2 with airflow direction along the −x axis, the Nu/Nu0 values range from 2.54 to 4.69, 2.30 to 4.49, and 2.25 to 4.29 for PRT = 1, 1.5, and 2, respectively. The f/f0 values range from 4.56 to 28.98, 2.97 to 21.58, and 2.75 to 18.78 for PRT = 1, 1.5, and 2, respectively. The highest TEF for PRT = 1 is 2.01, observed at BKRT = 0.05. For PRT = 1.5, the highest TEF is 2.15, observed at BKRT = 0.05 and 0.10. For PRT = 2, the highest TEF is 2.17, observed at BKRT = 0.05.
When comparing the influence of flow direction, it is found that airflow in the +x direction provides a higher heat transfer rate and pressure drop than airflow in the −x direction. This trend is consistent for both DXVIT types. When comparing the influence of DXVIT type, DXVIT type 1 provides a higher heat transfer rate than type 2 at PRT = 1 and 1.5, but a lower heat transfer rate at PRT = 2. This trend is consistent for both flow directions. Regarding the friction factor ratio (f/f0), DXVIT type 1 generally has a higher value than type 2 in most cases, except for PRT = 2 in the −x direction, where the opposite trend is observed.
The results from the study on TEF values at Re = 3000, which is the Reynolds number that provides the highest TEF, were used to create a contour plot showing the relationship between TEF, PRT, and BKRT, as shown in Figure 14. This graph demonstrates that the highest TEF values are found at BKRT values in the range of 0.05–0.10, which provides the best heat transfer and pressure drop ratio enhancement. The PRT value that provides the best TEF is PRT = 1.5 for DXVIT type 1, while for DXVIT type 2, the best TEF is found in the PRT range of 1.5–2.
The study clearly shows that the best TEF does not occur at BKRT = 0.20 and PRT = 1, even though it gives the best heat transfer rate, as it also results in a very high pressure drop in the system. The increased heat transfer rate is beneficial for the heat exchanger system, but the increased pressure drop has a negative impact on the system. Both of these factors must be considered when analyzing the benefits of installing DXVIT.
This study investigates the flow range of Re = 3000–16,000, with BKRT ranging from 0.05 to 0.20 and PRT ranging from 1 to 2. For DXVIT types 1 and 2, correlation equations for Nu/Nu0 and f/f0 are derived and presented in Figure 15a,b, respectively. The data from all case studies in this research have been plotted in a graph, where the y-axis represents data obtained from the developed correlation, and the x-axis represents data collected using a commercial program for this study. The corresponding equations are shown as Equations (14)–(17) for Nu/Nu0 and Equations (18)–(21) for f/f0.
N u / N u 0 = 27.110 Re 0.131 Pr 0.4 ( B K R T ) 0.236 ( P R T ) 0.504   for   Type   1 ,   + x
N u / N u 0 = 24.000 Re 0.139 Pr 0.4 ( B K R T ) 0.168 ( P R T ) 0.553   for   Type   1 ,   x
N u / N u 0 = 27.238 Re 0.133 Pr 0.4 ( B K R T ) 0.295 ( P R T ) 0.172   for   Type   2 ,   + x
N u / N u 0 = 26.181 Re 0.138 Pr 0.4 ( B K R T ) 0.282 ( P R T ) 0.128   for   Type   2 ,   x
f / f 0 = 8.436 Re 0.139 ( B K R T ) 0.987 ( P R T ) 0.920   for   Type   1 ,   + x
f / f 0 = 6.287 Re 0.302 ( B K R T ) 0.788 ( P R T ) 0.909   for   Type   1 ,   x
f / f 0 = 6.036 Re 0.328 ( B K R T ) 0.937 ( P R T ) 0.688   for   Type   2 ,   + x
f / f 0 = 5.664 Re 0.330 ( B K R T ) 0.923 ( P R T ) 0.676   for   Type   2 ,   x

6. Conclusions

The development of DXVIT to alter the flow characteristics and thermal behavior has led to the enhancement of heat exchanger systems for this research. The study investigates the influence of DXVIT size, DXVIT type, installation spacing, and flow direction on the flow behavior of air and heat transfer. The study was conducted in the turbulent flow regime, which covers a range of flow conditions for various industrial heat exchanger devices. The findings can be summarized as follows:
1. Flow behavior still maintains the concept of vortex flow generation, similar to the V-baffle (the prototype of an effective vortex generator for heat transfer). The mechanism of vortex flow generation arises from the pressure difference between the front and rear of the DXVIT, which results from the obstruction of the flow by the DXVIT. The resulting vortex flow affects the SQHX in two ways.
Part 1: It creates a disturbance at the heat transfer surface (SQHX walls), directly affecting the disturbance of the ThBL (thinning of the ThBL), which is the reason for the increase in the heat transfer coefficient.
Part 2: It helps improve the mixing of fluids with different temperatures.
2. Increasing the size of DXVIT and decreasing the installation spacing directly affect the vortex strength, which is proportional to the level of disturbance in the ThBL, heat transfer coefficient, and heat transfer rate.
3. The type and flow direction influence changes in the flow structure, which, in turn, affects the location of the disturbance in the ThBL.
4. The highest heat transfer rate of 5.29 is observed with DXVIT type 1 at flow direction +x. The highest TEF observed in this study occurs at BKRT = 0.05, PRT = 1.5, DXVIT type 1, and flow direction +x, with a value of 2.65.
5. From the analysis of the feasibility of manufacturing and installing the components in an actual heat exchanger system, it was found that the production of the components is relatively easy, similar to the production of V-baffle flow generators. The manufacturing cost is not significantly different. Additionally, the workpiece can be manufactured using modern forming processes [25], such as 3D printing [26].

Author Contributions

Conceptualization, A.B. and W.J.; methodology, A.B. and W.J.; software, A.B. and W.J.; validation, A.B. and W.J.; formal analysis, A.B. and W.J.; investigation, A.B. and W.J.; resources, A.B. and W.J.; data curation, A.B. and W.J.; writing—original draft preparation, A.B. and W.J.; writing—review and editing, A.B. and W.J.; visualization, A.B. and W.J.; supervision, A.B. and W.J.; project administration, A.B. and W.J.; funding acquisition, A.B. and W.J. All authors have read and agreed to the published version of the manuscript.

Funding

This work was financially supported by King Mongkut’s Institute of Technology Ladkrabang [2568-02-01-005].

Data Availability Statement

Data available on request due to restrictions.

Acknowledgments

The authors would like to thank Pongjet Promvonge for suggestions.

Conflicts of Interest

The authors declare no conflict of interest.

Abbreviations

Symbols and abbreviations
bDXVIT thickness, m
C μ constant value (=0.0845)
Dhhydraulic diameter (=H for square duct), m
ffriction factor, friction loss
hconvective heat transfer coefficient, W m−2 K−1
Hduct height (=duct width), m
k turbulent   kinetic   energy ,   k = ( u i u i ¯ ) / 2
ktthermal conductivity, W m−1 K−1
Lnumerical model length/periodic length
NuNusselt number
pstatic pressure, Pa
Ppitch spacing, m
PrPrandtl number
ReReynolds number
Tfluid temperature, K
u ¯ fluid mean velocity in square duct, m s−1
uimean component of velocity in the direction xi, m s−1
ufluctuating component of velocity, m s−1
Greek symbol
ρdensity, kg m−3
µdynamic viscosity, kg m−1s−1
μ e f f effective viscosity
μ t turbulent   viscosity ,   μ t = ρ C μ k 2 / ε
α k inverse effective Prandtl number for k
α ε ε
inverse effective Prandtl number for Γmolecular thermal diffusivity
Γtturbulent thermal diffusivity
δ i j a Kronecker delta
Subscripts
0smooth duct
ppdriving force
Abbreviations
BKRTblockage ratio
DXVITdiscrete X-V inducing turbulator
PRTpitch ratio
SQHXsquare duct heat exchanger
TEFthermal enhancement factor (=(Nu/Nu0)/(f/f0)1/3)
ThBL thermal boundary layer

References

  1. Mukhlif, E.A.; Abed, W.M. Influences of submerged V-broken rib geometry on the hydrothermal performance of vortex and engulfment flow regimes within a T-channel. Int. Commun. Heat Mass Transf. 2024, 159, 108325. [Google Scholar] [CrossRef]
  2. Kumar, A.; Pathak, M. Flow and heat transfer characteristics of gas turbine blade channels with compound V-rib-dimple structures. Int. Commun. Heat Mass Transf. 2024, 157, 107823. [Google Scholar] [CrossRef]
  3. Sutar, S.; Rout, S.K.; Senapati, J.R.; Barik, D.; Dennison, M.S.; Praveenkumar, S. Numerical investigation on the thermohydraulic performance of a solar air heater duct featuring parabolic rib turbulators on the absorber plate. Case Stud. Therm. Eng. 2024, 64, 105399. [Google Scholar] [CrossRef]
  4. Hegde, A.K.; Pai, R.; Karanth, K.V. Influence of solar insolation on energy and exergy efficiency of a rectangular duct solar air heater with various types of V rib roughness: An analytical approach. Int. Commun. Heat Mass Transf. 2024, 153, 107397. [Google Scholar] [CrossRef]
  5. Liu, C.; Bao, Y.; Li, B.; Lyu, P.; Liu, X.; Rao, Z. Experimental study on heat transfer enhancement and flow performance of microencapsulated phase change slurry in microchannel with different rib structures. Int. J. Heat Mass Transf. 2025, 237, 126437. [Google Scholar] [CrossRef]
  6. Wang, L.; Lv, C.; Liu, X.; Mao, J.; Zhang, D.; Liu, Y.; Li, M. Research on improving heat transfer performance by using wavy ribs with different cross sections. Appl. Therm. Eng. 2024, 257, 124397. [Google Scholar] [CrossRef]
  7. Kumar, M.S.; Abraham, S. Experimental and numerical studies of detailed heat transfer and flow characteristics in the rib turbulated annulus of a double pipe heat exchanger. Int. J. Therm. Sci. 2025, 207, 109382. [Google Scholar] [CrossRef]
  8. Cao, Z.; Luo, L.; Yang, X.; Yan, H.; Du, W. Effects of turning vane on flow control and heat transfer in ribbed two-pass channel with varied rib patterns. Int. J. Therm. Sci. 2025, 207, 109342. [Google Scholar] [CrossRef]
  9. Wang, L.; Liu, X.; Cui, T.; Mao, J.; Lv, C.; Zhang, D.; Liu, Y.; Li, M. Multi-objective analysis of the turbine blade internal cooling channel with discontinuous bionic S-shaped ribs. Int. J. Therm. Sci. 2025, 207, 109371. [Google Scholar] [CrossRef]
  10. Chen, L.; Weigand, B.; Yang, H.; Shi, Y.; Yang, Q. Numerical heat transfer investigation of a single impingement jet with combined V-ribs and preliminary optimization of V-rib configuration in initial crossflow. Int. J. Therm. Sci. 2024, 197, 108799. [Google Scholar] [CrossRef]
  11. Majmader, F.B.; Hasan, M.J. Effects of bidirectional rib arrangements on turbulent flow structure and heat transfer characteristics of a two-pass channel for turbine blade internal cooling. Int. Commun. Heat Mass Transf. 2024, 156, 107688. [Google Scholar] [CrossRef]
  12. Chhaparwal, G.K.; Goyal, R.; Srivastava, A.; Goyal, A.; Oza, A.D.; Siddiqui, M.I.H.; Natrayan, L.; Kumar, L.; Chandrakant, S. Numerical and experimental investigation of a solar air heater duct with circular detached ribs to improve its efficiency. Case Stud. Therm. Eng. 2024, 60, 104780. [Google Scholar] [CrossRef]
  13. Wang, L.; Liu, X.; Mao, J.; Lv, C.; Zhang, D.; Liu, Y.; Li, M. Analyzing the impact of sinusoidal wavy rib geometric parameters on turbine blade thermal and fluid dynamics. Int. J. Therm. Sci. 2024, 203, 109162. [Google Scholar] [CrossRef]
  14. Wang, Q.; Tao, J.; Cui, Z.; Zhang, T.; Chen, G. Numerical simulation of fluid and heat transfer characteristics of microchannel heat sink with fan-shaped grooves and triangular truncated ribs. Int. Commun. Heat Mass Transf. 2024, 155, 107580. [Google Scholar] [CrossRef]
  15. Fu, H.; Sun, H.; Luan, J.; Yang, L.; Luan, Y.; Magagnato, F. The heat transfer enhancement mechanism of W-shaped micro-ribs on impingement cooling. Appl. Therm. Eng. 2024, 252, 123658. [Google Scholar] [CrossRef]
  16. Wang, L.; Lv, C.; Mao, J.; Li, Y.; Zhang, D.; Liu, X. Effects of non-uniform wavy ribs on flow and heat transfer characteristics of turbine blade cooling channel. Appl. Therm. Eng. 2024, 248, 123249. [Google Scholar] [CrossRef]
  17. Prasad, J.S.; Datta, A.; Mondal, S. Numerical analysis of a solar air heater with offset transverse ribs placed near the absorber plate. Renew. Energy 2024, 227, 120608. [Google Scholar] [CrossRef]
  18. Boonloi, A.; Jedsadaratanachai, W. Thermal behaviors and flow profiles in a square channel fitted with X–V modified ribs: A numerical analysis. Case Stud. Therm. Eng. 2023, 49, 103282. [Google Scholar] [CrossRef]
  19. Tamang, S.; Ali, E.; Park, H. A novel concept for a rib turbulator for optimizing the cooling performance in a square channel. Int. J. Heat Mass Transf. 2024, 221, 125144. [Google Scholar] [CrossRef]
  20. Zhu, Q.; Wang, Z.; Zeng, J.; Wen, X.; Deng, H.; He, W.; Zhao, T. Numerical study on flow and heat transfer in a novel symmetric sinusoidal wavy microchannel heat sink with rectangular rib prisms. Int. J. Therm. Sci. 2024, 197, 108807. [Google Scholar] [CrossRef]
  21. Patankar, S.V.; Liu, C.H.; Sparrow, E.M. Fully developed flow and heat transfer in ducts having streamwise-periodic variations of cross-sectional area. J. Heat Transf. 1977, 99, 180–186. [Google Scholar] [CrossRef]
  22. Boonloi, A.; Jedsadaratanachai, W. Turbulent forced convection in a square duct heat exchanger (SDHX) equipped with combined vortex turbulators (CVT): A numerical investigation. Int. Commun. Heat Mass Transf. 2025, 161, 108421. [Google Scholar] [CrossRef]
  23. Cengel, Y.A.; Ghajar, A.J. Heat and Mass Transfer: Fundamentals & Applications, 5th ed.; McGraw-Hill Education: New York, NY, USA, 2015; ISBN 978-981-4595-27-8. [Google Scholar]
  24. Promvonge, P.; Skullong, S.; Kwankaomeng, S.; Thiangpong, C. Heat transfer in square duct fitted diagonally with angle-finned tape—Part 1: Experimental study. Int. Commun. Heat Mass Transf. 2012, 39, 617–624. [Google Scholar] [CrossRef]
  25. Tan, Y.; Ni, Y.; Xu, W.; Xie, Y.; Li, L.; Tan, D. Key technologies and development trends of the soft abrasive flow finishing method. J. Zhejiang Univ. Sci. A 2023, 24, 1043–1064. [Google Scholar] [CrossRef]
  26. Xu, P.; Li, Q.; Wang, C.; Li, L.; Tan, D.; Wu, H. Interlayer healing mechanism of multipath deposition 3D printing models and interlayer strength regulation method. J. Manuf. Process. 2025, 141, 1031–1047. [Google Scholar] [CrossRef]
Figure 1. Square duct inserted with DXVIT for (a) type 1 and (b) type 2.
Energies 18 01906 g001
Figure 2. Smooth duct validation.
Energies 18 01906 g002
Figure 3. Grid independence for (a) Nu/Nu0 and (b) f/f0 of type 1 DXVIT at BKRT = 0.15, PRT = 1 and +x flow direction.
Energies 18 01906 g003
Figure 4. Comparison with the experimental result [24] for (a) Nusselt number and (b) friction factor.
Energies 18 01906 g004aEnergies 18 01906 g004b
Figure 5. Flow configuration and thermal characteristic in a square duct inserted with type 1 DXVIT at BKRT = 0.15, PRT = 1, Re = 4000, and +x flow direction.
Energies 18 01906 g005
Figure 6. 3D vortex flow for (a) longitudinal vortex flow and (b) longitudinal vortex flow and streamline in the transverse plane in a square duct inserted with type 1 DXVIT at BKRT = 0.15, PRT = 1, Re = 4000, and +x flow direction.
Energies 18 01906 g006
Figure 7. Streamline in transverse plane and temperature contours in transverse planes at various BKRT for PRT = 1, Re = 4000, +x flow direction, type 1 DXVIT.
Energies 18 01906 g007
Figure 8. Streamline in the transverse plane and temperature contours in transverse planes at various PRT for BKRT = 0.15, Re = 4000, +x flow direction, type 1 DXVIT.
Energies 18 01906 g008
Figure 9. Streamline in the transverse plane and temperature contours in transverse planes at various DXVIT types and flow directions for BKRT = 0.15, Re = 4000.
Energies 18 01906 g009
Figure 10. Local Nusselt number contours on duct walls at various DXVIT types and flow directions for BKRT = 0.15, Re = 4000.
Energies 18 01906 g010
Figure 11. Nu/Nu0 vs. Re for (a) type 1 and (b) type 2.
Energies 18 01906 g011aEnergies 18 01906 g011b
Figure 12. f/f0 vs. Re for (a) type 1 and (b) type 2.
Energies 18 01906 g012aEnergies 18 01906 g012b
Figure 13. TEF vs. Re for (a) type 1 and (b) type 2.
Energies 18 01906 g013aEnergies 18 01906 g013b
Figure 14. TEF contours at various PRT and BKRT at Re = 3000.
Energies 18 01906 g014
Figure 15. Correlations for (a) Nu/Nu0 and (b) f/f0.
Energies 18 01906 g015aEnergies 18 01906 g015b
Disclaimer/Publisher’s Note: The statements, opinions and data contained in all publications are solely those of the individual author(s) and contributor(s) and not of MDPI and/or the editor(s). MDPI and/or the editor(s) disclaim responsibility for any injury to people or property resulting from any ideas, methods, instructions or products referred to in the content.

