


Techno-Economic Analysis of Geospatial Green Hydrogen Potential Using Solar Photovoltaic in Niger: Application of PEM and Alkaline Water Electrolyzers

 ,
,  ,
,
Abstract
1. Introduction
2. Materials and Methods
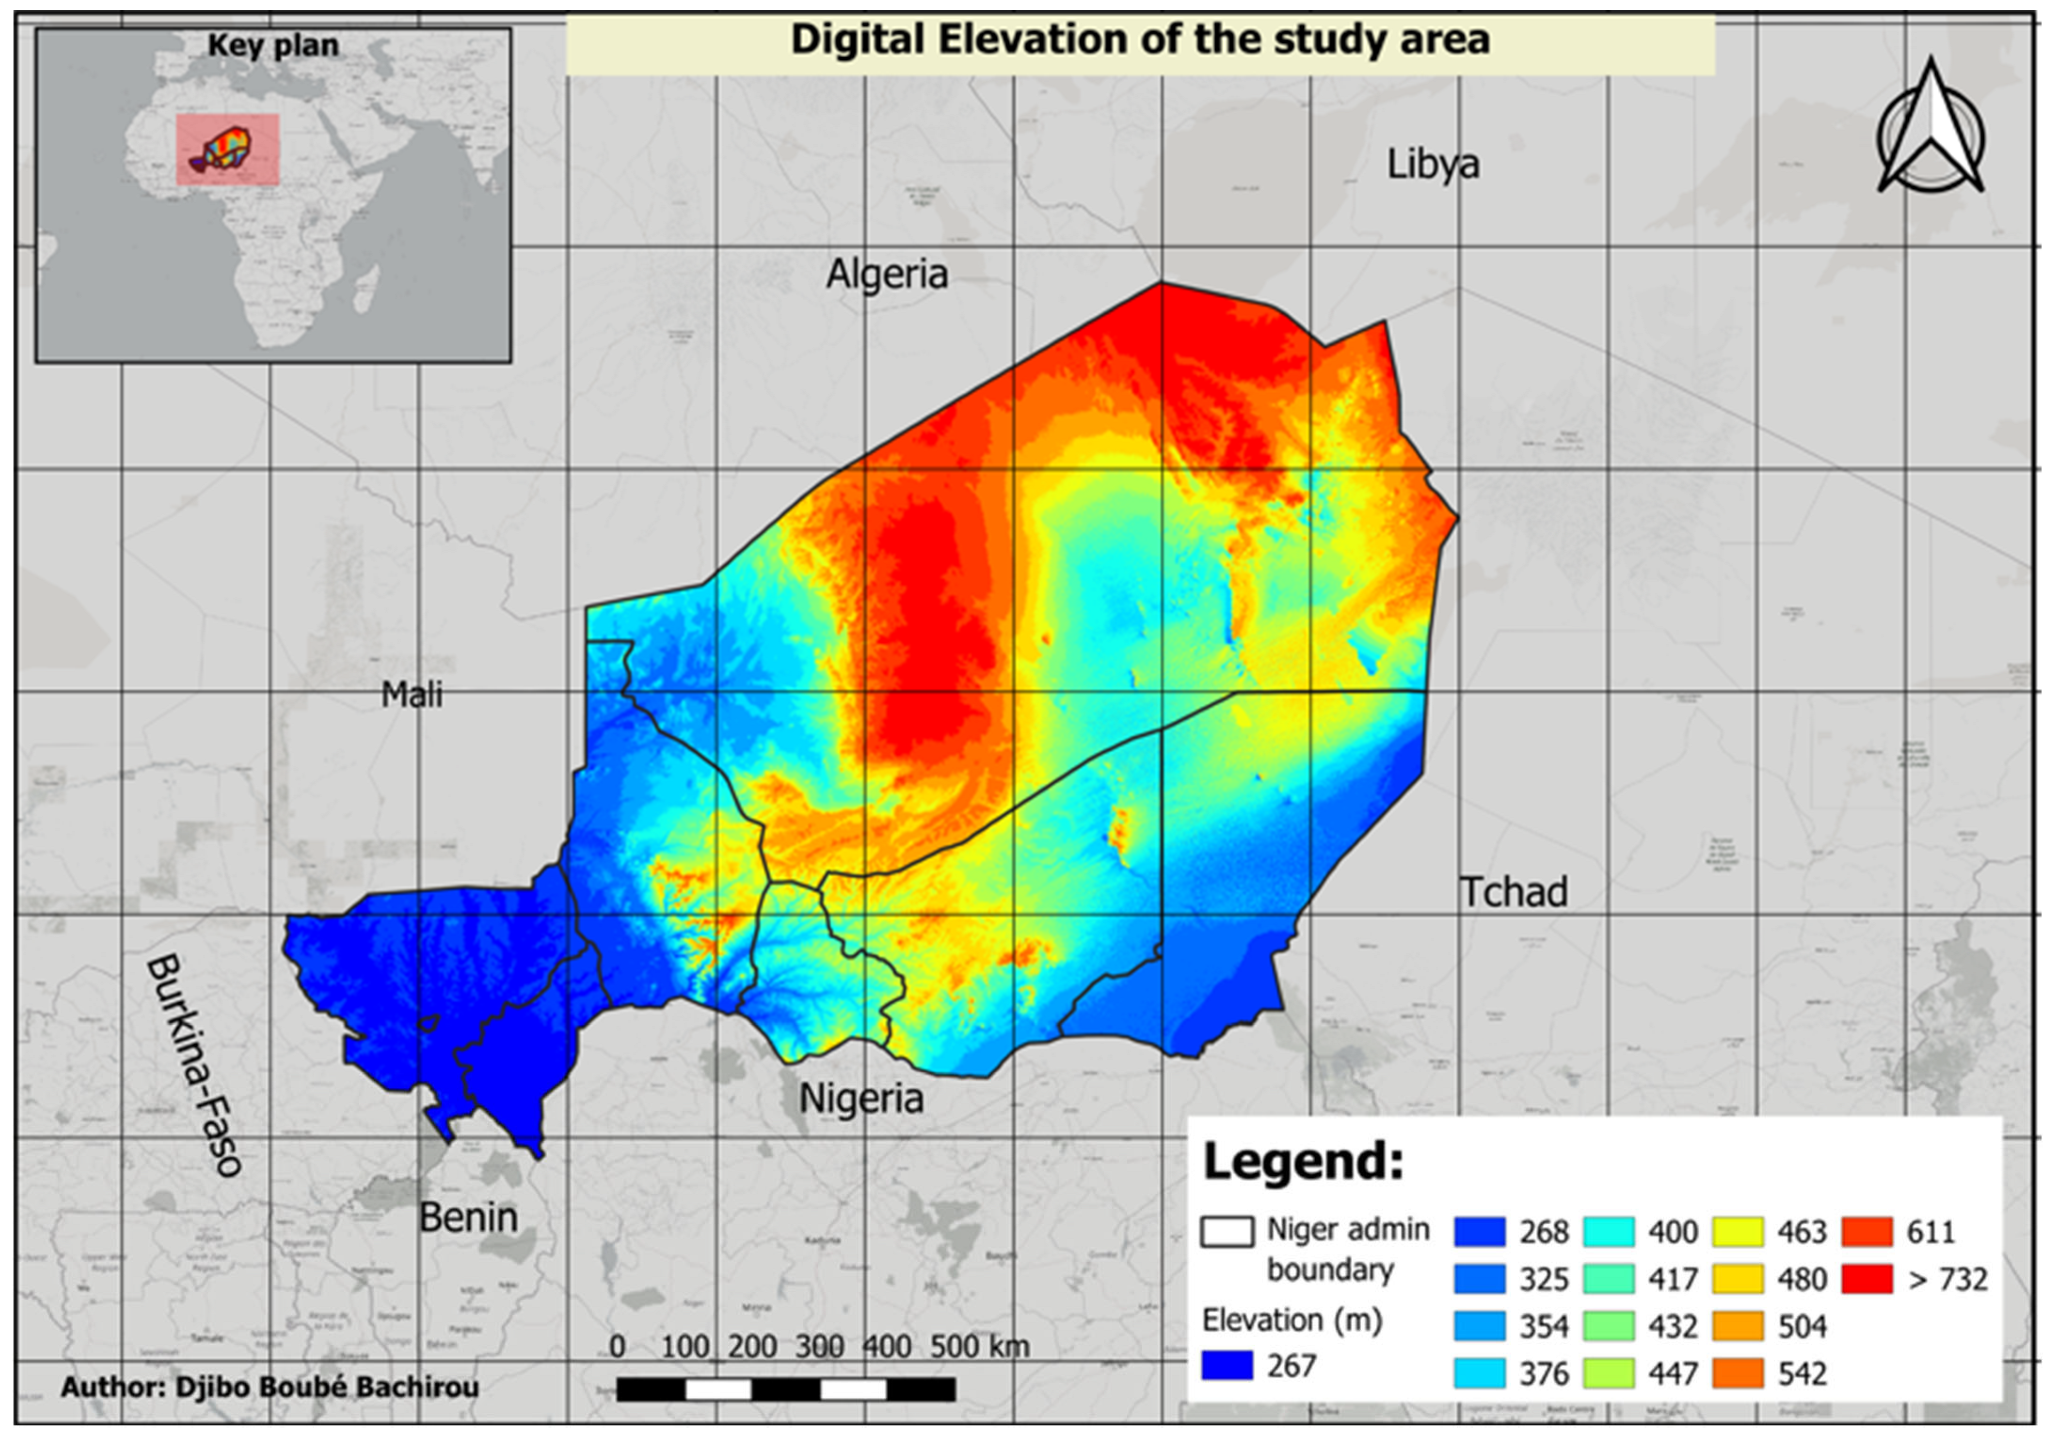
2.1. Study Area
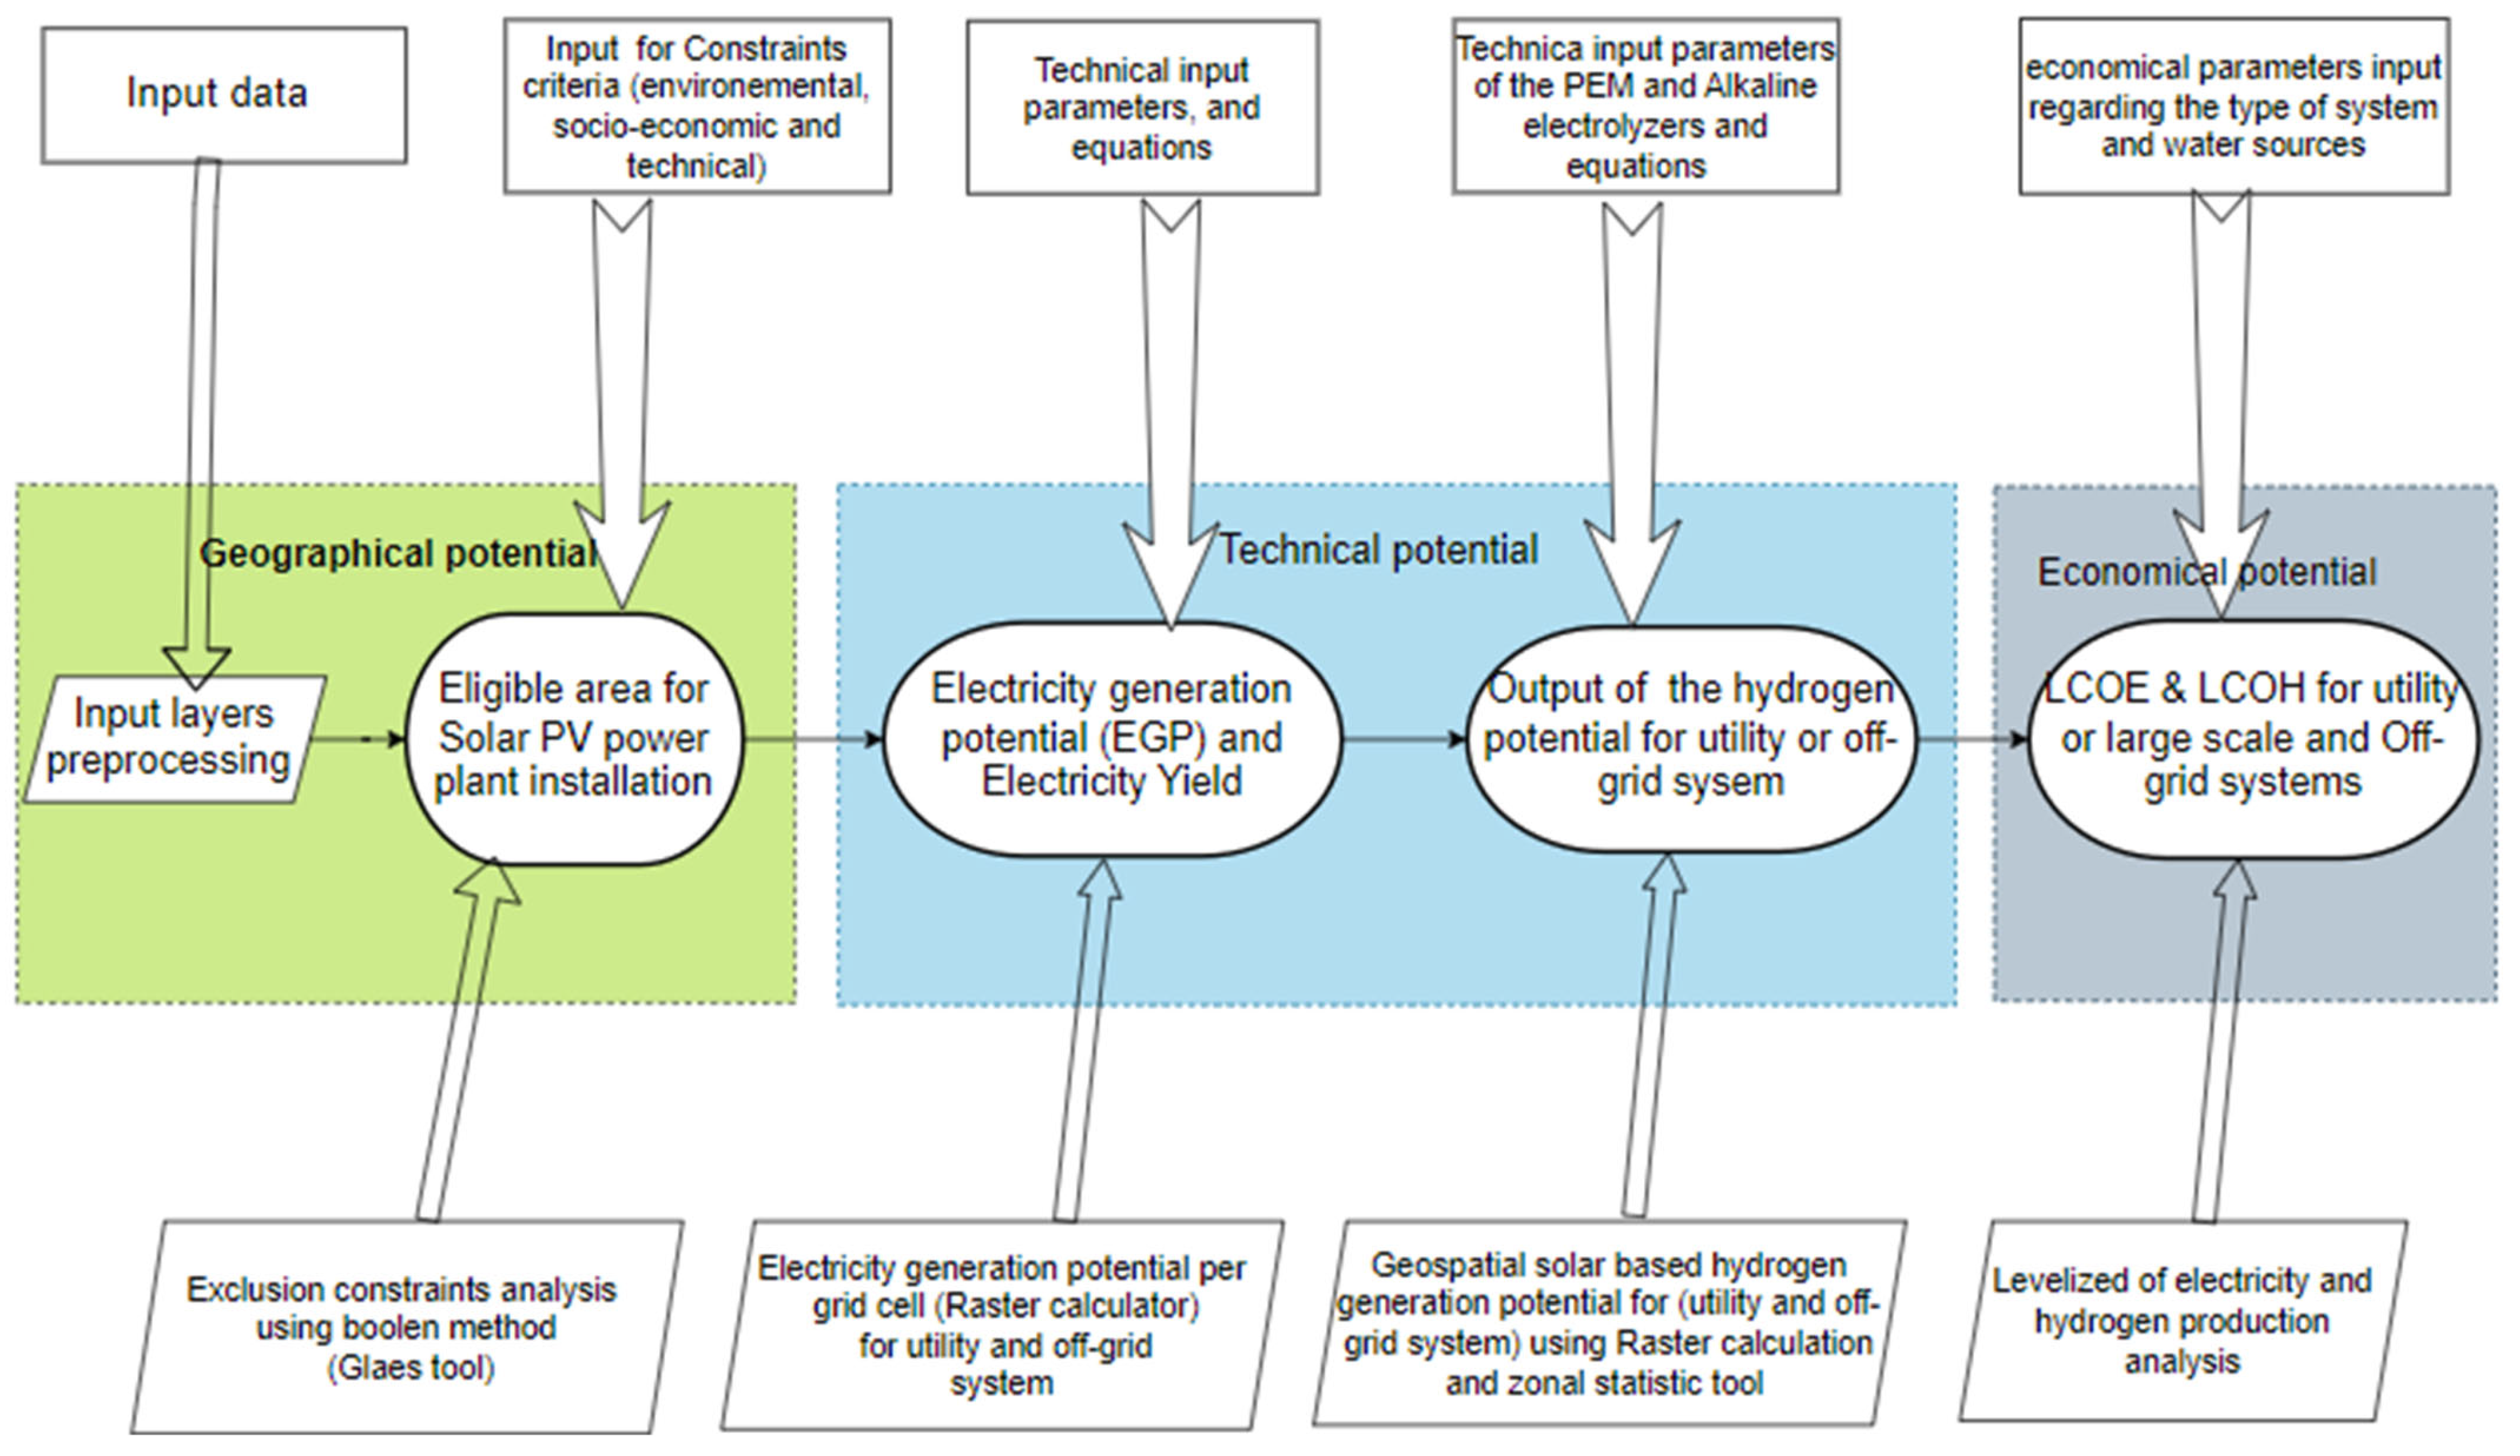
2.2. Methodology
2.2.1. Technical Potential Evaluation of Solar-Based Hydrogen Production
- (kWh/m2/year): the electricity generation potential;
- GHI: the global horizontal solar irradiance values for the cell at xy coordinates in (kWh/m2/year);
- : the efficiency of the PV panel in (%);
- the PV panel performance ratio in (%).
- : the specific PV electricity yield (kWh/kWp/year);
- : the area of the PV panel in (m2);
- : the nominal peak power of the panel (kWp).
- is the density of the green hydrogen potential in (kg/m2);
- is the efficiency of the electrolysis system (%);
- is the higher heating value (kWh/kg of H2).
2.2.2. Economic Analysis of Solar-Based Hydrogen Production
- CE is the investment cost of the electricity generation in (EUR/kWh);
- r and n represent, respectively, the discount rate and the projected lifetime;
- Celec is the investment cost of the electrolysis system (in EUR);
- is the annual hydrogen production potential (kg/year) in the year t.
- is the unit price of the electrolyzer (EUR/kWe);
- HHV represents the higher heating value (kWh/kg).
- : the specific water costs;
- : the water transport cost;
- : the water purification energy.

| Unit | Value | Reference | |
|---|---|---|---|
| Capex (2020 and 2030) | EUR/kWp | 1448.02 1346.64 | [45] |
| Opex | EUR/kWp | 15.28 | [45] |
| Lifetime | a | 25 | [53] |
| Interest rate | % | 4.9% | [54] |
| Unit | Value | Reference | |||
|---|---|---|---|---|---|
| Opex | % Capex/a | 2% capex | [55] | ||
| Cost of stack replace | EUR/kWel | 30% capex | [12] | ||
| Water demand | L/kgH2 | 21 | [12] | ||
| General water bodies | kWh/m3 | 0.4 | [56] | ||
| Water purification of ocean water | kWh/m3 | 3.7 | [57] | ||
| Specific water costs | EUR/m3 | 0.73 | [58] | ||
| Water transport | EUR/m3/100 km | 0.1 | [59] | ||
| Discount rate | % | 4.9 | [54] | ||
| Lifetime of the system | year | 20 | [44] | ||
| 2020 | 2030 | Reference | |||
| 5 MW | 100 MW | 5 MW | 100 MW | [46] | |
| Capex PEM water electrolyzer (EUR/KW) | 980 | 720 | 730 | 500 | |
| Capex alkaline water electrolyzer (EUR/KW) | 949 | 663 | 726 | 444 | |
3. Results and Discussion
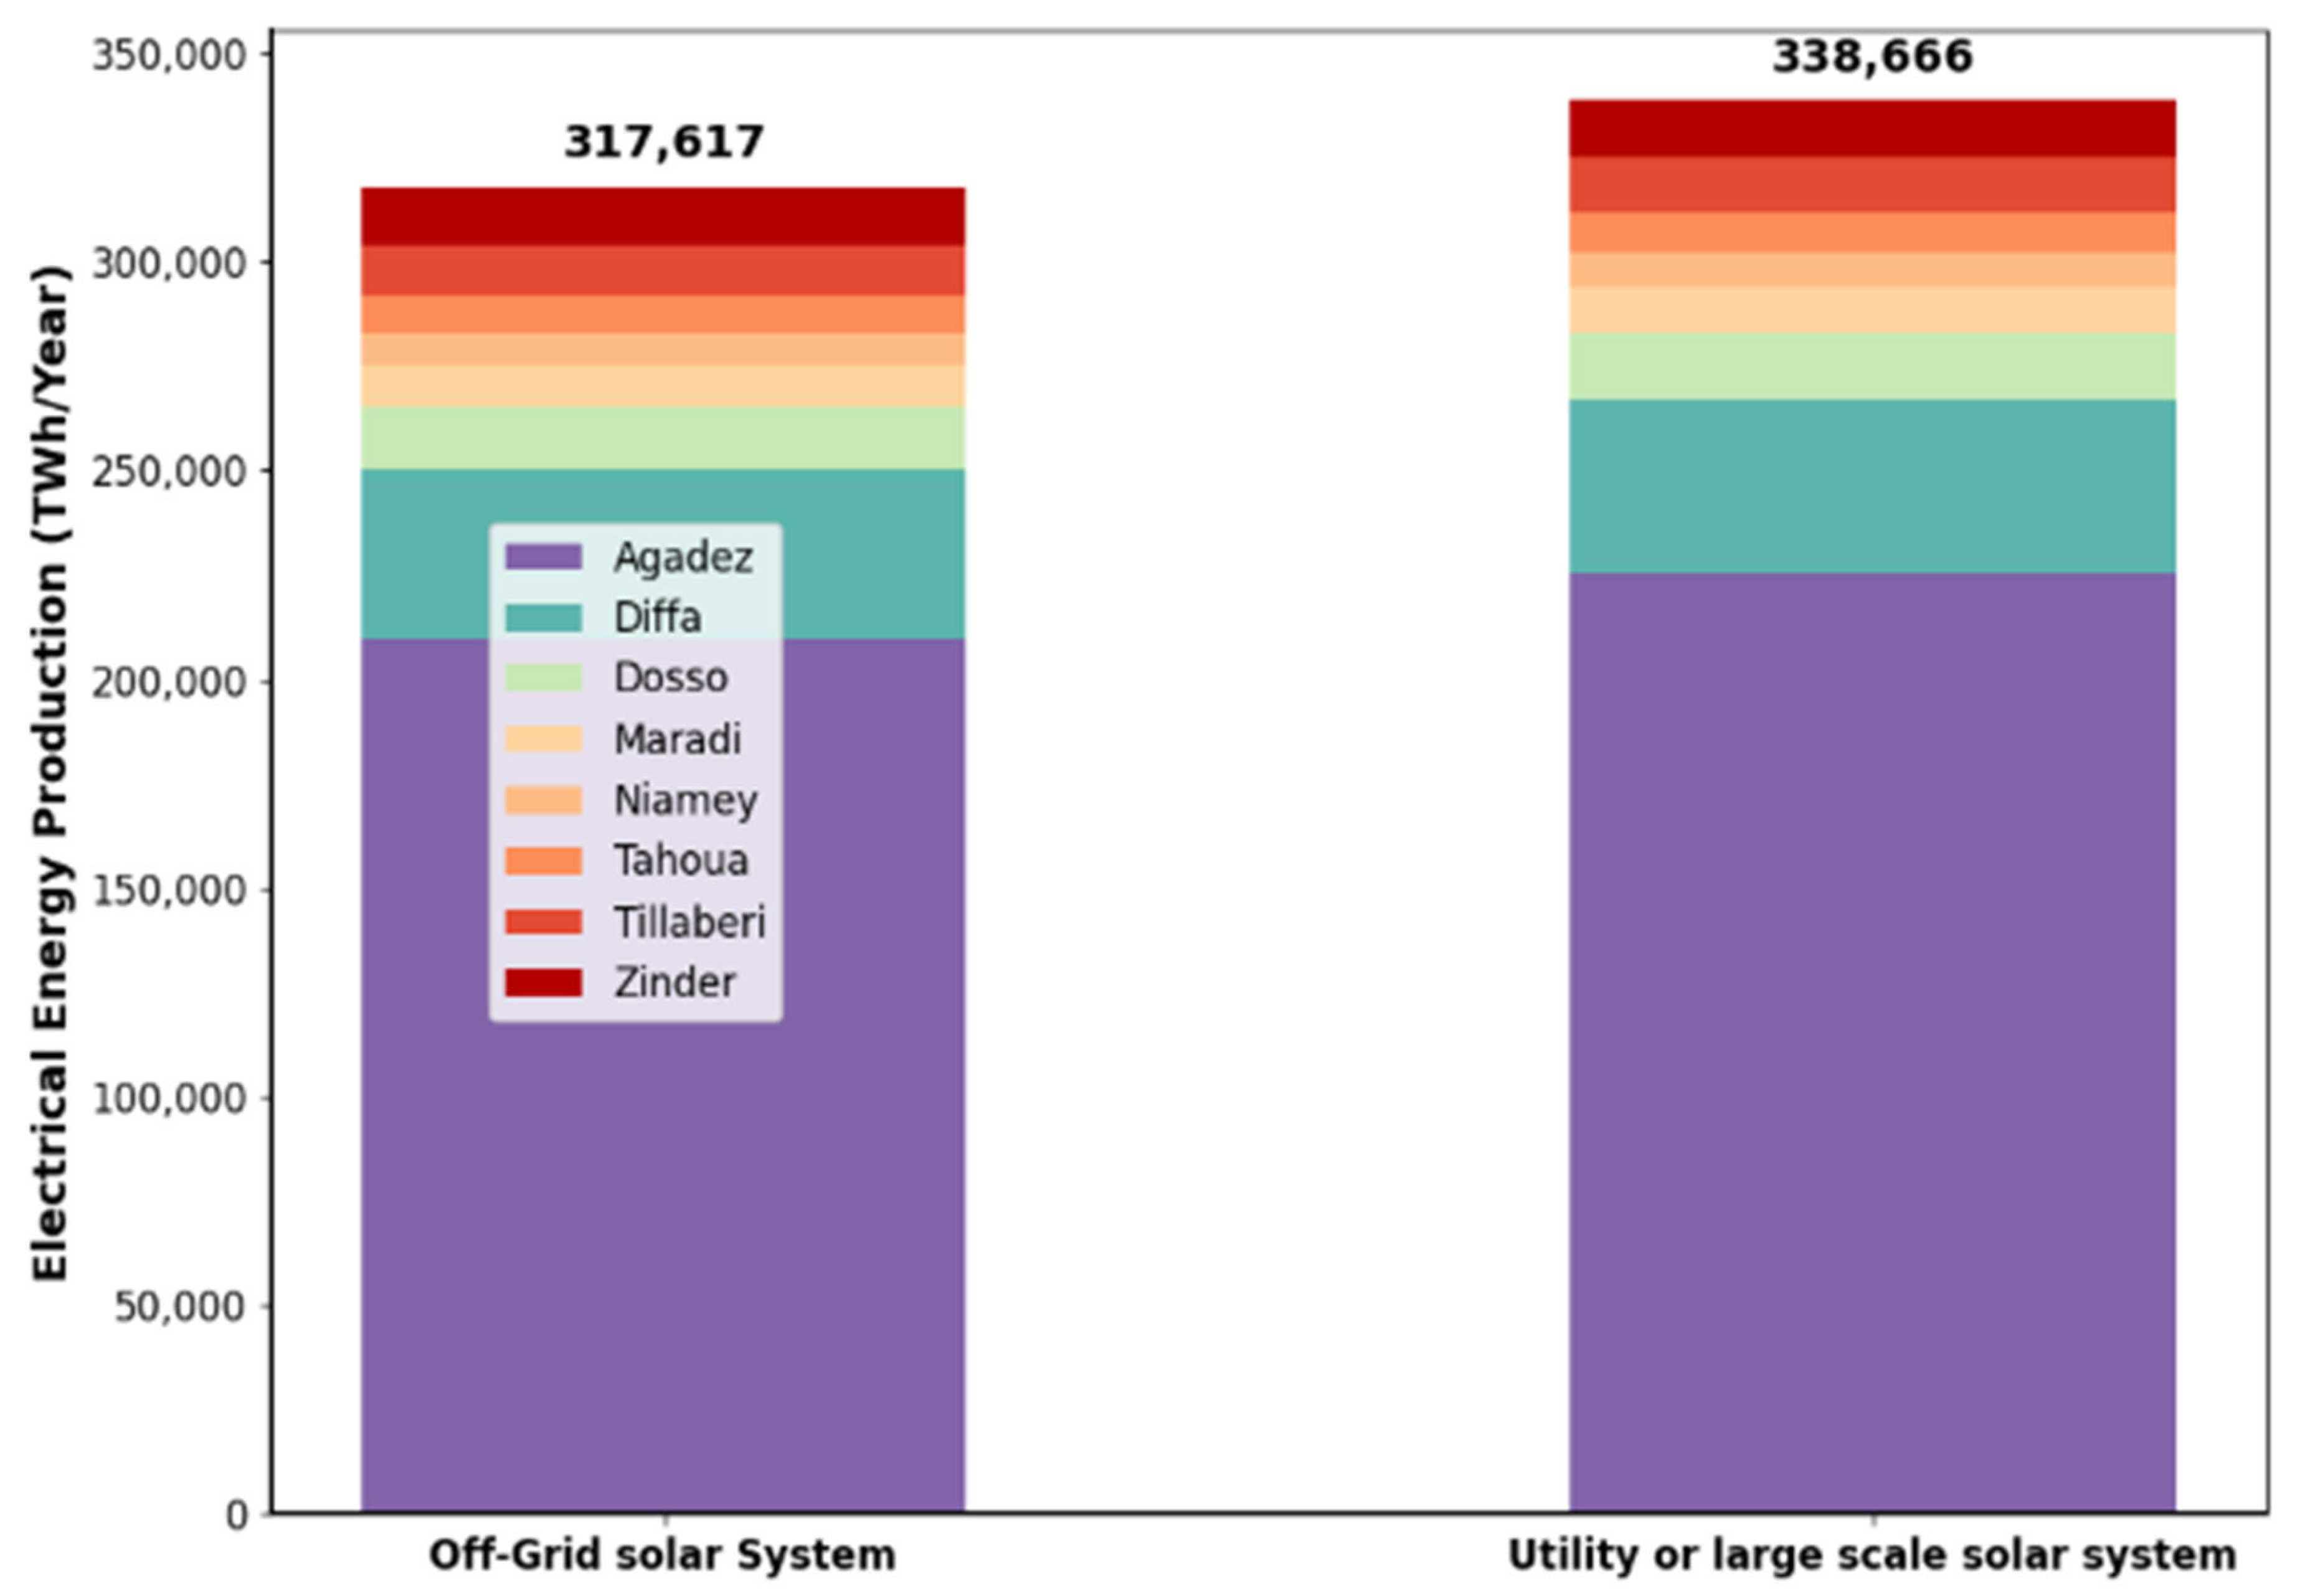
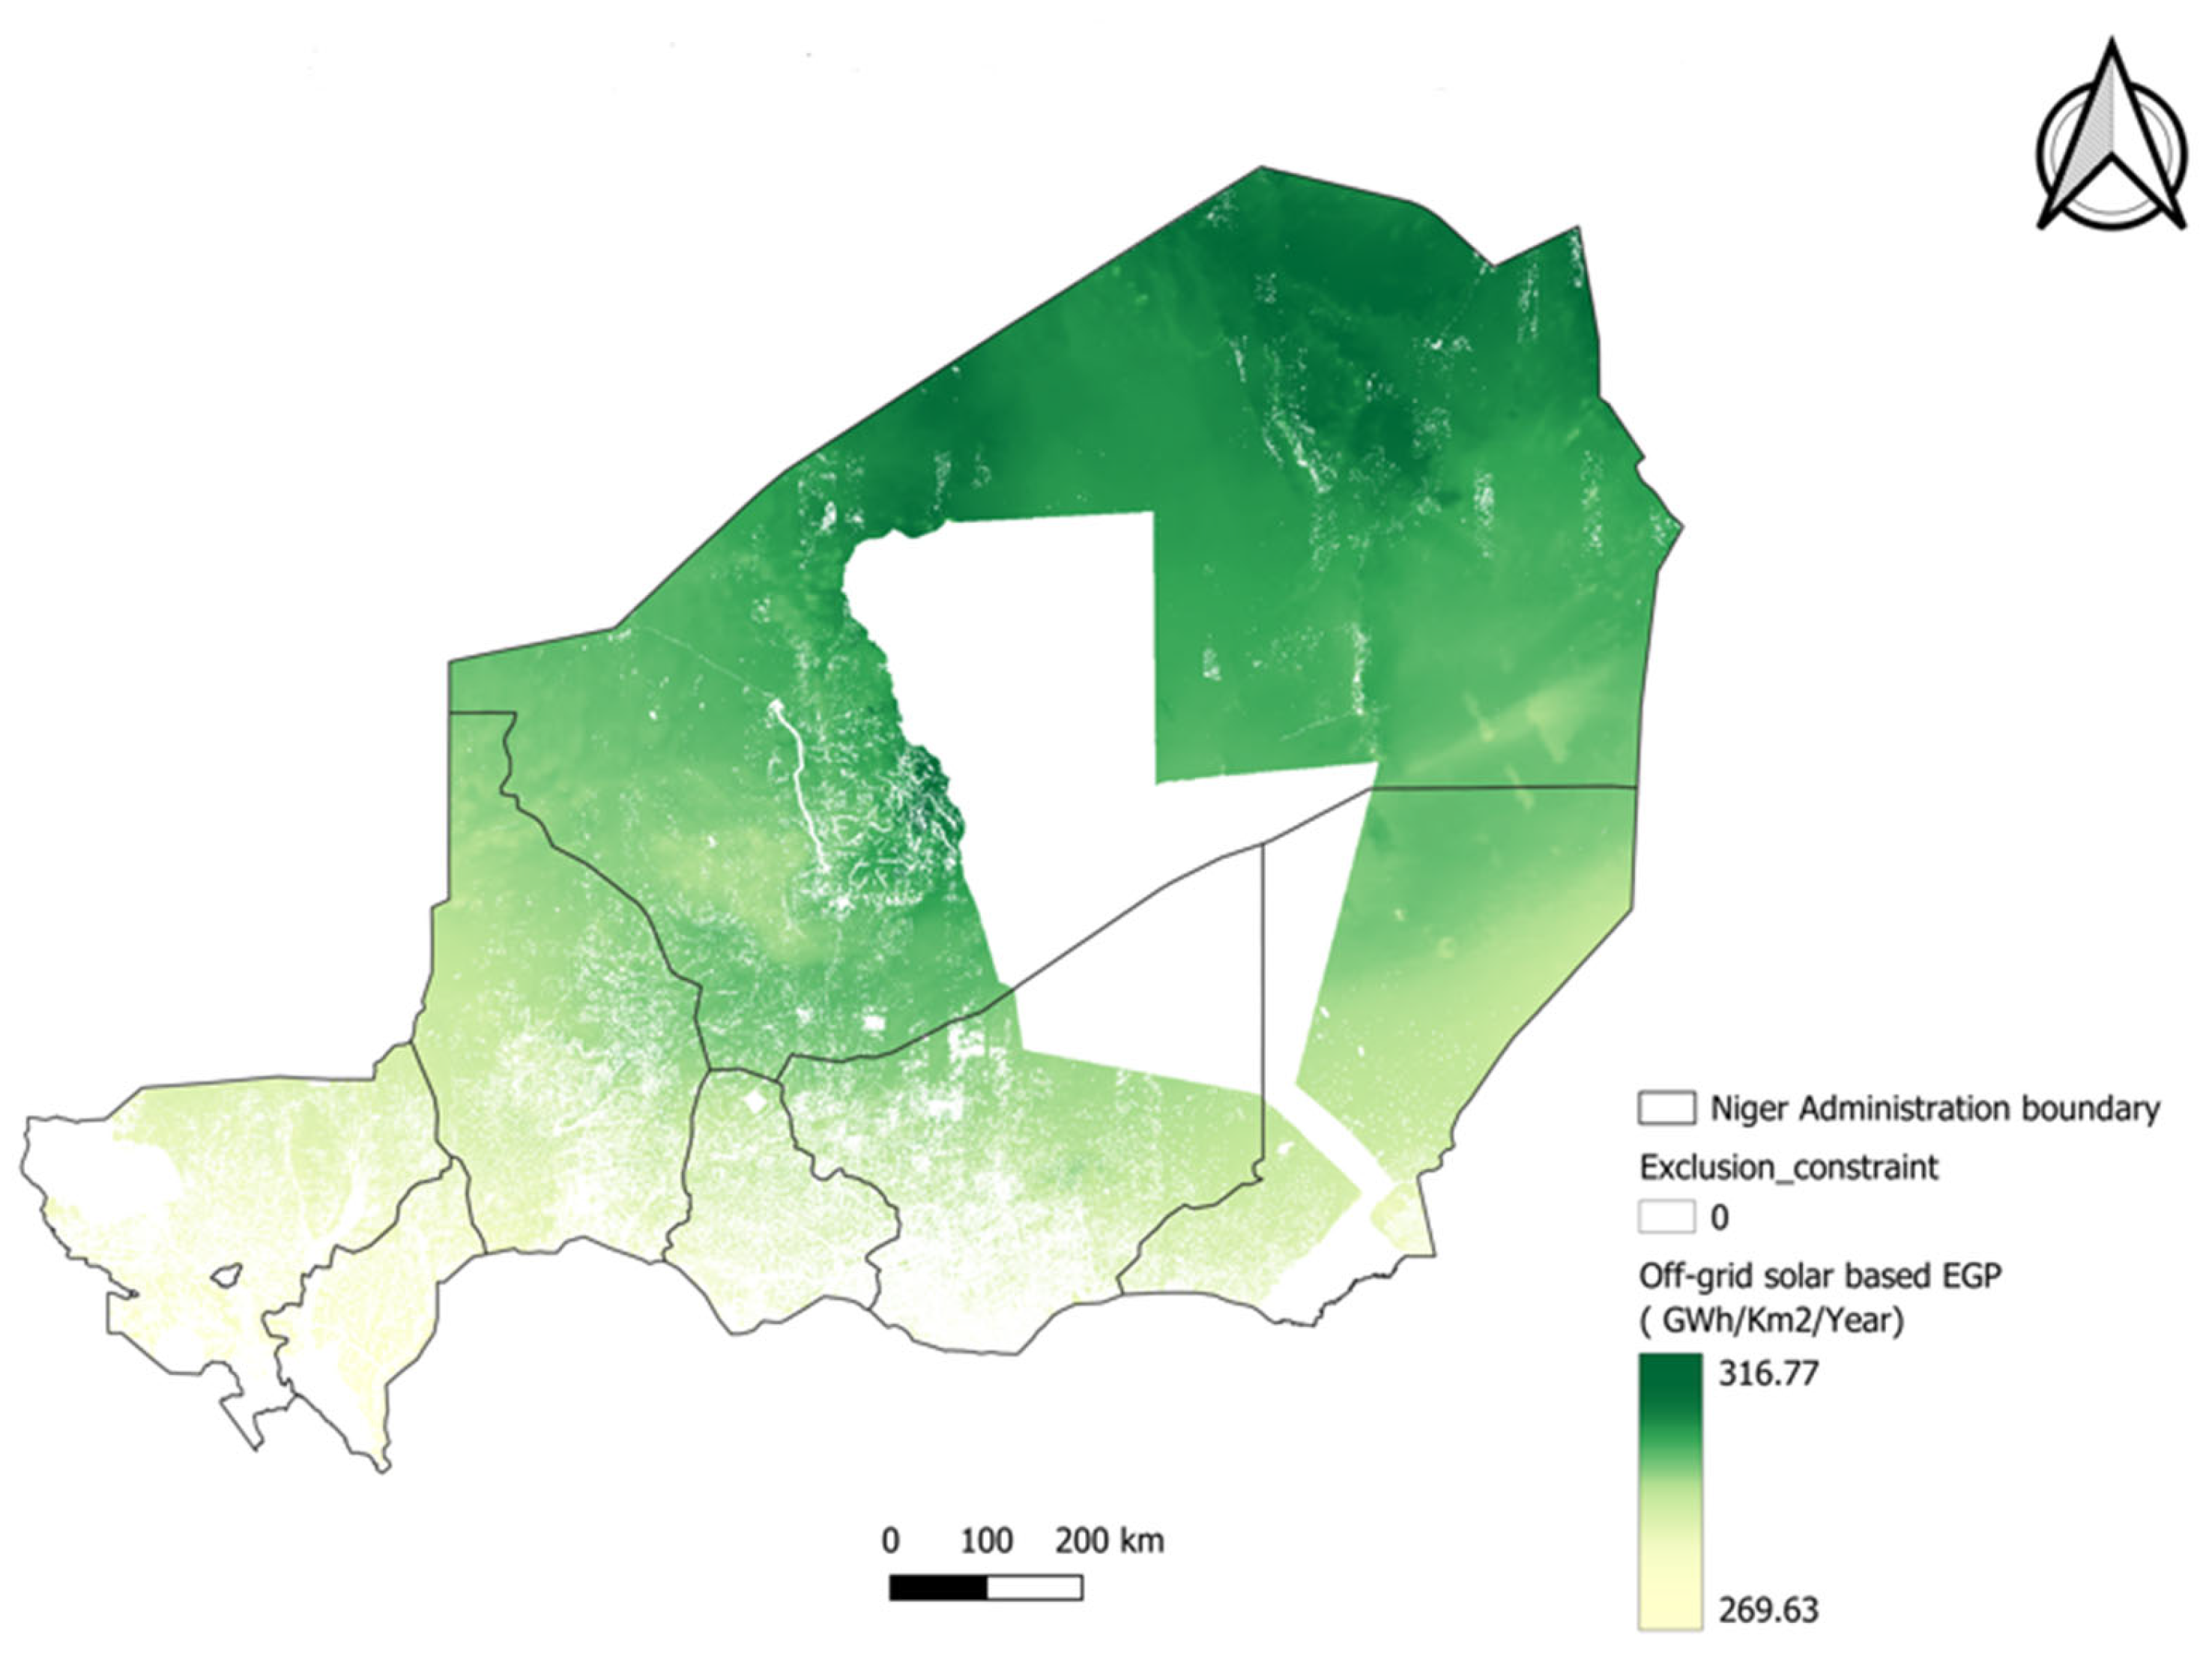
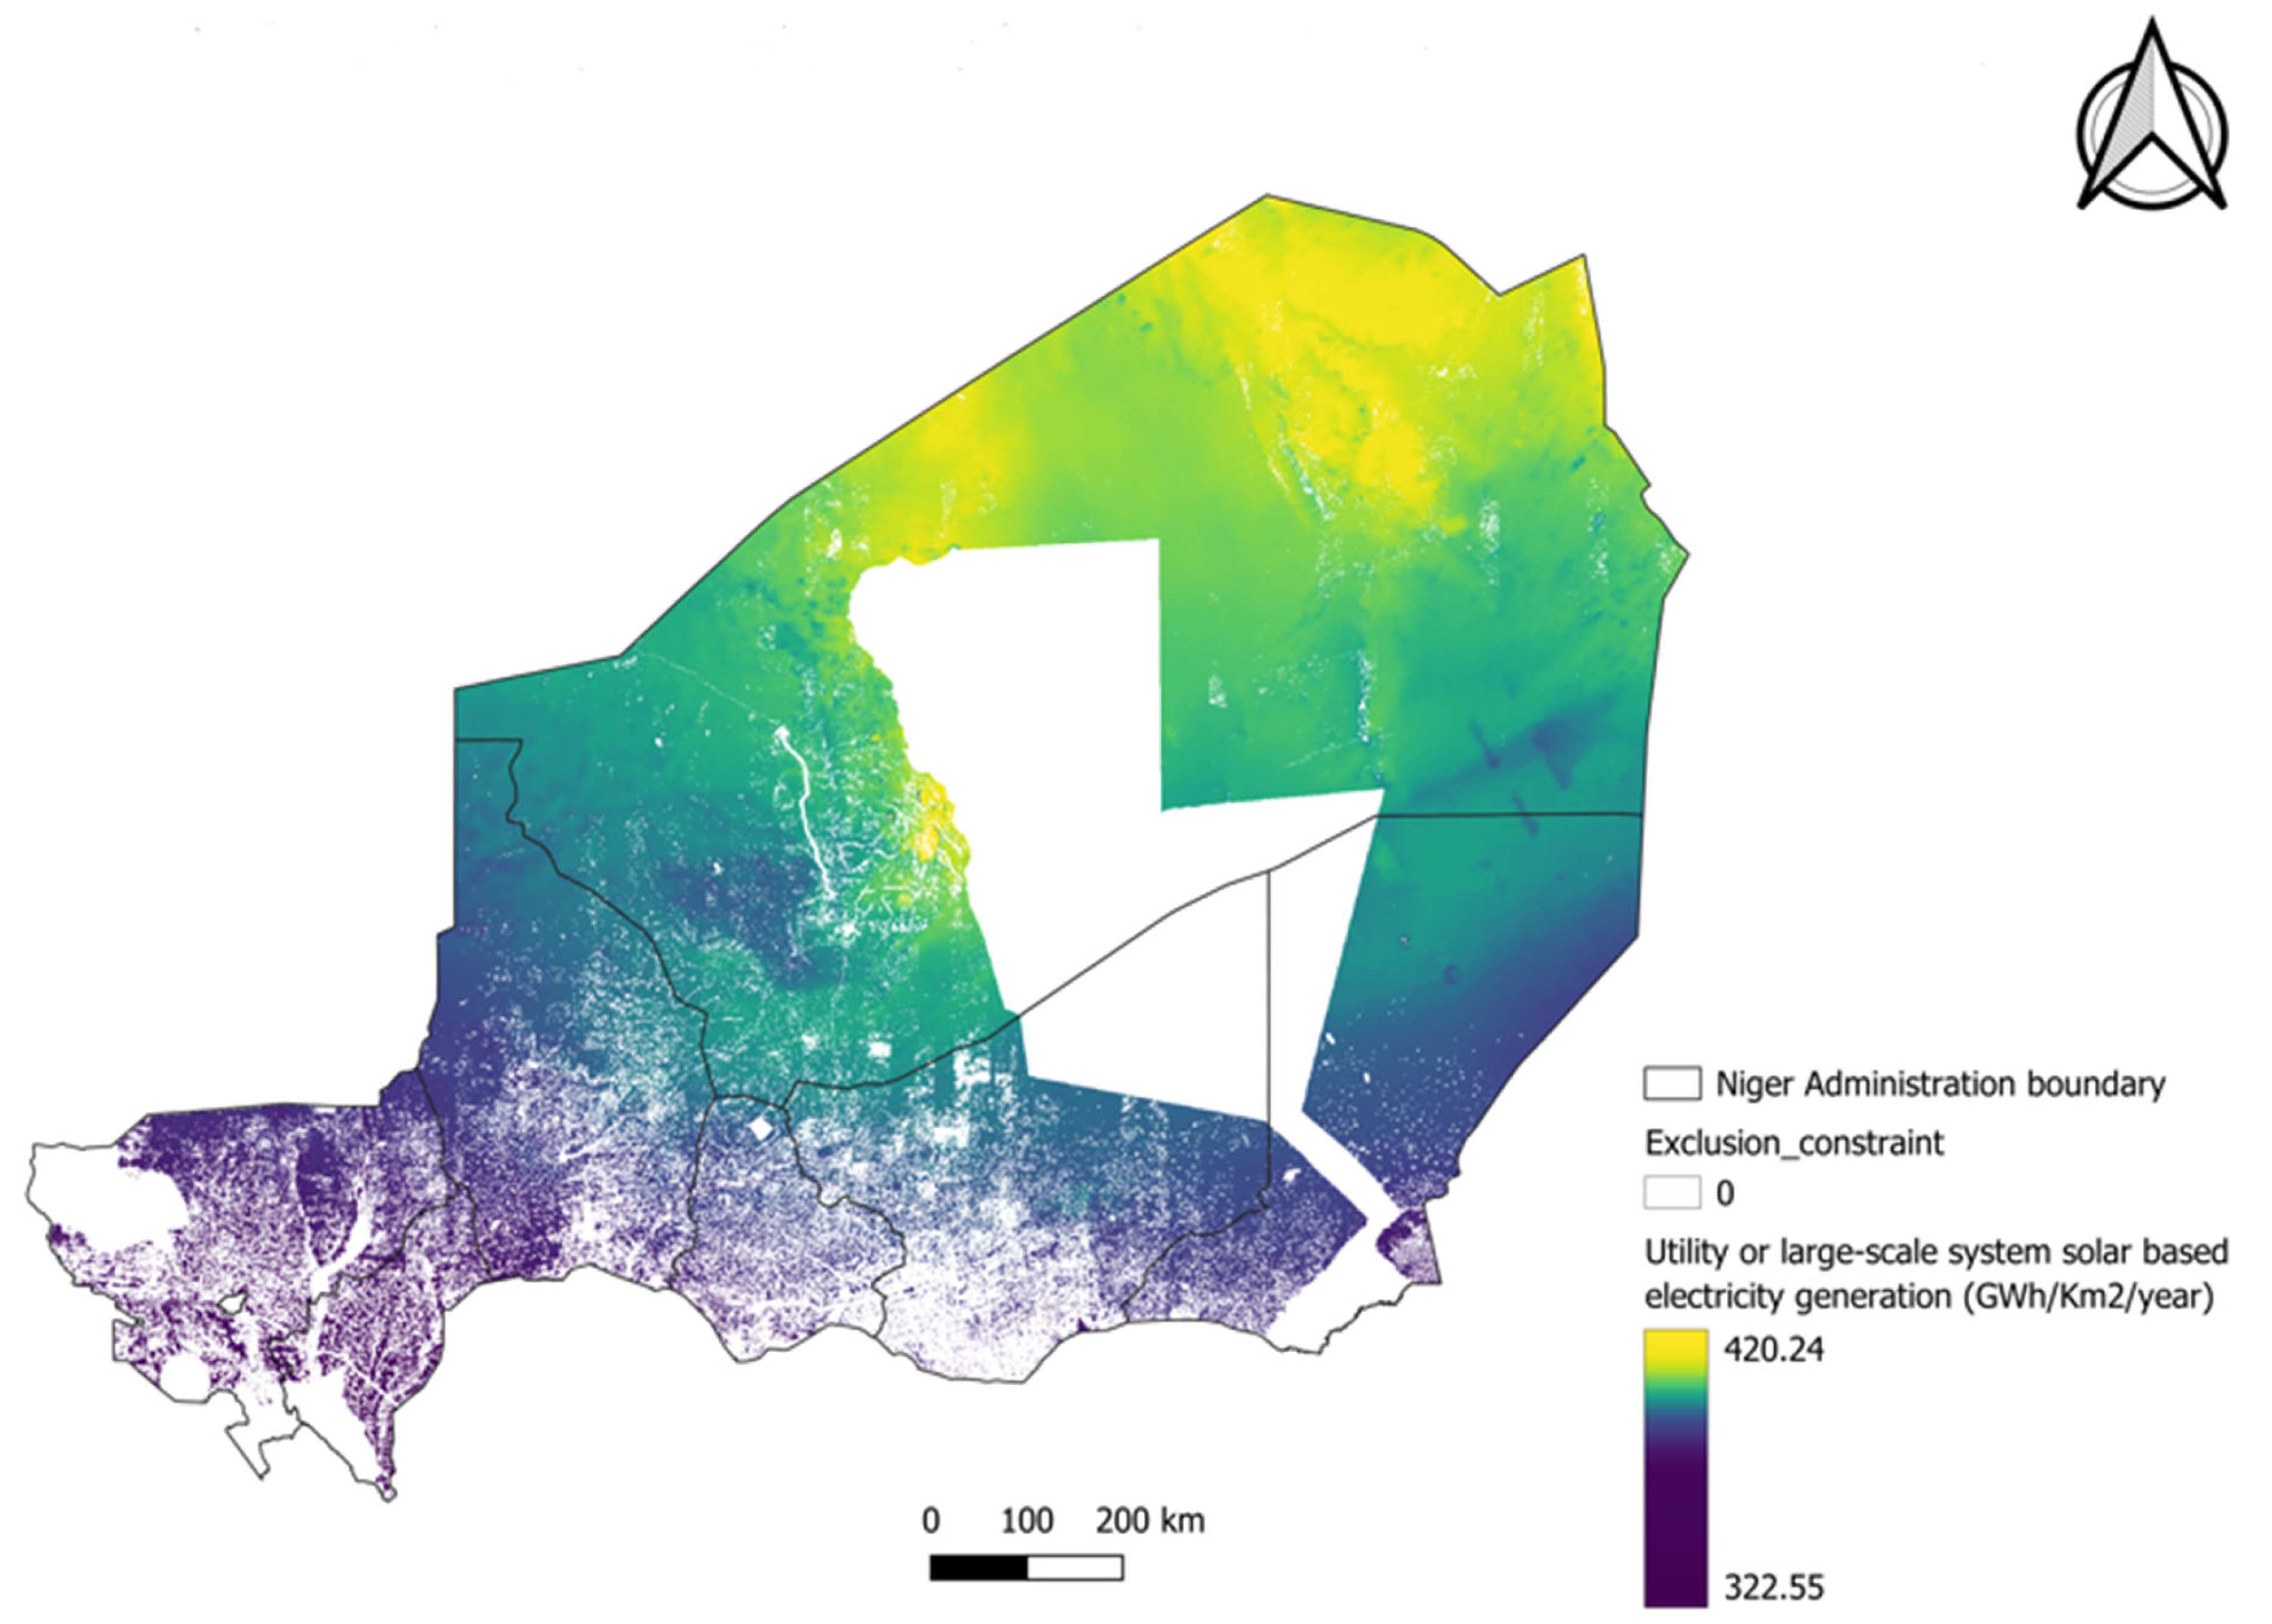
3.1. Technical Potential for Solar-Based Electricity Generation
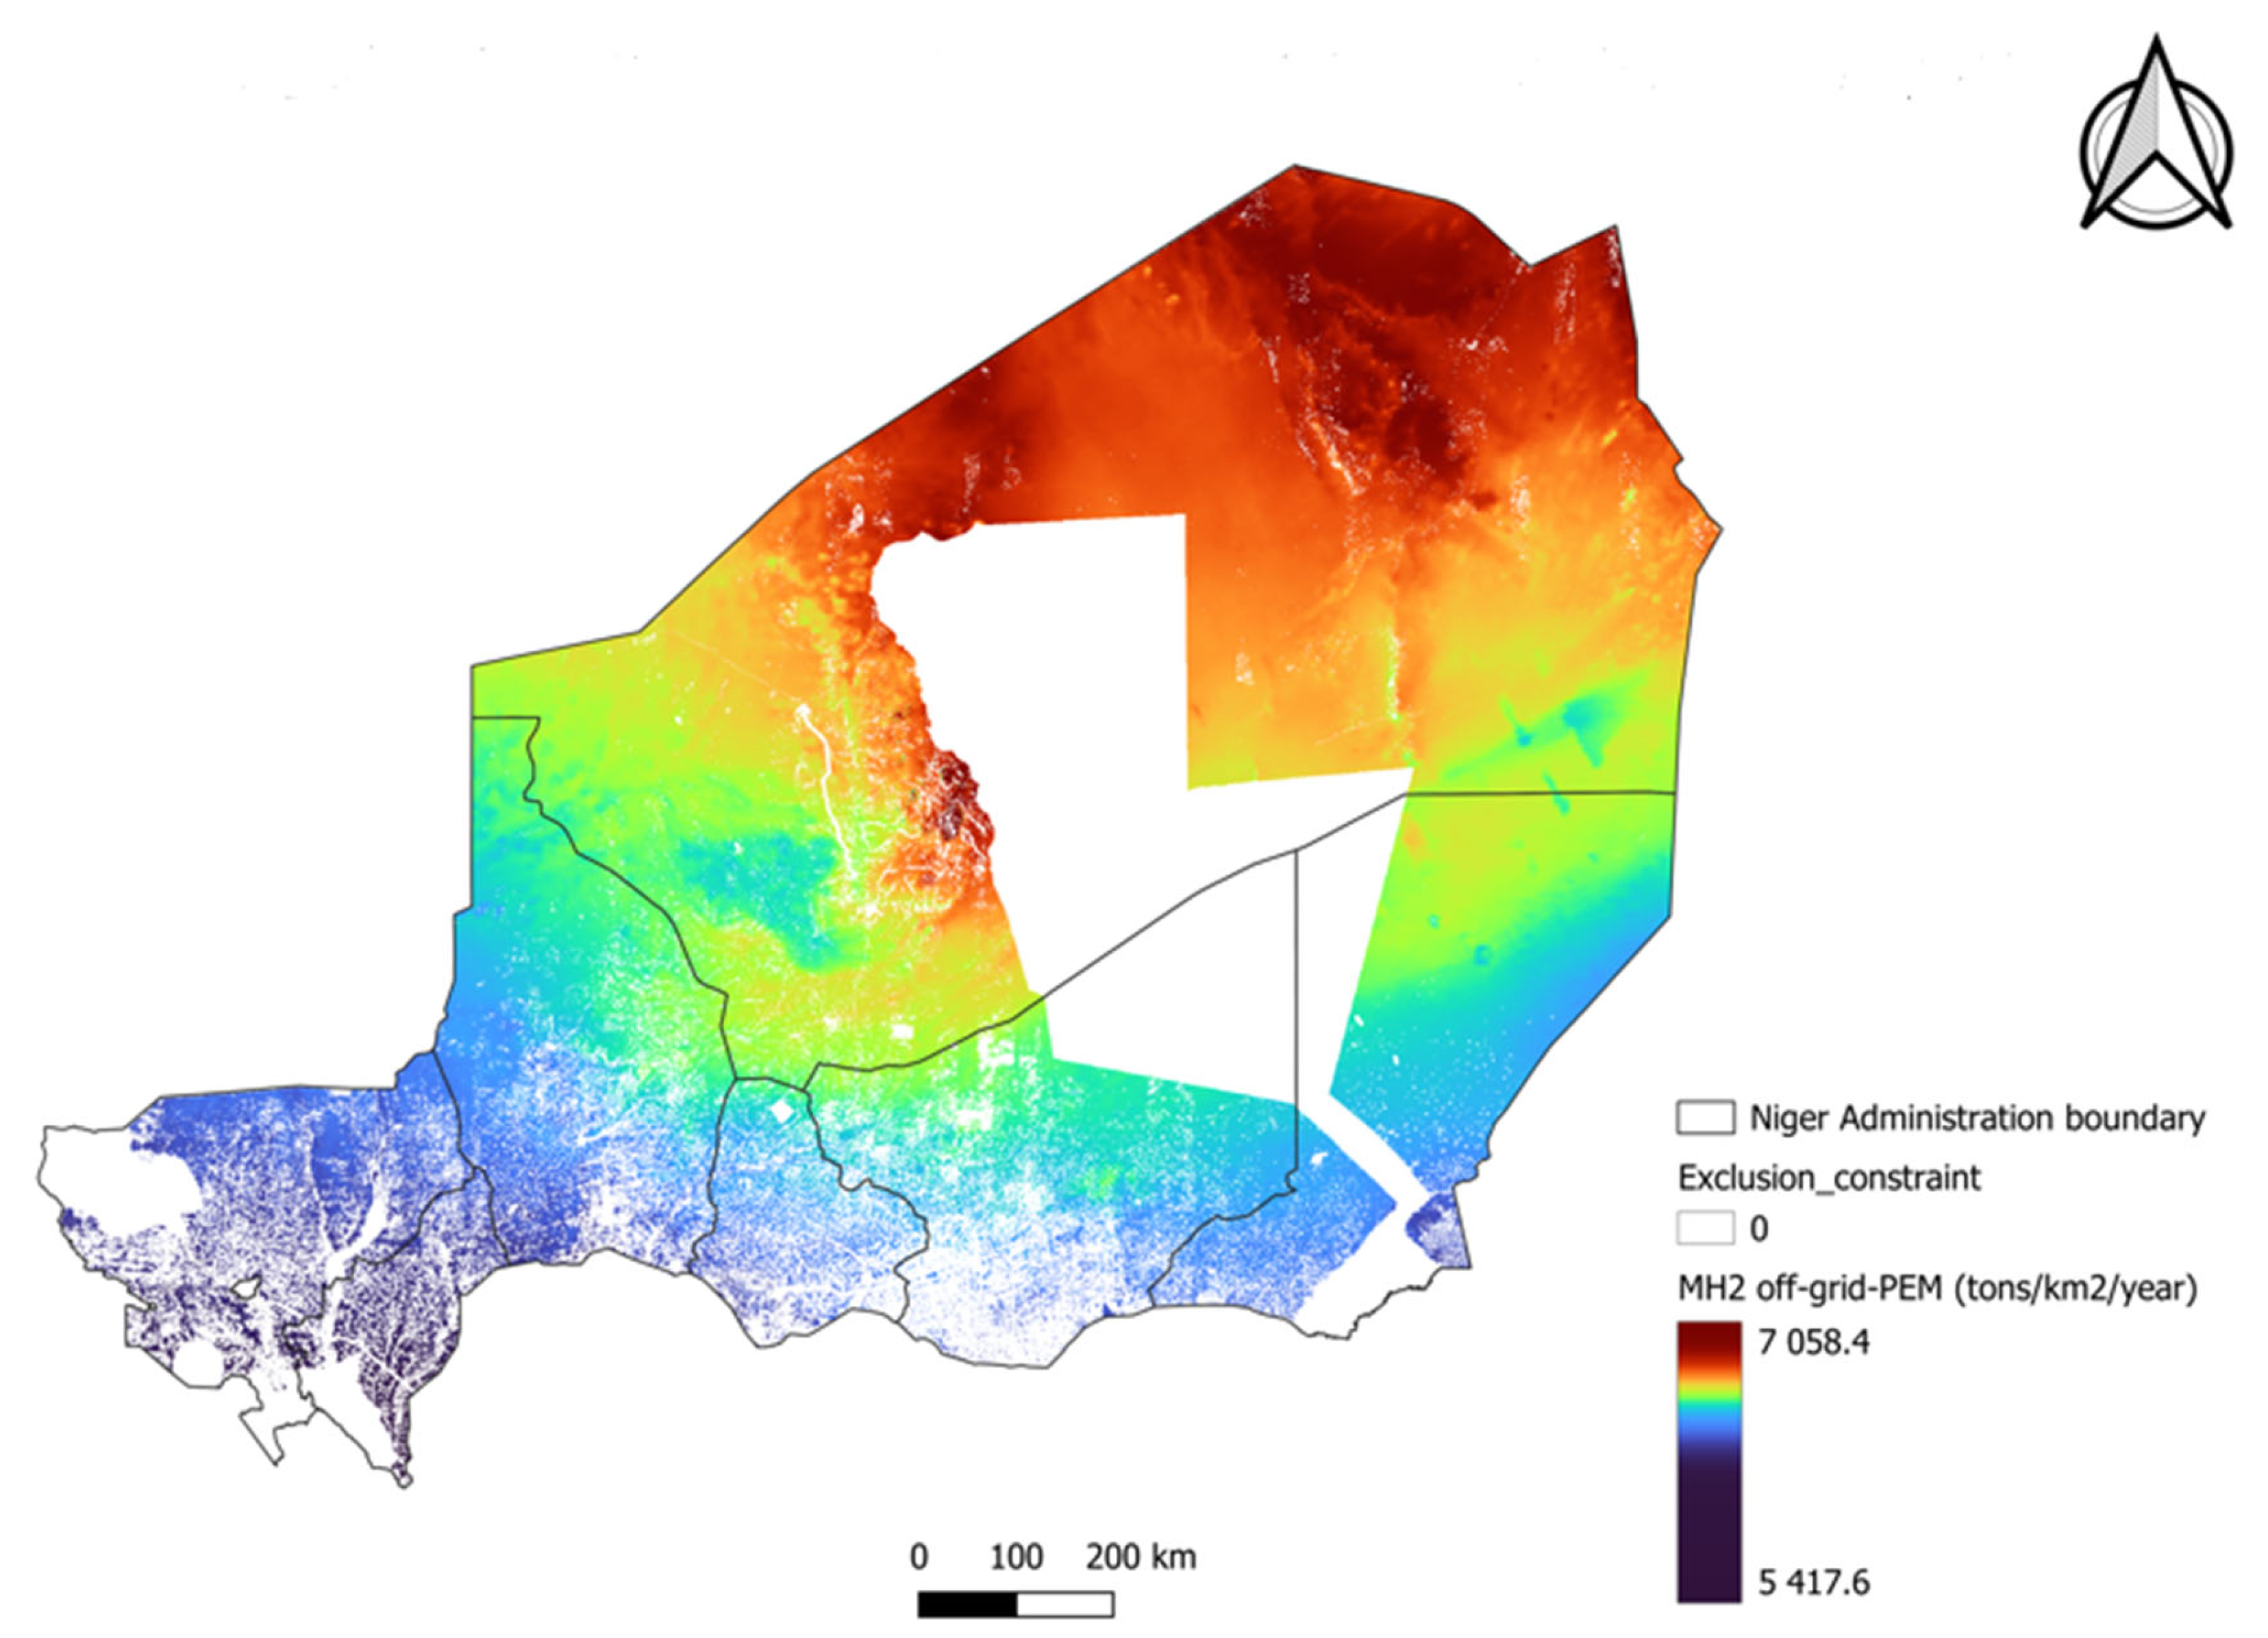
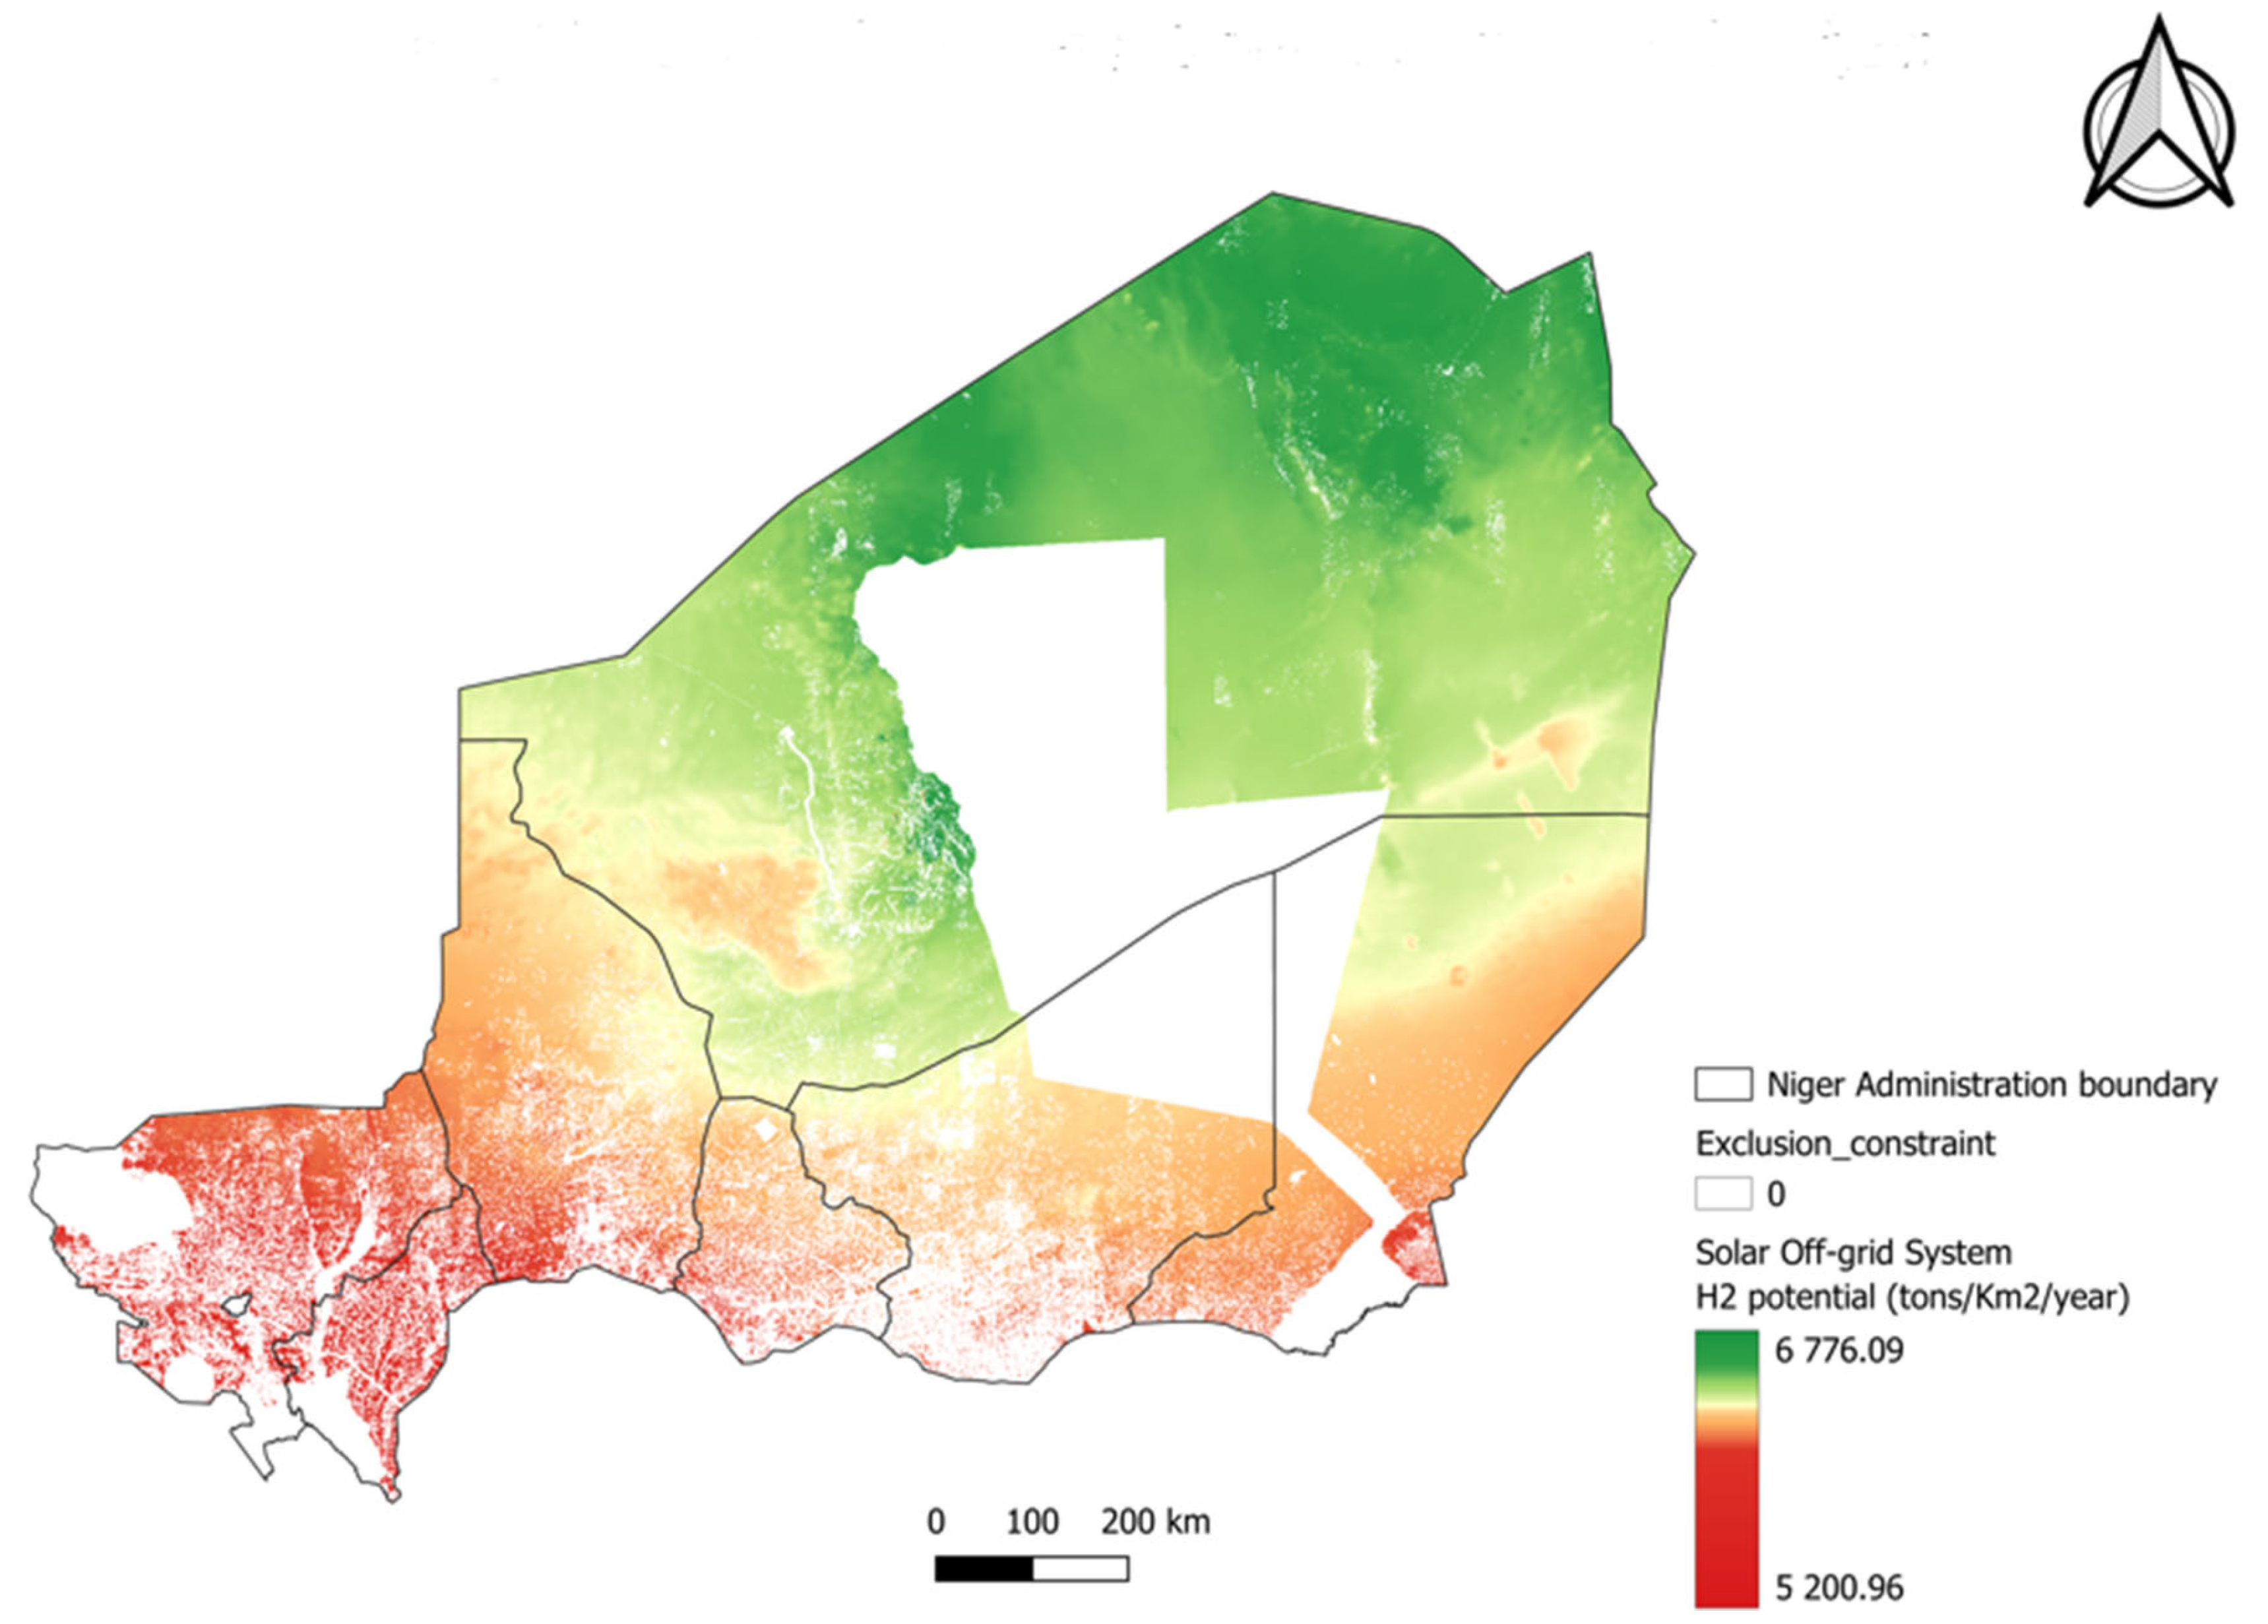
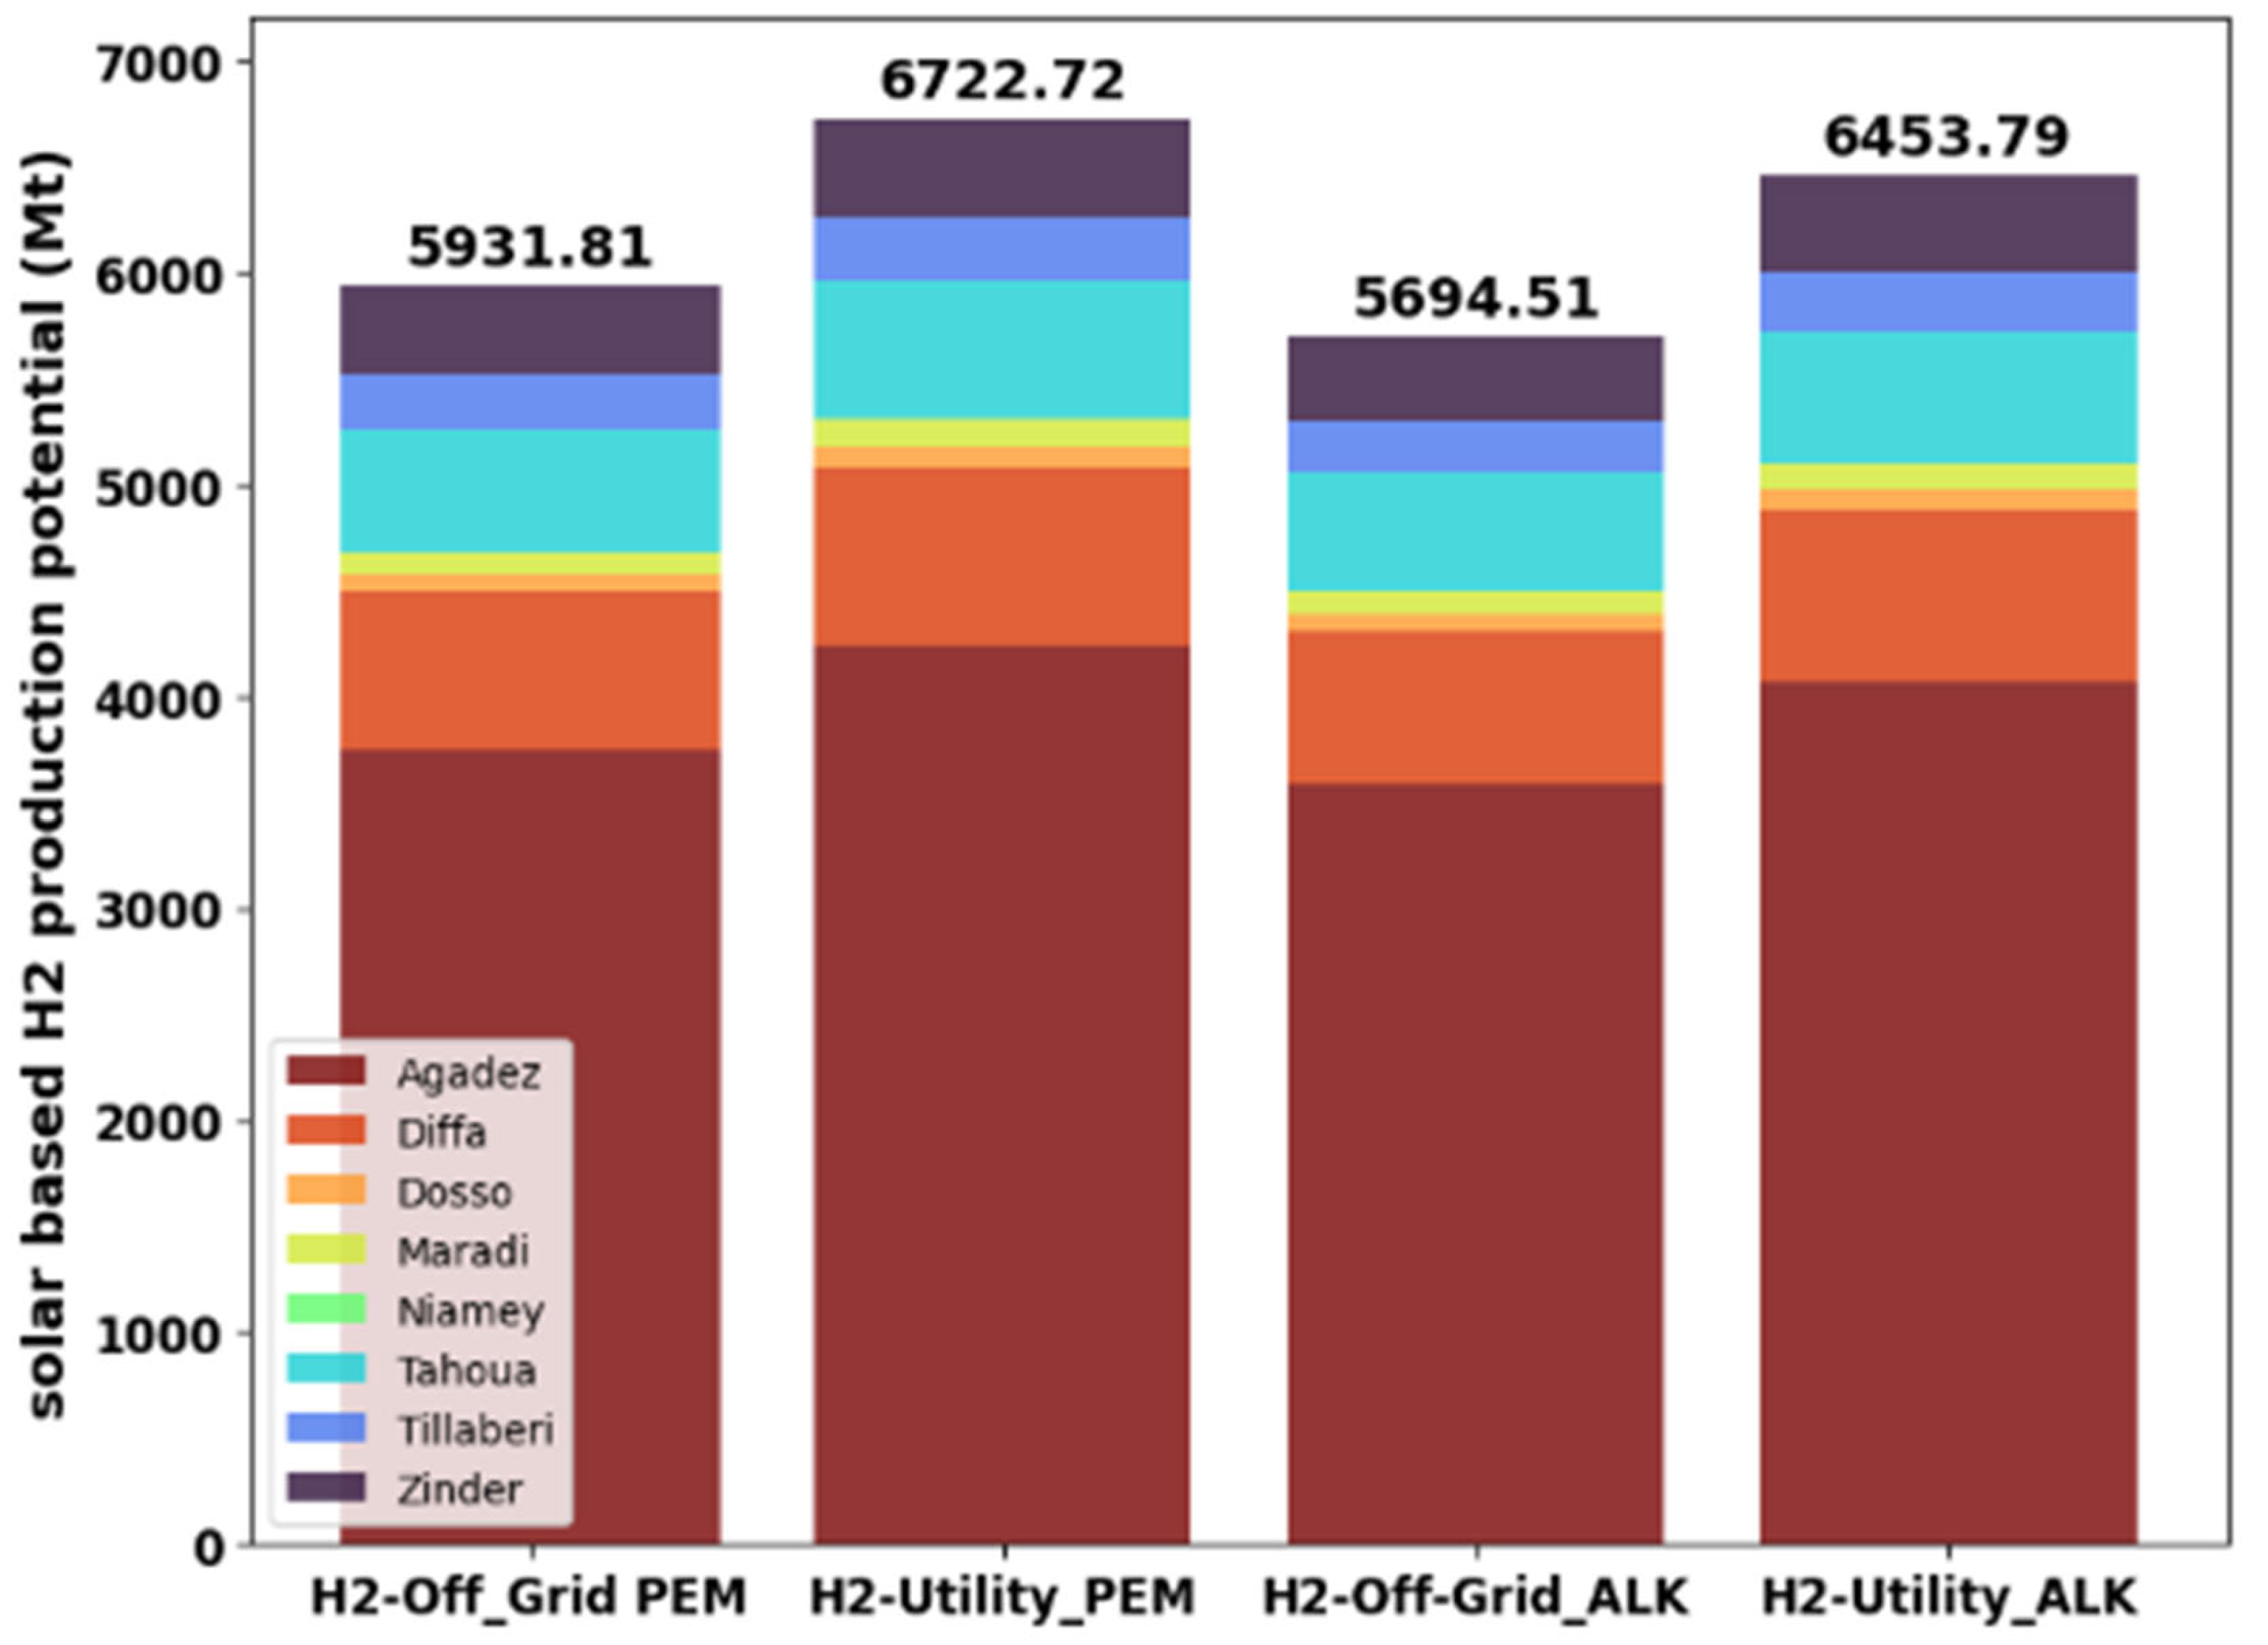
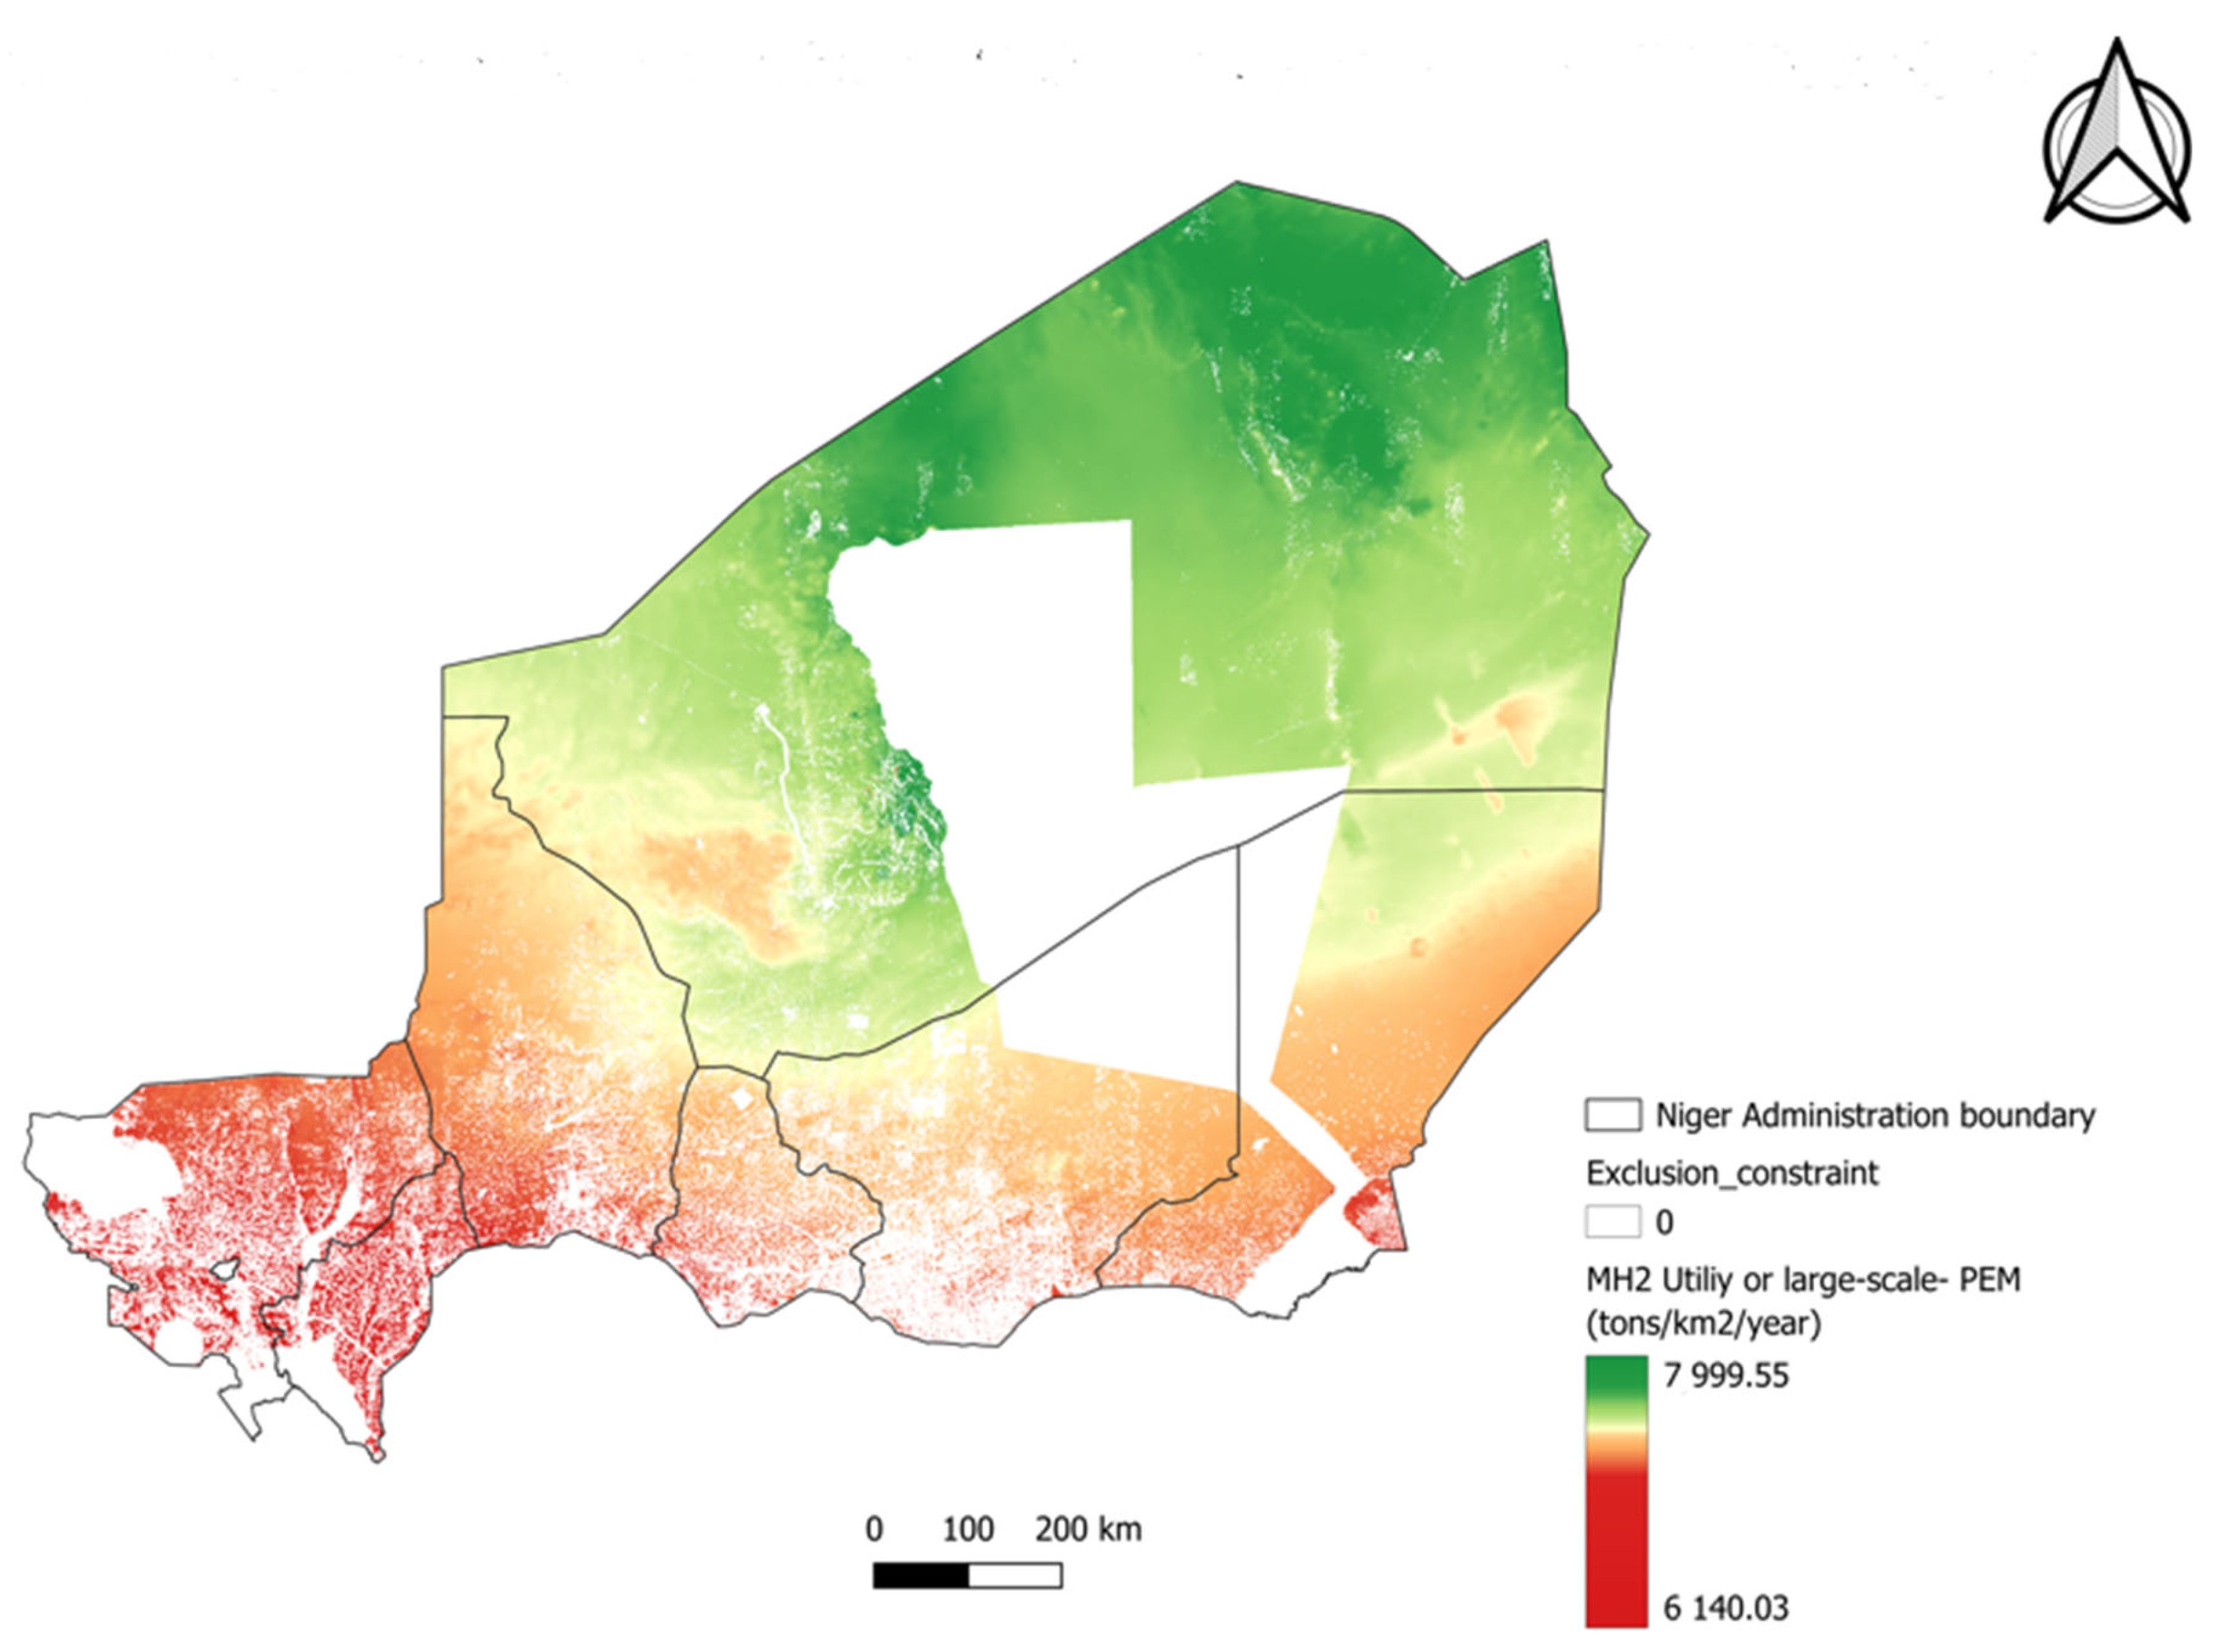
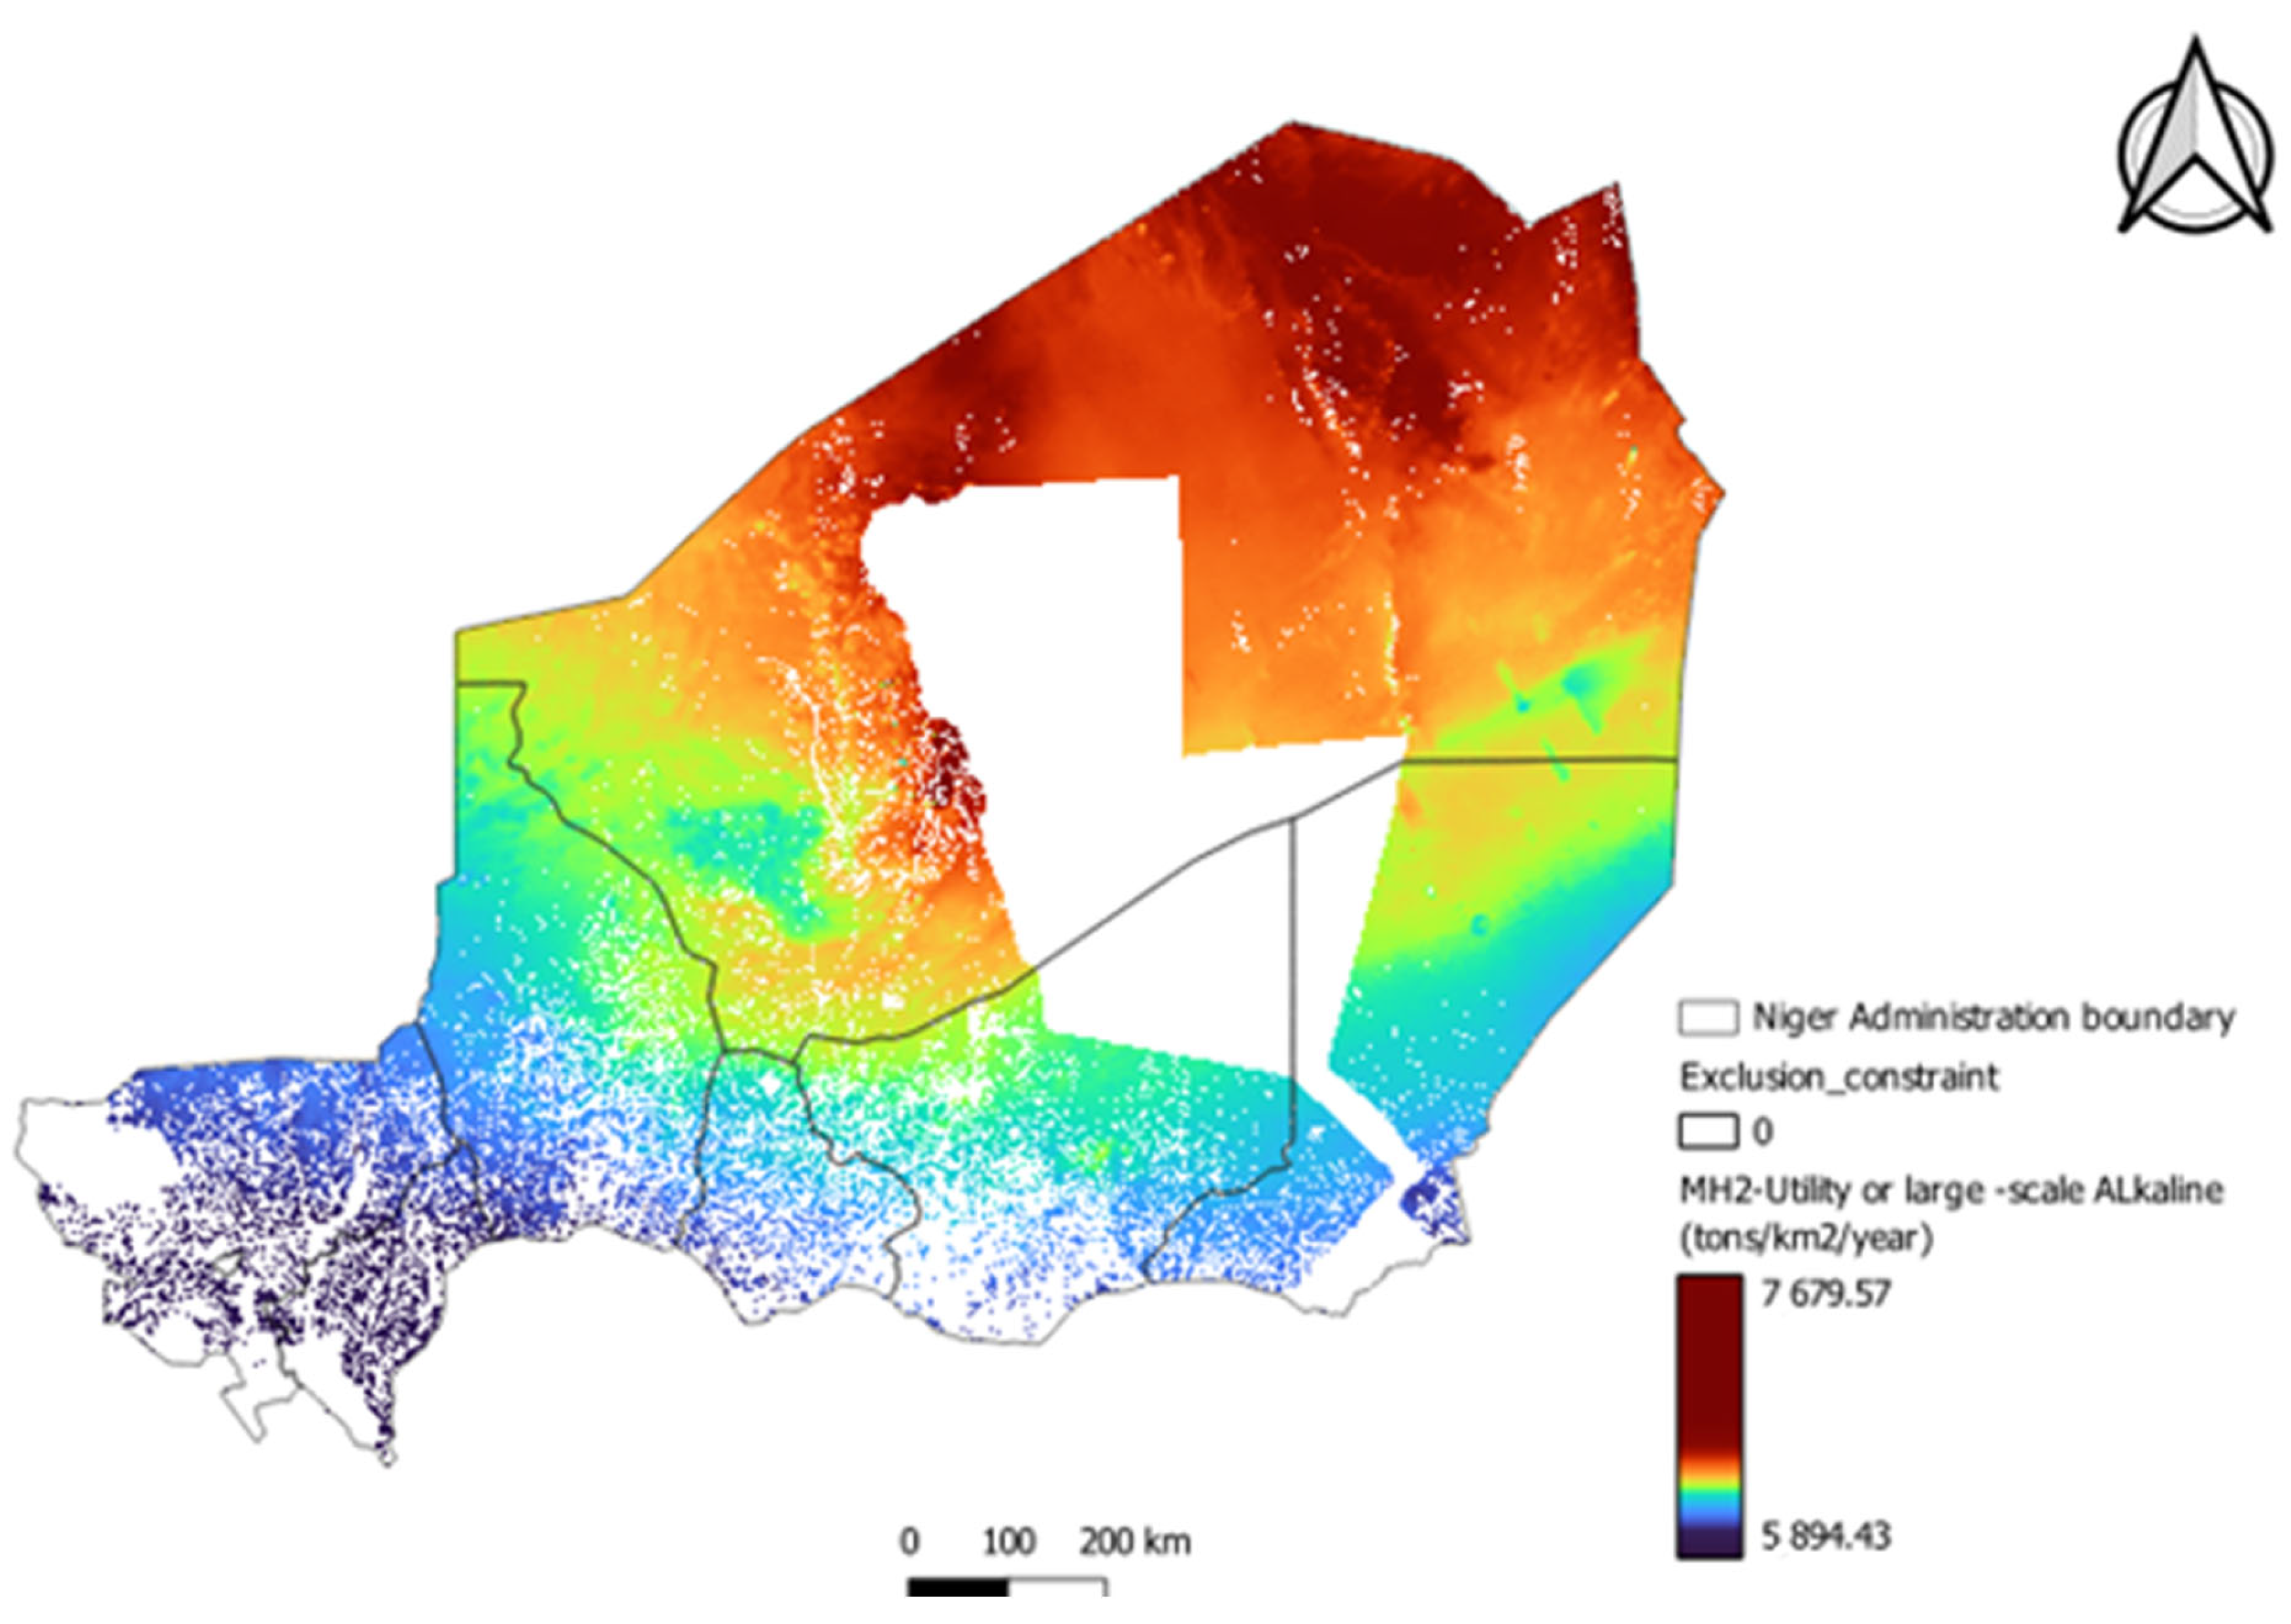
3.2. Technical Potential for Solar-Based Green Hydrogen Production
3.3. Economic Analysis of Electricity Generation from Solar PV Technology
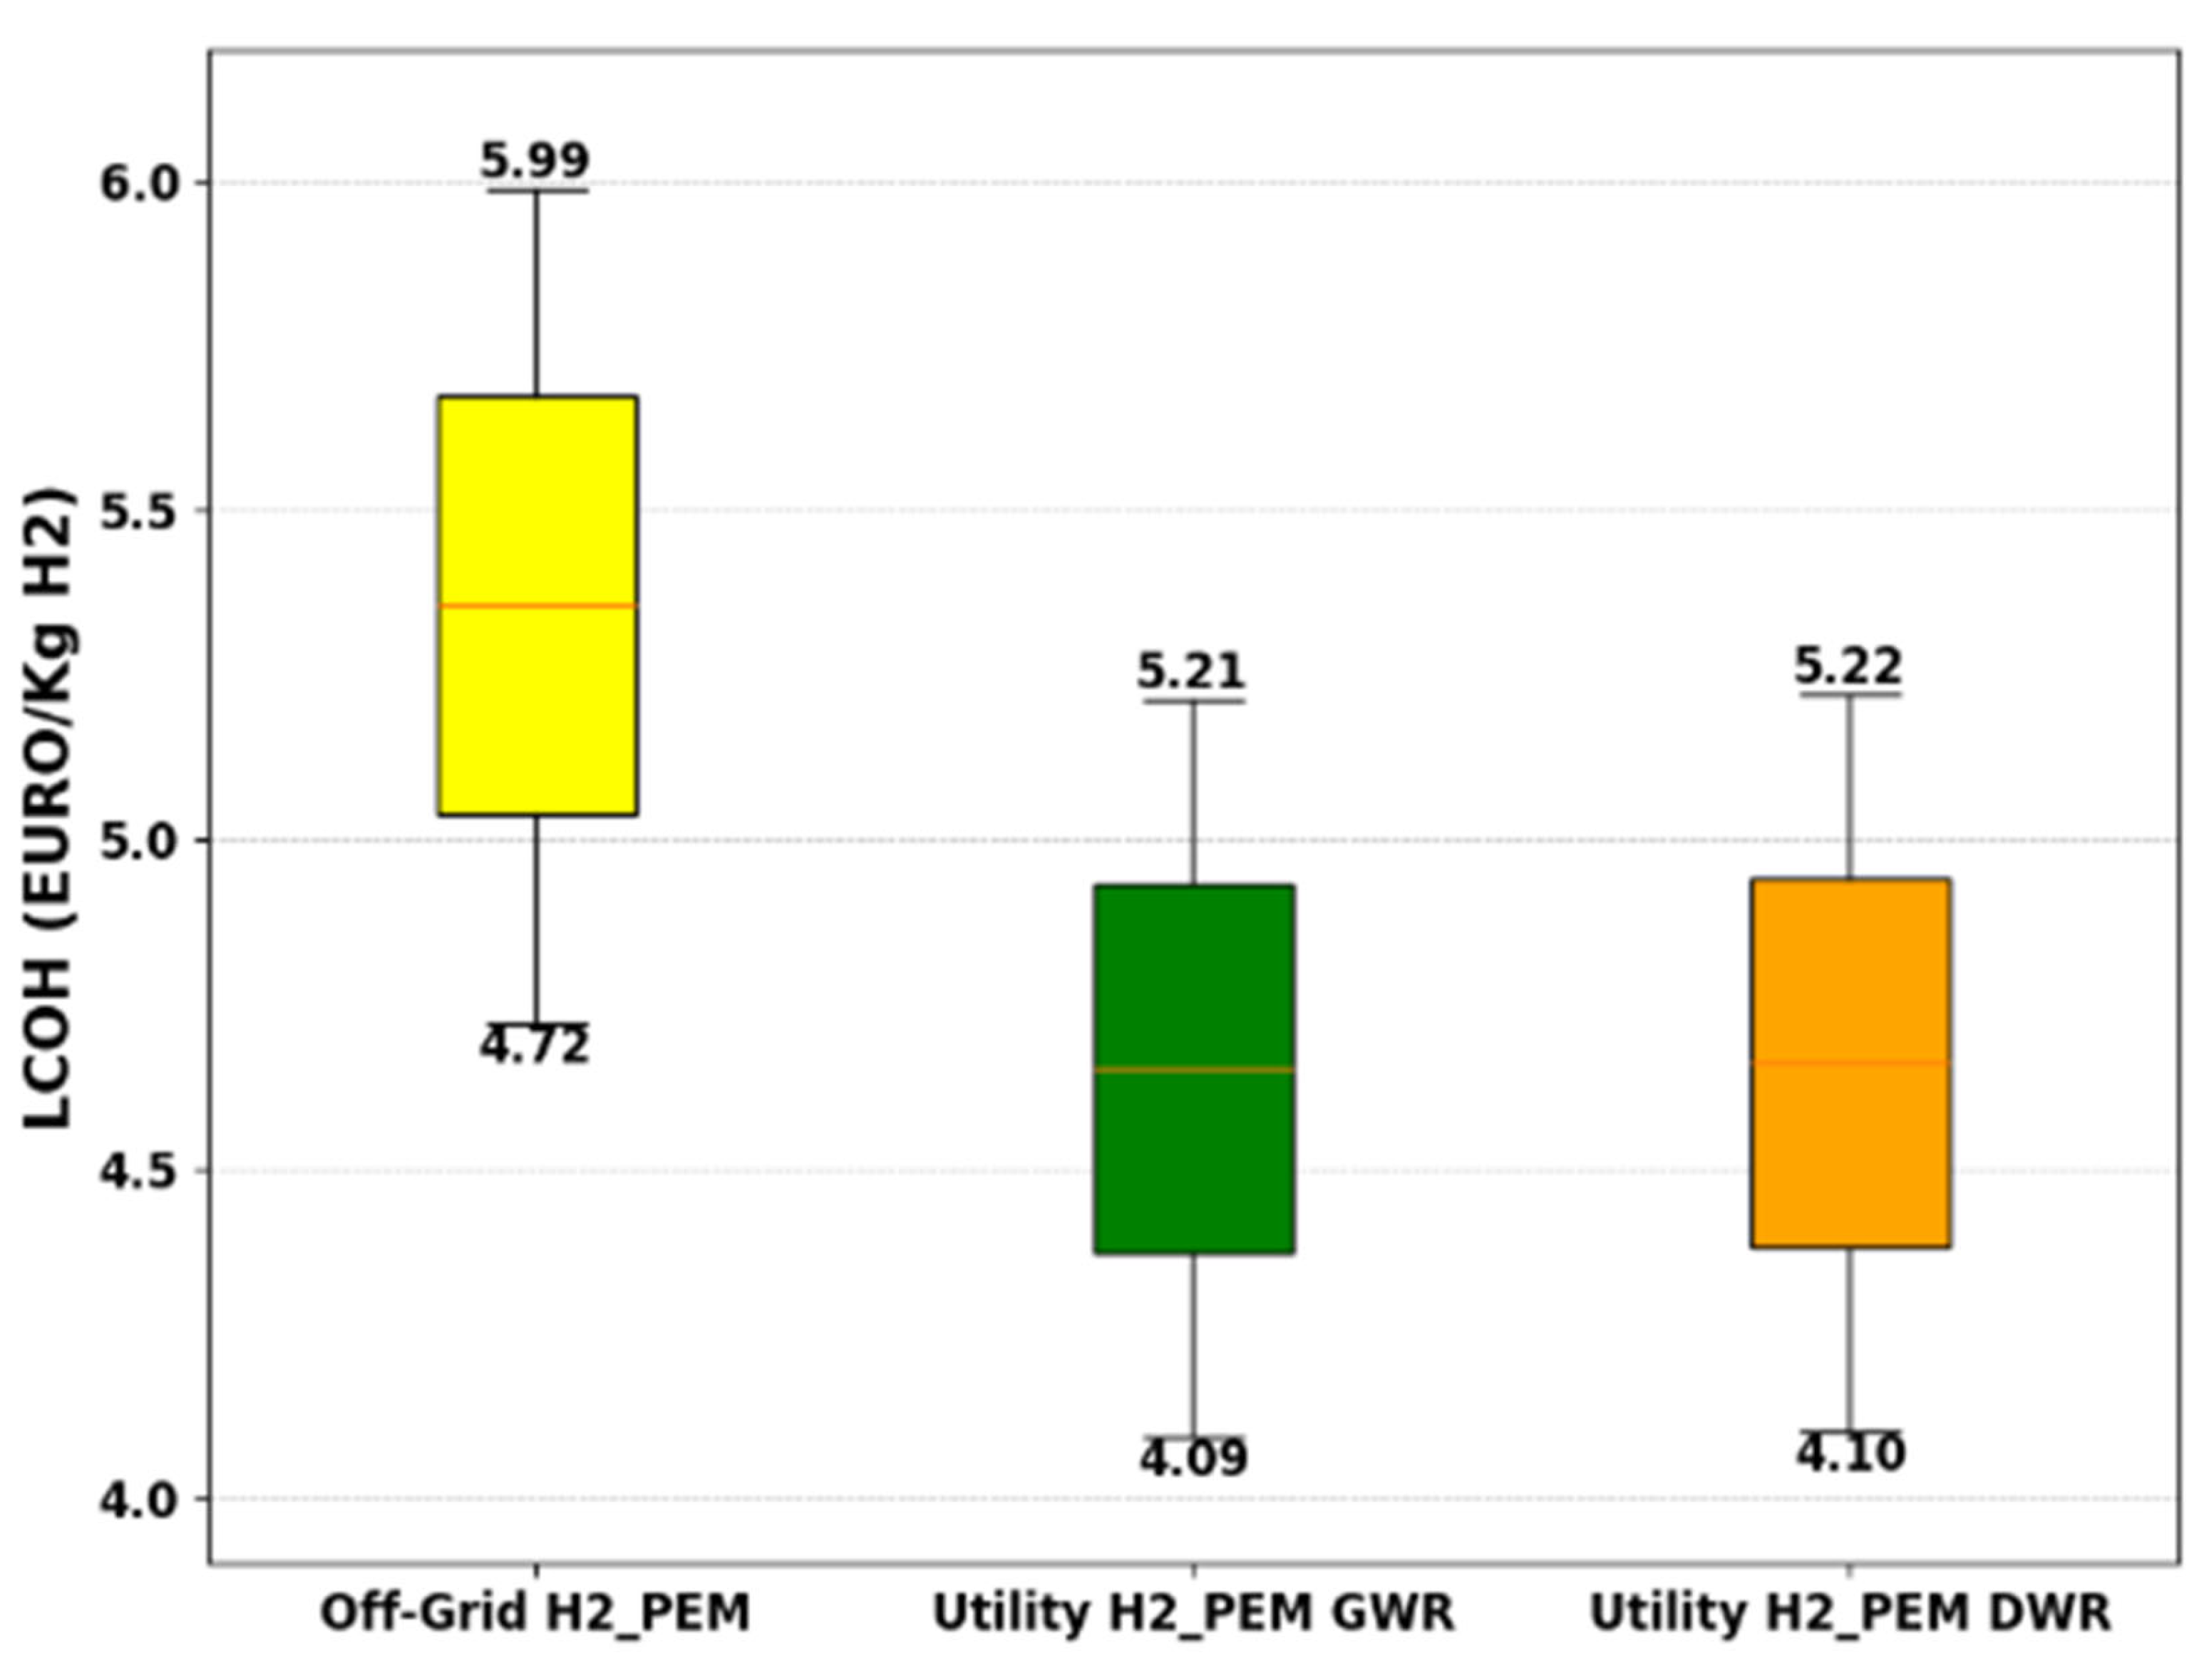
3.4. Economic Analysis of Green Hydrogen Production Using PEM Water Electrolyzer
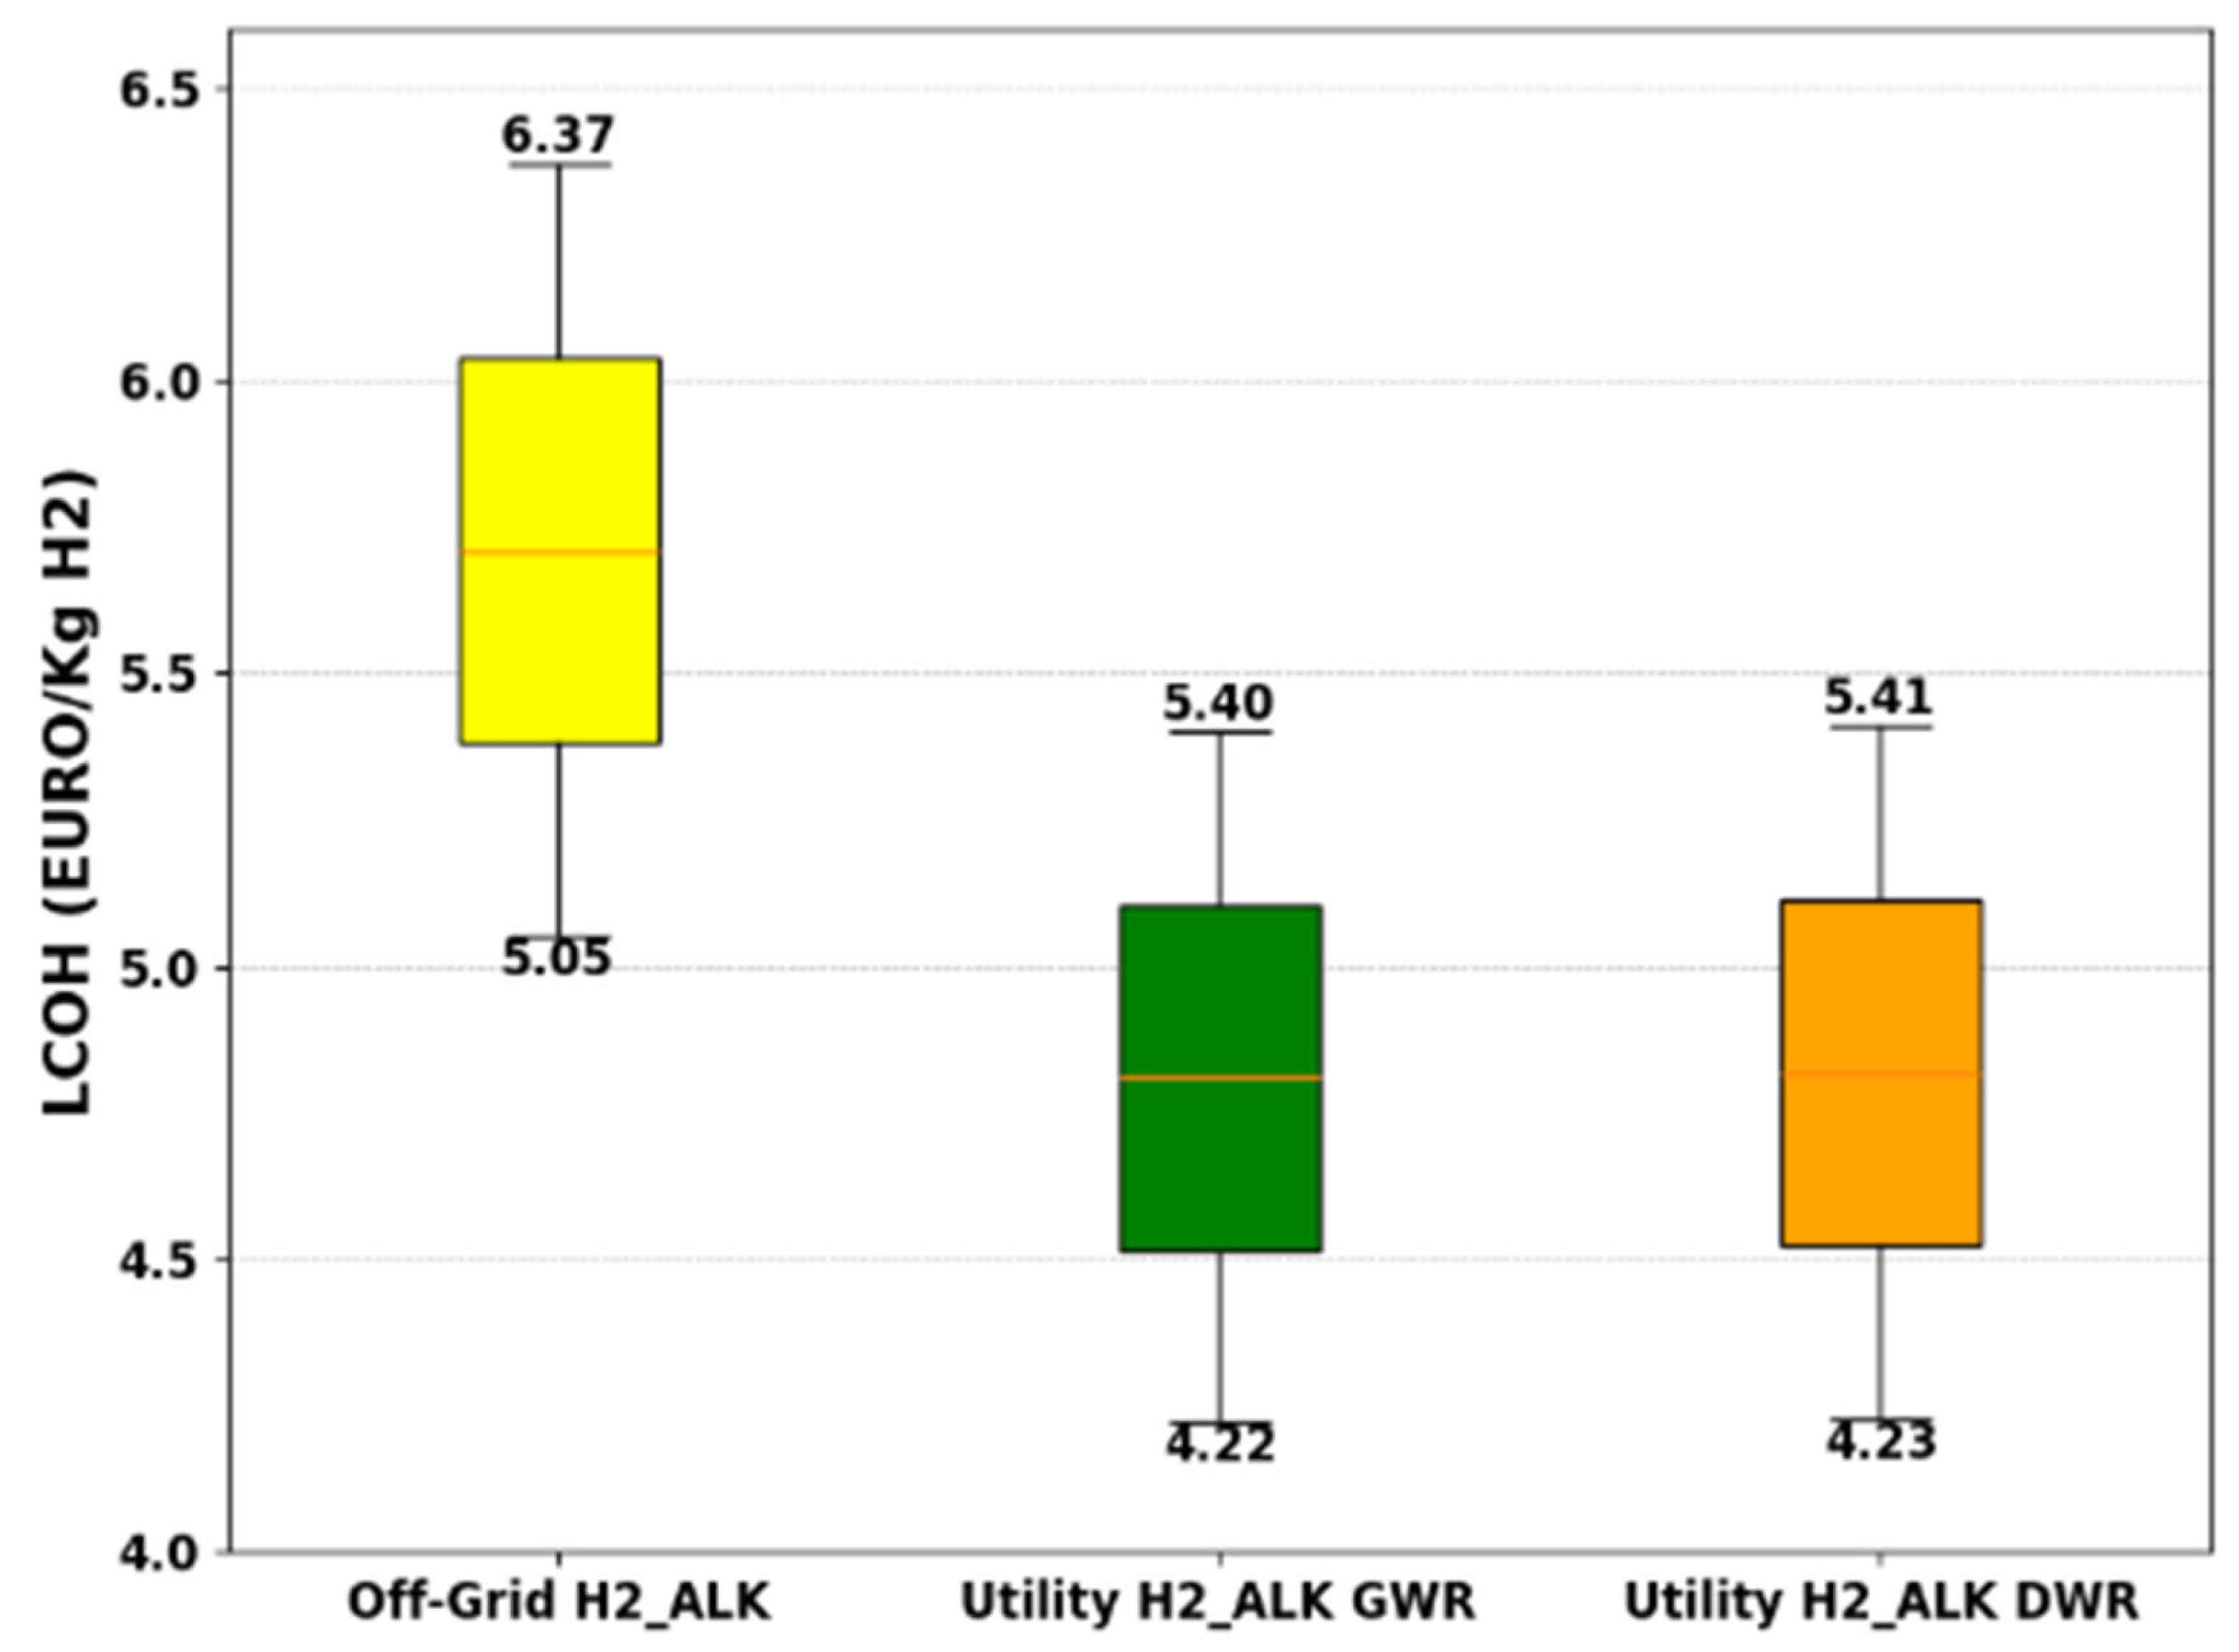
3.5. Economic Analysis of Hydrogen Production Using Alkaline Water Electrolyzer
3.6. Sensitivity Analysis Results
4. Conclusions
Author Contributions
Funding
Data Availability Statement
Conflicts of Interest
Appendix A
| Region | Available Land | Geographical | Solar Off-Grid EGP | Solar Off-Grid EGP | Solar Off-Grid Yield | Solar Off-Grid Yield | Solar Off-Grid EGPTotal |
|---|---|---|---|---|---|---|---|
| (km2) | Potential (%) | (GWh/km2/Year) Min | (GWh/km2/Year) Max | (kWh/kWp/Year) Min | (kWh/kWp/Year) Max | (TWh/Year) | |
| Agadez | 706,037.56 | 78.43% | 269.63 | 374.30 | 1320.36 | 1841.18 | 196,401.50 |
| Diffa | 156,906 | 71.61% | 330.98 | 353.34 | 1628.09 | 1738.05 | 39,326.14 |
| Dosso | 31,002 | 39.01% | 316.02 | 337.65 | 1554.51 | 1660.92 | 4298.67 |
| Maradi | 35,100 | 41.93% | 331.82 | 347.94 | 1632.20 | 1711.52 | 6015.76 |
| Niamey | 425.63 | 5.12% | 322.20 | 331.70 | 1584.87 | 1631.65 | 6.6 |
| Tahoua | 106,677 | 76.16% | 329.31 | 349.94 | 1619.89 | 1721.37 | 30,247.40 |
| Tillabéri | 89,623 | 41.69% | 318.14 | 340.21 | 1564.90 | 1673.50 | 13,550.22 |
| Zinder | 145,430 | 67.89% | 334.32 | 351.45 | 1644.50 | 1728.75 | 21,770.84 |
| Total | 311,617.17 |
| Region | Available Land | Geographical | Solar Utility-Scale Yield | Solar Utility-Scale Yield | Solar Utility-Scale EGP | Solar Off-Grid EGP | Solar Off-Grid EGPTotal |
|---|---|---|---|---|---|---|---|
| (km2) | Potential (%) | (kWh/kWp/Year) Min | (kWh/kWp/Year) Max | (GWh/km2/Year) Min | (GWh/km2/Year) Max | (TWh/Year) | |
| Agadez | 706,037.56 | 78.43% | 1479.97 | 2063.74 | 322.55 | 420.24 | 222,588.37 |
| Diffa | 156,906 | 71.61% | 1824.89 | 1948.15 | 375.11 | 400.45 | 44,569.62 |
| Dosso | 31,002 | 39.01% | 1742.42 | 1861.69 | 358.16 | 382.68 | 4871.83 |
| Maradi | 35,100 | 41.93% | 1829.49 | 1918.41 | 376.06 | 394.34 | 6817.86 |
| Niamey | 425.63 | 5.12% | 1776.45 | 1828.88 | 365.16 | 375.93 | 7.51 |
| Tahoua | 106,677 | 76.16% | 1815.7 | 1929.45 | 373.22 | 396.60 | 34,280.39 |
| Tillabéri | 89,623 | 41.69% | 1754.07 | 1875.79 | 360.55 | 385.58 | 15,356.91 |
| Zinder | 145,430 | 67.89% | 1843.29 | 1937.72 | 378.89 | 398.31 | 24,673.62 |
| Total | 353,166.15 |
Appendix B
| Region | Available Land | Geographical | Solar Off-Grid EGP | ALK_Based H2 Potential | PEM_Based H2 Potential | ALK_Based H2 Total | PEM_Based H2 Total |
|---|---|---|---|---|---|---|---|
| (km2) | Potential (%) | (TWh/Year) Total | (Tons/km2) Mean | (Tons/km2) Mean | Potential (Mt/Year) | Potential (Mt/Year) | |
| Agadez | 706,037.56 | 78.43% | 196,401.50 | 5084.50 | 5296.36 | 3589.06 | 3738.61 |
| Diffa | 156,906 | 71.61% | 39,326.14 | 4521.49 | 4709.89 | 718.65 | 748.59 |
| Dosso | 31,002 | 39.01% | 4298.67 | 2354.45 | 2452.55 | 78.55 | 81.82 |
| Maradi | 35,100 | 41.93% | 6015.76 | 2614.23 | 2723.16 | 109.93 | 114.51 |
| Niamey | 425.63 | 5.12% | 6.6 | 285.19 | 297.07 | 0.121 | 0.126 |
| Tahoua | 106,677 | 76.16% | 30,247.40 | 4783.72 | 4983.04 | 552.74 | 575.77 |
| Tillabéri | 89,623 | 41.69% | 13,550.22 | 2554.32 | 2660.75 | 247.61 | 257.93 |
| Zinder | 145,430 | 67.89% | 21,770.84 | 2532.11 | 2637.62 | 397.84 | 414.42 |
| Total | 311,617 | 5694.53 | 5931.81 |
| Region | Available Land | Geographical | Solar Utility-Scale EGP | ALK_Based H2 Potential | PEM_Based H2 Potential | ALK_Based H2 Total | PEM_Based H2 Total |
|---|---|---|---|---|---|---|---|
| (km2) | Potential (%) | (TWh/Year) Total | (Tons/km2) Mean | (Tons/km2) Mean | Potential (Mt/Year) | Potential (Mt/Year) | |
| Agadez | 706,037.56 | 78.43% | 222,588.37 | 5762.44 | 6002.54 | 4067.6 | 4237.09 |
| Diffa | 156,906 | 71.61% | 44,569.62 | 5124.36 | 5337.88 | 814.47 | 848.40 |
| Dosso | 31,002 | 39.01% | 4871.83 | 2668.38 | 2779.56 | 89.02 | 92.73 |
| Maradi | 35,100 | 41.93% | 4871.83 | 2962.38 | 3086.25 | 124.59 | 129.78 |
| Niamey | 425.63 | 5.12% | 7.51 | 323.21 | 336.68 | 0.137 | 0.143 |
| Tahoua | 106,677 | 76.16% | 34,280.39 | 5421.55 | 5647.44 | 626.44 | 652.54 |
| Tillabéri | 89,623 | 41.69% | 15,356.91 | 2894.90 | 3015.52 | 280.63 | 292.32 |
| Zinder | 145,430 | 67.89% | 24,673.62 | 2869.73 | 2989.30 | 450.88 | 469.67 |
| Total | 353,166 | 6453.8 | 6722.7 |
References
- Yang, Z.; Abbas, Q.; Hanif, I.; Alharthi, M.; Taghizadeh-Hesary, F.; Aziz, B.; Mohsin, M. Short- and Long-Run Influence of Energy Utilization and Economic Growth on Carbon Discharge in Emerging SREB Economies. Renew. Energy 2020. [Google Scholar] [CrossRef]
- International Energy Agency (IEA). World Energy Outlook 2023. 2023. Available online: https://www.iea.org/reports/world-energy-outlook-2023 (accessed on 5 October 2024).
- Ellabban, O.; Abu-Rub, H.; Blaabjerg, F. Renewable energy resources: Current status, future prospects and their enabling technology. Renew. Sustain. Energy Rev. 2014, 39, 748–764. [Google Scholar] [CrossRef]
- IEA. Renewables 2023: Analysis And Forecasts to 2028. 2023. Available online: https://www.worldenergy.org.tr/renewables-2023-analysis-and-forecasts-to-2028-summary/ (accessed on 15 December 2024).
- Mohsin, M.; Kamran, H.W.; Nawaz, M.A.; Hussain, M.S.; Dahri, A.S. Assessing the impact of transition from nonrenewable to renewable energy consumption on economic growth-environmental nexus from developing Asian economies. J. Environ. Manag. 2021, 284, 111999. [Google Scholar] [CrossRef]
- Aliyu, A.K.; Modu, B.; Tan, C.W. A review of renewable energy development in Africa: A focus in South Africa, Egypt and Nigeria. Renew. Sustain. Energy Rev. 2018, 81, 2502–2518. [Google Scholar] [CrossRef]
- Asiaban, S.; Kayedpour, N.; Samani, A.E.; Bozalakov, D.; De Kooning, J.D.M.; Crevecoeur, G.; Vandevelde, L. Wind and Solar Intermittency and the Associated Integration Challenges: A Comprehensive Review Including the Status in the Belgian Power System. Energies 2021, 14, 2630. [Google Scholar] [CrossRef]
- Ryberg, D.S.; Robinius, M.; Stolten, D. Methodological Framework for Determining the Land Eligibility of Renewable Energy Sources. arXiv 2018, arXiv:1712.07840. [Google Scholar]
- Wappler, M.; Unguder, D.; Lu, X.; Ohlmeyer, H.; Teschke, H.; Lueke, W. ScienceDirect Building the green hydrogen market—Current state and outlook on green hydrogen demand and electrolyzer manufacturing. Int. J. Hydrogen Energy 2022, 47, 33551–33570. [Google Scholar] [CrossRef]
- Wang, Z.; Zhang, X.; Rezazadeh, A. Hydrogen fuel and electricity generation from a new hybrid energy system based on wind and solar energies and alkaline fuel cell. Energy Rep. 2021, 7, 2594–2604. [Google Scholar] [CrossRef]
- International Renewable Energy Agency (IRENA). Global hydrogen trade to meet the 1.5 °C climate goal: Part III–green hydrogen supply cost and potential. In Global Hydrogen Trade to Meet the 1.5 °C Climate Goal; IREAN: Abu Dhabi, United Arab Emirates, 2022. [Google Scholar]
- IRENA. Green Hydrogen Cost Reduction: Scaling up Electrolyzers to Leet the 1.5 °C Climate Goal; IRENA: Abu Dhabi, United Arab Emirates, 2020. [Google Scholar]
- ECOWAS. Ecowas Green Hydrogen Policy and Strategy Framework; ECOWAS: Bissau, Guinea Bissau, 2023; Available online: https://www.ecreee.org (accessed on 10 November 2024).
- Economic Community of West. Ecowas Green Hydrogen Program; ECREEE: Praia, Cape Verde, 2023. [Google Scholar]
- Ministère de l’Energie et du Pétrole&SE4ALL. Plan d’Actions National de l’Energie Durable Pour Tous (SE4ALL) à L’horizon 2030; Ministère de l’Energie et du Pétrole & SE4ALL: Niamey, Niger, 2015; Available online: https://www.se4all-africa.org/fileadmin/uploads/se4all/Documents/Country_IPs/PI_SeforALL_Niger_FINAL__1_.pdf (accessed on 15 December 2023).
- Dufo-López, R.; Lujano-Rojas, J.M.; Bernal-Agustín, J.L. Optimisation of size and control strategy in utility-scale green hydrogen production systems. Int. J. Hydrogen Energy 2023, 50, 292–309. [Google Scholar]
- Ball, W.M. Michael The hydrogen economy vision or reality? Int. J. Hydrogen Energy 2015, 40, 19. [Google Scholar]
- Ashik, U.P.M.; Daud, W.W.; Abbas, H.F. Production of greenhouse gas free hydrogen by thermocatalytic decomposition of methane. Renew. Sustain. Energy Rev. 2015, 44, 221–256. [Google Scholar]
- Bhandari, R.; Trudewind, C.A. Zapp Life cycle assessment of hydrogen production via electrolysis—A review. J. Clean. Prod. 2014, 85, 151–163. [Google Scholar] [CrossRef]
- Franco, A.; Giovannini, C. Recent and Future Advances in Water Electrolysis for Green Hydrogen Generation: Critical Analysis and Perspectives. Sustainability 2023, 15, 16917. [Google Scholar] [CrossRef]
- Ursua, P.; Gandia, A.; Gandia, L.M. Sanchis Sanchis Hydrogen production from water electrolysis: Current status and future trends. Proc. IEEE 2012, 100, 410–426. [Google Scholar]
- Grigoriev, V.N.; Porembsky, S.A.; Fateev, V.I. Pure hydrogen production by PEM electrolysis for hydrogen energy. Int. J. Hydrogen Energy 2006, 31, 171–175. [Google Scholar]
- Brisse, M.; Schefold, A.; Zahid, J. High temperature water electrolysis in solid oxide cells. Energy Int. J. Hydrogen Cetinkaya 2008, 33, 5375–5382. [Google Scholar] [CrossRef]
- Bhandari, R.; Shah, R.R. Hydrogen as energy carrier: Techno-economic assessment of decentralized hydrogen production in Germany. Renew. Energy 2021, 177, 915–931. [Google Scholar] [CrossRef]
- Povacz, L.; Bhandari, R. Analysis of the Levelized Cost of Renewable Hydrogen in Austria. Sustainability 2023, 15, 4575. [Google Scholar] [CrossRef]
- Sánchez, E.U.P.; Ryberg, S.D.; Heinrichs, H.U.; Stolten, D.; Robinius, M. The potential of variable renewable energy sources in mexico: A temporally evaluated and geospatially constrained techno-economical assessment. Energies 2021, 14, 5779. [Google Scholar] [CrossRef]
- Messaoudi, D.; Settou, N.; Negrou, B.; Settou, B. GIS based multi-criteria decision making for solar hydrogen production sites selection in Algeria. Int. J. Hydrogen Energy 2019, 44, 31808–31831. [Google Scholar] [CrossRef]
- Touili, S.; Merrouni, A.A.; Azouzoute, A.; El Hassouani, Y.; Amrani, A.-I. A technical and economical assessment of hydrogen production potential from solar energy in Morocco. Int. J. Hydrogen Energy 2018, 43, 22777–22796. [Google Scholar] [CrossRef]
- Kitegi, M.S.P.; Lare, Y.; Coulibaly, O. Potential for Green Hydrogen Production from Biomass, Solar and Wind in Togo. Smart Grid Renew. Energy 2022, 13, 17–27. [Google Scholar] [CrossRef]
- Asare-Addo, M. Green hydrogen potential assessment in Ghana: Application of PEM electrolysis process and geospatial-multi-criteria approach. Int. J. Sustain. Energy 2023, 42, 1202–1225. [Google Scholar] [CrossRef]
- Bhandari, R. Green hydrogen production potential in West Africa—Case of Niger. Renew. Energy 2022, 196, 800–811. [Google Scholar] [CrossRef]
- Niger NDCs. Contribution Déterminée au Niveau National (Révisée). 2021. Available online: https://unfccc.int/sites/default/files/NDC/2022-06/CDNReviséedelaRDC.pdf (accessed on 15 December 2023).
- INS (Institut Nationale de la Statistique). Available online: https://www.stat-niger.org/ (accessed on 5 December 2023).
- Dankassoua, M.; Madougou, S.; Yahaya, S. Evaluation of Solar Potential at Niamey: Study Data of Insolation from 2015 and 2016. Smart Grid Renew. Energy 2017, 8, 394–411. [Google Scholar] [CrossRef]
- United Nations. Energy Statistics Pocketbook 2022; Statistics Papers, Serie E No.5; United Nations: New York, NY, USA, 2022; Available online: https://unstats.un.org/unsd/energystats/pubs/pocketbook/ (accessed on 15 December 2023).
- Yushchenko, A.; de Bono, A.; Chatenoux, B.; Patel, M.K.; Ray, N. GIS-based assessment of photovoltaic (PV) and concentrated solar power (CSP) generation potential in West Africa. Renew. Sustain. Energy Rev. 2018, 81, 2088–2103. [Google Scholar] [CrossRef]
- Vertex. Vertex S Backsheet Monocrysytalline Module. Available online: https://static.trinasolar.com/sites/default/files/EU_Datasheet_VertexS_DE09.05_C.pdf (accessed on 15 December 2023).
- Ahmed, T.; Mekhilef, S.; Shah, R.; Mithulananthan, N. An assessment of the solar photovoltaic generation yield in Malaysia using satellite derived datasets. Int. Energy J. 2019, 19, 61–76. [Google Scholar]
- Renac, I. Irena Solar Power Spatial Planning Techniques; IRENA Global Atlas: Abu Dhabi, United Arab Emirates, 2021. [Google Scholar]
- Harrison, K.W.; Remick, R.; Martin, G.D.; Hoskin, A. Hydrogen Production: Fundamentals and Cas Study Summaries e Preprint. 2010. Available online: https://www.osti.gov/bridge (accessed on 15 December 2023).
- Aghakhani, A.; Haque, N.; Saccani, C.; Pellegrini, M.; Guzzini, A. Direct carbon footprint of hydrogen generation via PEM and alkaline electrolysers using various electrical energy sources and considering cell characteristics. Int. J. Hydrogen Energy 2023, 48, 30170–30190. [Google Scholar]
- Kost, T.C.; Shammugam, S.; Fluri, V.; Peper, D.; Memar, A.D. Schlegl Stromgestehungskosten Erneuerbare Energien; Fraunhofer: Freiburg, Germany, 2021. [Google Scholar]
- Konstantin, P.P. Energiewirtschaft; Springer: Berlin/Heidelberg, Germany, 2017; Volume 3, pp. 662–49822. [Google Scholar]
- Müller, L.A.; Müller, L.A.; Leonard, A.; Leonard, A.; Trotter, P.A.; Trotter, P.A.; Hirmer, S.; Hirmer, S. Green hydrogen production and use in low- and middle-income countries: A least-cost geospatial modelling approach applied to Kenya. Appl. Energy 2023, 343. [Google Scholar] [CrossRef]
- International Atomic Energy Agency (IAEA). Sustainable Electricity Supply Scenarios for West Africa. Iaea-Tecdoc-1793; IAEA: Vienna, Austria, 2016; p. 144. [Google Scholar]
- Fraunhofer Institute for Solar Energy Systems Ise. Cost Forecast for Low-Temperature Electrolysis—Technology Driven Bottom-Up Prognosis for PEM and Alkaline Water Electrolysis Systems; Fraunhover: Freiburg, Germany, 2021; Available online: https://www.ise.fraunhofer.de/ (accessed on 15 December 2023).
- Rahmouni, S.; Settou, N.; Negrou, B.; Gouareh, A. GIS-based method for future prospect of hydrogen demand in the Algerian road transport sector. Int. J. Hydrogen Energy 2016, 41, 2128–2143. [Google Scholar] [CrossRef]
- Dincer, I.; Colpan, C.O.; Ezan, M.A.; Kizilkan, O. Progress in clean energy, volume 2: Novel systems and applications. Prog. Clean Energy 2015, 2, 1–1184. [Google Scholar] [CrossRef]
- Rahmouni, S.; Settou, N.; Chennouf, N.; Negrou, B.; Houari, M. A technical, economic and environmental analysis of combining geothermal energy with carbon sequestration for hydrogen production. Energy Procedia 2014, 50, 263–269. [Google Scholar] [CrossRef]
- Sigurvinsson, J.; Mansilla, C.; Lovera, P.; Werkoff, F. Can high temperature steam electrolysis function with geothermal heat? Int. J. Hydrogen Energy 2007, 32, 1174–1182. [Google Scholar] [CrossRef]
- Ohta, T. Solar-Hydrogen Energy Systems; OHTA: Yokohama, Japan, 1979. [Google Scholar]
- Reddy, K.V.; Ghaffour, N. Overview of the cost of desalinated water and costing methodologies. Desalination 2007, 205, 340–353. [Google Scholar] [CrossRef]
- IEA. Special Report on Solar PV Global Supply Chains. 2022. Available online: https://www.iea.org/reports/solar-pv-global-supply-chains/executive-summary (accessed on 7 September 2023).
- World Bank Data. Real Interest Rate. Available online: https://data.worldbank.org/indicator/FR.INR.RINR?locations=NE (accessed on 15 April 2024).
- IRENA. Renewable Power Generation Costs in 2017; IRENA: Abu Dhabi, United Arab Emirates, 2018; Available online: https://www.irena.org/-/media/Files/IRENA/Agency/Publication/2018/Jan/IRENA_2017_Power_Costs_2018.pdf (accessed on 7 September 2023).
- U.S-DOE. Primer on Energy Efficiency for Water and Wastewater Treatment (Department of Energy (DOE)); U.S-DOE: Washington, DC, USA, 2016. [Google Scholar]
- Patterson, B.D.; Mo, F.; Borgschulte, A.; Hillestad, M.; Joos, F.; Kristiansen, T.; Sunde, S.; van Bokhoven, J.A. Bruce Renewable CO2 recycling and synthetic fuel production in a marine environment. Proc. Natl. Acad. Sci. USA 2019, 116, 12212–12219. [Google Scholar] [CrossRef]
- Seen-Veolia. Tarifs de l’eau au Niger, Conformément à l’arrêté du Ministère de l’hydraulique et de l’environnement- société d’exploitation des eaux du Niger (SEEN)-Veolia). Available online: https://www.africa.veolia.com/sites/g/files/dvc1886/files/document/2019/09/CSC%20Niamey%20Municipal%20Niger%20Water_FR%20%282%29.pdf (accessed on 18 August 2023).
- Zhou, Y.; Tol, R.S.J. Evaluating the costs of desalination and water transport. Water Resour. Res. 2005, 41, 1–10. [Google Scholar] [CrossRef]
- Elkadeem, M.R.; Younes, A.; Mazzeo, D.; Jurasz, J.; Campana, P.E.; Sharshir, S.W.; Alaam, M.A. Geospatial-assisted multi-criterion analysis of solar and wind power geographical-technical-economic potential assessment. Appl. Energy 2022, 322, 119532. [Google Scholar]
- Ahmed, T.Z.; Braeckman, J.P.; Damo, U.M.; Hassan, M.G. The potential for rooftop solar photovoltaics to meet future electricity demand in Khartoum, Sudan. World J. Eng. Res. Technol. 2022, 8. [Google Scholar]
- IEA (Interntaiona Energy Agency). Africa Energy Outlook 2022; African Energy Chamber: Johannesburg, South Africa, 2022. [Google Scholar] [CrossRef]
- Irena. Renewable Generation Costs in 2022; Irena: Abu Dhabi, United Arab Emirates, 2022. [Google Scholar]
- World Energy Council. Working Paper|Hydrogen Demand and Cost Dynamics; England Wales: Great Britain, UK, 2021. [Google Scholar]
- Ahmadi, M.H.; Shahabaddin, S.; Dehshiri, H.; Rezaei, M. A Thorough Economic Evaluation by Implementing Solar/Wind Energies for Hydrogen Production: A Case Study. Sustainability 2022, 14, 1177. [Google Scholar] [CrossRef]
- Ahshan, R. Potential and economic analysis of solar-to-hydrogen production in the sultanate of oman. Sustainability 2021, 13, 9516. [Google Scholar] [CrossRef]
- Julich, B. WASCAL, SASCAL H2 Atlas Africa -Institute of Energy and Climate Research—Techno-Economic Systems Analysis (IEK-3). Available online: https://www.h2atlas.de/fr/hydrogen-tool (accessed on 3 March 2023).
Disclaimer/Publisher’s Note: The statements, opinions and data contained in all publications are solely those of the individual author(s) and contributor(s) and not of MDPI and/or the editor(s). MDPI and/or the editor(s) disclaim responsibility for any injury to people or property resulting from any ideas, methods, instructions or products referred to in the content. |
© 2025 by the authors. Licensee MDPI, Basel, Switzerland. This article is an open access article distributed under the terms and conditions of the Creative Commons Attribution (CC BY) license (https://creativecommons.org/licenses/by/4.0/).
Share and Cite
Boubé, B.D.; Bhandari, R.; Saley, M.M.; Bonkaney, A.L.; Adamou, R. Techno-Economic Analysis of Geospatial Green Hydrogen Potential Using Solar Photovoltaic in Niger: Application of PEM and Alkaline Water Electrolyzers. Energies 2025, 18, 1872. https://doi.org/10.3390/en18071872
Boubé BD, Bhandari R, Saley MM, Bonkaney AL, Adamou R. Techno-Economic Analysis of Geospatial Green Hydrogen Potential Using Solar Photovoltaic in Niger: Application of PEM and Alkaline Water Electrolyzers. Energies. 2025; 18(7):1872. https://doi.org/10.3390/en18071872
Chicago/Turabian StyleBoubé, Bachirou Djibo, Ramchandra Bhandari, Moussa Mounkaila Saley, Abdou Latif Bonkaney, and Rabani Adamou. 2025. "Techno-Economic Analysis of Geospatial Green Hydrogen Potential Using Solar Photovoltaic in Niger: Application of PEM and Alkaline Water Electrolyzers" Energies 18, no. 7: 1872. https://doi.org/10.3390/en18071872
APA StyleBoubé, B. D., Bhandari, R., Saley, M. M., Bonkaney, A. L., & Adamou, R. (2025). Techno-Economic Analysis of Geospatial Green Hydrogen Potential Using Solar Photovoltaic in Niger: Application of PEM and Alkaline Water Electrolyzers. Energies, 18(7), 1872. https://doi.org/10.3390/en18071872