Article

Evaluating the Balancing Properties of Wind and Solar Photovoltaic System Production

1
Institute of Forestry and Engineering, Estonian University of Life Sciences, 51006 Tartu, Estonia
2
CanmetEnergy Research Centre, Natural Resources Canada, 1 Haanel Drive, Ottawa, ON K1A1M1, Canada
3
Faculty of Mechatronics, Informatics and Interdisciplinary Studies, Technical University of Liberec, 461 17 Liberec, Czech Republic
4
Association of Talent Under Liberty in Technology (TULTECH), Sopruse Pst, 10615 Tallinn, Estonia
5
Institute for Nanomaterials, Advanced Technologies and Innovation, Technical University of Liberec, Studentská 1402/2, 461 17 Liberec, Czech Republic
*
Author to whom correspondence should be addressed.
Energies 2025, 18(7), 1871; https://doi.org/10.3390/en18071871
Submission received: 4 March 2025 / Revised: 30 March 2025 / Accepted: 3 April 2025 / Published: 7 April 2025
(This article belongs to the Special Issue Integration of Renewable Energy Systems in Power Grid)

Abstract

:
This research evaluates how wind and solar PV systems balance together. Increasing the share of stochastic renewable energy production in electricity and hot turning reserve deficit are welcome compensation issues. This research used weather station data from an open seashore from the last 10 years, 2014–2023, on the Estonian island Saaremaa’s west coast to evaluate yearly fluctuations. We used the indicator demand cover factor to estimate the coincidence of wind generation and solar PV system electricity. For clarity, the initial data were prepared by assuming the equality of production and consumption annual data by scaling the obtained data. This study demonstrates that the best compensating possibilities are the share of wind generation and solar PV electricity mix, respectively, equal to 0.7/0.3 and 0.8/0.2, reaching a demand cover factor of 0.62. This study evaluated the demand cover factor’s dependence on increased production compared to consumption. This study used different batteries to research the influence of these demand cover factors. Furthermore, this research makes a significant contribution by showcasing how to turn weather station data into real wind generator and PV panel production data.

1. Introduction

The increasing share of renewable energy sources in electricity generation is essential for achieving a sustainable and low-carbon energy system [1]. Among the most widely used renewable energy technologies, wind power (wind) and solar photovoltaic (solar PV) systems stand out due to their availability, scalability, and decreasing costs; however, both sources exhibit stochastic production patterns, leading to challenges in balancing supply and demand within a power grid. Understanding the relationship between these two sources is essential for optimizing energy generation, minimizing curtailment, and ensuring a stable electricity supply [2,3].
The balance between wind and solar PV system production has become a key concern in energy system planning, particularly in regions with a high penetration of variable renewable energy. While wind and solar PV systems are complementary to some extent, their combined production characteristics must be thoroughly analysed to determine the optimal mix that maximizes electricity generation while minimizing reserve deficits. The main challenge arises from the intermittent nature of these energy sources, requiring effective strategies to enhance grid stability and self-sufficiency [4].
There has been a slight setback in the development of green technologies recently. For example, the USA plans to withdraw from green agreements, and Europe has begun to realize the negative economic impact of overly rapid clean energy development plans. Despite everything, the development of renewable energy—specifically wind and solar—continues regardless of the wishes of top executives. The driving force behind this is humanity’s pursuit of a cleaner environment for future generations. There have not been many studies in recent years specifically on the compensatory properties between wind and solar PV generation equipment and their practical applicability.
Wind and solar PV systems have been combined, with biomass also included, proposed in [5]; however, it does not analyse the interaction between wind and solar PV systems. Moreover, batteries are listed alongside energy sources such as wind and solar PV systems, which is incorrect. The seasonal variations in solar and wind energy are analysed in the Commonwealth of Kentucky, USA. When considering daily patterns, the wind was found to follow solar generation with an offset [6]. The results indicate the potential of solar and wind energy across most African regions and emphasize the importance of considering solar, wind, or their combined energy mix for local energy planning and storage solutions [7]. The use of flexible solar and wind fleets as a secondary reserve, combined with an implicit storage technique, has been proposed [8]. Integrating multiple energy sources into a single hybrid renewable energy system effectively addresses challenges like intermittency and geographical limitations associated with individual renewable systems. Therefore, the continuous development and implementation of an energy management system are crucial for achieving key objectives such as energy efficiency, resilience, stability, and sustainability [9]. Several studies related to this field have been reviewed and are summarized as follows:
Benato et al. [10] examined the integration of energy storage systems with photovoltaic power plants, showing that the virtual power plant (VPP) model effectively smooths PV power peaks and enhances supply stability. Niu and Luo [11] explored economic efficiencies of distributed PV systems and storage solutions, revealing that optimized storage frameworks enhance grid adaptability and stability. Ho-Tran and Fiedler [12] studied seasonal extreme events in Germany’s renewable production, highlighting the increased risk of low power production in summer due to stationary cyclonic weather patterns. Fasihi et al. [13] investigated the potential of green ammonia production using hybrid PV–wind plants, identifying cost-competitive scenarios by 2040. Dietrich [14] analysed zero-energy buildings in different climates, emphasizing land-use trade-offs and optimized renewable integration strategies. Salkuti [15] proposed optimal railway electrification using renewable sources, demonstrating cost benefits and enhanced grid integration.
Chen et al. [16] examined land-use conflicts in renewable energy deployment in Northern Europe, concluding that offshore wind expansion could reduce land demands. Silva et al. [17] proposed a stochastic approach for optimizing renewable energy market participation, showing significant profit gains and imbalance reductions. Nnodim et al. [18] analysed wind and solar integration into electricity grids, recommending curtailment and storage for effective intermittency management. Al-Dahidi et al. [19] developed machine learning models for PV power predictions, improving forecasting accuracy for better grid management. Santos-Alamillos et al. [20] studied wind–solar spatiotemporal balancing in the Iberian Peninsula, concluding that colocation reduces generation variability. Veluchamy [21] introduced an optimization algorithm for microgrid energy management, achieving cost reductions in distributed networks. Velosa et al. [22] developed an open-source simulator for energy community power demand and generation scenarios, facilitating the testing of optimization strategies. Lippert [23] discussed lithium-ion energy storage in wind farms, demonstrating effective output control and ancillary service provision. Tafarte et al. [24] investigated bioenergy’s role in mitigating fluctuations from wind and solar PV systems, concluding that flexible bioenergy operation enhances grid stability. Schmidt et al. [25] analysed Brazil’s hydrothermal system, highlighting the benefits of wind–PV expansion in reducing thermal backup needs. Carbajales-Dale et al. [26] assessed storage energy costs for wind and solar PV systems, revealing that wind energy can support large-scale storage while PV systems are limited in terms of storage affordability. Haegel and Kurtz [27] tracked global PV adoption trends, showing rapid expansion and increasing storage integration.
Hadi et al. [28] proposed a demand response algorithm to optimize renewable penetration in microgrids, reducing peak demand and enhancing system balance. Stamatakis et al. [29] examined energy management in super-tankers, demonstrating CO2 reductions through PV–wind–hydrogen integration. Shepherd et al. [30] developed feasibility tools for green ammonia production, assessing storage needs and balancing strategies. Hou et al. [31] analysed climate change impacts on solar power generation, identifying changes in seasonal production variability. Madiba et al. [32] optimized under-frequency load shedding in microgrids, improving reliability through renewable integration. Coles et al. [33] studied tidal stream power’s impact on energy system security, demonstrating its role in supply–demand balancing. Jiang et al. [34] applied machine learning for energy management in grid-connected microgrids, achieving cost reductions and efficiency improvements. The following table summarizes the methodologies, objectives, and results from relevant studies.
From the literature overview, it becomes evident that different measures are used to try to achieve balancing activities in the presence of renewables: using a virtual power plant model, producing green ammonia, engaging energy storage elements, using machine learning models to predict solar PV production, etc. (Table 1). All these measures are prioritized for more significant profit, and the second output is balancing properties with renewables. The third aspect is lessening the environmental impact. Wind and solar PV production often accompany each other. The shortcoming that is revealed from the previous literature review is that different methods are used for balancing renewables, but marginal attention has been paid to the possibility of using self-balancing possibilities between wind and solar.
Unlike previous studies focusing on hourly based yearly datasets over ten years, our research provides a site-specific analysis by examining real-world data from Saaremaa, Estonia, offering localized insights into wind and PV system integration. The use of a decade-long dataset (2014–2023) ensures robustness in assessing renewable energy balancing, making our findings more reliable. Furthermore, this study applies the demand cover factor indicator to quantitatively evaluate the effectiveness of wind–PV system synergy in covering local electricity consumption, a methodology that is rarely explored in the existing literature. While previous studies primarily analyse wind and PV systems separately, our research uniquely assesses the role of different battery storage solutions in influencing the demand cover factor. Additionally, our findings provide practical recommendations for policymakers and grid operators in Estonia and similar regions, contributing to renewable energy policy advancements.
The core objective of this research is to identify the most effective combination of wind and solar PV system generation that enhances energy balance and minimizes reliance on external energy sources. It presents a comprehensive analysis of the balancing issues between wind and solar PV system production, emphasizing the significance of data-driven approaches in optimizing renewable energy generation. This study highlights the importance of selecting an appropriate energy mix, utilizing advanced forecasting techniques, and incorporating battery storage solutions to achieve a more reliable and sustainable energy supply. The insights derived from this research will be valuable for informing future renewable energy policies and strategies, particularly in regions with similar climatic and geographical conditions.
This article consists of five parts. The first part is the introduction, which gives the literature overview and sets the objectives. The second part gives an overview of the data treatment objectives used and describes the modelled equipment. The third chapter consists of the results of modelling and the influence of wind/solar PV share on the demand capacity factor in different conditions. The fourth chapter is the conclusion, where an explanation for issues that are not handled in the main chapters is given. The conclusion provides the principal results and generalizations. This article also has one appendix with a description of the measurement devices.

2. Data and Methods

In this study, the settlement of Roomassaare on the west coast of Saaremaa was chosen as the location for the wind generator and PV panels described in this article. This choice was primarily due to good wind conditions and the simultaneous availability of PV and wind speed data at the measuring station. Another factor in favour of this choice was that the location is on an island and at the same time in a remote area with a foreseeable weak electricity grid. This study interpreted the wind and solar PV system production data using hourly wind speed and total solar radiation data from the Roomassaare weather station (N 58°13′05″; E 22°30′3″) [36]. It used 10 years of hourly data from 2014 to 2023. Wind speed data were measured at the weather station at a height of 10 m.
The anemometer WAA151 measured wind speed from 4 December 2007 to 26 May 2015, and the anemometer WAA151 and windvane WAV151 measured wind direction during this period (Appendix A, Table A1 and Table A2 [37]). A Kipp & Zonen pyranometer CMP-21 (Delft, The Netherlands) measured solar total irradiation (Appendix A, Table A3 [38]). From 27 May 2015 to now, the Ultrasonic Wind Sensor WMT700 has been used to measure wind speed and direction (Appendix A, Table A1, [39]). Vaisala (Vantaa, Finland) produces all wind sensors.
Figure 1 shows that the wind generator and solar PV system production data are sometimes summarized and sometimes exist alone. Spring is the best time for following the coincidence of wind and solar PV system production data.
Scaling wind generator production and solar PV system data means that the sums of both annual datasets equal the sum of yearly consumption.
Wind speed from a height of 10 m was extrapolated to 18 m as the initial data of the wind generator TUGE 20 [40] using a logarithmic equation [41]:
V 2 = V 1 · l n · h 2 z 0 l n · h 1 z 0 ,
where V2 is the extrapolated wind speed at a height of 18 m, m/s;
V1 is the measured wind speed at a height of 10 m, m/s;
h2 is the wind generator hub height, 18 m;
h1 is the height of the measured wind speed in the weather station, 10 m;
z0 is the roughness coefficient; for a flat landscape, z0 = 0.03.
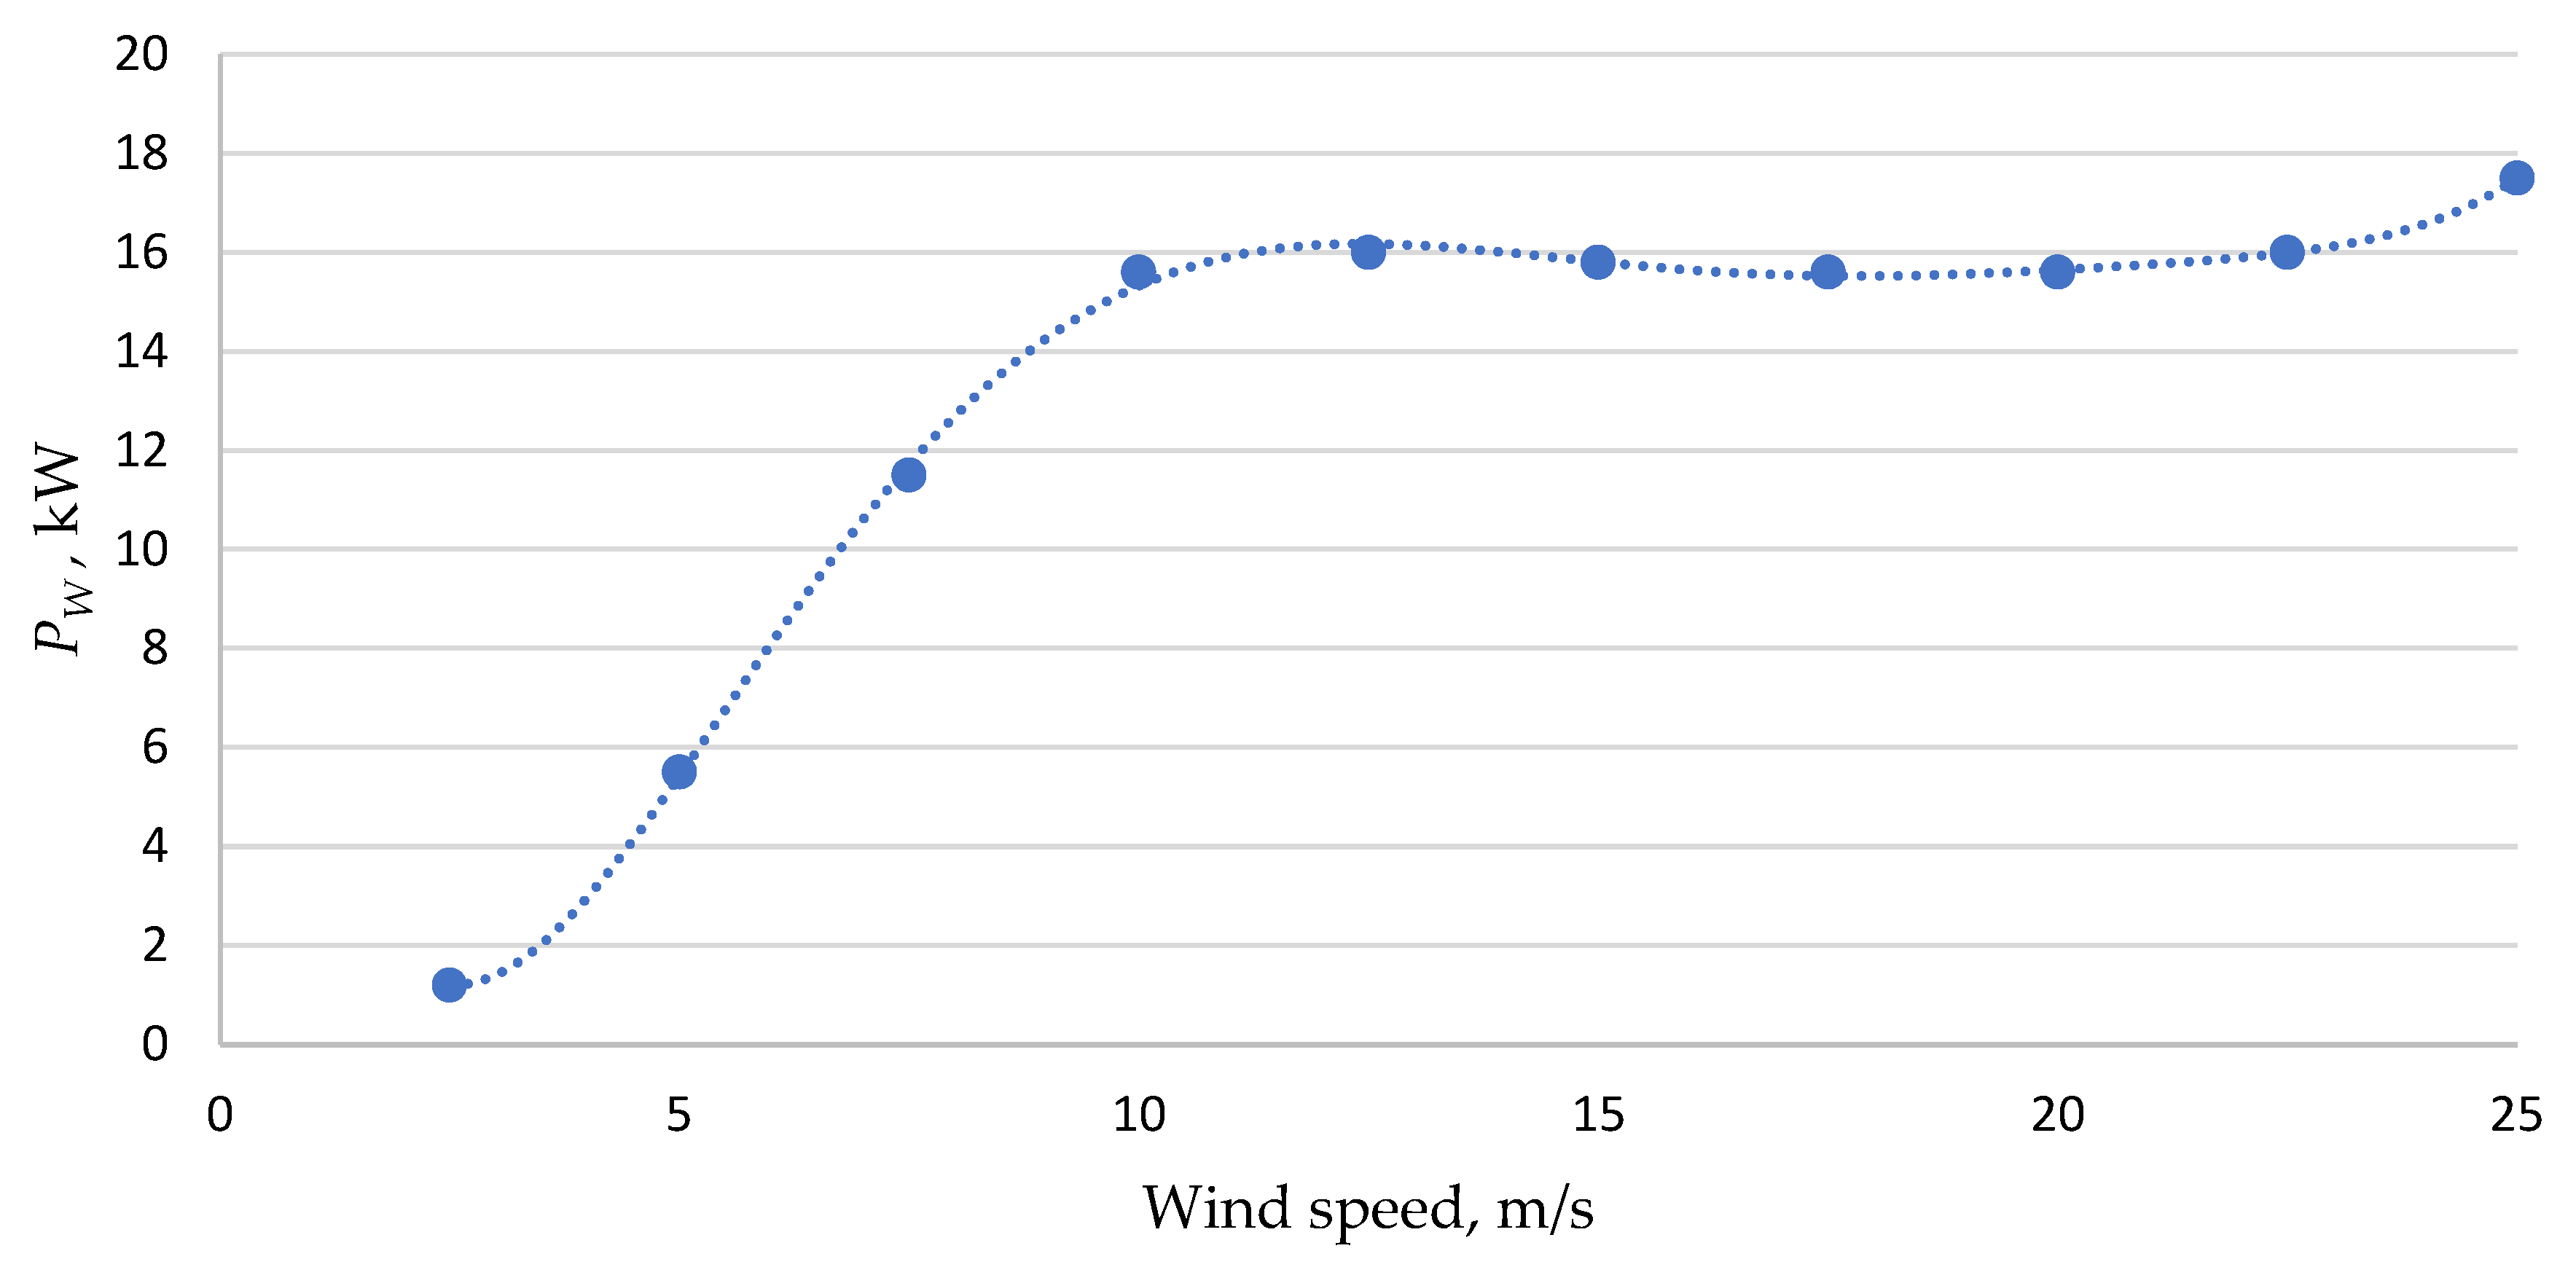
TUGE 20 power curve data [40] were interpolated by Formula (2), R2 = 0.9994:
P = 7 · 10 6 · V 0 6 0.0006 · V 0 5 + 0.022 · V 0 4 + 0.3904 · V 0 3 + 3.3587 · V 0 2 10.894 · V 0 + 12.753 ,
where P is the wind generator output capacity, kW;
V0 is the scaled wind speed at a height of 18 m.
The power curve described by Formula (2) is present in Figure 1.
Figure 2 shows that the sixth-order polynomial is described quite well for the power curve, R2 = 0.9994. As the cut-in wind speed for TUGE 20 is 3.5 m/s, power values below 3.5 m/s were removed. It is a typical small-wind-generator power curve.
The approximation of the solar irradiation data from the weather station horizontal-plane measurements for real PV panels’ output data (angle to the ground: 35°, azimuth: 180°, efficiency: 0.213, panel size a’= 2297 × 1134 mm, quantity: 10, Ja Solar JAM72S30 550W (Beijing, China), monocrystal) begins from the angle of incidence calculations by Formula (3) [42]:
A f = cos θ z · cos β + s i n ( θ z ) · s i ( β ) · cos γ s γ ,
where Af is the angle of incidence, °;
Ѳz is the zenith angle, °;
ß—the slope, the angle between the plane of the surface in question and horizontal, °;
ϒs is the solar azimuth angle, °;
ϒ is the surface azimuth angle, °.
Clear sky index [43]:
K t = G H I G 0 · c o s ( Z s ) ,  
where Kt is the clearness index;
GHI is the total sun solar irradiation on a horizontal surface in the Roomassaare weather station, W/m2;
G0 is the solar constant, 1367 W/m2;
Zs is the zenith angle, °.
Diffuse horizontal irradiance—DHI [43]:
D H I = G H I · 1 F ,
where F is as follows:
F =   1 0.249 · K t ,   w h e n   K t < 0.35   1.577 1.84 · K t ,   w h e n   0.35 K t < 0.75 0.1 ,   w h e n   K t 0.75 ,
Direct normal irradiance—DNI:
D N I = G H I D H I c o s ( Z s ) ,
Direct solar irradiance—Gdir:
G d i r = D N I · A f ,
Solar diffused irradiation—Gdif:
G d i f = D H I · ( 1 + cos β ) 2 ,
Solar irradiation reflection—Gref:
G r e f = G H I · ( 1 cos β ) 2 ,
Total irradiation—Gtotal:
G t o t a l = G o t s e + G d i f + G r e f ,  
PV panel production—P:
P = G t o t a l · S · η ,  
where P is the PV panel produced capacity, W;
S is the total panel area, m2;
η is the PV panel efficiency.
The modelled family size in a private house is two people and an area of 90 m2. The consumption schedule was measured in 2023, and the yearly consumption was 3276 kWh. Estonia is very close to the EU average in 2022 of 1584 kWh electricity consumption per capita [44]. The current case’s consumption is 3276 kWh, slightly more than the EU average of 3168 kWh for such households. The model features a typical household location in the countryside. The household has wood log stoves, electrical floor heating in the WC, two refrigerators, and an electric stove. There are no heat pumps. The yearly consumption graph is supposed to be close for all years from 2014 to 2023. New devices were not obtained during these ten years in this private house.
Calculations in this article scaled the wind generator and PV panels’ annual productions to equal the yearly consumption. PV panel production scaled by consumption was as follows:
P P V h = K P V · P P V h ,
where P P V ( h ) is the scaled annual production graph equal to the sum of consumption, kWh;
PPVh is the hourly production of PV panels, kW;
KVP is the scaling coefficient for PV panels:
K P V = W c y W P V y ,
where Wcy is the yearly sum of the consumption graph, kWh;
WPVy is the sum of yearly PV panel consumption, kWh.
Wind generator production by consumption:
P W ( h ) = K W · P W h ,
where P w ( h ) is the scaled wind generator annual production equal to the sum of consumption, kWh;
PWh is the hourly production of the wind generator, kW;
KW is the scaling coefficient for the wind generator:
K W = W c y W W y ,
where Wwy is the sum of the yearly wind generator production, in kWh.
Total power graph, which is equal to the consumption:
P t o t a l h = a · P P V h + b · P W ,
where a = percentage 0… 1, and b = (1 − a).
The indicator being modelled is the self-consumption rate or, in other words, the demand cover factor YD [45,46,47,48]:
Y D = t 0 t 1 P D d t + t 1 t 2 P S d t t 0 t 2 P D d t ,
where PS is the local power supply, and PD is the local power demand. The time when PD (t)PS (t) is denoted as t0t1, and t1t2 is the time when PD (t) ≥ PS (t) [45]. The demand cover factor is defined as the ratio in which the local supply covers the energy demand and indicates the “self-generation” [42,45].
This article investigates whether there may be differences in the best wind and PV electricity in different years when self-consumption is the highest. It finds the margins of the fluctuation and evaluates the optimal battery size.
This article is used to compare production capabilities among years in terms of the capacity factor (CF) [49]:
C F = 0 8760 P d t P r a t e d · t ,
where P is the annual production graph hourly capacities, kW;
Prated is the rated capacity of the production device, kW;
t is the hours per year, t = 8760 h.
The capacity factor is the quotient between annual actual production, conceivable production, and the yearly permanent rated production.
The multiplication coefficient, FD, is calculated as follows [50]:
F D = W p r o d t 0 t 2 P D d t ,
where Wprod is the actual wind generator and PV panel production mix, kWh;
t 0 t 2 P D d t is the yearly consumed electricity, kWh.

3. Results

This section presents results for calculating wind and solar PV system balancing properties together. Table 2 presents capacity factors CFwind and CFPV as annual capacity factors for wind generators and PV panels, respectively, Vavg is the average wind speed by year, and Pwind and PPV are the average yearly scaled wind generator and PV panel capacities, respectively. CFwind is desirably high for this site. CFPV is similar in all places in Estonia: at the seashores and lakeshores, it is a little higher, similarly to what is presented here, and inland, it keeps near 0.11. The fluctuations are higher with CFwind due to the nature of the wind conditions. In conclusion, the analysis of CFwind and CFPV representatives separated the average year, 2019, minimum, 2018, and maximum, 2020, when both capacities were similarly average, minimum, or maximum.
This means that, when yearly solar irradiation is high, the potential output of wind generators is high too; more energy from the sun induces more energy in the wind. Pwind and PPV denote the average annual capacity by 100% of production, separately.
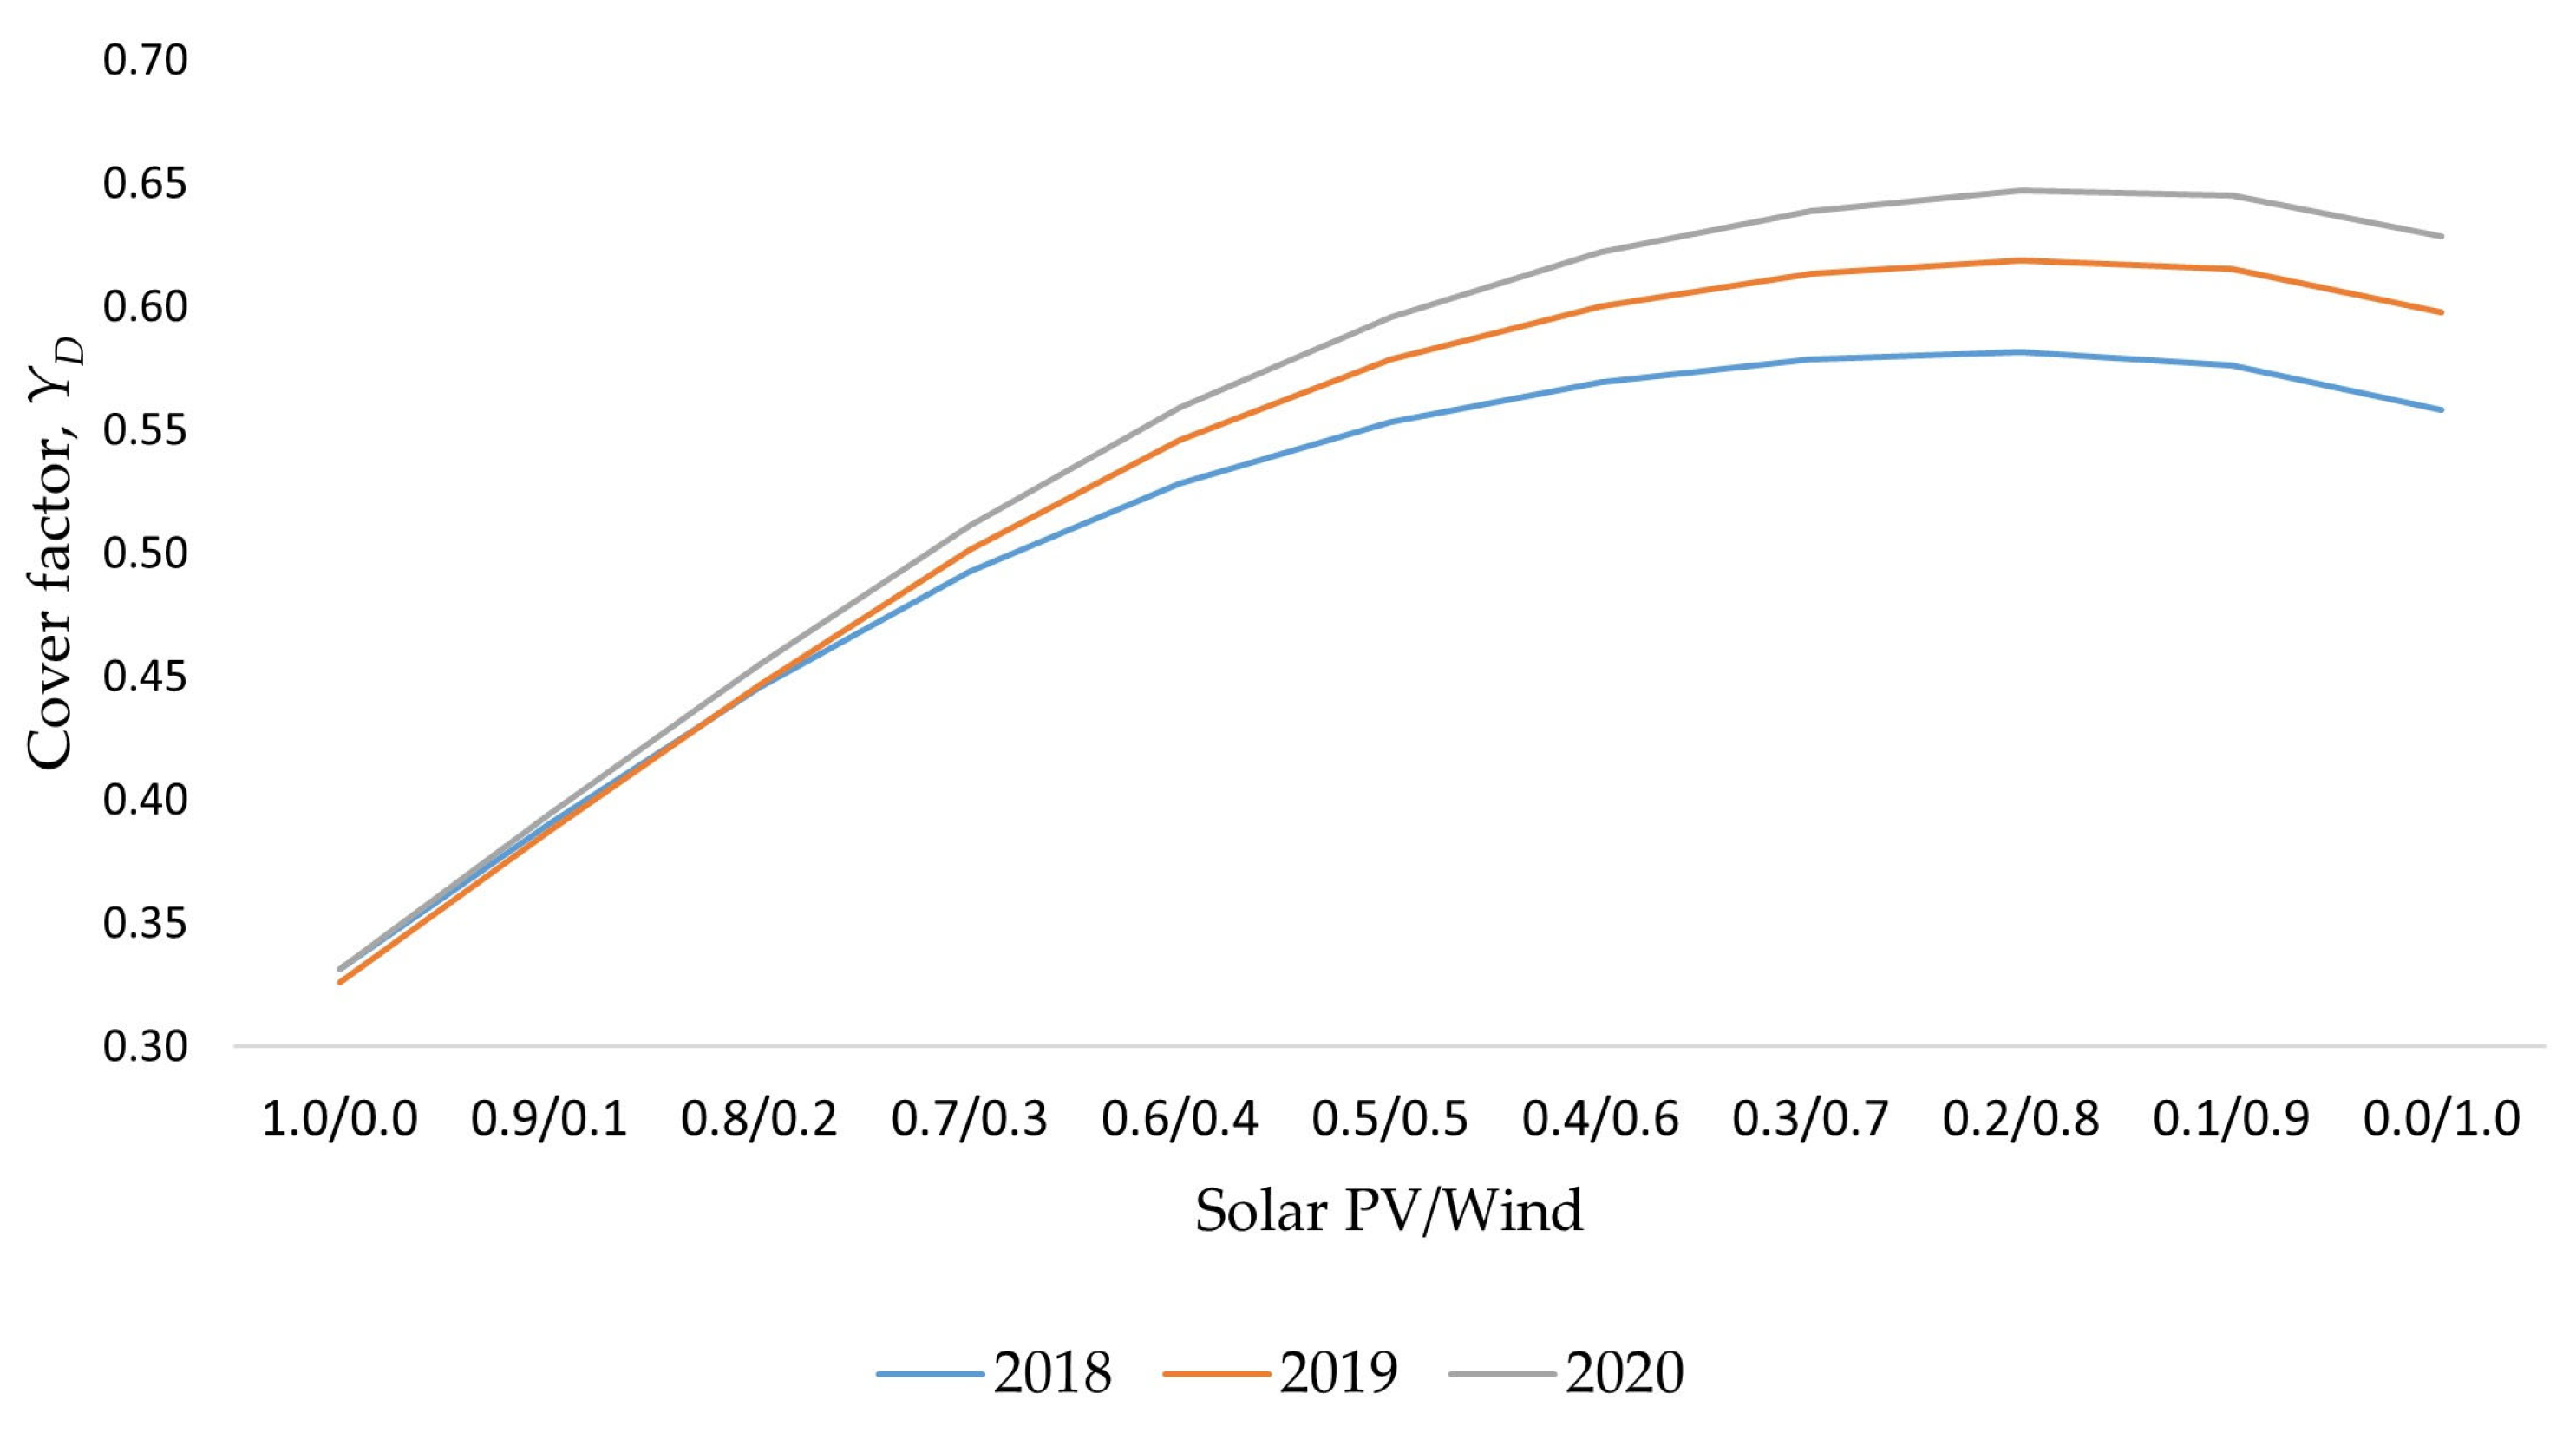
Figure 3 presents the demand cover factor, YD, in terms of different energy mixes. Energy mixes are annual electricity productions.
Figure 3 depicts the YD dependence of different wind and solar PV energy mixes. The highest value of 2019, YD = 0.62, was achieved for the energy mix values 0.2/0.8 and 0.3/0.7 simultaneously, as well as solar PV and wind systems. In this area, the curve is very smooth; it lowers rapidly on the side of a 100% solar PV system, YD = 0.33, and the opposite side of the figure when the wind share is 100%, YD = 0.6. This means that wind generation has more influence on the YD than solar PV systems do.
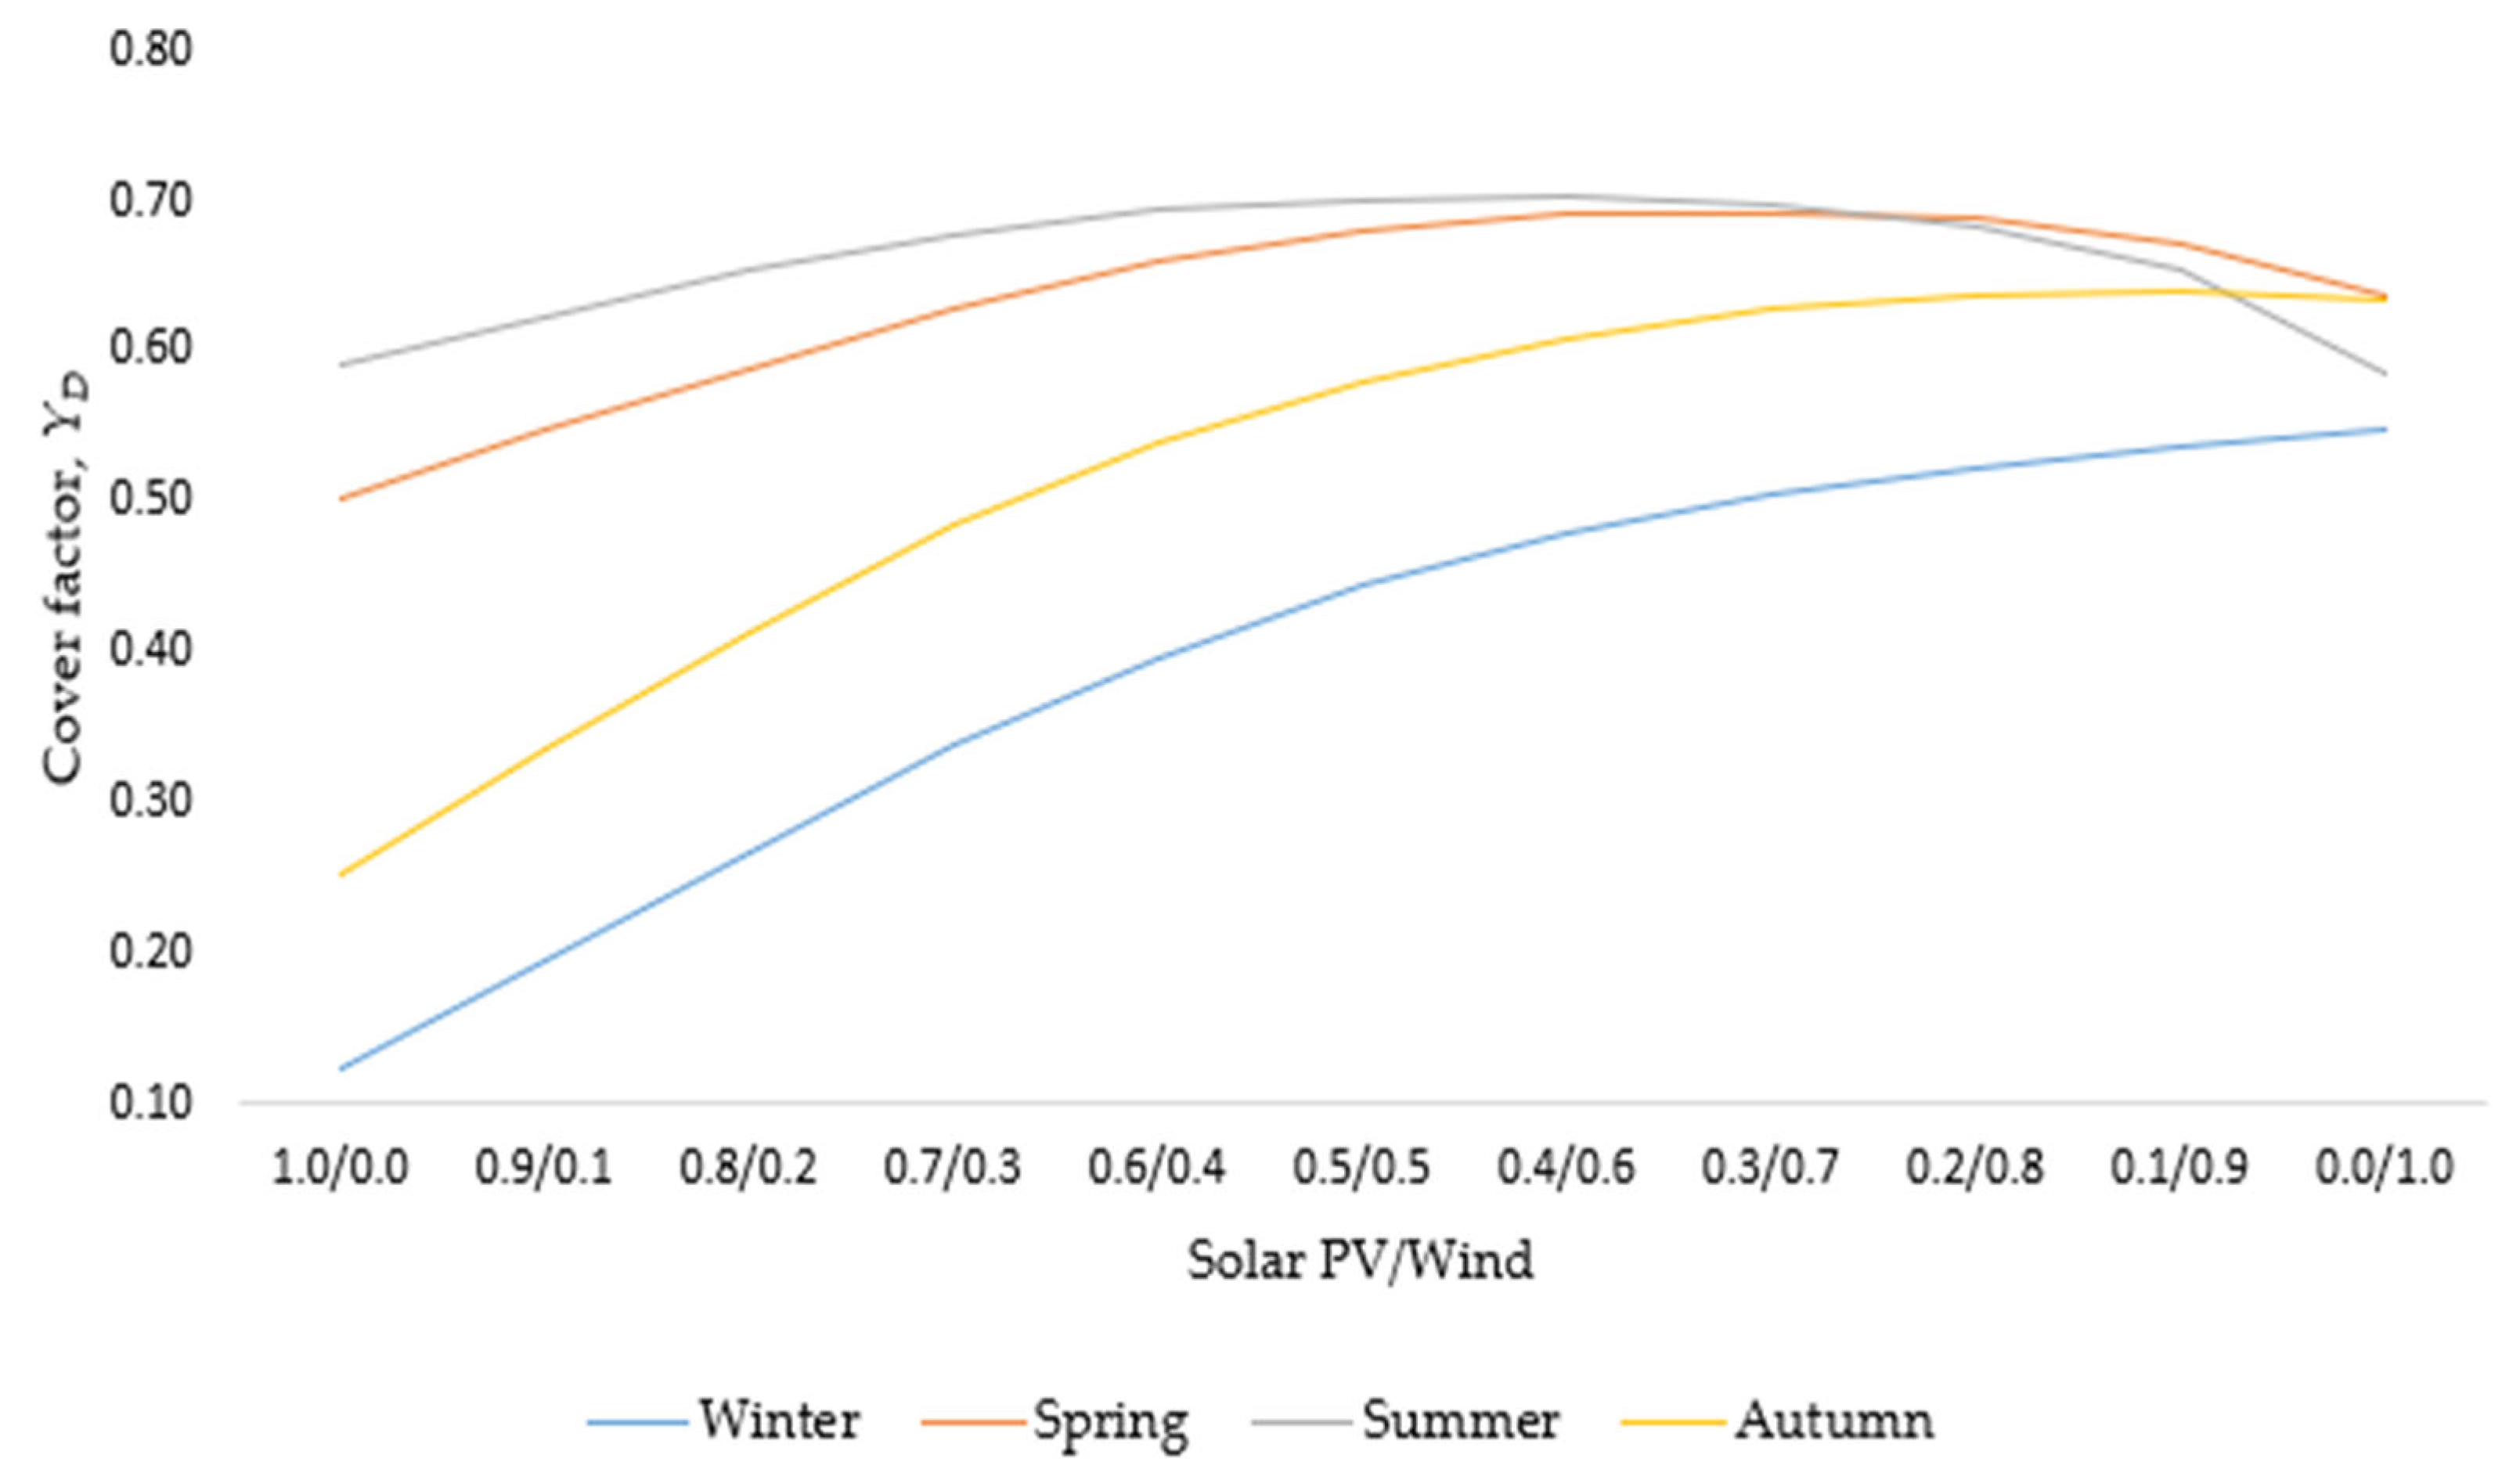
Figure 4 presents the demand cover factor, YD, in terms of different energy mixes, which are seasonal electricity productions.
Figure 4 depicts the YD dependence of different wind and solar PV energy mixes by season. The highest value is found in summertime, YD = 0.7, was achieved for the energy mix values 0.2/0.8 and 0.3/0.7 simultaneously, as well as solar PV and wind systems. The worse YD = 0.5 by the same energy mix is found in winter. In wintertime, the expected 100% solar PV value is YD = 0.12. With 100% wind, have less influence is present, and a relatively high value, YD = 0.6… 0.7, is maintained.
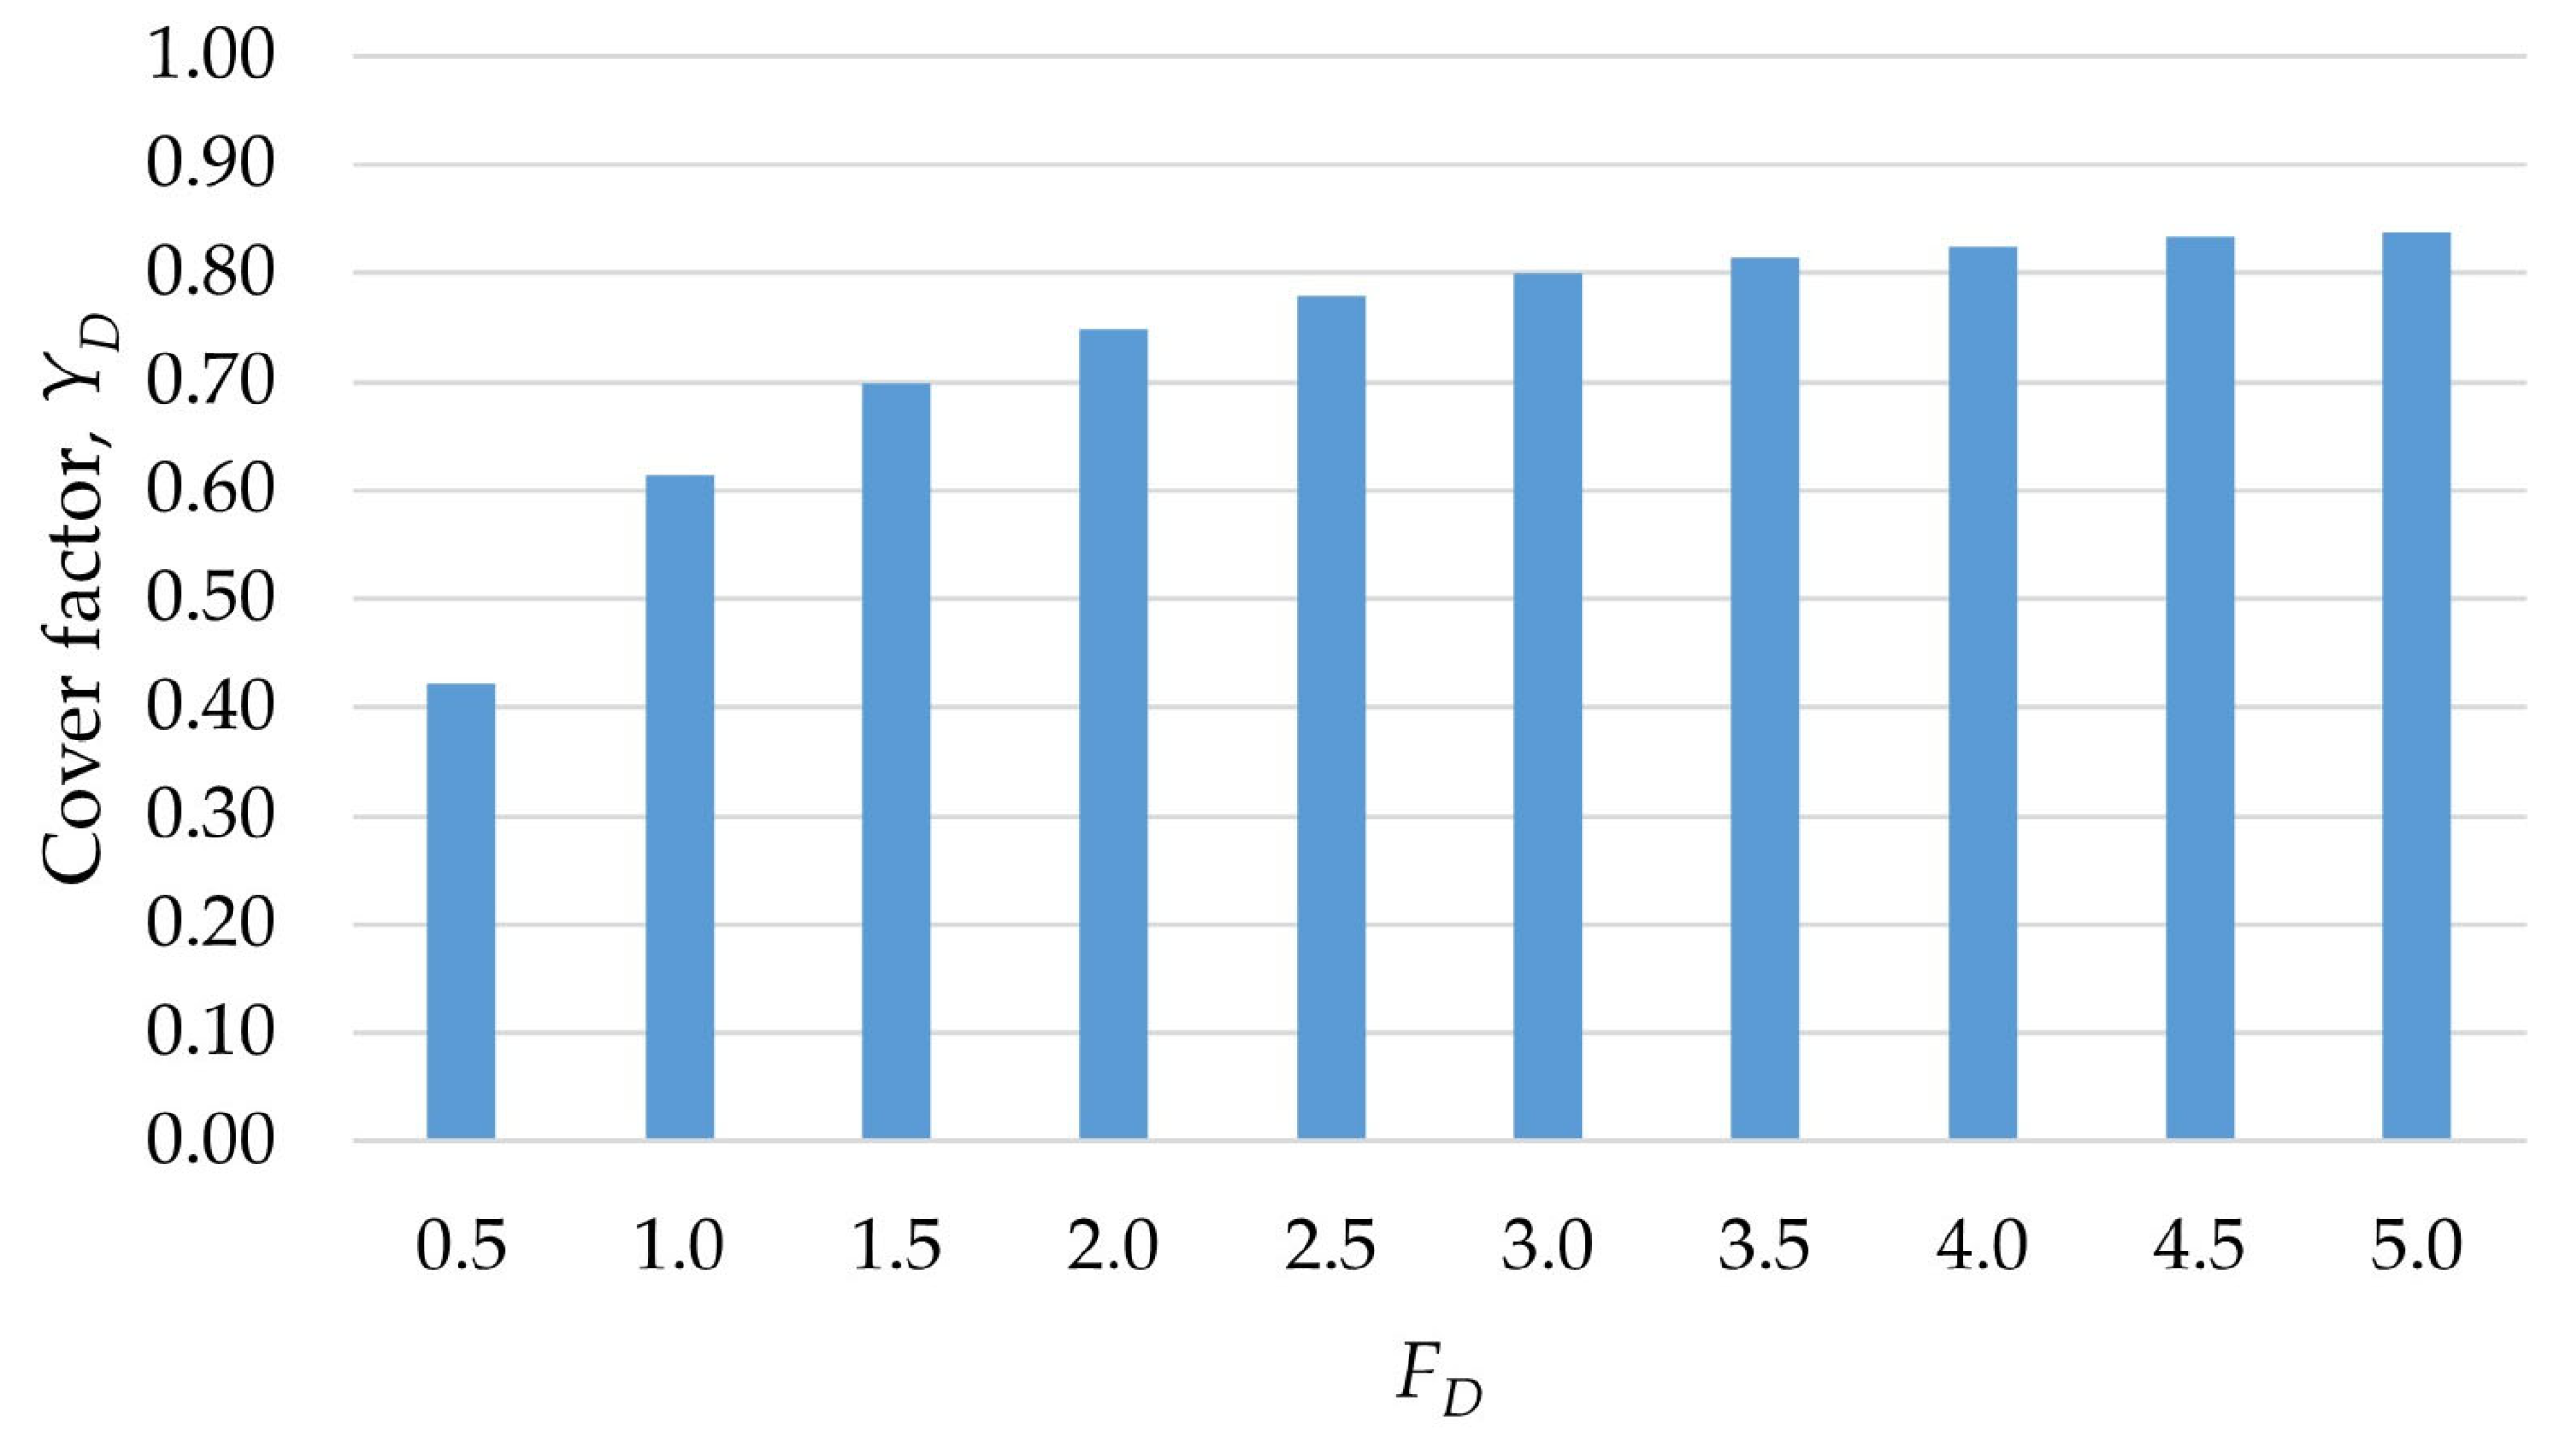
Figure 5 depicts the influence of the multiplicity, FD, of production on consumption in 2019 in terms of the 0.2/0.8 energy mix.
According to analyses supported by Figure 5, some conclusions can be made. The YD is significantly reduced by reducing production to half of consumption, according to expectations. YD growth slackens by increasing FD over one, reaching the value FD = 2.5 when YD reaches 0.78. This means that YD no longer grows proportionally when FD increases beyond 2.5. More precisely, the limit could be considered as FD = 2.
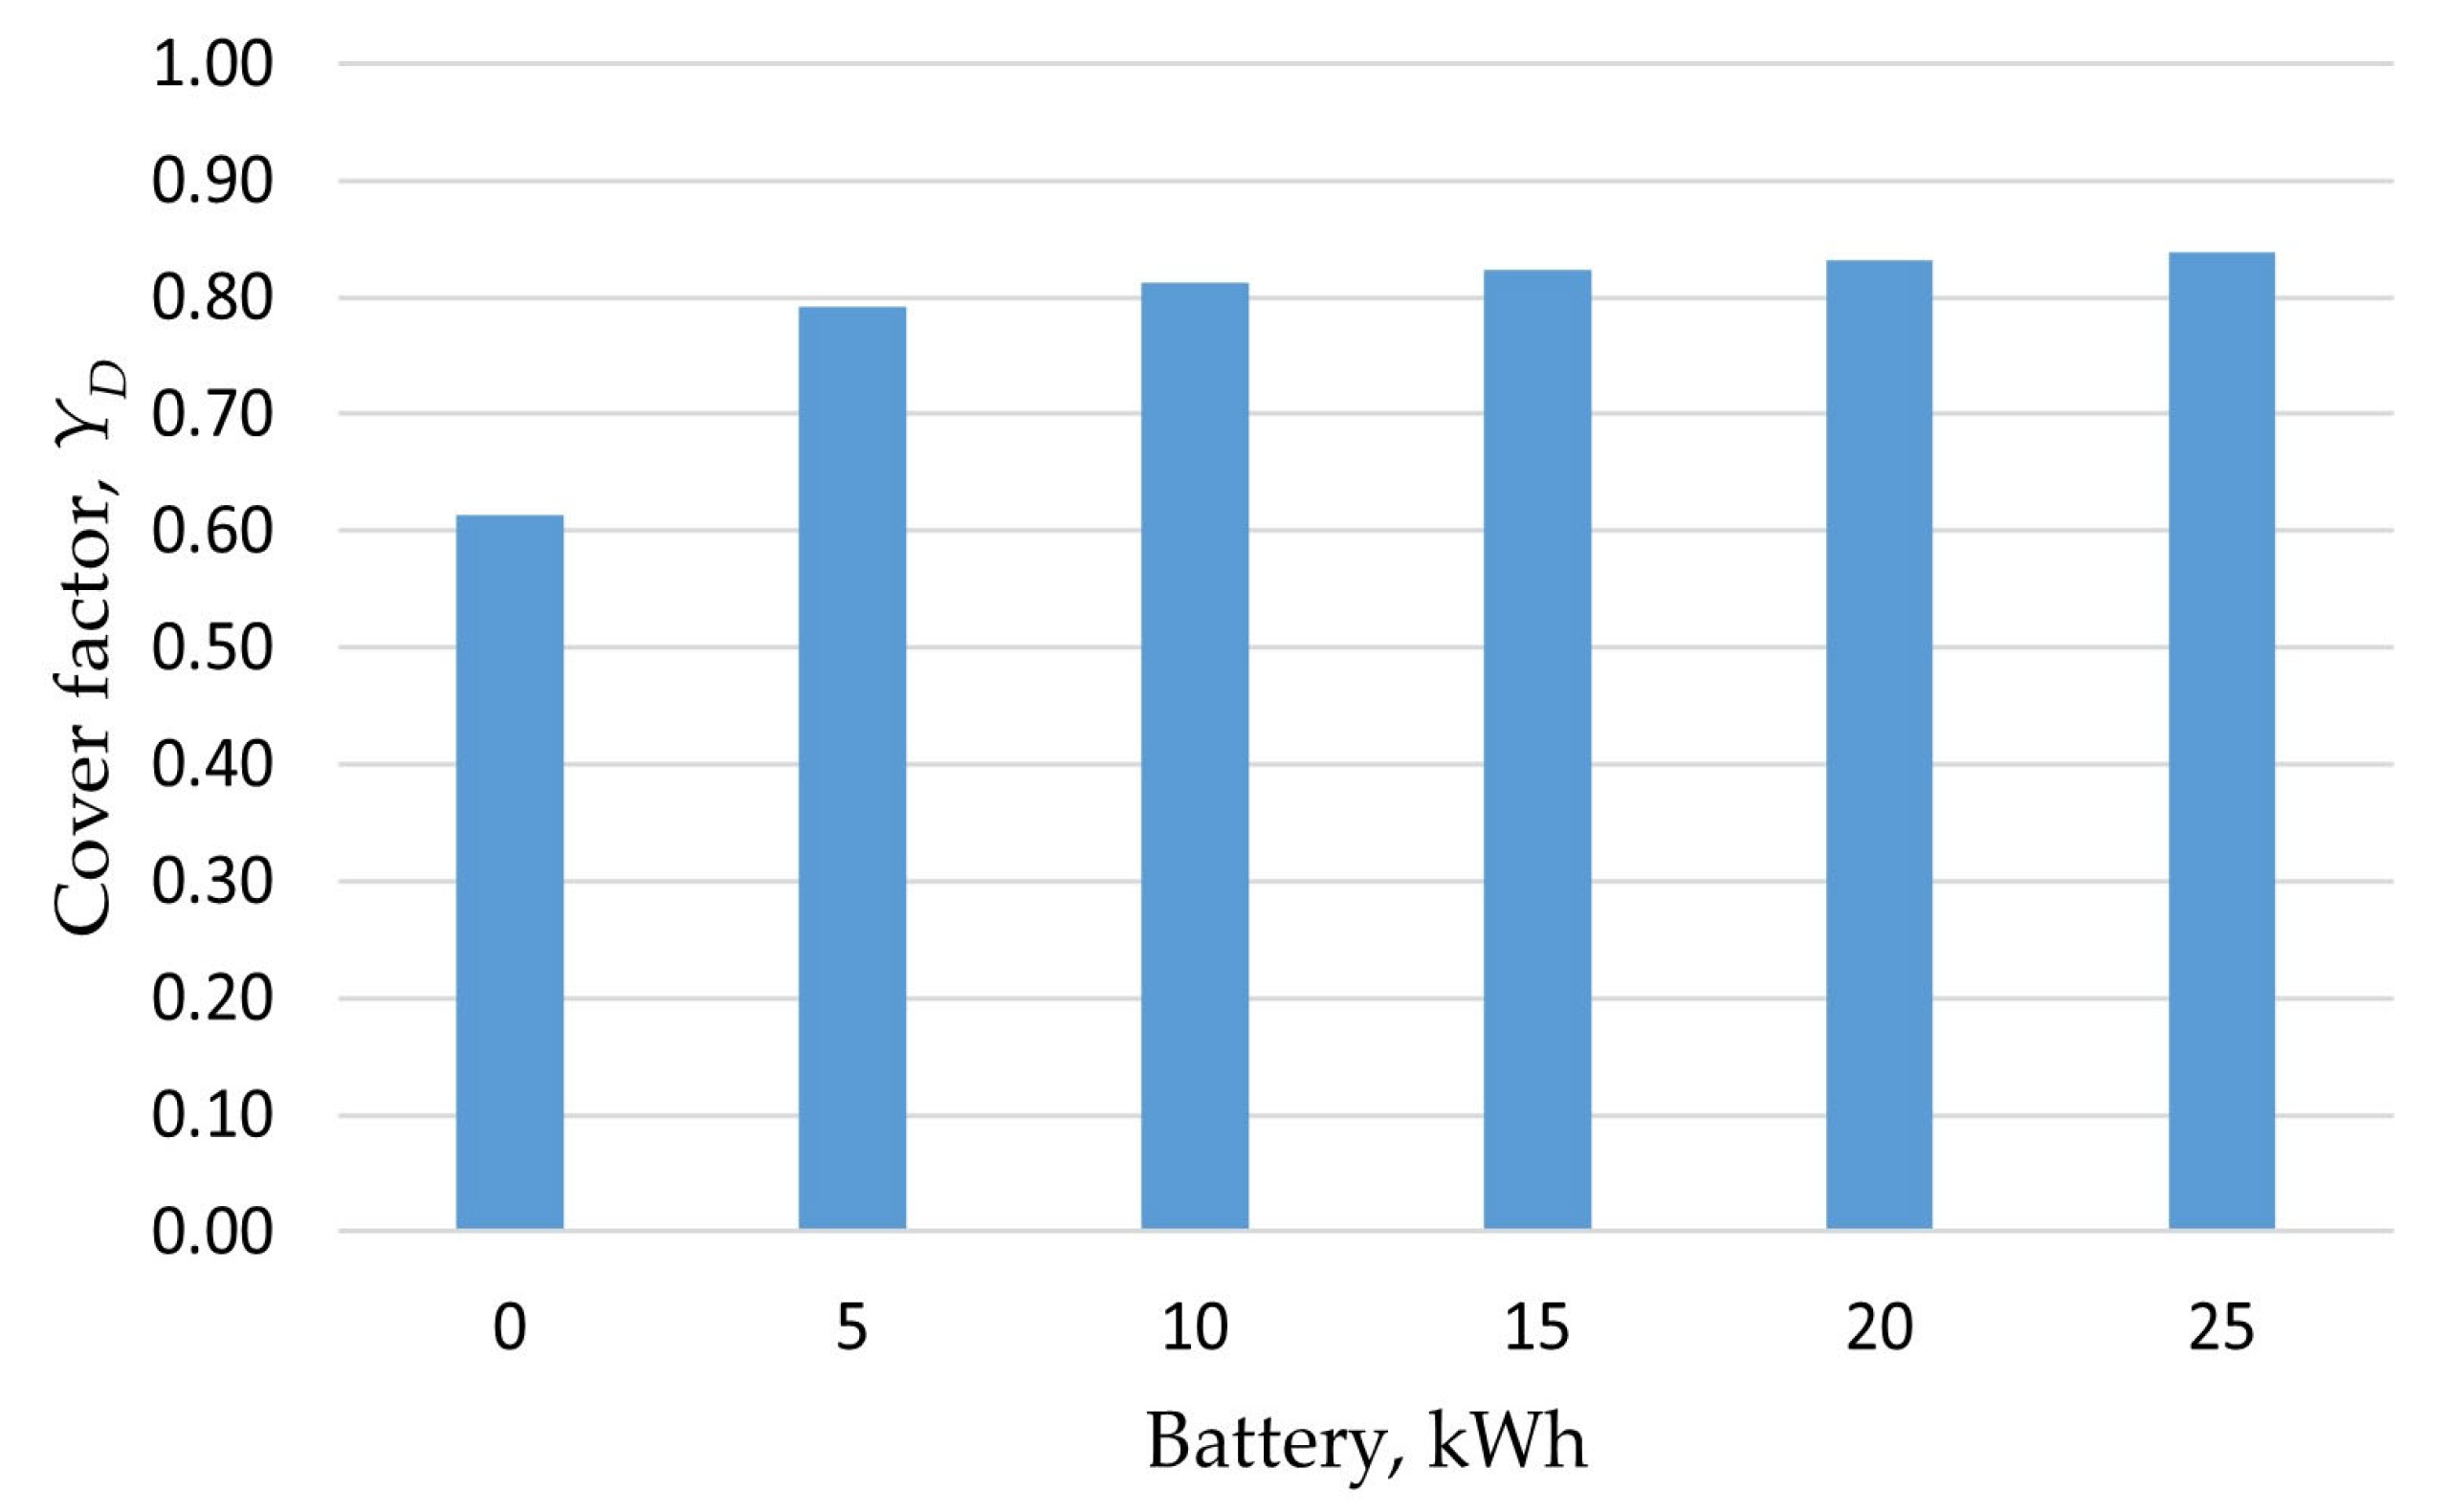
Figure 6 depicts the influence of adding batteries to the solution by FD = 1 in 2019, using an energy mix of 0.2/0.8.
Figure 6 depicts logic similar to that of the previous figure. Increasing the battery volume by over 10 kWh is no longer effective. It is identical to the asymptotic function, like in Figure 4. Upon switching the battery in the system to one that is 10 kWh, the YD reaches 0.82.

4. Discussion

This calculation does not take battery efficiency and ageing parameters into account. The authors assume that modern lithium batteries have high efficiency and that ageing parameters remain within the range uncertainty. The calculated YD appears relatively high compared to previous results [50]. Earlier calculations used a wind generator with CFwind = (0.05… 0.08); now, it is around 0.4. Solar PV CF was a little lower, too. Previously, different consumer data [45] were used at night with zero consumption; the current consumption data form an unbroken chart. There is less consumption at night and more in the daytime; however, consumption is still lower at night.
Different indicators of the optimal wind and solar PV energy mix are considered worldwide, but the results are similar to ours. In the US, the optimal energy mixes for balancing generation and daily load consist of approximately 80% wind energy and 20% solar PV due to the nighttime gap in solar production [51]. Again, in the US computing expected load-carrying capability, the best results were obtained in the 75/25 mix of wind and solar PV [52]. For instance, the initial statistical analysis of the Japanese data indicates that the optimal mix of hydrothermal, geothermal, and biomass energy that minimizes the standard deviation of mismatch, and the theoretical energy storage capacity is a combination of 75% solar and 25% wind power [53]. This means that this mix might be the opposite when in combination with other renewable energy sources. In contrast, a scenario with an 80/20 wind–solar energy mix reduces the overall surplus and offers an excellent opportunity for arbitraging the remaining surplus [54]. In conclusion, the available sources are rather old, and the optimal energy mix depends on the methodology and the accompaniment of other renewable sources.
As depicted in Figure 5 and Figure 6, YD is calculated using the average value in 2019. If minimum and maximum year values are used, YD changes between margins 0.59 and 0.65. The uncertainty is less than ±5%.
Wind speed and total solar irradiation are often measured at weather stations, but how can these measurements be interpolated into technical production data? This article addresses this question. Although it appears to be a case study, it provides insights that can be scaled up or down for other solutions.
Preventing the oversizing of wind and solar PV production equipment when planning small distributed networks is essential. The best option is to have a high self-consumption level. This has an economic effect. Less electricity purchased from the grid lessens the environmental impact. Electricity obtained from the grid is generated largely by fossil fuels. The ecological effect is expressed only by the choice of production equipment: wind generators and solar PV. Hydroelectricity in Estonia is not spread due to the flat terrain. Other ways are to purchase electricity from the grid and use a CHP (cogeneration heat plant), gas turbines or motors, or, in the worst case, only electrical generators that use fossil liquid fuels.

5. Conclusions

This study provides significant insight into balancing wind and solar PV system production research in small-scale regions like Estonia. This article’s novelty lies in its study of wind and solar PV balancing in good wind conditions in Estonia. In good wind conditions, the YD maximum is broader, and the impact of wind and solar separately on the individual result is more significant.
We used self-consumption, measured as a demand cover factor, YD, as an indicator for evaluating wind, and solar PV system balancing potential together. A smooth peak appears on the demand cover factor curve and wind and solar PV system production, particularly in shares of 30/70 and 20/80 for solar PV systems and wind, respectively. The maximum YD at the peak is 0.62, and maintaining a high level of YD favours wind generation, where 100% wind production yields a YD of 0.6, compared to only 0.33 for 100% solar PV energy. The production capacity needed to be increased relative to consumption to achieve optimal results, with the best outcomes occurring at FD = 2.5 and YD = 0.78. By increasing FD over 2.5, the growth speed of YD significantly slows down. Adding battery storage further improved capacity utilization, with a 10 kWh battery achieving a YD of 0.82. It is important to note that wind conditions with a high CF, as presented in this study, provide only a small balancing effect between wind and solar PV system production, whereas lower CF values for wind enhance the impact of balancing.
Finally, this article presents a method for calculating the actual output of production devices based on measured weather, wind, and total solar irradiation data. The best balancing shares of wind and solar PV are generalized at least to the northern hemisphere and by different CF values of wind and solar PV.

Author Contributions

Conceptualization, A.A. and W.Y.; methodology, A.A. and R.M. (Riho Meister); software, R.M. (Riho Meister); validation, K.H. and W.Y.; formal analysis, K.H., R.M. (Reza Moezzi) and M.G.; investigation, A.A.; resources, A.A. and K.H.; data curation, R.M. (Riho Meister) and R.M. (Reza Moezzi); writing—original draft preparation, R.M. (Reza Moezzi), M.G. and A.A.; writing—review and editing, A.A., R.M. (Reza Moezzi) and M.G.; visualization, R.M. (Riho Meister) and M.G.; supervision, A.A.; project administration, A.A. All authors have read and agreed to the published version of the manuscript.

Funding

This research received no external funding.

Data Availability Statement

The original contributions presented in this study are included in the article. Further inquiries can be directed to the corresponding author.

Acknowledgments

The authors would like to thank Tuge Energia Ltd. (TUGE Ltd., Paldiski, Estonia) for making the data of the 20 kW wind generator available, the Estonian Environment Agency Weather Service department for making wind and solar irradiation data available, and the Chair of Energy Application Engineering at the Estonian University of Life Sciences for support.

Conflicts of Interest

The authors declare no conflicts of interest.

Appendix A

Table A1. Anemometer WAA151 specifications [37].
ParameterIndication
Sensor/Transducer typeCup anemometer/Optico-chopper
Measuring range0.4…75 m/s
Starting threshold<0.5 m/s
Accuracy (within 0.4…60 m/s), with characteristic transfer function±0.17 m/s
With “simple transfer function” Ut = 0.1 × R±0.5 m/s
Table A2. Wind vane WAV151 specifications [37].
ParameterIndication
Sensor/Transducer typeVane/Optical code disc
Measuring range0…360°
Starting threshold<0.4 m/s
Resolution5.6°
AccuracyBetter than ±3°
Setting time after power turn-on<100 µs
Dealy distance0.4 m
Table A3. Specifications of pyranometer KippjaZonen CMP21 [38].
ParameterIndication
Spectral range (50% points)285 to 2800 nm
Sensitivity7 to 14 µV/W/m2
Response time (95%)<5 s
Zero ofset A<±7 W/m2
Zero ofset B<±2 W/m2
Directional response (up to 80° with 1000 W/m2 beam)
Temperature response (−20 to ±50 °C)<±1%
Operational temperature−40 °C to +80 °C
Maximum solar irradiance4000 W/m2
Fielf of view180°
Table A4. Specifications of Ultrasonic Wind Sensor WMT700 [39].
ParameterIndication
Observation rangeWMT701: 0….40 m/s
Starting threshold0.01 m/s
Resolution time250 ms
Accuracy0…75 m/s ±0.1 m/s or 2% of reading, whichever is greater
Observation range0…360°
Starting threshold0.1 m/s
Resolition0.01°
Response time250 ms
Accuracy± 2°
Observation rangeWMT701: 0….40 m/s

References

  1. Benhacene, H.L.M.; Hussien, A.M. The Impact of Adopting Renewable Energy Resources on Sustainable Development in Saudi Arabia: A Qualitative View. Sustainability 2025, 17, 768. [Google Scholar] [CrossRef]
  2. Kies, A.; Schyska, B.; Von Bremen, L. The Demand Side Management Potential to Balance a Highly Renewable European Power System. Energies 2016, 9, 955. [Google Scholar] [CrossRef]
  3. Shen, C.-L.; Shen, Y.-S. Output Filter Design for a Novel Dual-Input PV-Wind Power Converter by Energy Balance Principle. Appl. Sci. 2016, 6, 263. [Google Scholar] [CrossRef]
  4. Boubii, C.; El Kafazi, I.; Bannari, R.; El Bhiri, B.; Bossoufi, B.; Kotb, H.; AboRas, K.M.; Emara, A.; Nasiri, B. Synergizing Wind and Solar Power: An Advanced Control System for Grid Stability. Sustainability 2024, 16, 815. [Google Scholar] [CrossRef]
  5. Frimpong, S.O.; Agbehadji, I.E.; Abayomi, A.; Millham, R.C.; Freeman, E.; Ujakpa, M.M. Economic and Reliability Determination of Sustainable Renewable Energy Mix Based on Social Spider Prey Optimization Algorithm. Soft Comput. 2023, 27, 10687–10718. [Google Scholar] [CrossRef]
  6. Syed, A.S.; Patrick, A.; Lauf, A.; Elmaghraby, A. Assessing the Complementarity of Wind and Solar Energy in Kentucky. Energies 2024, 17, 3226. [Google Scholar] [CrossRef]
  7. Larsen, M.A.D.; Bournhonesque, J.; Thiery, W.; Halsnæs, K.; Hattermann, F.F.; Hoff, H.; Salack, S.; Adenle, A.; Liersch, S. Renewable Energy Planning in Africa: Robustness of Mean and Extreme Multi-Model Climate Change Patterns in Solar PV and Wind Energy Potentials. Environ. Res. Commun. 2024, 6, 15001. [Google Scholar] [CrossRef]
  8. Pierro, M.; Barba, M.; Perez, R.; Perez, M.; Moser, D.; Cornaro, C. Ancillary Services via Flexible Photovoltaic/Wind Systems and “Implicit” Storage to Balance Demand and Supply. Solar RRL 2023, 7, 2200704. [Google Scholar] [CrossRef]
  9. Belhadef, O.; Merahi, F.; Badoud, A.E. Energy Management Systems for Hybrid Renewable Energy Systems: A Comprehensive Review. In Proceedings of the 2024 2nd International Conference on Electrical Engineering and Automatic Control (ICEEAC), Setif, Algeria, 12–14 May 2024; pp. 1–6. [Google Scholar]
  10. Benato, A.; De Vanna, F.; Stoppato, A. Levelling the Photovoltaic Power Profile with the Integrated Energy Storage System. Energies 2022, 15, 9521. [Google Scholar] [CrossRef]
  11. Niu, X.; Luo, X. Policies and Economic Efficiency for Distributed Photovoltaic and Energy Storage Industry. Distrib. Gener. Altern. Energy J. 2023, 38, 1197–1222. [Google Scholar] [CrossRef]
  12. Ho-Tran, L.; Fiedler, S. More Summertime Low-Power Production Extremes in Germany with a Larger Solar Power Share. Solar Energy 2024, 283, 112979. [Google Scholar] [CrossRef]
  13. Fasihi, M.; Weiss, R.; Savolainen, J.; Breyer, C. Global Potential of Green Ammonia Based on Hybrid PV-Wind Power Plants. Appl. Energy 2021, 294, 116170. [Google Scholar] [CrossRef]
  14. Dietrich, U. Zero-Energy Buildings in Cities with Different Climates and Urban Densities: Emergy Demand, Renewable Energy Harvest On-Site and Off-Site and Total Land Use for Different Renewable Technologies. Int. J. Energy Prod. Manag. 2021, 6, 335–346. [Google Scholar] [CrossRef]
  15. Salkuti, S.R. Optimal Operation of Electrified Railways with Renewable Sources and Storage. J. Electr. Eng. Technol. 2021, 16, 239–248. [Google Scholar] [CrossRef]
  16. Chen, Y.; Kirkerud, J.G.; Bolkesjø, T.F. Balancing GHG Mitigation and Land-Use Conflicts: Alternative Northern European Energy System Scenarios. Appl. Energy 2022, 310, 118557. [Google Scholar] [CrossRef]
  17. Silva, A.R.; Pousinho, H.M.I.; Estanqueiro, A. A Multistage Stochastic Approach for the Optimal Bidding of Variable Renewable Energy in the Day-Ahead, Intraday and Balancing Markets. Energy 2022, 258, 124856. [Google Scholar] [CrossRef]
  18. Nnodim, C.T.; Kpu, G.C.; Okhuegbe, S.N.; Ajani, A.A.; Adebayo, S.; Diarah, R.S.; Aliyu, S.J.; Onokwai, A.O.; Osueke, C.O. Figures of Merit for Wind and Solar PV Integration in Electricity Grids. J. Sci. Ind. Res. 2022, 81, 349–357. [Google Scholar]
  19. Al-Dahidi, S.; Ayadi, O.; Adeeb, J.; Alrbai, M.; Qawasmeh, B.R. Extreme Learning Machines for Solar Photovoltaic Power Predictions. Energies 2018, 11, 2725. [Google Scholar] [CrossRef]
  20. Santos-Alamillos, F.J.; Pozo-Vázquez, D.; Ruiz-Arias, J.A.; Lara-Fanego, V.; Tovar-Pescador, J. Analysis of Spatiotemporal Balancing between Wind and Solar Energy Resources in the Southern Iberian Peninsula. J. Appl. Meteorol. Climatol. 2012, 51, 2005–2024. [Google Scholar] [CrossRef]
  21. Veluchamy, K.; Veluchamy, M. A New Energy Management Technique for Microgrid System Using Muddy Soil Fish Optimization Algorithm. Int. J. Energy Res. 2021, 45, 14824–14844. [Google Scholar] [CrossRef]
  22. Velosa, N.; Gomes, E.; Morais, H.; Pereira, L. PROCSIM: An Open-Source Simulator to Generate Energy Community Power Demand and Generation Scenarios. Energies 2023, 16, 1611. [Google Scholar] [CrossRef]
  23. Lippert, M. Balancing Renewables with Li-Ion Energy Storage. Power 2014, 158, 34. [Google Scholar]
  24. Tafarte, P.; Hennig, C.; Dotzauer, M.; Thrän, D. Impact of Flexible Bioenergy Provision on Residual Load Fluctuation: A Case Study for the TransnetBW Transmission System in 2022. Energy Sustain. Soc. 2017, 7, 3. [Google Scholar] [CrossRef]
  25. Schmidt, J.; Cancella, R.; Pereira, A.O. The Role of Wind Power and Solar PV in Reducing Risks in the Brazilian Hydro-Thermal Power System. Energy 2016, 115, 1748–1757. [Google Scholar] [CrossRef]
  26. Carbajales-Dale, M.; Barnhart, C.J.; Benson, S.M. Can We Afford Storage? A Dynamic Net Energy Analysis of Renewable Electricity Generation Supported by Energy Storage. Energy Environ. Sci. 2014, 7, 1538–1544. [Google Scholar] [CrossRef]
  27. Haegel, N.M.; Kurtz, S.R. Global Progress Toward Renewable Electricity: Tracking the Role of Solar (Version 3). IEEE J. Photovolt. 2023, 13, 768–776. [Google Scholar] [CrossRef]
  28. Al Hadi, A.; Silva, C.A.S.; Hossain, E.; Challoo, R. Algorithm for Demand Response to Maximize the Penetration of Renewable Energy. IEEE Access 2020, 8, 55279–55288. [Google Scholar] [CrossRef]
  29. Stamatakis, M.E.; Stamataki, E.E.; Stamelos, A.P.; Ioannides, M.G. Energy Management in a Super-Tanker Powered by Solar, Wind, Hydrogen and Boil-Off Gas for Saving CO2 Emissions. Electronics 2024, 13, 1567. [Google Scholar] [CrossRef]
  30. Shepherd, J.; Haider Ali Khan, M.; Amal, R.; Daiyan, R.; MacGill, I. Open-Source Project Feasibility Tools for Supporting Development of the Green Ammonia Value Chain. Energy Convers. Manag. 2022, 274, 116413. [Google Scholar] [CrossRef]
  31. Hou, X.; Wild, M.; Folini, D.; Kazadzis, S.; Wohland, J. Climate Change Impacts on Solar Power Generation and Its Spatial Variability in Europe Based on CMIP6. Earth Syst. Dyn. 2021, 12, 1099–1113. [Google Scholar] [CrossRef]
  32. Madiba, T.; Bansal, R.C.; Justo, J.J.; Kusakana, K. Optimal Control System of under Frequency Load Shedding in Microgrid System with Renewable Energy Resources. In Smart Energy Grid Design for Island Countries; Green Energy Technology; Springer: Berlin/Heidelberg, Germany, 2017; pp. 71–96. [Google Scholar] [CrossRef]
  33. Coles, D.; Wray, B.; Stevens, R.; Crawford, S.; Pennock, S.; Miles, J. Impacts of Tidal Stream Power on Energy System Security: An Isle of Wight Case Study. Appl. Energy 2023, 334, 120686. [Google Scholar] [CrossRef]
  34. Jiang, H.; Du, E.; He, B.; Zhang, N.; Wang, P.; Li, F.; Ji, J. Analysis and modeling of seasonal characteristics of renewable energy generation. Renew. Energy 2023, 219, 119414. [Google Scholar] [CrossRef]
  35. Frank, C.; Fiedler, S.; Crewell, S. Balancing Potential of Natural Variability and Extremes in Photovoltaic and Wind Energy Production for European Countries. Renew. Energy 2021, 163, 674–684. [Google Scholar] [CrossRef]
  36. Keskkonnaagentuur ILM. Estonian Environment Agency Weather Services. Available online: https://www.ilmateenistus.ee/?lang=en (accessed on 3 March 2025).
  37. Vaisala. Wind Sensors. Available online: https://www.vaisala.com/en/products/weather-environmental-sensors/wind (accessed on 3 March 2025).
  38. Pyranometer CMP21. Available online: https://www.kippzonen.com/Product/14/CMP21-Pyranometer (accessed on 3 March 2025).
  39. Ultrasonic Wind Sensor WMT700. Available online: https://www.vaisala.com/en/products/weather-environmental-sensors/windcap-ultrasonic-wind-sensor-wmt700 (accessed on 3 March 2025).
  40. TUGE20. TUGE Small Wind Turbines. Available online: https://www.tuge.ee (accessed on 3 March 2025).
  41. Land Monitoring Service. Available online: https://land.copernicus.eu/en/products/corine-land-cover (accessed on 3 March 2025).
  42. Duffie, J.A.; Beckman, W.A. Solar Engineering of Thermal Processes, 4th ed.; Wiley: Hoboken, NJ, USA, 2013; ISBN 9780470873663. [Google Scholar]
  43. Erbs, D.G.; Klein, S.A.; Duffie, J.A. Estimation of the Diffuse Radiation Fraction for Hourly, Daily and Monthly-Average Global Radiation. Solar Energy 1982, 28, 293–302. [Google Scholar] [CrossRef]
  44. Eurostat. Consumption of Electricity per Capita in the Household Sector. Available online: https://ec.europa.eu/eurostat/statistics-explained/index.php?title=Electricity_and_heat_statistics#General_overview (accessed on 29 March 2025).
  45. Annuk, A.; Hovi, M.; Kalder, J.; Kabanen, T.; Ilves, R.; Marss, M.; Martinkauppi, B.; Miidla, P. Methods for Increasing Shares of Self-Consumption in Small PV Solar Energy Applications. In Proceedings of the 2020 9th International Conference on Renewable Energy Research and Application (ICRERA), Glasgow, UK, 27–30 September 2020; pp. 184–187. [Google Scholar]
  46. Põder, V.; Lepa, J.; Palge, V.; Peets, T.; Annuk, A. The Estimation of Needed Capacity of a Storage System According to Load and Wind Parameters. Oil Shale 2009, 26, 283–293. [Google Scholar] [CrossRef]
  47. Khan, T.; Waseem, M.; Muqeet, H.A.; Hussain, M.M.; Yu, M.; Annuk, A. 3E Analyses of Battery-Assisted Photovoltaic-Fuel Cell Energy System: Step towards Green Community. Energy Rep. 2022, 8, 184–191. [Google Scholar] [CrossRef]
  48. Vanhoudt, D.; Geysen, D.; Claessens, B.; Leemans, F.; Jespers, L.; Van Bael, J. An Actively Controlled Residential Heat Pump: Potential on Peak Shaving and Maximization of Self-Consumption of Renewable Energy. Renew. Energy 2014, 63, 531–543. [Google Scholar] [CrossRef]
  49. Annuk, A.; Allik, A.; Prikk, P.; Uiga, J.; Tammoja, H.; Toom, K.; Olt, J. Increasing Renewable Fraction by Smoothing Consumer Power Charts in Grid-Connected Wind-Solar Hybrid Systems. Oil Shale 2013, 30, 257. [Google Scholar] [CrossRef]
  50. Kalder, J.; Allik, A.; Hõimoja, H.; Jõgi, E.; Hovi, M.; Märss, M.; Kurnitski, J.; Fadejev, J.; Lill, H.; Jasinskas, A.; et al. Optimal Wind/Solar Energy Mix for Residential Net Zero-Energy Buildings. In Proceedings of the International Scientific Conference “RURAL DEVELOPMENT 2017”, Kaunas, Lithuania, 23–24 November 2017; Aleksandras Stulginskis University: Kaunas, Lithuania, 2018. [Google Scholar] [CrossRef]
  51. Becker, S.; Frew, B.A.; Andresen, G.B.; Zeyer, T.; Schramm, S.; Greiner, M.; Jacobson, M.Z. Features of a fully renewable US electricity system: Optimized mixes of wind and solar PV and transmission grid extensions. Energy 2014, 72, 443–458. [Google Scholar] [CrossRef]
  52. Pickering, S.; Rostkowski, I.; Fodey, S.; Huebbsch, M.; Clases, Z.; Ticknor, D.; Mccalley, J.; Okullo, J.; Heath, B.; Figuerosa-Acevedo, A. Power System Resource Adequacy Evaluation under Increasing Renewables for the Midwestern US. In Proceedings of the 2019 North American Power Symposium (NAPS), Wichita, KS, USA, 13–15 October 2019. [Google Scholar] [CrossRef]
  53. Tsuchiya, H. Electricity supply largely from solar and wind resources in Japan. Renew. Energy 2012, 48, 318–325. [Google Scholar] [CrossRef]
  54. Andresen, G.B.; Rodriguez, R.A.; Becker, S.; Greiner, M. The potential for arbitrage of wind and solar surplus power in Denmark. Energy 2014, 76, 49–58. [Google Scholar] [CrossRef]
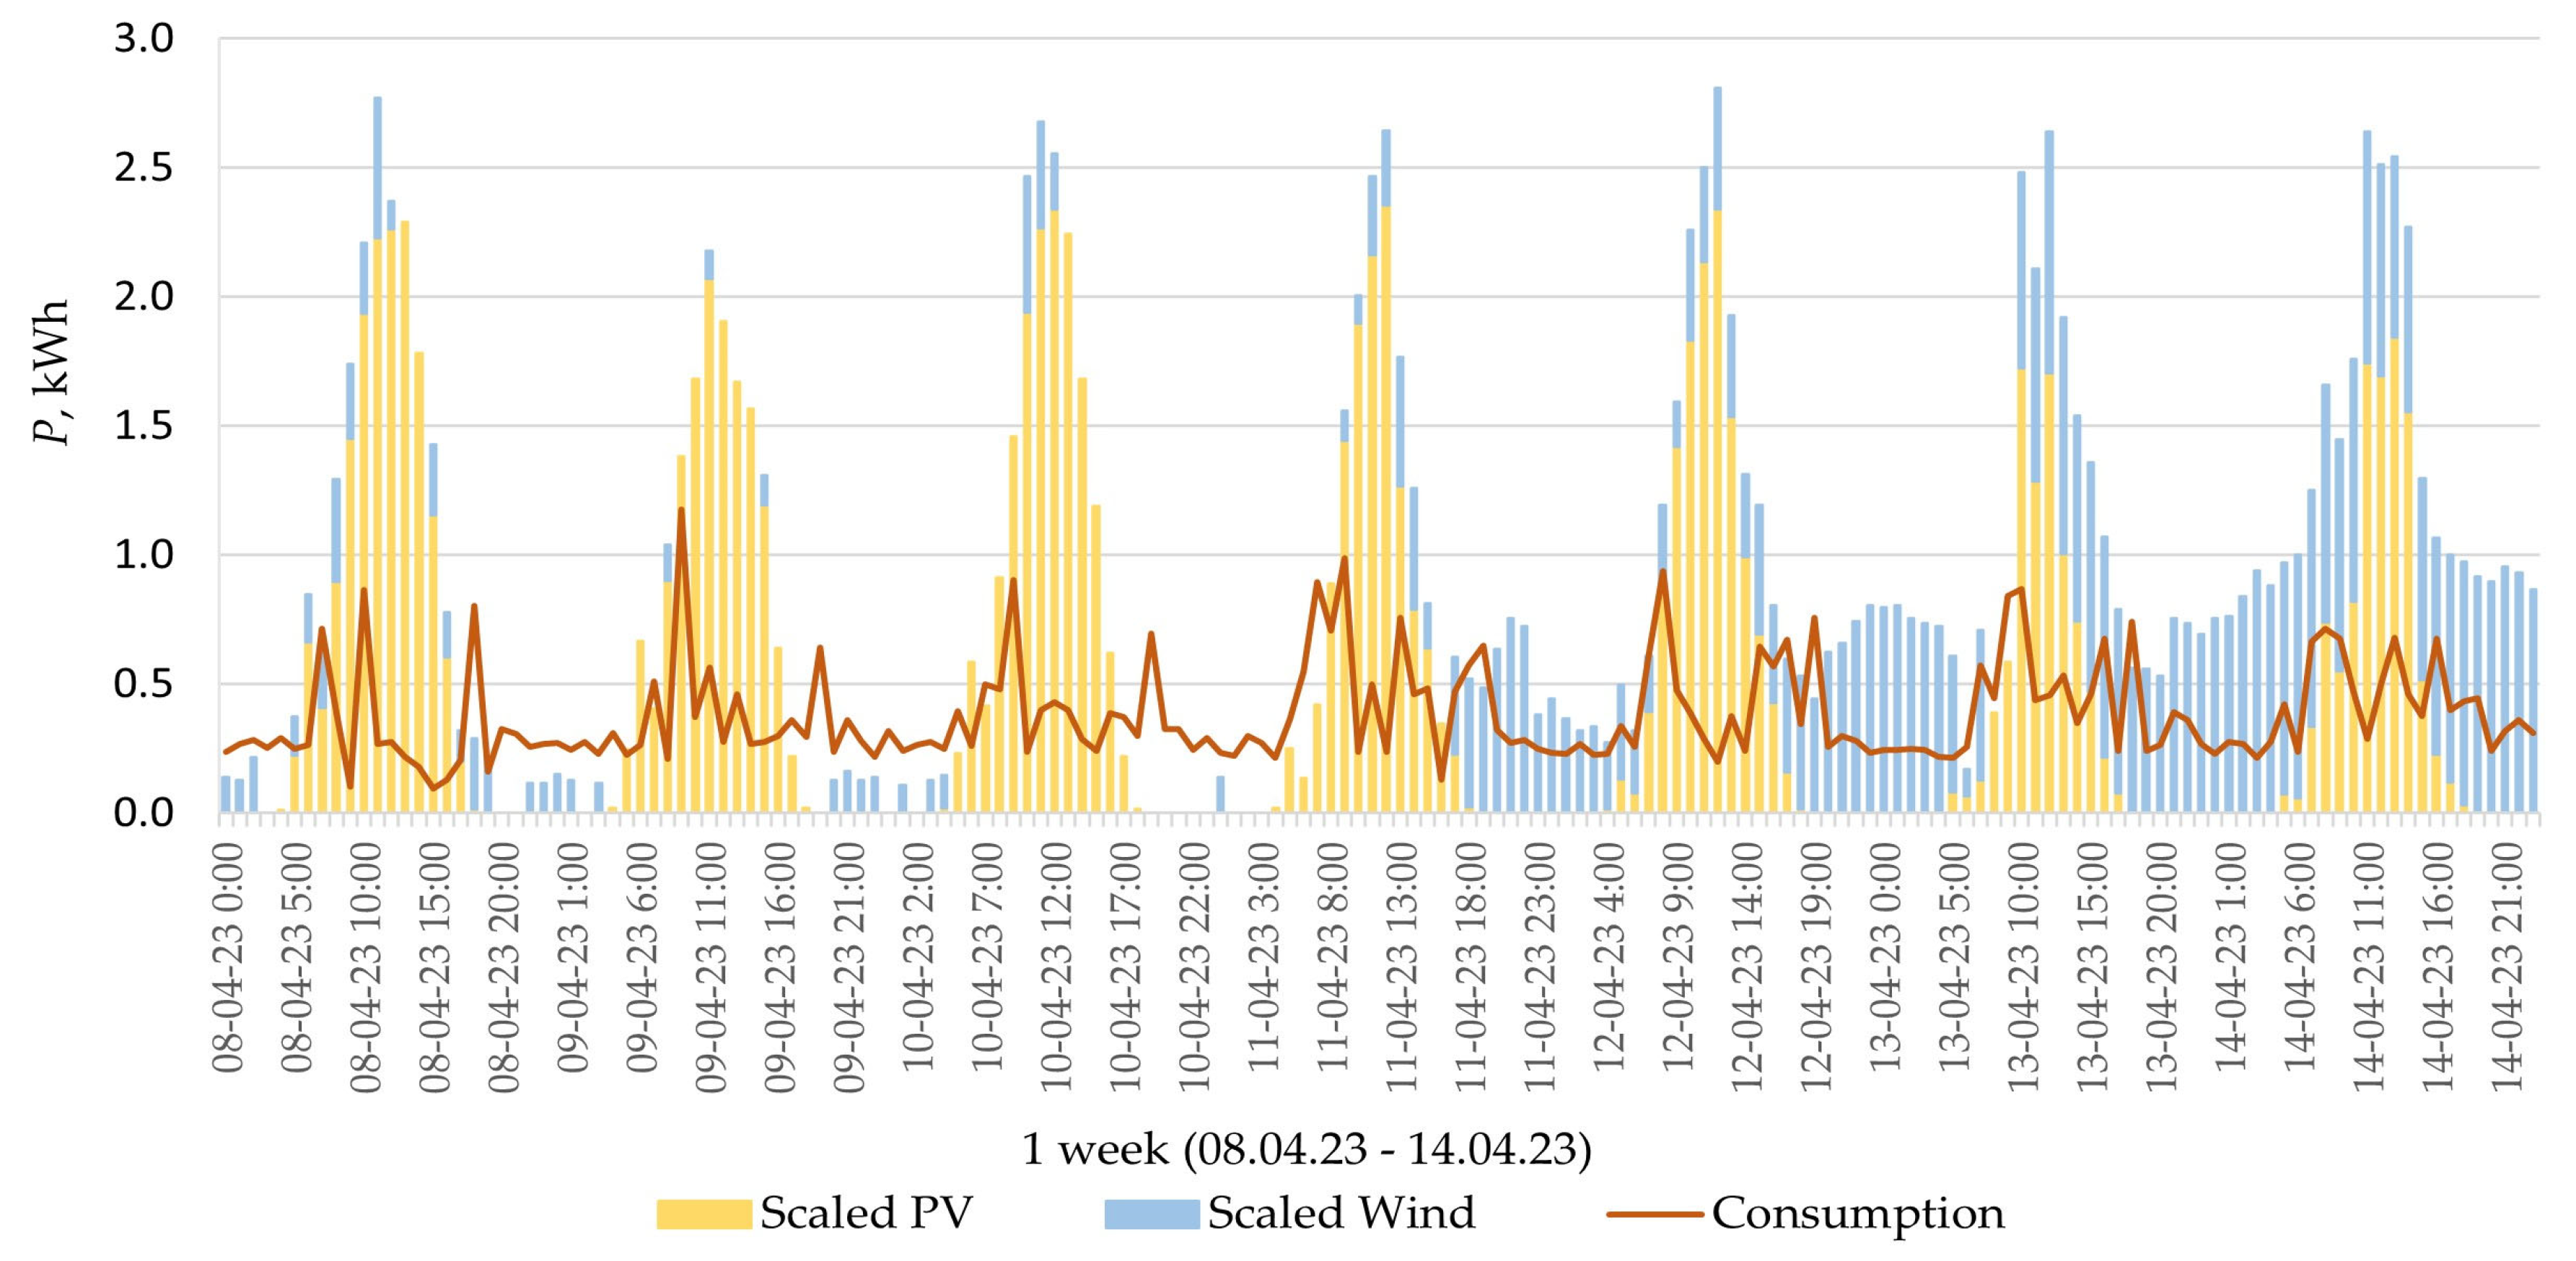
Figure 1. Production and consumption scaled profiles in one week (8 April 2023–14 April 2023).
Energies 18 01871 g001
Figure 2. The power curve of the wind generator TUGE 20 [40].
Energies 18 01871 g002
Figure 3. Dependence on a share of wind and solar PV systems for YD in 2018, 2019, and 2020.
Energies 18 01871 g003
Figure 4. Dependence on a share of wind and solar PV systems for YD in 2019 separately for winter, spring, summer, and fall.
Energies 18 01871 g004
Figure 5. Dependence from a multiplicity of production to YD in the year 2019.
Energies 18 01871 g005
Figure 6. Dependence on the capacity volumes in 2019.
Energies 18 01871 g006
Table 1. Comparison of some highly related studies.
StudyMethodologyObjectivesResults
Benato et al. [10]Integration of energy storage with PV systemsOptimize power output stabilizationVirtual power plant model improved power stability
Niu and Luo [11]Economic analysis of distributed PV systems and storageEvaluate grid adaptability and storage efficiencyOptimized framework enhanced stability and reliability
Frank et al. [35]Analysis of seasonal renewable production in GermanyStudy extreme low-power eventsIdentified increased risk of summer production deficits
Fasihi et al. [13]Green ammonia production with hybrid PV–wind systemsAssess cost competitivenessFound feasible cost levels for green ammonia by 2040
Table 2. Yearly properties of production devices.
YearCapacity
CFwind
Factors
CFPV
Vavg
m/s
Pwind
kW
PPV
kW
20230.3630.1205.137.260.66
20220.3670.1175.217.350.65
20210.3820.1165.377.650.64
20200.4880.1186.489.770.65
20190.3980.1165.537.960.64
20180.3460.1214.916.910.66
20170.3970.1115.547.950.61
20160.3720.1145.247.440.63
20150.4430.1175.968.870.64
20140.3940.1155.487.880.64
Average0.3950.1165.497.900.64
Disclaimer/Publisher’s Note: The statements, opinions and data contained in all publications are solely those of the individual author(s) and contributor(s) and not of MDPI and/or the editor(s). MDPI and/or the editor(s) disclaim responsibility for any injury to people or property resulting from any ideas, methods, instructions or products referred to in the content.