1. Introduction
Transitioning to renewable energy has gained popularity in the past two decades as a precondition for sustainable growth. Governments across the world are moving away from fossil fuels to cleaner energy sources such as wind and solar, driven by the desire to achieve growth with limited environmental damage [
1,
2,
3]. It is generally understood that fossil fuels are a major driver of climate change whose effects have not only resulted in slow growth in countries dependent on agriculture but have also disproportionately affected poor countries. Moving towards renewable energy, in this context, is considered key to mitigating the adverse effects of fossil fuels and achieving sustainable economic growth [
4]. However, while the evidence has demonstrated a positive potential impact of renewable energy consumption on green growth [
5,
6,
7,
8,
9,
10] some studies, [
11,
12] have found it either negative or statistically insignificant, making it difficult to draw firm conclusions about how the energy transition towards renewable energy could impact green growth in low income regions such as sub-Saharan Africa.
Others [
4,
13,
14,
15,
16,
17,
18,
19,
20,
21] have found the impact of renewable energy dependent on the quality of institutions and good governance, respectively. In this study, we argue that good institutions and governance play a crucial role in determining how renewable energy consumption influences green growth. Lastly, others have found the impact dependent on the level of income. Using a quantile regression approach, the observed growth effects of renewable energy are found to be positive in low and low–middle quintiles and negative for middle, high–middle and higher quantiles [
22]. They additionally reported the negative and significant impact of renewable energy on economic growth in virtually all quantiles when renewable energy was measured as a share of total consumption.
Despite the policy relevance of this discussion, there is little to no scholarly evidence regarding the impact of renewable energy on green growth in the context of sub-Saharan Africa, where sustainable economic development remains a challenge amid a rapidly growing population [
23,
24,
25,
26,
27,
28]. Much of the available evidence [
4,
13,
29,
30,
31] has focused on overall growth without specifically and explicitly addressing green growth. Currently, knowledge about how renewable energy potentially affects green growth in sub-Saharan Africa is, to a large extent, inferred and extrapolated from European studies [
5,
6,
32] which could be deemed inappropriate given the stark differences in the macroeconomic environments between the two regions. While the existing evidence [
4,
13,
29,
30,
31] provides important insights, a specific focus on green growth would provide a clearer picture of how renewable energy facilitates green and sustainable growth with a limited environmental footprint.
In view of the above gaps, the aim of this analysis is twofold. First, it examines the impact of renewable energy on green economic growth in sub-Saharan Africa. Second, in a bid to understand the specific channels, it aims to estimate the impact of renewable energy consumption on four types of environmental damage, namely carbon dioxide damage, energy depletion, mineral and net forest depletion. In pursuing these two aims, this study argues that the lack of empirical consensus requires a careful methodological approach that addresses some of the most pressing methodological caveats, particularly slope heterogeneity, endogeneity and cross-sectional dependence. It makes three primary contributions. First, it presents estimates from two estimators in which one disregards cross-sectional dependence and potential slope heterogeneity. The other estimator simultaneously accounts for slope heterogeneity, cross-sectional dependence and endogeneity. This contribution allows us to infer the extent to which ignoring these violations in the existing literature could be responsible for the contradictory findings. Accounting for slope heterogeneity is essential when estimating the impact of renewable energy consumption on green growth in sub-Saharan Africa, given the significant variability in economic, institutional, and infrastructural contexts across the region. Sub-Saharan African countries differ widely in their renewable energy resources and capacity for technological adoption, which can result in varying responses to renewable energy policies. Ignoring this heterogeneity could lead to biased estimates [
33] and the formulation of ineffective or misleading policy recommendations. Accounting for cross-sectional dependence is also critical when estimating the impact of renewable energy consumption on green growth in sub-Saharan Africa given the interconnectedness of economies in the region—through region trade and economic blocks. Failing to account for this interdependence can lead to biased estimates [
34]. This study therefore distinguishes itself from the related literature by providing methodological rigor. Unlike many previous studies which assume parameter homogeneity and fail to account for economic interdependencies between countries, this study employs an econometric approach that addresses slope heterogeneity and cross-sectional dependence, ensuring more reflective and policy-relevant findings.
Second, unlike the available literature for sub-Saharan Africa, this study focuses specifically on green growth, which refers to an increase in the gross domestic product net of pollution and environmental depletion. Focusing on green growth is important considering its potential role as a means of supporting the achievement of sustainable development goals [
35]. It has been additionally that green growth is key to not only mitigating the adverse effects of climate change and natural disasters but also holds the potential to alleviating poverty and reducing the unsustainable dependence on natural resources [
36,
37]. Third, the study simultaneously addresses the impact of renewable energy on green growth and the different types of environmental damage. This contribution is important as it offers a more holistic analysis by simultaneously examining the impact of renewable energy consumption on green growth and various forms of environmental damage. Traditional studies tend to focus either on the direct economic benefits of renewable energy or on specific types of environmental harm, such as carbon emissions. However, environmental degradation is multi-dimensional, involving forest and mineral depletion, all of which may be affected by energy transitions. By addressing these different types of environmental damage in sub-Saharan Africa, this study provides a more nuanced understanding of how renewable energy adoption can contribute to sustainable growth while addressing a broader range of environmental challenges. This comprehensive approach is crucial for the formulation of policies that promote both economic and environmental sustainability.
In summary, this study provides a novel contribution by explicitly examining green growth in the context of sub-Saharan Africa, an area largely overlooked in the existing literature. While studies on renewable energy and economic growth in the region are increasing, most, as indicated above, do not distinguish between conventional economic expansion and green growth, which accounts for both economic performance and environmental sustainability. This distinction is critical given that sub-Saharan Africa faces unique challenges, including high dependence on natural resources, energy insecurity and vulnerability to climate change. Furthermore, much of the current knowledge on green growth is extrapolated from high-income economies with vastly different institutional, infrastructural and environmental conditions, limiting its applicability to the region. By focusing specifically on green growth, this study provides a more accurate and contextually relevant analysis of how renewable energy contributes to sustainable development in sub-Saharan Africa, offering empirical insights that are essential for designing policies that balance economic progress with environmental sustainability.
From a policy perspective, linking renewable energy consumption and green growth speaks directly to a number of the United Nations Sustainable Development Goals, such as goal 7, which aims to ensure access to affordable, reliable, sustainable and modern energy for all; goal 11, which is concerned with sustainable cities and communities; goal 12, which is concerned with responsible consumption and production; and goal 13, which is concerned with taking urgent action to combat climate change and its impacts. According to the United Nations, international financial flows for clean energy in developing countries remain insufficient despite improvements in energy intensity and renewable energy growth. At the current rate, 660 million people will still lack electricity and 1.8 billion will not have access to clean cooking by 2030. To achieve universal access to energy by 2030, the United Nations is currently calling for efforts to expedite electrification efforts, boost investments in renewable energy, enhance energy efficiency and establish supportive policies and regulatory frameworks. In addition, sub-Saharan Africa is implementing the Sustainable Energy for All (SEE4ALL) goals, which seek to achieve energy efficiency, accessibility and expanding the share of renewable energy. Examining how renewable energy relates to green growth complements these efforts in the pursuit of sustainable growth and development in one of the world’s poorest regions.
This study is related to two strands of research. The first category comprises studies estimating the impact of renewable energy on either economic growth or green growth [
5,
6,
8,
29,
32]. Although some have found a negative impact, this body of literature has generally identified the positive impact of renewable energy on economic growth, albeit in the context of European countries. The second category of research comprises studies linking renewable energy consumption and environmental damage [
38,
39,
40,
41,
42]. This body of literature generally supports the notion that renewable energy mitigates environmental damage by reducing the use of fossil fuels.
The rest of the study is organized as follows.
Section 2 provides a literature review on renewable energy and economic growth.
Section 3 covers the methodology of the study. The empirical results are presented, interpreted and discussed in
Section 4. Concluding remarks, policy recommendations and areas for further study are presented in
Section 5.
2. Literature Review
Fossil fuels are responsible for more than 80% of global energy consumption [
43]. Their production and consumption are criticized for being environmentally unfriendly. It is argued, in particular, that fossil fuels and CO
2 emissions have negative environmental effects which often culminate in climate change. As a result, there is a general understanding that transitioning to renewable energy is key to unlocking green growth. A proposition raised in the literature is that renewable energy sources have a much lower carbon footprint compared to fossil fuels [
8]. By substituting fossil fuel-based energy with renewables, countries can reduce greenhouse gas emissions, which is essential for mitigating climate change. In the long run, this reduction in emissions leads to improved environmental quality, including cleaner air, better health outcomes and greater biodiversity. A healthier environment supports sustainable development, which is central to green growth. In addition, the transition to renewable energy is believed to be a driver of technological innovation capable of spurring the development of new energy-efficient technologies and green infrastructure [
29,
44,
45].
Several studies have empirically linked renewable energy consumption with economic growth. Applying a linear regression approach, renewable energy is found to positively drive economic growth in the European Union through facilitating technological creation, the creation of green jobs, infrastructure development and a reduction in environmental damage [
7]. Similarly, evidence from 45 African countries and the generalized method of moments (GMM) approach, show positive effects of renewable energy consumption on carbon footprints, natural resource depletion and economic growth [
46]. This positive relationship between renewable energy consumption is, however, challenged in some studies [
11]. For instance, in the context of the Gulf Cooperation Council (GCC) countries between 2001 and 2019, evidence shows a negative and significant impact of global renewable energy consumption and economic growth [
7]. This negative effect is similarly corroborated by several other studies in literature [
12,
22].
Efforts to explain the contradictory evidence have generated research incorporating the moderating role of institutions and good governance. Some studies argue that the impact of renewable energy is not independent and depends on the quality of institutions and good governance [
4,
15,
16,
17,
19,
20,
21,
47]. This body of literature generally agrees that institutional quality and good governance matter as moderating factors [
48,
49].
Studies specific to sub-Saharan Africa have mostly focused on economic growth rather than green growth [
4,
10,
13,
31,
50,
51] in exception of a few studies [
52]. The positive impact of renewable energy on economic growth is generally confirmed. Partly driven by the desire to explain this negative effect, the moderating role of foreign direct investment has been considered [
53]. Despite an estimation approach that differs with some of the notable studies [
52], the evidence largely agrees with the negative linear relationship observed in literature.
It is also clear from the literature that studies specifically addressing green growth in sub-Saharan are scarce at best. The majority of the existing evidence is drawn from European and Asian experiences [
32,
54,
55,
56,
57,
58,
59]. The underrepresentation of sub-Saharan experiences in this literature is hard to justify given the availability of data on renewable energy, indicators of CO
2 emissions and other measures of environmental degradation in most of the countries. The pursuit of a green energy transition and sustainable development in the region raises an urgent question for researchers, concerning how renewable energy consumption influences economic growth. In addition, while previous studies on the renewable energy–growth nexus primarily focus on economic growth, this study differentiates itself by explicitly examining green growth, which integrates both economic expansion and environmental sustainability. Much of the existing literature identifies the positive impact of renewable energy on economic growth but often relies on methodologies that assume parameter homogeneity and disregard cross-sectional dependence, potentially leading to biased estimates [
5,
6]. In contrast, this study employs an econometric approach that explicitly accounts for slope heterogeneity and cross-sectional dependence, addressing key methodological shortcomings. Moreover, while prior research often draws inferences from developed economies where energy infrastructure, institutional capacity and environmental policies differ significantly from those in sub-Saharan Africa, this study provides region-specific evidence that challenges widely held assumptions about the direct impact of renewable energy on green growth. By refining both the conceptual and empirical approach, this study offers a more robust and policy-relevant analysis tailored to the unique economic and environmental conditions of sub-Saharan Africa.
3. Methodology
The analysis uses a panel dataset comprising 22 sub-Saharan countries observed annually from 1990 to 2019. Although the data could stretch to 2023, the analysis deliberately discarded data from 2020 to 2023 as most variables were disrupted by COVID-19. The COVID-19 pandemic caused significant economic contractions, unusual energy consumption, and disruptions in supply chains. These anomalies are problematic on two grounds. First, they represent a state of disequilibrium and therefore do not reflect long-term trends in renewable energy consumption and green growth in the region. Second, they invite problems associated with outliers such as bias and heteroscedasticity, which ultimately distort the efficiency of estimates and compromise statistical inference. Compared to cross-sectional and time series datasets, a panel dataset allows the controlling of unobserved heterogeneity specific to each country [
60]. The pooling of cross-sectional countries over time additionally brings rich variation and more degrees of freedom, which both facilitate efficient estimation [
61]. The 22 countries and sampling period were selected based on data availability. Green growth is defined as an annual change in the real Green Gross Domestic Product (GGDP) net of energy depletion (ED), mineral depletion (MD), net forest depletion (NFD) and carbon dioxide damage (NFD) in current values. The current GGDP is measured as
This is subsequently deflated using each country’s real GDP deflator to produce Real Green Domestic Product (RGGDP). Green growth (GG) is then measured as
The variable of interest is renewable energy consumption (as a % of total energy consumption). With regard to other explanatory variables, the literature suggests a wide array of determinants of growth ranging from human and physical capital [
62], the quality of institutions, government consumption, the real exchange rate [
63,
64], trade openness [
65], financial development [
1,
47,
66,
67,
68,
69,
70,
71,
72], religion [
73], geography [
74], natural disasters [
75], population growth [
64] and technological progress [
76] among others. In this study, the analysis only considers some of the key variables whose data are consistently available across the 22 countries. These variables include trade (as a % of GDP), included to control for external developments; general government consumption (as a % of GDP) to identify each country’s fiscal stance; and gross capital formation (as a % of GDP), capturing infrastructural developments. To mitigate the potential omitted variable bias, efforts were made during the estimation strategy to account for endogeneity. Data on all variables are sourced from the World Bank’s World Development Indicators (WDI).
Methodologically, the analysis emphasizes the importance of cross-sectional dependence, slope heterogeneity and idiosyncratic endogeneity. Sub-Saharan countries have become more dependent on each other in recent years owing to AFCTA and several other economic blocks. Ignoring this potential dependence could lead to endogeneity and parameter inconsistency if the unobserved common factors are correlated with renewable energy consumption [
77]. As the baseline estimator, this study used the mean group dynamic common correlated effects (MG-DCCE) approach. The selection of the MG-DCCE estimator over alternative econometric approaches, such as system GMM or panel fixed effects, is driven by key methodological concerns inherent in panel data analysis for sub-Saharan Africa. First, as alluded to above, many existing studies on the renewable energy–growth nexus employ system GMM, which, while effective in addressing endogeneity, assumes parameter homogeneity and cross-sectional independence—assumptions that are particularly restrictive in the context of sub-Saharan Africa, where economies exhibit substantial heterogeneity in terms of institutional quality, infrastructure and policy frameworks. Given this heterogeneity, an approach that allows for slope heterogeneity is essential to capture the differential impacts of renewable energy on green growth across countries. Second, cross-sectional dependence is a critical issue due to economic interdependencies, shared environmental policies and regional energy trade agreements, which, if ignored, can lead to biased and inconsistent estimates. When cross-sectional dependence is present in the residuals, instrumental variable regressions are inconsistent [
77,
78,
79], including the generalized method of moments (GMM) [
80,
81].
The MG-DCCE estimator explicitly accounts for both slope heterogeneity and cross-sectional dependence, providing more robust and contextually relevant estimates. Third, this study prioritizes methodological rigor by addressing endogeneity concerns through instrumental variable estimation within the MG-DCCE framework, ensuring that the estimated effects reflect causal relationships rather than spurious correlations. The are two types of cross-sectional dependence, namely weak and strong cross-sectional dependence [
82]. The error term is weakly cross-sectionally dependent if
where
, is a heterogeneous factor loading associated with the unobserved common factor captured in the residual. The residuals are strongly cross-sectionally dependent if
Cross-sectional independence occurs when
. It is argued that cross-sectional independence is a restrictive assumption as some degree of cross-dependence will likely exist and that it is strong cross-sectional dependence that is problematic [
34]. Thus, a test for weak cross-sectional dependence has been in proposed against the alternative hypothesis of strong cross-sectional dependence. The test statistics of this test are given by
where
is the correlation coefficient. For robustness purposes, the analysis also considered an cross-sectional dependence test [
83]. It was necessary to conduct cross-sectional dependence tests as they help in the selection of a more appropriate estimation approach. The selection of a more appropriate estimation approach in turn helps to facilitate the estimation of reliable results. Using the xtcd2 and xtcd commands in Stata 17, respectively, the results showed evidence of strong cross-sectional dependence, making all estimators (the difference and system GMM, the fixed and random effects, the panel dynamic ordinary least squares, the panel fully modified ordinary least squares, etc.) that assume inappropriate cross-sectional independence.
In the second step, the analysis tested for panel units as T was large enough to raise concerns of non-stationarity. Panel unit root tests are categorized into two groups namely first-generation tests which ignore cross-sectional dependence and the second-generation tests which account for cross-sectional dependence. Given the existence of cross-sectional dependence in the present case, the analysis used the Cross-sectional Im, Pesaran and Shin (CIPS) test for unit roots in heterogeneous panels which is robust in terms of cross-section dependence [
84]. As the results will show in
Section 4, some variables, including the dependent variable, were integrated into order zero, thus eliminating the need to test for cointegration.
Next, the analysis tested for slope homogeneity as it may be too restrictive and potentially misleading to assume slope homogeneity, given the heterogenous macroeconomic environments characterizing sub-Saharan countries and the stark differences in regulatory practices across the region. In line with this concern, it has been argued that incorrectly ignoring slope heterogeneity can produce results that are biased [
85]. Testing for slope homogeneity is therefore imperative prior to choosing the appropriate model specification [
86]. One way of testing the slope homogeneity assumption is to use an F-test on the difference in the sum of squared residuals from an ordinary least squares regression and a cross-section unit specific ordinary least squares regression [
87]. The main limitation of the latter is the assumption of a homoscedastic error variance, which is often violated in panel data regressions [
86]. Given this background, this study uses a test for slope homogeneity which allows for a heterogeneous variance and is implemented using the xthst Stata command [
33,
86]. The test statistics are given by
which is asymptotically
under the null hypothesis of slope homogeneity. For robustness purposes, the analysis additionally considers a heteroscedasticity and autocorrelation consistent (HAC) extension [
88]. This test is given as
where
is the OLS estimator for each cross-sectional unit from the regression specification
, and null hypothesis that
, for some
against the alternative
, for some
and
. Both tests find strong evidence of slope heterogeneity. This ruled out all estimators that assume slope heterogeneity, such as the difference and system GMM.
Based on preliminary diagnostic tests, it was necessary to consider panel estimation approaches that allow slope heterogeneity. Generally, two approaches are used in the literature, and these are the seemingly unrelated regression (SURE) and the mean group estimators. When N is moderate to large, as is the case here, i.e., N = 22, the SURE approach is not feasible [
89]. Therefore, given the additional need to address cross-sectional dependence, the analysis used the MG version of the dynamic common correlated effects (DCCE) estimator which is robust to contemporaneous correlation [
90]. The DCCE was preferred over the static common correlated effects (CCE) since it is now well established that growth is a dynamic process. The CCE would be inconsistent if the dependent variable was a dynamic process [
77,
89,
91]. The DCCE builds on the following specification:
where
is the dependent variable and
is a vector of independent variables, including renewable energy consumption. The presence of the lagged dependent variable makes the estimator inconsistent. To correct this, it has been demonstrated that the estimator recovers consistency if the basis of the
lags of the cross-sectional averages are included for both the dependent variable and the exogenous independent variables [
89]. Denoting the number of lags by
, the equation to be estimated becomes
where
is green growth and
is a vector comprising independent variables. Note that
. If we stack
and
into
,
, then the MG coefficients are given as
Since we have small to moderate panel, the analysis applies the recommendation proposed in literature of using the “half-panel” jackknife bias-correction method [
89].
where
is the MG coefficient of the first half of the panel and
of the second half of the panel. Regarding implementation, the DCCE approach was estimated using the dcce2 Stata command [
90]. In summary, this command obtains MG coefficients in two steps. First, the estimates of each
are estimated separately to account for slope heterogeneity. In the second step, the unit-specific coefficients are averaged across all cross-sectional units. The approach purges cross-sectional dependence by including cross-sectional averages and lags [
89,
91]. The test produces a post estimation test for weak cross-sectional dependence in the residuals in a bid to determine whether the included cross-sectional averages sufficiently eliminate strong cross-sectional dependence. More importantly, the approach supports the use of instrumental variables to account for endogeneity. Endogeneity was considered given the difficulty of controlling all factors that jointly affect renewable energy and green growth. Ignoring this potential endogeneity could invite a small sample bias that does not completely disappear in large sample sizes. In reaction to this concern, renewable energy consumption was instrumented by its own lag in a separation estimation for robustness purposes.
Theoretically, an increase in renewable energy consumption reduces dependence on non-renewable energy sources, which are typically associated with high levels of environmental degradation, including carbon emissions, air pollution and resource depletion. Therefore, renewable energy consumption is expected to have a positive effect on green economic growth by enabling countries to meet their energy needs without compromising environmental sustainability. Trade openness can stimulate green economic growth in two primary ways. First, by promoting the diffusion of green technologies and environmentally friendly practices, trade allows countries to adopt cleaner technologies from abroad, enhancing productivity while reducing environmental damage. Second, trade can lead to specialization, allowing countries to focus on industries in which they have a comparative advantage, potentially lowering their environmental footprint if those industries are less resource intensive. However, there is also the risk that increased trade could lead to greater environmental degradation, particularly in developing countries where industries might prioritize economic growth over environmental concerns.
General government consumption is a proxy for state interventions. In the context of green economic growth, government interventions can play a dual role. On one hand, if government spending is directed toward sustainable development initiatives, such as investment in clean energy infrastructure, environmental protection and public transportation, it can directly foster green economic growth. On the other hand, if government consumption is geared toward inefficient or unsustainable practices, such as subsidies for fossil fuels or high-emission industries, it could have a negative impact on green economic growth. Lastly, from a green growth perspective, gross capital formation can have negative or positive effects on green growth. If channeled into green industries—such as renewable energy, energy-efficient technologies and sustainable agriculture— gross capital formation can contribute significantly to green economic growth by improving productivity while minimizing environmental damage. However, if capital is directed toward polluting industries or infrastructure that exacerbates environmental degradation, the impact on green growth could be negative.
In the penultimate section of this study, this analysis links renewable energy consumption with the four forms of environmental degradation, namely carbon dioxide damage, energy depletion, mineral and net forest depletion. As renewables replace fossil fuels, which are the primary source of CO2 emissions, an increase in renewable energy consumption should result in a reduction in emissions. This relationship aligns with the broader goal of mitigating climate change through cleaner energy sources. For mineral depletion, the effect of renewable energy consumption is less direct but still largely negative. Renewable energy technologies, particularly solar and wind, require less mineral extraction compared to fossil fuel-based energy sources, which deplete non-renewable resources at a faster rate. As renewable energy consumption grows, the demand for minerals like coal, oil, and natural gas should decline, reducing mineral depletion over time.
Regarding energy depletion, renewable energy consumption is expected to have a similarly negative relationship. The transition to renewable sources reduces reliance on finite fossil fuels, thus mitigating the depletion of non-renewable energy resources. While the extraction of resources for renewable technologies (e.g., for wind turbines or solar panels) still requires materials, the overall effect of increasing renewable energy consumption should be a decrease in the depletion of non-renewable energy resources. Finally, net forest depletion may see a mixed or slightly negative relationship with renewable energy consumption. While renewable energy sources themselves have minimal impact on forests, the production of biomass for energy can sometimes lead to deforestation. However, if renewable energy policies prioritize wind-, solar- and hydropower, forest depletion should decrease as fossil fuel consumption declines, leading to less land-use change and destruction associated with traditional energy extraction.
4. Results and Discussion
Table 1 presents descriptive statistics. Green growth averaged −0.1% annually between 1990 and 2019, ranging from −6.6% to 1.8%. This is concerning in regards to the 22 sub-Saharan countries, as it suggests that the region has not achieved sustainable growth in the past three decades and that sustainable growth has, in fact, been shrinking annually on averaged since 1990. The largest annual decline was for Rwanda in 1994, possibly reflecting the disruptive effects of the genocide. The highest annual growth was for Chad in 2003. Renewable energy consumption averaged 74% of total energy consumption, which is encouraging from the perspective of clean energy adoption. The standard deviation, however, shows high variability in the average share of renewable energy use. The least consumption of renewable energy, 8.9%, was for Mauritius in 2018. Mauritius is in fact one of the lowest consumers of renewable energy as its share averaged on 22% during the sampling period. This descriptive statistic is consistent with Mauritius’ overreliance on fossil fuels. The highest share of 96% was for Burundi in 2004. Between 1990 and 2019, the share of renewable energy consumption averaged 93%.
Table 2 presents the correlation matrix. The intention is to measure the degree of multicollinearity which, if too high, could make it difficult to parse out the individual effects of the collinear variables [
92]. In addition, high collinearity among the independent variables inflates the standard errors of the regression coefficients, which consequently distorts statistical inference, making it harder to detect the true relationship between the independent and dependent variables [
93]. As
Table 2 shows, all the correlation coefficients are small to moderate, dismissing concerns of high collinearity among the independent variables.
Table 3 presents the cross-sectional dependence test results. Evidently, both tests return test statistics whose probability values are less than 1% for all variables, including the residual. The results, therefore, show evidence of strong cross-sectional dependence.
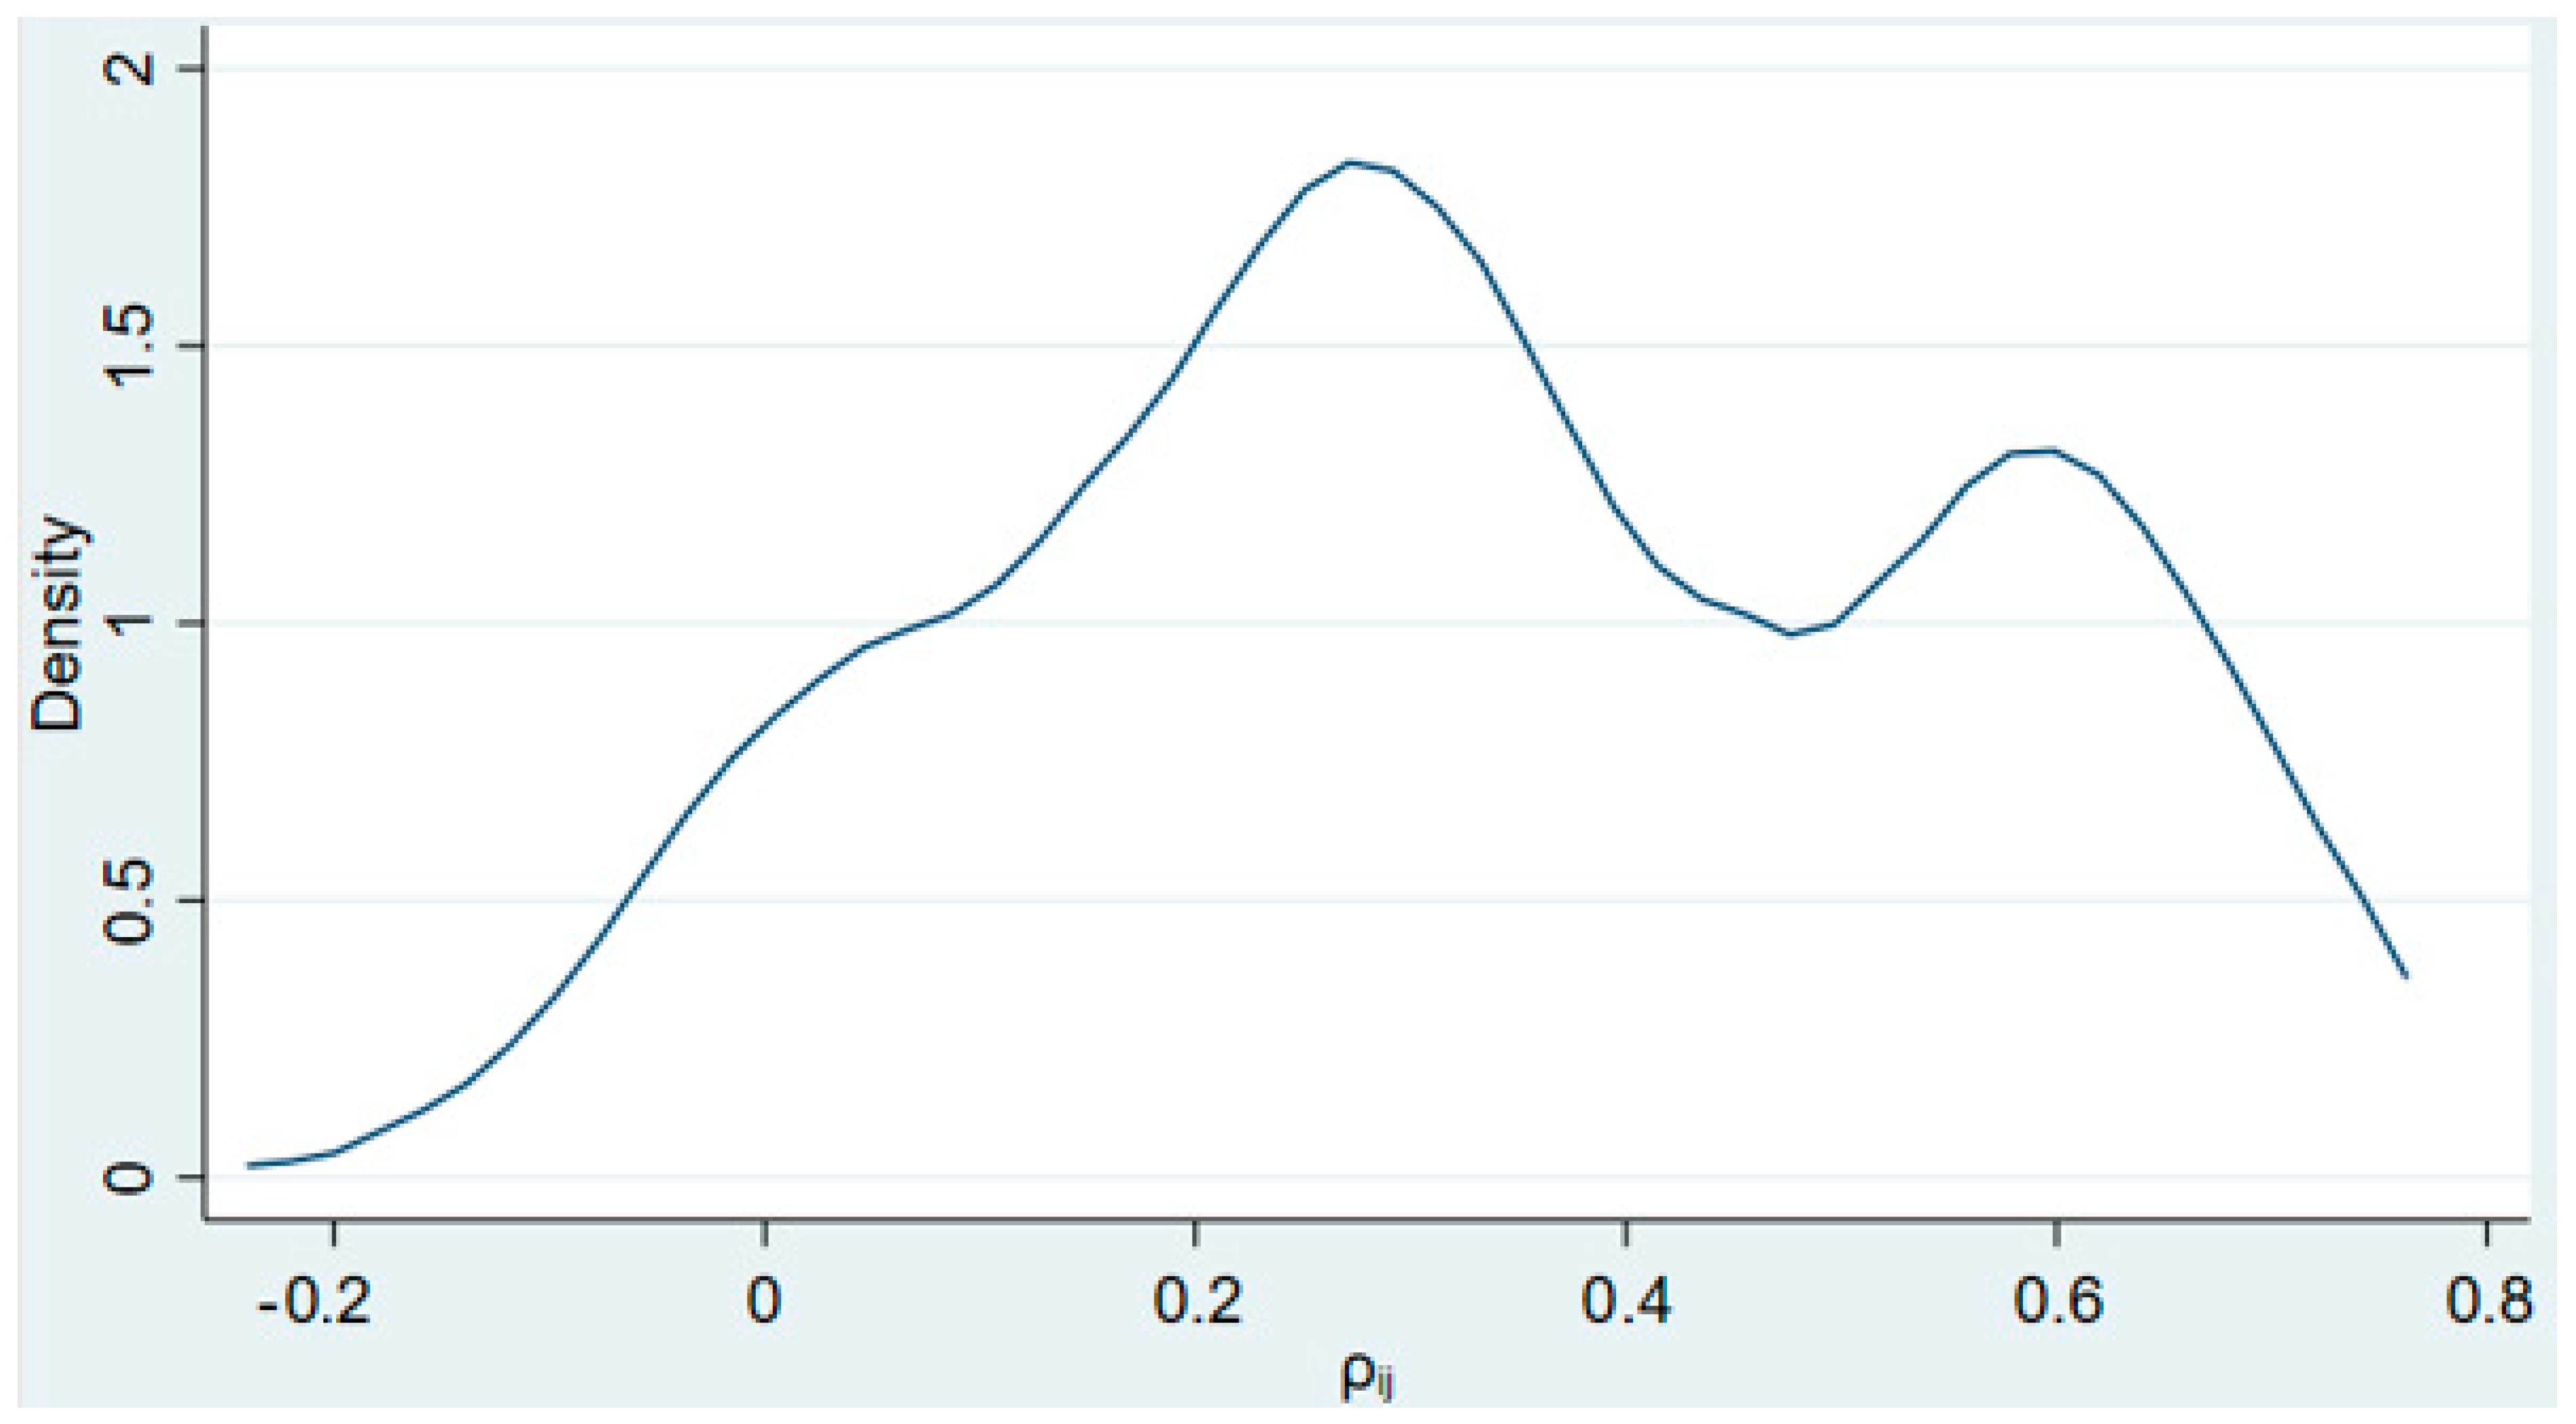
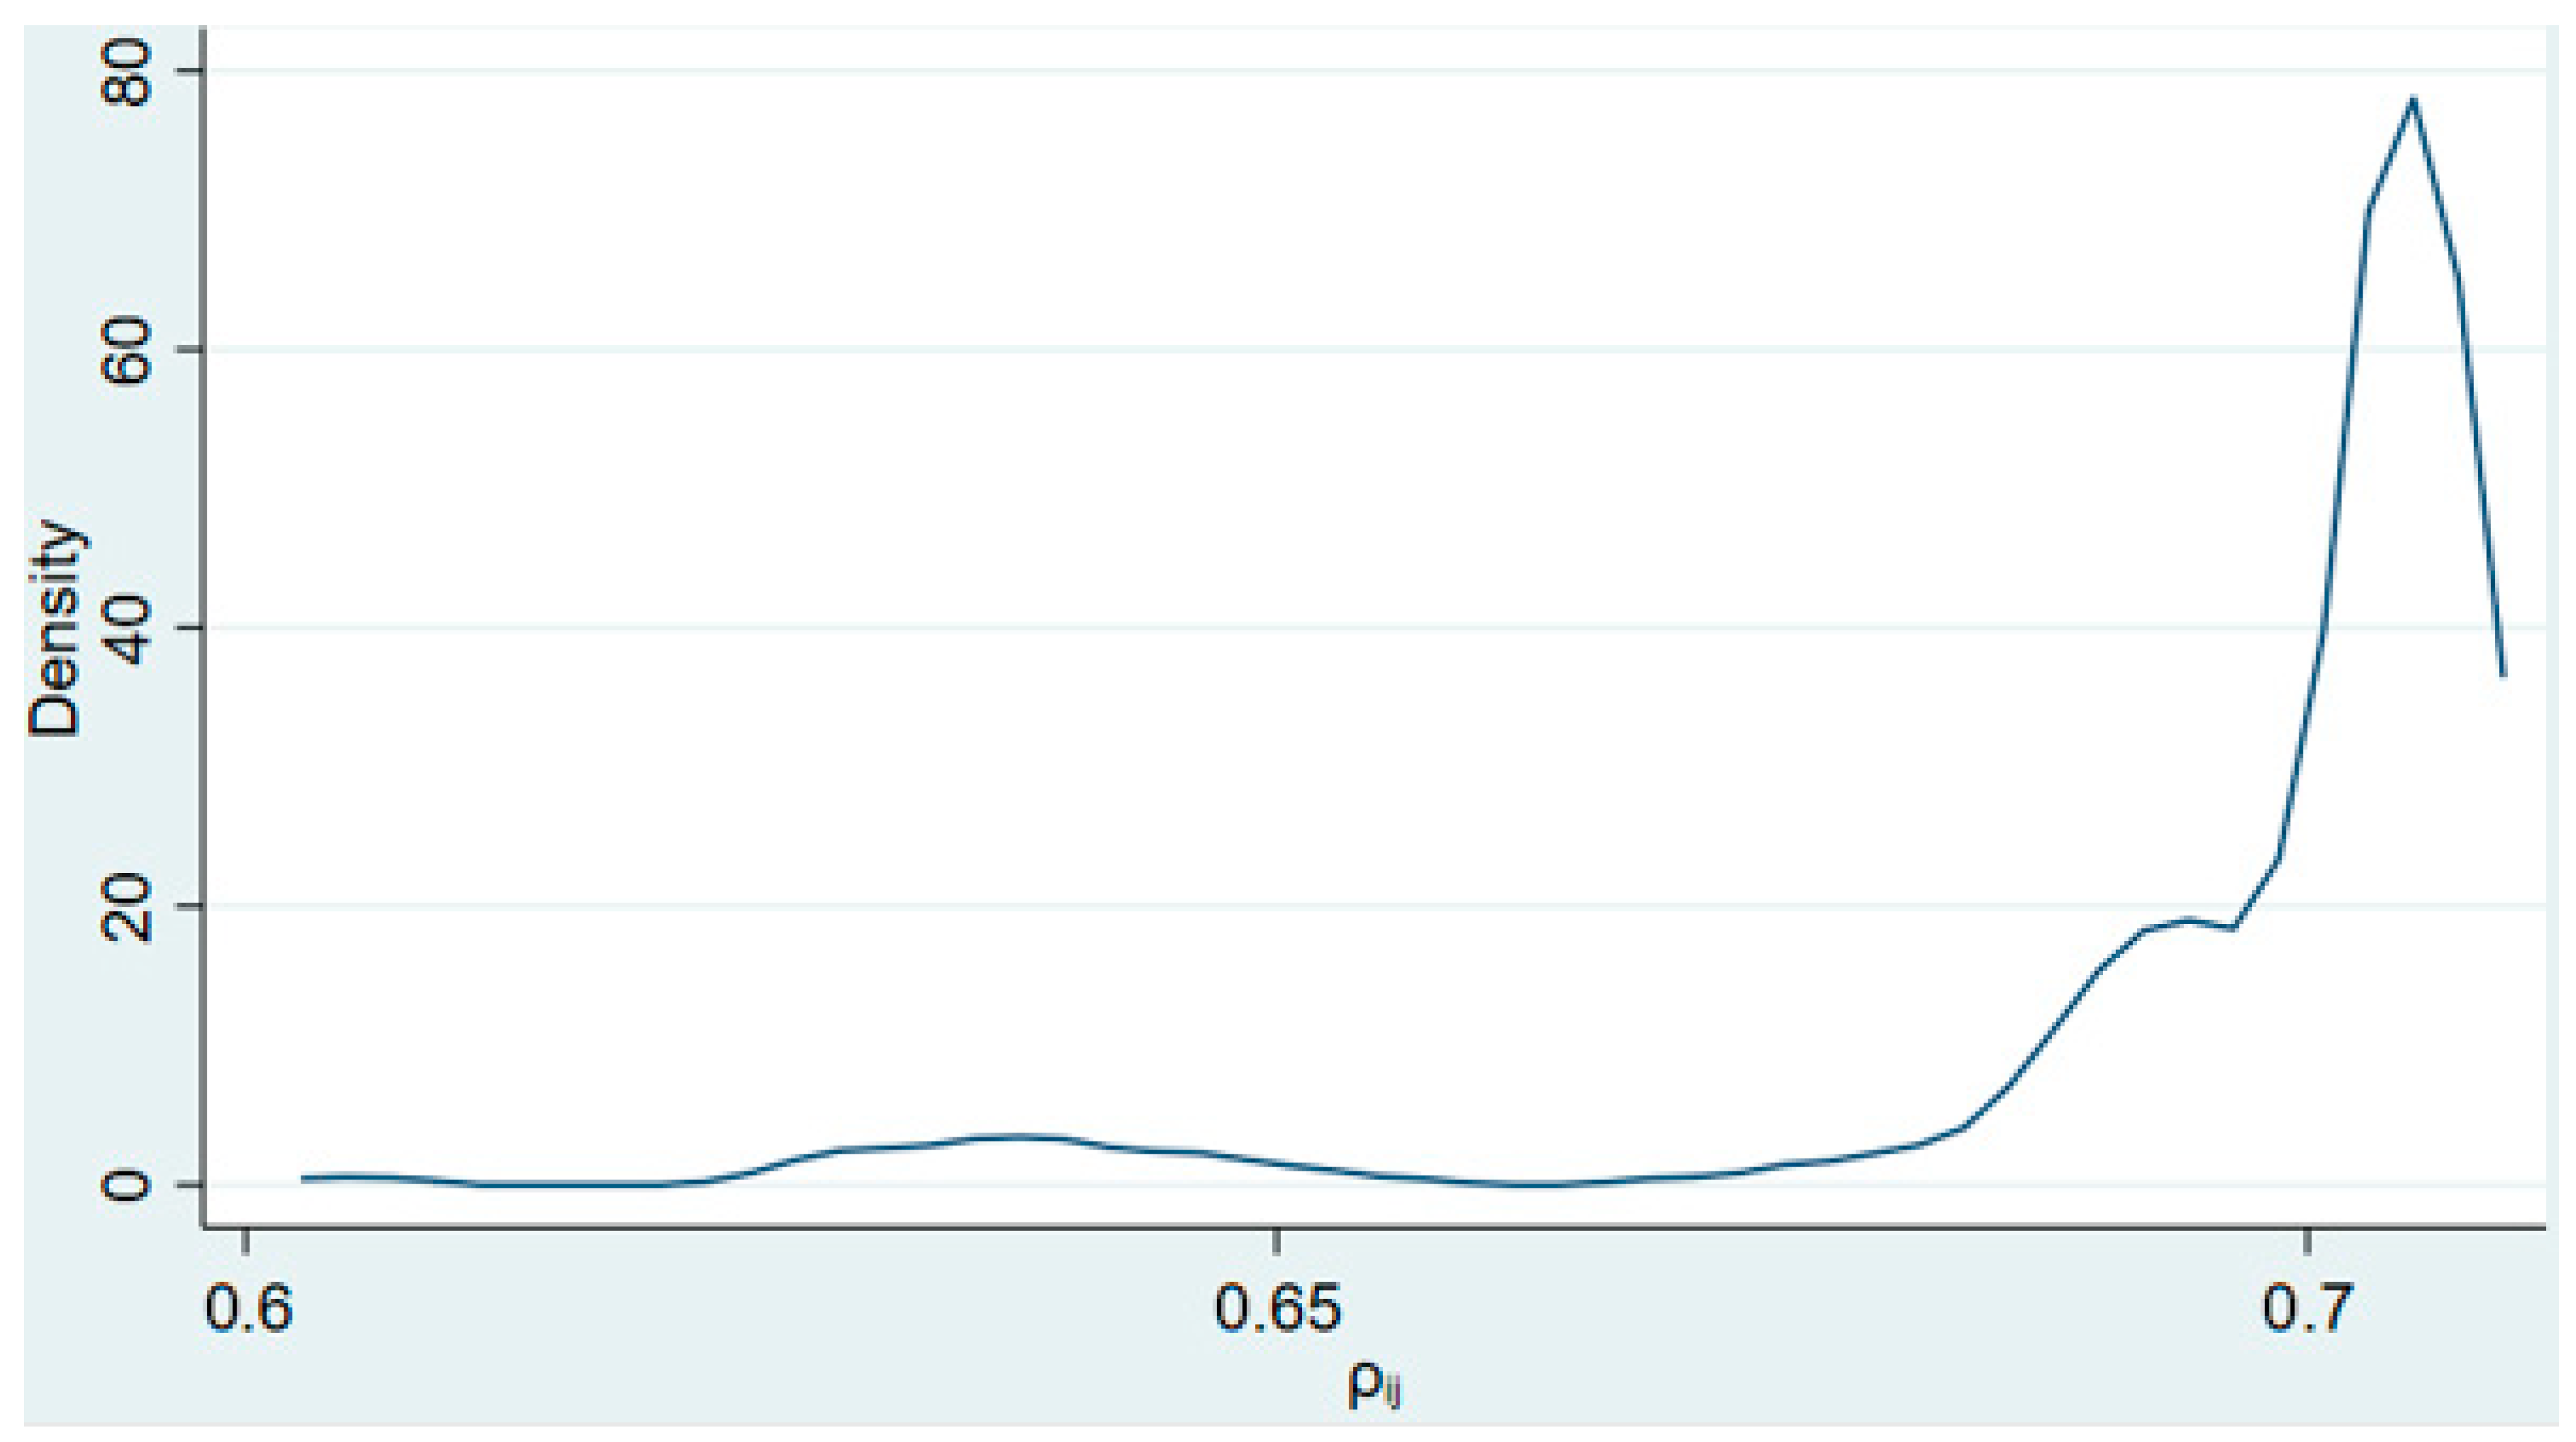
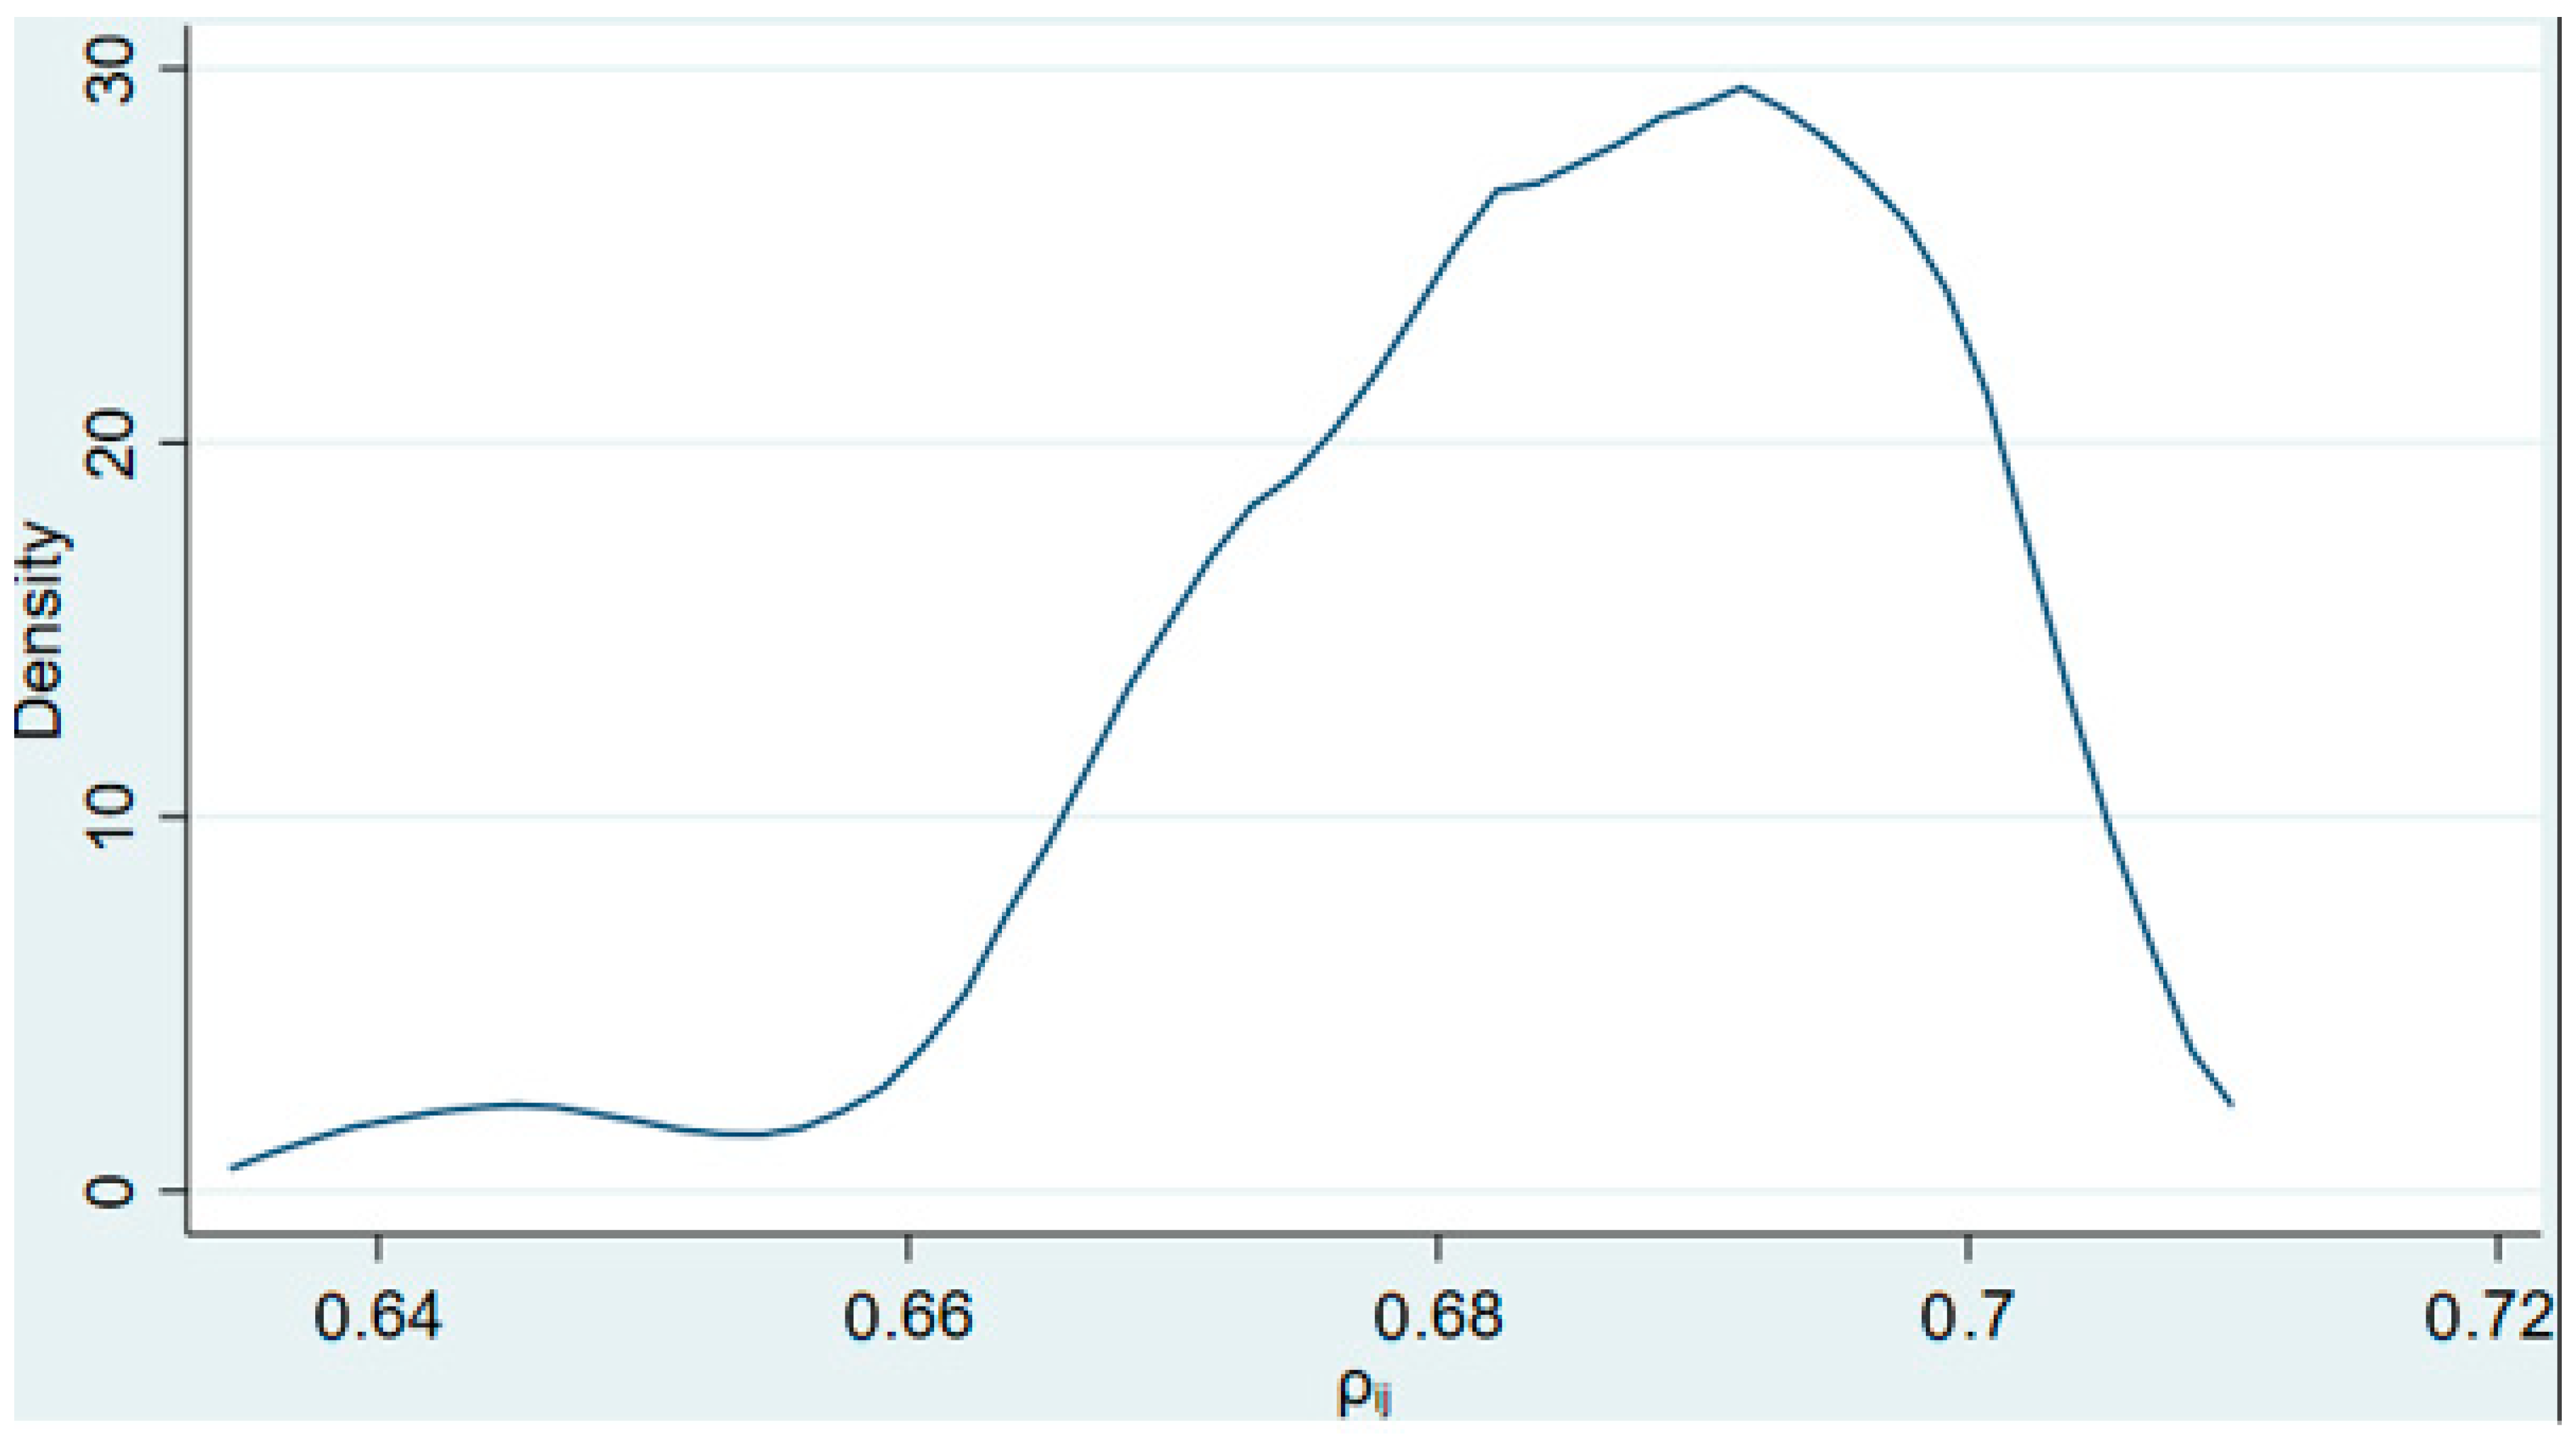
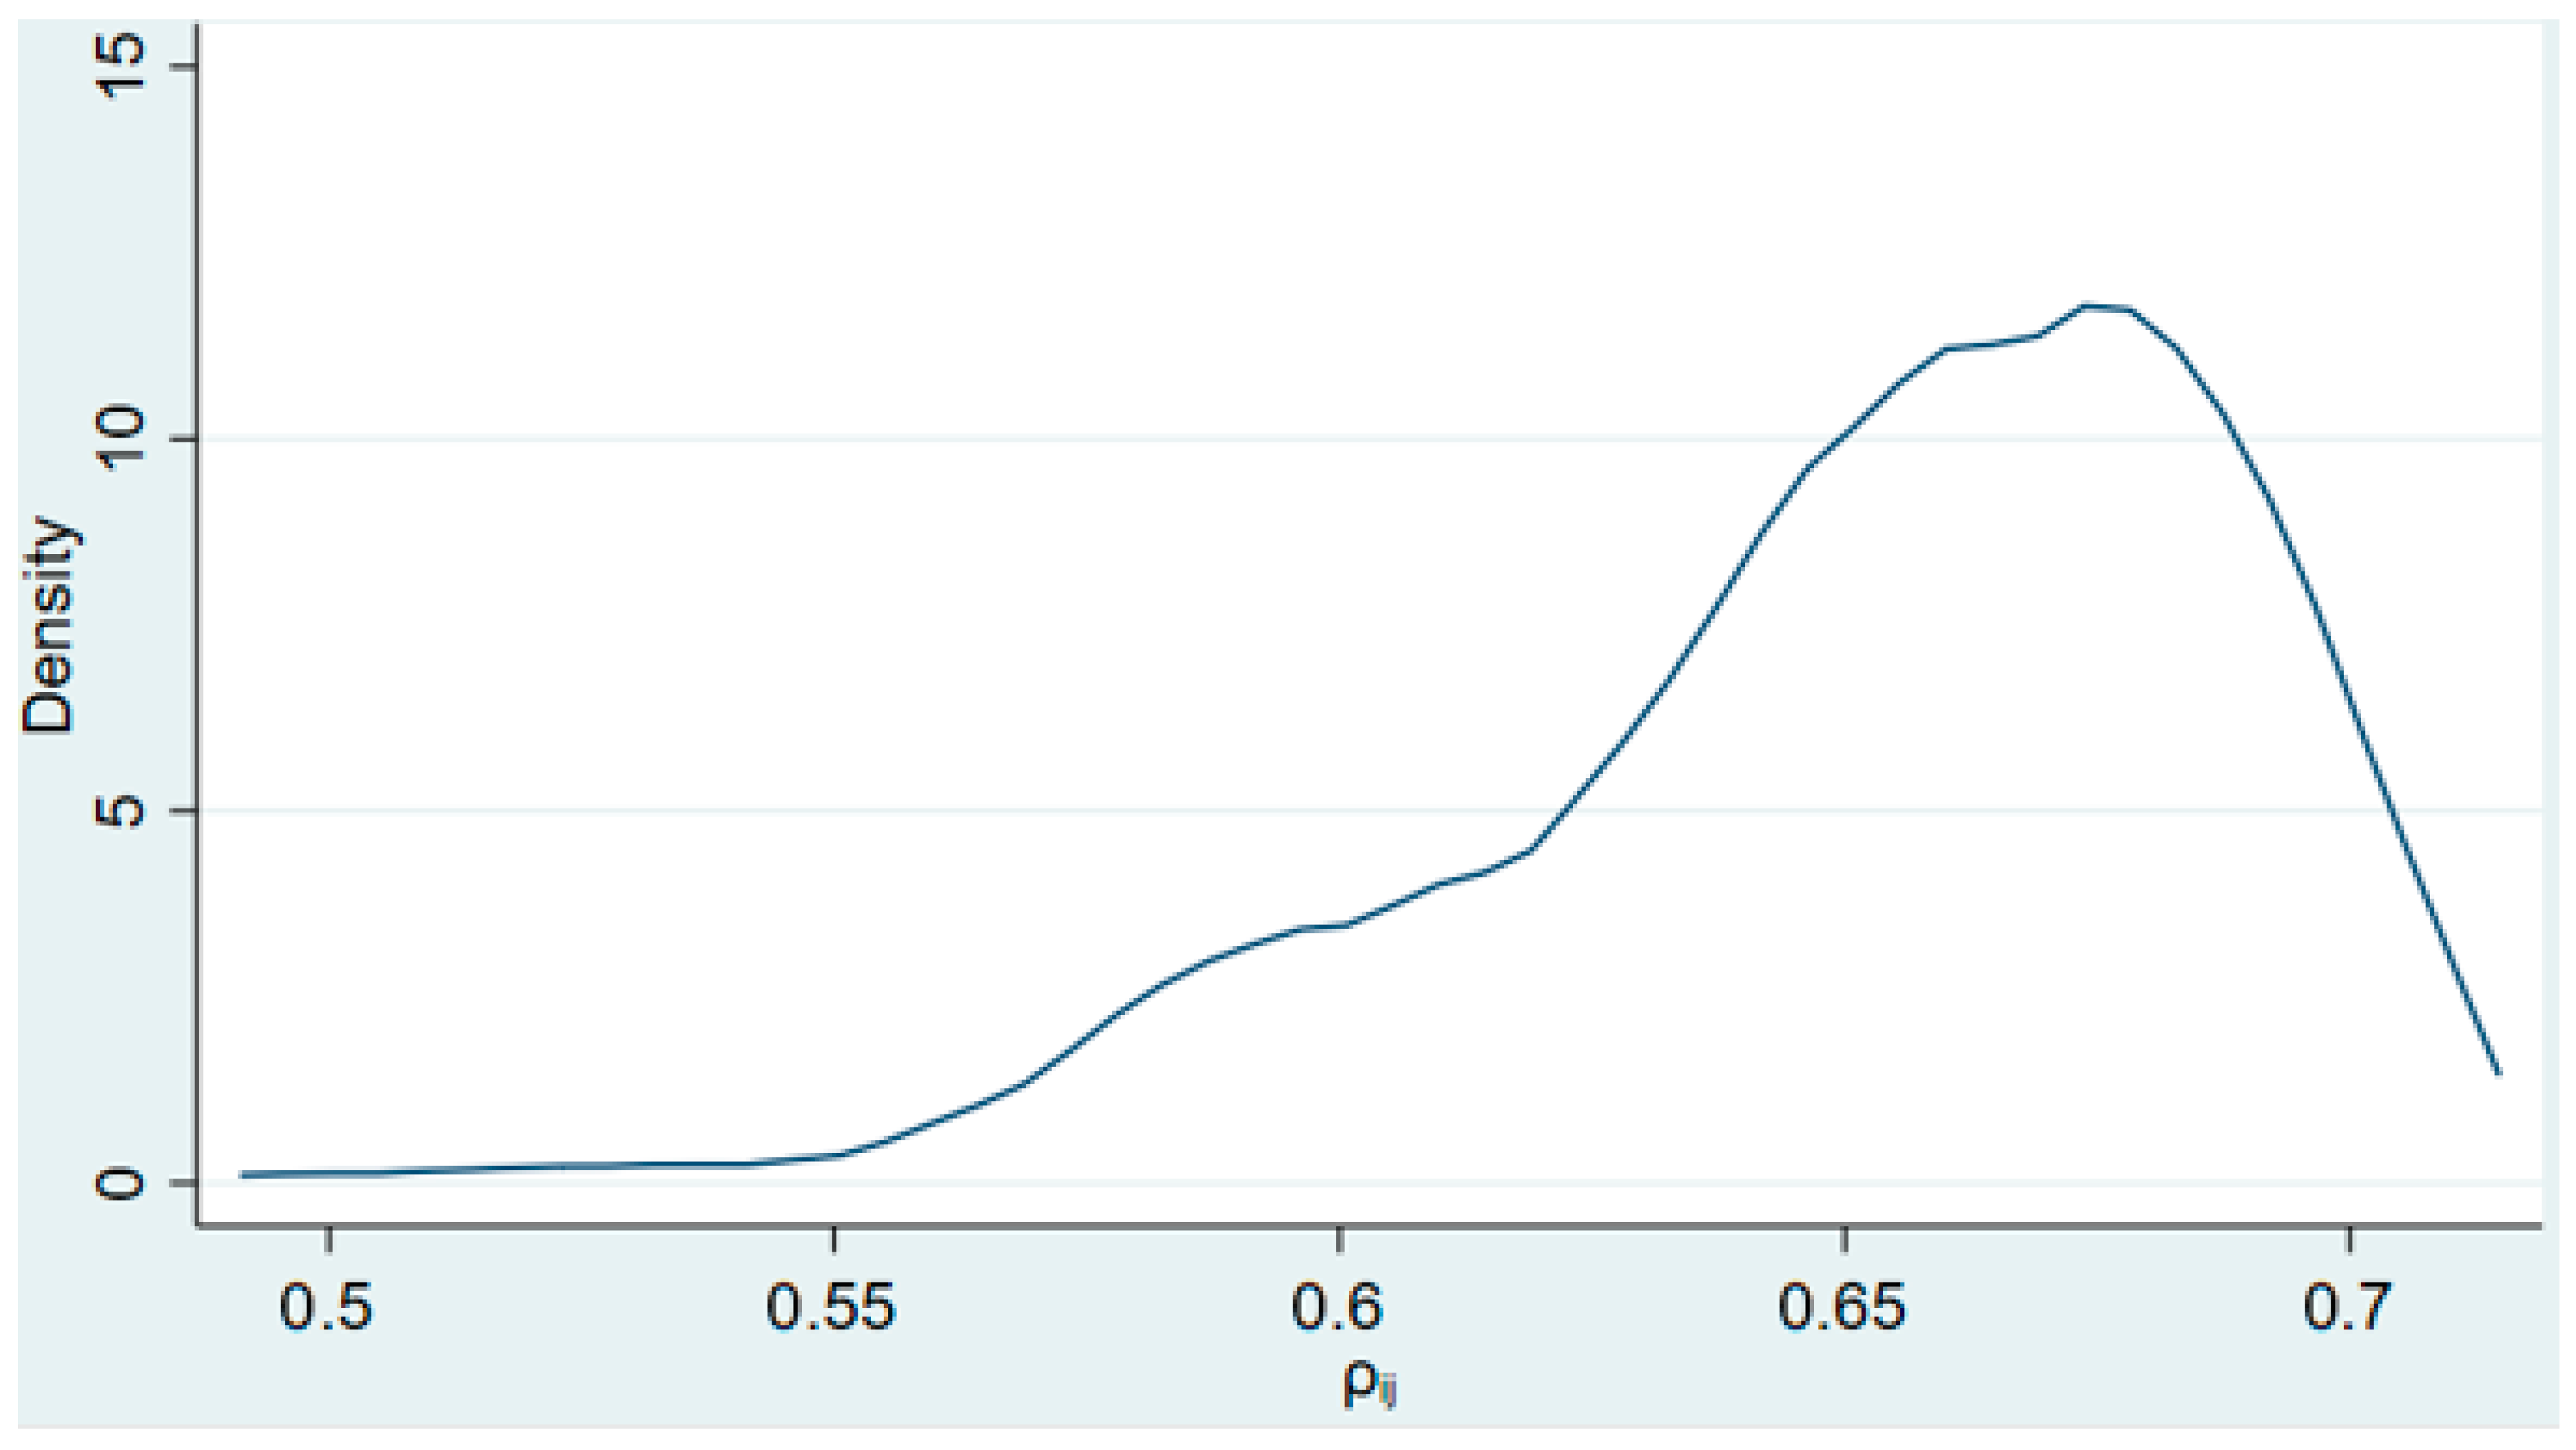
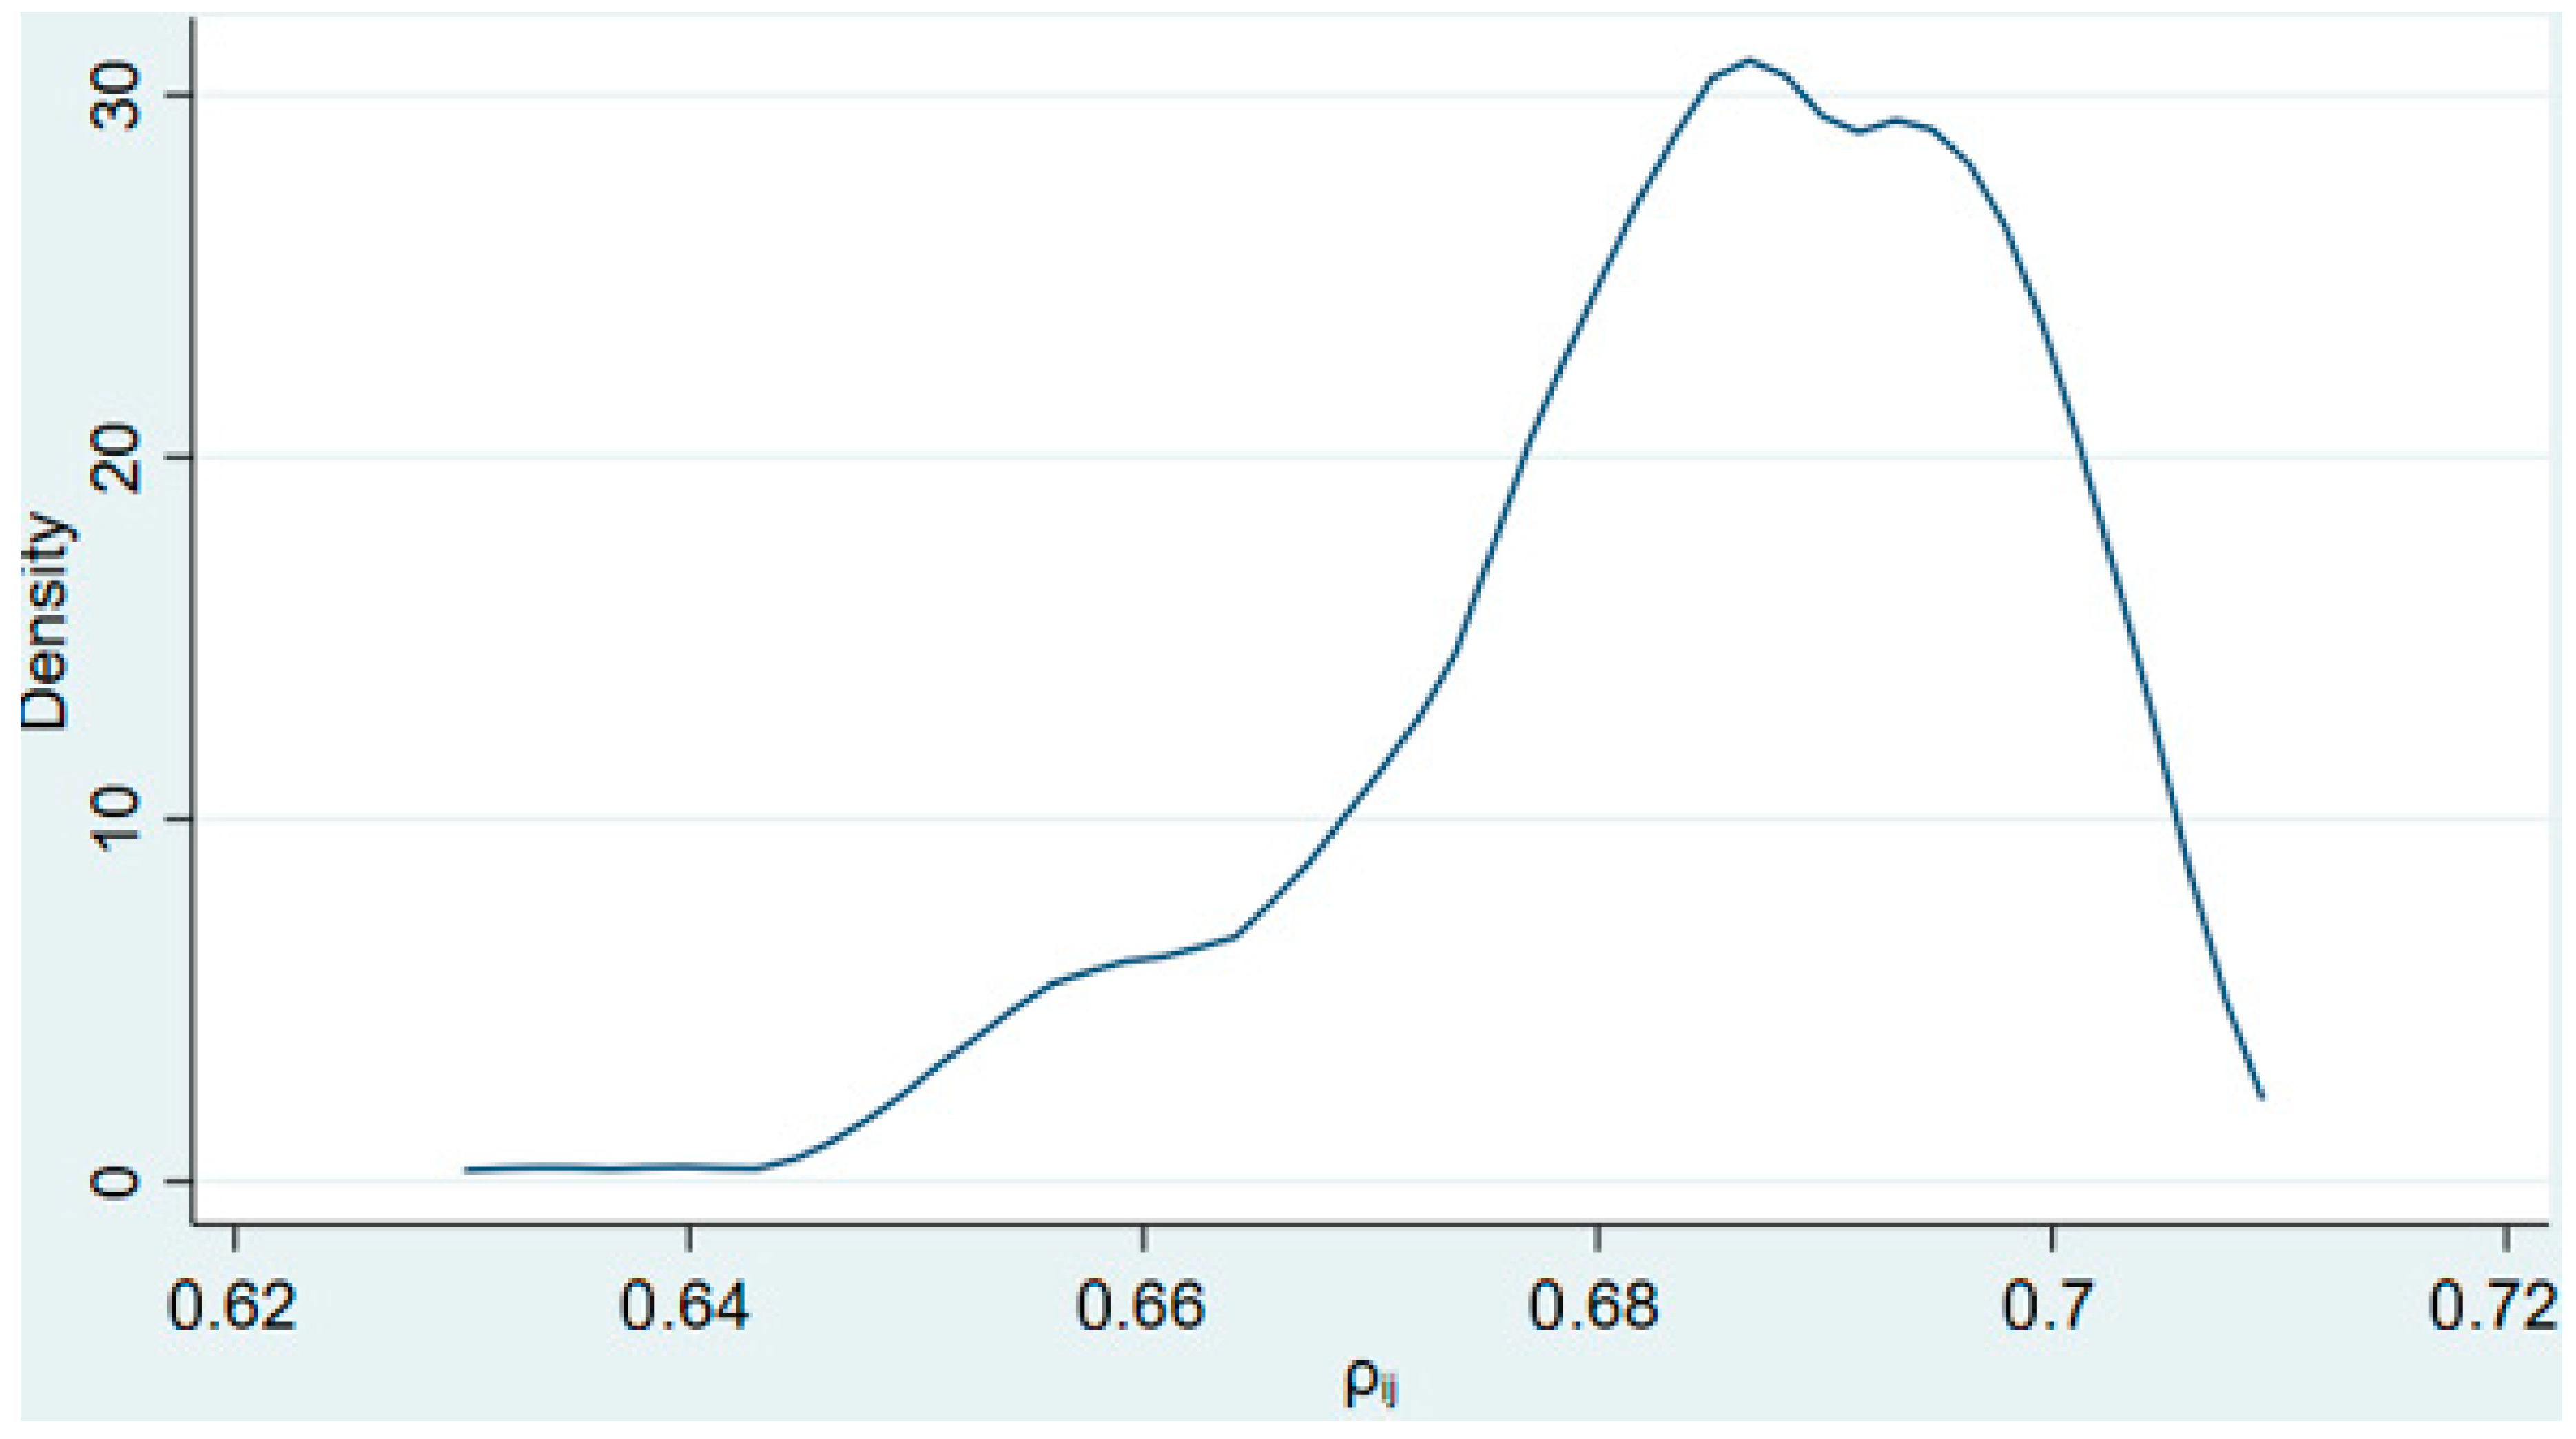
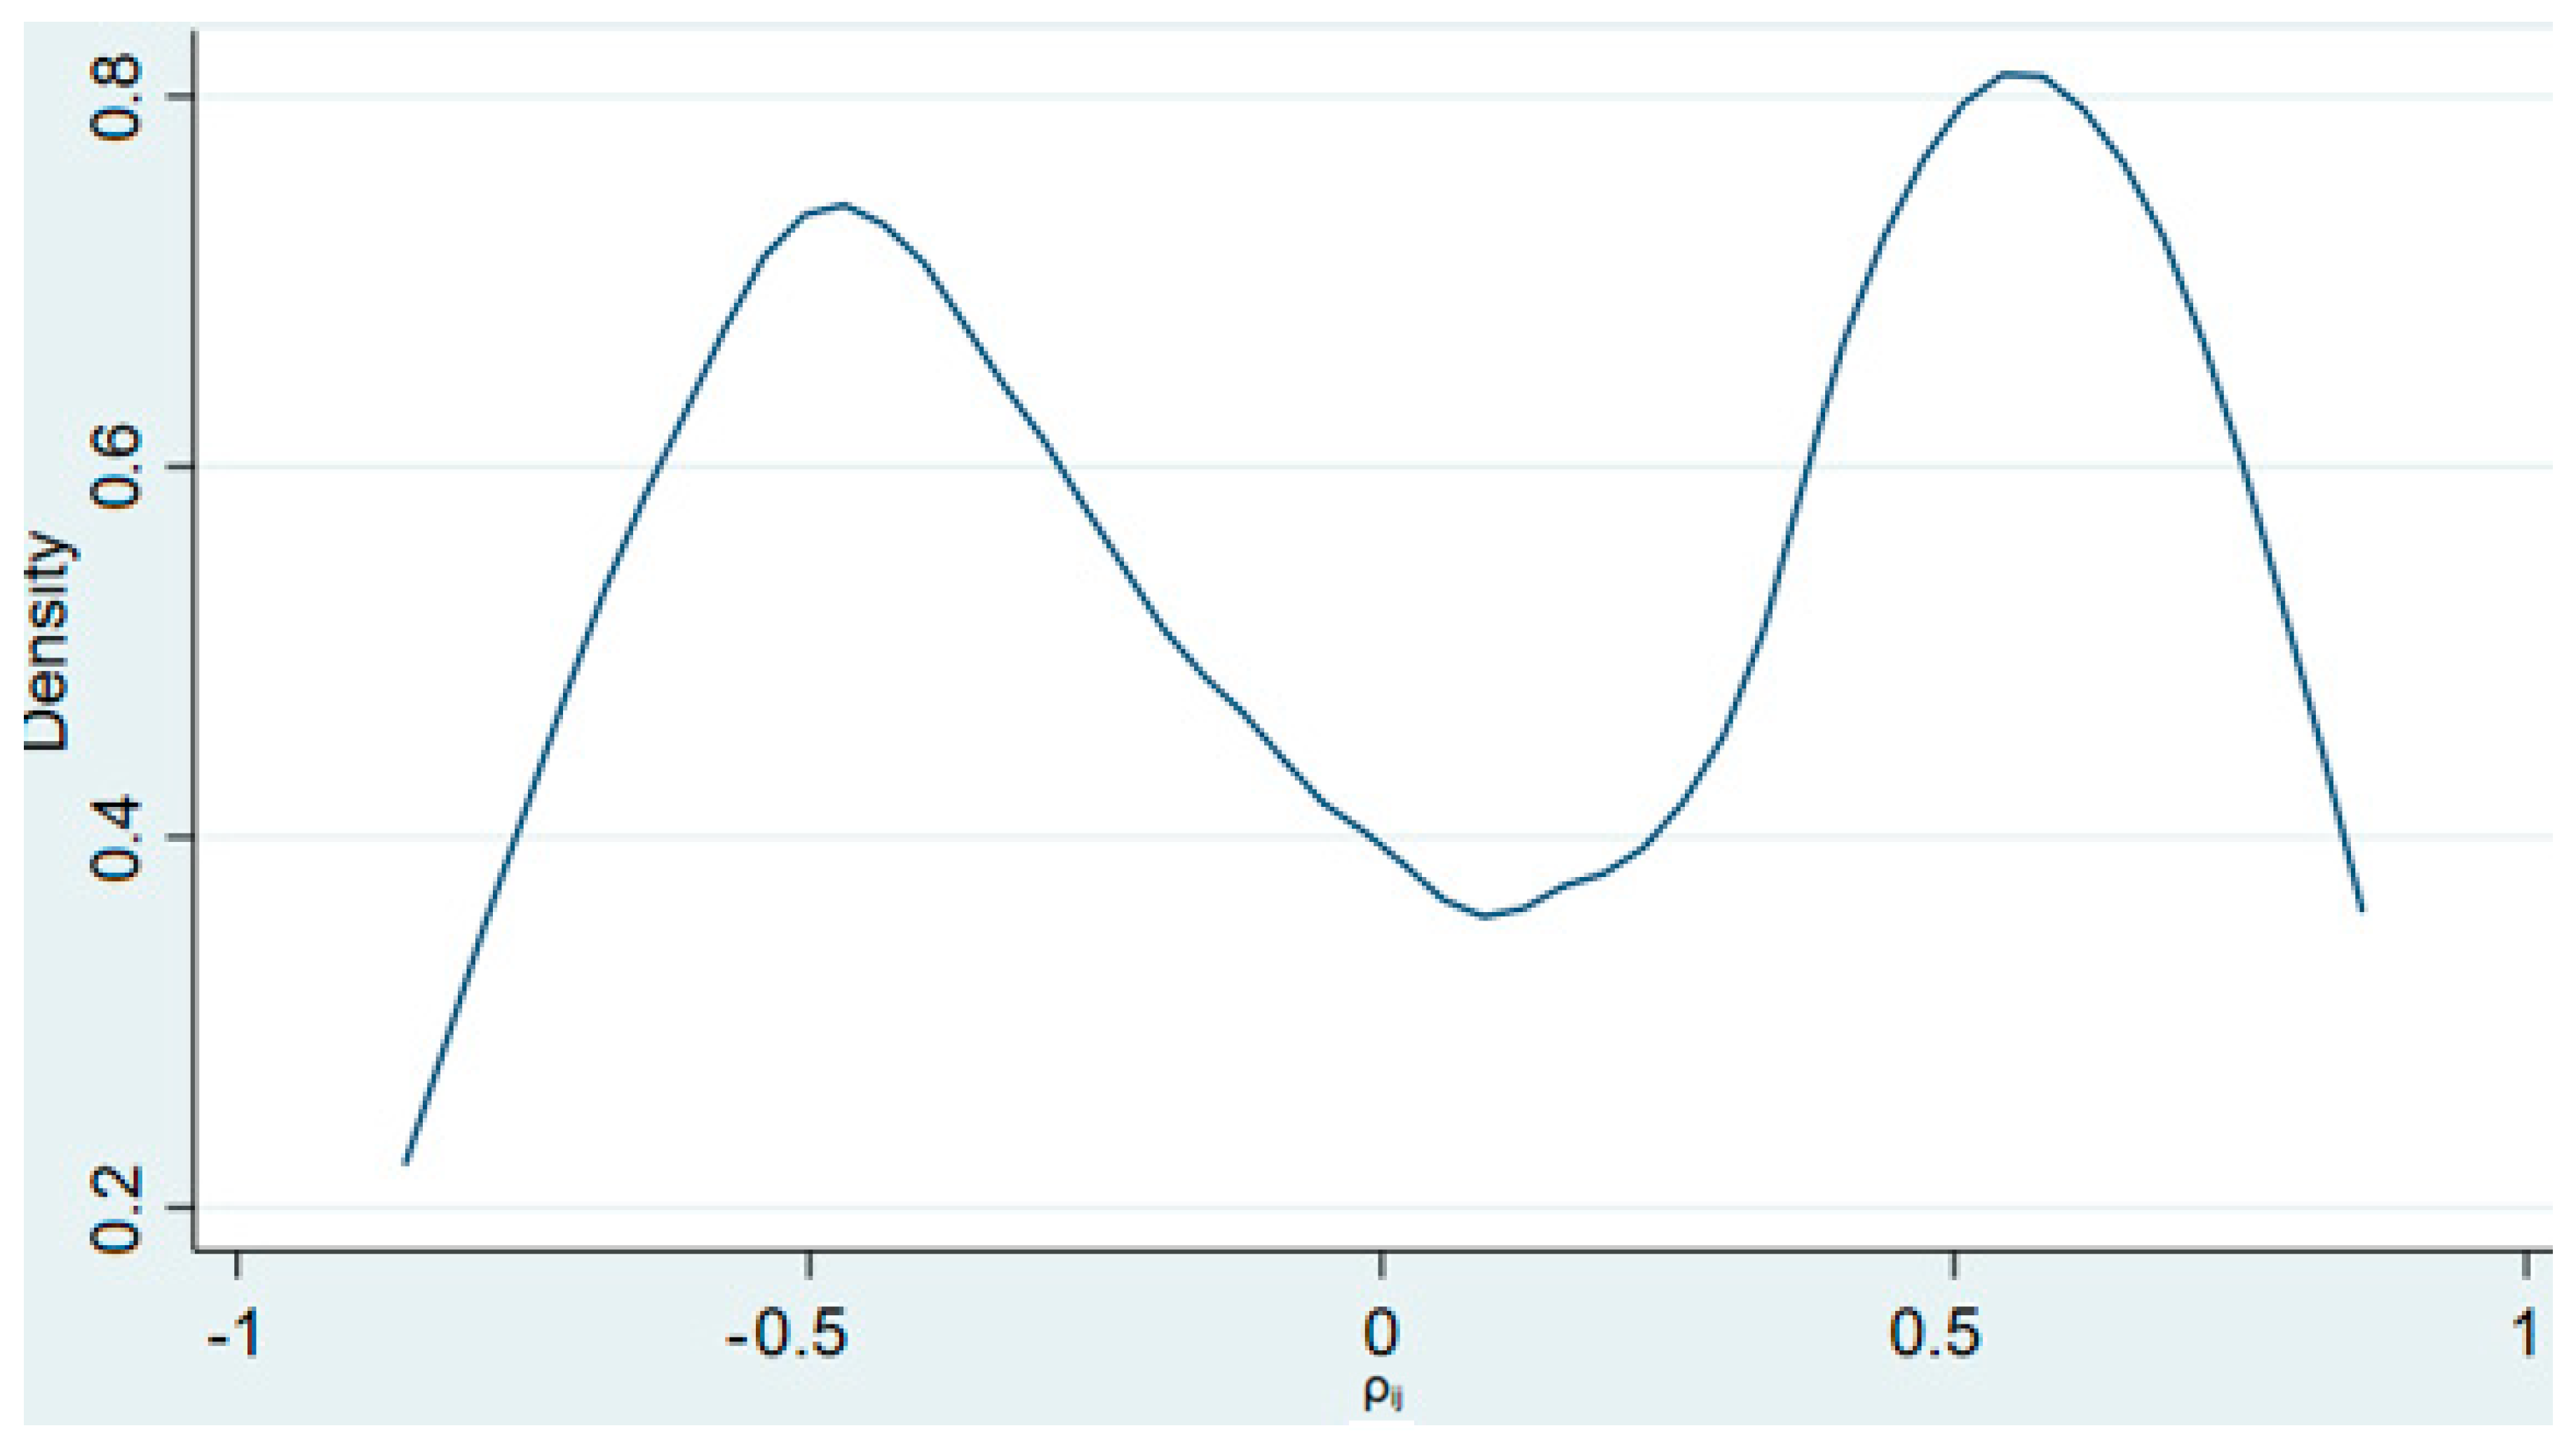
Figure 1,
Figure 2,
Figure 3,
Figure 4,
Figure 5 and
Figure 6 display the kernel density functions of the variables with respect to cross-sectional dependence. We noticed strong cross-sectional dependence concentrated around 0.6–0.8 for renewable energy consumption, government consumption, investment and the share of trade. These visual observations corroborate the independence of sub-Saharan countries in terms of renewable energy adoption, investment and international trade, which is not surprising given the existence of several regional trade and economic agreements across the region. Green growth and the residual appear to be bimodal. The bimodality of the residual in particular seems to be moderately negative and positive, respectively.
The results in
Table 3 coupled with
Figure 1,
Figure 2,
Figure 3,
Figure 4,
Figure 5 and
Figure 6 justify the use of a panel unit root test that accounts for cross-sectional dependence as failure to do so would render our unit root tests unreliable [
84]. The unit root test results are presented in
Table 4. The null hypothesis of a unit root is rejected in levels for green growth, government consumption, and gross capital formation at the 5% level. These variables are, therefore, integrated into the order of zero, i.e., I (0). For the remaining variables, renewable energy and trade, the null hypothesis of a unit root is rejected after the first differentiation, suggesting an integration of the order of one for these two variables. Given the mixture of integration, it was unreasonable to pursue tests for cointegration, as cointegration in its conventional form requires, as a precondition, that the variables be non-stationary and integrated into the same order. Rather than testing for cointegration, the analysis expressed trade and renewable energy consumption into the first differentiation prior to estimation in order to avoid spurious regression.
In
Table 5, the analysis presents results from the slope homogeneity tests. Both tests return very low probability values, suggesting strong evidence against the null hypothesis. The tests, therefore, conclude that the slope coefficients are heterogeneous across countries, ruling out the use of estimation approaches that assume slope homogeneity.
Overall, the preliminary diagnostic checks suggest that multicollinearity is less prevalent and that an appropriate estimation approach is one that accounts for cross-sectional dependence while allowing slope heterogeneity. The MG-DCCE was, therefore, preferred over common estimation approaches applied in the literature, such as the difference and system GMM, for this very reason.
Table 6 presents the regression results. While appreciating the limitations of the system GMM in light of the preliminary diagnostics on parameter heterogeneity and cross-sectional dependence, its results are tabulated side-by-side with results from the IV-DCCE and the DCCE. This helps determine the extent to which ignoring cross-sectional dependence and parameter heterogeneity influences the conclusion. Different specifications were considered. In some specifications, trade and renewable energy are included in the first difference. In others, the variables are included in level form.
Table 6 highlights two main results. First, the commonly applied system GMM shows a positive and statistically significant impact of renewable energy consumption on green growth, with constant trade openness, government consumption, gross capital formation and dynamic term. While this result agrees with most studies, linking renewable energy and green growth, a look at the results from the IV-DCCE and the DCCE models, which account for the prevalent cross-sectional dependence and heterogeneous slope coefficients, shows that this result is likely misleading. The IV-DCCE and the DCEE particularly find no significant connection between renewable energy consumption and green growth in the 22 sub-Saharan countries. This result holds regardless of whether the I (1) variables are included in the first difference or the level form. The second important result is that green growth in the 22 sub-Saharan countries is primarily achievable through gross capital formation, which is consistent with economic theory.
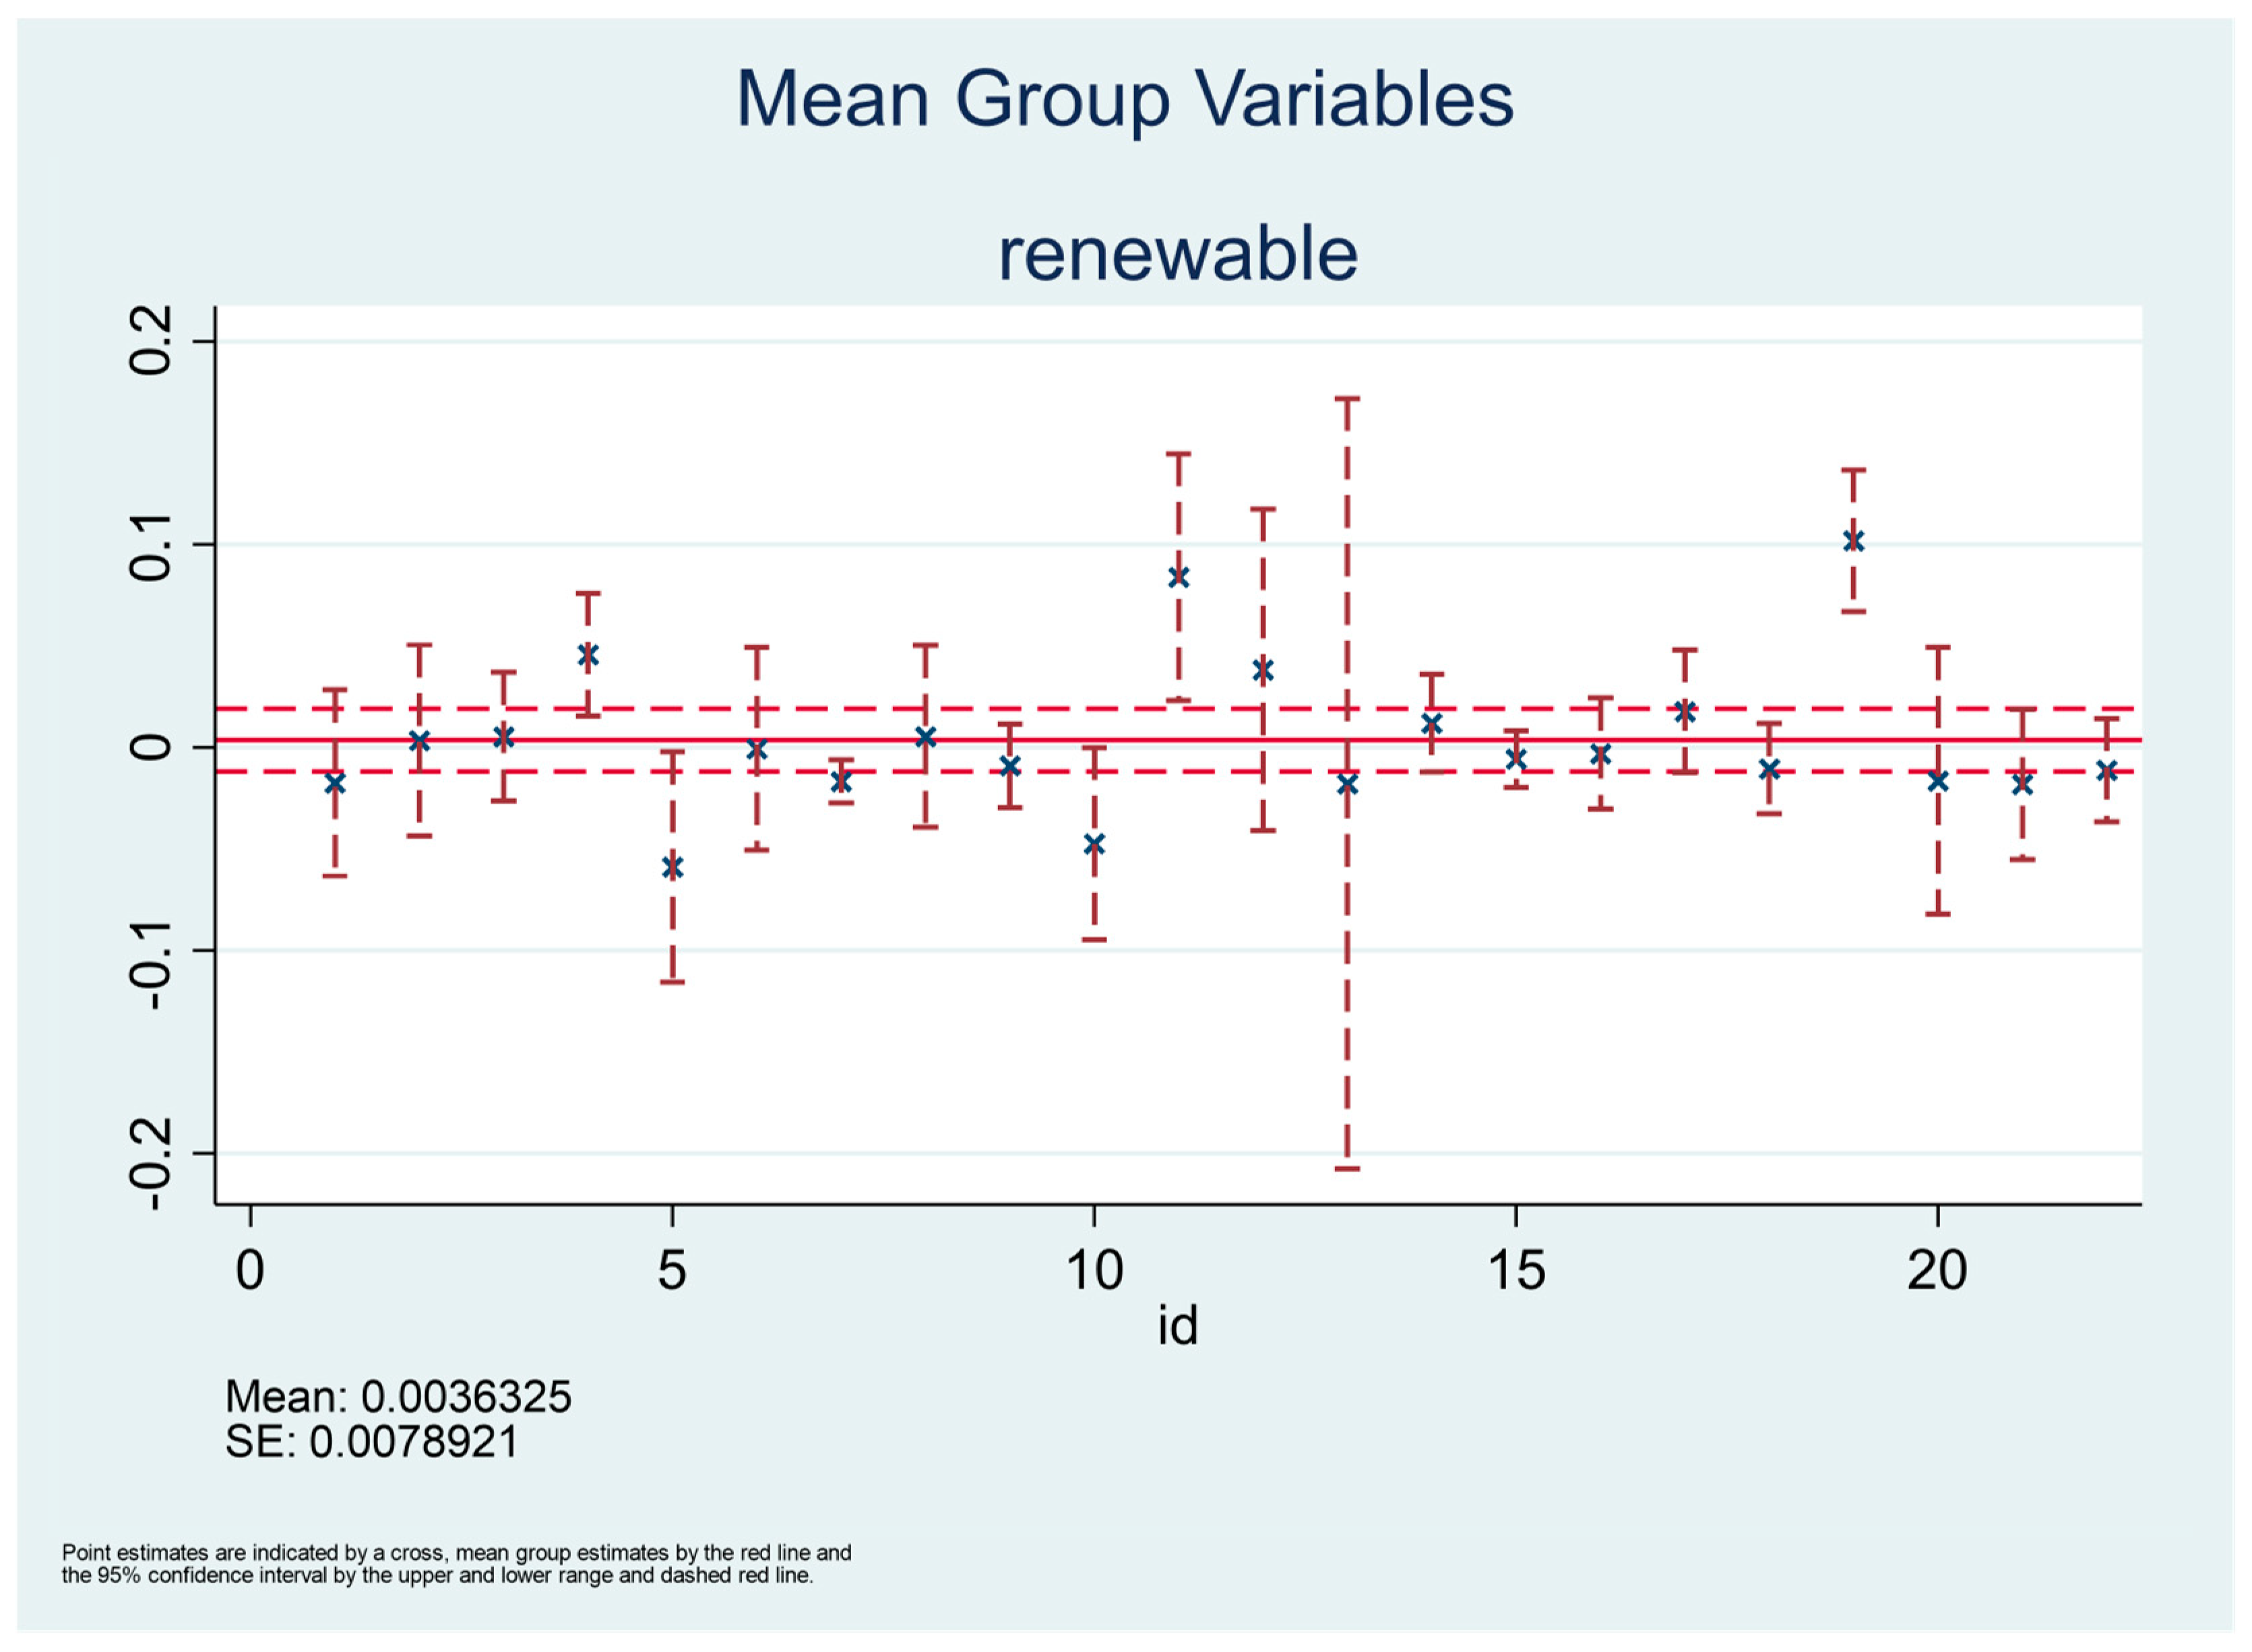
Figure 7 is a range plot displaying the cross-country point estimates of renewable energy from the MG-DCCE and their associated confidence intervals. The upper part of the plot represents the maximum of the 95% confidence interval, while the lower part represents the minimum. The cross in the middle captures the point estimate from the MG-DCCE. In addition, the range plot also includes the 95% confidence interval of the point estimate. Two main observations can be drawn from the graph. One is that, consistently with the MG estimates reported in
Table 6, most of the confidence intervals contain a zero. The second is the presence of some variability in the appearance of the coefficients. In the fourth, eleventh and nineteenth countries, for instance, renewable energy in fact correlates positively and significantly with green economic growth. From the dataset, these countries are Botswana, Guinea-Bissau and Sierra-Leone. On the other hand, the fifth and tenth countries exhibit a negative and significant association between renewable energy and green economic growth. These countries are the Central African Republic and Ghana.
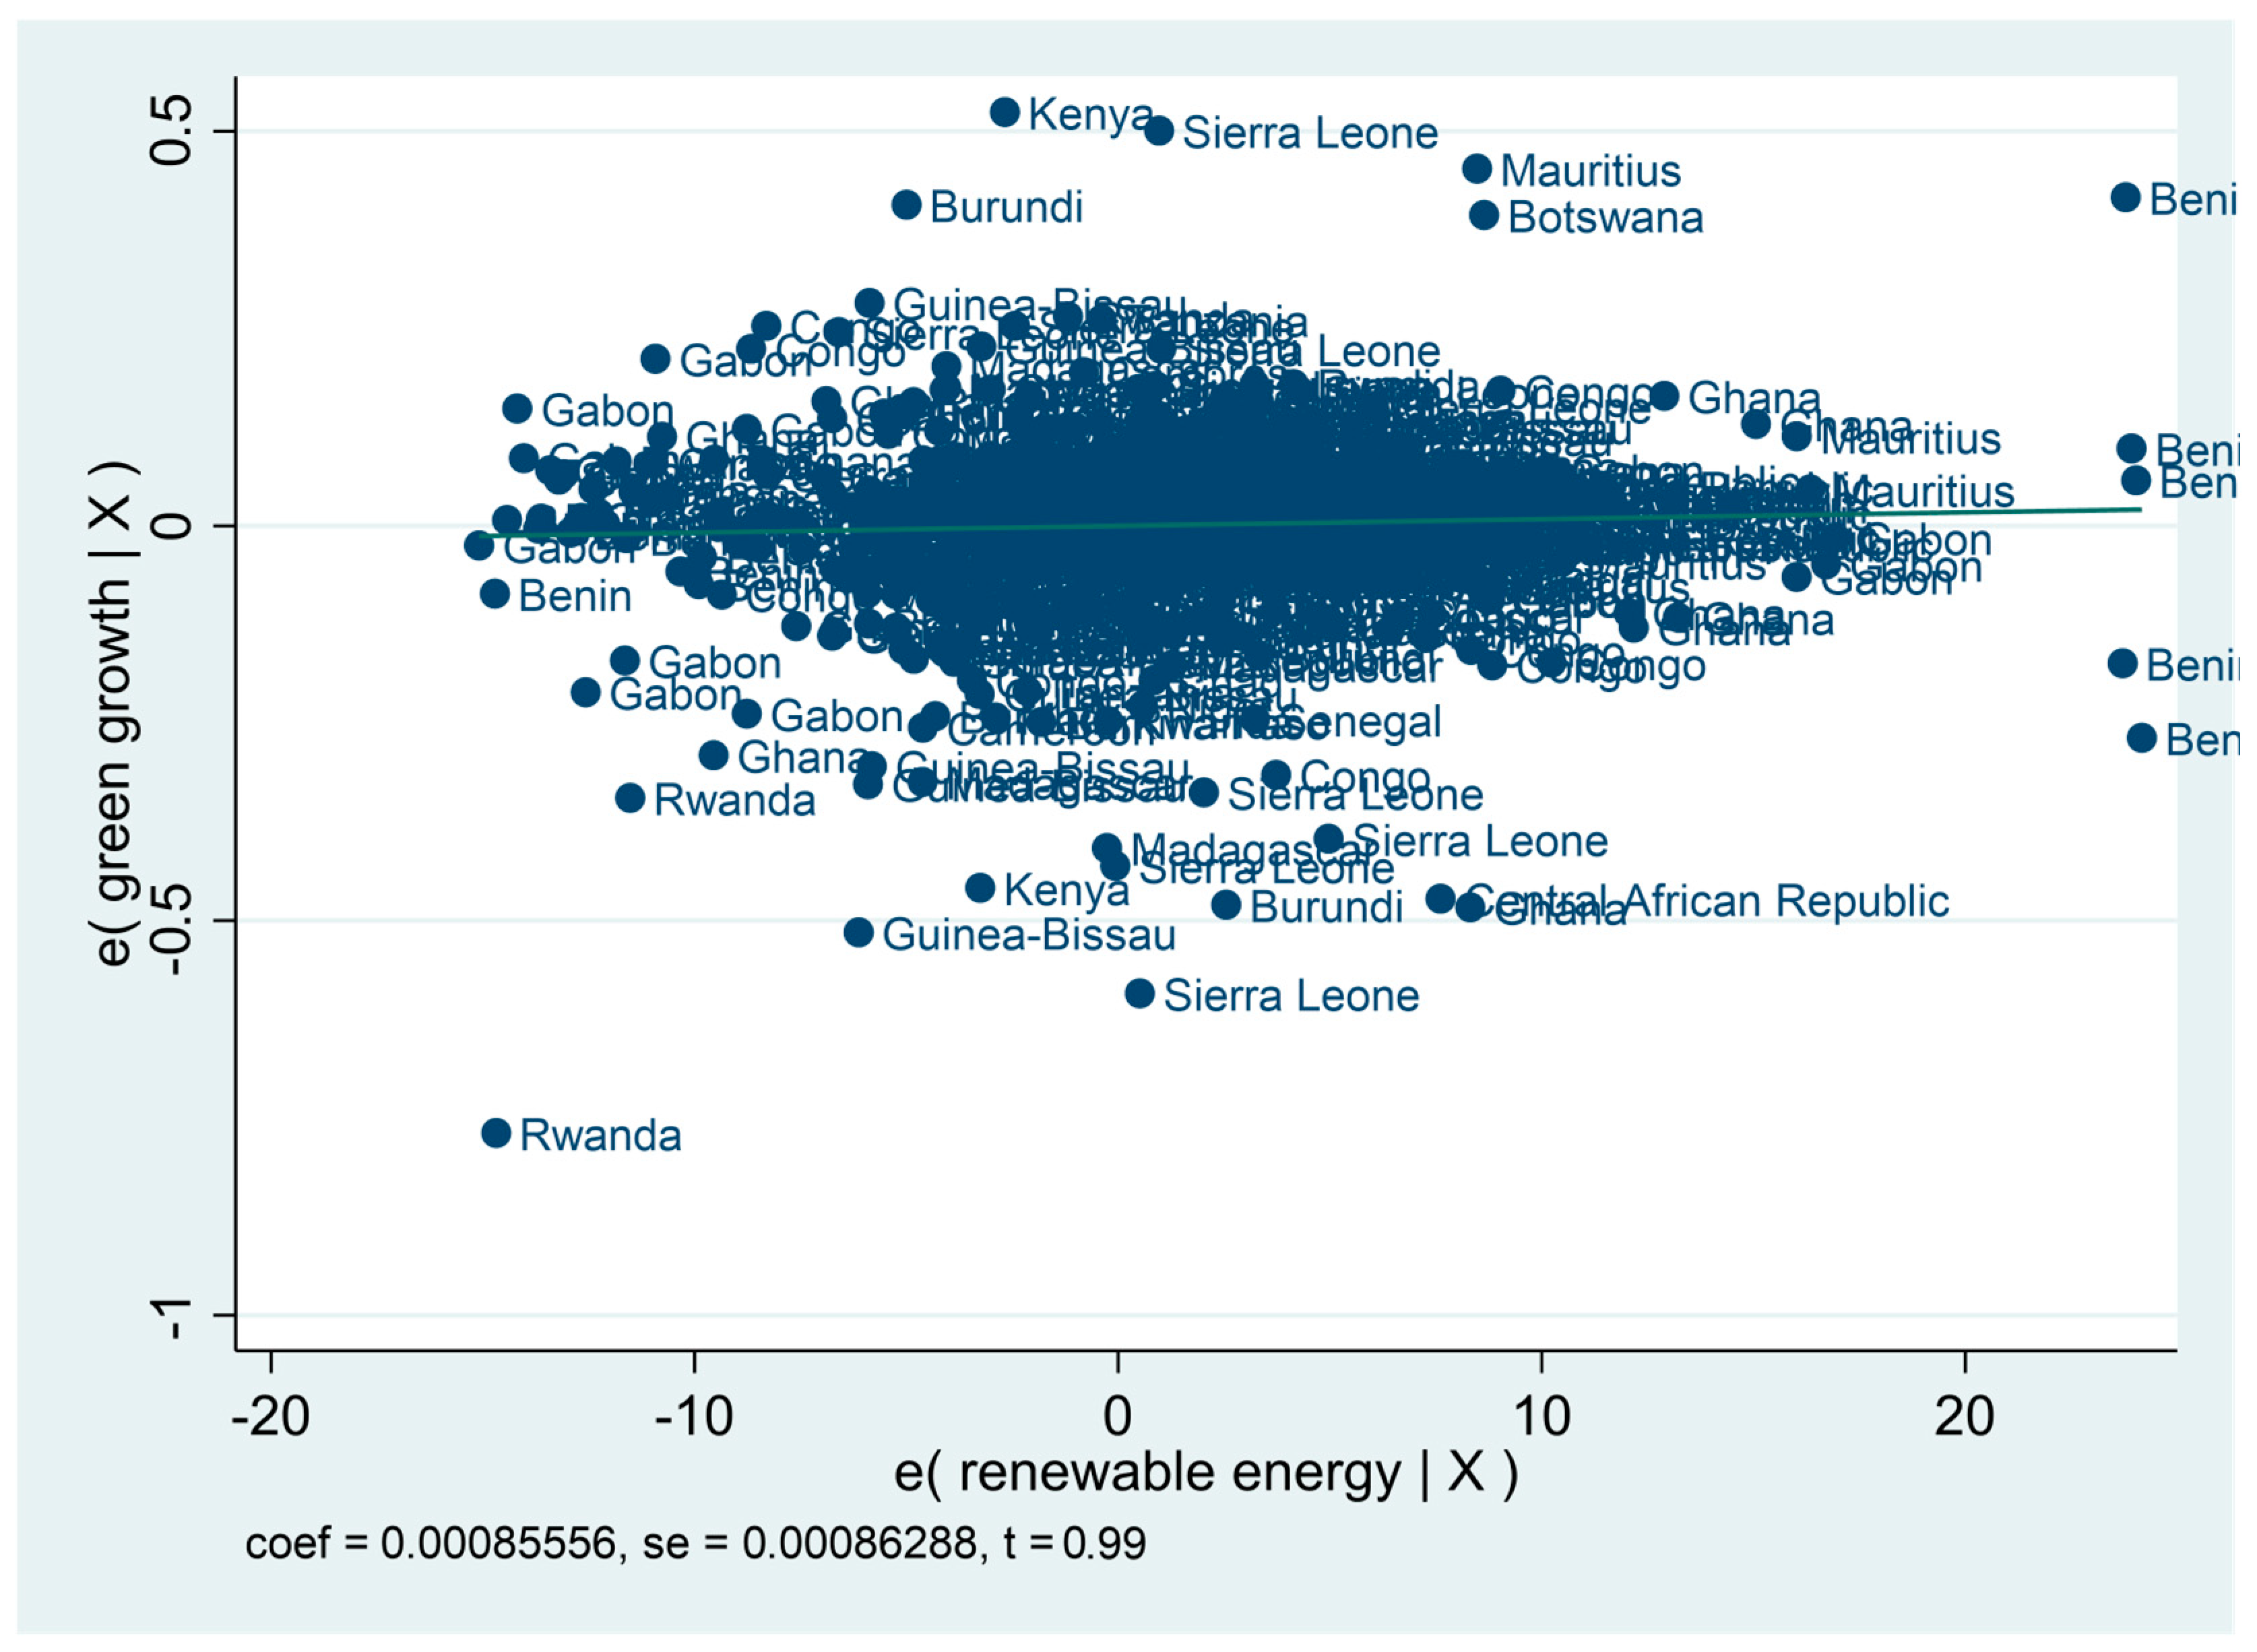
Figure 8 displays a conditional scatter plot of renewable energy and green economic growth. The graph particularly shows the association between renewable energy and green growth, with constant trade, gross capital formation and general government consumption. A quick visual inspection of the graphs shows little to no association between renewable energy consumption and green economic growth, with constant trade, gross capital formation and general government consumption. This is demonstrated, in particular, by a line that is virtually flat and a test statistic that is as low as 0.99. This visual observation aligns with the MG estimates, where the impact of renewable energy consumption is found to be, on average, statistically insignificant at conventional levels of significance.
In the next exercise, the aim is to determine whether renewable energy could have an impact on the four types of environmental damage, namely carbon dioxide damage, mineral depletion, net forest depletion and energy depletion. This stems from the hypothesis that renewable energy is generally a clean form of energy and therefore minimizes environmental damage. This is in line with goal number 13 of the United Nations SDG, which is related to climate action. Similarly to the baseline approach, the four variables were tested for stationarity using a method that accounts for cross-sectional dependence, which is clearly prevalent in data.
Table 7 presents the results. It shows that carbon dioxide damage is integrated into the order of zero, while net forest, mineral and depletion are all integrated into the order of one. The non-stationary variables were transformed into the first difference prior to estimation.
Table 8 presents the results. No controls are included in these regressions in a bid to capture the full impact of renewable energy on environmental damage. The main result arising from the table is that renewable energy consumption reduces only significantly carbon dioxide damage. Its impact on other forms of environmental damage is not statistically significant despite carrying the expected negative marker. The negative and statistically significant impact of renewable energy on carbon dioxide damage suggests that renewable energy consumption is associated with a reduction in CO
2 emissions, supporting the argument that transitioning from fossil fuels to renewable energy can mitigate environmental damage. This result is particularly important for sub-Saharan Africa, where reliance on fossil fuels for energy production has led to significant carbon emissions and where transitioning to renewable sources is seen as a crucial strategy for sustainable development.
There are possible explanations for the insignificant link between renewable energy consumption and other forms of environmental damage. For net forest depletion, it is possible that the transition to renewable energy alone does not sufficiently address the broader drivers of forest depletion, which in sub-Saharan Africa may be more directly linked to agricultural expansion, illegal logging and land-use changes rather than energy consumption per se. Economic theory suggests that while renewable energy can reduce pressure on forests by lowering reliance on biomass fuels, additional policies aimed at improving land management and enforcing forest conservation might be necessary to see a clear impact on forest depletion. Regarding mineral damage, although mineral extraction often leads to extensive environmental harm, including land degradation and contamination, the transition to renewable energy might not directly influence mineral damage unless there is a more comprehensive shift towards green technology in the mining sector itself.
With respect to energy depletion, the significant impact could indicate that renewable energy consumption has yet to show a meaningful impact on reducing energy depletion in sub-Saharan Africa. This finding can be explained by economic theory on the slow pace of energy transitions, where shifts from fossil fuels to renewable sources require time, infrastructure and market development. In a region where some countries are still heavily reliant on biomass and non-renewable energy, the incremental increase in renewable energy may not be enough to substantially reduce the depletion of non-renewable resources. As argued in the theory of path dependence, the entrenched nature of existing energy systems and the growing demand for energy make it difficult for renewables alone to significantly reduce environmental damage in the short term.
Discussion
The results offer an insightful view of the impact of renewable energy consumption on green growth in sub-Saharan Africa. An important feature of the analysis is the demonstration of how ignoring parameter heterogeneity and cross-sectional dependence could bias the results. Despite showing the positive impact of renewable energy on green growth, which aligns with the theory and majority of the available studies, the two-step system GMM fails to account for cross-sectional dependence. Sub-Saharan countries are highly dependent on each other, as supported by cross-sectional dependence tests. The GMM method assumes cross-sectional independence, which is unrealistic for sub-Saharan Africa, where regional integration and external shocks can affect several countries contemporaneously. By not accounting for cross-sectional dependence, the system GMM is likely to be biased, as argued in the methodology section. This limitation could explain why the coefficient for renewable energy consumption appears significant in the GMM model but not in the DCCE models, which allow for more flexibility in modeling these cross-country dependencies.
Additionally, the two-step system GMM does not account for parameter heterogeneity, a crucial oversight given the diverse economic structures and development stages across SSA. The region spans countries with varying levels of infrastructure, political stability and institutional quality. Therefore, the impact of renewable energy consumption on green growth is likely to differ widely across countries, as supported by the empirical tests for slope homogeneity. By assuming a homogeneous effect of renewable energy across all sub-Saharan countries, the system GMM fails to capture this heterogeneity, casting further doubt on the validity of its finding. The DCCE models, which accommodate slope heterogeneity and cross-sectional dependence, show that renewable energy consumption has no significant impact on green growth. This result underlines the limitations of the system GMM in handling cross-sectional dependence and parameter heterogeneity. The DCCE model allows for cross-sectional dependence and captures differences in the effect of renewable energy consumption across countries, providing a more reliable estimate.
In light of these methodological concerns, the more conservative results of the DCCE models should likely be given greater weight. These models suggest that the effect of renewable energy consumption on green growth in SSA is weaker than initially suggested by the system GMM. The absence of a significant effect in the DCCE models implies that renewable energy consumption may not yet be the transformative driver of green growth in the region that some policymakers might hope for. Within the literature, the insignificant impact of renewable energy on green growth disagrees with much of the available evidence [
5,
6,
7,
8,
9,
10]. This analysis argues that these studies have, in general, used estimation approaches that disregard parameter heterogeneity and cross-sectional dependence. The preliminary tests in this analysis demonstrated the importance of addressing these two violations. It is therefore possible that the inconclusiveness of findings in the literature reflects methodological deficiencies in terms of handling slope heterogeneity and contemporaneous correlations. This explanation supports the argument that ignoring cross-sectional dependence and slope heterogeneity in panel data models can lead to biased estimates and incorrect inference, leading to erroneous policy recommendations [
34]. Intuitively, an insignificant link between renewable energy consumption and green growth is plausible since, in theory, energy consumption hardly influences growth directly. Empirically, in specifications where gross capital formation, a key determinant of growth, is held constant, the insignificant growth impact of renewable energy could indicate that its impact on green growth indirectly operates through infrastructural investments.
5. Conclusions
This study provides important insights into the relationship between renewable energy consumption and green growth, as well as its impact on various forms of environmental degradation in sub-Saharan Africa. The findings challenge the conventional wisdom that renewable energy consumption is a strong driver of green growth, as the results from the more robust IV-DCCE and DCCE models reveal no significant impact on green growth across the region. Instead, gross capital formation emerges as the key determinant of green growth, aligning with economic theory that highlights the importance of infrastructure and investment in driving long-term growth. In particular, the study concludes that renewable energy consumption does not have a direct or statistically significant impact on green economic growth in sub-Saharan Africa, although it helps minimize environmental damage by reducing CO2 emissions. Instead, the results underscore the central role of gross capital formation in achieving green growth, consistent with economic theory. This finding has critical policy implications, particularly in emphasizing the role of gross capital formation as the primary driver of green growth in sub-Saharan Africa. While the existing literature often assumes that increasing renewable energy consumption directly stimulates green growth, this study demonstrates that such a relationship is not statistically significant when accounting for cross-sectional dependence and slope heterogeneity. Instead, the results indicate that green growth in the region is largely driven by investment in infrastructure, as captured by gross capital formation. This suggests that while transitioning to renewable energy remains important for reducing environmental degradation—particularly carbon emissions—it is not sufficient on its own to drive sustainable economic growth. Policymakers should therefore prioritize investments in renewable energy infrastructure, technological innovation and industrial capacity to ensure that renewable energy contributes indirectly to green growth through gross capital formation. This implication aligns with Solow’s growth model, which emphasizes the role of investment in physical capital in increasing economic growth to a steady state. Higher levels of capital accumulation are achieved through infrastructure development. In the absence of investment in infrastructure, renewable energy alone may not be able to generate the green growth outcomes that policymakers seek in the region. Additionally, while renewable energy consumption is found to significantly reduce carbon dioxide emissions, it does not significantly reduce other forms of environmental degradation, such as net forest depletion, mineral damage and energy depletion. These results suggest that while renewable energy is crucial for mitigating CO2 emissions, broader and more targeted policies are necessary to address the diverse environmental challenges facing sub-Saharan Africa.
The choice of the MG-DCCE estimator over the widely used GMM system has significant practical implications for policy formulation in sub-Saharan Africa. Many existing studies cited in the literature review section employ GMM estimators, which assume parameter homogeneity and cross-sectional independence—assumptions that are highly restrictive in the context of sub-Saharan Africa, where economic structures, institutional capacities and energy policies vary widely across countries. By contrast, the MG-DCCE estimator explicitly accounts for slope heterogeneity and cross-sectional dependence, ensuring that the estimated effects reflect country-specific variations while addressing the interconnectedness of regional economies. The practical significance of this methodological contribution is evident in the study’s findings: while GMM suggests a statistically significant positive impact of renewable energy on green growth, the MG-DCCE results indicate that this relationship is not robust when accounting for these methodological caveats. This suggests that a one-size-fits-all policy approach to renewable energy in sub-Saharan Africa may be misguided, as the impact of renewable energy on green growth is contingent on country-specific factors. Consequently, policymakers should prioritize targeted, context-sensitive strategies that recognize the diverse conditions across the region rather than relying on generalized findings that may not hold when key methodological limitations are addressed.
In light of these findings, future policy efforts should focus on a comprehensive approach that combines renewable energy adoption with investments in infrastructure, resource management and sustainable development practices to promote both green growth and environmental sustainability, considering country-specific circumstances in the region. Overall, this study suggests that while renewable energy consumption is essential for environmental sustainability, it is the broader investment in infrastructure that provides the foundation for green growth in sub-Saharan Africa, emphasizing the need for integrated policies that encourage both clean energy and capital accumulation for long-term development.
Given the heterogeneity across countries in terms of economic development, energy access and institutional capacity, as confirmed by the preliminary diagnostic tests in this study, future studies could explore how different national and regional contexts might influence the effectiveness of renewable energy policies. While some studies have already considered the role of institutions and governance, there is still room to explore the role of financial development and regional integration in shaping renewable energy outcomes across sub-Saharan Africa.


