Article

Quantitative Classification of Shale Lithofacies and Gas Enrichment in Deep-Marine Shale of the Late Ordovician Wufeng Formation and Early Silurian Longyi1 Submember, Sichuan Basin, China

1
State Key Laboratory of Oil and Gas Reservoir Geology and Exploitation, Chengdu University of Technology, Chengdu 610059, China
2
Cost Management Center, PetroChina Southwest Oil & Gas Field Company, Chengdu 610051, China
*
Author to whom correspondence should be addressed.
Energies 2025, 18(7), 1835; https://doi.org/10.3390/en18071835
Submission received: 4 February 2025 / Revised: 29 March 2025 / Accepted: 31 March 2025 / Published: 4 April 2025

Abstract

:
The classification of shale lithofacies, pore structure characteristics, and controlling factors of gas enrichment in deep-marine shale are critical for deep shale gas exploration and development. This study investigates the Late Ordovician Wufeng Formation (448–444 Ma) and Early Silurian Longyi1 submember (444–440 Ma) in the western Chongqing area, southern Sichuan Basin, China. Using experimental data from deep-marine shale samples, including total organic carbon (TOC) content analysis, X-ray diffraction (XRD), field emission scanning electron microscopy (FE-SEM), low-pressure N2 and CO2 adsorption, gas content measurement, and three-quartile statistical analysis, a lithofacies classification scheme for deep-marine shale was established. The differences between various global marine shale formations were compared, and the main controlling factors of gas enrichment and advantageous lithofacies for deep shale were identified. The results show that six main lithofacies were identified: organic-rich siliceous shale (S1), organic-rich mixed shale (M1), medium-organic siliceous shale (S2), medium-organic mixed shale (M2), organic-lean siliceous shale (S3), and organic-lean mixed shale (M3). Deep-marine shale gas mainly occurs in micropores, and the development degree of micropores determines the gas content. Micropore development is jointly controlled by the TOC content, felsic mineral content, and clay mineral content. TOC content directly controls the development degree of micropores, whereas the felsic and clay mineral contents control the preservation and destruction of micropores during deep burial. The large-scale productivity of siliceous organisms during the Late Ordovician Wufeng period to the Early Silurian Longmaxi period had an important influence on the formation of S1. By comparing the pore structure parameters and gas contents of different lithofacies, it is concluded that S1 should be the first choice for deep-marine shale gas exploration, followed by S2.

1. Introduction

With the continuous growth of global energy demand, shale gas has emerged as a significant alternative to conventional hydrocarbon resources and has become an important unconventional natural gas resource worldwide [1,2,3,4]. The advancement of shale gas geological theory, combined with the development of hydraulic fracturing and horizontal drilling technologies, has facilitated the large-scale commercial development of shale oil and gas at shallow to moderate depths (depths of 2000–3500 m) across multiple basins worldwide. Notable examples include the Barnett shale in the Fort Worth Basin of the United States [1], the Haynesville shale and Eagle Ford shale in the Western Gulf of Mexico Basin of the United States [5], the Longmaxi shale in the Sichuan Basin of China [6,7], and the Hot shale in the Jeffara Basin of North Africa [8]. However, to meet the energy demand, exploration of deeper oil and gas resources will inevitably be needed. In recent years, the Wufeng Formation–Longyi1 submember in the Sichuan Basin has been the most promising strata for deep shale gas exploration and development in China [9,10,11]. According to estimates by PetroChina, the deep shale gas reservoirs (depths of 3500–4500 m) of the Wufeng Formation–Longmaxi Formation contribute 84% of the total resources in the southern Sichuan Basin, demonstrating great potential for shale gas exploration and development [12,13,14]. Due to complex geological conditions, the advantageous shale lithofacies and pore structure characteristics of deep-marine shale gas enrichment are still unclear, and only a few relevant studies have been performed. Therefore, a systematic study of the lithofacies classification scheme, lithofacies characteristics, pore structure parameters, and main factors controlling gas enrichment in deep-marine shale gas reservoirs is of great significance for shale gas exploration and development in similar geological environments worldwide.
Lithofacies analysis is regarded as essential for shale oil or shale gas exploration because it can reveal the special sedimentary environment and pore characteristics of shale reservoirs [15,16,17]. Recently, extensive research has been conducted globally on shale lithofacies classification. The focus of these studies has progressively transitioned from early emphasis on lithology, paleontological features, laminations development, and structural characteristics to the quantitative characterization of mineral content. Similarly, the classification criteria for shale lithofacies types have evolved from subjective, qualitative descriptions to systematic and quantitative classification standards [18,19]. Despite these advancements, because shale gas reservoirs are affected by tectonism, sedimentation, diagenesis, and other factors, leading to significant differences in lithofacies types, no uniform standards or methods have been developed [1,8,15,20]. Scholars have classified shale using various lithofacies classification methods. For example, Loucks and Ruppel [1] recognized three main lithofacies of the Barnett shale based on mineralogy, texture, and biological species. Mustafa et al. [17] classified Qusaiba shale into three different lithofacies based on organic matter abundance and sedimentary structure. However, previous studies on shale lithofacies have mostly focused on shale layers at shallow and moderate depths, and the classification criteria are subjective. Due to the variations in the sedimentary environment and deep burial process of deep-marine shales, there is no suitable shale lithofacies classification scheme for deep-marine shale reservoir evaluation, and the reservoir characteristics of each lithofacies are not clear. Therefore, based on extensive experimental data from deep-marine shale reservoirs, there is a need to further explore lithofacies classification schemes to guide shale gas exploration and development in these environments worldwide.
Comprehensively evaluating the pore characteristics of shale reservoirs can effectively reduce exploration risk [20,21,22]. Numerous studies on the pore characteristics of marine shale, including pore type, morphology, size, volume, specific surface area, and average pore diameter analyses, have been conducted worldwide [23,24,25]. For example, some scholars have divided shale pores into organic pores, inorganic pores, and microfractures [16,26,27]. Some researchers have demonstrated that organic pores are the most significant pore type in marine shale gas reservoirs, and during thermal evolution, overmature marine shale forms numerous organic pores which provide a considerable specific surface area and pore volume [5,14,23,26]. In addition, marine shale is highly heterogeneous, as various lithofacies demonstrate significant differences in pore characteristics [2,28]. Xu et al. [2] concluded that lithofacies type has a prominent influence on the specific surface area of shales. Slatt and O’Brien [26] reported the discovery of organic pores in the Barnett and Woodford shales, which can provide storage space for gas molecules. However, most of these studies focused on the pore characteristics of shales at shallow and moderate depths, and the pore characteristics of different lithofacies in deep-marine shales have not been well documented. Moreover, the main factors controlling the pore structure parameters and gas enrichment of deep-marine shale reservoirs still need to be clarified.
In this paper, Wufeng Formation–Longyi1 submember deep-marine shale samples were collected from eight typical deep shale gas wells in the western Chongqing area, Sichuan Basin, China. Based on geochemical and mineral composition analysis, low-pressure N2 and CO2 adsorption, thin section and field emission scanning electron microscopy (FE-SEM), total gas content measurements, and other experimental procedures were used. We classified the lithofacies of deep shale reservoirs, compared the characteristics of different marine shale formations, and conducted correlation studies between the pore structure parameters and total gas contents of different lithofacies. The major objectives of this work were to (1) establish a deep-marine shale lithofacies classification scheme and classify lithofacies types, (2) compare the similarities and differences between deep-marine shale and global shale formations, (3) evaluate the pore structure and gas content characteristics of the different lithofacies, (4) summarize the main factors controlling gas enrichment, and (5) determine the advantageous lithofacies for deep-marine shale gas exploration. The findings of this study provide a quantitative lithofacies classification scheme for deep-marine shale gas exploration and enhance the understanding of lithofacies characteristics and gas enrichment mechanisms within deep-marine shale in similar geological environments worldwide.

2. Geological Setting

The Sichuan Basin, located in the northwest of Yangtze Platform, is a large-scale ancient superimposed sedimentary basin developed on the basement of Presinian metamorphic and magmatic rocks in south China [29] (Figure 1A). The western Chongqing area is located in a low and steep tectonic belt in the southern Sichuan Basin, south of the Central Sichuan gentle tectonic belt and west of the Eastern Sichuan high and steep tectonic belt (Figure 1B,C) [30]. The study area has experienced multiple episodes of tectonic movements, including the Caledonian movement, Hercynian movement, Indosinian movement, Yanshan movement, and Himalayan movement, resulting in the formation of a northeast–southwest structural feature and leading to the development of a complex faulted anticline [29,30].
The sedimentary period of the Wufeng Formation (O3w) to the Longyi1 submember (bottom of the Silurian Longmaxi Formation) in the western Chongqing area was dominated by an anoxic shallow to deep-water shelf depositional environment, depositing a set of organic-rich black shale [31] (Figure 2A). The sedimentation environment during this period was affected by a combination of global climatic changes, sea-level fluctuations, and regional tectonic activities [32]. During the early Wufeng Formation, sedimentation was influenced by the Qianzhong ancient land and the Leshan-Longnüsi paleouplift, which occurred during a regressive phase with shallow sedimentary water, resulting in the deposition of low TOC content silty clay shale. By the late Wufeng stage, global cooling and a drop in sea level led to the deposition of the Guanyinqiao section shell limestone, with a thickness of less than 0.5 m in the study area. In the early stage of the Longyi1 submember, global warming, ice sheet melting, and a major marine transgression deepened the water column, resulting in the deposition of black siliceous shale at the bottom of the Longmaxi Formation. In the late Longyi1 submember stage, sea levels fell, water depths shallowed, anoxic conditions weakened, and terrigenous input increased, resulting in the deposition of silty shale with lower organic content.
The Wufeng Formation–Longyi1 submember in this area is characterized by its significant thickness (55–81 m) and considerable burial depth (3500–4500 m), making it one of the most important areas for deep-marine shale gas exploration and development in China [6,20]. Based on lithological characteristics, electrical properties, and logging curves, the Longyi1 submember can be further subdivided into four sublayers: Longyi11, Longyi12, Longyi13, and Longyi14 (hereafter referred to as Sublayer 1, Sublayer 2, Sublayer 3, and Sublayer 4) [6,12]. Among these, the interval from the top of Wufeng Formation to Sublayer 3 is dominated by black carbonaceous siliceous shale, with high total organic carbon (TOC) content and abundant graptolites, indicating deposition under anoxic conditions with high primary productivity. This is the main shale-gas-producing layer in the study area, with a thickness of 14–28 m (Figure 2B).
Figure 1. (A) Location of Sichuan Basin in the Upper Yangtze Block; (B) Location of the southern Sichuan Basin; (C) Geological map of the western Chongqing area and locations of research wells. (Base maps for (A,B) were modified from [16,29]; the latitude and longitude data in (A) were obtained from [29], while those in (B,C) were sourced from the Standard Map Service Network [33]).
Energies 18 01835 g001
Figure 2. (A) Stratigraphic column of the well H202; (B) Stratigraphic column of the Wufeng Formation–Longyi1 submember, showing the vertical distribution of TOC content in well H202 (numbers 1-4 correspond to sublayers 1 through 4).
Energies 18 01835 g002

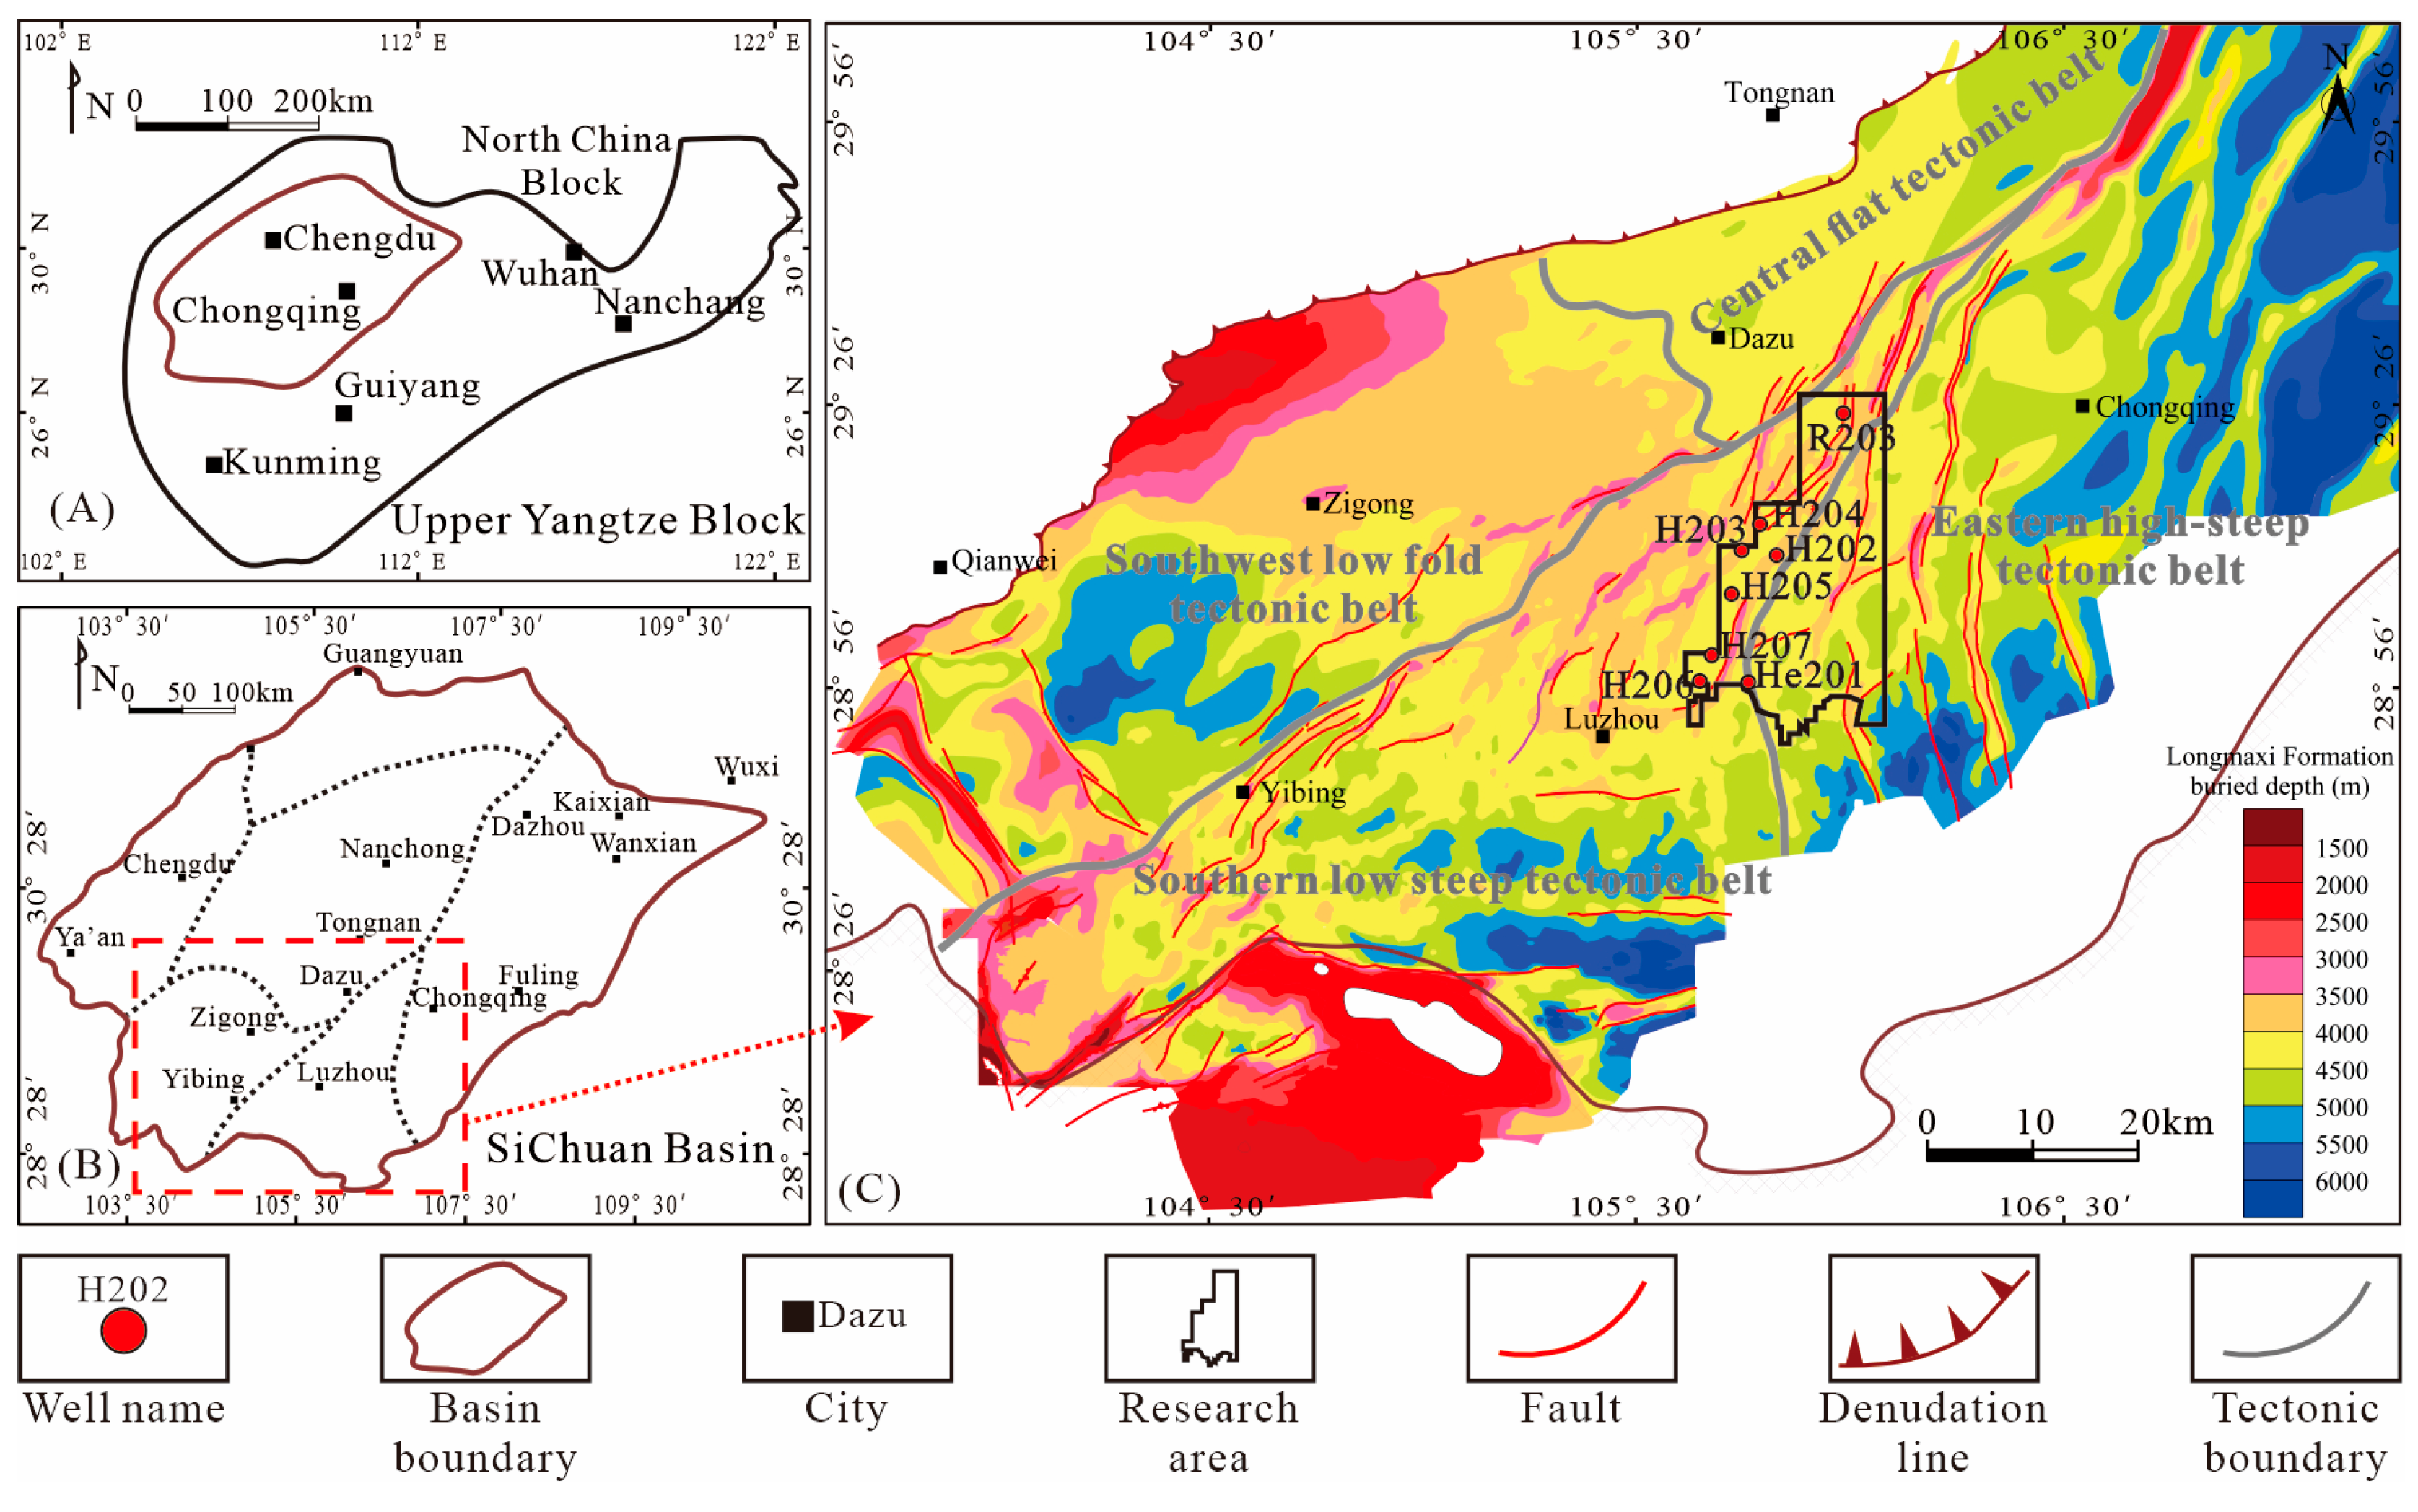
3. Samples and Methods

3.1. Shale Samples

In this study, deep-marine shale drilling core samples were collected from the Upper Ordovician Wufeng Formation and the Lower Silurian Longyi1 submember in eight typical deep shale gas wells in the western Chongqing area, namely, well He201, well H202, well H203, well H204, well H205, well H206, well H207 and well R203, totaling 80 shale samples from different sublayers. There are 8 samples from the Wufeng Formation, 11 samples from Sublayer 1, 14 samples from Sublayer 2, 13 samples from Sublayer 3, and 34 samples from Sublayer 4. The burial depths of the samples range from 3600 m to 4400 m; thus, all of the samples are deep shale reservoir samples. The drilling locations are shown in Figure 1C.

3.2. Experimental Methods

The experiments involved in this study included TOC analysis, whole-rock X-ray diffraction (XRD), FE-SEM, low-pressure N2 and CO2 adsorption, and total gas content measurements.
The TOC content analysis was conducted using a LECO CS-230 carbon and sulfur analyzer at the Geological Laboratory Research Institute of Hebei Scoilmic company (Cangzhou, China). To ensure the accuracy of TOC measurements, the samples were pretreated to remove inorganic carbon, which is particularly important for carbonate-rich shale. Prior to testing, the samples were crushed to a particle size of 60–80 mesh and pretreated with hydrochloric acid (HCl) to eliminate inorganic carbon, mainly carbonate components [18]. After acid treatment, the samples were rinsed with distilled water to remove any residual acid, dried, and then combusted with oxygen in the carbon–sulfur analyzer. The amount of CO2 produced during the combustion process was detected to quantitatively calculate the TOC content in the shale sample. This pretreatment step ensures that the measured CO2 is derived exclusively from organic carbon, thereby providing an accurate determination of TOC content even in carbonate-rich shale formations.
The XRD analysis was conducted using a Bruker AXS D8 Discover X-ray diffractometer at the Geological Laboratory Research Institute of Hebei Scoilmic company (Cangzhou, China). The shale samples were ground to 200 mesh using an agate mortar and then placed in an oven for 24 h. After drying, XRD experiments were conducted to determine the type of mineral based on the characteristic peaks in the diffraction pattern, compared with the standard pattern or database. Quantitative phase analysis was performed using the K-value method (reference intensity ratio method), where the relative mineral contents were determined by calculating the integrated areas of characteristic diffraction peaks and applying appropriate K-factors for each mineral content. Experimental conditions: Cu target, tube voltage 40 kV, tube current 100 mA, step size 0.02°, rotation speed 4°/min [20].
The FE-SEM observations were conducted using a Zeiss Merlin Compact field emission scanning electron microscope at the Geological Laboratory Research Institute of Hebei Scoilmic company (Cangzhou, China). The samples were prepared as rectangular blocks measuring 30 mm × 30 mm × 15 mm. First, they were subjected to mechanical polishing, followed by argon ion polishing. Subsequently, carbon powder was sprayed onto the samples to enhance conductivity, enabling quantitative observations of nanoscale pore sizes and morphologies within the shale samples under the electron microscope [34,35,36]. The working voltage was 15 kV, and the observation distance was 9–11 mm.
The low-pressure N2 and CO2 adsorption tests were conducted using a Micromeritics ASAP 2460 automatic gas adsorption analyzer at the Kezheng Testing company (Suzhou, China). Before the experiment, 3–5 g of the sample was weighed and it was crushed into powder with a particle size of 60–80 mesh. The shale powder sample was dried for 12 h at 110 °C in the degassing chamber to eliminate free water and impurity gas in the samples. Then, the degassed samples were exposed to N2 at 77 K and CO2 at 273.15 K, respectively, to obtain adsorption–desorption isotherms for both gases. CO2 is suitable for characterizing micropores (<1.5 nm), while N2 is appropriate for analyzing a limited range of micropores, mesopores, and some macropores (1.5–100 nm). Next, we used the Brunauer—Emmett—Teller (BET) model to calculate the specific surface area data and used the Barrett–Joyner–Halenda (BJH) model to calculate the total pore volume and average pore diameter [37,38,39]. The pore diameter distribution was calculated with the density functional theory (DFT) model [38,39,40], and the micropore specific surface area and micropore volume were estimated by the Dubinin–Radushkevich (DR) model [38].
The total gas content includes three parts, namely lost gas, desorption gas, and residual gas. The lost gas was calculated using an improved USBM model, while the desorbed gas was measured using an on-site desorption gas analyzer. The residual gas was measured using a residual gas analyzer after crushing and heating the residual samples [41].
In this study, the pore size classification is based on the International Union of Pure and Applied Chemistry (IUPAC) shale pore size classification standard, which identifies pores with sizes less than 2 nm as micropores, pores with sizes from 2 to 50 nm as mesopores, and pores with sizes greater than 50 nm as macropores [42].

4. Results

4.1. Characteristics of Deep-Marine Shale Gas Reservoirs

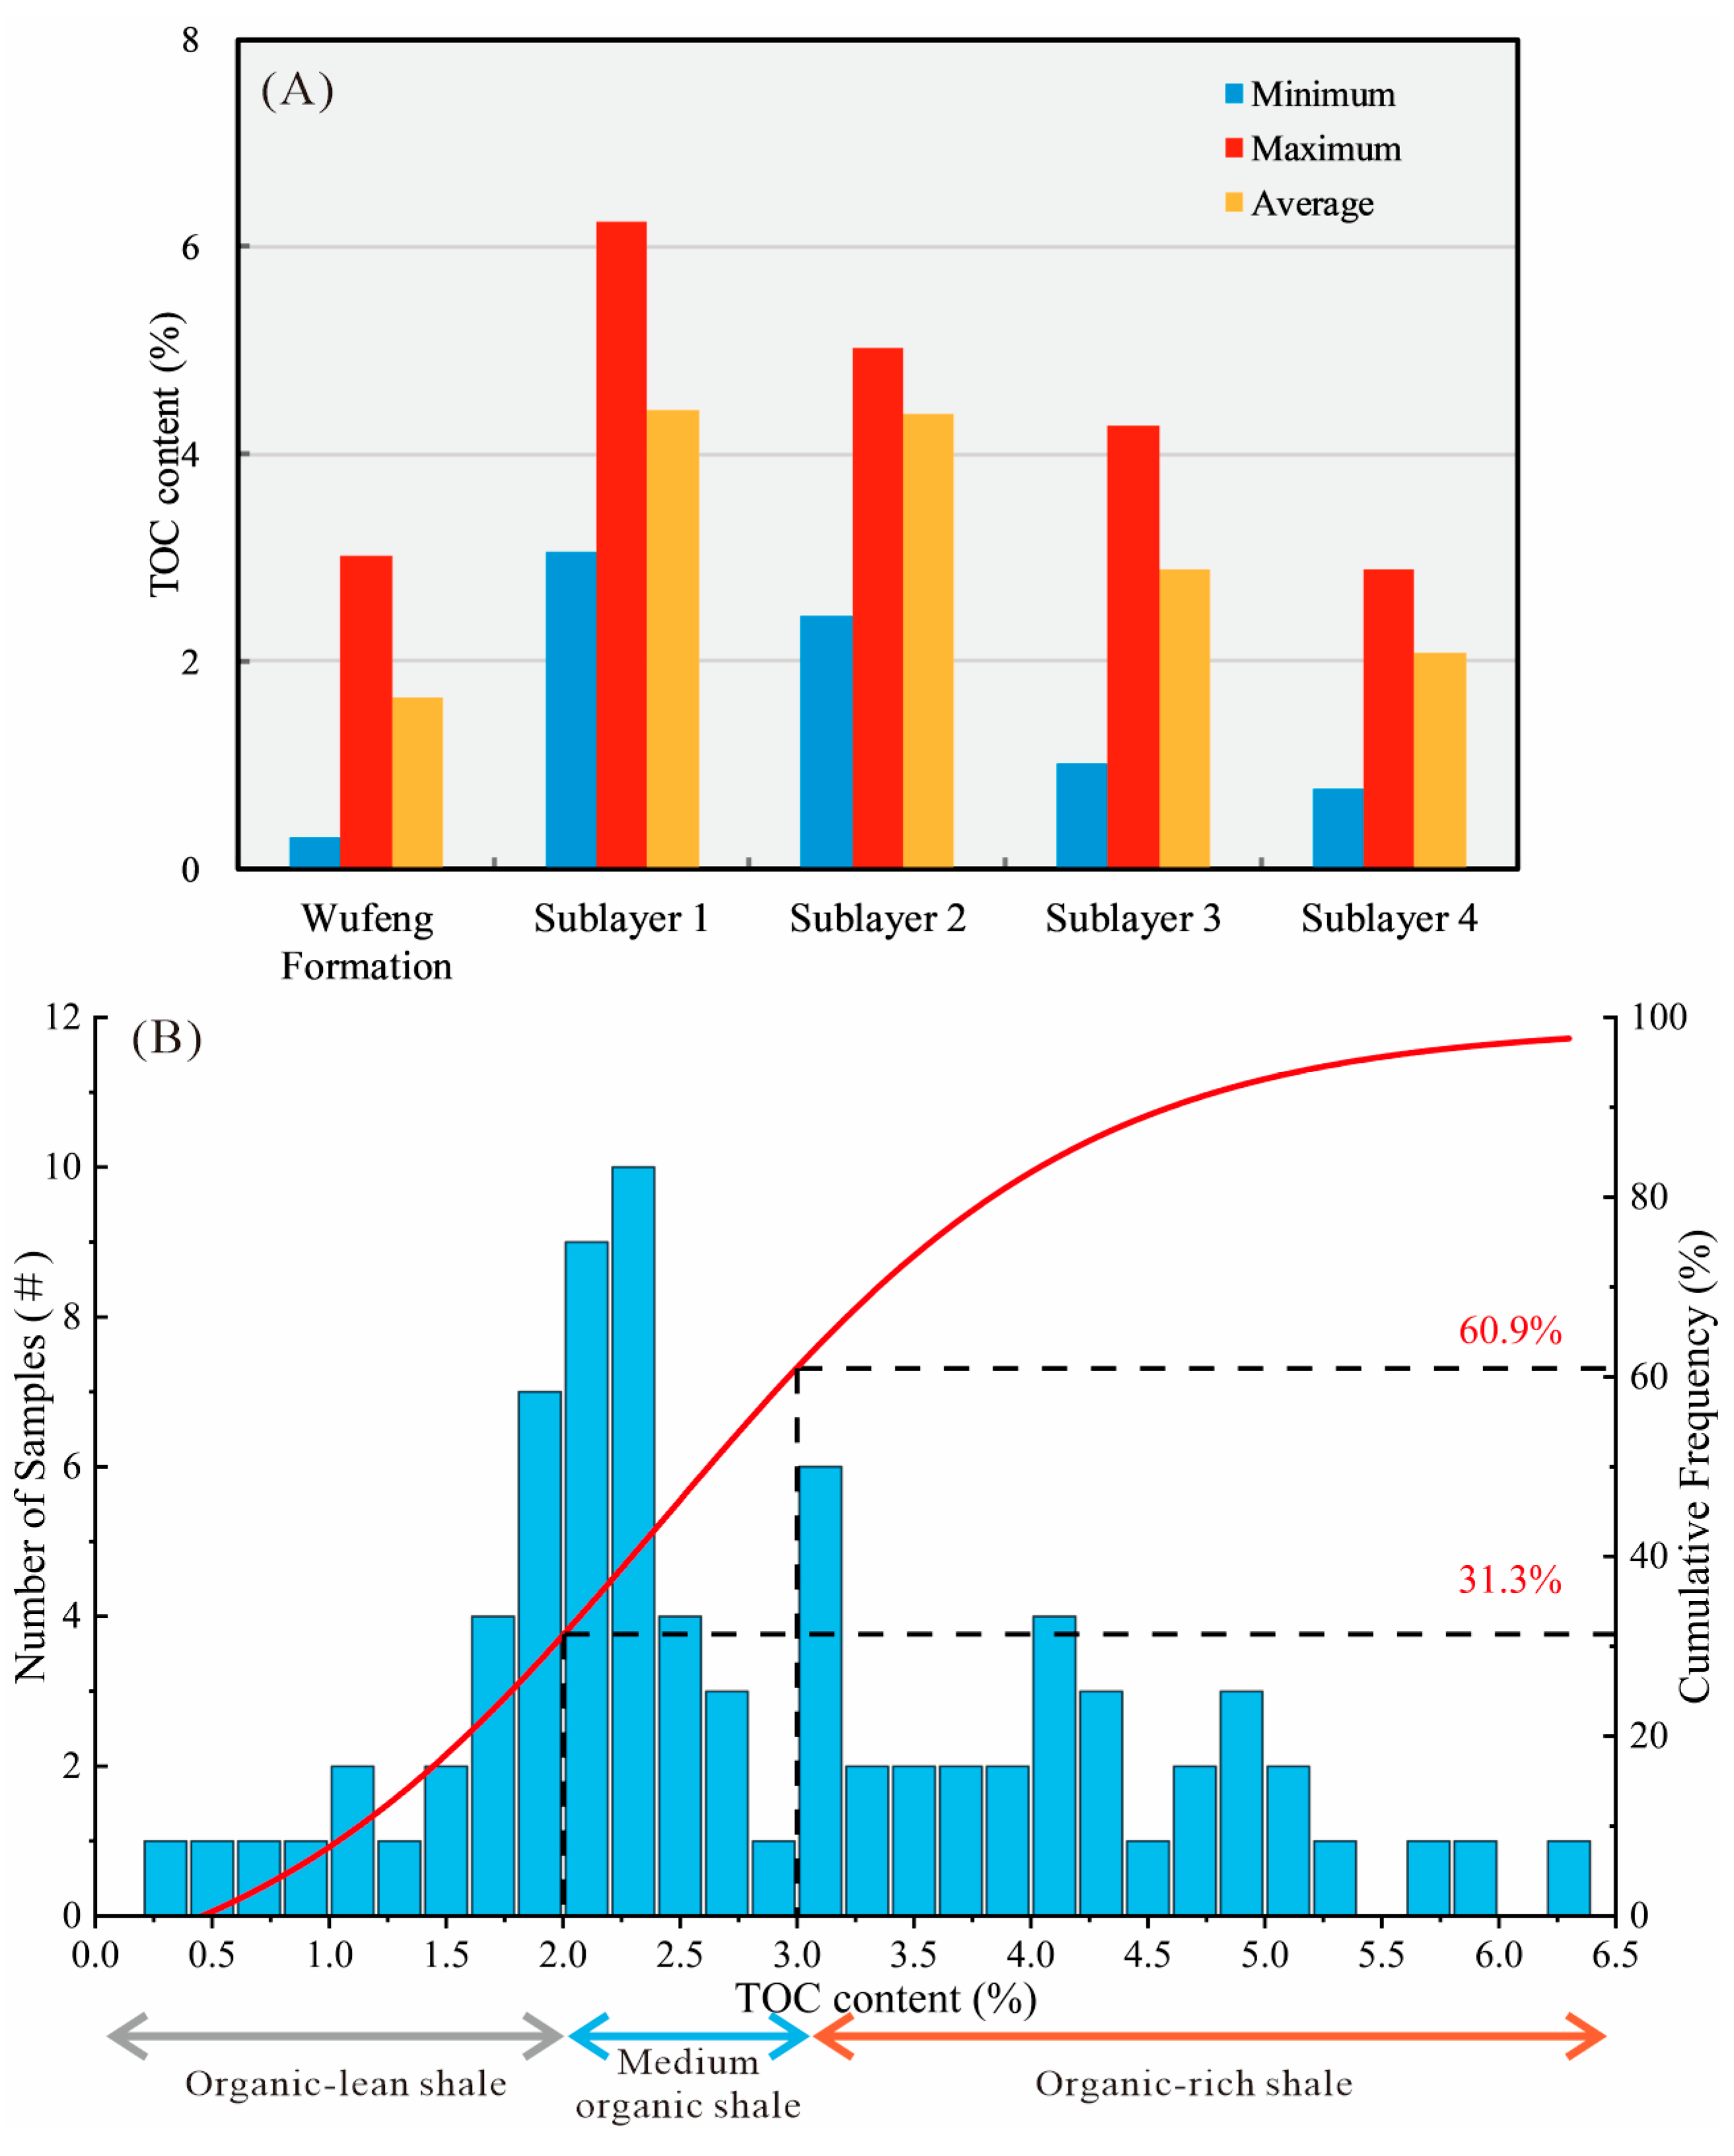
4.1.1. Geochemical Characteristics

The geochemical experimental data indicate that the organic matter type and maturity of the Upper Ordovician Wufeng Formation and lower Silurian Longyi1 submember in the western Chongqing area exhibit little variation overall, while the TOC content varies more markedly among the different sublayers (Table 1).
Kerogen microscopic identification analysis reveal that the microscopic components of the organic matter are dominated by amorphous sapropelinite, with contents ranging from 94% to 99% and an average of 96.7% (Table 1). In addition to sapropelinite, the samples contain small amounts of vitrinite, with contents ranging from 0% to 6% and an average of 3.2% (Table 1). The kerogen type index (TI) ranges from 89.5 to 98.3, with an average of 94.2, indicating Type I kerogen (Table 1), and the parent material source was mainly algae. Although the burial depth of the Wufeng Formation–Longyi1 submember in the western Chongqing area is characterized by deep burial in the north and shallow burial in the south, the bitumen-equivalent vitrinite reflectance ERo of organic matter maturity shows slight variation [43], with ERo values ranging from 2.13% to 2.49%, with an average of 2.38% (Table 1), indicating that all samples have reached the overmature stage. This suggests that, during the deep burial process of the shale reservoirs in the study area, the crude oil initially generated from kerogen has undergone thermal cracking, transitioning into the dry gas stage and resulting in significant gas generation [44]. The TOC distribution exhibits significant variations among sublayers (Figure 3A), primarily controlled by sedimentary environment differences [45]. Enhanced productivity of siliceous organisms during the late Wufeng to early Longyi1 submember global warming period, combined with excellent preservation conditions in deep-water environments [32], resulted in high TOC content at the Wufeng Formation top and Sublayer 1 (Figure 2B). In the late Longyi1 submember deposition stage, water depth reduction and transition to a shallow-water shelf environment led to TOC content decrease.
Some scholars have set the lower limit of the TOC content in the Longmaxi Formation shale in the Sichuan Basin at 1.0% [46], and the lower limit for the TOC of effective shale established by North American petroleum geologists is 2.0% [15]. In the deep shale samples from the Wufeng Formation–Longyi1 submember in the western Chongqing area, the TOC content ranging from 0.30% to 6.23%, averaging 2.87%. Notably, the TOC content at the top of the Wufeng Formation and in Sublayer 1 and Sublayer 2 is significantly higher than this lower limit in all samples, indicating good exploration potential.
However, due to the significant differences in the geochemical characteristics of shale in different regions and layers, scholars have proposed numerous classification and evaluation schemes for the TOC content in shale gas reservoirs [46,47,48]. These methods mainly rely on empirical division, which is highly subjective and has limited regional applicability. Currently, there is still a lack of applicable TOC content classification and evaluation schemes for the deep-marine shale in the western Chongqing area. Therefore, based on the TOC distribution characteristics of deep-marine shale samples in the western Chongqing area, IBM SPSS Statistics software (Version 24) was used to conduct a three-quartile statistical analysis [49]. Based on the results of the first quartile of Q1 = 2.04% and the second quartile of Q2 = 3.1%, and combined with previous studies on the TOC content characteristics of the Wufeng Formation–Longmaxi Formation shale in the Sichuan Basin, a classification evaluation scheme for the TOC content in the western Chongqing area was established. That is, a TOC content < 2% indicates organic-lean shale, a TOC content between 2% and 3% indicates medium-organic shale, and a TOC content > 3% indicates organic-rich shale, with corresponding proportions of 31.3%, 29.6%, and 39.1%, respectively, among all samples investigated here (Figure 3B).

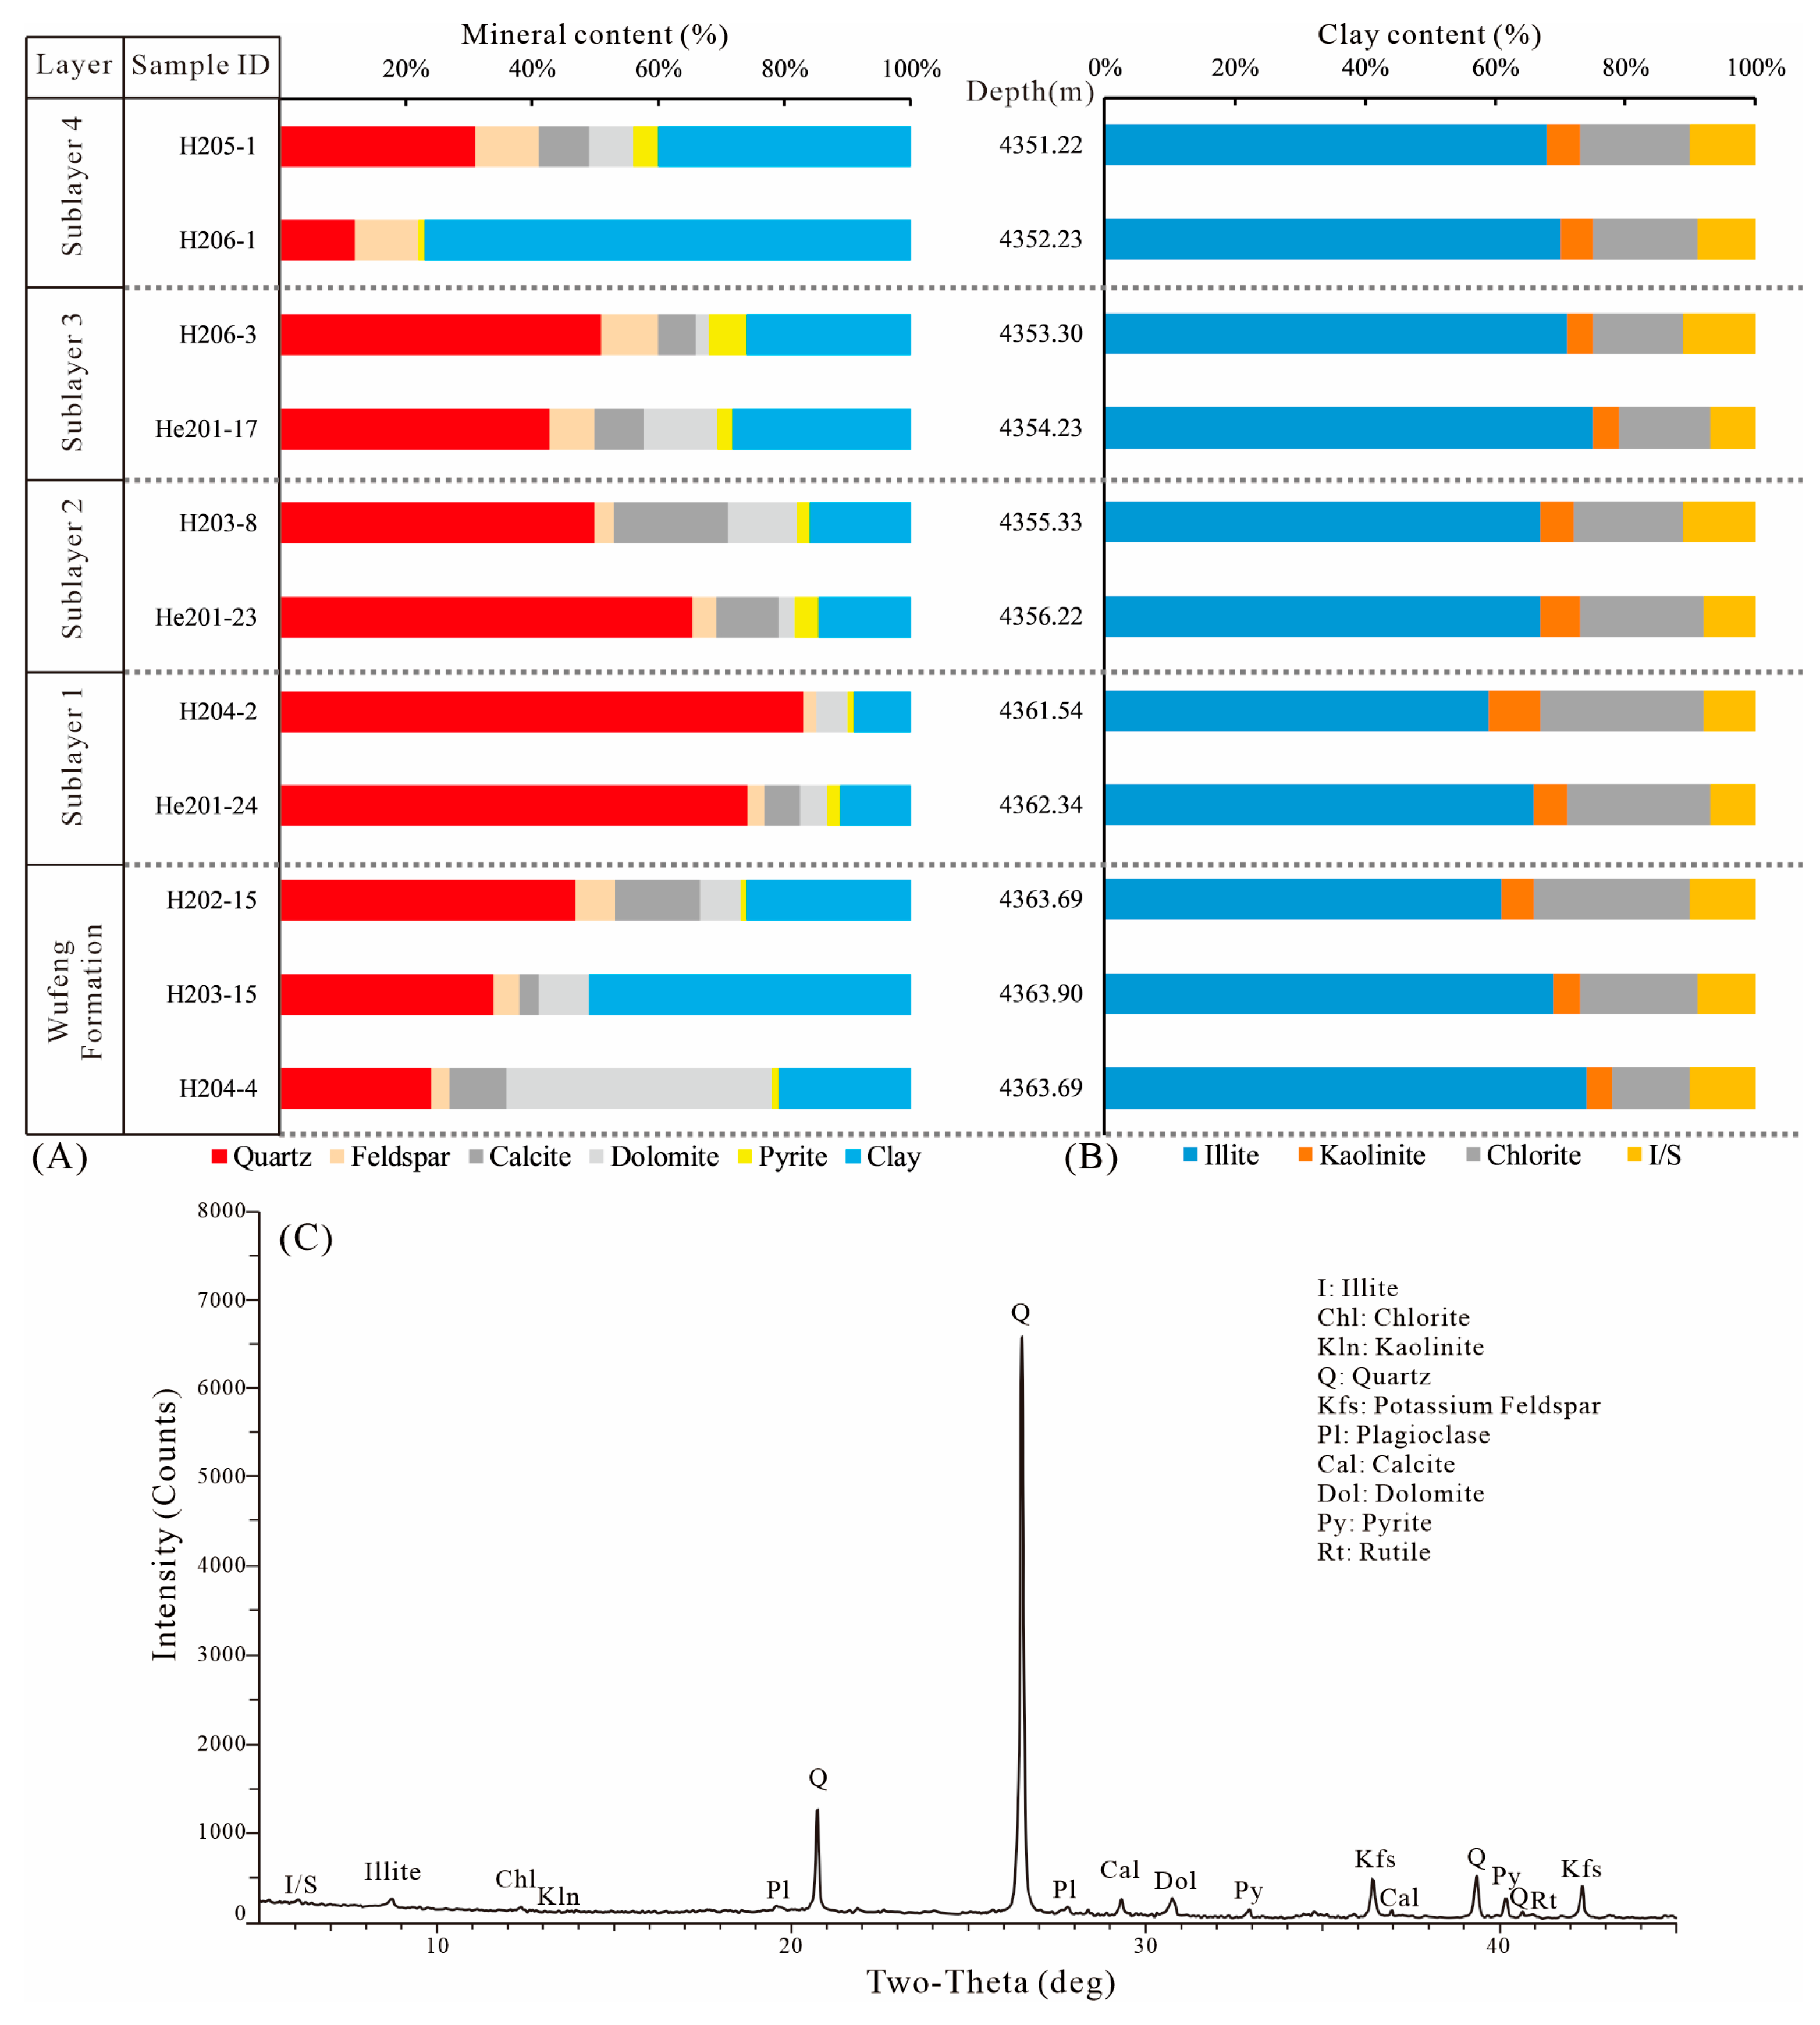
4.1.2. Characteristics of the Mineral Compositions

XRD data show that deep-marine shale minerals are mainly composed of felsic minerals such as quartz, K-feldspar, and plagioclase; carbonate minerals such as calcite and dolomite; clay minerals such as illite, kaolinite, chlorite, and mixed-layer illite/smectite (I/S); and other minerals such as rutile and pyrite (Figure 4C). Owing to the low content of rutile and K-feldspar, only a few samples contain 1% to 3% of these minerals. Therefore, in this study, rutile was ignored, K-feldspar and plagioclase were merged into feldspar, and the main mineral content was normalized to calculate the relative percentage content of each main mineral.
The mineral composition exhibits pronounced vertical variations across different sublayers. In the Wufeng Formation, quartz content is relatively low at the bottom but shows an upward-increasing trend. The highest quartz abundance occurs in Sublayer 1 of the Longyi1 submember, above which quartz gradually decreases while feldspar content slightly increases. This distribution pattern is due to the global warming from the late Wufeng to early Longyi1 submember periods, which enhanced the productivity of siliceous organisms. In addition, the deep-water shelf depositional environment and reduced terrestrial inputs jointly promoted the large-scale preservation of biogenic silica [50]. Initially, biogenic silica was preserved in sediments as opal-A. During deep burial diagenesis, increasing temperature and pressure triggered the opal-A → opal-CT → microcrystalline quartz transformation, ultimately forming dense, high-hardness aggregates of microcrystalline quartz [51]. Given the deep burial and overmature thermal conditions (ERo > 2.0%) of the study area, silica predominantly exists as microcrystalline quartz. Notably, feldspar content remains low throughout the sequence (<10%), which results from both depositional and diagenetic factors [52]. The shallow- to deep-water shelf environment received limited terrigenous input, restricting initial feldspar supply. Furthermore, advanced thermal maturity promoted extensive feldspar alteration, with conversion to clay minerals (primarily illite) and authigenic quartz [50].
In general, deep-marine shale mineral compositions within each sublayer of the Wufeng Formation–Longyi1 submember vary only slightly in the study area, but there are differences between each sublayer. As shown in Figure 4A, quartz content displays a distinct stratigraphic distribution, reaching its maximum concentration in Sublayer 1 and decreasing both upward and downward. The clay minerals are dominated by illite, followed by chlorite, with minor amounts of kaolinite and I/S (Figure 4B). This mineralogical composition indicates deposition in a stable environment with limited terrigenous input, followed by advanced diagenesis under thermal conditions, as shown by the illite predominance and lack of smectite-rich phases [52].

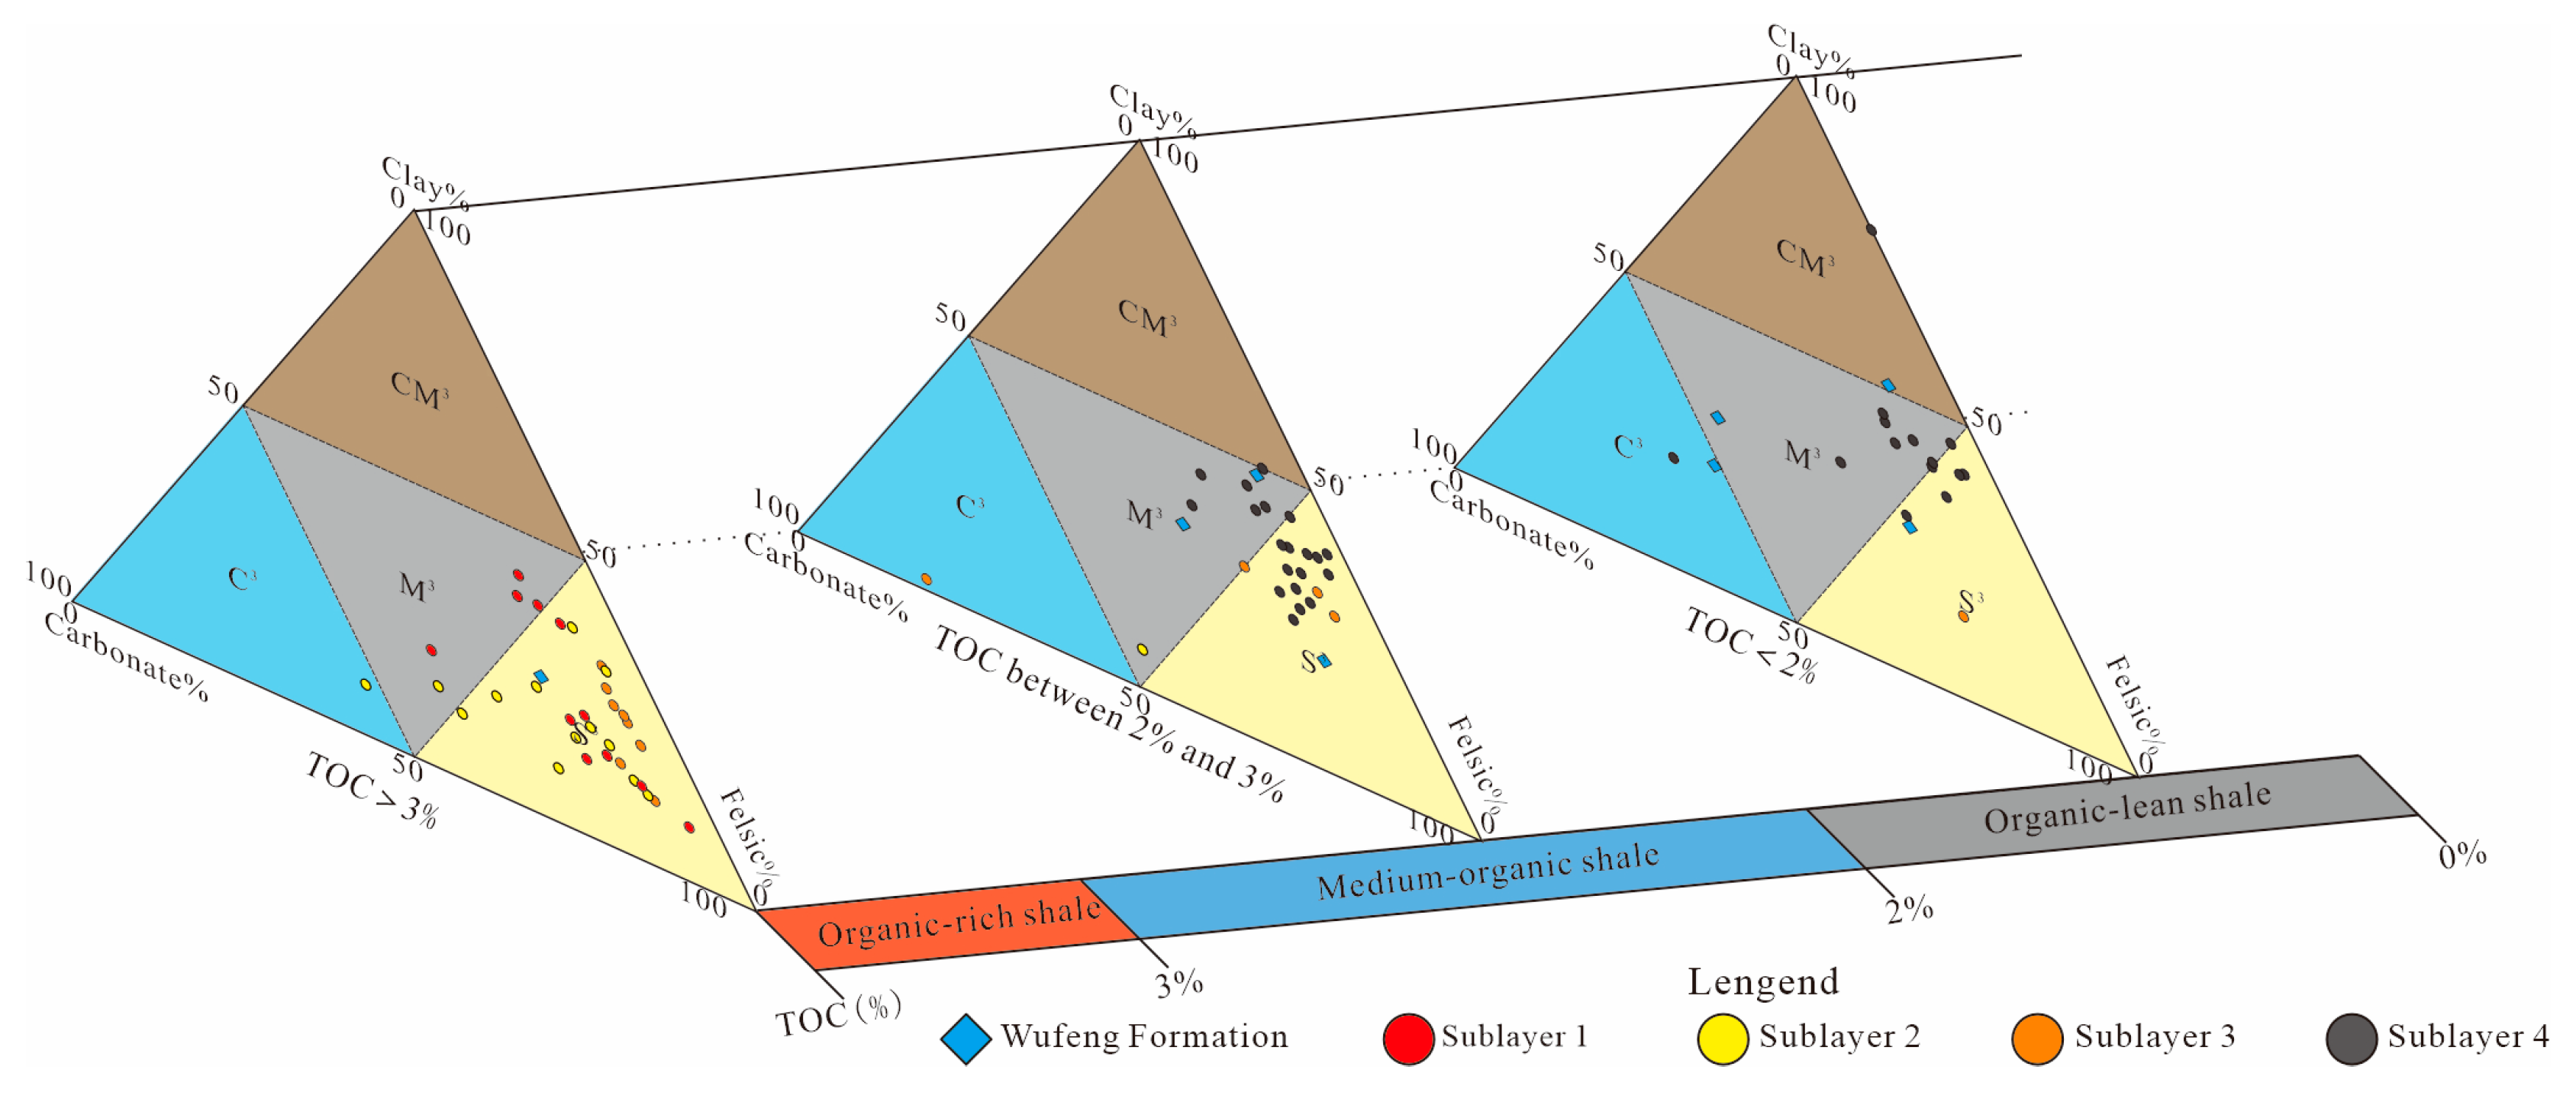
4.2. Classification Scheme and Lithofacies Types

4.2.1. Lithofacies Classification Scheme

Previous studies demonstrate the TOC content in marine shale is a key parameter affecting the hydrocarbon generation capacity of shale gas reservoirs [26,44], while mineral composition significantly influences fracability [20]. In this study, the lithofacies classification criteria are primarily based on TOC content and mineral composition, as these parameters are the most critical factors controlling gas generation capacity and reservoir fracability in deep-marine shale. Although stratification structure can reflect sedimentary environments [29], it was not included in the classification scheme due to its subjectivity in qualitative observation. Based on the geochemical and mineral composition characteristics of shale samples, we adopted a composite lithofacies classification method that incorporates the TOC content and mineral composition to classify the deep-marine shale lithofacies of the Wufeng Formation–Longyi1 submember in the western Chongqing area.
The TOC content was classified according to the Classification and Evaluation Scheme for TOC Content in the western Chongqing area. Due to the small size of the study area, the straight-line distance between the farthest two wells (well R203 and well H206) is less than 70 km. The sedimentary facies of the Wufeng Formation–Longyi1 submember in the research area are all deep-water shelf facies, and the mineral composition differences are not significant. Therefore, considering the practicality and operability of the mineral composition classification scheme, four types of lithofacies were classified based on the ternary diagram. The specific classification scheme is as follows:
First, three types of shale were classified using the Classification and Evaluation Scheme for TOC Content in the western Chongqing area, namely, a TOC content > 3% corresponded to organic-rich shale, a TOC content between 2% and 3% corresponded to medium-organic shale, and a TOC content < 2% corresponded to organic-lean shale. Second, felsic minerals (quartz and feldspar), carbonate minerals (calcite and dolomite), and clay minerals were used as the three terminal elements for graphical analysis. Based on 50% as the classification standard, four types of shale lithofacies were classified: siliceous shale lithofacies, calcareous shale lithofacies, clay shale lithofacies, and mixed shale lithofacies. Therefore, the composite lithofacies classification method that incorporates the TOC content and mineral composition distinguishes a total of 12 lithofacies (Figure 5).

4.2.2. Lithofacies Types

The results of the TOC content classification show that organic-rich shale, medium-organic shale, and organic-lean shale are present in the western Chongqing area, with differences between each sublayer. The Wufeng Formation mainly features organic-lean shale, followed by medium-organic shale, while organic-rich shale is less common. All samples from Sublayer 1 are organic-rich shale. The vast majority of samples from Sublayer 2 are organic-rich shale, with rare medium-organic shale and no organic-lean shale development. Sublayer 3 mainly consists of organic-rich shale, followed by medium-organic shale, with less organic-lean shale. Sublayer 4 mainly consists of medium-organic shale, followed by organic-lean shale, with no organic-rich shale development (Figure 6).
The results of the composite lithofacies classification method that incorporates TOC content and mineral composition (Figure 5) indicate that a total of 10 shale lithofacies developed in the Wufeng Formation–Longyi1 submember in the research area, namely, organic-rich siliceous shale (S1), organic-rich calcareous shale (C1), organic-rich mixed shale (M1), medium-organic siliceous shale (S2), medium-organic calcareous shale (C2), medium-organic mixed shale (M2), organic-lean siliceous shale (S3), organic-lean calcareous shale (C3), organic-lean clay shale (CM3), and organic-lean mixed shale (M3). Among them, most samples of organic-rich shale are S1, followed by M1, and only one sample of Sublayer 2 is C1; most samples of medium-organic shale are S2, followed by M2, and only one sample of Sublayer 3 is C2; most samples of organic-lean shale are S3, followed by M3. Only a small number of samples from the Wufeng Formation and Sublayer 4 are from C3 and CM3. Overall, the study area mainly features the following six types of shale lithofacies: organic-rich siliceous shale (S1), organic-rich mixed shale (M1), medium-organic siliceous shale (S2), medium-organic mixed shale (M2), organic-lean siliceous shale (S3), and organic-lean mixed shale (M3).
The TOC and mineral composition characteristics of the main lithofacies are shown in Table 2. S1 occurs mainly at the top of the Wufeng Formation and Sublayer 1, with a small amount of development in Sublayer 2. It is characterized by both high contents of felsic mineral (more than 50%) and TOC (higher than 3%) (Table 2), and the core is black and dark gray shale with developed laminations and abundant and well-preserved graptolites (Figure 7A). Under the microscope, S1 is mainly composed of mud and felsic grains, and individual spicules can be seen. The clastic particles are suspended in the mud and show a directional arrangement (Figure 7B), which indicates a relatively weak hydrodynamic environment; M1 is found mainly in Sublayer 1 and Sublayer 2. In terms of mineral composition, the average silica, carbonate, and clay mineral contents are all less than 50% (Table 2), and the core is composed of dark gray and black shale with well-developed laminations, pyrite patches, and incompletely preserved graptolites (Figure 7C). Under the microscope, M1 is mainly composed of mud, fewer carbonate particles and felsic grains, and fewer fossils than S1 can be observed. Massive and faint laminations are the dominant sedimentary structures in this lithofacies (Figure 7D); S2 occurs mainly in the Wufeng Formation and Sublayer 3, with a small amount of development in Sublayer 4. It is typical for its high felsic mineral content (more than 50%) and medium TOC content (ranging from 2% to 2.52%) (Table 2). This rock is dark gray shale with developed laminations. There are few pyrite particles at the lamination boundaries, and the graptolite species are few and not well preserved (Figure 7E). Under the microscope, S2 has similar characteristics to S1 but with larger grain sizes (Figure 7F). M2 is found mainly in the Wufeng Formation and Sublayer 2, with a small amount of development in Sublayer 4. In terms of the mineral and TOC contents, the average silica, carbonate, and clay mineral contents were all less than 50%, with a moderate TOC content (ranging from 2% to 2.88%) (Table 2). This rock is black gray shale with a massive structure and unclear laminations intercalated with silty muddy strips. Scattered pyrite particles are visible on the surface, with few graptolites (Figure 7G). Under the microscope, M2 has larger grain sizes than M1, also showing massive and faint lamination structures (Figure 7H). S3 occurs mainly at the bottom of the Wufeng Formation and from Sublayer 3 to Sublayer 4. It is typical for its high content of felsic minerals (more than 50%) and low TOC content (less than 2%) (Table 2). This rock is gray shale with unclear laminations, occasionally showing pyrite phenocrysts, silty strips, and sandy nodules (Figure 7I). Under the microscope, silty homogeneous particles and radiolarians can be observed (Figure 7J). M3 is found mainly in the Wufeng Formation and Sublayer 4. It is characterized by mixed mineral contents (all below 50%) and low TOC contents (less than 2%) (Table 2). Core observations show that M3 is mainly characterized by a massive structure with a gray color (Figure 7K). Under the microscope, the main body of M3 is mud, and the clastic grains have a faint directional arrangement and are significantly larger than those observed in other layers (Figure 7L), indicating a strong hydrodynamic depositional environment.
The overall relationship between TOC content and clay content demonstrates a negative and reversible trend (Table 2), implying that an increase in clay mineral content dilutes organic matter, thereby hindering its enrichment [29]. In the M3, the higher clay mineral content, combined with stronger hydrodynamic conditions, results in the dilution and oxidative degradation of organic matter, ultimately leading to lower TOC content.

4.3. Reservoir Spatial Characteristics

The microscopic characteristics of the shale pores within the Wufeng Formation–Longyi1 submember in the western Chongqing area were analyzed via FE-SEM and argon ion beam polished SEM (Figure 8). Following the shale pore classification scheme proposed by researchers [16,23,26], three main types of pores were identified in deep-marine shale reservoirs: organic pores, inorganic pores, and microfractures. Based on polished SEM images, the surface porosity of both inorganic and organic pores in different shale lithofacies was quantified using ImageJ software (Version 1.54f) (Figure 9A,B). The pores were mainly observed at the nanoscale, with notable variations in surface porosity among the various shale lithofacies (Figure 9C).

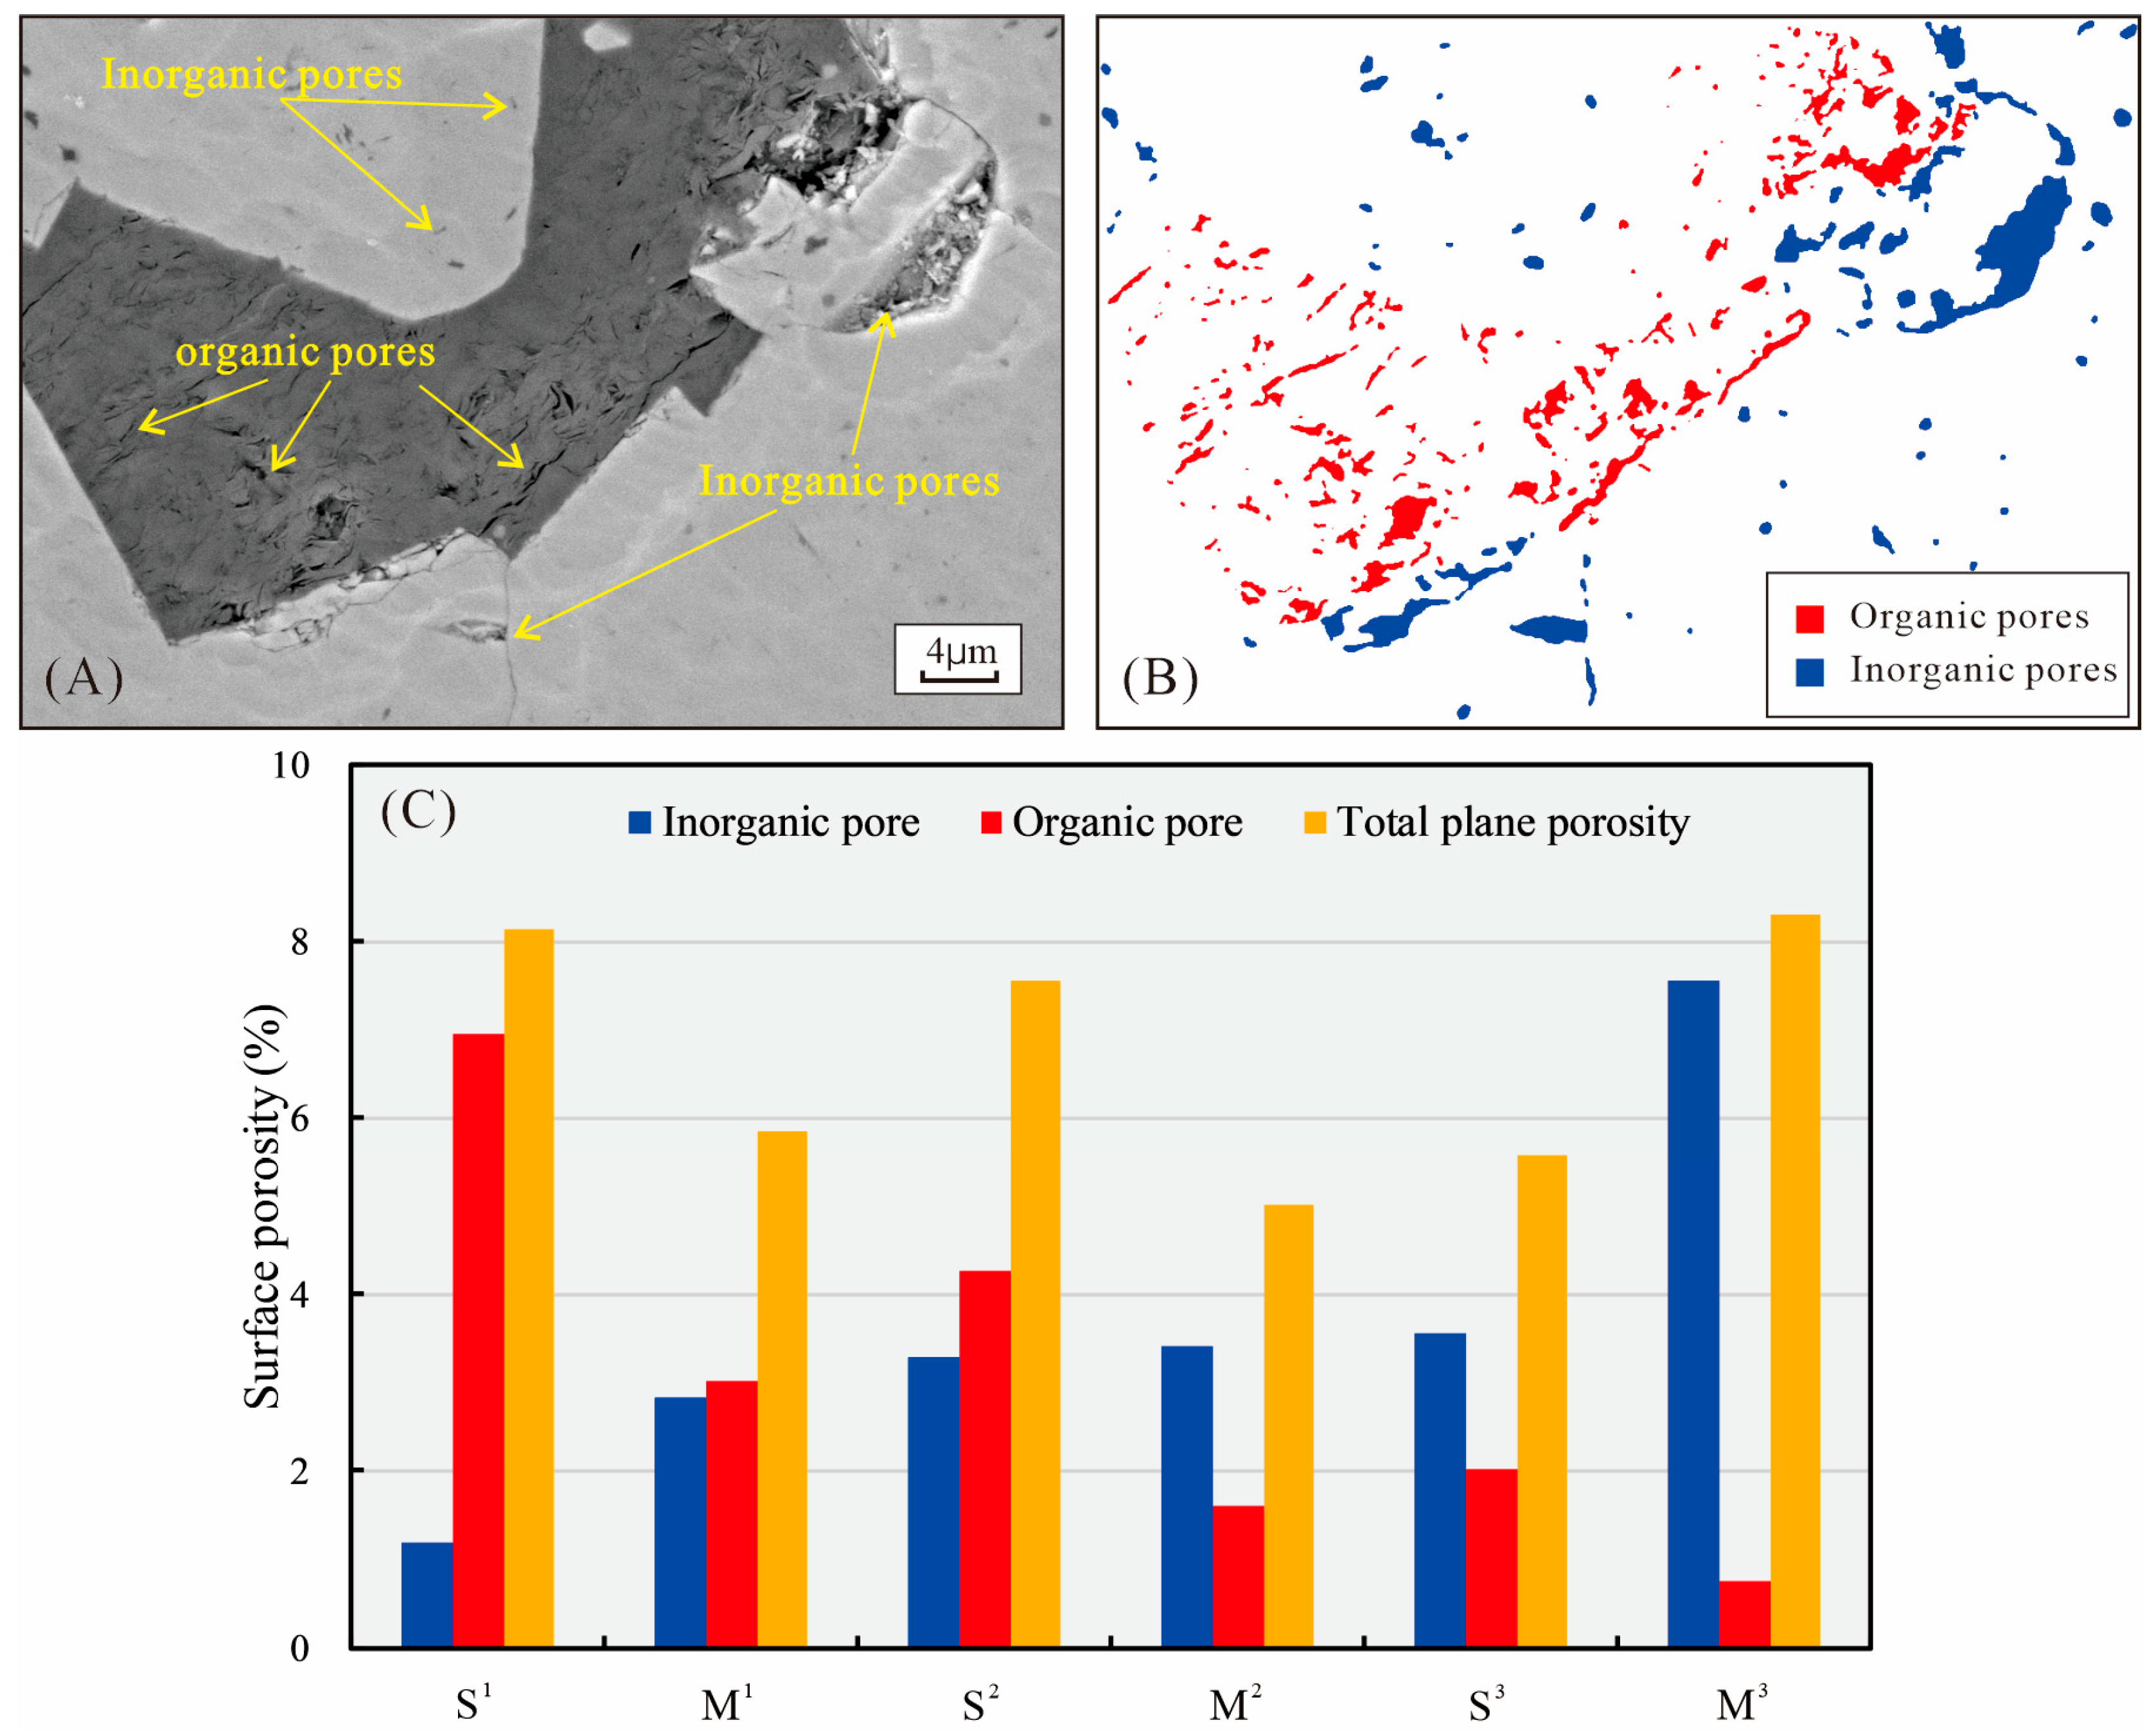
4.3.1. Organic Pores

Organic pores are of great significance in marine shale gas reservoirs because they are the main reservoir space for shale gas storage and the key factor for shale gas enrichment and stable production [26,27,53].
The shale lithofacies and microscopic organic matter types in the study area control the development of organic pores. S1 has the most developed organic pores (Figure 9C), which mainly developed inside the migrated organic matter associated with clay minerals and strawberry-shaped pyrite. The organic pores are mainly circular and nearly circular (Figure 8A), with pore diameters ranging from 10 nm to 800 nm, mainly nanoscale pores, and the pores were predominantly produced during the process of maturation and gas generation of the organic components in shale. However, the organic pores inside the strip-shaped organic matter in S1 are almost nonexistent (Figure 8B,G). The massive organic matter in S2 developed a small number of organic pores with a nearly circular pore morphology (Figure 8E). The migrated organic matter in S2 grew interactively with clay minerals and are thus mainly distributed in the intergranular pores between rigid mineral particles, with slit-like and floccular pore morphologies, and shrinkage fractures developed at the edges or inside of the organic matter (Figure 8D). The organic-lean shale (including S3 and M3) has less organic matter, irregular organic matter is sporadically distributed in the clay mineral interlaminar pores and the intergranular pores of strawberry-shaped pyrite, and organic pores are not developed (Figure 8H,I).

4.3.2. Inorganic Pores

The inorganic pores of deep-marine shale reservoirs in the study area are mainly divided into intergranular and intragranular pores. Intergranular pores are more common in siliceous shales and are commonly found between rigid mineral particles such as quartz, feldspar, and pyrite (Figure 8D). Clay mineral interlaminar pores are the main inorganic pore type in deep-marine shale reservoirs in the western Chongqing area. Due to the impact of compaction during diagenesis, clay mineral interlaminar pores have directional distribution characteristics (Figure 8C,I). Because these pores were formed between clay mineral interlayers, mixed shale lithofacies exhibit a higher development of clay mineral interlaminar pores compared to siliceous shale lithofacies with similar TOC content, resulting in a higher inorganic surface porosity (Figure 9C). The FE-SEM observations show that the clay mineral interlaminar pores in M3 are the most developed, followed by those in M2, which are mainly developed between the interlamellar layers of clay mineral aggregates such as illite and chlorite in the form of elongated or slit-like pores with widths ranging from 50 nm–1 μm (Figure 8C,F,H,I). The intragranular pores are mainly dissolution pores, which are mainly isolated and distributed in quartz, dolomite, calcite, or feldspar, with nearly circular and elliptical shapes. The pore size ranges from 100–500 nm (Figure 8D), which may be caused by organic matter acid discharge and the dissolution of mineral particles during hydrocarbon generation [32].

4.3.3. Microfractures

Microfractures are conducive to shale gas accumulation and migration and are important reservoir storage spaces and migration channels for shale gas [54]. Nanoscale to microscale microfractures are developed in deep-marine shale in the western Chongqing area and can be divided into structural fractures and shrinkage fractures. The structural fractures are wavy and microtoothed shapes, with lengths of 1–40 μm and openings of 50–500 nm (Figure 8B,D,I). Shrinkage fractures developed inside organic matter or at the contact edge between organic matter and mineral particles and were formed by the volume contraction of organic matter during hydrocarbon generation and expulsion (Figure 8D).
Overall, S1, S2, and M3 all exhibit relatively high surface porosity (Figure 9C). Among them, S1 and S2 are dominated by organic pores, with the development of organic shrinkage fractures, while inorganic pores are relatively scarce and consist primarily of intergranular pores. In contrast, M3 contains a large number of inorganic pores, mainly clay mineral interlaminar pores, while organic pores are almost undeveloped.

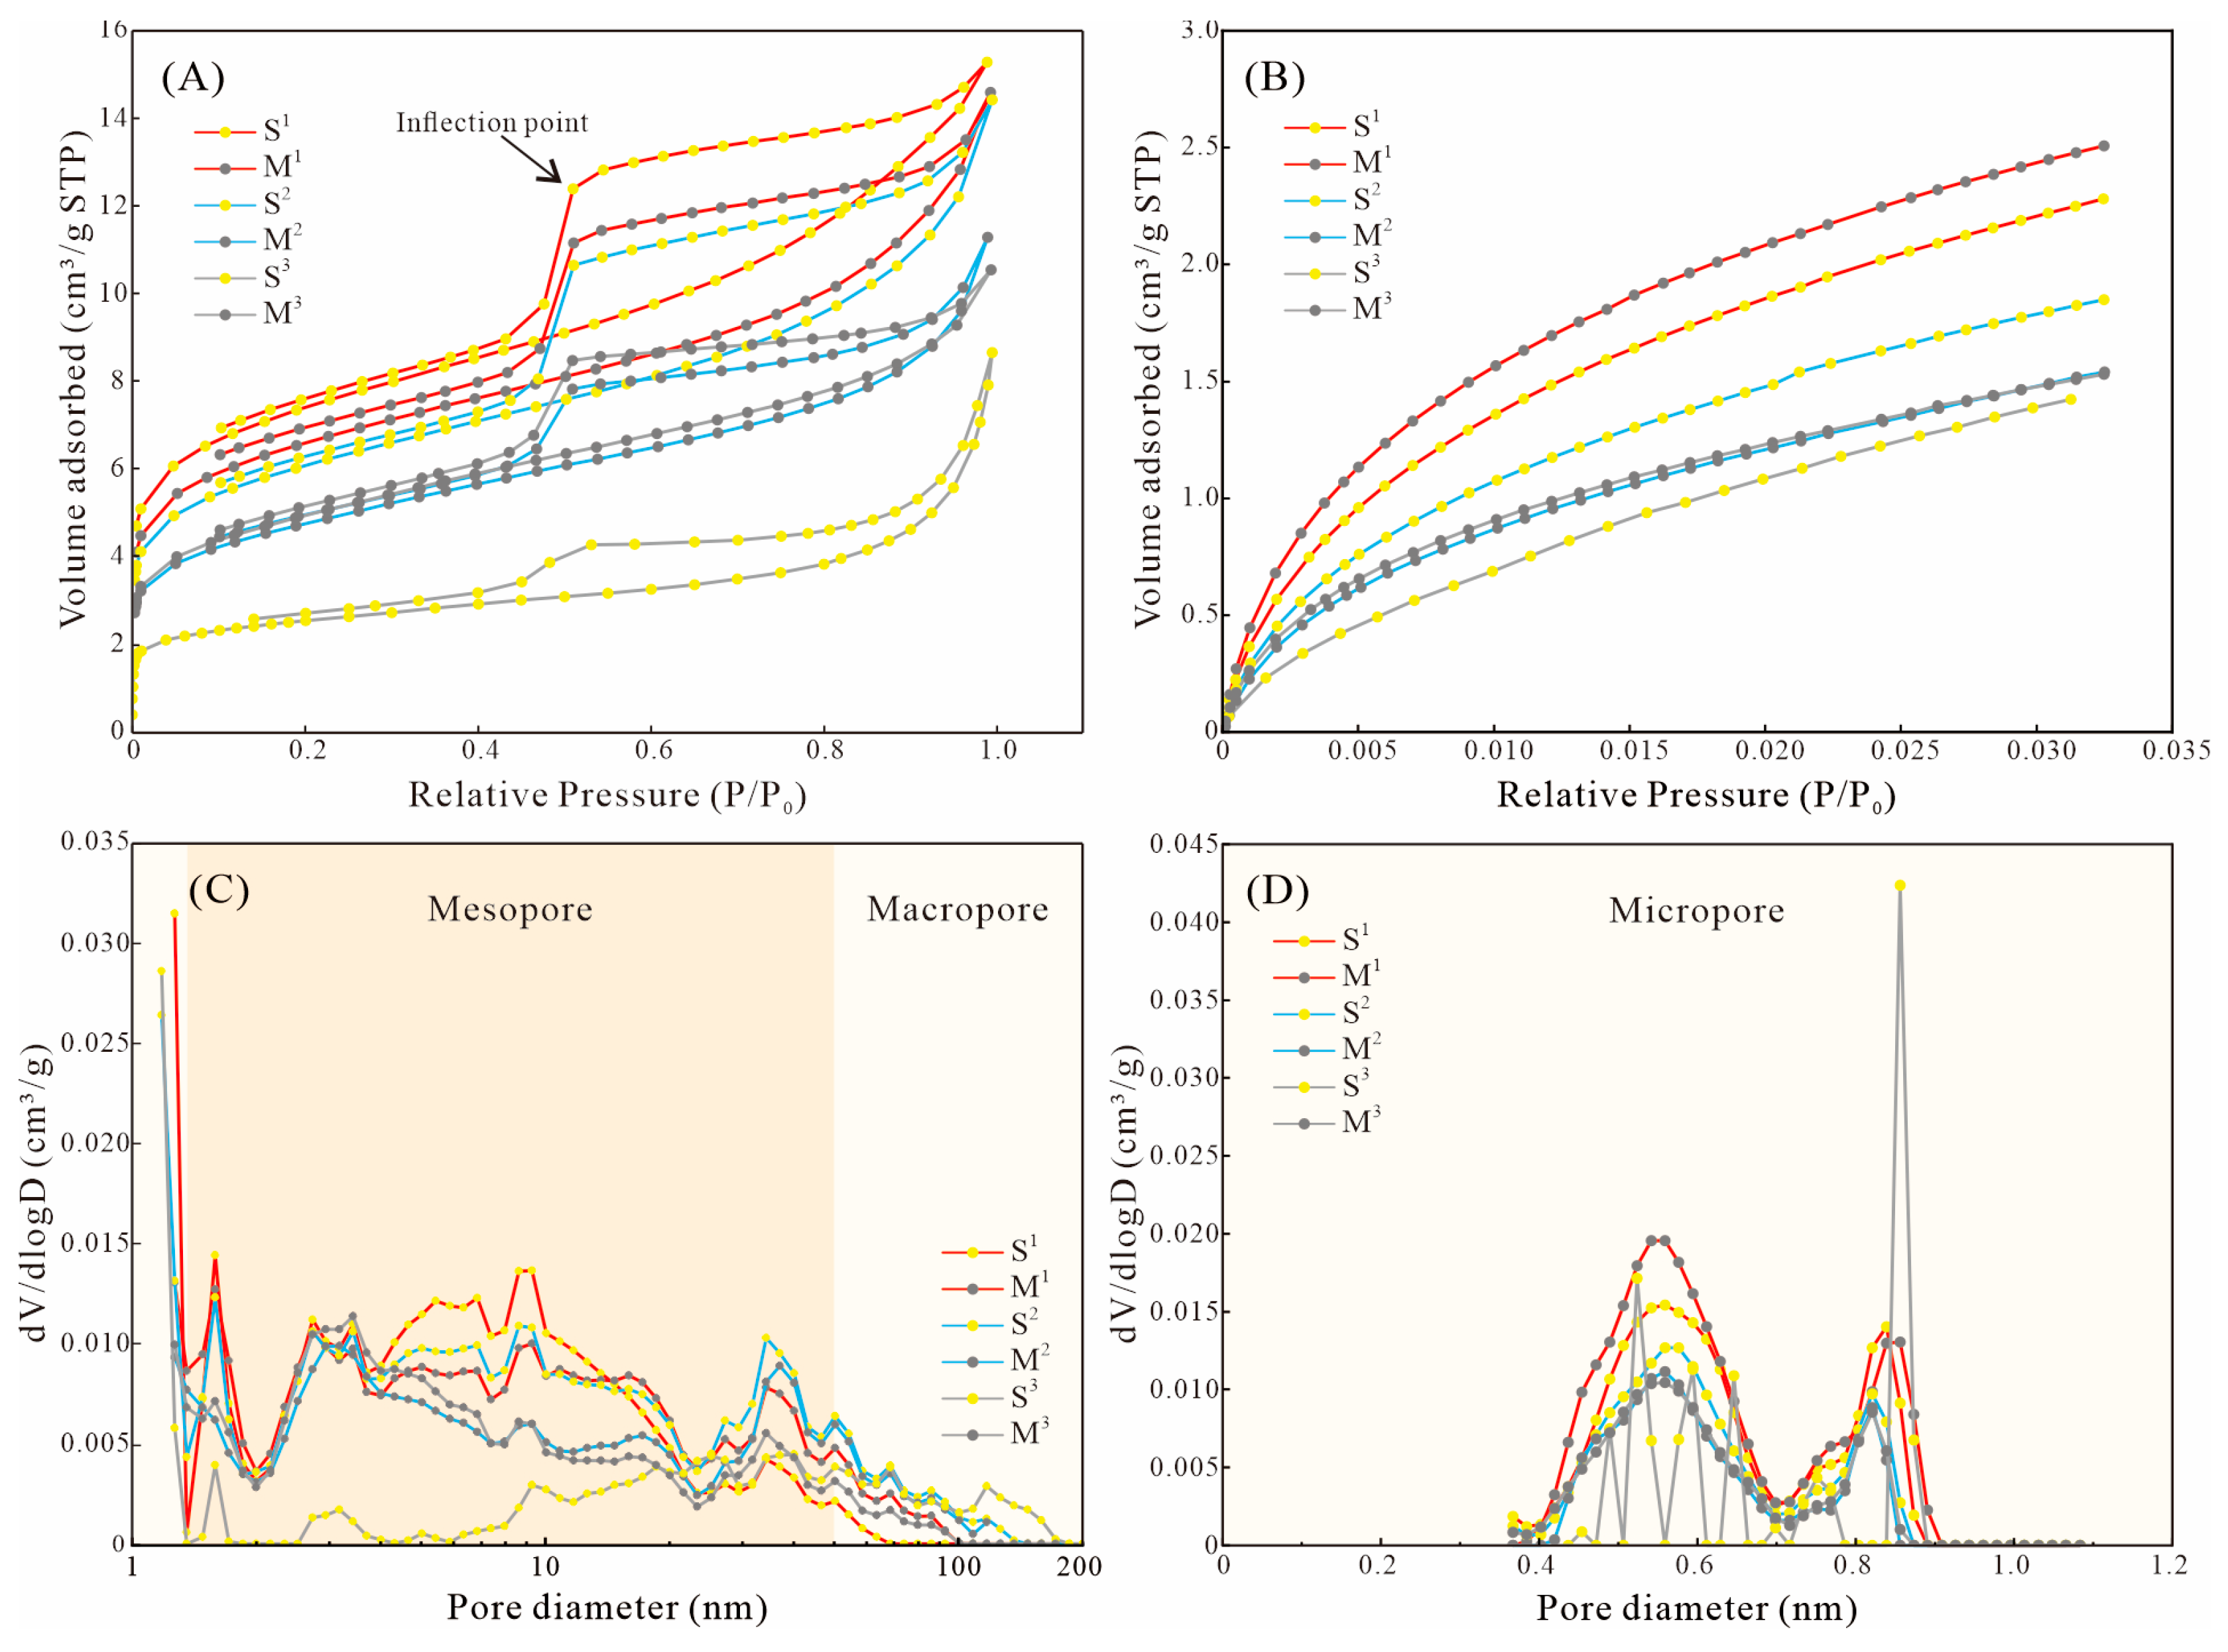
4.4. Low-Pressure N2 and CO2 Adsorption Experiments

4.4.1. Low-Pressure N2 and CO2 Adsorption Isotherms

Shale gas is mainly enriched in micropores and smaller mesopores [35,38], and the low-pressure N2 and CO2 adsorption technique can be used to quantitatively analyze pores with diameters less than 100 nm. Specifically, N2 adsorption is particularly effective for characterizing a limited range of micropores (1.5–2 nm), mesopores (2–50 nm), and some macropores (50–100 nm) [35,36], whereas CO2 adsorption is widely utilized for analyzing micropores (<1.5 nm) in shale samples [38,55,56].
The N2 adsorption–desorption isotherms of the main lithofacies of the Wufeng Formation–Longyi1 submember in the western Chongqing area have similar shapes. The curve pattern is a three-segmented feature with a reversed S-shaped characteristic (Figure 10A). According to the classification scheme of the IUPAC [42], the N2 adsorption isothermal curve hysteresis loops of deep-marine shale samples show H3 or H2 characteristics. The adsorption–desorption isotherms begin to separate at a relative pressure (p/p0) of approximately 0.45–0.48, forming a clear hysteresis loop. At a relative pressure (p/p0) of approximately 0.50, the desorption curve shows a clear inflection point where the adsorption amount decreases significantly (Figure 10A). This behavior indicates that the pore structures are primarily composed of cylindrical pores, slit pores, wedge-shaped pores, and ink-bottle-shaped pores [40,57]. Meanwhile, the CO2 adsorption isotherms of deep-marine shale samples conform to a typical Type I adsorption isotherm, indicating the presence of micropores in these samples (Figure 10B) [38].
The shale lithofacies influences the N2 adsorption curve morphology (Figure 10A). S1 exhibits a high adsorption capacity, with a clear H3 hysteresis loop and a large hysteresis loop area, indicating that the pores in S1 consist mainly of open-ended cylindrical pores and parallel slit-shaped pores. In contrast, S3 and M3 have a low adsorption capacity, with the hysteresis loop transitioning from H3 to H2 and a small hysteresis loop area, indicating that the pores of the samples mainly consist of ink-bottle-shaped pores, wedge-shaped pores, and parallel slit-shaped capillary pores. This suggests that the organic-lean shale samples contain more clay mineral interlaminar pores, which is in line with the results of the SEM observations.
The low-pressure N2 and CO2 adsorption isotherms reveal that the nanometer pores in the deep-marine shale reservoirs of the Wufeng Formation–Longyi1 submember in the western Chongqing area are distributed from micropores to macropores. The pore morphologies are dominated by an intricate combination of slit pores, wedge-shaped pores, ink-bottle-shaped pores, cylindrical pores, and parallel slit-shaped pores, reflecting the heterogeneity of these reservoirs [38,40,57].

4.4.2. Pore Diameter Distribution

The pore diameter distributions of the different shale lithofacies can be calculated with a DFT model (Figure 10C,D). The nanopores in deep-marine shale reservoirs of the Wufeng Formation–Longyi1 submember in the western Chongqing area are classified as micropores, mesopores, and macropores, but there are some variations in distribution among different lithofacies. The micropores of the six main lithofacies are mainly contributed by pores with a size range of 0.4–0.9 nm, which has a bimodal feature (Figure 10D). Notably, organic-rich shale (including S1 and M1) displays higher peak heights and larger peak areas, suggesting more developed micropores. The pore size distribution derived from N2 adsorption reveals multipeak characteristics in the shale samples (Figure 10C). Siliceous shale (including S1 and S2) exhibits the most developed micropores in the 1.5–2 nm range, followed by mesopores in the 3–20 nm range. Among these, S1 has the highest peak height in the pore diameter distribution, indicating a more concentrated distribution and development of micropores and mesopores. In contrast, organic-lean shales primarily developed mesopores in the 7–50 nm range, with lower peak heights and a smaller area under the pore diameter distribution curve, suggesting a significantly smaller total pore volume compared to S1.

5. Discussion

5.1. Comparison of Global Marine Shales

The Wufeng–Longmaxi shale in the western Chongqing area shows both similarities and differences in geological characteristics and pore types when compared with global marine shale formations (Table 3).
Specifically, the current burial depth of the Wufeng–Longmaxi shale greatly exceeds that of the Barnett shale (US) [26,58], the Poker Chip shale (Canada) [56,59,60], and North African Hot shales [8] and is only similar to the Eagle Ford shale located south of the Edwards and Sligo Shelf Margins [61]. Notably, its maturity substantially exceeds that of these formations due to complex tectonic influences and burial depth. The Wufeng–Longmaxi shale entered the uplift stripping stage in the Late Cretaceous [62], reaching a peak in the Miocene, and its ancient depth was much deeper than present, causing a great maturity–depth mismatch [20]. This makes the Wufeng–Longmaxi shale exhibit the highest maturity among these shales, now in the overmature dry gas stage.
In terms of shale lithofacies and pore types, the lithofacies of the Longmaxi shale is similar to that of the Barnett shale, with both classified as S1 (high carbon and felsic content). However, there are notable differences in their pore types: the Longmaxi shale has a deeper burial depth and higher compaction and thermal maturity, resulting in lower development of intergranular pores compared to the Barnett shale, while organic matter pores are more well-developed. Additionally, the carbonate mineral content in the Longmaxi Formation is higher than that in the Barnett shale, and the tectonic activity in the western Chongqing area has been more intense, resulting in a greater number of carbonate mineral dissolution pores and microfractures observable in the Longmaxi shale.
Table 3. Comparison of geological characteristics and pore types between Global Marine Shale Formations and the Wufeng–Longmaxi Formation in Western Chongqing, Sichuan Basin, China.
CountryShale NameDepthRoTOCCarbonate MineralClay MineralFelsic MineralLithofacies (a)Main Pore Types (b)Data Sources
(m)(%)(%)(%)(%)(%)
AmericaBarnett shale799–24841–1.45.30.437.455.3S1Intergranular pores, organic pores, clay mineral interlaminar pores[5,26,58,61,63]
Eagle Ford shale232–39620.67–1.761.881511C3Intergranular pores, dissolution pores
CanadaPoker Chip shale10810.5–1.22.21.875.721.8CM2Clay mineral interlaminar pores[56,59,60]
North AfricaHot shale1245–21400.35–0.95.72244116M1Clay mineral interlaminar pores, microfractures[8]
ChinaLongmaxi shale3612–41252.13–2.48315.927.256.9S1Organic pores, intergranular pores, dissolution pores, microfracturesExperimental data
Wufeng shale3616–41282.41–2.491.6624.930.844.3M3Clay mineral interlaminar pores, intergranular pores
Note: (a) Lithofacies were identified according to the lithofacies classification scheme proposed in this study. (b) Main pore types are described in the reference literature or recognized based on SEM images found in the literature.
The mineral composition of the Wufeng Formation is similar to North Africa’s Hot shale, with both classified as M-type (mixed shale) lithofacies and dominated by clay mineral interlaminar pores. However, the TOC content of the Wufeng Formation is significantly lower than that of the Hot shale, and it has a higher content of felsic minerals, greater burial depth, and a higher degree of compaction. Consequently, a small number of intergranular pores can be observed in the Wufeng Formation, primarily surrounding the felsic minerals. In contrast, the Eagle Ford (US) and Poker Chip (Canada) shales demonstrate significant differences in lithofacies and pore types compared to the Wufeng–Longmaxi shale. The Eagle Ford shale is characterized by a lower TOC content and a very high carbonate mineral content, classifying it as C3, with pore types predominantly consisting of intergranular pores and carbonate mineral dissolution pores. Conversely, the Poker Chip shale has a moderate TOC content and a higher clay mineral content, classifying it as CM2, with pore types primarily composed of clay mineral interlaminar pores.
Compared with various global marine shale formations, the deep-marine shale in the study area exhibits greater burial depths, higher thermal maturity, and more intense tectonic activity. As a result, the pore types of deep-marine shale are more diverse than those of other shales, with more developed organic pores and more microfractures. Additionally, the strong compaction during deep burial resulted in smaller intergranular pores, mainly developed around felsic minerals.

5.2. Evaluation of Fractal Dimensions and Pore Structure Parameters

5.2.1. Fractal Dimensions

This study is based on experimental data of low-pressure N2 adsorption and uses the Frenkel–Halsey–Hill (FHH) model to calculate the pore surface fractal dimension (D1) and structural fractal dimension (D2) of deep-marine shale samples in the study area [2,64,65]. Specifically, D1 represents the fractal dimension under relative pressure (p/p0) conditions below 0.45, reflecting the influence of van der Waals forces and characterizing the surface roughness of the samples; D2 represents the fractal dimension under relative pressure (p/p0) conditions above 0.45, reflecting capillary condensation effects and characterizing the complexity and irregularity of the pore structure. The values of D1 and D2 are shown in Table 4.
The D1 and D2 of the main lithofacies of deep-marine shale in the study area are generally high. Specifically, D1 ranges from 2.5982 to 2.7322, with an average value of 2.6584, while D2 ranges from 2.7732 to 2.8830, with an average value of 2.8493. Notably, all samples exhibit D2 values greater than D1, indicating that the internal pore structure of deep-marine shale is more complex [64,65]. There are differences in fractal dimensions among different lithofacies. The D1 values of M2 and M3 are relatively low. It is speculated that this is because organic pores are underdeveloped, and during the deep burial process, the compaction effect makes the clay mineral particles arrange more closely, the pores become more regular, the homogeneity is stronger, and thus the fractal dimension is smaller. The D2 value of S3 is relatively low. This is because, due to the lack of organic pores and clay mineral interlaminar pores, the pore types are relatively simple, mainly intergranular pores, with strong homogeneity, resulting in a smaller fractal dimension [2,40].

5.2.2. Pore Structure Parameters

In this study, five key pore structure parameters, namely, the specific surface area, total pore volume, average pore diameter, micropore specific surface area, and micropore volume, are used to quantitatively analyze and discuss the pore structure characteristics of deep-marine shale in the study area. The detailed parameter data are given in Table 4.
The correlations between the different pore structure parameters and the TOC contents of different lithofacies are shown in Figure 11A–D. The specific surface area and pore volume are positively correlated with the TOC content, with Pearson’s r values of 0.591 and 0.517, respectively (Figure 11A,B); moreover, the micropore specific surface area and micropore volume are strongly correlated with the TOC content, showing a significant positive correlation, with Pearson’s r values of 0.906 and 0.871, respectively (Figure 11C,D). This indicates that deep-marine shale pores in the research area are mainly developed in organic matter and that the organic pores contribute greatly to the micropore specific surface area and micropore volume. Therefore, the organic micropores developed in organic matter can provide potential adsorption sites for shale gas and provide storage space for the enrichment of adsorbed gas [57,66].
The correlation analysis between the mineral content and pore structure parameters revealed that the micropore specific surface area and micropore volume are positively correlated with the felsic mineral content, with Pearson’s r values of 0.695 and 0.628, respectively (Figure 11E,F), and it is speculated that the enrichment of felsic minerals improves the compressive strength of deep-marine shales, which is conducive to the preservation of micropores during deep burial [40]. The micropore specific surface area and micropore volume are negatively correlated with the clay mineral content, with Pearson’s r values of −0.689 and −0.619, respectively (Figure 11G,H). This is presumed to be due to the strong compaction during deep burial, where compaction closed and very small clay mineral particles filled part of the pore space, inhibiting the development of micropores [45]. From the comparison of the pore structure parameters of the different lithofacies, the micropore specific surface area and micropore volume of S1 have obvious advantages, followed by those of S2 and M1, and they are the lowest for the organic-lean shales (including S3 and M3), indicating that S1 has the greatest adsorption capacity, which is more conducive to the enrichment of shale gas (Figure 12).

5.3. Evaluation of Gas Content

The gas content is a key indicator of the production capacity and economic exploitation value of shale reservoirs, and the enrichment of shale gas is affected by a variety of factors, such as temperature and pressure conditions, TOC content, mineral composition, and pore structure characteristics [45,66]. Therefore, correlation analyses of the TOC content, mineral content, and various pore structure parameters of deep-marine shale in the study area with the total gas content were performed (Figure 13).
The results show that the specific surface area, total pore volume, and average pore diameter are not significantly correlated with the total gas content, with Pearson’s r values all less than 0.4 (Figure 13A–C); however, the TOC content is positively correlated with the total gas content, with a Pearson’s r value of 0.424 (Figure 13D). In addition, the micropore specific surface area and micropore volume are strongly positively correlated with the total gas content, with Pearson’s r values of 0.708 and 0.701, respectively (Figure 13E,F), indicating that the development degree of the micropores in the study area is the main factor controlling the gas content of deep-marine shale and that the shale gas is mainly adsorbed in the organic micropores [3]. On the other hand, the felsic mineral content is positively correlated with the total gas content and TOC content, with Pearson’s r values of 0.749 and 0.592, respectively (Figure 13G,H), indicating that the felsic minerals of the Wufeng Formation–Longyi1 submember in the western Chongqing area are mainly derived from biogenic silica [50,51,52]. Previous researchers have shown that siliceous organisms (such as radiolarians and sponge spicules) aggregate to form high-silica and organic-rich aggregates, which increases their deposition rate in sediment water and effectively reduces the oxidation rate of organic matter in water, providing favorable conditions for the enrichment and accumulation of organic matter in shales [67]. Therefore, it is speculated that the massive reproduction and accumulation of siliceous organisms during the Late Ordovician Wufeng period to the early Silurian Longmaxi period were important factors influencing the formation of S1 in the study area [50]. The clay mineral content and the total gas content showed a negative correlation, with a Pearson’s r value of −0.671 (Figure 13I). Samples with higher clay mineral contents generally have lower total gas contents, which may be related to the inhibition of micropore development by clay minerals [51].
According to the comparison of the gas content characteristics of the different lithofacies, the gas content of the organic-rich shale and medium-organic shale is generally greater than that of the organic-lean shale, and the gas content of the siliceous shale lithofacies is slightly greater than that of the mixed shale lithofacies.

5.4. Main Controlling Factors of Gas Enrichment and Advantageous Shale Lithofacies

Based on the correlation analysis of the TOC content, mineral content, pore structure parameters, and gas content, the results of pairwise correlation analysis between each parameter are displayed in a heatmap (Figure 14, values are Pearson’s r). The results show that deep-marine shale gas in the study area is mainly stored in micropores, and the degree of micropore development determines the gas content [40,45]. The development of micropores in deep-marine shale reservoirs is jointly controlled by the TOC content, felsic mineral content, and clay mineral content. Micropores mainly developed in organic matter, and organic pores contribute a large amount of the micropore specific surface area and micropore volume [67]. Therefore, for the overmature deep-marine shale in the study area, the TOC content directly controlled the degree of micropore development, while the felsic and clay mineral contents controlled the preservation and destruction of micropores during the deep burial process. Therefore, deep-marine shale with a high TOC content, high felsic mineral content, and low clay mineral content has the greatest exploration potential.
The discrimination of advantageous shale lithofacies is key for evaluating the economic value and resource potential of deep-marine shale [45,68,69]. Based on the evaluation of pore structure parameters and gas content, as well as the main factors controlling gas enrichment, the main lithofacies of the Wufeng Formation–Longyi1 submember in the western Chongqing area were analyzed and compared. The results show that the source of S1 was mainly biogenic silica, with a high TOC content and felsic mineral content. Moreover, organic micropores are well-developed in the organic matter, with a high micropore specific surface area and micropore volume, as well as a high total gas content; thus, S1 could be considered an excellent advantageous lithofacies in the study area. The TOC content of S2 is relatively low, but the content of felsic minerals is high. Organic pores are relatively developed in S2, and the specific surface area, micropore volume, and total gas content are relatively high, so S2 is assumed to be a moderately advantageous lithofacies in the research area. Organic-lean shales (including S3 and M3) have low TOC contents, underdeveloped organic pores, and relatively low micropore specific surface areas, micropore volumes, and total gas contents, indicating poor development potential. Overall, based on the analysis above, S1 is regarded as the optimal choice for shale gas exploration in deep-marine shale formations with similar geological environments worldwide, followed by S2. In contrast, the development potential of organic-lean shale is relatively limited.

6. Conclusions

The deep-marine shale of the Wufeng Formation–Longyi1 submember in western Chongqing was selected as the research object, aiming to establish a suitable lithofacies classification scheme for deep-marine shale. Based on a comprehensive analysis of lithofacies types and correlation studies of key parameters, advantageous shale lithofacies were identified. The following conclusions have been drawn:
(1)
A suitable lithofacies classification scheme for deep-marine shale was established using the three-quartile statistical analysis method and mineralogical ternary diagrams. Based on this scheme, six main lithofacies have been identified in deep-marine shale, namely, organic-rich siliceous shale (S1), organic-rich mixed shale (M1), medium-organic siliceous shale (S2), medium-organic mixed shale (M2), organic-lean siliceous shale (S3), and organic-lean mixed shale (M3).
(2)
Through comparisons with various global marine shale formations, it was found that deep-marine shales exhibit greater burial depths, higher thermal maturity, and more intense tectonic activity. The increase in burial depth and compaction, coupled with intense tectonic activity, has resulted in a greater diversity of pore types in deep-marine shales, characterized by well-developed organic pores and microfractures, while intergranular pores are relatively small.
(3)
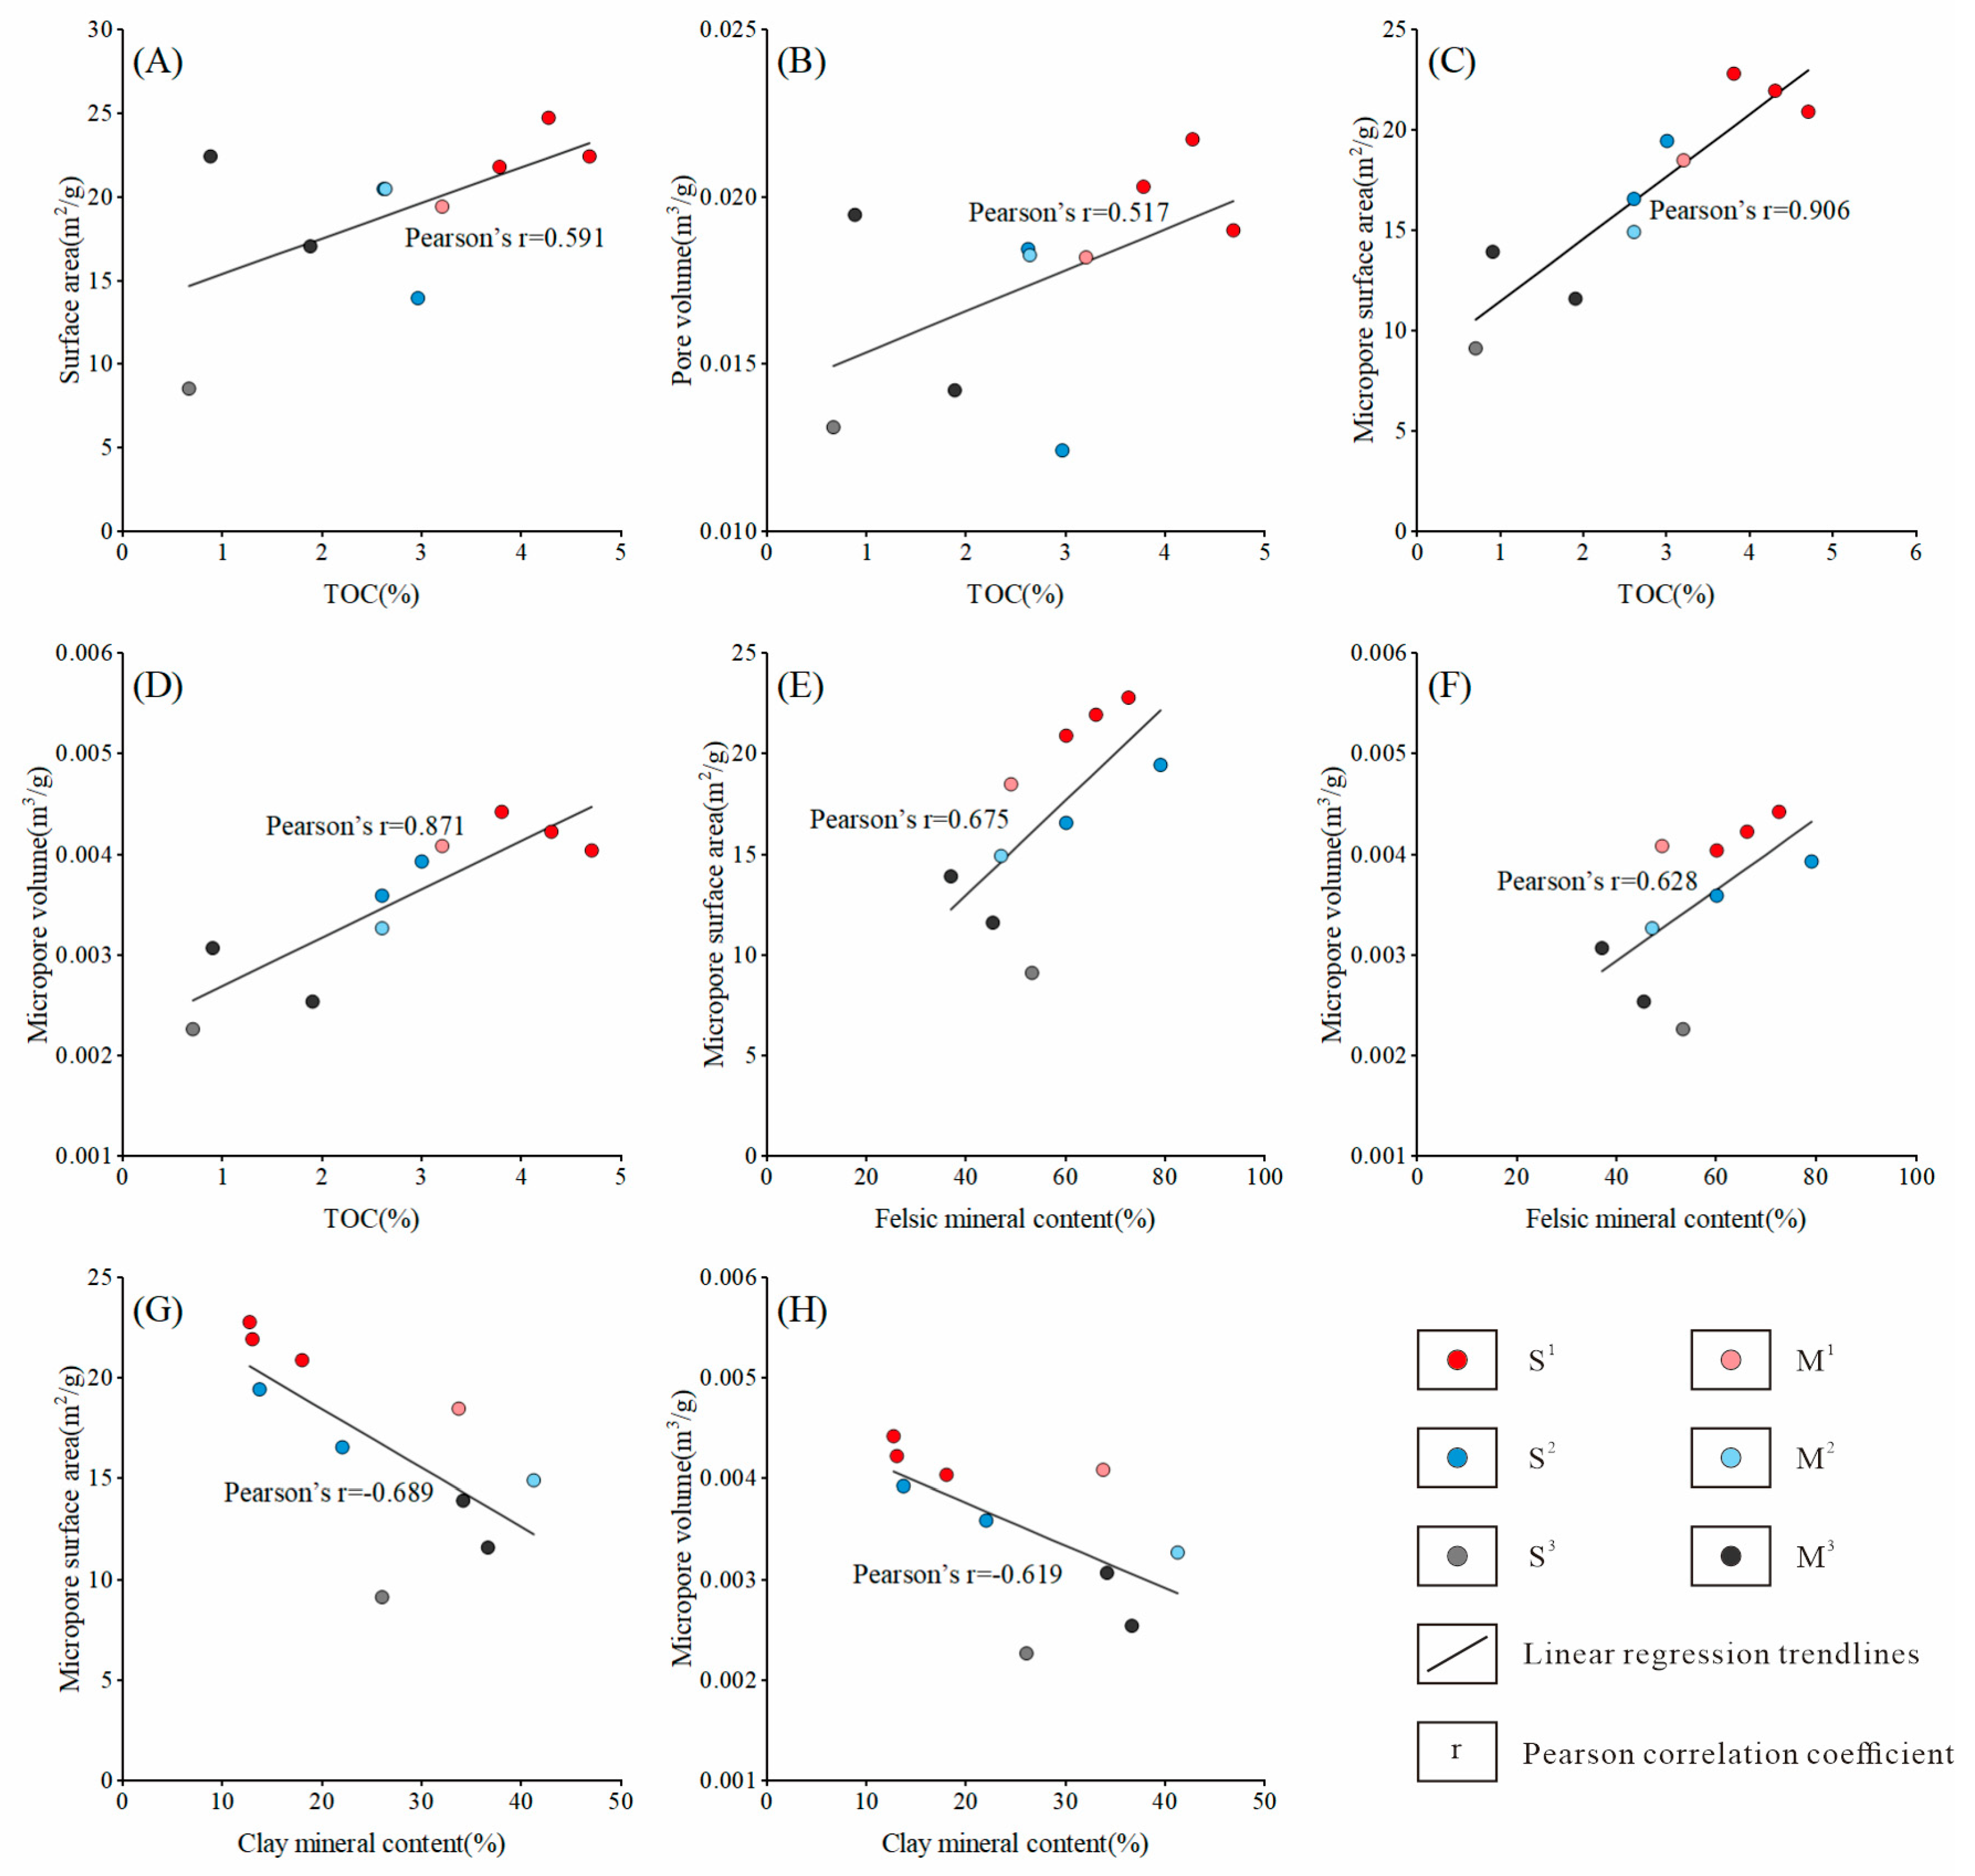
The development degree of the micropores is the main factor controlling the gas content of deep-marine shale, and the shale gas is mainly adsorbed in the organic micropores. The development of micropores in deep-marine shale reservoirs is jointly controlled by the TOC content, felsic mineral content, and clay mineral content. The degree of micropore development is directly controlled by the TOC content, whereas the felsic and clay mineral contents controlled the preservation and destruction of micropores in the process of deep burial.
(4)
Based on the investigation of the felsic mineral content, total gas content, and TOC content, it is concluded that the large-scale reproduction and accumulation of siliceous organisms during the Late Ordovician Wufeng period to the early Silurian Longmaxi period had an important influence on the formation of S1.
(5)
By comparing the pore structure parameters and gas contents of the different lithofacies, it is concluded that S1 has a high TOC content and felsic mineral content, well-developed organic pores, a large micropore specific surface area, a large micropore volume, and a high total gas content, making it an excellent advantageous lithofacies for deep-marine shale gas exploration. In contrast, the TOC content of S2 is relatively low, but the felsic mineral content is high. Organic pores are relatively developed, with a relatively large specific surface area and micropore volume and high total gas content, so S2 is assumed to be a moderately advantageous lithofacies. The TOC content, micropore specific surface area, micropore volume, and total gas content of the organic-lean shale (including S3 and M3) are relatively low, resulting in poor development potential. Therefore, in deep-marine shale with similar geological environments worldwide, S1 is considered the best choice for shale gas exploration, followed by S2.

Author Contributions

Conceptualization, L.F.; software, H.L.; validation, J.L. and X.G.; formal analysis, G.X.; investigation, J.L.; data curation, H.L.; writing—original draft, L.F.; writing—review and editing, L.F. and G.X.; supervision, F.X.; funding acquisition, F.X. All authors have read and agreed to the published version of the manuscript.

Funding

This research was funded by the National Natural Science Foundation Youth Foundation Project of China (funder Fanghao Xu; grant number 42302186) and the Chengdu University of Technology Graduate Education Reform Project (funder Haoran Liang; grant number 2023YJG212).

Data Availability Statement

The original contributions presented in the study are included in the article, further inquiries can be directed to the corresponding author.

Acknowledgments

We are grateful to Ni Gensheng and Yuan Jingzhou from the Development Division of PetroChina Southwest Oil & Gas Field Company for providing the deep-marine shale samples and basic geological data, which have greatly supported our research.

Conflicts of Interest

Author Jiaxin Liu was employed by the company PetroChina Southwest Oil & Gas Field Company. The remaining authors declare that the research was conducted in the absence of any commercial or financial relationships that could be construed as a potential conflict of interest.

References

  1. Loucks, R.G.; Ruppel, S.C. Mississippian Barnett Shale: Lithofacies and depositional setting of a deep-water shale-gas succession in the Fort Worth Basin, Texas. AAPG Bull. 2007, 91, 579–601. [Google Scholar] [CrossRef]
  2. Xu, S.; Gou, Q.Y.; Hao, F.; Zhang, B.Q.; Shu, Z.G.; Lu, Y.B.; Wang, Y.X. Shale pore structure characteristics of the high and low productivity wells, Jiaoshiba shale gas field, Sichuan Basin, China: Dominated by lithofacies or preservation condition? Mar. Pet. Geol. 2020, 114, 104211. [Google Scholar] [CrossRef]
  3. Wang, Y.; Liu, L.F.; Cheng, H.F. Gas adsorption characterization of pore structure of organic-rich shale: Insights into contribution of organic matter to shale pore network. Nat. Resour. Res. 2021, 30, 2377–2395. [Google Scholar] [CrossRef]
  4. Zhang, L.H.; He, X.; Li, X.G.; Li, K.C.; He, J.; Zhang, Z.; Guo, J.J.; Chen, Y.N.; Liu, W.S. Shale gas exploration and development in the Sichuan Basin: Progress, challenge and countermeasures. Nat. Gas Ind. B 2022, 9, 176–186. [Google Scholar] [CrossRef]
  5. McMahon, T.P.; Larson, T.E.; Zhang, T.; Shuster, M. Geologic characteristics, exploration and production progress of shale oil and gas in the United States: An overview. Pet. Explor. Dev. 2024, 51, 925–948. [Google Scholar] [CrossRef]
  6. Ma, X.H.; Wang, H.Y.; Zhou, S.W.; Shi, Z.S.; Zhang, L.F. Deep shale gas in China: Geological characteristics and development strategies. Energy Rep. 2021, 7, 1903–1914. [Google Scholar] [CrossRef]
  7. Gao, P.; Xiao, X.M.; Hu, D.F.; Lash, G.G.; Liu, R.B.; Cai, Y.D.; Wang, Z.H.; Zhang, B.Y.; Yuan, T.; Liu, S.Y. Effect of silica diagenesis on porosity evolution of deep gas shale reservoir of the Lower Paleozoic Wufeng-Longmaxi formations, Sichuan Basin. Mar. Pet. Geol. 2022, 145, 105873. [Google Scholar] [CrossRef]
  8. Arfaoui, I.; Hamdi, O.; Boulvain, F. Geochemical and mineralogical characterizations of Silurian “Hot” shales: Implications for shale gas/oil reservoir potential in Jeffara basin-southeastern Tunisia, North Africa. J. Afr. Earth Sci. 2024, 212, 105213. [Google Scholar] [CrossRef]
  9. Zou, C.N.; Dong, D.Z.; Wang, Y.M.; Li, X.J.; Huang, J.L.; Wang, S.F.; Guan, Q.Z.; Zhang, C.C.; Wang, H.Y.; Liu, H.L.; et al. Shale gas in China: Characteristics, challenges and prospects (I). Pet. Explor. Dev. 2015, 42, 753–767. [Google Scholar] [CrossRef]
  10. Chen, K.F.; Yang, R.; Bao, H.Y.; Dong, T.; Jia, A.Q.; Hu, Q.H.; Guo, X.W.; He, S. Depositional-diagenetic process and their implications for pore development of Wufeng-Longmaxi shales in the Jiangdong block, Fuling shale gas field, SW China. Mar. Pet. Geol. 2023, 151, 106177. [Google Scholar] [CrossRef]
  11. Xiang, K.M.; Shi, H.L.; Wang, X.M.; Zhao, Y.; Dong, X.X.; Pang, H.Q.; Zhang, Y.Y. Reservoir characteristics and main controlling factors of gas content of deep shale gas in southern Sichuan Basin. J. N. Pet. Univ. 2023, 47, 44–55. [Google Scholar] [CrossRef]
  12. Ma, X.H.; Wang, H.Y.; Zhou, S.W.; Feng, Z.Q.; Liu, H.L.; Guo, W. Insights into NMR response characteristics of shales and its application in shale gas reservoir evaluation. J. Nat. Gas Sci. Eng. 2020, 84, 103674. [Google Scholar] [CrossRef]
  13. Liu, S.G.; Jiao, K.; Zhang, J.C.; Ye, Y.H.; Xie, G.L.; Deng, B.; Ran, B.; Li, Z.W.; Wu, J.; Li, J.X.; et al. Research progress on the pore characteristics of deep shale gas reservoirs: An example from the Lower Paleozoic marine shale in the Sichuan Basin. Nat. Gas Ind. 2021, 41, 29–41. [Google Scholar] [CrossRef]
  14. Guo, T.L.; Meng, X.H.; Lei, W.; Liu, M.M.; Huang, L. Characteristics and governing factors of pore structure and methane sorption in deep-marine shales: A case study of the Wufeng–Longmaxi Formations, Weirong shale gas field, Sichuan Basin. Nat. Resour. Res. 2023, 32, 1733–1759. [Google Scholar] [CrossRef]
  15. Wu, L.Y.; Hu, D.F.; Lu, Y.C.; Liu, R.B.; Liu, X.F. Advantageous shale lithofacies of Wufeng Formation-Longmaxi Formation in Fuling gas field of Sichuan Basin, SW China. Pet. Explor. Dev. 2016, 43, 208–217. [Google Scholar] [CrossRef]
  16. Wang, Z.Y.; Chen, L.; Chen, D.X.; Lai, J.; Deng, G.S.; Liu, Z.Y.; Wang, C. Characterization and evaluation of shale lithofacies within the lowermost Longmaxi-Wufeng Formation in the southeast Sichuan Basin. J. Pet. Sci. Eng. 2020, 193, 107353. [Google Scholar] [CrossRef]
  17. Mustafa, A.; Abouelresh, M.O.; Abdulraheem, A. Control of Lithofacies and Geomechanical Characteristics on Natural Fracture Systems in Qusaiba Shale, Rub’ Al-Khali Basin, Saudi Arabia. Arab. J. Sci. Eng. 2021, 46, 5817–5834. [Google Scholar] [CrossRef]
  18. Lv, J.H.; Jiang, F.J.; Hu, T.; Zhang, C.X.; Huang, R.D.; Hu, M.L.; Xue, J.; Huang, L.L.; Wu, Y.P. Control of complex lithofacies on the shale oil potential in ancient alkaline lacustrine basins: The Fengcheng Formation, Mahu Sag, Junggar Basin. Geoenergy Sci. Eng. 2023, 224, 211501. [Google Scholar] [CrossRef]
  19. Yao, Y.L.; Xiao, F.; Li, S.C.; Yang, J.G.; Huang, Y.M.; Ye, C.L. Enrichment model of tight shale oil in the first Member of Cretaceous Qingshankou Formation in the southern Qijia sag, Songliao basin. Acta Geol. Sin. 2024, 98, 3393–3407. [Google Scholar] [CrossRef]
  20. Wang, E.Z.; Guo, T.L.; Li, M.W.; Li, C.R.; Dong, X.X.; Zhang, N.X.; Feng, Y. Exploration potential of different lithofacies of deep marine shale gas systems: Insight into organic matter accumulation and pore formation mechanisms. J. Nat. Gas Sci. Eng. 2022, 102, 104563. [Google Scholar] [CrossRef]
  21. Han, H.; Pang, P.; Zhong, N.N.; Luo, Q.Y.; Ma, Y.; Gao, Y. The pore characteristics and gas potential of the Jurassic continental shales in the middle-small basins, northwest China. J. Pet. Sci. Eng. 2020, 188, 106873. [Google Scholar] [CrossRef]
  22. Miao, F.; Wu, D.; Liu, X.Y.; Xiao, X.C.; Zhai, W.B.; Geng, Y.Y. Methane adsorption on shale under in situ conditions: Gas-in-place estimation considering in situ stress. Fuel 2022, 308, 121991. [Google Scholar] [CrossRef]
  23. Klaver, J.; Desbois, G.; Littke, R.; Urai, J.L. BIB-SEM characterization of pore space morphology and distribution in postmature to overmature samples from the Haynesville and Bossier Shales. Mar. Pet. Geol. 2015, 59, 451–466. [Google Scholar] [CrossRef]
  24. Gou, Q.Y.; Xu, S.; Hao, F.; Yang, F.; Zhang, B.Q.; Shu, Z.G.; Zhang, A.H.; Wang, Y.X.; Lu, Y.B.; Cheng, X.; et al. Full-scale pores and micro-fractures characterization using FE-SEM, gas adsorption, nano-CT and micro-CT: A case study of the Silurian Longmaxi Formation shale in the Fuling area, Sichuan Basin, China. Fuel 2019, 253, 167–179. [Google Scholar] [CrossRef]
  25. Jiang, T.; Jin, Z.J.; Liu, G.X.; Hu, Z.Q.; Chen, X.H.; Liu, Z.B.; Wang, G.P. Investigating the pore structure characteristics and reservoir capacities of lower Jurassic continental shale reservoirs in the northeastern Sichuan Basin, China. Front. Earth Sci. 2022, 10, 886907. [Google Scholar] [CrossRef]
  26. Slatt, R.M.; O’Brien, N.R. Pore types in the Barnett and Woodford gas shales: Contribution to understanding gas storage and migration pathways in fine-grained rocks. AAPG Bull. 2011, 95, 2017–2030. [Google Scholar] [CrossRef]
  27. Zhou, S.W.; Ning, Y.; Wang, H.Y.; Liu, H.L.; Xue, H.Q. Investigation of methane adsorption mechanism on Longmaxi shale by combining the micropore filling and monolayer coverage theories. Adv. Geo-Energy Res. 2018, 2, 269–281. [Google Scholar] [CrossRef]
  28. He, J.; Zhu, S.Y.; Shi, X.W.; Zhao, S.X.; Cao, L.Y.; Pan, S.L.; Wu, F.; Wang, M. Characteristics of lithofacies in deep shale gas reservoirs in the southeast Sichuan Basin and their influence on pore structure. Front. Earth Sci. 2022, 10, 857343. [Google Scholar] [CrossRef]
  29. Feng, Y.; Xiao, X.M.; Gao, P.; Wang, E.Z.; Hu, D.F.; Liu, R.B.; Li, G.; Lu, C.G. Restoration of sedimentary environment and geochemical features of deep marine Longmaxi shale and its significance for shale gas: A case study of the Dingshan area in the Sichuan Basin, South China. Mar. Pet. Geol. 2023, 151, 106186. [Google Scholar] [CrossRef]
  30. Wu, J.F.; Zhang, C.L.; Zhao, S.X.; Zhang, J.; Feng, J.R.; Xia, Z.Q.; Fang, Y.; Li, B.; Yin, M.X.; Zhang, D.K. Typical types of shale gas reservoirs in southern Sichuan Basin and enlightenment of exploration and development. Nat. Gas Geosci. 2023, 34, 1385–1400. [Google Scholar]
  31. Zhang, K.; Song, Y.; Jia, C.Z.; Jiang, Z.X.; Han, F.L.; Wang, P.F.; Yuan, X.J.; Yang, Y.M.; Zeng, Y.; Li, Y.; et al. Formation mechanism of the sealing capacity of the roof and floor strata of marine organic-rich shale and shale itself, and its influence on the characteristics of shale gas and organic matter pore development. Mar. Pet. Geol. 2022, 140, 105647. [Google Scholar] [CrossRef]
  32. Li, J.; Li, H.; Yang, C.; Wu, Y.J.; Gao, Z.; Jiang, S.L. Geological characteristics and controlling factors of deep shale gas enrichment of the Wufeng-Longmaxi Formation in the southern Sichuan Basin, China. Lithosphere 2022, 2022, 4737801. [Google Scholar] [CrossRef]
  33. The Standard Map Service Network. Available online: http://bzdt.ch.mnr.gov.cn/ (accessed on 3 February 2025).
  34. Zhu, H.J.; Lu, Y.J.; Pan, Y.Y.; Qiao, P.; Raza, A.; Liu, W. Nanoscale mineralogy and organic structure characterization of shales: Insights via AFM-IR spectroscopy. Adv. Geo-Energy Res. 2024, 13, 231–236. [Google Scholar] [CrossRef]
  35. Yang, R.; He, S.; Yi, J.Z.; Hu, Q.H. Nano-scale pore structure and fractal dimension of organic-rich Wufeng-Longmaxi shale from Jiaoshiba area, Sichuan Basin: Investigations using FE-SEM, gas adsorption and helium pycnometry. Mar. Pet. Geol. 2016, 70, 27–45. [Google Scholar] [CrossRef]
  36. Liu, K.Q.; Ostadhassan, M.; Zhou, J.; Gentzis, T.; Rezaee, R. Nanoscale pore structure characterization of the Bakken shale in the USA. Fuel 2017, 209, 567–578. [Google Scholar] [CrossRef]
  37. Bardestani, R.; Patience, G.S.; Kaliaguine, S. Experimental methods in chemical engineering: Specific surface area and pore size distribution measurements—BET, BJH, and DFT. Can. J. Chem. Eng. 2019, 97, 2781–2791. [Google Scholar] [CrossRef]
  38. Turlapati, V.Y.; Prusty, B.K.; Yarlagadda, D.K.; Pal, S.K.; Raja, E. Analysis of micropore size distribution using Dubinin’s theory of volume filling—Effect of particle size on pore characterization of organic-rich Indian shales. J. Nat. Gas Sci. Eng. 2022, 106, 104746. [Google Scholar] [CrossRef]
  39. Baldovino-Medrano, V.G.; Niño-Celis, V.; Isaacs Giraldo, R. Systematic Analysis of the Nitrogen Adsorption–Desorption Isotherms Recorded for a Series of Materials Based on Microporous–Mesoporous Amorphous Aluminosilicates Using Classical Methods. J. Chem. Eng. Data 2023, 68, 2512–2528. [Google Scholar] [CrossRef]
  40. Song, Z.Z.; Abid, A.; Lyu, M.Y.; Zhang, Y.Q.; Jiang, F.J.; Liu, Z.Y.; Zheng, W.; Wang, X.Y. Quantitative analysis of nitrogen adsorption hysteresis loop looping and its indicative significance in pore structure characterization: A case study of Section 7 of the Upper Triassic Extension Formation in Ordos Basin. Oil Gas Geol. 2023, 44, 495–509. [Google Scholar] [CrossRef]
  41. Zhang, J.C.; Wang, X.Z.; Li, Z.M.; Liu, S.G.; Niu, J.L.; Yuan, T.S.; Li, X.Q.; Tang, X. Technological progress and trend in shale gas on-site testing: A critical review. Earth Sci. Front. 2024, 31, 315–326. [Google Scholar]
  42. Rouquerol, J.; Avnir, D.; Fairbridge, C.W.; Everett, D.H.; Haynes, J.M.; Pernicone, N.; Ramsay, J.D.F.; Sing, K.S.W.; Unger, K.K. Recommendations for the characterization of porous solids (Technical Report). Pure Appl. Chem. 1994, 66, 1739–1758. [Google Scholar] [CrossRef]
  43. Suárez-Ruiz, I.; Juliao, T.; Suárez-García, F.; Marquez, R.; Ruiz, B. Porosity development and the influence of pore size on the CH4 adsorption capacity of a shale oil reservoir (Upper Cretaceous) from Colombia. Role of solid bitumen. Int. J. Coal Geol. 2016, 159, 1–17. [Google Scholar] [CrossRef]
  44. Hu, G.; Pang, Q.; Jiao, K.; Hu, C.W.; Liao, Z.W. Development of organic pores in the Longmaxi Formation overmature shales: Combined effects of thermal maturity and organic matter composition. Mar. Pet. Geol. 2020, 116, 104314. [Google Scholar] [CrossRef]
  45. Li, Q.W.; Liu, Z.B.; Chen, F.R.; Liu, G.X.; Zhang, D.W.; Li, P.; Wang, P.W. Lithofacies types and reservoir characteristics of Jurassic shale in the Sichuan Basin revealed by the Da’anzhai Member, Well Y2, Yuanba area. Oil Gas Geol. 2022, 43, 1127–1140. [Google Scholar] [CrossRef]
  46. Li, Y.J.; Liu, H.; Zhang, L.H.; Lu, Z.G.; Li, Q.R.; Huang, Y.B. Lower limits of evaluation parameters for the lower Paleozoic Longmaxi shale gas in southern Sichuan Province. Sci. China Earth Sci. 2013, 56, 710–717. [Google Scholar] [CrossRef]
  47. Burnaman, M.D.; Shelton, J. Shale gas play screening and evaluation criteria. China Pet. Explor. 2009, 14, 51. [Google Scholar]
  48. Hu, Z.Q.; Du, W.; Zhu, T.; Liu, Z.Q. Sequence stratigraphy and lithofacies characteristics of fine-grained deposits of Wufeng-Longmaxi Formations in the Sichuan Basin and on its periphery. Oil Gas Geol. 2022, 43, 1024–1038. [Google Scholar] [CrossRef]
  49. Zhao, S.X.; Xia, Z.Q.; Li, H.; Wang, G.X.; Qiu, Z.; Liu, S.J.; Zhang, C.L.; Li, B.; Yin, X.M.; Yang, L.C. Quantitative evaluation and main controlling factors of natural fractures in a shale reservoir: A case study of the deep shale of the Wufeng Formation-Longmaxi Formation in Luzhou. Acta Sedimentol. Sin. 2025, 43, 212–225. [Google Scholar] [CrossRef]
  50. Guo, X.S.; Li, Y.P.; Borjigen, T.G.; Wang, Q.; Yuan, T.; Shen, B.J.; Ma, Z.L.; Wei, F.B. Hydrocarbon generation and storage mechanisms of deep-water shelf shales of Ordovician Wufeng Formation–Silurian Longmaxi Formation in Sichuan Basin, China. Pet. Explor. Dev. 2020, 47, 193–201. [Google Scholar] [CrossRef]
  51. Guan, Q.Z.; Dong, D.Z.; Zhang, H.L.; Sun, S.S.; Zhang, S.R.; Guo, W. Types of biogenic quartz and its coupling storage mechanism in organic-rich shales: A case study of the Upper Ordovician Wufeng Formation to Lower Silurian Longmaxi Formation in the Sichuan Basin, SW China. Pet. Explor. Dev. 2021, 48, 700–709. [Google Scholar] [CrossRef]
  52. Li, Y.; Shi, X.W.; Luo, C.; Wu, W.; Yang, X.; Zhu, Y.Q.; Tian, C.; Zhong, K.S.; Li, Y.Y.; Xu, H.; et al. Impact of different diagenetic minerals on shale reservoirs in Wufeng-Longmaxi Formation in southern Sichuan Basin. J. Chengdu Univ. Technol. Sci. Technol. Ed. 2024, 51, 745–757+771. [Google Scholar]
  53. Borjigin, T.; Shen, B.J.; Yu, L.J.; Yang, Y.F.; Zhang, W.T.; Tao, C.; Xi, B.B.; Zhang, Q.Z.; Bao, F.; Qin, J.Z. Mechanisms of shale gas generation and accumulation in the Ordovician Wufeng-Longmaxi Formation, Sichuan Basin, SW China. Pet. Explor. Dev. 2017, 44, 69–78. [Google Scholar] [CrossRef]
  54. Panahi, H.; Kobchenko, M.; Meakin, P.; Dysthe, D.K.; Renard, F. In-situ imaging of fracture development during maturation of an organic-rich shale: Effects of heating rate and confinement. Mar. Pet. Geol. 2018, 95, 314–327. [Google Scholar] [CrossRef]
  55. Liu, H.; Wu, S.H.; Jiang, X.M.; Wang, G.Z.; Cao, Q.X.; Qiu, P.H.; Qin, Y.K. The configuration analysis of the adsorption isotherm of nitrogen in low temperature with the lignite char produced under fast pyrolysis. J. China Coal Soc. 2005, 30, 507–510. [Google Scholar] [CrossRef]
  56. Chen, L.; Jiang, Z.X.; Liu, K.Y.; Wang, P.F.; Ji, W.M.; Gao, F.L.; Li, P.; Hu, T.; Zhang, B.; Huang, H.X. Effect of lithofacies on gas storage capacity of marine and continental shales in the Sichuan Basin, China. J. Nat. Gas Sci. Eng. 2016, 36, 773–785. [Google Scholar] [CrossRef]
  57. Chen, S.B.; Zhu, Y.M.; Wang, H.Y.; Liu, H.L.; Wei, W.; Fang, J.H. Structure characteristics and accumulation significance of nanopores in Longmaxi shale gas reservoir in the southern Sichuan Basin. J. China Coal Soc. 2012, 37, 438–444. [Google Scholar] [CrossRef]
  58. Zhao, H.; Givens, N.B.; Curtis, B. Thermal maturity of the Barnett Shale determined from well-log analysis. AAPG Bull. 2007, 91, 535–549. [Google Scholar] [CrossRef]
  59. Riediger, C.L. Hydrocarbon source rock potential and comments on correlation of the Lower Jurassic Poker Chip Shale, west-central Alberta. Bull. Can. Pet. Geol. 2002, 50, 263–276. [Google Scholar] [CrossRef]
  60. Ross, D.J.K.; Bustin, R.M. Shale gas potential of the Lower Jurassic Gordondale Member, northeastern British Columbia, Canada. Bull. Can. Pet. Geol. 2007, 55, 51–75. [Google Scholar] [CrossRef]
  61. Sun, X.; Zhang, T.; Walters, C.C. Geochemistry of oils and condensates from the lower Eagle Ford Formation, south Texas. Part 2: Molecular characterization. Mar. Pet. Geol. 2022, 141, 105710. [Google Scholar] [CrossRef]
  62. Liu, W.; Wu, J.; Jiang, H.; Zhou, Z.; Luo, C.; Wu, W.; Li, X.J.; Liu, S.G.; Deng, B. Cenozoic exhumation and shale-gas enrichment of the Wufeng-Longmaxi formation in the southern Sichuan basin, western China. Mar. Pet. Geol. 2021, 125, 104865. [Google Scholar] [CrossRef]
  63. Heller, R.; Zoback, M. Adsorption of methane and carbon dioxide on gas shale and pure mineral samples. J. Unconv. Oil Gas Resour. 2014, 8, 14–24. [Google Scholar] [CrossRef]
  64. Qiu, H.Y.; Jiang, Z.X.; Liu, Z.J.; Chang, J.Q.; Su, Z.F.; Yang, Z.W.; Zhou, W. Difference in pore structure characteristics between condensate and dry shale gas reservoirs: Insights from the pore contribution of different matrix components. J. Nat. Gas Sci. Eng. 2021, 96, 104283. [Google Scholar] [CrossRef]
  65. Liang, Z.K.; Jiang, Z.X.; Li, Z.; Gao, F.L.; Liu, X.Q. Investigation into the pore structure and multifractal characteristics of shale reservoirs through N2 adsorption: An application in the Triassic Yanchang Formation, Ordos Basin, China. Geofluids 2021, 2021, 9949379. [Google Scholar] [CrossRef]
  66. Huo, J.F.; Gao, J.; Guo, X.W.; Yi, J.Z.; Shu, Z.G.; Bao, H.Y.; Yang, R.; Luo, T.; He, S. Characteristics and controlling factors of pore structures of various lithofacies in shales of Longmaxi Formation, eastern Sichuan Basin. Oil Gas Geol. 2020, 41, 1162–1175. [Google Scholar] [CrossRef]
  67. Wang, S.F.; Zou, C.N.; Dong, D.Z.; Wang, Y.M.; Huang, J.L.; Guo, Z.J. Biogenic silica of organic-rich shale in Sichuan Basin and its significance for shale gas. Acta Sci. Nat. Univ. Pekin. 2014, 50, 476–486. [Google Scholar] [CrossRef]
  68. Xu, L.F.; Deng, J.M.; Du, J.; Li, Y.; Wu, P.; Wu, X.; Hu, W.Q.; Zhao, F.; Zheng, W.; Jiang, Z.X. Lithofacies types and reservoir differences of marine continental transitional shale in Linxing area, eastern margin of Ordos Basin. J. China Coal Soc. 2021, 46, 862–876. [Google Scholar] [CrossRef]
  69. Zhang, W.T.; Hu, W.X.; Borjigin, T.; Zhu, F. Pore characteristics of different organic matter in black shale: A case study of the Wufeng-Longmaxi Formation in the southeast Sichuan Basin, China. Mar. Pet. Geol. 2020, 111, 33–43. [Google Scholar] [CrossRef]
Figure 3. The TOC content distributions of the Wufeng Formation–Longyi1 submember from eight typical deep shale gas wells in the western Chongqing area, Sichuan Basin. (A) Distribution of TOC content in each sublayer; (B) Frequency distribution histogram of TOC content from 80 deep-marine shale samples.
Energies 18 01835 g003
Figure 4. Mineral composition percentage distribution of the Wufeng Formation–Longyi1 submember from different sublayers in the western Chongqing area, Sichuan Basin. (A) Whole-rock XRD mineral analysis in the study area; (B) Clay XRD mineral analysis in well H206; (C) Typical XRD pattern of the deep-marine shale, He201—4118m.
Energies 18 01835 g004
Figure 5. Comprehensive ternary lithofacies diagram of the TOC content and mineral composition of 80 deep-marine shale samples from the Wufeng Formation–Longyi1 submember in the western Chongqing area, Sichuan Basin.
Energies 18 01835 g005
Figure 6. The TOC content percentage distributions among different sublayers from 80 deep-marine shale samples from the Wufeng Formation–Longyi1 submember in the research area.
Energies 18 01835 g006
Figure 7. Core and thin section photographs of the main lithofacies. (A) H202, 4075 m, S1, dark gray shale with abundant graptolites; (B) H202, 4075 m, S1, spicules and directional arrangement; (C) He201, 4128 m, M1, black shale with laminations; (D) He201, 4128 m, M1, massive and faint laminations; (E) He201, 4085 m, S2, black–gray shale with few small graptolites; (F) He201, 4085 m, S2, siliceous horizontal laminations; (G) H203, 3738 m, M2, black–gray shale with pyrite and small graptolites; (H) H203, 3738 m, M2, massive structure; (I) He201, 4078 m, S3, dark gray shale with sandy nodules; (J) He201, 4078 m, S3, homogeneous particles and radiolarians; (K) He201, 4082 m, M3, dark gray shale with massive structure; (L) He201, 4082 m, M3, large-grained debris particles.
Energies 18 01835 g007
Figure 8. The pore types and morphological characteristics of the main lithofacies identified from FE-SEM images. (A) H202, 4075 m, S1, organic pores developed in migrated organic matter; (B) H202, 4075 m, S1, strip-shaped organic matter with no visible pores, and microfractures in deep shale; (C) H207, 4258.35 m, M1, clay minerals show a directional arrangement, strawberry-shaped pyrite coexisting with clay minerals; (D) R201, 4239.38 m, S2, intergranular pores, intragranular dissolution pores, microfractures, organic pores, and organic matter shrinkage fractures; (E) H204, 3616.1 m, S2, several organic pores developed in massive organic matter; (F) H204, 3579.86 m, M2, clay mineral interlaminar pores, and intergranular pores of dolomite particles; (G) H204, 3612.45 m, M2, strip-shaped organic matter with no visible pores; (H) H204, 3564.93 m, S3, clay mineral interlaminar pores, and intergranular pores of strawberry-shaped pyrite; (I) He201, 4087.3 m, M3, clay mineral interlaminar pores, and a little irregular organic matter.
Energies 18 01835 g008
Figure 9. Image processing workflow and surface porosity distribution characteristics of the main lithofacies. (A) Original argon ion beam polished SEM image; (B) Pore identification using ImageJ software (red = organic pores, blue = inorganic pores); (C) Comparative surface porosity distribution across different lithofacies.
Energies 18 01835 g009
Figure 10. Results of the low-pressure N2 and CO2 adsorption experiments on the main lithofacies. (A) N2 adsorption–desorption isotherms; (B) CO2 adsorption isotherms; (C) Pore diameter distribution determined by the DFT model; (D) Micropore diameter distribution determined by the DFT model.
Energies 18 01835 g010
Figure 11. Relationships between the pore structure parameters and the TOC (AD), felsic mineral (E,F), and clay mineral (G,H) contents of the main lithofacies of the Wufeng Formation–Longyi1 submember in the western Chongqing area, Sichuan Basin.
Energies 18 01835 g011
Figure 12. Micropore surface area and micropore volume of the main lithofacies of the Wufeng Formation–Longyi1 submember in the western Chongqing area, Sichuan Basin.
Energies 18 01835 g012
Figure 13. Relationships between total gas content and TOC, mineral content, and pore structure parameters of the main lithofacies of the Wufeng Formation–Longyi1 submember in the western Chongqing area, Sichuan Basin. (A) Surface area vs. total gas content; (B) Pore volume vs. total gas content; (C) Average pore diameter vs. total gas content; (D) TOC vs. total gas content; (E) Micropore surface area vs. total gas content; (F) Micropore volume vs. total gas content; (G) Felsic mineral content vs. total gas content; (H) Felsic mineral content vs. TOC; (I) Clay mineral content vs. total gas content.
Energies 18 01835 g013
Figure 14. Heat-mapped correlation of the main parameters of deep-marine shale, Wufeng Formation–Longyi1 submember, western Chongqing area, Sichuan Basin, China.
Energies 18 01835 g014
Table 1. Geochemical characteristics of different sublayers in the western Chongqing area, Sichuan Basin.
WellDepth (m)StrataMacerals Composition Percentage (%)TIOrganic Matter TypeRb (%) (a)Ero (%) (b)
SapropeliniteExiniteVitriniteInertinite
H2043581.4Sublayer 49604093Type I3.242.40
H2043599.92Sublayer 49802096.5Type I3.282.43
H2043610.4O3w9505091.3Type I3.252.41
H2074232.1Sublayer 49802096.5Type I3.342.46
H2074242.6Sublayer 49505091.3Type I3.362.48
H2074252.4Sublayer 39406089.5Type I3.352.47
H2074262.4O3w9604093Type I3.382.49
H2024072.32Sublayer 4//////2.82.13
H2024075.01Sublayer 39901098.3Type I//
R2034330.9Sublayer 2//////2.882.18
R2034335.77Sublayer 19900198Type I//
Note: (a) Rb is the solid bitumen reflectance. (b) The calculation method for the equivalent vitrinite reflectance (Ero = 0.618 × Rb + 0.4) is from [43].
Table 2. Statistics of the TOC content and mineral composition of the main lithofacies in the western Chongqing area, Sichuan Basin.
LithofaciesMain Developmental SublayersTOC (%)Mineral Composition Percentage (%)
Felsic MineralsCarbonate MineralsClay Minerals
S1O3w, Sublayer 1, Sublayer 2 3.01 5.88 4.18 51 85 66 5 37 13.5 8 34.9 16.86
M1Sublayer 1, Sublayer 2 3.05 6.23 4.17 42 49 45.4 13 39 23.8 13 39 27
S2O3w, Sublayer 3, Sublayer 4 2.0 2.52 2.21 50.2 67 57.63 2.7 15 9.25 18 38.4 29.72
M2O3w, Sublayer 2, Sublayer 4 2.0 2.88 2.48 37 50 43.39 6.9 46 18.35 6 45.7 34.78
S3O3w, Sublayer 3, Sublayer 4 1.02 1.9 1.53 51.8 67 55.67 5 19.9 13.07 12 37.6 28.65
M3O3w, Sublayer 4 0.5 1.86 1.59 23 50 42.58 4.6 46 17.07 29 44 37.76
Note: The data format of the TOC content and mineral composition column is M i n M a x A v e r a g e .
Table 4. Reservoir characteristics, fractal dimensions, and pore structure parameters of the main lithofacies in the western Chongqing area, Sichuan Basin.
Sample IDDepthTOCCarbonate MineralClay MineralFelsic MineralSurface AreaTotal Pore VolumeAverage Pore DiameterMicropore Surface AreaMicropore VolumeTotal Gas ContentD1D2Lithofacies
(m)(%)(%)(%)(%)(m²/g)(m3/g)(nm)(m²/g)(m3/g)(m3/t)
H204-073607.344.315136624.7170.02175.3421.9440.004232.742.67822.8243S1
H207-064255.964.712186022.420.0195.71320.9220.004041.622.64952.8573S1
H202-84075.013.86.612.772.521.7860.02036.45822.8080.004424.692.68532.8791S1
H207-044258.643.217.333.74919.4310.01825.98818.5000.004091.352.66812.8584M1
H204-113600.732.613226020.4990.01856.11816.5840.003593.022.6362.858S2
R203-54343.1935.813.77913.9470.01247.9219.4560.003934.22.73222.8728S2
H204-153594.732.67.741.24720.4770.01836.01514.9350.003272.012.6332.8466M2
H202-34085.60.719.92653.28.5780.013110.2429.1290.002270.612.66782.7732S3
H207-254224.391.912.536.645.317.0670.01425.00711.6140.002540.32.62182.8822M3
H204-013617.710.924.234.136.922.4250.01954.9513.9360.003072.162.59822.883M3
Disclaimer/Publisher’s Note: The statements, opinions and data contained in all publications are solely those of the individual author(s) and contributor(s) and not of MDPI and/or the editor(s). MDPI and/or the editor(s) disclaim responsibility for any injury to people or property resulting from any ideas, methods, instructions or products referred to in the content.

