Article

Optimized Dimensioning and Economic Assessment of Decentralized Hybrid Small Wind and Photovoltaic Power Systems for Residential Buildings

1
Enisyst GmbH, Robert-Bosch-Straße 8/1, 72124 Pliezhausen, Germany
2
Center for Sustainable Energy Technology, University of Applied Sciences Stuttgart, Schellingstraße 24, 70174 Stuttgart, Germany
3
NETZ: Technologietransferzentrum Nachhaltige Energien, Aschaffenburg UAS, Würzburger Str. 45, 63743 Aschaffenburg, Germany
4
Institute of Applied Analysis and Numerical Simulation (IANS), University of Stuttgart, Allmandring 5b, 70569 Stuttgart, Germany
5
Next-Generation Cities Institute, Concordia University, 2155 Rue Guy, ER-1431.35, Montréal, QC H3H 2L9, Canada
*
Author to whom correspondence should be addressed.
Energies 2025, 18(7), 1811; https://doi.org/10.3390/en18071811
Submission received: 26 February 2025 / Revised: 27 March 2025 / Accepted: 31 March 2025 / Published: 3 April 2025

Abstract

:
In Germany, wind and photovoltaic (PV) systems dominate renewable electricity generation, with large wind turbines contributing 24.1% and PV systems contributing 10.6% in 2022. In contrast, electricity production from small wind turbines remains marginal (<0.01%). While currently only viable in high-wind locations, factors like rising electricity prices, cheaper battery storage, and increasing electrification could boost their future role. Within this work, a residential energy supply system consisting of a small wind turbine, PV system, heat pump, battery storage, and electric vehicle was dimensioned for different sites in Germany and Canada based on detailed simulation models and genetic algorithms in order to analyze the effect of bidirectional charging on optimal system dimensions and economic feasibility. This was carried out for various electricity pricing conditions. The results indicate that, with electricity purchase costs above 0.42 EUR/kWh, combined with a 25% reduction in small wind turbine and battery storage investment expenses, economic viability could be significantly enhanced. This might expand the applicability of small wind power to diverse sites.

1. Introduction

Sector coupling and load management are crucial elements for reaching climate neutrality. Today, in Germany, most of the renewable energy sources (RESs) are converted within the domain of the energy sector; thus, it becomes important for effective load management to include an evergrowing share of volatile renewable energy (RE). At present, over 50% of this RE supply is derived from large wind turbines [1], characterized by their megawatt-level power output, which feeds into the medium- or high-voltage grid. Complementary to this, a significant portion of RESs is contributed by smaller decentralized plants, often feeding into the low-voltage grid, an arrangement that ideally encourages consumption within the same distribution grid. These are mainly photovoltaic (PV) and biogas plants that exemplify how an RE approach can be realized economically on a substantial scale. In Germany, this progress has been considerably driven by the deployment of fixed feed-in tariffs over the past two decades, fostering the necessary economies of scale for financially feasible electricity production. In contrast, the adoption of small wind power plants has been notably limited in Germany. This is illustrated by the fact that electricity generation from small wind turbines constitutes less than 0.01% of the overall electricity output [2,3]. In comparison, the contribution of PV installations reached 10.6% in 2022, while large wind turbines accounted for 24.1% [1]. Typically, these systems are implemented separately in distinct technical and spatial contexts. Thus, the potential for localized integration between PV and wind power systems has received limited attention. This is unfortunate as cost-saving opportunities exist, particularly for small-scale installations, where shared fixed installation costs could be advantageous [4]. Also, due to their different generation profiles, wind power and PV have shown to complement each other [5,6].
Regarding small wind power, several factors underpin this discrepancy, including challenges in locating suitable sites, navigating complex legal frameworks, and the relatively modest subsidies available. The fact that the market for small wind systems is fragmented, which results in higher costs, alongside a lack of confidence in the technology, also contributes to the subdued presence of small wind power plants. This is unfortunate as the decentralized nature of small wind power at low-voltage grid level offers benefits like reducing the need for grid expansion or infrastructure upgrades. Although small wind power currently suits locations with favorable wind potential, changing factors such as rising electricity prices, falling battery storage costs, and growing electrification in heating [7] and transport [8] could create new opportunities.

1.1. Hybrid Power Generation from Small Wind Turbines and PV Systems

With regard to the combined operation of small wind turbines, PV systems and energy storage (battery as well as chemical storage), research so far has focused on the optimization of hybrid power generation [9] as well as optimized microgrid operation [10,11]. Sichilalu et al. [12] study a system with a grid-connected PV module, small wind turbine, and fuel cell in South Africa, but do not consider the thermal behavior of the building. In the study by Kaabeche et al. [13], an optimization model is developed for a hybrid system of a PV module, small wind turbine, and battery storage that models power-to-heat using electrical load profiles. Arabali et al. [14] analyze a heating, ventilation, air conditioning, and refrigeration (HVACR) system combined with a PV module and small wind turbine as well as electricity storage. System sizing as well as intelligent load management strategies are optimized using a genetic algorithm (GA). Thermal storage and thermal building dynamics are not considered.
Only a third of the publications refer to systems with a grid connection. At only 9.9%, sector coupling based on heat pump applications was very rarely investigated for this particular system combination [15]. Most publications do not reflect the dynamic behavior of the building, which means that an increase in flexibility due to overheating or undercooling and the associated rebound effect are not considered. Furthermore, there are few studies that explicitly refer to Germany as a location and the corresponding framework conditions. For example, of 550 studies published between 1995 and 2020 on the topic of small wind power in combination with a PV system, only three were examined with reference to Germany (one stand-alone system and two systems with grid connection) [15]. The basic approach of those studies by Grieser et al. [16], Rieck et al. [17] and Weida et al. [18] is comparable to the analyses presented within this work. Rieck et al. [17] examine the economic viability of small wind turbines for various locations in Germany in conjunction with PV systems and heat pumps in residential buildings. However, no future economic framework conditions are considered here. At the same time, the mutual influence of the self-consumption of electricity from PV systems and small wind turbines is not addressed. Weida et al. [18] examine the interaction of PV systems and wind power plants for various regions in Germany but only refer to large wind power plants. Grieser et al. [16] examine the economic viability of small wind turbines for six urban locations in Germany. However, no integration of PV systems is considered.

1.2. Optimized Dimensioning of HVAC Systems

In research, metaheuristic optimization approaches, such as evolutionary algorithms (EAs) and, in particular, GAs, are often used to dimension the individual components in hybrid RE power supply systems. One reason for this is that such systems are often only dimensioned on the basis of empirical values, which are not or only insufficiently available in the case of changing framework conditions or new system combinations [19]. Specifically for hybrid systems, research has investigated the application of GAs for a wide variety of use cases. For example, Mayer et al. [20] use a GA to optimize a hybrid power system consisting of a PV module, small wind turbine, solar thermal collector, thermal buffer storage, and battery storage. In addition, thermal insulation thickness and life cycle impacts are included in the optimization. The optimization objective here is multi-criteria and relates to the full cost and environmental impact in terms of CO2 emissions. Ko et al. [21] determine the optimal dimensioning of a system consisting of a PV module, solar thermal collector, heat pump, boiler, and chiller for an elementary school building using a GA in terms of life cycle cost, RE fraction, and CO2 emissions caused. Koutroulis et al. [22] use a GA to find the optimal dimensioning of a photovoltaic module and small wind turbine to supply a household. Zhang et al. [23] apply a GA to a residential PV module, battery storage, and hydrogen storage system to increase self-sufficiency and reduce investment costs. Only the electrical side of the system, and not the thermal side, is considered. Bee et al. [24] use a GA to determine the optimal dimensioning of a system consisting of a heat pump, PV module, thermal buffer storage, and battery storage. Bernal-Agustin et al. [25] determine the optimal parameters for an EA to dimension a complex system of a PV module, small wind turbine, diesel generator, electrolyzer, fuel cell, and battery storage. Xu et al. [26] dimension a system of wind power, a PV module, and pumped storage using a GA, particle swarm optimization (PSO) and simulated annealing (SA). It is shown that, for this specific use case, PSO gives better results than the GA and SA.

1.3. Aim of This Work

The dimensioning of power systems is usually rule-based for cost reasons. In many cases, however, this is not the most optimal solution, since the building, user-specific, and climatic conditions vary, which can only be represented in part by a rule-based dimensioning. Another problem is that the rule-based dimensioning loses its validity when the general conditions change (investment and energy costs or yields, possible subsidies, and efficiency of the systems), or when new rules have to be created, for which empirical values are first required. In addition, there is hardly any practical experience for the combination of PV systems and small wind turbines.
Therefore, within this work, a dimensioning of a residential building’s individual energy system components (small wind turbine, PV module, battery storage, heat pump, thermal buffer storage) was carried out by means of a metaheuristic (i.e., a genetic) optimization algorithm. The optimization goal is based on the economic efficiency in the form of the equivalent annual costs for different locations. Current and various future scenarios were examined with regard to the varying economic conditions, such as investment costs, electricity purchase prices, and electricity marketing prices. In addition, the effect of integrating battery electric vehicles (BEVs) by means of bidirectional charging (vehicle-to-home) on the economic efficiency of the PV system and the small wind turbine unit was evaluated for the 2022 scenario.
It was observed that higher electricity procurement costs (≥0.42 EUR/kWh), coupled with a 25% reduction in investment expenditures for small wind turbines and battery storage, could significantly enhance the economic viability of small wind turbines for residential buildings equipped with heat pumps. Under these circumstances, small wind turbines would become attractive for a broader array of additional locations. In most cases, the current feed-in tariff or direct marketing at exchange electricity prices ≥ 60 EUR/MWh would prove sufficient for an economically viable operation.
Simultaneously, concerning the intensifying electrification of the transportation sector and the prospects of bidirectional charging, it was demonstrated that, within existing conditions, the integration of BEVs and bidirectional charging does not positively influence the economic feasibility of the considered scenarios for small wind turbine installations. Nonetheless, under future conditions, the load management of heat pumps or BEV charging could potentially exert a positive impact on the profitability of small wind turbines.

2. Methodology

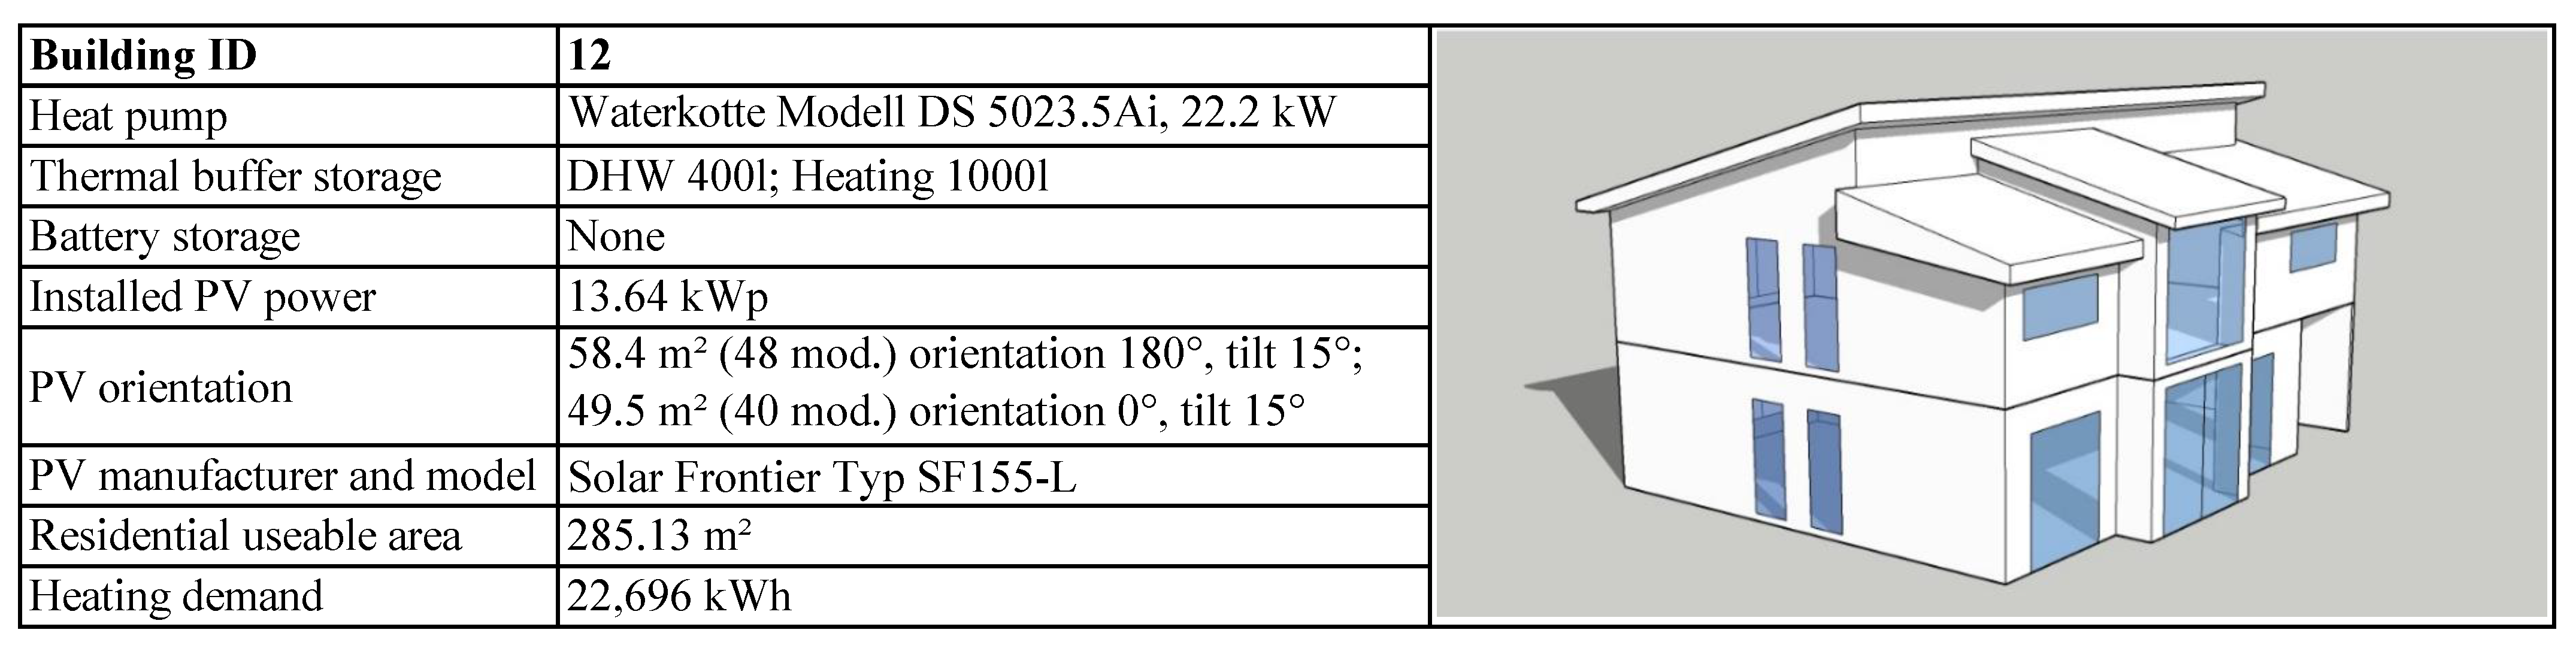
2.1. Boundary Conditions

This study is based on a residential building located within a plus-energy settlement situated in the German municipality of Wüstenrot. It includes a heat pump fed by a cold district heating grid that operates at lower temperatures, supplemented by two thermal buffer storage tanks and a PV system. The specific building parameters are shown in Figure 1. Additionally, over the span of multiple years, detailed measurements of all relevant energy flows were gathered in high resolution.
Building upon this dataset, a detailed white-box model was created within the INSEL simulation environment. This model was calibrated based on the collected empirical data and subsequently validated. This calibration and validation approach is described in detail in [27,28]. For a more in-depth understanding of the configuration of the local cold district heating grid and the plus-energy settlement, additional insights can be found in [29].
A metaheuristic optimization was chosen due to the model being run as a co-simulation, with the optimization being realized in Python 3.10 and the building and energy supply model in INSEL. This was carried out because INSEL achieves more detailed results of the energy supply system compared to common solutions in Python, like OemOf [30]. The control variables of the optimization were thermal heat pump power rating (15–25 kW), DHW and space heating buffer storage sizes (500–3000 L), battery storage capacity (0–20 kWh), PV peak power (0–20 kWp), and rated wind turbine power (0–20 kW) in 1 kW or 100 l steps. The optimizations were carried out for a time span of an entire year with a time resolution of one minute for each pilot site.
With this validated digital twin, different locations in Germany and abroad were investigated, based on measured data of wind speed, global radiation, ambient temperature, and ground or brine temperature. An overview of the general conditions of the different investigated locations is given in Table 1. For the brine-side flow temperature of the heat pump, the same annual profile measured in Wüstenrot was used for the sites in Germany. For the Montreal site, a separate profile based on the mean brine temperatures for the ground-source heat pump operation in Montreal [31] was used.
Montreal was chosen due to its good data availability and its research-cooperative ties that could potentially provide a basis for future research based on this methodology, especially as Canada is a country with a high domestic heating demand and, so far, has a low utilization rate of heat pumps, especially when taking into account that 35% of the heat supply was carried out by direct electrical heating in 2021 [32].
When examining Table 2, it becomes apparent that the average annual wind speed at the locations ranges between 1.5 m/s and 5.1 m/s over a ten-year average. This aligns with a geospatial analysis of wind data derived from [33], which indicates that over 58% of potential locations in Germany fall within this range. The average annual temperature of the locations is between 7.2 °C and 10.6 °C, which, according to DIN EN 12831 [34], corresponds to 59% of locations in Germany. The Montreal site serves as a comparative case with German data. It represents an urban environment within the Canadian climate zone Dfb (Humid Continental Mild Summer, Wet All Year) [35]. However, to draw further conclusions for Canada, additional simulations for other locations in different climate zones would be necessary.
Table 1. Studied sites. Data sources: (a) [36]; (b) [37]; (c) [38]; (d) [31].
LocationData ResolutionData SourceMeasurement Height [m]Hub Height [m]Roughness Exponent [-]
Aachen10 min DWD   ( a ) 5100.16
Braunlage10 min DWD   ( a ) 8150.28
Greifswald10 min DWD   ( a ) 5100.28
Potsdam10 min DWD   ( a ) 18150.28
Stuttgart30 minCFD simulation   ( b ) 3030no scaling
Wüstenrot1 hOwn measurements5150.28
Montreal1 h ECCC   ( c , d ) 2020no scaling
The weather data on which the simulations are based (wind speed, global radiation, and ambient temperature) represent the year 2019. Looking at Table 2, it can be seen that, for the year 2019, the mean values deviate only slightly from the 10-year average. For the Wüstenrot and Stuttgart sites, insufficient historical data were available for comparison. The measured average wind speeds range between 1.5 m/s at the Stuttgart site and 5.1 m/s at the Aachen site. It should be mentioned that, under the current framework conditions, an average annual wind speed of 4.0 m/s and above can be assumed to be sufficient for the economic operation of small wind turbines [39].

2.2. Overall System Cost Function

The objective function of the optimization is based on a dynamic economic evaluation using the annuity method according to VDI 2067 Wirtschaftlichkeit gebäudetechnischer Anlagen [40]. The economic evaluation is calculated in the form of the equivalent annual cost (EAC). This consists of the annual expenditures for the investment, operation, and maintenance of the various system components. The EAC is calculated according to the following Equation (1):
f E A C = f H a r d w a r e + f E n e r g y
Here, f H a r d w a r e is calculated by the following Equation (2):
f H a r d w a r e = i P i + i O M i
O M i [€] is the sum of the annual fixed and variable operating and maintenance costs of the specific system component i (usually a percentage of P i ). P i [€] is the annualized capital cost of the investment for the specific system component i, calculated according to the following Equation (3):
P = P V · r i 1 ( 1 + r i ) n L i f e
where PV [€] is the present value of the total investment, including possible subsidies, r i [%] is the annual interest rate, and n L i f e [years] is the estimated lifetime of the investment. The energy cost of this system (see Equation (4)) consists of the amount of electricity Q i , i n [kWh] purchased from the grid and the amount of electricity Q i , o u t [kWh] fed into the grid, in conjunction with the respective specific prices. For the fed-in electricity, a distinction is made here between different feed-in tariffs for the PV system and small wind turbine. For the total electricity costs, the sum of the electricity grid purchase with a purchase price of c i , i n [€/kWh] and the sum of the electricity fed in with a feed-in tariff of c i , o u t [€/kWh] are considered.
f E n e r g y = i Q i , i n · c i , i n i Q i , o u t · c i , o u t

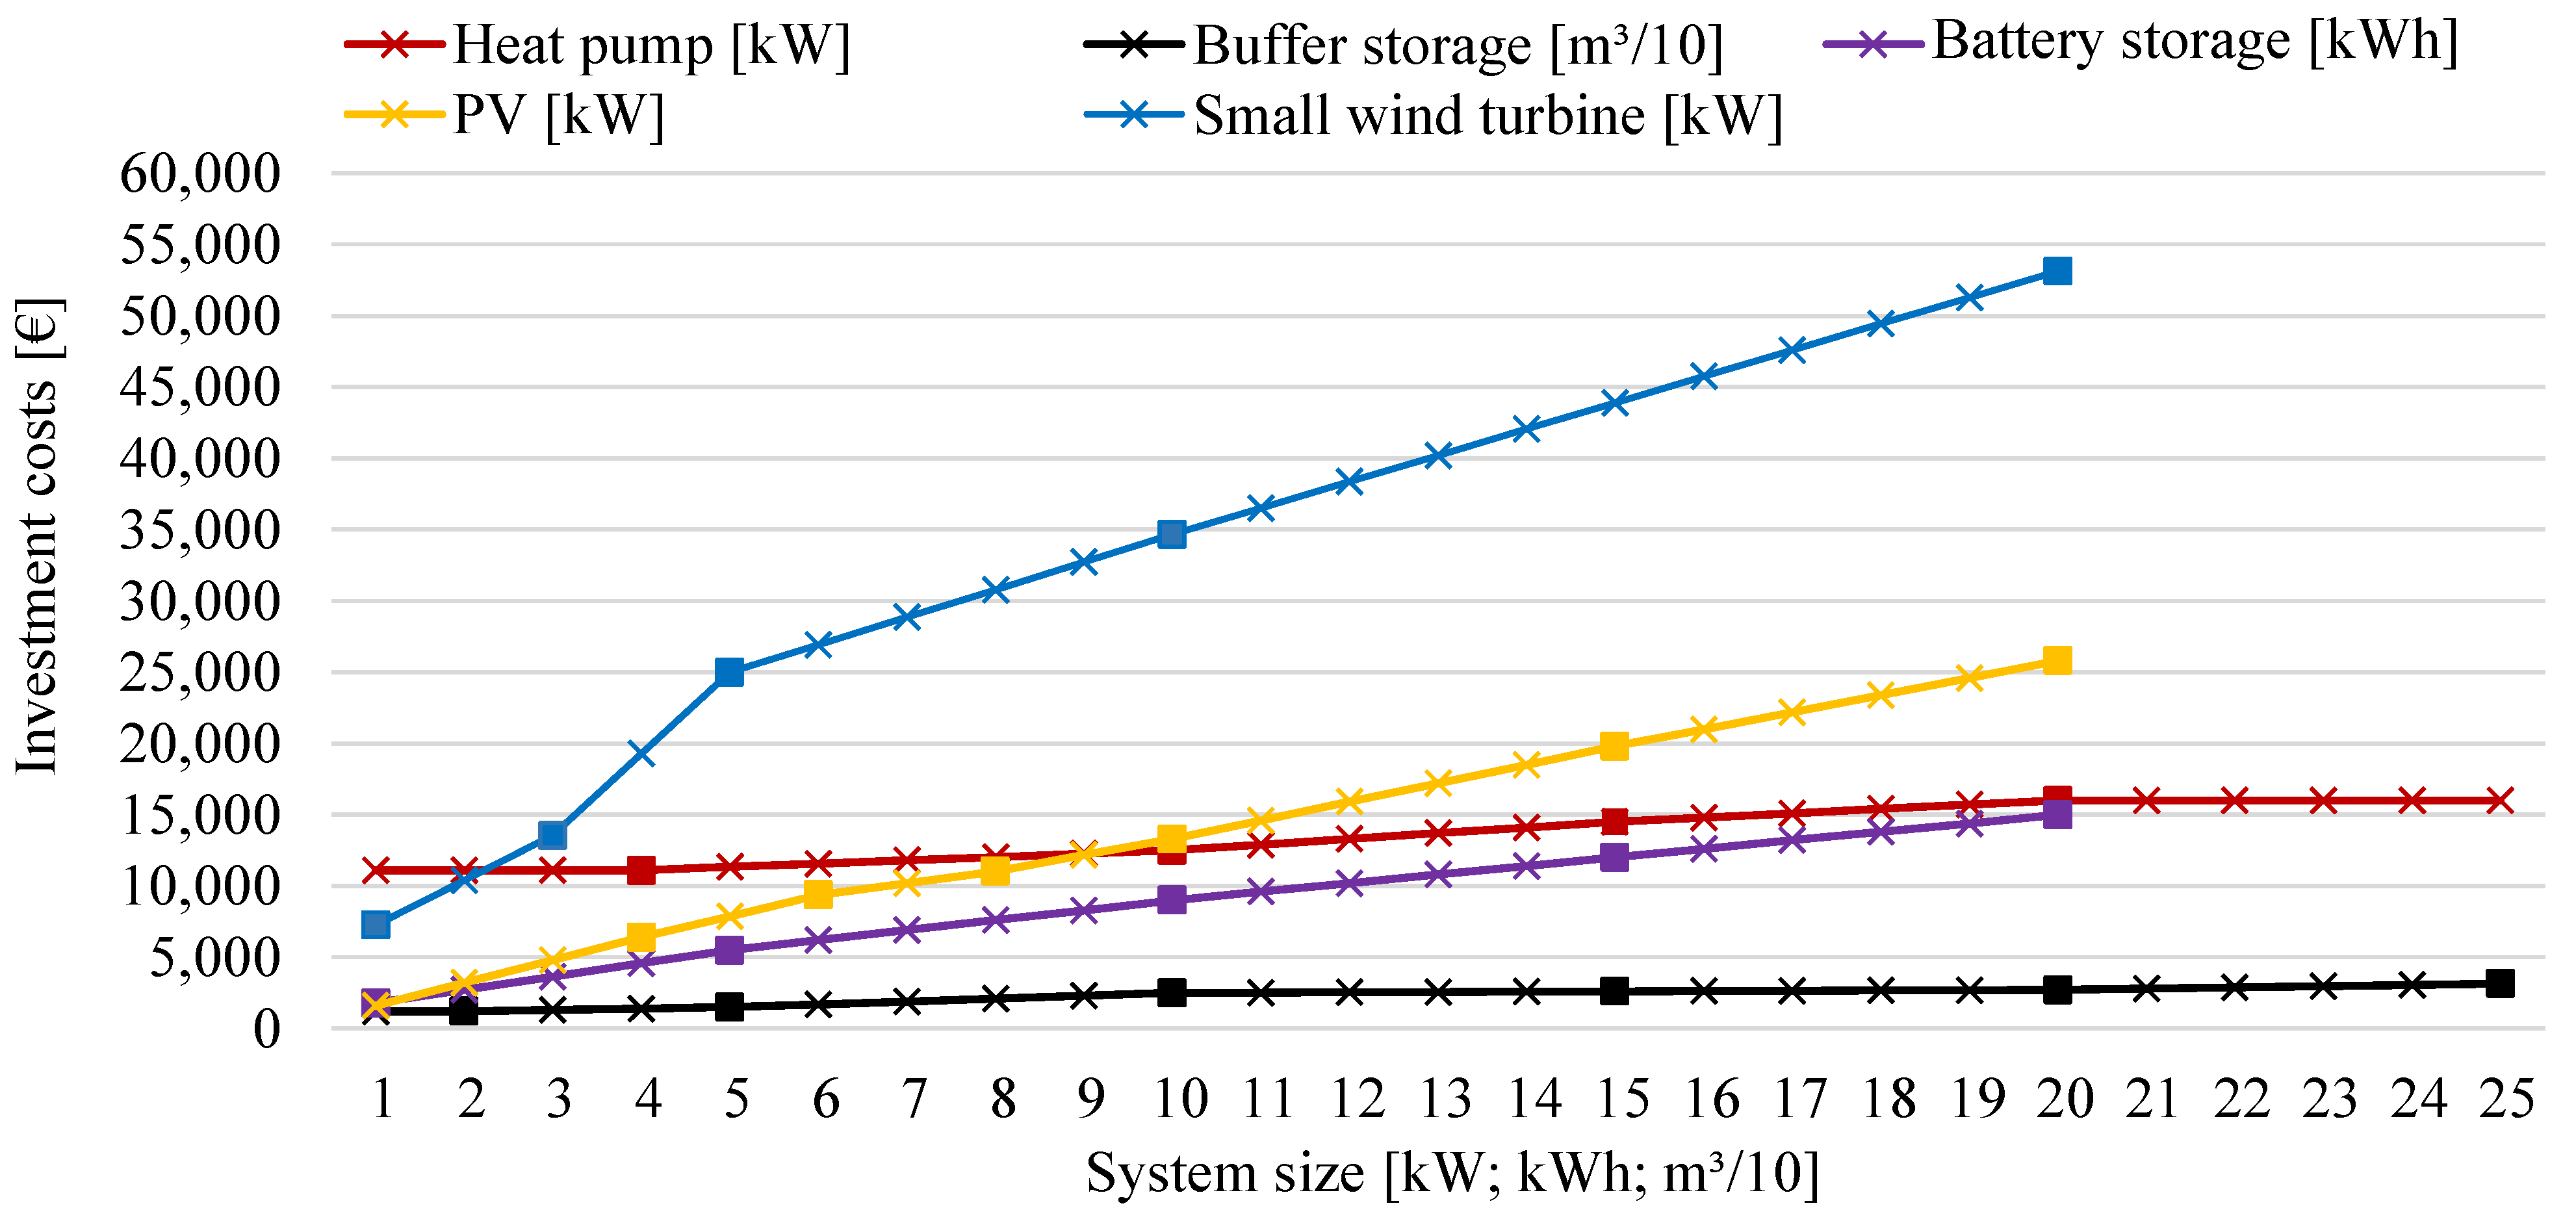
2.3. Investment Costs

The calculated investment costs of the different energy supply systems depending on their dimensioning and the maintenance costs, as well as the assumed lifetime, are presented in the Appendix A in Table A1.
Figure 2 shows the linear interpolation of investment costs over the individual system variables considered in the optimization. The investment costs include the installation costs. Subsidies are not taken into account since there are significant regional differences, e.g., for battery storages. The power output or demand of the heat pump and the PV system is scaled linearly. For the small wind turbine, the characteristic curves published by the manufacturer were used for turbines of the types Aeolos-V 1 kW, Aeolos-V 3 KW, Aeolos-V 5 kW, and Aeolos-V 10 kW. Between these sizes, the characteristic curves were interpolated. This is shown in Figure 3.
For all variants, the interest rate is set to 3%. A monthly connection fee of EUR 7 per installed kW of thermal heat pump capacity is assumed for the connection to the cold district heating network. The feed-in tariff for the PV system is assumed to be 0.0653 EUR/kWh for a size up to 10 kWP, and 0.0634 EUR/kWh for a size between 10 kWp and 30 kWp, which corresponds to the subsidy rates in Germany as of April 2022.
The feed-in tariff for the small wind turbine is assumed to be 0.0618 EUR/kWh and the electricity purchase price is assumed to be 0.34 EUR/kWh. This also corresponds to the costs in April 2022. In the course of 2022, the electricity purchase prices have increased, in some cases significantly, by up to 70%. However, this situation appears to be easing and, according to [41], household prices for new customers are now back to an average of 0.32 EUR/kWh, whereas, for existing customers, they are 0.44 EUR/kWh with a downward trend.

3. Results

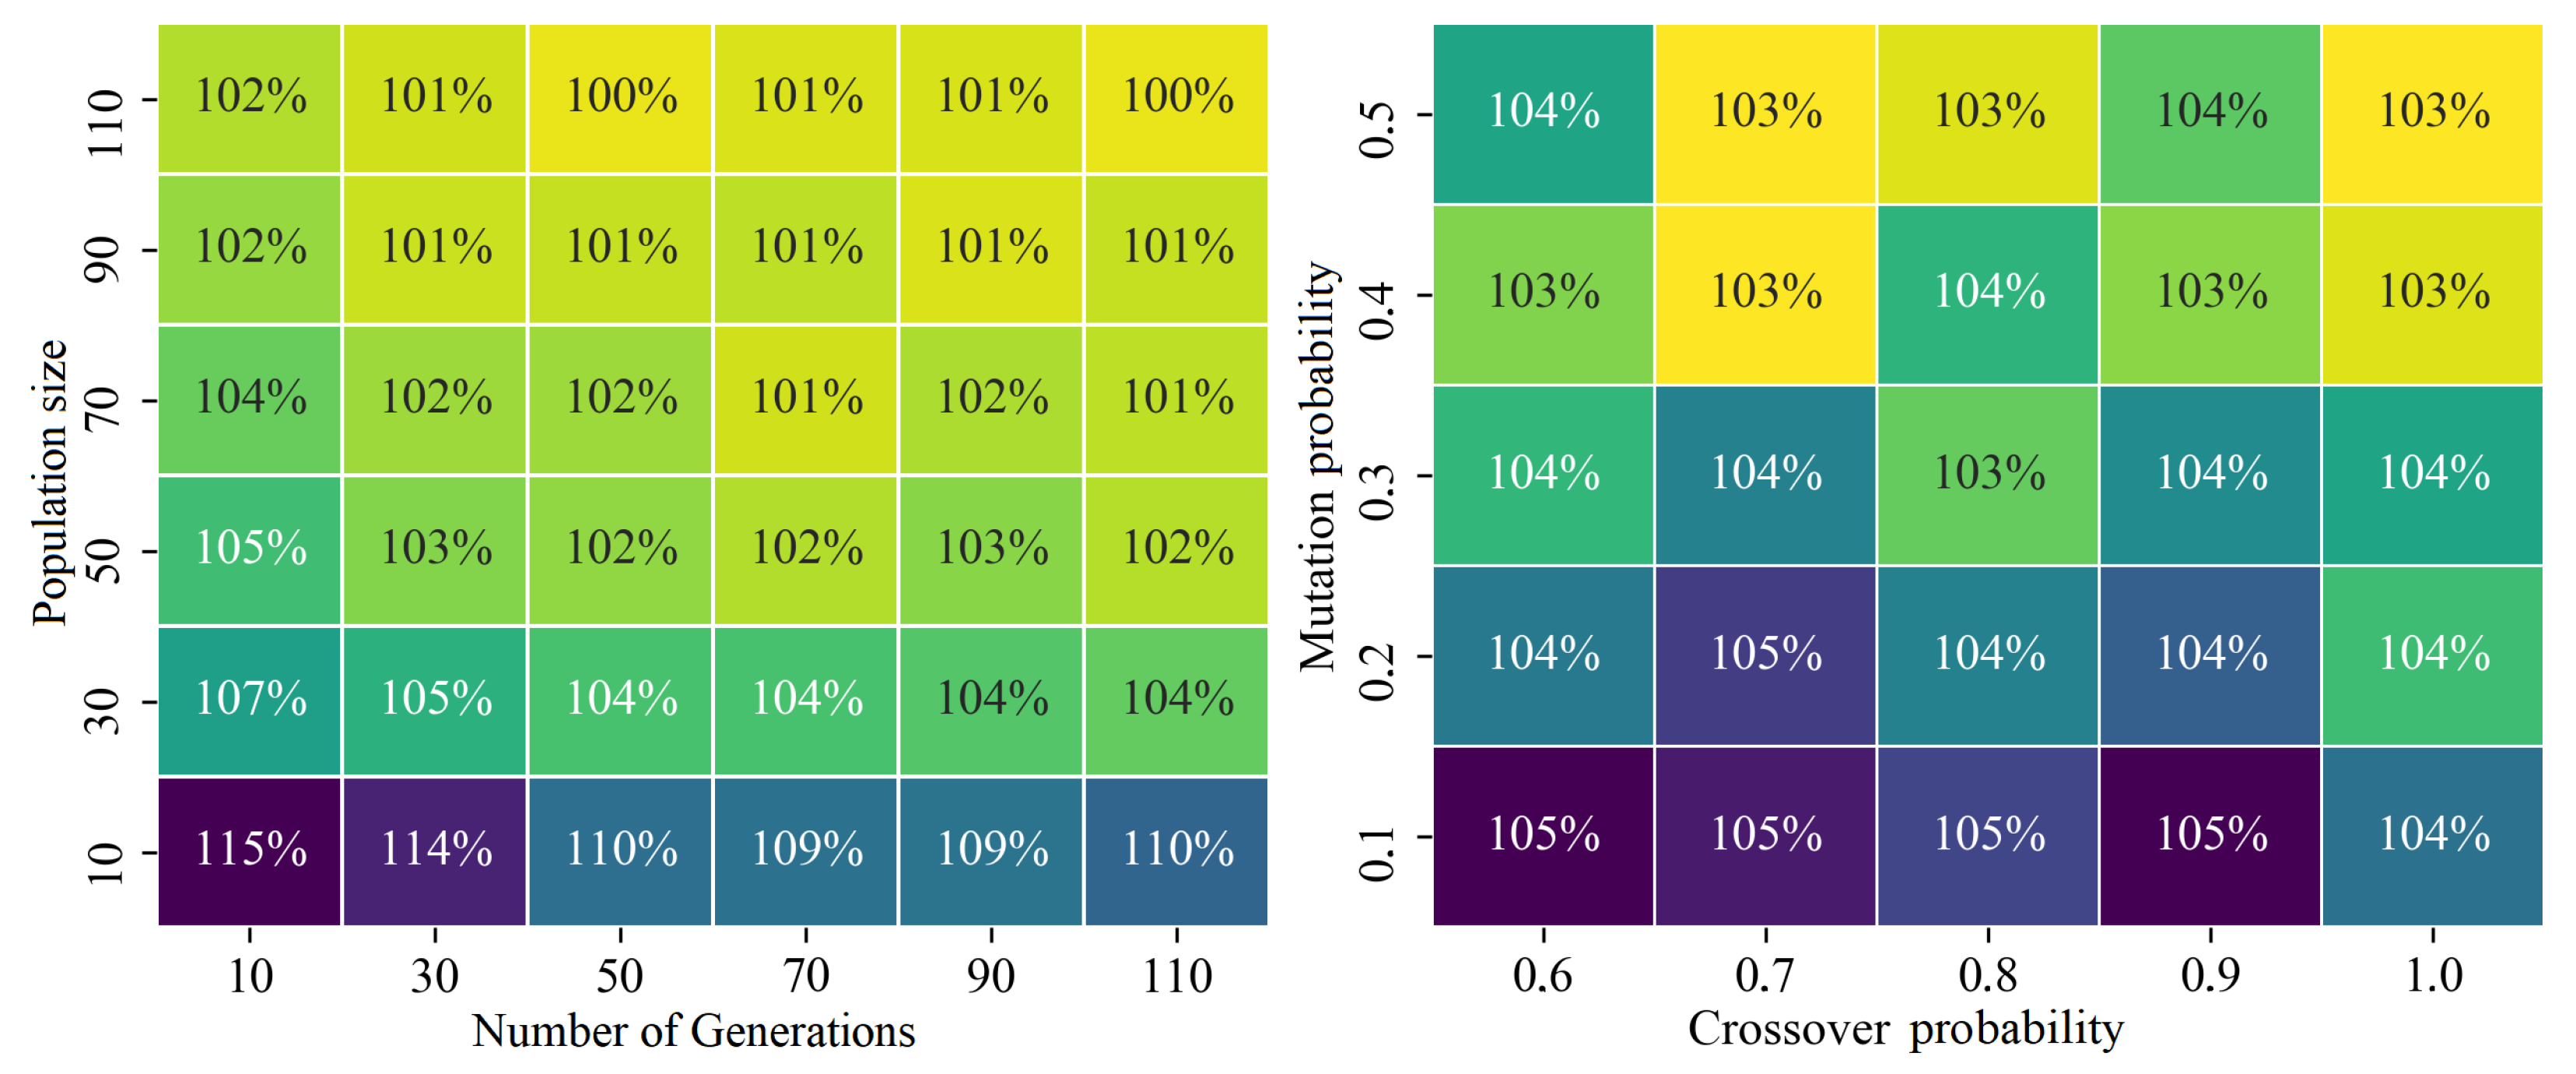
3.1. Optimal Parameters for Genetic Algorithms

To identify optimal parameters for the utilized genetic algorithm application, aiming to find the right balance between computational efficiency and proximity to a global optimum, an iterative study was carried out as outlined in [19]. This involved an incremental iteration in which the number of generations and the population size were adjusted in increments of 20, ranging from 10 to 110. Simultaneously, the crossover probability was iterated in intervals of 0.1, spanning from p c = 0.6 to p c = 1.0 . Additionally, the mutation probability underwent incremental changes in steps of 0.1, ranging from p m = 0.1 to p m = 0.5 . The selection of these parameter bounds for the crossover probability is grounded in their established prevalence within the literature [42,43]. As for the mutation probability limits, these were determined empirically. To mitigate result variances, which are particularly noticeable when dealing with a low number of generations or a small population size, each parameter combination underwent three separate computations.
The culmination of these varied parameter combinations is visually depicted in Figure 4a,b. The percentage values associated with these figures denote the increase in costs, serving as a gauge of deterioration relative to the most optimal outcome.
It can be seen in Figure 4a that population size has a stronger influence than the number of generations. The overall relatively small deterioration of up to 115% can be attributed to the fact that this value represents the average of the different iterated crossover and mutation probabilities. Thus, it includes all good and bad combinations. Looking at the results of the varied population size and number of generations in Figure 4a, we see a balance between computation time and result quality for a population size of 90 combined with a number of 30 generations. Looking at the results of varying crossover and mutation probabilities in Figure 4b, the best results are obtained in conjunction with a crossover probability of 0.7 ≤ p c ≤ 1.0 and with a mutation probability of 0.4 ≤ p m ≤ 0.5. Based on this, the following parameters are considered optimal for the present use case of optimized dimensioning [19].
  • Number of generations: 30;
  • Population size: 90;
  • Two-point crossover; crossover probability: 1.0;
  • Uniform mutation; mutation probability: 0.5;
  • Competition selection; tournament size: 5.

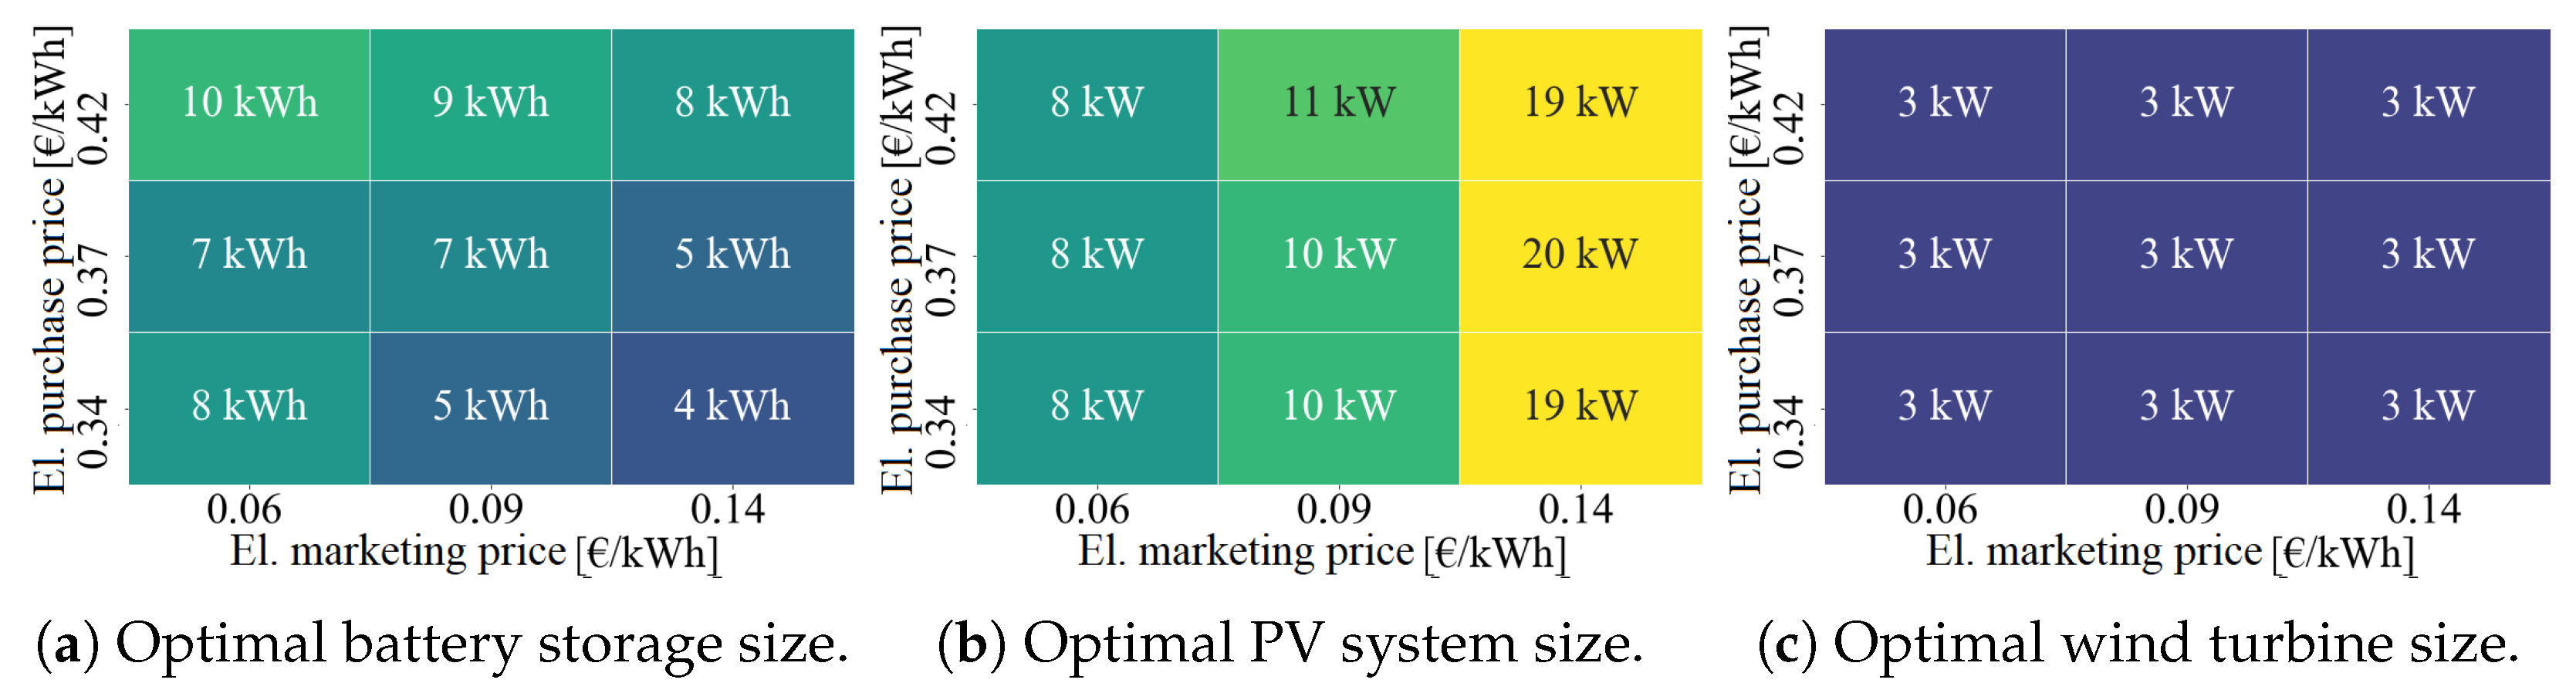
3.2. Current Framework Conditions

To provide a starting point for comparison, optimized dimensioning of the components is first performed for all sites based on current conditions in terms of electricity purchase prices, electricity marketing prices, and investment costs. This is shown in Table 3.
This shows that small wind turbines can only be operated economically in the locations with high wind potential, Aachen and Montreal. The same is true for battery storage, which, despite an installed PV system and heat pump operation, would only be economical in the case of an additional small wind turbine and, even then, only at a very small size (1–2 kWh). The size of the heating buffer storage is moderate at 0.5–0.8 m3. The PV system is sized to between 4 and 9 kWp depending on the irradiance of the site.

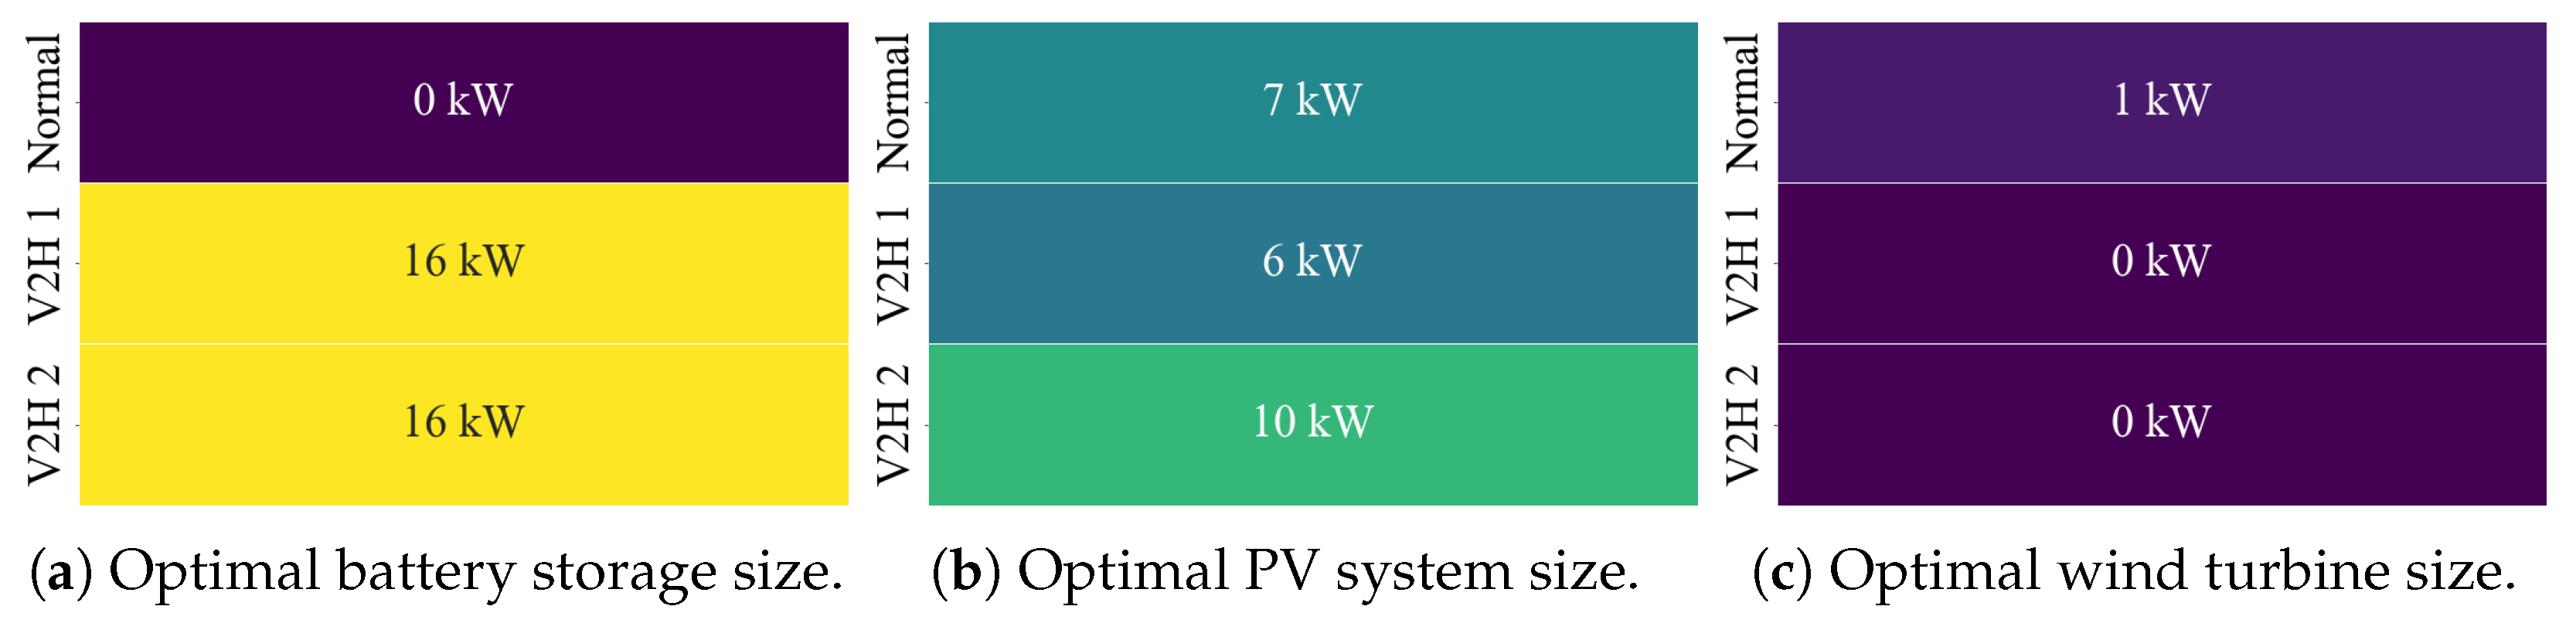
3.3. Current Framework Conditions with Vehicle-to-Home

To investigate the impact of the ever-increasing number of BEVs and the associated storage potential in the context of a vehicle-to-home application, one BEV was added to each of the sites under the current framework conditions. The assumption here is that the applied 80 kWh vehicle battery will be used between a 40% and 60% of SOC, if possible, in order to ensure a high cycle stability of the battery. This means that the upper limit is 48 kWh, the lower limit is 32 kWh, and, thus, the usable capacity is 16 kWh. The efficiency for combined charging and discharging is assumed to be 80%. Furthermore, two different driving profiles are investigated, the first being commute to work, and the second being usage as a secondary car, which has longer parking hours at home at the charging port. These profiles are based on data from the German mobility atlas [44] and driving and demand profiles derived from [45]. Charging and discharging of the vehicle took place whenever they were available. Since no load management was implemented in this case, uncertainty regarding availability was not taken into account. The primary motivation for including this variant is to determine whether using the BEV’s battery as temporary storage, without incurring additional investment costs, could improve the economic viability of small wind turbines.
The results for the first driving profile, which generally has an absence of the vehicle during the day on weekdays at times of greatest PV power production, are shown in Table 4. The results for the second driving profile, which has a greater presence of the vehicle and thus greater flexibility, are shown in Table 5.
It can be seen that, for the driving profile of the first car, commuting to work as shown in Table 4, the dimensioning of the PV system is the same size or partly smaller depending on the location compared to the dimensioning without the BEV as shown in Table 3. This can be attributed, among other things, to the fact that the BEV is not available at times of highest PV power generation and that the efficiency for combined charging and discharging is lower compared to a fixed battery storage (80% vs. 90%). It should be noted here that the financial differences in the sizing of the individual components are sometimes quite close. For example, in the case of Wüstenrot, increasing the PV system to 8 kWp would only mean a difference of EUR 27 per year in the overall balance. The economic efficiency of a small wind turbine is not improved with this driving profile in connection with the assumed framework conditions. In the case of the Montreal site, it even gets worse. In the first-car, commute-to-work variant, the energy costs of the entire system (household electricity demand, heat pump, and BEV) remain roughly constant compared to the variant without the BEV, despite the additional purchase of 2410.7 kWh of electricity for the BEV, because vehicle-to-home use can increase electricity self-consumption without additional investment costs.
Regarding the second-car driving profile, it can be seen in Table 5 that, due to the higher availability of the BEV and the resulting greater flexibility, the dimensioning of the PV system is significantly larger. On average, a 49% larger PV system would make sense compared to the dimensioning without the BEV (see Table 3). At the same time, under the current conditions, there is no positive impact on the size of the small wind turbine, but this could be different under possible future scenarios. In the case of the Montreal site, as with the first-car, commute-to-work driving profile, it actually becomes worse, which can be attributed to the lower availability and efficiency of the vehicle battery charging and discharging process compared to stationary battery storage. Due to the increased self-consumption, the electricity costs of the entire system even decrease noticeably in the variant second-car driving profile, despite the 1366.3 kWh increase in demand due to the BEV. However, these economic evaluations do not include any possible damage to the vehicle battery due to additional cycles. According to a study carried out previously, this would be between EUR 175.5 and EUR 271.6 per year, depending on the driving profile, whereby the number of cycles in the variants studied is higher than in the case studied here due to optimized charge load management. In this context, however, it must also be considered that bidirectional operation takes place in the range of an SOC between 40% and 60%, which means a high cycle stability and thus the vehicle’s service life possibly being reached sooner despite vehicle-to-home operation, rather than the vehicle battery falling below 80% in capacity [46].

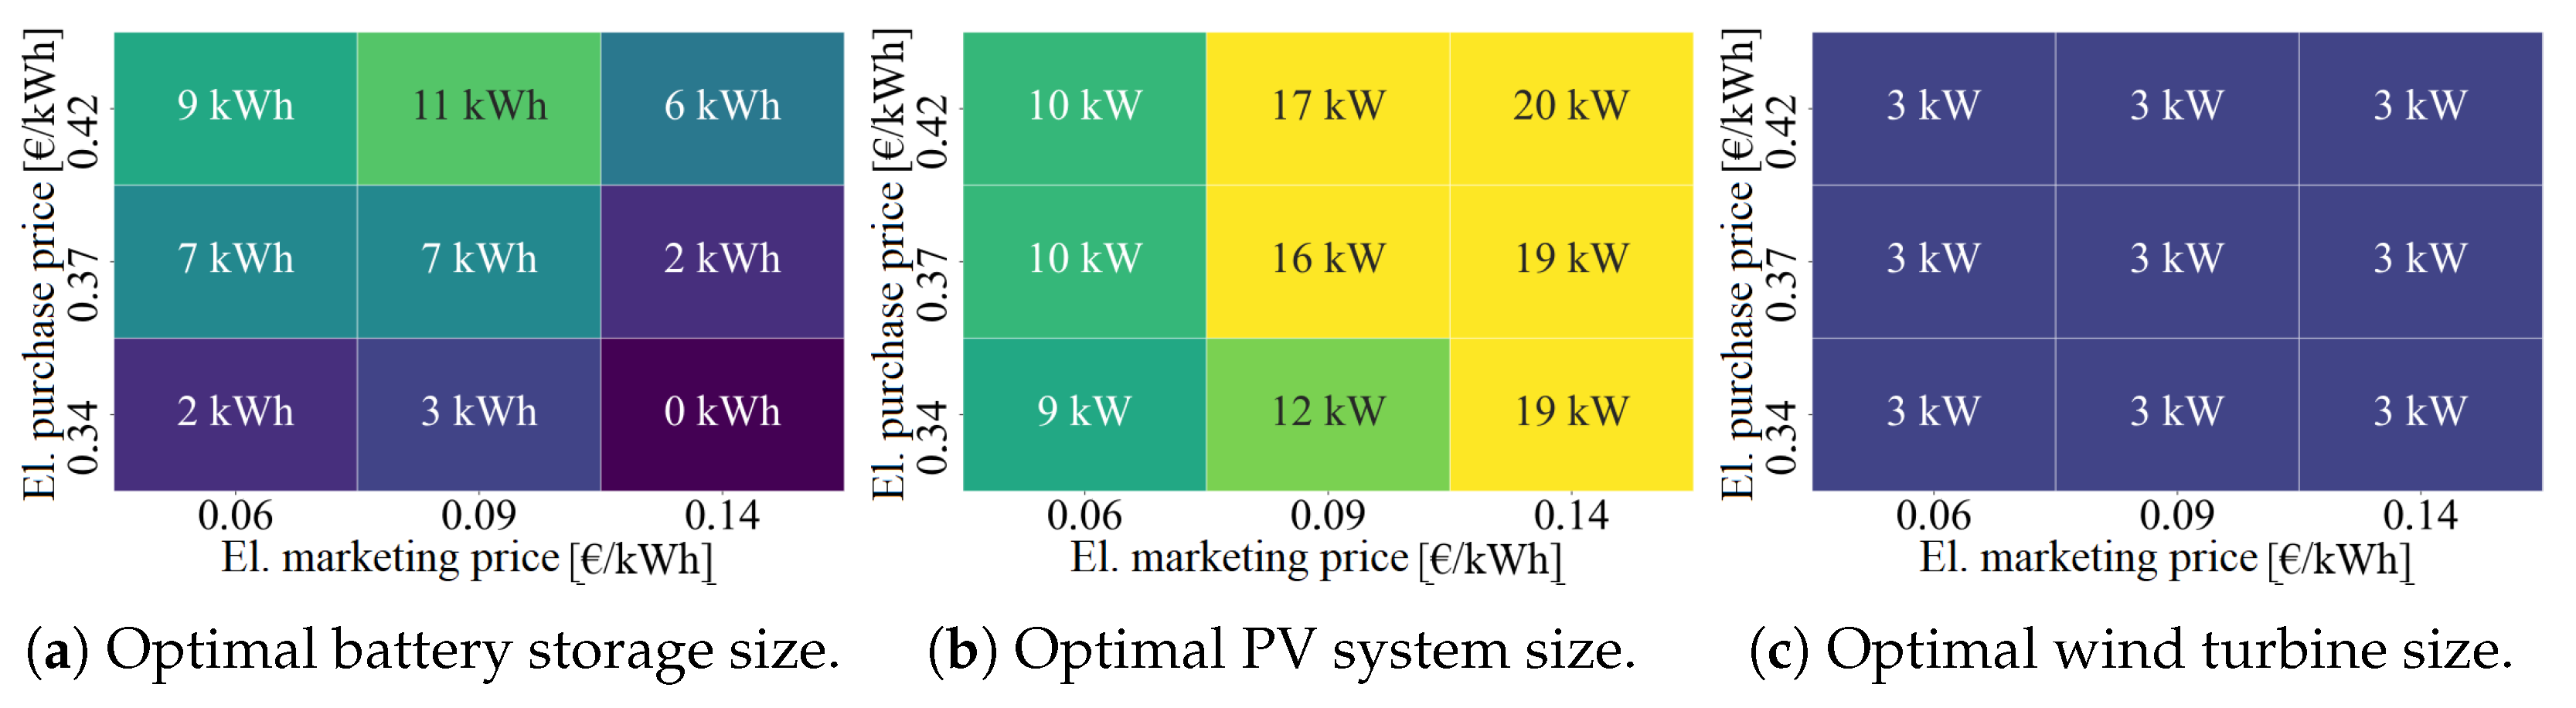
3.4. Future Framework Conditions

In the following, the system components are dimensioned for the different locations with respect to increasing electricity purchase and electricity marketing prices and decreasing capital costs. Thereby the system components are each dimensioned for various cost combinations. These are an electricity purchase price of 0.34 EUR/kWh, 0.37 EUR/kWh, and 0.42 EUR/kWh; an electricity marketing price of 0.06 EUR/kWh, 0.09 EUR/kWh, and 0.14 EUR/kWh; and an investment cost reduction of the battery storage and the small wind turbine by 25% and by 50%, respectively. The costs of the remaining system components (heat pump, PV system, and thermal buffer storage) remain constant with respect to the calculation time of the dimensioning, which would otherwise increase eightfold. This restriction is accepted since this work primarily focuses on the potential of small wind turbines and, also, research indicates that battery storage cost development will play a more important role compared to PV cost development in future scenarios, as the future adoption of PV and PV-T (thermal) systems is expected to depend heavily on advancements in energy storage technologies that are both efficient and economical [47]. Over the past 12 years, the total installation costs for large PV systems have declined significantly, with an average annual decrease of approximately 12%. However, the costs for non-module components such as inverters, mounting systems, switches, wiring, and installation work have remained relatively stable since 2014 [48]. Recent estimates place the unit investment costs for PV systems at around 870 USD/kWp, with projections indicating a drop to below 700 USD/kWp shortly after 2030 and further reductions to approximately 560 USD/kWp by 2050 [49]. In parallel, lithium-ion battery technology is expected to see substantial cost reductions. The cost of battery cells is anticipated to decrease by nearly 50% between 2023 and 2030, driven by advancements in production techniques and economies of scale [50].

3.5. Aachen, Germany

Figure 5a–c show the optimal battery storage, PV system, and small wind turbine sizes for the Aachen site for different electricity purchase and marketing prices, with an investment cost reduction of 25% for a small wind turbine and battery storage compared to today’s prices. In Figure 6a–c, this is carried out for an investment cost reduction of 50%. Thereby, green and more yellow colors indicate that a large system is more economical. The detailed results showing the specific annual investment, maintenance, and energy costs, as well as the dimensioning of the additional system components (heat pump and heating and domestic hot water (DHW) buffer storage), are presented in the Appendix A in Table A2.
It can be seen that the operation of a small wind turbine is economical for all constellations. However, this is already the case for this location under the current framework conditions. The optimal size is 3 kW. The battery storage size is equally influenced by the electricity purchase price and the electricity marketing price for a 25% investment cost reduction. In the most favorable case (electricity purchase price of 0.42 EUR/kWh; electricity marketing price of 0.06 EUR/kWh), a battery storage size of 8 kWh would be the most economical. In the worst case (electricity purchase price of 0.34 EUR/kWh; electricity marketing price of 0.14 EUR/kWh), the installation of a battery storage would not make sense. With a 50% investment cost reduction, it can be seen with regard to the battery storage that the storage sizes representing the best economic efficiency are significantly larger. Even in the worst case, a battery storage of 7 kWh would still be the most economical. The dimensioning of the PV system shows a relatively small influence of the battery storage size on the economic efficiency. The electricity purchase price has a moderate effect on the economic efficiency, while the electricity marketing price has a significant effect. In the most favorable case of an electricity marketing price of 0.14 EUR/kWh, a PV system size between 19 and 20 kWp would be the most economical. In the worst case (electricity purchase price of 0.34 EUR/kWh; electricity marketing price of 0.06 EUR/kWh), a PV system size of 4 kWp would be the most economical. The optimal heat pump size is 15 kW throughout, and the optimal buffer storage sizes vary between 0.5 m3 and 0.9 m3 for heating and DHW storage for all combination options.

3.6. Braunlage, Germany

Figure 7a–c show the optimal battery storage, PV system, and small wind turbine sizes for the Braunlage site for different electricity purchase and marketing prices, with an investment cost reduction of 25% for a small wind turbine and battery storage compared to today’s prices. In Figure 8a–c, this is carried out for an investment cost reduction of 50%. Thereby, green and more yellow colors indicate that a large system is more economical. The detailed results showing the specific annual investment, maintenance, and energy costs, as well as the dimensioning of the additional system components (heat pump and heating and DHW buffer storage), are presented in the Appendix A in Table A3.
In the case of this site, the dimensioning shows clear differences with regard to the different investment costs for the battery storage and small wind turbine, which can be attributed to the lower yield of the small wind turbine. In the case of an investment cost reduction of 25%, a small wind turbine would thus only make sense at an electricity purchase price of 0.42 EUR/kWh and an electricity marketing price of 0.09 EUR/kWh or 0.14 EUR/kWh. For an investment cost reduction of 50%, the operation of a small wind turbine would make sense for all electricity purchases and electricity marketing price constellations. The best small wind turbine size would be 3 kW. The optimal battery storage size at a 25% investment cost reduction is influenced by the electricity production, the electricity purchase price, and the electricity marketing price. In the best case (3 kW small wind turbine; 20 kWp PV system; electricity purchase price of 0.42 EUR/kWh; electricity marketing price of 0.14 EUR/kWh), a battery storage size of 8 kWh would be the most economical. At an electricity purchase price of 0.34 EUR/kWh, a battery storage system does not make sense for all electricity marketing prices. With a 50% investment cost reduction, it can be seen with regard to the battery storage that it makes sense for all constellations. At an electricity purchase price of 0.34 EUR/kWh, storage sizes of 3–7 kWh would make sense, depending on the electricity marketing price and the size of the PV system. For an electricity purchase price of 0.42 EUR/kWh, which favors the use of a battery storage, the optimal storage size would be between 10 kWh and 11 kWh. Looking at the detailed results in Table A3, it can also be seen that, if the investment cost of the small wind turbine is reduced by 50% and that of the battery storage is reduced by 25%, the most economic small wind turbine size would be the same as for the variant of the investment cost reduction of the small wind turbine and battery storage by 50%. The small wind turbine investment cost has the greater impact here. The sizing of the PV system shows a relatively small influence of the battery storage size. The electricity purchase price has a moderate impact, while the electricity marketing price has a significant impact. In the most favorable case of an electricity marketing price of 0.14 EUR/kWh, a PV system size between 19 and 20 kWp would be the most economical. In the worst case (electricity purchase price of 0.34 EUR/kWh; electricity marketing price of 0.06 EUR/kWh), a PV system size of 4 kWp would be the most economical. The optimal heat pump size is 15 kW throughout, and the optimal buffer storage sizes vary between 0.5 m3 and 0.8 m3 for heating and DHW storage for all combination options.

3.7. Greifswald, Germany

Figure 9a–c show the optimal battery storage, PV systems, and small wind turbine sizes for the Greifswald site for different electricity purchase and marketing prices, with an investment cost reduction of 25% for a small wind turbine and battery storage compared to today’s prices. In Figure 10a–c, this is carried out for an investment cost reduction of 50%. Thereby, green and more yellow colors indicate that a large system is more economical. The detailed results showing the specific annual investment, maintenance, and energy costs, as well as the dimensioning of the additional system components (heat pump and heating and DHW buffer storage), are presented in the Appendix A in Table A4.
In the case of the Greifswald site, there are clear differences in the dimensioning depending on the investment cost reduction, especially for the battery storage size. Compared to the current situation in Table 3, a small wind turbine would make sense for all combination options with an investment cost reduction of 25%, except for an electricity purchase price of 0.34 EUR/kWh and an electricity marketing price of 0.06 EUR/kWh or 0.09 EUR/kWh. The best small wind turbine size here would be 3 kW. For an investment cost reduction of 50%, the operation of a small wind turbine would make sense for all electricity purchases and electricity marketing price constellations. The best small wind turbine size would also be 3 kW. The optimal battery storage size at a 25% investment cost reduction is influenced by the expected yield, the electricity purchase price, and the electricity marketing price. In the best case (3 kW small wind turbine; 5 kWp PV system; electricity purchase price of 0.42 EUR/kWh; electricity marketing price of 0.06 EUR/kWh), a battery storage size of 6 kWh would be the most economical. At an electricity purchase price of 0.34 EUR/kWh and an electricity marketing price of 0.06 EUR/kWh and 0.14 EUR/kWh, as well as at an electricity purchase price of 0.37 EUR/kWh and an electricity marketing price of 0.14 EUR/kWh, a battery storage system does not make sense. With a 50% investment cost reduction, it can be seen with regard to the battery storage that it makes sense for all constellations. The optimal storage sizes would be between 4 kWh and 9 kWh, depending on the electricity purchase price, electricity marketing price, and PV system size. Looking at the detailed results in Table A4, it can also be seen that, if the investment cost of the small wind turbine is reduced by 25% and the battery storage is reduced by 50%, the most economic small wind turbine size would be the same as the variant of the investment cost reduction of the small wind turbine and battery storage by 50%. Thus, in this case, the battery storage investment cost has the greater impact. In the dimensioning of the PV system, the battery storage size shows relatively little influence on the dimensioning, except in the case of the battery storage investment cost reduction of 25% with an electricity marketing price of 0.06 EUR/kWh and an electricity purchase price of 0.37 EUR/kWh or 0.42 EUR/kWh. In this case, the reduction in the investment costs of the battery storage and the small wind turbine contributes to making the operation of a small wind turbine economical. Similarly, the installation of a battery storage greater than 5 kWh is unprofitable. This means that the PV system and the small wind turbine must share the limited storage capacity. Since wind power is prioritized here, this leads to smaller sizing of the PV system. The electricity marketing price also has a significant impact on the size of the PV system. In the most favorable case of an electricity marketing price of 0.14 EUR/kWh, a PV system size between 17 and 20 kWp would be the most economical. The optimal heat pump size is consistently 15 kW, and the optimal buffer storage sizes vary for heating and DHW storage between 0.5 m3 and 1.0 m3 for all combination possibilities.

3.8. Potsdam, Germany

Figure 11a–c show the optimal battery storage, PV system, and small wind turbine sizes for the Potsdam site for different electricity purchase and marketing prices, with an investment cost reduction of 25% for a small wind turbine and battery storage compared to today’s prices. In Figure 12a–c, this is carried out for an investment cost reduction of 50%. Thereby, green and more yellow colors indicate that a large system is more economical. The detailed results showing the specific annual investment, maintenance, and energy costs, as well as the dimensioning of the additional system components (heat pump and heating and DHW buffer storage), are presented in the Appendix A in Table A5.
In the case of the Potsdam site, there are significant differences in the dimensioning depending on the investment cost reduction, especially for the battery storage size. Compared to the current situation in Table 3, a small wind turbine would make sense with an investment cost reduction of 25%, except for an electricity purchase price of 0.34 EUR/kWh and an electricity purchase price of 0.37 EUR/kWh in combination with an electricity marketing price of 0.14 EUR/kWh. The best small wind turbine size here would be 3 kW. For an investment cost reduction of 50%, the operation of a small wind turbine would make sense for all electricity purchases and electricity marketing price constellations. The best small wind turbine size would also be 3 kW. The optimal battery storage size at a 25% investment cost reduction is influenced by the expected yield, the electricity purchase price, and the electricity marketing price. At an investment cost reduction of 25%, a battery storage system only makes sense in combination with a small wind turbine. In the best case (3 kW small wind turbine; 9 kWp PV system; electricity purchase price of 0.42 EUR/kWh; electricity marketing price of 0.06 EUR/kWh), a battery storage size of 7 kWh would be the most economical. With a 50% investment cost reduction, it is shown with regard to the battery storage that its use is economical for all constellations. Depending on the electricity purchase price, electricity marketing price, and PV system size, the optimal storage sizes would be between 4 kWh and 10 kWh. Looking at the detailed results in Table A4, it can be seen that, compared to the investment cost reduction of the battery storage, the investment cost reduction of the small wind turbine is the significant cause for the improvement in the economic efficiency of the hybrid system. In the PV system dimensioning, the battery storage size is shown to have a relatively small impact on the sizing. The electricity marketing price has the most significant impact on the PV system size. In the most favorable case of an electricity marketing price of 0.14 EUR/kWh, a PV system size between 18 and 20 kWp would be the most economical. The optimal heat pump size is consistently 15 kW, and the optimal buffer storage sizes vary between 0.5 m3 and 0.8 m3 for heating and DHW storage for all combination options.

3.9. Stuttgart, Germany

Figure 13a–c show the optimal battery storage, PV system, and small wind turbine sizes for different electricity purchase and marketing prices for the Stuttgart site, with an investment cost reduction of 25% for a small wind turbine and battery storage compared to today’s prices. In Figure 14a–c, this is carried out for an investment cost reduction of 50%. Thereby, green and more yellow colors indicate that a large system is more economical. The detailed results, showing the specific annual investment, maintenance, and energy costs, as well as the dimensioning results of the other systems (heat pump and heating and DHW buffer storage), are presented in the Appendix A in Table A6.
In the case of the Stuttgart site, there are significant differences in the dimensioning depending on the investment cost reduction, especially for the battery storage size. The operation of a small wind turbine would not be economical in any of the scenarios, as was already the case under the current framework conditions shown in Table 3. At a 25% investment cost reduction, the optimal battery storage size is influenced by the expected revenue, the electricity purchase price, and the electricity marketing price. At an investment cost reduction of 25%, a battery storage system does not make sense at an electricity purchase price of 0.34 EUR/kWh and an electricity marketing price of 0.14 EUR/kWh. For the other constellations, the most reasonable battery storage size varies between 3 kWh and 11 kWh. With a 50% investment cost reduction, it can be seen with regard to the battery storage that its use is economical for all constellations. Depending on the electricity purchase price, electricity marketing price, and PV system size, the optimal storage sizes would be between 10 kWh and 17 kWh. When dimensioning the PV system, the battery storage size shows relatively little influence on the sizing. The electricity marketing price has the most significant impact on the PV system size. In the most favorable case of an electricity marketing price of 0.14 EUR/kWh, a PV system size of 20 kWp would be the most economical. The optimal heat pump size is consistently 15 kW, and the optimal buffer storage sizes vary between 0.5 m3 and 1.1 m3 for heating and DHW storage for all combination options.

3.10. Wüstenrot, Germany

Figure 15a–c show the optimal battery storage, PV system, and small wind turbine sizes for the Wüstenrot site for different electricity purchase and marketing prices, with an investment cost reduction of a small wind turbine and battery storage by 25% compared to today’s prices. In Figure 16a–c, this is carried out for an investment cost reduction of 50%. The detailed results, showing the specific annual investment, maintenance, and energy costs, as well as the dimensioning results of the other systems (heat pump and heating and DHW buffer storage), are presented in theAppendix A in Table A7.
In the case of the Wüstenrot site, there are significant differences in the dimensioning depending on the investment cost reduction, especially in the battery storage size. The operation of a small wind turbine would not be economical in any of the scenarios, as was already the case in the actual situation shown in Table 3. With an investment cost reduction of 25%, it can be seen that a battery storage system is hardly economical. Only at an electricity purchase price of 0.42 EUR/kWh and an electricity marketing price of 0.06 EUR/kWh is the battery storage dimensioned with 4 kWh. A 50% investment cost reduction results in the best case (electricity purchase price of 0.34 EUR/kWh and an electricity marketing price of 0.14 EUR/kWh) in battery storage sizes between 10 kWh and 15 kWh. When sizing the PV system, the battery storage size shows relatively little influence on the sizing. The electricity marketing price has the most significant impact on the PV system size. In the most favorable case of an electricity marketing price of 0.14 EUR/kWh, a PV system size of 19–20 kWp would be the most economical. The optimal heat pump size is consistently 15 kW, and the optimal buffer storage sizes vary between 0.5 m3 and 1.3 m3 for heating and DHW storage for all combination options.

3.11. Montreal, Canada

Figure 17a–c show the optimal battery storage, PV system, and small wind turbine sizes for the Montreal site for different electricity purchase and marketing prices, with a 25% investment cost reduction of a small wind turbine and battery storage compared to today’s prices. In Figure 18a–c, this is carried out for an investment cost reduction of 50%. Thereby, green and more yellow colors indicate that a large system is more economical. The detailed results, showing the specific annual investment, maintenance, and energy costs, as well as the dimensioning results of the other systems (heat pump and heating and DHW buffer storage), are presented in the Appendix A in Table A8.
In the case of the Montreal site, there are clear differences in the dimensioning depending on the investment cost reduction for the battery storage size, as well as for the dimensioning of the PV system. Compared to the current situation in Table 3, a small wind turbine would make sense for all combination options with an investment cost reduction of 25% and larger. The best small wind turbine size here would be 3 kW. The optimal battery storage size at a 25% investment cost reduction is influenced by the expected yield, the electricity purchase price, and the electricity marketing price. In the best case (3 kW small wind turbine; 17 kWp PV system; electricity purchase price of 0.42 EUR/kWh; electricity marketing price of 0.09 EUR/kWh), a battery storage size of 11 kWh would be the most economical. With an electricity purchase price of 0.34 EUR/kWh and an electricity marketing price of 0.14 EUR/kWh, a battery storage system does not make sense. With a 50% investment cost reduction, it is shown with regard to the battery storage that it makes sense for all constellations. The optimal storage sizes would be between 7 kWh and 16 kWh, depending on the electricity purchase price, electricity marketing price, and PV system size. Looking at the detailed results in Table A8, we see that, in the limiting case (25% small wind turbine and 50% battery storage investment cost reduction), where the heat pump was sized to 18 kW by the algorithm, a larger small wind turbine of 7 kW would be most economical. The PV system dimensioning shows relatively little influence on the dimensioning of the battery storage. The electricity marketing price has the most significant impact on the size of the PV system. In the most favorable case of an electricity marketing price of 0.14 EUR/kWh, a PV system size between 19 and 20 kWp would be the most economical. The optimal heat pump size is between 15 kW and 18 kW, and the optimal buffer storage sizes vary between 0.5 m3 and 0.9 m3 for heating and DHW storage for all possible combinations.

4. Discussion

For the optimized sizing of a hybrid energy supply system (consisting of a heat pump, buffer storage, battery storage, PV system, and small wind turbine) for a single-family house, the best parameters for the genetic optimization algorithm were first determined iteratively. This resulted in an optimal crossover probability of 0.7 ≤ p c ≤ 1.0 in conjunction with an optimal mutation probability of 0.4 ≤ p m ≤ 0.5, with the best number of generations being 30 and the best population size being 90. Furthermore, competition selection with a tournament size of 5 was chosen as the selection method. Based on this, the system components were dimensioned for different scenarios for different locations with and without the integration of a BEV using vehicle-to-home under the current framework conditions. Under future framework conditions, different electricity purchase and electricity marketing prices were included in the dimensioning, with a gradual reduction in the investment costs of the small wind turbine and battery storage.

4.1. Current Framework Conditions

The dimensioning for the current state shows that small wind turbines can only be operated economically in the locations with high wind potential, such as Aachen and Montreal. The same holds for the battery storage, which, despite an installed PV system and heat pump operation, would only be economical in the case of an additional small wind turbine and, even then, only at a very small size (1–2 kWh). The size of the heating buffer storage is normal at 0.5–0.8 m3. The PV system is sized between 4 and 9 kWp depending on the irradiation of the location.
In Figure 19, the mean value of the dimensioned system size of the battery storage, PV system, and small wind turbine is shown for the different German locations and compared with the replacement of the battery storage by the vehicle-to-home use of a BEV with two different driving profiles. Here, the V2H 1 driving profile means use as a first car with a weekday commute to work, and the V2H 2 driving profile means use as a second car with longer periods of availability and lower charging requirements. It is assumed that 16 kWh of the vehicle battery can be used, which corresponds to the range between 40% and 60% of the SOC for an 80 kWh battery. On average, a 49% larger PV system would make sense due to vehicle-to-home operation compared to the dimensioning without the BEV. At the same time, the current conditions do not show a positive impact on the size of the small wind turbine. In the case of the Montreal site, the economics of a small wind turbine actually become worse, which can be attributed to the lower availability and efficiency of the vehicle battery charging and discharging process compared to a stationary battery storage system. However, under future conditions, the impact of a vehicle-to-home application could have a positive effect on the sizing of a small wind turbine. This needs to be investigated further and was not considered in the context of this work.
A positive aspect of the vehicle-to-home application is that, due to the increased self-consumption, the electricity costs remain the same or decrease, depending on the driving profile, despite additional power requirements of 2410.7 kWh (first car) or 1366.3 kWh (second car). It should be noted that this study did not take into account the additional costs related to battery aging. According to a previous study, this would be between EUR 175.5 and EUR 271.6 per year, depending on the driving profile. In this context, however, it must also be considered that bidirectional operation takes place in the range of a state of charge (SOC) between 40% and 60%, which means a high cycle stability and thus the vehicle’s age possibly being reached earlier despite vehicle-to-home operation, rather than the vehicle battery falling below 80% in capacity [46].

4.2. Future Framework Conditions

With regard to the future scenarios examined, it should be noted that no investment cost reductions were assumed for the PV system, since the prices here have already reached a very low level, whereas larger cost reductions can be assumed for battery storage and possibly also for the small wind turbine due to economies of scale and new technologies. In addition, it must be taken into account that the dimensioning of the small wind turbine is not representative of the average values over several locations due to the influence of local conditions (buildings, vegetation, topography). The dimensioning of the PV system and, in connection with it, the battery storage is clearly more independent of this and gives more general insights.
When dimensioning the small wind turbine, it becomes apparent that turbines of a smaller size are preferred since their performance values differ little at low wind speeds (2.5–4 m/s) (see Figure 3), whereas the costs increase disproportionately in comparison. The interaction between costs (see Figure 2) and characteristics (see Figure 3) also explains why the dimensioning of the small wind turbine converges at 3 kW for the sites with higher wind potential. This size offers the best ratio of yield to investment costs at the prevailing wind speeds, since investment costs increase disproportionately between a 3 kW and 5 kW turbine size. In general, the annual costs are close to each other. For example, at the Aachen site, an increase in the size of the small wind turbine from 3 kW to 4 kW would mean an increase in costs of 7%.
Figure 20 shows different scenarios for electricity purchase and electricity marketing prices, averaged over all German locations, with an investment cost reduction of 25% for the battery storage and small wind turbine. Figure 21 shows the same averaged scenarios with an investment cost reduction of 50%. In general, it can be seen that, with regard to the dimensioning of the PV system, the electricity marketing price is mainly decisive. The electricity purchase price as well as the battery storage size have a subordinate effect. This is due to the fact that the demand of the building and thus the maximum achievable self-consumption are limiting factors.
With regard to the dimensioning of the small wind turbine, interestingly, the electricity purchase price has the greater effect. This can be explained by the fact that the small wind turbine enables a significantly higher share of self-consumption of wind-generated electricity due to the higher simultaneity of generation and consumption, as well as the preferential use of wind electricity in the model. A reduction in the investment costs also has a noticeable effect, whereby, at higher electricity purchase prices of ≥0.37 EUR/kWh, an investment cost reduction of 25% already has the same effect as an investment cost reduction of 50%.
With regard to the dimensioning of the battery storage system, it can be seen that the electricity purchase price and the electricity marketing price have an equal influence on its economic efficiency. In addition, a reduction in the investment costs to 25% as well as to 50% has a significant effect on the dimensioning. If a battery storage would still be almost unprofitable with an investment cost reduction of 25%, at favorable electricity purchase prices of 0.34 EUR/kWh, battery storage sizes of 5–12 kWh would be most economical with an investment cost reduction of 50%.
With regard to the heat pump and the buffer storage, it is shown that there is hardly any effect of the different climatic conditions on their dimensioning. It is also shown that the original dimensioning of the heat pump of the building was oversized, whereas the thermal buffer storages are similar in size to the original building. However, it should also be noted here that, in reality, the heating capacity is dimensioned to be somewhat larger for extreme situations.
Finally, it should be mentioned that variations in dimensioning are possible, since genetic algorithms find a global optimum only approximately. This can lead to fluctuations in components with low investment costs, such as buffer storage sizes.

4.3. Conclusions

Our observations indicate that higher electricity procurement costs, specifically those exceeding 0.42 EUR/kWh, in combination with a 25% reduction in investment expenses for small wind turbines and battery storage systems, have the potential to significantly improve the economic viability of small wind turbines supplying residential buildings equipped with heat pumps. In such scenarios, small wind turbines could become appealing for a wider range of locations. In many cases, the current feed-in tariff or the option of direct marketing at electricity prices exceeding 60 EUR/MWh would be sufficient for ensuring economically viable operations. At the same time, considering the increasing electrification of the transportation sector and the increasing potential of bidirectional charging, it has been demonstrated that, within the current framework conditions, the integration of battery electric vehicles (BEVs) and bidirectional charging does not have a positive impact on the economic feasibility of the discussed small wind turbine installations. However, looking ahead to future conditions, effective load management for heat pumps or BEV charging could potentially contribute to the profitability of small wind turbines.

Author Contributions

M.B., R.O. and B.S. wrote the main manuscript. All authors reviewed the manuscript. The design of the work, its analysis, and the interpretation of data were carried out by M.B. and D.P., D.P. and U.E. revised this work critically for important intellectual content. All authors have read and agreed to the published version of the manuscript.

Funding

This work was funded by the Federal Ministry for Economic Affairs and Climate Action grant number 03ET1116A within the research project Smart2Charge.

Data Availability Statement

The original contributions presented in this study are included in the article. Further inquiries can be directed to the corresponding author.

Conflicts of Interest

Author Marcus Brennenstuhl was employed by the company Enisyst GmbH. The remaining authors declare that the research was conducted in the absence of any commercial or financial relationships that could be construed as a potential conflict of interest.

Abbreviations

The following abbreviations are used in this manuscript:
B E V Battery Electric Vehicle
C b a t t Battery Capacity [kWh]
c i Sum of electricity purchase or sale [€]
C F D Computational Fluid Dynamics
D W D Deutscher Wetterdienst (German Weather Service)
D H W Domestic Hot Water
E A Evolutionary Algorithm
E A C Equivalent Annual Cost (economic evaluation)
E C C C Environment and Climate Change Canada
G A Genetic Algorithm
H P Heat Pump
I N S E L Integrated Simulation Environment Language
n L i f e Estimated lifetime of the investment in years
O M Operating and Maintenance Costs [€]
PAnnualized Capital Cost [€]
p c Probability of crossover in genetic algorithms
P e l Electrical Power [kW]
p m Probability of mutation in genetic algorithms
P t h Thermal Power [kW]
P S O Particle Swarm Optimization
P V    Photovoltaic
P V    Present Value (for investment) [€]
Q i    Amount of energy [kWh]
r i    Interest rate per period (e.g., annually)
R E    Renewable Energy
R E S    Renewable Energy Source
S A    Simulated Annealing
S O C    State of Charge
V D I    Verein Deutscher Ingenieure (Association of German Engineers)
V 2 H    Vehicle-to-Home

Appendix A. Detailed Dimensioning Results

Table A1. Size-specific investment costs of different energy supply systems. Cost sources: (a) [51] small wind turbine type Aeolos-V incl. 43% costs for foundation, mast and installation; (b) [52] incl. inverter and installation; (c) [53]; (d) own research of current trade prices incl. EUR 2500 installation costs; (e) own research of current trade prices incl. EUR 1000 installation costs.
Small Wind Turbine
System Size [kW]Invest [EUR ]   ( a ) Maintenance CostLife Span
1 kW72543.0%20 years
3 kW13,549
5 kW25,000
10 kW34,658
20 kW53,130
PV system
System size [kW]Invest [EUR ]   ( b ) Maintenance costLife span
464002.3%20 years
69360
811,040
1013,300
1519,800
2025,800
Battery storage
System size [kW]Invest [EUR ]   ( c ) Maintenance costLife span
018002.3%15 years
55500
109000
1512,000
2015,000
Heat pump
System size [kW]Invest [EUR ]   ( d ) Maintenance costLife span
011,1003.5%20 years
411,100
1012,500
1514,500
2016,000
Thermal buffer storage
System size [Ł]Invest [EUR ]   ( e ) Maintenance costLife span
20012003.0%20 years
5001500
10002500
15002600
20002700
30003600
Table A2. Optimized dimensioning and economic efficiency of the energy supply system of a single building for electricity price and investment cost scenarios, Aachen site.
Total
Cost
[EUR/a]
Energy
Cost
[EUR/a]
Invest./
Maintenance
[EUR/a]
P th
HP
[kW]
V storage
DHW
[m3]
V storage
Room
[m3]
C batt
[kWh]
P el
PV
[kWp]
P el
Wind
[kW]
El. Marketing
Price
[EUR/kWh]
El. Purchase
Price
[EUR/kWh]
Investment Cost Reduction of Small Wind Turbine by 25%; Battery Storage by 25%
676016695091150.50.74430.060.34
680516675138150.50.74530.060.37
699913725626150.50.58830.060.42
664312085435150.90.62930.090.34
664711615486150.50.54930.090.37
686811405728150.50.58930.090.42
6019−2226241150.50.501930.140.34
6363−4066768150.50.521840.140.37
6379−3586737150.50.561930.140.42
Investment cost reduction of small wind turbine by 50%; battery storage by 25%
630917084601150.50.73430.060.34
655818474710150.50.55330.060.37
667713245353150.50.59830.060.42
630111345167150.80.54830.090.34
631412595055150.50.54830.090.37
654810935455150.50.59930.090.42
5832−3196150150.60.702030.140.34
5881−4896371150.60.732030.140.37
6145−2846430150.80.741930.140.42
Investment cost reduction of small wind turbine by 25%; battery storage by 50%
651313745140150.50.77530.060.34
659814865112150.50.511430.060.37
686310395824150.50.8121030.060.42
63887245664150.50.512930.090.34
65299465584150.60.78930.090.37
67689755793150.80.713930.090.42
5980−6886668150.80.571930.140.34
6069−7456813150.80.582030.140.37
6340−936433150.50.781630.140.42
Investment cost reduction of small wind turbine by 50%; battery storage by 50%
632114864835150.80.58430.060.34
626010915169150.50.510830.060.37
656313605203150.90.511730.060.42
61078805227150.60.710830.090.34
613510045131150.50.59830.090.37
63809175463150.60.7111030.090.42
5588−6926280150.50.571930.140.34
5681−5996280150.50.571930.140.37
5846−7186564150.50.5122030.140.42
Table A3. Optimized dimensioning and economic efficiency of the energy supply system of a single building for electricity price and investment cost scenarios. Braunlage site.
Total
Cost
[EUR/a]
Energy
Cost
[EUR/a]
Invest./
Maintenance
[EUR/a]
P th
HP
[kW]
V storage
DHW
[m3]
V storage
Room
[m3]
C batt
[kWh]
P el
PV
[kWp]
P el
Wind
[kW]
El. Marketing
Price
[EUR/kWh]
El. Purchase
Price
[EUR/kWh]
Investment Cost Reduction of Small Wind Turbine by 25%; Battery Storage by 25%
781241823631150.50.60400.060.34
823341064127150.90.60800.060.37
872044334287150.50.72800.060.42
780635964209150.50.90900.090.34
810436414463150.50.73900.090.37
865333595294150.50.82830.090.42
745421435311150.50.801900.140.34
778522215564150.50.812000.140.37
826516046661150.50.632030.140.42
Investment cost reduction of small wind turbine by 50%; battery storage by 25%
777430754699150.80.62530.060.34
800533454659150.70.83430.060.37
840036654734150.50.73530.060.42
764826015047150.60.62930.090.34
796828435125150.90.72930.090.37
830533604945150.50.72830.090.42
730413535951150.50.701930.140.34
750817945715150.50.601730.140.37
800316136390150.50.932030.140.42
Investment cost reduction of small wind turbine by 25%; battery storage by 50%
784040253815150.60.72400.060.34
806232774785150.50.7111000.060.37
850137034798150.50.6121000.060.42
776831454623150.60.761000.090.34
796033394621150.50.671000.090.37
846926575812150.60.8111030.090.42
741921095310150.50.621800.140.34
774613346412150.50.671730.140.37
810522245881150.50.7102000.140.42
Investment cost reduction of small wind turbine by 50%; battery storage by 50%
759730944503150.50.73430.060.34
783826115227150.60.710830.060.37
815228305322150.50.611930.060.42
754424485096150.50.77830.090.34
776124055356150.70.681030.090.37
814126595482150.70.7111030.090.42
729110186273150.50.832030.140.34
741010366374150.50.691930.140.37
777713466431150.50.7101930.140.42
Table A4. Optimized dimensioning and economic efficiency of the energy supply system of a single building for electricity price and investment cost scenarios. Greifswald site.
Total
Cost
[EUR/a]
Energy
Cost
[EUR/a]
Invest./
Maintenance
[EUR/a]
P th
HP
[kW]
V storage
DHW
[m3]
V storage
Room
[m3]
C batt
[kWh]
P el
PV
[kWp]
P el
Wind
[kW]
El. Marketing
Price
[EUR/kWh]
El. Purchase
Price
[EUR/kWh]
Investment Cost Reduction of Small Wind Turbine by 25%; Battery Storage by 25%
745733884069150.50.70800.060.34
764627704876150.50.82430.060.37
803427855248150.50.66530.060.42
742731754252150.60.81800.090.34
750822725236150.50.52830.090.37
791324075505150.60.54930.090.42
68726316241150.50.501930.140.34
708110576024150.50.501730.140.37
74828026680150.50.732030.140.42
Investment cost reduction of small wind turbine by 50%; battery storage by 25%
704025524488150.50.52430.060.34
735227674585150.512430.060.37
762831404488150.50.52430.060.42
697924914488150.50.52430.090.34
724125854656150.50.64430.090.37
758025065074150.60.54830.090.42
66005256075150.50.61.01930.140.34
68118415970150.50.801930.140.37
714111006041150.50.621830.140.42
Investment cost reduction of small wind turbine by 25%; battery storage by 50%
729223244967150.50.57430.060.34
746724994967150.50.57430.060.37
783823955443150.60.58830.060.42
725518875368150.50.66830.090.34
744717815666150.60.681030.090.37
775120475703150.60.691030.090.42
69342476687150.80.671930.140.34
69873406647150.50.581930.140.37
73056016703150.60.591930.140.42
Investment cost reduction of small wind turbine by 50%; battery storage by 50%
704717115335150.50.591030.060.34
722520545170150.70.59830.060.37
747023385131150.50.59830.060.42
693219804952150.60.54830.090.34
705618975159150.50.57930.090.37
736420665298150.50.581030.090.42
65564206136150.50.751830.140.34
66553756280150.50.571930.140.37
70046106394150.60.691930.140.42
Table A5. Optimized dimensioning and economic efficiency of the energy supply system of a single building for electricity price and investment cost scenarios. Potsdam site.
Total
Cost
[EUR/a]
Energy
Cost
[EUR/a]
Invest./
Maintenance
[EUR/a]
P th
HP
[kW]
V storage
DHW
[m3]
V storage
Room
[m3]
C batt
[kWh]
P el
PV
[kWp]
P el
Wind
[kW]
El. Marketing
Price
[EUR/kWh]
El. Purchase
Price
[EUR/kWh]
Investment Cost Reduction of Small Wind Turbine by 25%; Battery Storage by 25%
734931984151150.50.60900.060.34
759221695423150.70.54830.060.37
793222215711150.60.67930.060.42
720729544253150.60.501000.090.34
741921095310150.50.53830.090.37
776919755793150.50.671030.090.42
670514135292150.70.501900.140.34
694117765164150.60.501800.140.37
73355416793150.80.642030.140.42
Investment cost reduction of small wind turbine by 50%; battery storage by 25%
703522664770150.50.54530.060.34
722625114715150.60.53530.060.37
753323495185150.50.56830.060.42
694417405204150.60.531030.090.34
708621794907150.50.52830.090.37
743620285408150.50.661030.090.42
65973526245150.50.611840.140.34
65965566039150.50.602030.140.37
69716946277150.60.622030.140.42
Investment cost reduction of small wind turbine by 25%; battery storage by 50%
722525944632150.50.610900.060.34
740526594746150.50.5111000.060.37
766822455423150.50.58830.060.42
712724684659150.50.681000.090.34
735217135639150.60.610930.090.37
764417355910150.80.5111130.090.42
66679185749150.60.572000.140.34
68222286593150.50.542030.140.37
70722796792150.50.592030.140.42
Investment cost reduction of small wind turbine by 50%; battery storage by 50%
689818045094150.50.58830.060.34
707319975076150.60.57830.060.37
736421765188150.50.610830.060.42
681316275186150.50.551030.090.34
694616855261150.50.571030.090.37
725717855472150.50.691130.090.42
63451896156150.50.541930.140.34
64911786314150.50.552030.140.37
67704346337150.60.581930.140.42
Table A6. Optimized dimensioning and economic efficiency of the energy supply system of a single building for electricity price and investment cost scenarios. Stuttgart site.
Total
Cost
[EUR/a]
Energy
Cost
[EUR/a]
Invest./
Maintenance
[EUR/a]
P th
HP
[kW]
V storage
DHW
[m3]
V storage
Room
[m3]
C batt
[kWh]
P el
PV
[kWp]
P el
Wind
[kW]
El. Marketing
Price
[EUR/kWh]
El. Purchase
Price
[EUR/kWh]
Investment Cost Reduction of Small wind Turbine by 25%; Battery Storage by 25%
681023864424150.50.53900.060.34
699222624730150.50.561000.060.37
734622555091150.60.5101100.060.42
672818304897150.60.531300.090.34
685113145537150.50.581600.090.37
717610966080150.50.8111900.090.42
59705705400150.60.602000.140.34
62604745786150.80.632000.140.37
64934116082150.50.5102000.140.42
Investment cost reduction of small wind turbine by 50%; battery storage by 25%
681825424276150.50.51900.060.34
699020304959150.50.581100.060.37
730420675237150.50.5111200.060.42
671024374273150.60.601000.090.34
689815115387150.60.591400.090.37
717110626109150.50.7121900.090.42
59125505361150.50.502000.140.34
61757755400150.70.502000.140.37
65094646045150.50.692000.140.42
Investment cost reduction of small wind turbine by 25%; battery storage by 50%
662018544766150.50.6111000.060.34
680219654836150.50.8121000.060.37
707419275148150.50.7151200.060.42
64766465830150.50.5131900.090.34
66377565881150.60.5141900.090.37
68427446098150.50.5182000.090.42
60281645865151.10.5111900.140.34
59871135874150.50.5112000.140.37
62393655874150.50.5112000.140.42
Investment cost reduction of small wind turbine by 50%; battery storage by 50%
659318154778150.50.5121000.060.34
675217075045150.50.5131200.060.37
702519495077150.50.5141200.060.42
64888635625150.50.5101800.090.34
66015996002150.50.5152000.090.37
68357696066150.50.5172000.090.42
5861−135874150.50.5112000.140.34
59871135874150.50.5112000.140.37
62482595989150.50.6142000.140.42
Table A7. Optimized dimensioning and economic efficiency of the energy supply system of a single building for electricity price and investment cost scenarios. Wüstenrot site.
Total
Cost
[EUR/a]
Energy
Cost
[EUR/a]
Invest./
Maintenance
[EUR/a]
P th
HP
[kW]
V storage
DHW
[m3]
V storage
Room
[m3]
C batt
[kWh]
P el
PV
[kWp]
P el
Wind
[kW]
El. Marketing
Price
[EUR/kWh]
El. Purchase
Price
[EUR/kWh]
Investment Cost Reduction of Small Wind Turbine by 25%; Battery Storage by 25%
760633554252150.70.71800.060.34
793136214310150.80.91800.060.37
833338984435150.60.64800.060.42
736931354234150.50.501000.090.34
770733964311150.50.901000.090.37
825139174334150.60.71900.090.42
703814945544150.60.612000.140.34
717418135361150.50.502000.140.37
768524325253150.50.501900.140.42
Investment cost reduction of small wind turbine by 50%; battery storage by 25%
745538443611150.50.50400.060.34
777834284350150.50.52900.060.37
830434984806150.60.571000.060.42
747629864491150.70.521000.090.34
768032834397150.50.611000.090.37
825839474311150.60.801000.090.42
696217985164150.60.501800.140.34
719519225273150.50.601900.140.37
769824265273150.50.601900.140.42
Investment cost reduction of small wind turbine by 25%; battery storage by 50%
739027464644150.50.511900.060.34
763230714562150.50.611800.060.37
806031604901150.50.8141000.060.42
734925204830150.60.5131000.090.34
754227134830150.50.6131000.090.37
792229954927150.50.5131100.090.42
698116895292150.70.501900.140.34
716913635806150.50.782000.140.37
751715595957150.50.6132000.140.42
Investment cost reduction of small wind turbine by 50%; battery storage by 50%
739427824612150.50.510900.060.34
768228834799150.60.714900.060.37
803531424894150.60.5151000.060.42
737126184753150.70.5101000.090.34
751927414778150.50.5121000.090.37
797331884785150.50.7111000.090.42
704514355610150.51.322000.140.34
714213765766150.50.5111900.140.37
750416305874150.50.5112000.140.42
Table A8. Optimized dimensioning and economic efficiency of the energy supply system of a single building for electricity price and investment cost scenarios. Montreal site.
Total
Cost
[EUR/a]
Energy
Cost
[EUR/a]
Invest./
Maintenance
[EUR/a]
P th
HP
[kW]
V storage
DHW
[m3]
V storage
Room
[m3]
C batt
[kWh]
P el
PV
[kWp]
P el
Wind
[kW]
El. Marketing
Price
[EUR/kWh]
El. Purchase
Price
[EUR/kWh]
Investment Cost Reduction of Small Wind Turbine by 25%; Battery Storage by 25%
785124935357150.60.52930.060.34
801522225793150.50.671030.060.37
831724305886150.50.591030.060.42
757718295748150.50.531230.090.34
783013426488150.60.571630.090.37
810313106793150.50.5111730.090.42
68115316280150.50.701930.140.34
70815646518150.60.721930.140.37
74995566943150.80.762030.140.42
Investment cost reduction of small wind turbine by 50%; battery storage by 25%
750222985204150.50.631030.060.34
770322955408150.60.561030.060.37
800121755826150.50.5121130.060.42
725317915462150.50.521330.090.34
754416895855150.80.571330.090.37
784114276414150.50.8111630.090.42
64314116020150.50.502030.140.34
66603486312150.50.532030.140.37
73426856657160.50.561930.140.42
Investment cost reduction of small wind turbine by 25%; battery storage by 50%
762118045818150.60.5131030.060.34
787418616013150.90.6131130.060.37
814122855856150.60.7131030.060.42
743911536287150.60.5131430.090.34
75399826557150.50.5151630.090.37
781311166697150.50.5161730.090.42
6688−676755150.50.582030.140.34
6885−166901150.50.7112030.140.37
87336328101180.50.661770.140.42
Investment cost reduction of small wind turbine by 50%; battery storage by 50%
724218055437150.50.5121030.060.34
745320345418150.50.614930.060.37
771320635650150.50.5151130.060.42
706312755789150.50.5121330.090.34
721611176099150.50.5111630.090.37
752811416387150.50.6161730.090.42
6397−106408150.50.672030.140.34
6511−216532150.50.5112030.140.37
68032516552150.50.5151930.140.42

References

  1. Statistisches Bundesamt. Stromerzeugung 2022, 2023. Available online: https://www.destatis.de/DE/Presse/Pressemitteilungen/2023/03/PD23_090_43312.html (accessed on 27 June 2023).
  2. Bundesverband für WindEnergie BWE, e.V. Windenergie in Deutschland—Zahlen und Fakten. 2020. Available online: https://www.wind-energie.de/themen/zahlen-und-fakten/deutschland/ (accessed on 15 November 2023).
  3. Gehling, M. Installierte Leistung, Stromerzeugung und Marktentwicklung von Kleinwindanlagen in Deutschland; Technical Report; Ingenieurbüro für Erneuerbare Energien: Leipzig, Germany, 2019. [Google Scholar]
  4. Wagh, S.; Walke, T. Review on Wind-Solar Hybrid Power System. Int. J. Res. Sci. Eng. 2017, 3, 71–76. [Google Scholar]
  5. Acatech. Wie kann der Ausbau von Photovoltaik und Windenergie Beschleunigt Werden? Stellungnahme; Technical Report; Leopoldina Akademienunion: Schweinfurt, Germany, 2022. [Google Scholar]
  6. Brennenstuhl, M.; Lust, D.; Boch, P.; Yadack, M.; Eicker, U. The Potential of Small Wind Turbine Integration in Residential Buildings Complementing PV and Heat Pump Operation. ISEC Conf. Proc. Renew. Heat. Cool. Integr. Urban Ind. Energy Syst. 2018, 1, 331–339. [Google Scholar]
  7. Absatzzahlen und Marktanteile; Bundesverband WWärmepumpe (BWP) e. V.: Berlin, Germany, 2023.
  8. Anteil der Elektroautos am Bestand der Personenkraftwagen in Deutschland von 2018 bis 2020 und Prognose bis 2030; Statista GmbH: Hamburg, Germany, 2022.
  9. Ahmed, N.A.; Miyatake, M.; Al-Othman, A.K. Power fluctuations suppression of stand-alone hybrid generation combining solar photovoltaic/wind turbine and fuel cell systems. Energy Convers. Manag. 2008, 49, 2711–2719. [Google Scholar] [CrossRef]
  10. Mohammadi, S.; Soleymani, S.; Mozafari, B. Scenario-based stochastic operation management of MicroGrid including Wind, Photovoltaic, Micro-Turbine, Fuel Cell and Energy Storage Devices. Int. J. Electr. Power Energy Syst. 2014, 54, 525–535. [Google Scholar] [CrossRef]
  11. Niknam, T.; Golestaneh, F.; Shafiei, M. Probabilistic energy management of a renewable microgrid with hydrogen storage using self-adaptive charge search algorithm. Energy 2013, 49, 252–267. [Google Scholar] [CrossRef]
  12. Sichilalu, S.; Tazvinga, H.; Xia, X. Optimal control of a fuel cell/wind/PV/grid hybrid system with thermal heat pump load. Sol. Energy 2016, 135, 59–69. [Google Scholar] [CrossRef]
  13. Kaabeche, A.; Belhamel, M.; Ibtiouen, R. Techno-economic valuation and optimization of integrated photovoltaic/wind energy conversion system. Sol. Energy 2011, 85, 2407–2420. [Google Scholar] [CrossRef]
  14. Arabali, A.; Ghofrani, M.; Etezadi-Amoli, M.; Fadali, M.S.; Baghzouz, Y. Genetic-algorithm-based optimization approach for energy management. IEEE Trans. Power Deliv. 2013, 28, 162–170. [Google Scholar] [CrossRef]
  15. Mazzeo, D.; Matera, N.; De Luca, P.; Baglivo, C.; Congedo, P.M.; Oliveti, G. A literature review and statistical analysis of photovoltaic-wind hybrid renewable system research by considering the most relevant 550 articles: An upgradable matrix literature database. J. Clean. Prod. 2021, 295, 126070. [Google Scholar] [CrossRef]
  16. Grieser, B.; Sunak, Y.; Madlener, R. Economics of small wind turbines in urban settings: An empirical investigation for Germany. Renew. Energy 2015, 78, 334–350. [Google Scholar] [CrossRef]
  17. Rieck, J.; Taube, L.; Behrendt, F. Feasibility analysis of a heat pump powered by wind turbines and PV-Applications for detached houses in Germany. Renew. Energy 2020, 162, 1104–1112. [Google Scholar] [CrossRef]
  18. Weida, S.; Kumar, S.; Madlener, R. Financial viability of grid-connected solar PV and wind power systems in Germany. Energy Procedia 2016, 106, 35–45. [Google Scholar] [CrossRef]
  19. Weiler, V.; Lust, D.; Brennenstuhl, M.; Brassel, K.H.; Duminil, E.; Eicker, U. Automatic dimensioning of energy system components for building cluster simulation. Appl. Energy 2022, 313, 118651. [Google Scholar] [CrossRef]
  20. Mayer, M.J.; Szilágyi, A.; Gróf, G. Environmental and economic multi-objective optimization of a household level hybrid renewable energy system by genetic algorithm. Appl. Energy 2020, 269, 115058. [Google Scholar] [CrossRef]
  21. Ko, M.J.; Kim, Y.S.; Chung, M.H.; Jeon, H.C. Multi-objective optimization design for a hybrid energy system using the genetic algorithm. Energies 2015, 8, 2924–2949. [Google Scholar] [CrossRef]
  22. Koutroulis, E.; Kolokotsa, D.; Potirakis, A.; Kalaitzakis, K. Methodology for optimal sizing of stand-alone photovoltaic/wind-generator systems using genetic algorithms. Sol. Energy 2006, 80, 1072–1088. [Google Scholar] [CrossRef]
  23. Zhang, Y.; Lundblad, A.; Campana, P.E.; Yan, J. Comparative Study of Battery Storage and Hydrogen Storage to Increase Photovoltaic Self-sufficiency in a Residential Building of Sweden. Energy Procedia 2016, 103, 268–273. [Google Scholar] [CrossRef]
  24. Bee, E.; Prada, A.; Baggio, P. Optimization of Air Source Heat Pump Systems over the Heating Season through the Use of Renewable Energy Sources. In Proceedings of the International High Performance Buildings Conference Proceedings, West Lafayette, IN, USA, 11–14 July 2016. [Google Scholar]
  25. Bernal-Agustín, J.L.; Dufo-López, R. Efficient design of hybrid renewable energy systems using evolutionary algorithms. Energy Convers. Manag. 2009, 50, 479–489. [Google Scholar] [CrossRef]
  26. Xu, X.; Hu, W.; Cao, D.; Huang, Q.; Chen, C.; Chen, Z. Optimized sizing of a standalone PV-wind-hydropower station with pumped-storage installation hybrid energy system. Renew. Energy 2020, 147, 1418–1431. [Google Scholar] [CrossRef]
  27. Brennenstuhl, M.; Lust, D.; Pietruschka, D.; Schneider, D. Demand Side Management Based Power-to-Heat and Power-to-Gas Optimization Strategies for PV and Wind Self-Consumption in a Residential Building Cluster. Energies 2021, 14, 6712. [Google Scholar] [CrossRef]
  28. Rosa, M.D.; Brennenstuhl, M.; Cabrera, C.A.; Eicker, U.; Finn, D.P. An Iterative Methodology for Model Complexity Reduction in Residential Building Simulation. Energies 2019, 12, 2448. [Google Scholar] [CrossRef]
  29. Brennenstuhl, M.; Zeh, R.; Otto, R.; Pesch, R.; Stockinger, V.; Pietruschka, D. Report on a Plus-Energy District with Low- Temperature DHC Network, Novel Agrothermal Heat Source, and Applied Demand Response. Appl. Sci. 2019, 9, 5059. [Google Scholar] [CrossRef]
  30. Krien, U.; Schönfeldt, P.; Launer, J.; Hilpert, S.; Kaldemeyer, C.; Pleßmann, G. oemof.solph—A model generator for linear and mixed-integer linear optimisation of energy systems. Softw. Impacts 2020, 6, 100028. [Google Scholar] [CrossRef]
  31. Emmi, G.; Zarrella, A.; De Carli, M.; Galgaro, A. Solar assisted ground source heat pump in cold climates. Energy Procedia 2015, 82, 623–629. [Google Scholar] [CrossRef]
  32. Government of Canada. Residential Space Heating System Stock Share. 2021. Available online: https://oee.nrcan.gc.ca/corporate/statistics/neud/dpa/showTable.cfm?type=HB&sector=res&juris=00&rn=13&year=2021&page=0#sources (accessed on 16 March 2025).
  33. DWD. Windkarten zur Mittleren Windgeschwindigkeit. 2024. Available online: https://www.dwd.de/DE/leistungen/windkarten/ (accessed on 22 November 2024).
  34. Deutsches Institut für Normung e.V. DIN EN 12831 Energetische Bewertung von Gebäuden—Verfahren zur Berechnung der Norm-Heizlast; Technical Report; DIN: Berlin, Germany, 2017. [Google Scholar]
  35. CEC. Climate Zones of North America. Available online: https://www.cec.org/mapmonday/climate-zones-in-north-america/ (accessed on 12 December 2024).
  36. DWD. Open-Data-Server des Deutschen Wetterdienstes. 2022. Available online: https://opendata.dwd.de/ (accessed on 22 October 2022).
  37. Brennenstuhl, M.; Harbola, S.; Koukofikis, A.; Padsala, R.; Schaaf, M.; Coors, V.; Voss, U. CFD Simulation and Visualization Based Investigation of Small Wind Turbine Potential: A Case Study “Neuer Stöckach” for Stuttgart. ISPRS Ann. Photogramm. Remote Sens. Spat. Inf. Sci. 2021, 8, 17–24. [Google Scholar] [CrossRef]
  38. ECCC. Data Download for Montréal. 2022. Available online: https://montreal.weatherstats.ca/ (accessed on 22 January 2025).
  39. Jüttemann, P. Kleinwind-Marktreport Ausgabe 2020, 6th ed.; Patrick Jüttemann: Bad Honnef, Germany, 2019. [Google Scholar]
  40. Verein Deutscher Ingenieure. VDI 2067—Economic Efficiency of Building Installations: Fundamentals and Economic Calculation; Technical Report; Verein Deutscher Ingenieure e.V.: Harzgerode, Germany, 2012. [Google Scholar]
  41. Strom-Report. Strompreisentwicklung—Strompreise sinken 2023 wieder, 2023. Available online: https://strom-report.com/strompreise/strompreisentwicklung/ (accessed on 23 May 2023).
  42. Buttelmann, M.; Lohmann, B. Optimierung mit Genetischen Algorithmen und eine Anwendung zur Modellreduktion. At-Autom. 2004, 52, 151–163. [Google Scholar] [CrossRef]
  43. Kleine Büning, H.; Kramer, O.; Ting, C.; Aslan, D. Genetische Algorithmen; Technical Report; Universität Paderborn: Paderborn, Germany, 2007. [Google Scholar]
  44. Bundesministerium für Digitales und Verkehr. Deutsches Mobilitätspanel (MOP). 2021. Available online: https://bmdv.bund.de/SharedDocs/DE/Artikel/G/deutsches-mobilitaetspanel.html (accessed on 16 March 2023).
  45. Brennenstuhl, M.; Otto, R.; Elangovan, P.K.; Eicker, U. The Potential of Vehicle-to-Home Integration for Residential Prosumers: A Case Study. Smart Grids Sustain. Energy 2024, 9, 25. [Google Scholar] [CrossRef]
  46. Lehtola, T.A.; Zahedi, A. Electric Vehicle Battery Cell Cycle Aging in Vehicle to Grid Operations: A Review. IEEE J. Emerg. Sel. Top. Power Electron. 2021, 9, 423–437. [Google Scholar] [CrossRef]
  47. Rodrigues, A.; Machado, D.; Dentinho, T. Electrical Energy Storage Systems Feasibility; the Case of Terceira Island. Sustainability 2017, 9, 1276. [Google Scholar] [CrossRef]
  48. Fraunhofer ISE. Photovoltaics Report; Fraunhofer ISE: Freiburg, Germany, 2024. [Google Scholar]
  49. DNV. Energy Transition Outlook 2024: A Global and Regional Forecast to 2050; Technical Report; DNV: Bærum, Norway, 2024. [Google Scholar]
  50. Orangi, S.; Manjong, N.; Clos, D.P.; Usai, L.; Burheim, O.S.; Strømman, A.H. Historical and prospective lithium-ion battery cost trajectories from a bottom-up production modeling perspective. J. Energy Storage 2024, 76, 109800. [Google Scholar] [CrossRef]
  51. Renugen Limited. Renugen Limited Marketplace. 2022. Available online: https://www.renugen.co.uk/ (accessed on 11 April 2024).
  52. Scon-Marketing GmbH. Das sind die Kosten einer Photovoltaikanlage in 2022. 2022. Available online: https://www.solaranlagen-portal.de/photovoltaik/preis-solar-kosten.html/ (accessed on 11 April 2024).
  53. PV Magazine Group GmbH & Co. KG. PV Magazine: Speichermarkt in Deutschland auf Wachstumskurs bei Sinkenden Preisen. 2020. Available online: https://www.pv-magazine.de/2020/12/01/speichermarkt-in-deutschland-auf-wachstumskurs-bei-sinkenden-preisen/ (accessed on 11 March 2025).
Figure 1. Building system specifications. The heat pump was manufactured by Waterkotte GmbH, 44628 Herne, Germany. The PV system was manufactured by Solar Frontier K.K., Tokyo 108-6209, Japan.
Energies 18 01811 g001
Figure 2. Interpolated investment costs depending on the system size of the considered system components.
Energies 18 01811 g002
Figure 3. Interpolated power curves depending on the wind speed of the considered small wind turbines’ power rating.
Energies 18 01811 g003
Figure 4. Parameter0 variation of a genetic algorithm for optimized dimensioning. Own representation, already published in [19].
Energies 18 01811 g004
Figure 5. Optimal system component sizes as a function of the electricity purchase and marketing price with an investment cost reduction of 25% for small wind turbine and battery storage, Aachen site.
Energies 18 01811 g005
Figure 6. Optimal system component sizes as a function of the electricity purchase and marketing price with an investment cost reduction of 50% for small wind turbine and battery storage, Aachen site.
Energies 18 01811 g006
Figure 7. Optimal system component sizes as a function of the electricity purchase and marketing price with an investment cost reduction of 25% for small wind turbine and battery storage, Braunlage site.
Energies 18 01811 g007
Figure 8. Optimal system component sizes as a function of the electricity purchase and marketing price with an investment cost reduction of 50% for small wind turbine and battery storage, Braunlage site.
Energies 18 01811 g008
Figure 9. Optimal system component sizes as a function of the electricity purchase and marketing price with an investment cost reduction of 25% for small wind turbine and battery storage, Greifswald site.
Energies 18 01811 g009
Figure 10. Optimal system component sizes as a function of the electricity purchase and marketing price with an investment cost reduction of 50% for small wind turbine and battery storage, Greifswald site.
Energies 18 01811 g010
Figure 11. Optimal system component sizes as a function of the electricity purchase and marketing price with an investment cost reduction of 25% for small wind turbine and battery storage, Potsdam site.
Energies 18 01811 g011
Figure 12. Optimal system component sizes as a function of the electricity purchase and marketing price with an investment cost reduction of 50% for small wind turbine and battery storage, Potsdam site.
Energies 18 01811 g012
Figure 13. Optimal system component sizes as a function of the electricity purchase and marketing price with an investment cost reduction of 25% for small wind turbine and battery storage, Stuttgart site.
Energies 18 01811 g013
Figure 14. Optimal system component sizes as a function of the electricity purchase and marketing price with an investment cost reduction of 50% for small wind turbine and battery storage, Stuttgart site.
Energies 18 01811 g014
Figure 15. Optimal system component sizes as a function of the electricity purchase and marketing price with an investment cost reduction of 25% for small wind turbine and battery storage, Wüstenrot site.
Energies 18 01811 g015
Figure 16. Optimal system component sizes as a function of the electricity purchase and marketing price with an investment cost reduction of 50% for small wind turbine and battery storage, Wüstenrot site.
Energies 18 01811 g016
Figure 17. Optimal system component sizes for a single-family home as a function of electricity purchase and marketing price with an investment cost reduction of 25% for small wind turbine and battery storage, Montreal site.
Energies 18 01811 g017
Figure 18. Optimal system component sizes for a single-family home as a function of electricity purchase and marketing price with an investment cost reduction of 50% for small wind turbine and battery storage, Montreal site.
Energies 18 01811 g018
Figure 19. Optimal system component sizes for a single-family house, current state without and with vehicle-to-home use, mean values across all locations studied in Germany.
Energies 18 01811 g019
Figure 20. Optimal system component sizes as a function of the electricity purchase and marketing price with an investment cost reduction of 25% for small wind turbine and battery storage, average values across all locations investigated in Germany.
Energies 18 01811 g020
Figure 21. Optimal system component sizes as a function of the electricity purchase and marketing price with an investment cost reduction of 50% for small wind turbine and battery storage, average values across all locations investigated in Germany.
Energies 18 01811 g021
Table 2. Average measured annual values of the sites.
V ¯ wind
2019 [m/s]
V ¯ wind
2010–2020 [m/s]
Θ ¯ amb
2019
[°C]
Θ ¯ amb
2010–2020
[°C]
G ¯ oh
2019 [W/m2]
G ¯ oh
2010–2020
[W/m2]
Aachen5.15.110.910.6125.1121.5
Braunlage3.63.48.17.2115.1112.0
Greifswald4.14.210.59.5122.6119.2
Potsdam4.04.011.310.2130.1124.5
Stuttgart1.5-12.8-124.8-
Wüstenrot2.3-9.2-126.2-
Montreal4.64.56.97.8149.7134.2
Table 3. Optimized dimensioning and economic efficiency of the energy supply system for different locations, current conditions (energy and investment costs as of 2022).
Location P th HP [kW] V storage
DHW
[m3]
V storage
Room
[m3]
C batt [kWh] P el
PV
[kWp]
P el
Wind [kW]
Total Costs [EUR/a]EnergyCosts [EUR/a]Invest. and Maintenance [EUR/a]
Aachen150.50.7143708419255159
Braunlage150.50.8090792237324190
Greifswald150.50.6040743037993631
Potsdam150.70.6050742836253803
Stuttgart150.60.5080686828194049
Wüstenrot150.60.6080754134724069
Montreal150.70.6293831625175798
Table 4. Optimized dimensioning and economic efficiency of the energy supply system for different locations, actual state with vehicle-to-home (driving profile of first car, commuting to work, energy and investment costs as of 2022).
Location P th
HP [kW]
V storage
DHW
[m3]
V storage
Room
[m3]
C batt [kWh] P el
PV
[kWp]
P el
Wind [kW]
Total Costs [EUR/a]EnergyCosts [EUR/a]Invest. and Maintenance [EUR/a]
Aachen150.50.51603719928474351
Braunlage150.50.61640791242823631
Greifswald150.50.51640750238913611
Potsdam150.80.61690749032814210
Stuttgart150.70.51690699528244171
Wüstenrot150.60.51640758439533631
Montreal150.70.716100826839574312
Table 5. Optimized dimensioning and economic efficiency of the energy supply system of a single building for different locations, actual state with vehicle-to-home (driving profile of second car, energy and investment costs as of 2022).
Location P th
HP [kW]
V storage
DHW
[m3]
V storage
Room
[m3]
C batt [kWh] P el
PV
[kWp]
P el
Wind [kW]
Total Costs [EUR/a]EnergyCosts [EUR/a]Invest. and Maintenance [EUR/a]
Aachen160.50.51683685613955462
Braunlage150.60.71690770035104190
Greifswald150.70.516100726129894273
Potsdam150.70.51680715230844069
Stuttgart150.50.516110655622054351
Wüstenrot150.70.616100736730754292
Montreal150.60.616120788933824507
Disclaimer/Publisher’s Note: The statements, opinions and data contained in all publications are solely those of the individual author(s) and contributor(s) and not of MDPI and/or the editor(s). MDPI and/or the editor(s) disclaim responsibility for any injury to people or property resulting from any ideas, methods, instructions or products referred to in the content.

