
Regional-Scale Energy Modelling for Developing Strategies to Achieve Climate Neutrality


Abstract
1. Introduction
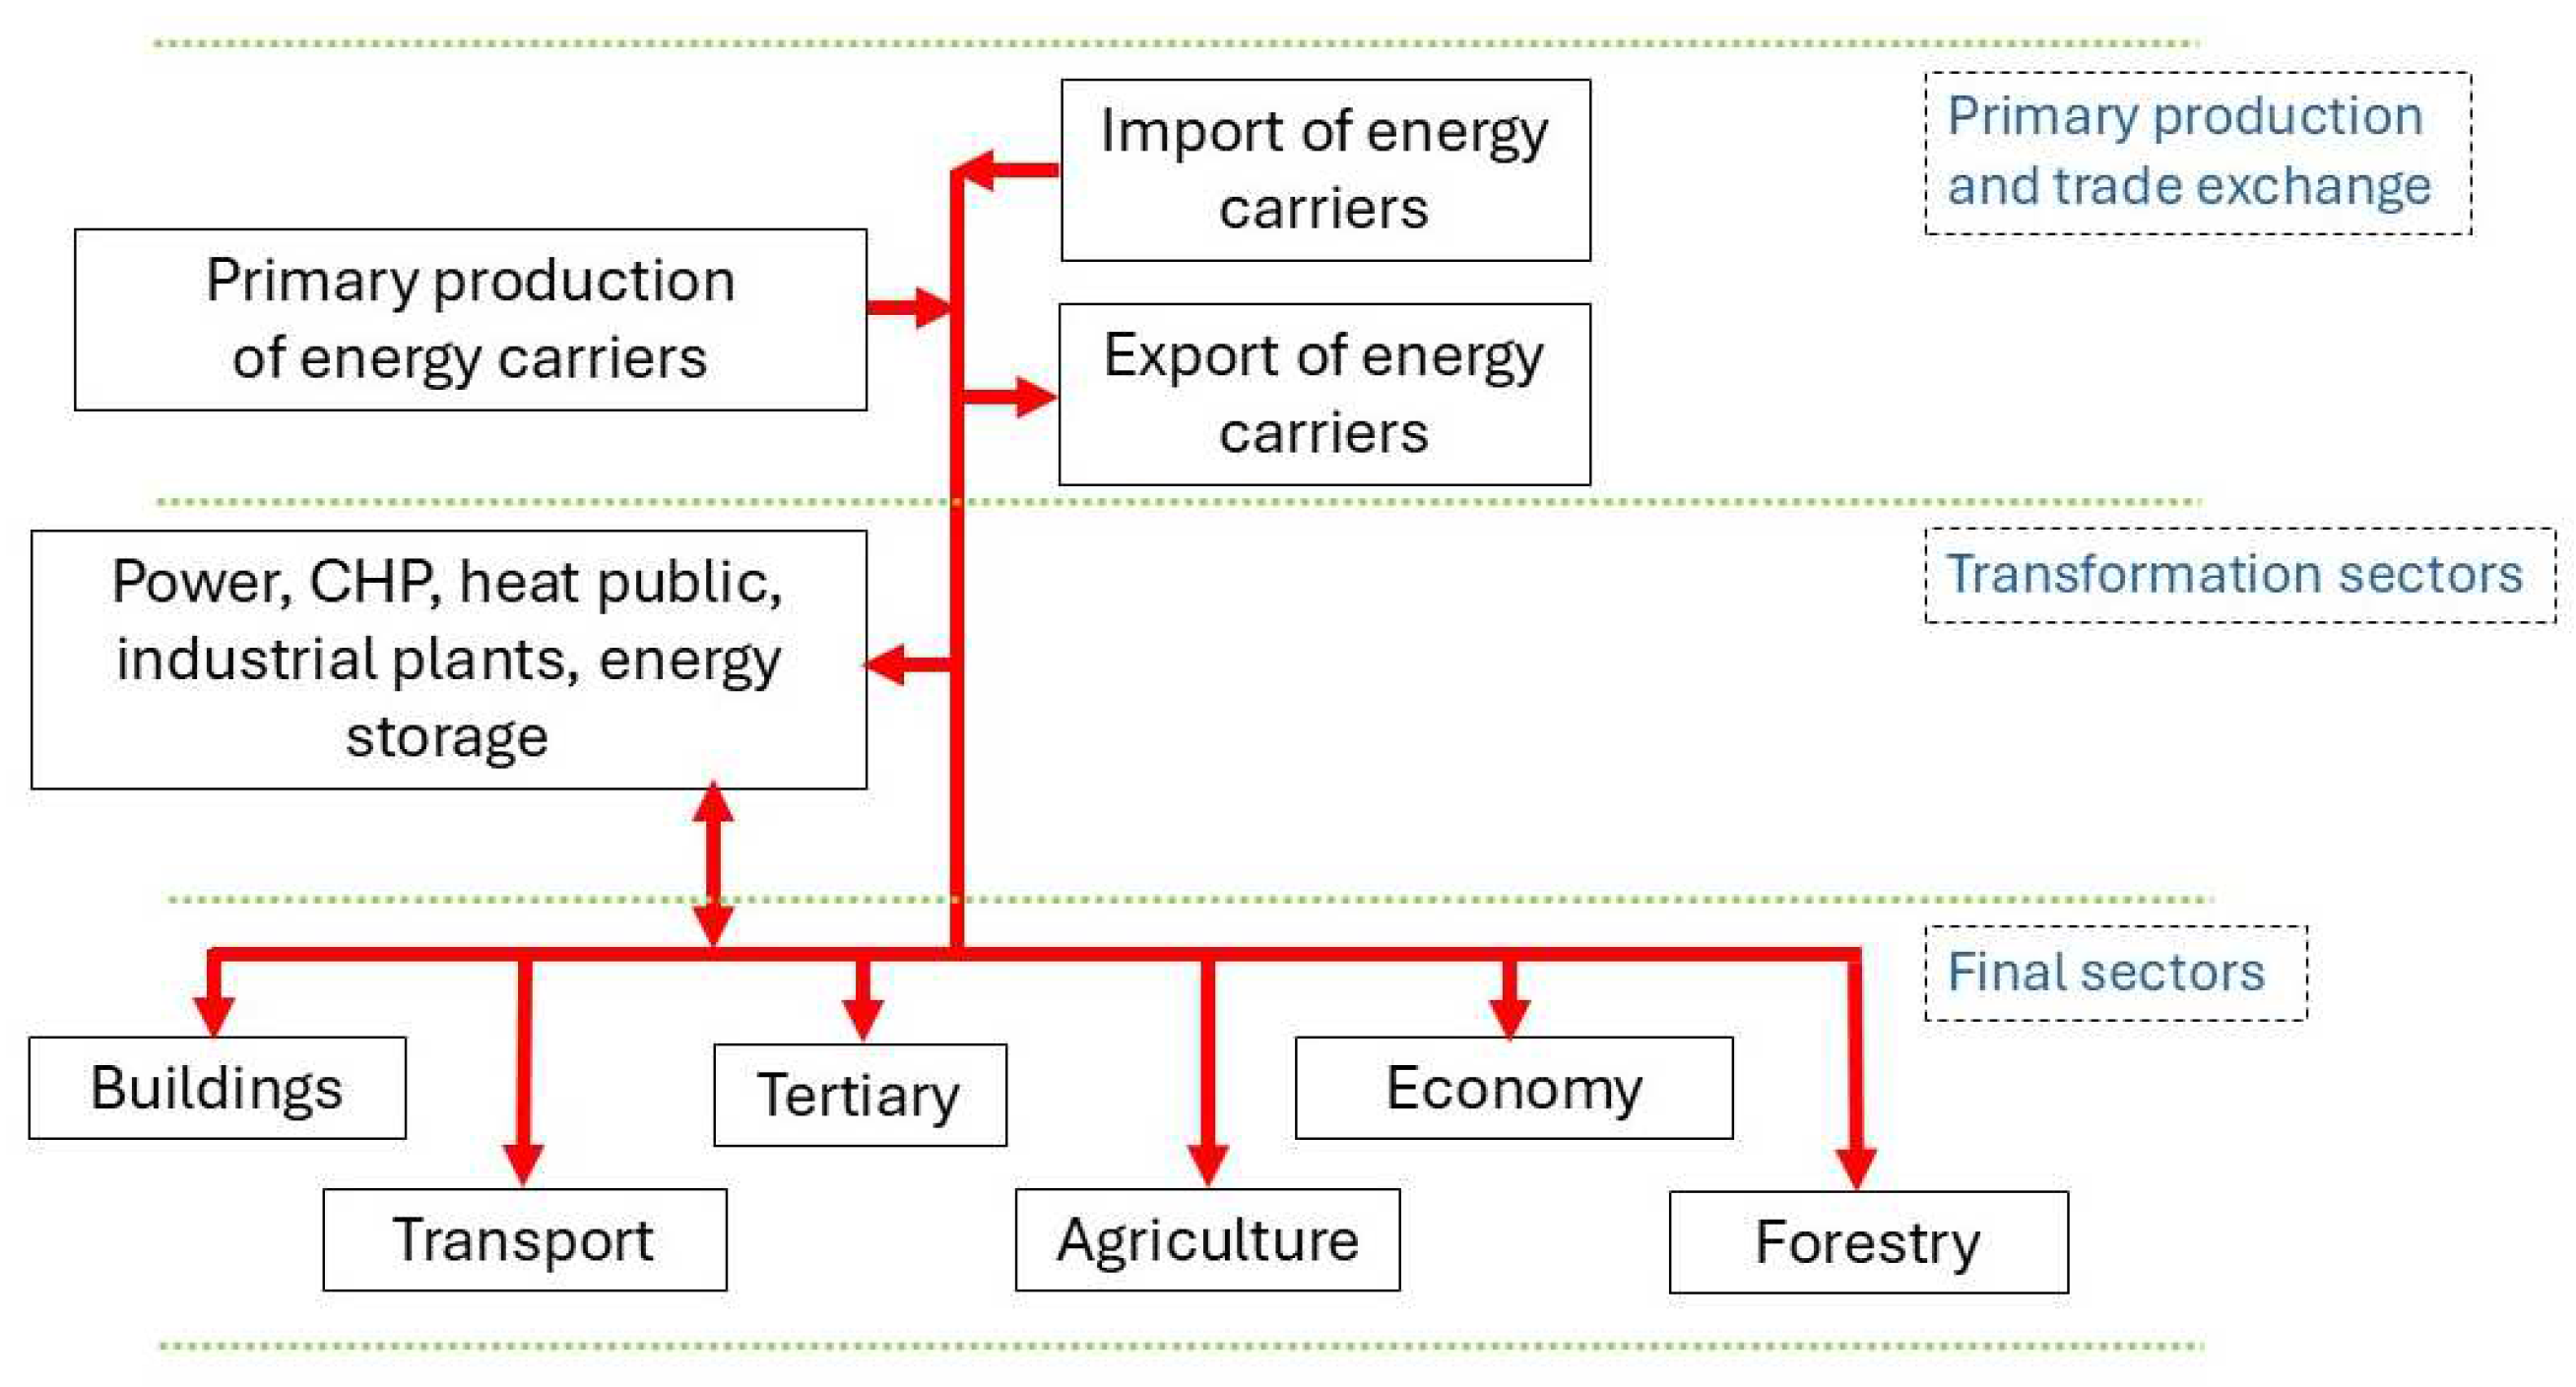
2. Model
2.1. General Assumptions
2.2. Energy Sector
2.3. Buildings (Household and Tertiary Sectors)
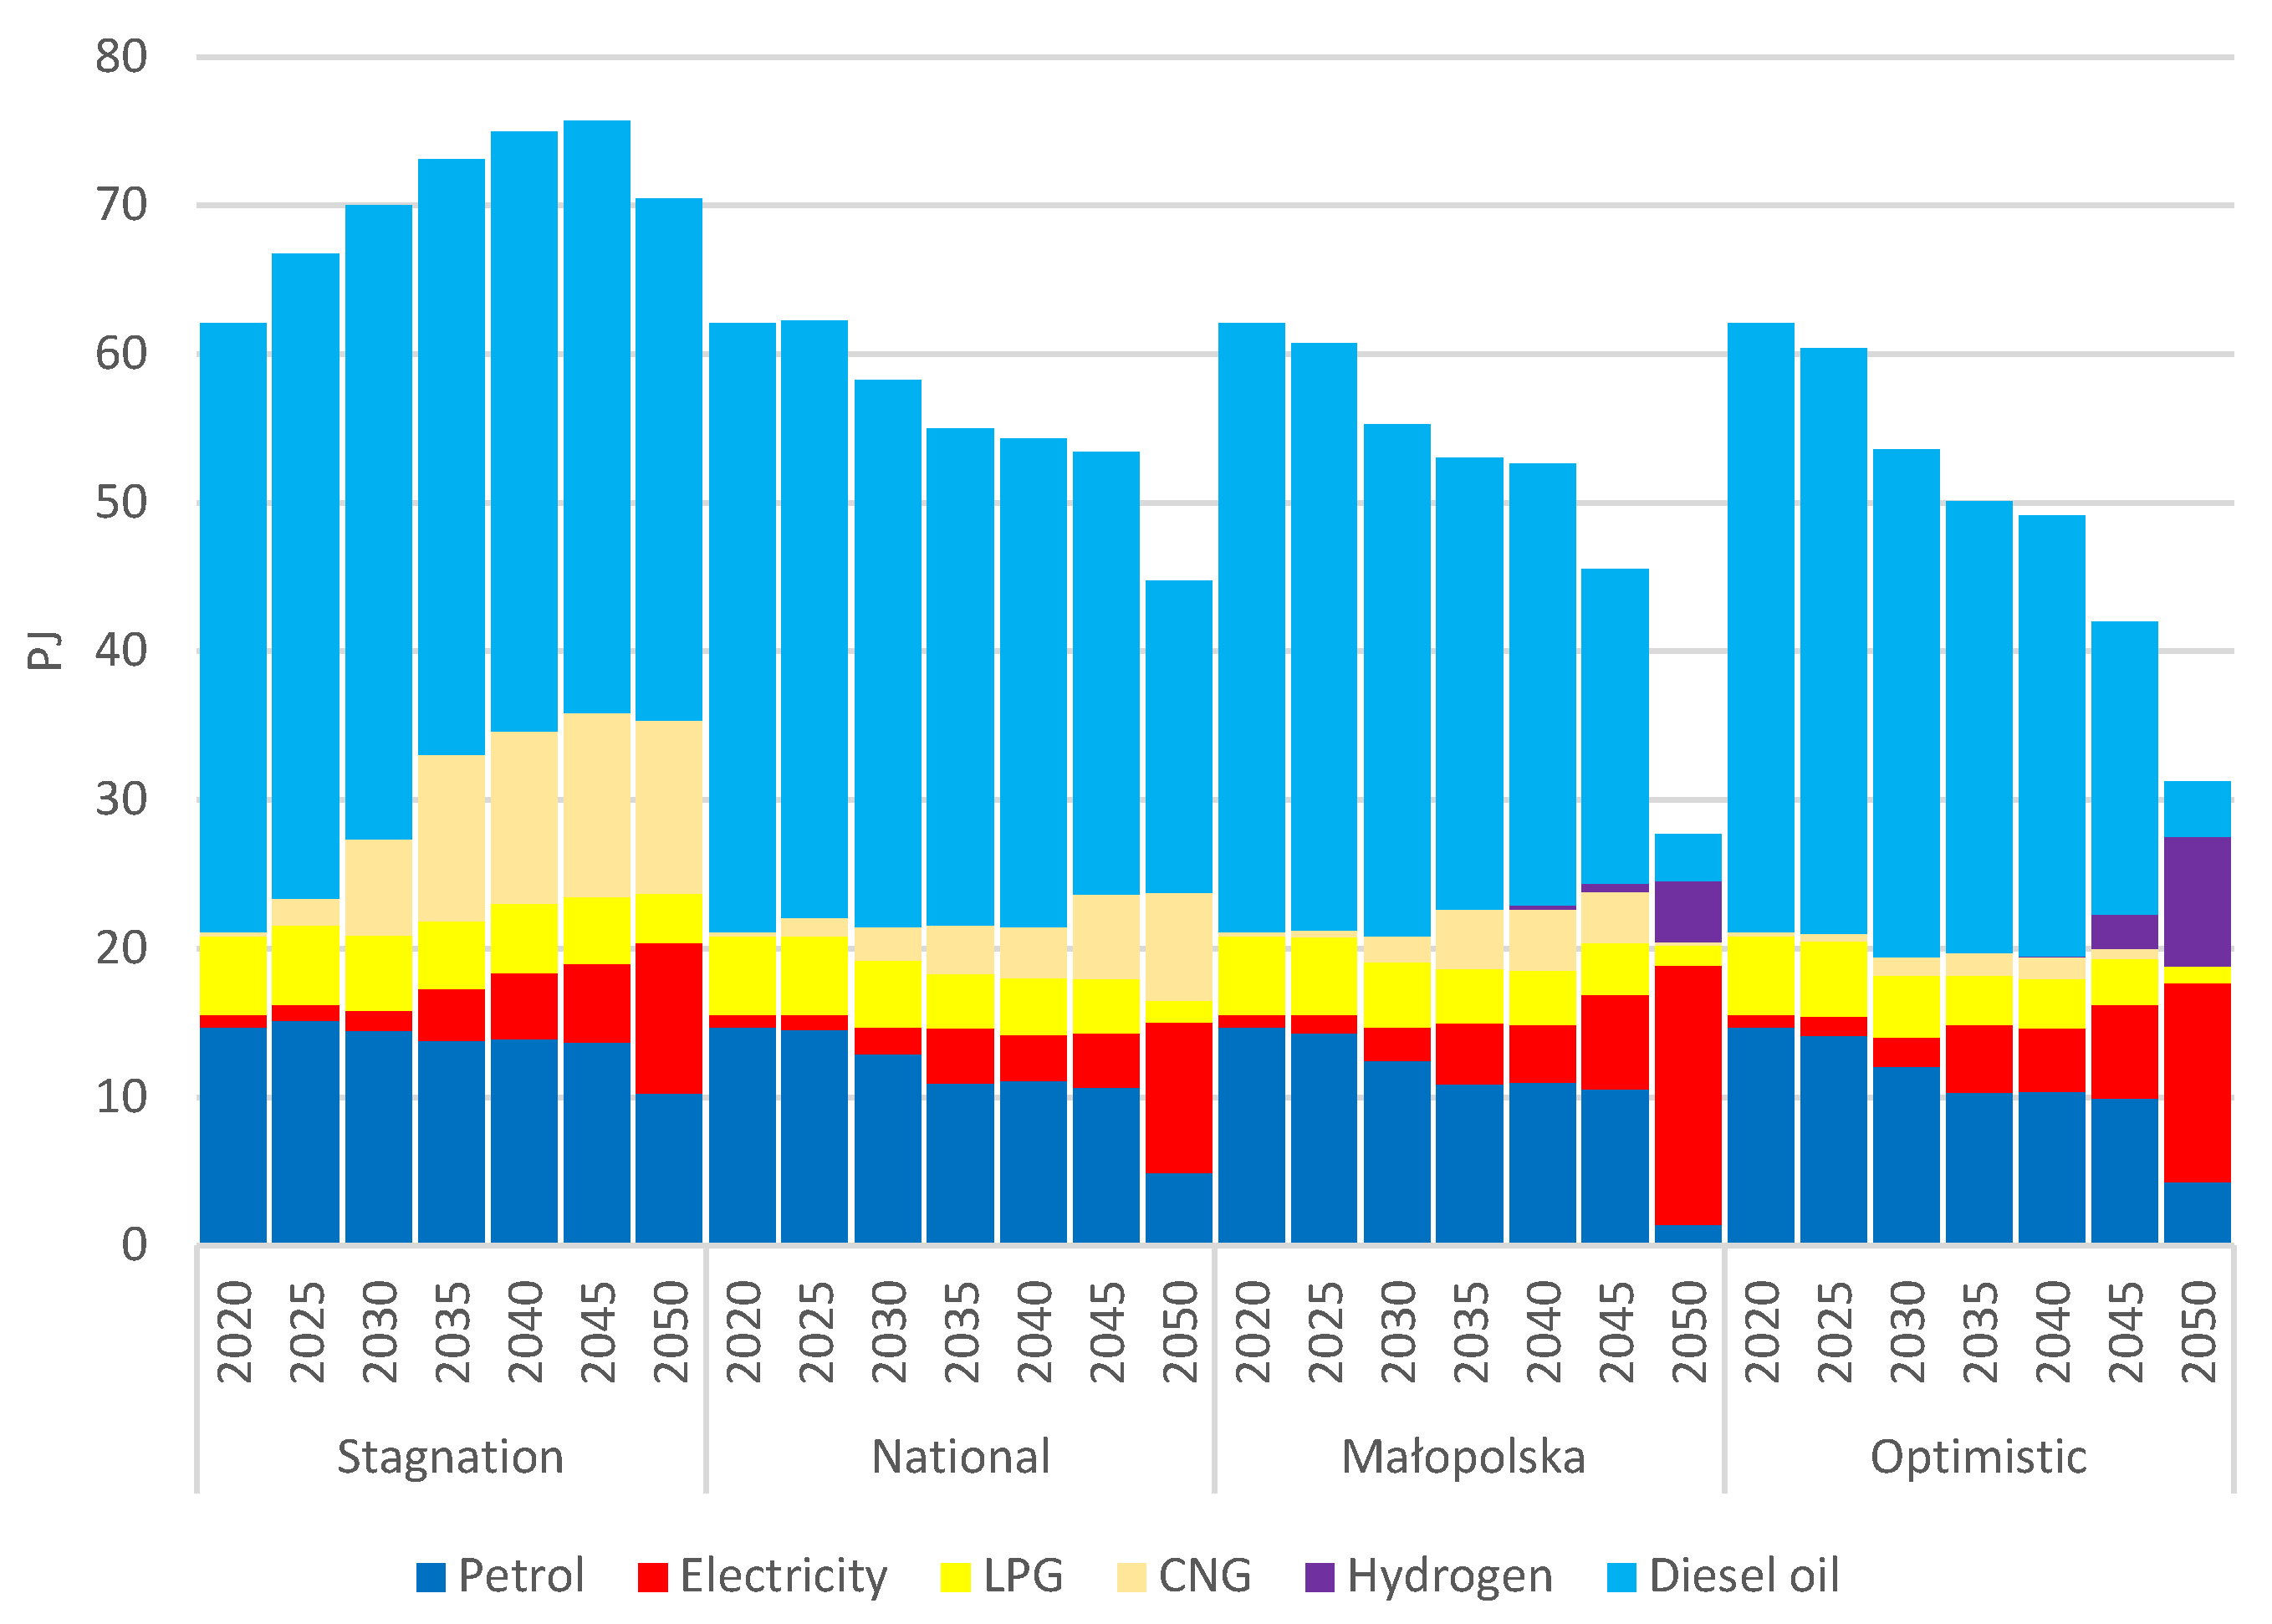
2.4. Transport
2.5. Economy
- The three largest CHP plants were individually modelled, while smaller CHP plants (below 10 MW of electrical capacity) were aggregated by fuel.
- One industrial heating plant with a thermal capacity over 10 MW was individually modelled, while other heating plants were aggregated by fuel.
- The only cement plant operating in the region was individually modelled.
- Food and beverage production and processing industries (meat, fruit, beverages, snacks, dairies) were aggregated into a single group.
- The chemical industry (chemicals, medicines, fertilisers, industrial gases, cleaning agents) was aggregated into another group.
- The paper and wood processing industry (wood products, paper, cardboard) was aggregated separately.
- The metal production and processing industry (steel processing, aluminium) was aggregated into its own group.
- The mineral industry (excluding cement plants), including construction materials, ceramics, and aggregates, was grouped.
- The machinery and equipment production industry (refractory products, fittings, car parts, electronics, machinery) was categorised as another group.
- All other industrial units not included above, as well as facilities that emitted less than 100 tons of CO2 in 2020, were aggregated into the final group. This includes waste management, general industry, building construction, hygiene products, printing, tobacco, mining, and window production.
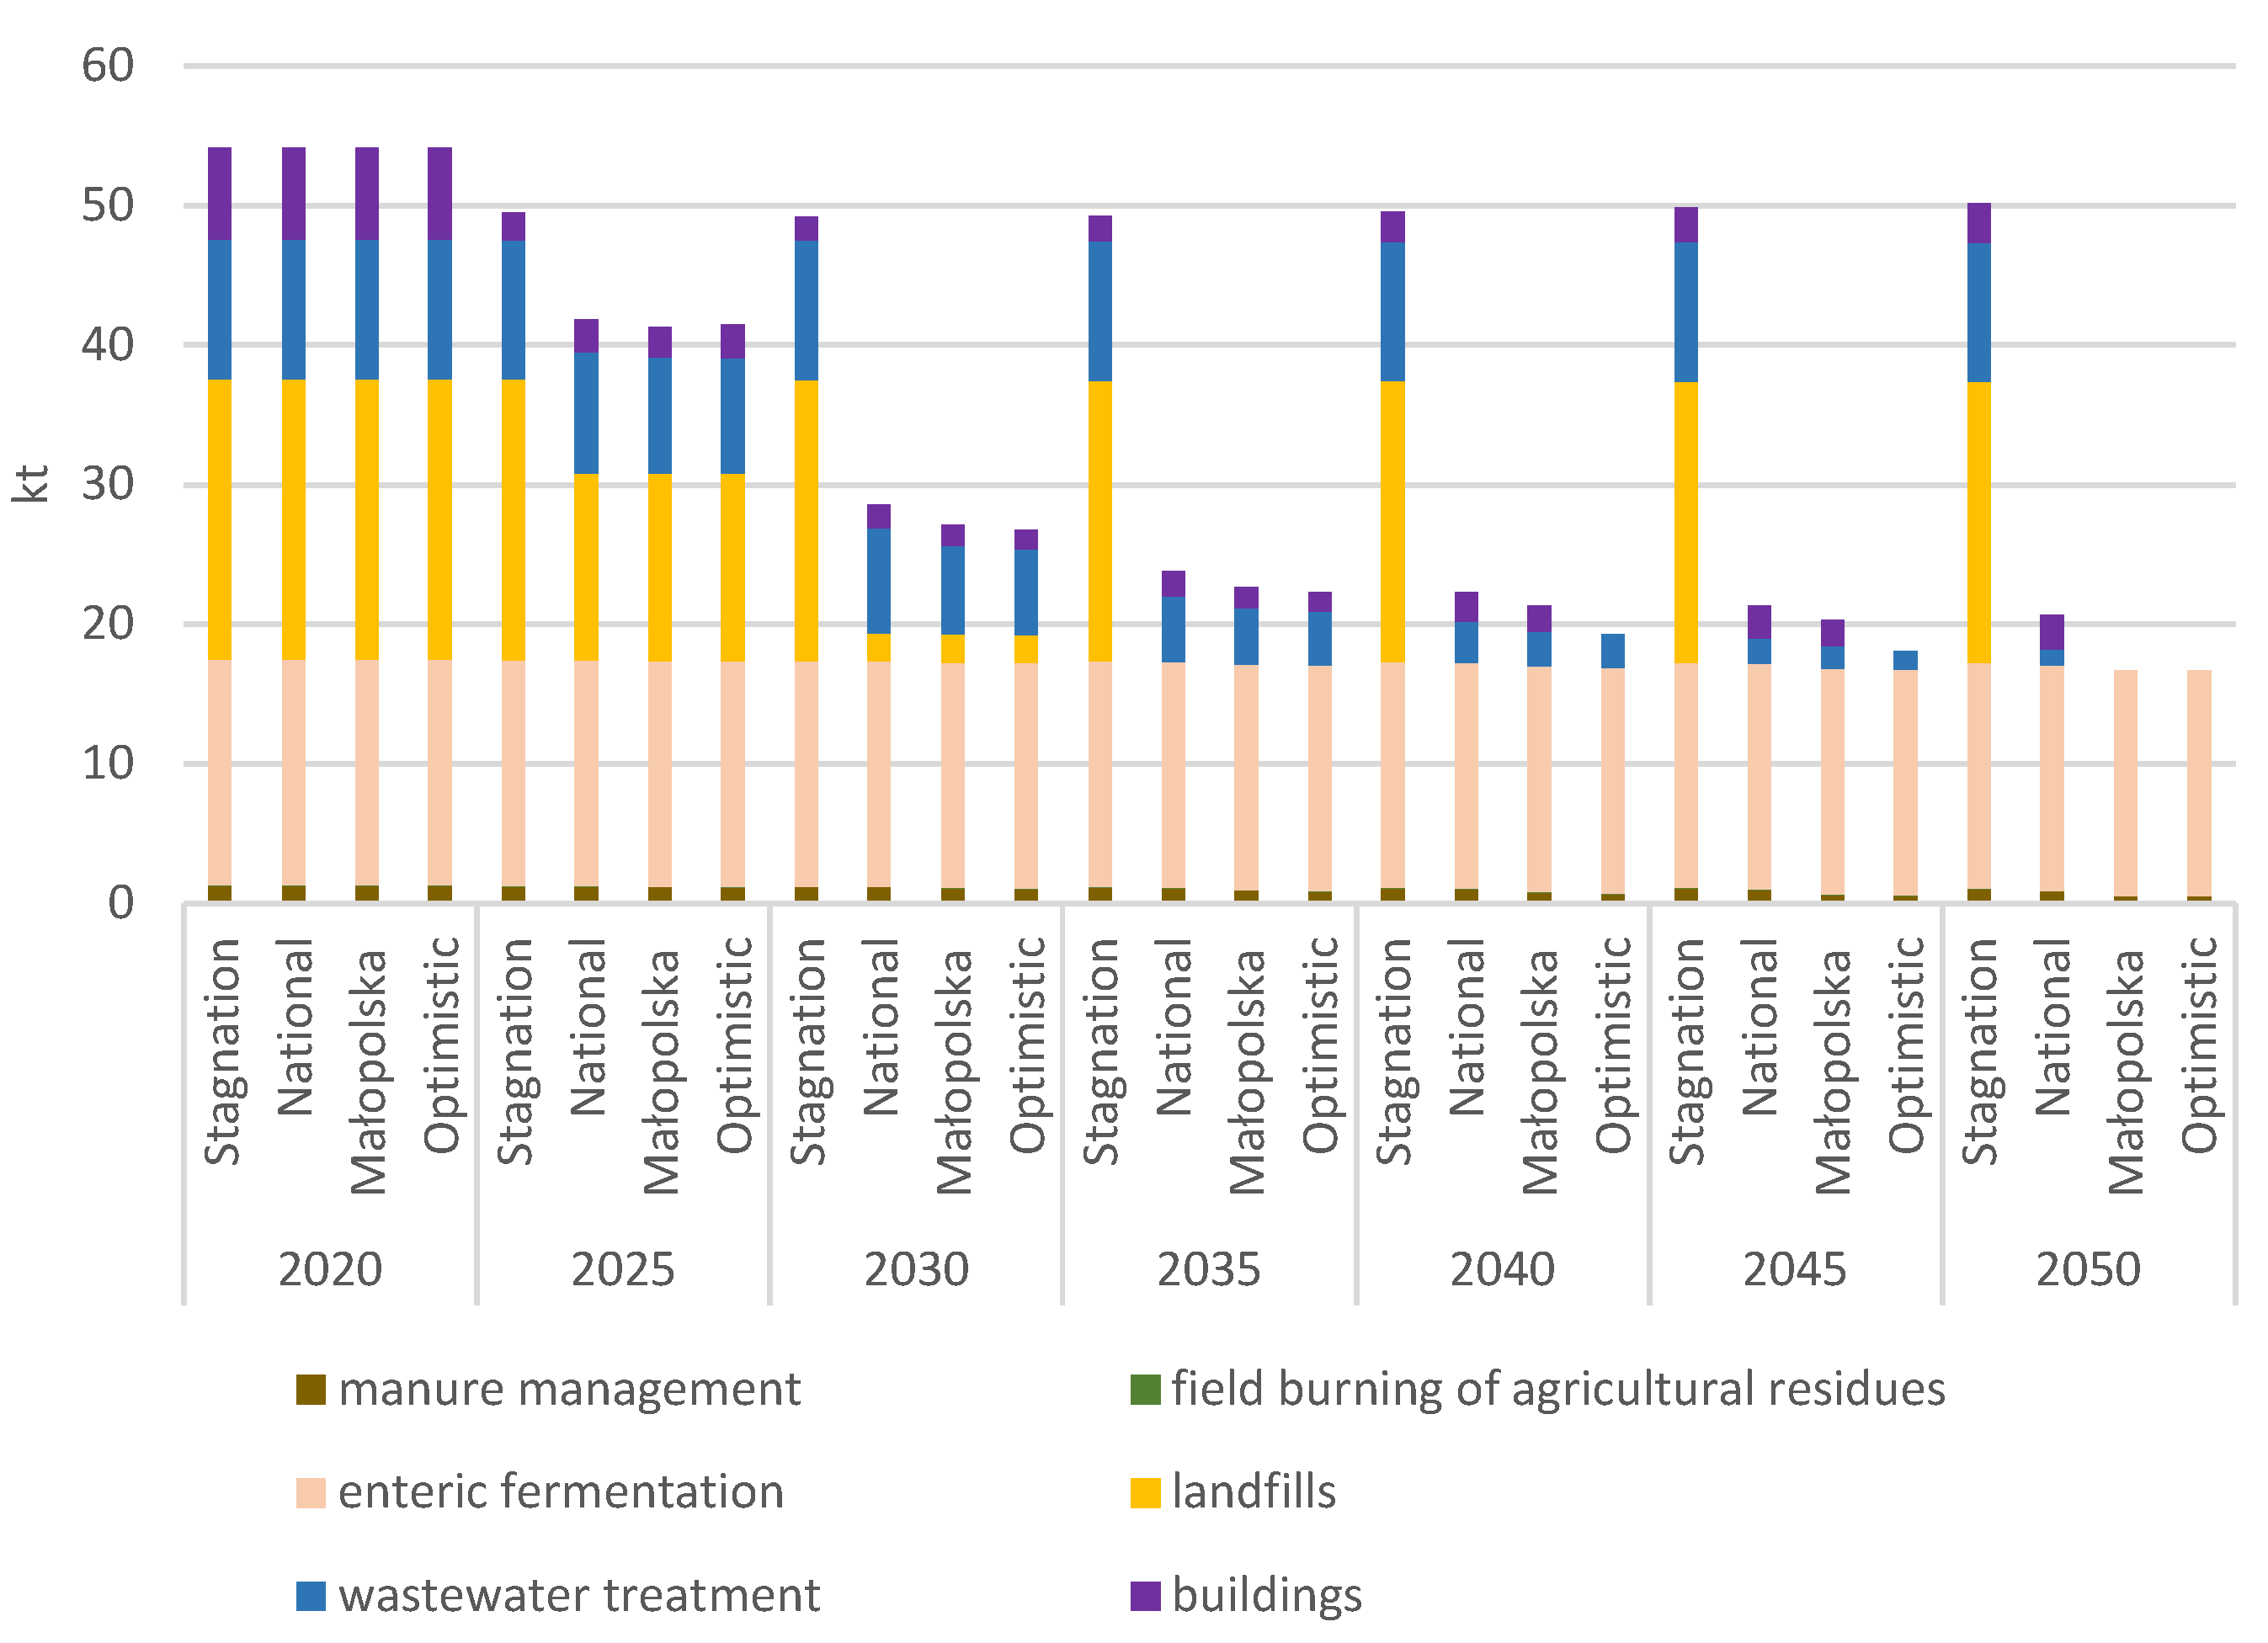
2.6. Agriculture
2.7. Land Use and Forestry
3. Scenarios
4. Results
5. Discussion
- Stagnation—A scenario assuming no implementation of climate goals, in which the economy transforms at its current pace, and renewable energy sources and energy efficiency are not promoted. However, in this scenario, existing mechanisms, such as the costs of CO2 emission allowances, are maintained.
- National—A scenario assuming that climate goals in the Małopolska province align with those set for Poland as a whole in the National Plan for Energy and Climate, which targets a 7% reduction in CO2 emissions for non-ETS sectors compared to 2005 levels.
- Małopolska—A scenario based on the targets set for the Małopolska province in the Regional Climate and Energy Action Plan. It assumes a 40% reduction in greenhouse gas emissions by 2030 compared to 1990 and aims at climate neutrality in the province by 2050.
- Optimistic—A scenario assuming a 55% reduction in greenhouse gas emissions by 2030 compared to 1990, along with the implementation of the “Fit for 55%” package, ultimately achieving climate neutrality in the province by 2050.
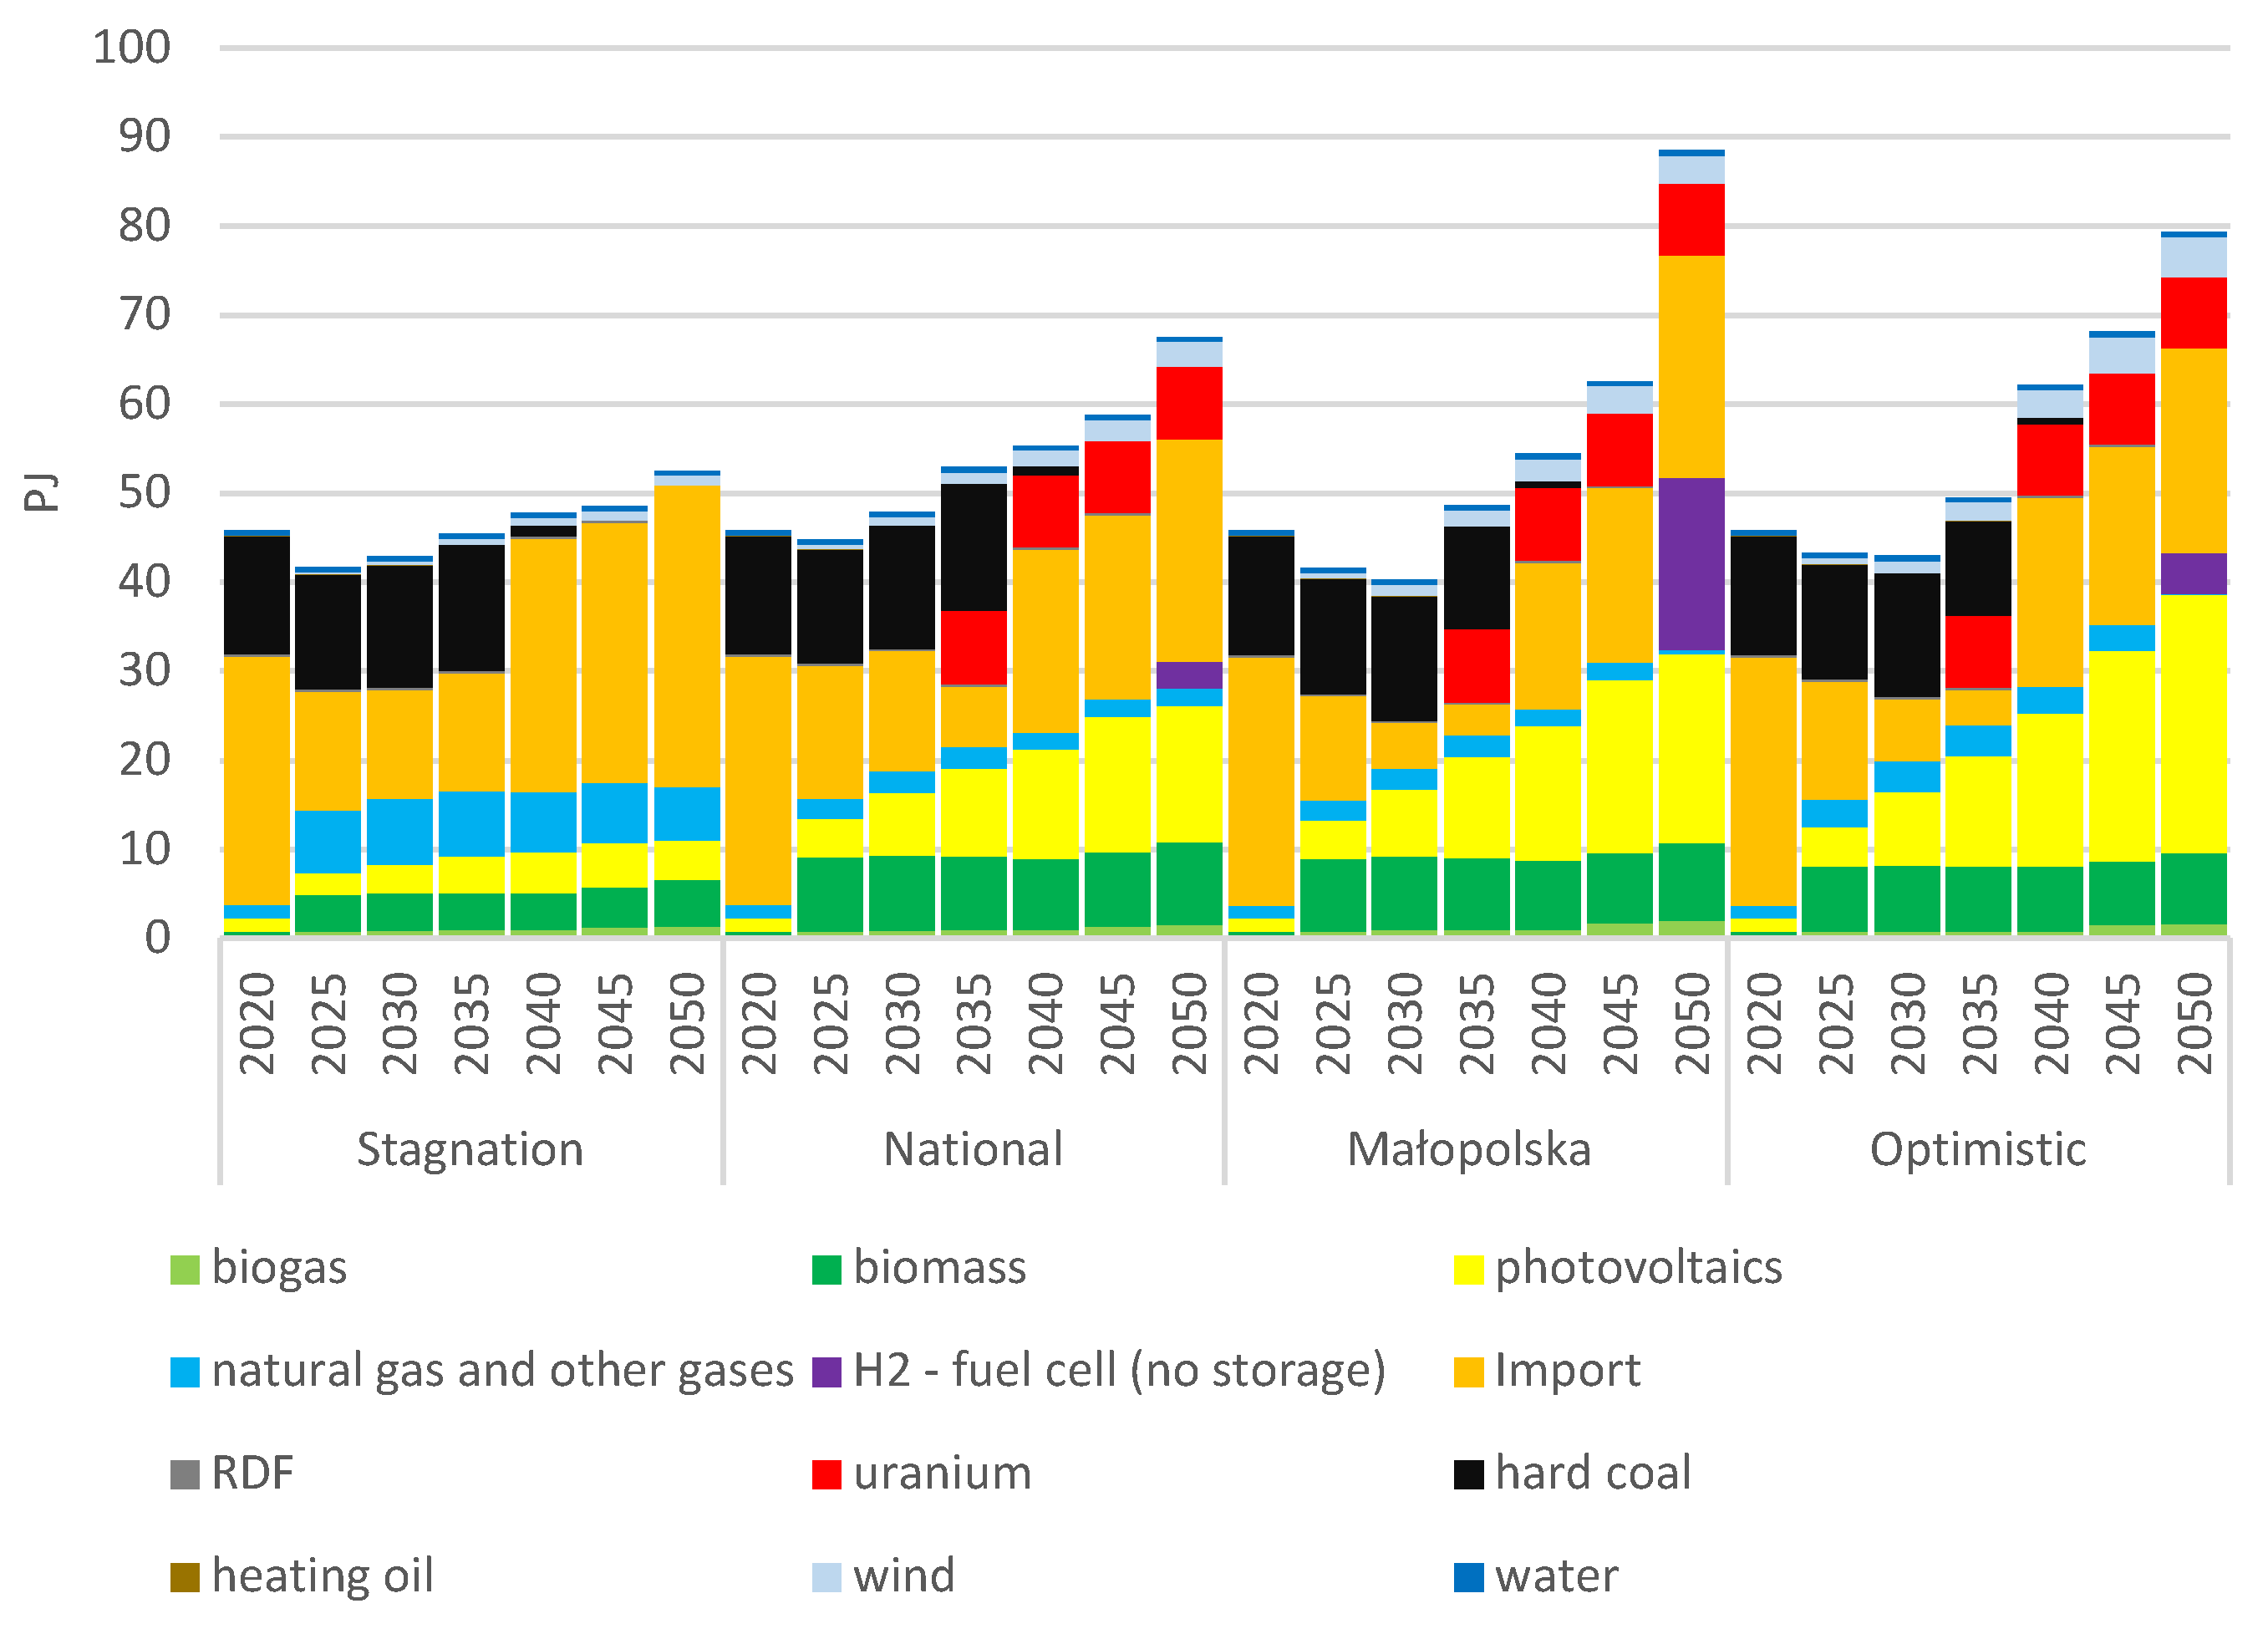
- In the Stagnation scenario, by 2050, 65% of electricity demand will be met through imports, as fossil fuel power plants will become unprofitable and renewable energy sources will remain underdeveloped.
- If the voivodeship aims at energy self-sufficiency, it must invest in nuclear power, as the potential of renewable energy sources will cover at most 45% of the electricity demand.
- The population density of the region is nearly twice that of the national average, and its largely mountainous terrain, including the Tatra Mountains, limits the potential for onshore wind energy development. Furthermore, due to its inland location, the model does not consider offshore wind energy.
- The use of small modular reactors (SMRs) in Poland remains a topic of debate due to the lack of existing commercial units, uncertain costs, and challenges related to social acceptance.
- If nuclear technology is excluded from the model, investments shift toward improving energy efficiency and greater imports of electricity.
- Livestock emissions can be offset through new afforestation efforts.
- In the building sector, energy consumption could be reduced by 45% between 2020 and 2050.
- However, in other sectors, achieving efficiency improvements is more challenging. Sector-specific targets alone are insufficient to meet the assumed energy efficiency goals for the region.
- If the voivodeship does not implement climate policies and targets in the coming years, as illustrated in the Stagnation scenario, it will face significant challenges in maintaining economic competitiveness due to reliance on imported energy and high-carbon-footprint products.
- The model does not prioritise investments in electricity storage, as the region’s limited renewable energy potential means that most of the energy from these sources is consumed in real time.
Author Contributions
Funding
Conflicts of Interest
References
- Coal Regions in Transition. Overview 2020; European Investment Bank: Luxembourg, 2020. [Google Scholar]
- Pietras-Goc, B.; Motak, E. Assumptions for the Territorial Plan of the Just Transformation of Western Małopolska. Appendix No. 1 to the Information for the Meeting of the Małopolska Province Board on 11 March 2021. 2021. Available online: https://www.malopolska.pl/file/news/2021/2021_03_11_Zal_1_Zalozenia_TPST_MZ.pdf (accessed on 20 February 2025). (In Polish).
- UMWM Regional Climate and Energy Action Plan. Annex No. 1 to Resolution No. 228/20 of the Małopolska Province Board of 18 February 2020; Marshal’s Office of the Małopolska Voivodeship: Kraków, Poland, 2020; Available online: https://bip.malopolska.pl/api/files/2311440 (accessed on 5 March 2024). (In Polish)
- Sowiżdżał, A.; Zyśk, J. Diagnosis of the Current Situation for the Purposes of Preparing the Regional Climate and Energy Plan for the Małopolska Voivodeship; AGH University of Krakow: Kraków, Poland, 2020. (In Polish) [Google Scholar]
- Limpens, G.; Moret, S.; Jeanmart, H.; Maréchal, F. EnergyScope TD: A Novel Open-Source Model for Regional Energy Systems. Appl. Energy 2019, 255, 113729. [Google Scholar] [CrossRef]
- Connolly, D.; Lund, H.; Mathiesen, B.V.; Leahy, M. A Review of Computer Tools for Analysing the Integration of Renewable Energy into Various Energy Systems. Appl. Energy 2010, 87, 1059–1082. [Google Scholar] [CrossRef]
- Pfenninger, S.; Hirth, L.; Schlecht, I.; Schmid, E.; Wiese, F.; Brown, T.; Davis, C.; Gidden, M.; Heinrichs, H.; Heuberger, C.; et al. Opening the Black Box of Energy Modelling: Strategies and Lessons Learned. Energy Strategy Rev. 2018, 19, 63–71. [Google Scholar] [CrossRef]
- Prina, M.G.; Lionetti, M.; Manzolini, G.; Sparber, W.; Moser, D. Transition Pathways Optimization Methodology through EnergyPLAN Software for Long-Term Energy Planning. Appl. Energy 2019, 235, 356–368. [Google Scholar] [CrossRef]
- Moret, S.; Codina Gironès, V.; Bierlaire, M.; Maréchal, F. Characterization of Input Uncertainties in Strategic Energy Planning Models. Appl. Energy 2017, 202, 597–617. [Google Scholar] [CrossRef]
- Gong, J.W.; Li, Y.P.; Lv, J.; Huang, G.H.; Suo, C.; Gao, P.P. Development of an Integrated Bi-Level Model for China’s Multi-Regional Energy System Planning under Uncertainty. Appl. Energy 2022, 308, 118299. [Google Scholar] [CrossRef]
- Liu, Y.; Yu, S.; Zhu, Y.; Wang, D.; Liu, J. Modeling, Planning, Application and Management of Energy Systems for Isolated Areas: A Review. Renew. Sustain. Energy Rev. 2018, 82, 460–470. [Google Scholar] [CrossRef]
- Borasio, M.; Moret, S. Deep Decarbonisation of Regional Energy Systems: A Novel Modelling Approach and Its Application to the Italian Energy Transition. Renew. Sustain. Energy Rev. 2022, 153, 111730. [Google Scholar] [CrossRef]
- Kavei, F.; Nicoli, M.; Quatraro, F.; Savoldi, L. The Energy Transition in the Age of Open Science: Call for Regional Modelling Solutions 2024. In Proceedings of the CUE2024—Applied Energy Symposium and Forum, Shenzhen, China, 11–13 May 2024. [Google Scholar]
- Sahoo, S.; Van Stralen, J.N.P.; Zuidema, C.; Sijm, J.; Faaij, A. Regionally Integrated Energy System Detailed Spatial Analysis: Groningen Province Case Study in the Northern Netherlands. Energy Convers. Manag. 2023, 277, 116599. [Google Scholar] [CrossRef]
- Gonocruz, R.A.; Ozawa, A.; Kudoh, Y. Japan’s Energy Transition Scenarios to Achieve Carbon Neutrality under Multiple Energy Service Demand: Energy System Analysis Using the AIST-TIMES Model. Appl. Energy 2025, 383, 125300. [Google Scholar] [CrossRef]
- Lund, H.; Mathiesen, B.V. Energy System Analysis of 100% Renewable Energy Systems—The Case of Denmark in Years 2030 and 2050. Energy 2009, 34, 524–531. [Google Scholar] [CrossRef]
- Bellocchi, S.; De Iulio, R.; Guidi, G.; Manno, M.; Nastasi, B.; Noussan, M.; Prina, M.G.; Roberto, R. Analysis of Smart Energy System Approach in Local Alpine Regions—A Case Study in Northern Italy. Energy 2020, 202, 117748. [Google Scholar] [CrossRef]
- Mimica, M.; Krajačić, G. The Smart Islands Method for Defining Energy Planning Scenarios on Islands. Energy 2021, 237, 121653. [Google Scholar] [CrossRef]
- Cormio, C.; Dicorato, M.; Minoia, A.; Trovato, M. A Regional Energy Planning Methodology Including Renewable Energy Sources and Environmental Constraints. Renew. Sustain. Energy Rev. 2003, 7, 99–130. [Google Scholar] [CrossRef]
- Cai, Y.P.; Huang, G.H.; Tan, Q.; Liu, L. An Integrated Approach for Climate-Change Impact Analysis and Adaptation Planning under Multi-Level Uncertainties. Part II. Case Study. Renew. Sustain. Energy Rev. 2011, 15, 3051–3073. [Google Scholar] [CrossRef]
- Miller, G.C.; Quashnick, J.; Hebert, V. Reaction Rate of Metallic Mercury with Hydroxyl Radical in the Gas Phase. Abstr. Pap. Am. Chem. Soc. 2001, U47, 221. [Google Scholar]
- Mutani, G.; Todeschi, V.; Tartaglia, A.; Nuvoli, G. Energy Communities in Piedmont Region (IT). The Case Study in Pinerolo Territory. In Proceedings of the 2018 IEEE International Telecommunications Energy Conference (INTELEC), Turino, Italy, 7–11 October 2018; IEEE: Piscataway, NJ, USA, 2018; pp. 1–8. [Google Scholar]
- Rabe, M.; Streimikiene, D.; Drożdż, W.; Bilan, Y.; Kasperowicz, R. Sustainable Regional Energy Planning: The Case of Hydro. Sustain. Dev. 2020, 28, 1652–1662. [Google Scholar] [CrossRef]
- Lyden, A.; Pepper, R.; Tuohy, P.G. A Modelling Tool Selection Process for Planning of Community Scale Energy Systems Including Storage and Demand Side Management. Sustain. Cities Soc. 2018, 39, 674–688. [Google Scholar] [CrossRef]
- Campillo, J.; Dahlquist, E.; Wallin, F.; Vassileva, I. Is Real-Time Electricity Pricing Suitable for Residential Users without Demand-Side Management? Energy 2016, 109, 310–325. [Google Scholar] [CrossRef]
- Zhang, H.; Zhai, X.; Zhang, J.; Bai, X.; Li, Z. Mechanism Analysis of the Effect of the Equivalent Proportional Coefficient of Inertia Control for a Doubly Fed Wind Generator on Frequency Stability in Extreme Environments. Sustainability 2024, 16, 4965. [Google Scholar] [CrossRef]
- IEA-ETSAP TIMES. Available online: https://iea-etsap.org/index.php/etsap-tools/model-generators/times (accessed on 20 February 2025).
- Loulou, R.; Goldstein, G.; Noble, K. Documentation for the MARKAL Family of Models; Energy Technology Systems Analysis Programme: Paris, France, 2004. [Google Scholar]
- Amorim, F.; Pina, A.; Gerbelová, H.; Pereira Da Silva, P.; Vasconcelos, J.; Martins, V. Electricity Decarbonisation Pathways for 2050 in Portugal: A TIMES (The Integrated MARKAL-EFOM System) Based Approach in Closed versus Open Systems Modelling. Energy 2014, 69, 104–112. [Google Scholar] [CrossRef]
- Balyk, O.; Andersen, K.S.; Dockweiler, S.; Gargiulo, M.; Karlsson, K.; Næraa, R.; Petrović, S.; Tattini, J.; Termansen, L.B.; Venturini, G. TIMES-DK: Technology-Rich Multi-Sectoral Optimisation Model of the Danish Energy System. Energy Strategy Rev. 2019, 23, 13–22. [Google Scholar] [CrossRef]
- Loulou, R.; Goldstein, G.; Kanudia, A.; Lettila, A.; Remme, U. Documentation for the TIMES Model. PART I 2016; Energy Technology Systems Analysis Programme: Paris, France, 2016. [Google Scholar]
- Loulou, R.; Lettila, A.; Kanudia, A.; Remme, U.; Goldstein, G. Documentation for the TIMES Model. PART II 2016; Energy Technology Systems Analysis Programme: Paris, France, 2016. [Google Scholar]
- Gargiulo, M. Getting Started with TIMES-VEDA; Energy Technology Systems Analysis Programme: Paris, France, 2009. [Google Scholar]
- Muehlich, P.; Hamacher, T. Global Transportation Scenarios in the Multi-Regional EFDA-TIMES Energy Model. Fusion Eng. Des. 2009, 84, 1361–1366. [Google Scholar] [CrossRef]
- Krakowski, V.; Assoumou, E.; Mazauric, V.; Maïzi, N. Feasible Path toward 40–100% Renewable Energy Shares for Power Supply in France by 2050: A Prospective Analysis. Appl. Energy 2016, 171, 501–522. [Google Scholar] [CrossRef]
- Panos, E.; Kober, T.; Wokaun, A. Long Term Evaluation of Electric Storage Technologies vs Alternative Flexibility Options for the Swiss Energy System. Appl. Energy 2019, 252, 113470. [Google Scholar] [CrossRef]
- Danyang, L.; Wenying, C. Prospective Influences of the Substitution of Electric Vehicles for Liquid Vehicles: TIMES Modeling of the Global Energy System. Energy Procedia 2019, 158, 3782–3787. [Google Scholar] [CrossRef]
- Kimuli, I.; Goldstein, G.; Lubwama, M.; Kirabira, J.B.; Sebbit, A. Energy Scenarios for Greater Kampala Metropolitan Area towards a Sustainable 2050: A TIMES-VEDA Analysis. Smart Energy 2023, 10, 100099. [Google Scholar] [CrossRef]
- Allena-Ozolina, S.; Pakere, I.; Jaunzems, D.; Freimanis, R.; Blumberga, A.; Bazbauers, G. Passenger Transport Shift to Green Mobility—Assessment Using TIMES Model. Environ. Clim. Technol. 2022, 26, 341–356. [Google Scholar] [CrossRef]
- Allena-Ozolina, S.; Pakere, I.; Jaunzems, D.; Blumberga, A.; Bazbauers, G. Integrated MARKAL-EFOM System (TIMES) Model for Energy Sector Modelling. In Proceedings of the 2020 IEEE 61th International Scientific Conference on Power and Electrical Engineering of Riga Technical University (RTUCON), Riga, Latvia, 5–7 November 2020; IEEE: Piscataway, NJ, USA, 2020; pp. 1–7. [Google Scholar]
- Tortorella, M.M.; Di Leo, S.; Cosmi, C.; Fortes, P.; Viccaro, M.; Cozzi, M.; Pietrapertosa, F.; Salvia, M.; Romano, S. A Methodological Integrated Approach to Analyse Climate Change Effects in Agri-Food Sector: The TIMES Water-Energy-Food Module. Int. J. Environ. Res. Public Health 2020, 17, 7703. [Google Scholar] [CrossRef]
- Allena-Ozolina, S.; Jaunzems, D.; Pakere, I.; Blumberga, A.; Bazbauers, G. Decarbonisation Pathways of Industry in TIMES Model. Environ. Clim. Technol. 2021, 25, 318–330. [Google Scholar] [CrossRef]
- Wyrwa, A.; Suwała, W.; Pluta, M.; Raczyński, M.; Zyśk, J.; Tokarski, S. A New Approach for Coupling the Short- and Long-Term Planning Models to Design a Pathway to Carbon Neutrality in a Coal-Based Power System. Energy 2021, 239, 122438. [Google Scholar] [CrossRef]
- Pluta, M.; Wyrwa, A.; Zyśk, J.; Suwała, W.; Raczyński, M. Scenario Analysis of the Development of the Polish Power System towards Achieving Climate Neutrality in 2050. Energies 2023, 16, 5918. [Google Scholar] [CrossRef]
- Zyśk, J.; Wyrwa, A.; Raczyński, M.; Pluta, M.; Michalska, S.; Wyrwa, E.; Olkuski, T.; Suwała, W. Energy and Emission Balance of the Małopolskie Voivodeship in 2020. Min. Inform. Autom. Electr. Eng. 2023, 1, 7–12. [Google Scholar] [CrossRef]
- Sowiżdżał, A.; Tomaszewska, B.; Pająk, L.; Kaczmarczyk, M.; Luboń, W.; Pełka, G.; Hałaj, E.; Hajto, M.; Brawiak, K.; Chmielowska, A.; et al. Assessment of the Renewable Energy Potential in the Małopolska Region; AGH University of Krakow: Krakow, Poland, 2022. (In Polish) [Google Scholar]
- Conclusions from Forecast Analyses for the Energy Sector; Ministry of Climate and Environment: Warsaw, Poland, 2021. (In Polish)
- MCE Scenario 3. For Pre-Consultation on the Update of KPEIK/PEP2040. Analysis for the Power Sector Taking into Account the Change of the Political and Economic Situation After the Russian Invasion of Ukraine; Ministry of Climate and Environment: Warsaw, Poland, 2023. (In Polish)
- Polish Energy Policy Until 2040. 2021. Available online: https://www.gov.pl/web/climate/energy-policy-of-poland-until-2040-epp2040 (accessed on 3 June 2022). (In Polish)
- Pluta, M.; Wyrwa, A.; Suwała, W.; Zyśk, J.; Raczyński, M.; Tokarski, S. A Generalized Unit Commitment and Economic Dispatch Approach for Analysing the Polish Power System under High Renewable Penetration. Energies 2020, 13, 1952. [Google Scholar] [CrossRef]
- GUS. Statistical Yearbook of the Republic of Poland 2020; Central Statistical Office: Warsaw, Poland, 2020. (In Polish) [Google Scholar]
- Population Forecast for the Małopolska Voivodeship until 2050; The Małopolska Regional Research Centre and the Statistical Office in Kraków: Krakow, Poland, 2015.
- GUS. Statistical Yearbook of the Małopolska Voivodeship; Editorial Team of the Statistical Office in Krakow: Krakow, Poland, 2021. (In Polish) [Google Scholar]
- Potyra, M. Household Forecast for 2016–2050; Central Statistical Office, Department of Demographic and Labor Market Research: Warsaw, Poland, 2016. (In Polish) [Google Scholar]
- GUS. Energy Consumption in Households—Estimated Data for 2020; Central Statistical Office: Warsaw, Poland, 2020. (In Polish) [Google Scholar]
- GUS. Housing and Municipal Infrastructure in 2020; Central Statistical Office: Warsaw, Poland, 2021. (In Polish) [Google Scholar]
- Institut Wohnen und Umwelt GmbH. Residential Building Typology. Available online: https://episcope.eu/building-typology/country/pl/ (accessed on 3 June 2022).
- Chiodi, A.; De Miglio, R.; Gargiulo, M.; Kanudia, A.; Nijs, W.; Politis, S.; Ruiz Castello, P.; Zucker, A. JRC-EU-TIMES 2017 Upgrade—Buildings and Heating and Cooling Technologies; Publications Office of the European Union: Luxembourg, 2017. [Google Scholar]
- Szczukocka, A. Statistical Assessment of the Importance of the Services Sector in the Economy; Publishing House of University of Łódź: Łódź, Poland, 2013. [Google Scholar]
- Nijs, W.; Ruiz, P. 01_JRC-EU-TIMES Full Model. 2019. Available online: https://data.jrc.ec.europa.eu/dataset/8141a398-41a8-42fa-81a4-5b825a51761b (accessed on 3 June 2022).
- Peryt, S.; Wnuk, R.; Berent-Kowalska, G.; Nowakowski, P. Energy Efficiency 2010–2020; Statistics Poland: Warsaw, Poland, 2022. [Google Scholar]
- Main Office of Building Supervision Central Register of Building Emissions. Available online: https://www.gunb.gov.pl/podmenu/1713 (accessed on 8 June 2022).
- Minister of Transport, Construction and Maritime Economy Regulation of the Minister of Transport, Construction and Maritime Economy of 5 July 2013 Amending the Regulation on Technical Conditions to Be Met by Buildings and Their Location; Journal of Laws of The Republic of Poland: Warsaw, Poland, 2013. Available online: https://isap.sejm.gov.pl/isap.nsf/download.xsp/WDU20130000926/O/D20130926.pdf (accessed on 5 June 2023). (In Polish)
- GUS. The Situation of Households in 2020 in the Light of the Results of the Household Budget Survey; Central Statistical Office: Warsaw, Poland, 2021. (In Polish) [Google Scholar]
- GUS. Household Budgets in 2020; Central Statistical Office: Warsaw, Poland, 2020. (In Polish) [Google Scholar]
- Waśkiewicz, J.; Pawlak, P. Expert Forecasts of Changes in the Road Transport Sector Activity (in the Context of the Act on the Greenhouse Gas and Other Substances Emission Management System) Tabulated List; Motor Transport Institute: Warsaw, Poland, 2017. (In Polish) [Google Scholar]
- Eurostat Passenger Road Transport on National Territory, by Type of Vehicles Registered in the Reporting Country. Available online: https://ec.europa.eu/eurostat/databrowser/view/ROAD_PA_MOV/default/table?lang=en%20 (accessed on 20 June 2020).
- Eurostat Railway Transport Measurement—Passengers. Available online: https://ec.europa.eu/eurostat/databrowser/view/rail_pa_quartal/default/table?lang=en (accessed on 1 September 2022).
- Eurostat Goods Transported by Type of Transport. Available online: https://ec.europa.eu/eurostat/databrowser/view/RAIL_GO_TYPEPAS__custom_3599985/default/table?lang=en (accessed on 5 June 2022).
- GUS Central Statistical Office, Local Data Bank. Available online: https://bdl.stat.gov.pl/bdl/dane/podgrup/temat (accessed on 20 January 2024).
- State of the City Report 2020; Krakow City Hall Department of Strategy, Planning and Investment Monitoring Department of Strategic Planning and Analysis: Krakow, Poland, 2021. (In Polish)
- European Commission TREMOVE: An EU-Wide Transport Model. Available online: https://ec.europa.eu/environment/archives/air/models/tremove.htm (accessed on 12 February 2022).
- Road Transport in Poland in 2018 and 2019; Central Statistical Office: Warsaw, Szczecin, 2021. (In Polish)
- Eurostat Road Traffic by Type of Vehicle (Million Vkm). Available online: https://ec.europa.eu/eurostat/databrowser/view/road_tf_road/default/table?lang=en&category=road.road_tf (accessed on 26 March 2025).
- Zieliński, J.; Tutka, P.; Kunikowski, P.; Szyszło, A. Synthesis of the Results of the 2020/21 GPR on the Rural National Road Network; General Directorate for National Roads and Motorways, Heller Consult sp. z o.o.: Warsaw, Poland, 2021. (In Polish) [Google Scholar]
- Zieliński, J.; Tutka, P.; Kunikowski, P.; Szyszło, A. Synthesis of the Results of the 2020/21 GPR on the Provincial Road Network Outside the City; General Directorate for National Roads and Motorways, Heller Consult sp. z o.o.: Warsaw, Poland, 2021. (In Polish) [Google Scholar]
- Railways in the Voivodeships—Use and Transport Policy; Office of Rail Transport: Warsaw, Poland, 2019. (In Polish)
- Eurostat Summary of Quarterly Road Freight Transport by Type of Operation and Type of Transport. Available online: https://ec.europa.eu/eurostat/databrowser/view/road_go_tq_tott/default/table?lang=en (accessed on 2 February 2022). (In Polish).
- International Council on Clean Transportation. Available online: https://theicct.org/ (accessed on 21 March 2025).
- Gillingham, K. Carbon Calculus. For Deep Greenhouse Gas Emission Reductions, a Long-Term Perspective on Costs Is Essential. In Finance & Development; International Monetary Fund: Washington, DC, USA, 2019. [Google Scholar]
- Jin, Y.; Chen, B. Comparison of Potential CO2 Reduction and Marginal Abatement Costs across in the China and Korea Manufacturing Industries. J. Innov. Knowl. 2022, 7, 100172. [Google Scholar] [CrossRef]
- Lameh, M.; Al-Mohannadi, D.M.; Linke, P. Minimum Marginal Abatement Cost Curves (Mini-MAC) for CO2 Emissions Reduction Planning. Clean Technol. Environ. Policy 2022, 24, 143–159. [Google Scholar] [CrossRef]
- Ocena Potencjału Redukcji Emisji Gazów Cieplarnianych w Polsce Do Roku 2030. Podsumowanie; McKinsey & Company Poland: Warsaw, Poland, 2009.
- Peryt, S. Trendy Efektywności Energetycznej Polskiej Gospodarki z Wykorzystaniem Narzędzi ODYSSEE; GUS: Warsaw, Poland, 2021. [Google Scholar]
- Engel, H.; Purta, M.; Speelman, E.; Szarek, G.; Pluijm, P. Carbon-Neutral Poland 2050; McKinsey & Company: Warsaw, Poland, 2020. [Google Scholar]
- Zibunas, C.; Meys, R.; Kätelhöna, A.; Bardowa, A. Cost-Optimal Pathways towards Net-Zero Chemicals and Plastics Based on a Circular Carbon Economy. Comput. Chem. Eng. 2022, 162, 107798. [Google Scholar] [CrossRef]
- Agricultural Census 2020; Central Statistical Office: Warsaw, Poland, 2023. (In Polish)
- Livestock in 2020; Central Statistical Office: Warsaw, Poland, 2021. (In Polish)
- Dong, H.; Mangino, J.; McAllister, T.A.; Hatfield, J.L.; Johnson, D.E.; Lassey, K.R.; Aparecida de Lima, M.; Romanovskaya, A. 2006 IPCC Guidelines for National Greenhouse Gas Inventories. Volume 4: Agriculture, Forestry and Other Land Use. Chapter 10: Emissions from Livestock and Manure Managemen; IPCC: Geneva, Switzerland, 2006. [Google Scholar]
- Facts about Fur Farming in Poland; Association of Entrepreneurs and Employers: Warsaw, Poland, 2020.
- KOBIZE A Package of Tables with Data on Greenhouse Gas Emissions in the Common Reporting Format (CRF); It Contains Detailed Emission Data for the Years 1988–2021. The Data Was Reported to the UNFCCC Secretariat on 28.03.2023; National Centre for Emission Balancing and Management: Warsaw, Poland, 2023.
- EC. EU Agricultural Outlook for Markets, Income and Environment, 2021–2031; European Commission, DG Agriculture and Rural Development: Brussels, Belgium, 2021. [Google Scholar]
- National Afforestation Programme; Ministry of the Environment: Warsaw, Poland, 2023. (In Polish)
- UMWM Air Protection Program for the Małopolska Province. Małopolska in a Healthy Atmosphere. Annex No. 2 to Resolution No. XXV/373/20 of the Małopolska Regional Assembly of 28 September 2020; Official Journal of the Małopolska Voivodeship: Warszawa, Poland, 2020. Available online: https://edziennik.malopolska.uw.gov.pl/WDU_K/2020/6337/akt.pdf (accessed on 5 January 2024). (In Polish)
- MIiS. Polish Hydrogen Strategy until 2030, Annex to Resolution No. 149 of the Council of Ministers of 2 November 2021; Ministry of Climate and Environment: Warsaw, Poland, 2021. (In Polish) [Google Scholar]
- MAP. National Energy and Climate Plan 2021–2030. Assumptions and Goals, Policies and Actions; Ministry of State Assets: Warsaw, Poland, 2019. [Google Scholar]
- MVS. Development Strategy of the Voivodeship “Małopolska 2030”. Annex to Resolution No. XXXI/422/20 of the Regional Assembly of the Małopolska Voivodeship of 17 December 2020; Małopolska Voivodeship Sejmik: Kraków, Poland, 2020. [Google Scholar]
- Long-Term Building Renovation Strategy. Supporting the Renovation of the National Building Stock. Annex to Resolution No. 23/2022 of the Council of Ministers of 9 February 2022. 2022. Available online: https://energy.ec.europa.eu/system/files/2022-06/PL%202020%20LTRS%20_%20EN%20version.pdf (accessed on 15 February 2022).
- European Commission PRIMES Energy System Model. Available online: https://web.jrc.ec.europa.eu/policy-model-inventory/explore/models/model-primes (accessed on 15 February 2022).


| Fuel/ Technology | Start | Investment Costs | Fixed Cost | Variable Costs (Fuel Costs Excluded) | Net Efficiency | Technical Lifespan | CO2 Emission Factor |
|---|---|---|---|---|---|---|---|
| Year | EUR/kW | EUR/kW | EUR/kW | % | Years | kg/GJ | |
| Hard coal—PC | 2025 | 1658 | 44 | 0.89 | 46 | 40 | 94.19 |
| Hard coal—PC + CCS | 2035 | 3014 | 75 | 1.44 | 38 | 40 | 11.30 |
| Hard coal—IGCC | 2025 | 2261 | 58 | 1.39 | 48 | 40 | 94.19 |
| Hard coal—IGGC + CCS | 2035 | 3265 | 79 | 2.03 | 40 | 40 | 11.30 |
| Hard coal—CHP | 2025 | 2261 | 48 | 0.89 | 30/80 | 40 | 94.19 |
| Hard coal—CHP + CCS | 2035 | 3517 | 76 | 2.79 | 22/75 | 40 | 12 |
| Natural gas—CCGT | 2025 | 754 | 18 | 0.51 | 58–62 | 30 | 55.82 |
| Natural gas—CCGT + CCS | 2035 | 1357 | 39 | 1.13 | 50–52 | 30 | 6.70 |
| Natural gas—OCGT | 2025 | 502 | 16 | 0.39 | 40 | 30 | 55.82 |
| Natural gas—CHP CCGT | 2025 | 1013 | 25 | 0.36 | 34/80 | 30 | 55.82 |
| Nuclear—SMR (with heat recovery) | 2030 | 5523–4380 * | 88 | 1.71 | 33/60 | 60 | 0 |
| Wind onshore | 2025 | 1367–1107 * | 35–31 * | – | – | 25 | 0 |
| PV (roof) | 2025 | 818–647 * | 10–8 * | – | – | 25 | 0 |
| PV (ground) | 2025 | 758–593 * | 16 | – | – | 25 | 0 |
| Hydro (small) | 2025 | 1976 | 75 | – | – | 60 | 0 |
| Biomass—CHP | 2025 | 2915–2718 * | 121 | 0.89 | 30/80 | 30 | 0 |
| Biogas—CHP | 2025 | 2663 | 108 | 0.57 | 37/85 | 25 | 0 |
| Hard coal—heating boiler | 2025 | 352 | 1 | 0.39 | 90 | 30 | 94.19 |
| Natural gas—heating boiler | 2025 | 151 | 1 | 0.02 | 96 | 30 | 55.82 |
| Heating oil—heating boiler | 2025 | 201 | 1 | 0.14 | 95 | 30 | 74.10 |
| Biomass—heating boiler | 2025 | 502 | 1 | 0.09 | 90 | 30 | 0 |
| Electricity—heating boiler | 2025 | 118 | 1 | 0.11 | 99 | 30 | 0 |
| Electricity—large-scale heat pump | 2025 | 827 | 1 | 0.11 | 350 | 20 | 0 |
| Geothermal energy—heating plant | 2025 | 1253 | 1 | 0.11 | 95 | 40 | 0 |
| Fuel of Technology | Start | Investment Costs | Fixed Cost | Variable Costs (Fuel Costs Excluded) | Net Efficiency | Technical Lifespan |
|---|---|---|---|---|---|---|
| year | EUR/GJ | EUR/GJ | EUR/GJ | % | years | |
| Lithium-ion battery | 2025 | 92,700–39,730 * | – | – | 90 | 10 |
| Lead–acid battery | 2025 | 55,620–50,323 * | – | – | 80 | 10 |
| Compressed air energy storage | 2025 | 34,961–29,664 * | – | – | 55 | 60 |
| Pumped-storage hydroelectricity | 2025 | 110,741 | – | – | 75 | 60 |
| Compressed hydrogen storage ** | 2025 | 2877 | – | – | 85 | 30 |
| year | EUR/kW | EUR/kW | EUR/GJ | % | years | |
| Electrolyzer—hydrogen production ** | 2025 | 558–200 * | 8 | 11.86 | 62 | 30 |
| Hydrogen cells (without heat recovery) ** | 2025 | 30,023–698 * | 151 | 44.18 | 44 | 10 |
| Stagnation | National | Małopolska | Optimistic |
|---|---|---|---|
| Climate | |||
| No climate targets | 2030: CO2 emission reduction for non-ETS sectors 7% compared to year 2005 | 2030: Reducing GHG at least 40% (compared to year 1990) 2050: climate neutrality | 2030: Reducing GHG by at least 55% (compared to year 1990), 2050: climate neutrality |
| Energy efficiency | |||
| 2030: Remaining unchanged energy consumption at the 2020 level | 2030: Improvement of energy efficiency 23% in relation to primary energy consumption compared to PRIMES 2007 forecast | 2030: Improvement of energy efficiency by 32.5% in relation to primary energy consumption compared to PRIMES 2007 forecast | 2030: At least 40% improvement in energy efficiency compared to PRIMES 2007 forecast |
| Renewable energy sources | |||
| 2030: Share of RES up to 20% of gross final energy consumption | 2030: Share of RES at least 23.5% of gross final energy consumption | 2030: Share of RES at least 32% of gross final energy consumption | 2030: Share of RES at least 40% of gross final energy consumption |
Disclaimer/Publisher’s Note: The statements, opinions and data contained in all publications are solely those of the individual author(s) and contributor(s) and not of MDPI and/or the editor(s). MDPI and/or the editor(s) disclaim responsibility for any injury to people or property resulting from any ideas, methods, instructions or products referred to in the content. |
© 2025 by the authors. Licensee MDPI, Basel, Switzerland. This article is an open access article distributed under the terms and conditions of the Creative Commons Attribution (CC BY) license (https://creativecommons.org/licenses/by/4.0/).
Share and Cite
Zyśk, J.; Wyrwa, A.; Raczyński, M.; Pluta, M.; Suwała, W. Regional-Scale Energy Modelling for Developing Strategies to Achieve Climate Neutrality. Energies 2025, 18, 1787. https://doi.org/10.3390/en18071787
Zyśk J, Wyrwa A, Raczyński M, Pluta M, Suwała W. Regional-Scale Energy Modelling for Developing Strategies to Achieve Climate Neutrality. Energies. 2025; 18(7):1787. https://doi.org/10.3390/en18071787
Chicago/Turabian StyleZyśk, Janusz, Artur Wyrwa, Maciej Raczyński, Marcin Pluta, and Wojciech Suwała. 2025. "Regional-Scale Energy Modelling for Developing Strategies to Achieve Climate Neutrality" Energies 18, no. 7: 1787. https://doi.org/10.3390/en18071787
APA StyleZyśk, J., Wyrwa, A., Raczyński, M., Pluta, M., & Suwała, W. (2025). Regional-Scale Energy Modelling for Developing Strategies to Achieve Climate Neutrality. Energies, 18(7), 1787. https://doi.org/10.3390/en18071787