1. Introduction
Lithium-ion batteries are widely used in electric vehicles (EVs) owing to their high energy density, high power density, long cycle life, and low self-discharge coefficient [
1,
2,
3]. Consequently, the demands for battery management systems (BMSs) are also continuously increasing [
4,
5]. State of energy (SOE), as an important component of state parameters, is generally better at reflecting the energy capacity and available power level of a battery compared to state of charge (SOC). The accurate and reliable estimation of SOE is an important guarantee for the safe and efficient operation of battery systems [
6,
7].
Battery packs always consist of hundreds and thousands of cells in both series and parallel modes, which work together to meet the power and energy demands of EVs [
5,
8,
9]. However, the resulting inconsistency risks between each cell pose many difficulties for the SOE estimation of battery packs [
10,
11]. How to exploit a simple, efficient, and accurate SOE estimation method for BMSs is still a challenging task.
Typically, in SOE estimation, a strategy combining continuous energy accumulation and intermittent correction is adopted [
12]. The energy accumulation method is the most basic method that estimates SOE by integrating the product of voltage and current over time [
13]. Due to its extremely wide coverage of operating conditions, it is taken as an indispensable part of SOE estimation. However, for the energy accumulation method, the effects of inaccurate initial values and continuously accumulated systematic errors cannot be overcome. Therefore, under specific conditions, appropriate correction methods need to be adopted to promptly calibrate the errors generated by the energy accumulation method. This means that to develop an accurate SOE estimation method for battery packs, research on correction methods is crucial.
In early research on correction methods, lithium-ion battery packs were always simplified as “large cells”, and the SOE was estimated by cell methods such as the model-based approach [
5,
8] and data-driven approach [
14,
15]. Though this type of method is easy to operate, it does not take into account the inconsistency between each cell, which will lead to the estimation results gradually deviating from the true values, especially in the stage of obvious aging. Many efforts have been made to improve the accuracy estimation of battery pack SOE by considering the issue of inconsistent aging levels among cells. Refs. [
16,
17] suggested that some prominent cells within the battery pack can well represent its dynamic characteristics. These cells were selected as representative cells. After estimating the SOEs of these representative cells, a dynamic weighting method was used to combine the energy states of the representative cells for the battery pack state. Continuing this line of thought, in Ref. [
7], two representative cells were determined by the highest and lowest terminal voltage, and a dynamic weight allocation method based on terminal voltage was applied to the SOE of the two representative cells. In addition, in Ref. [
18], under the same weight allocation scheme, two representative cells were determined based on ohmic resistance, and their SOEs were estimated by the Adaptive Extended Kalman Filter (AEKF) algorithm.
These methods based on representative cells effectively incorporate cell inconsistency into SOE estimation and greatly reduce computational complexity. However, there is still an inescapable potential hazard with such methods, which lies in the weight allocation for SOE. In the above references, the input for weights was always voltage, which meant that the accuracy of battery pack SOE estimation heavily depended on the linearity between cells’ voltage and their SOE. Meanwhile, these references all took ternary lithium-ion batteries as the experimental subjects. Whether NCA (Li-Ni-Co-Al-Oxide) or NCM (Li-Ni-Co-Mn-Oxide), both types of batteries have a good linear relationship between their SOE and voltage, which ensures the effectiveness of these methods. But for LFP (LiFePO4) batteries, this method is not applicable. This is because the voltage curve has a large plateau which seriously undermines the linearity between SOE and voltage. When weight allocation methods based on voltage are used for the SOE estimation of LFP battery packs, they can lead to extremely unreasonable weight allocation during most charging and discharging intervals, ultimately leading to incorrect SOE estimation results for the battery pack.
To solve this problem, a new approach based on the online construction of the average open-circuit voltage (OCV) curve for a series-connected battery pack is proposed in this paper. In this new method, the average OCV curve, which is just the average value of all series-connected cells’ curves and can be directly used for the calculation of the battery pack’s SOE, is constructed online through the aging extrapolation and dynamic weighting of the representative cells’ OCVs. This solution not only retains the advantage of the representative cells in replicating the overall behavior of the battery pack, but also fundamentally resolves the issue of inaccurate battery pack SOE estimation that arises from the breakdown of linearity between the SOE and voltage by replacing the weighting of the SOE with the weighting of the OCV. In addition, a method based on steep voltage change detection is adopted for the aspect of representative cell selection.
The remainder of this paper is organized as follows: the SOE estimation method for battery packs is described in
Section 2; the experiments are introduced in
Section 3; the results and discussions are provided in
Section 4; and the conclusions are summarized in
Section 5.
2. Methods
In this section, an SOE estimation method based on the relationship between OCV and SOE is first introduced; then, based on this method, two constraints in the battery pack SOE estimation method are analyzed in detail. Finally, the comprehensive solutions for these constraints are proposed and the specific technologies of their solutions are listed.
2.1. SOE Estimation Based on OCV
The SOE, as the ratio of the remaining battery discharge energy to initial energy, is a general concept, as shown in Equation (1).
where
is the remaining discharge energy and
is the initial energy, which is obtained through an energy testing experiment for a fresh battery.
To establish a relationship between SOE and OCV based on the Thevenin model, which is usually used to simulate the dynamic characteristics of a battery, the remaining discharge energy can be divided into two parts, the energy generated by OCV and the energy consumed by internal resistance, respectively [
19]. Equation (1) can be rewritten as Equation (2).
where
represents the ohmic internal resistance;
represents the polarization internal resistance;
represents the energy generated by the OCV;
represents the energy consumed by ohmic resistance;
represents the energy consumed by polarization resistance; and
represents the energy consumed by both internal resistances, which is the sum of
and
.
According to Joule’s law,
and
can be further obtained from Equations (3) and (4), wherein,
t represents the current time node;
represents the time node when the battery is emptied; and
represents the standard discharge current. It should be noted that, in this paper, charging is defined as positive and discharging is defined as negative. Therefore,
is a negative value here.
It should be noted that OCV is a function of both SOC and state of health (SOH). Here, the SOC is the ratio of the remaining electric quantity to the initial capacity of the fresh battery [
20], and the SOH is the ratio of the current capacity to the initial capacity of the fresh battery.
Then, substituting Equations (3) and (4) into Equation (2), SOE will be rephrased as Equation (5).
In the equation, since the integral of
from
t to
is the remaining electric quantity that can be obtained by multiplying the SOC with the initial capacity of the fresh battery (i.e.,
), the ultimate expression of SOE can be reorganized as shown in Equation (6).
2.2. Constraints Presented in SOE Estimation for Battery Pack
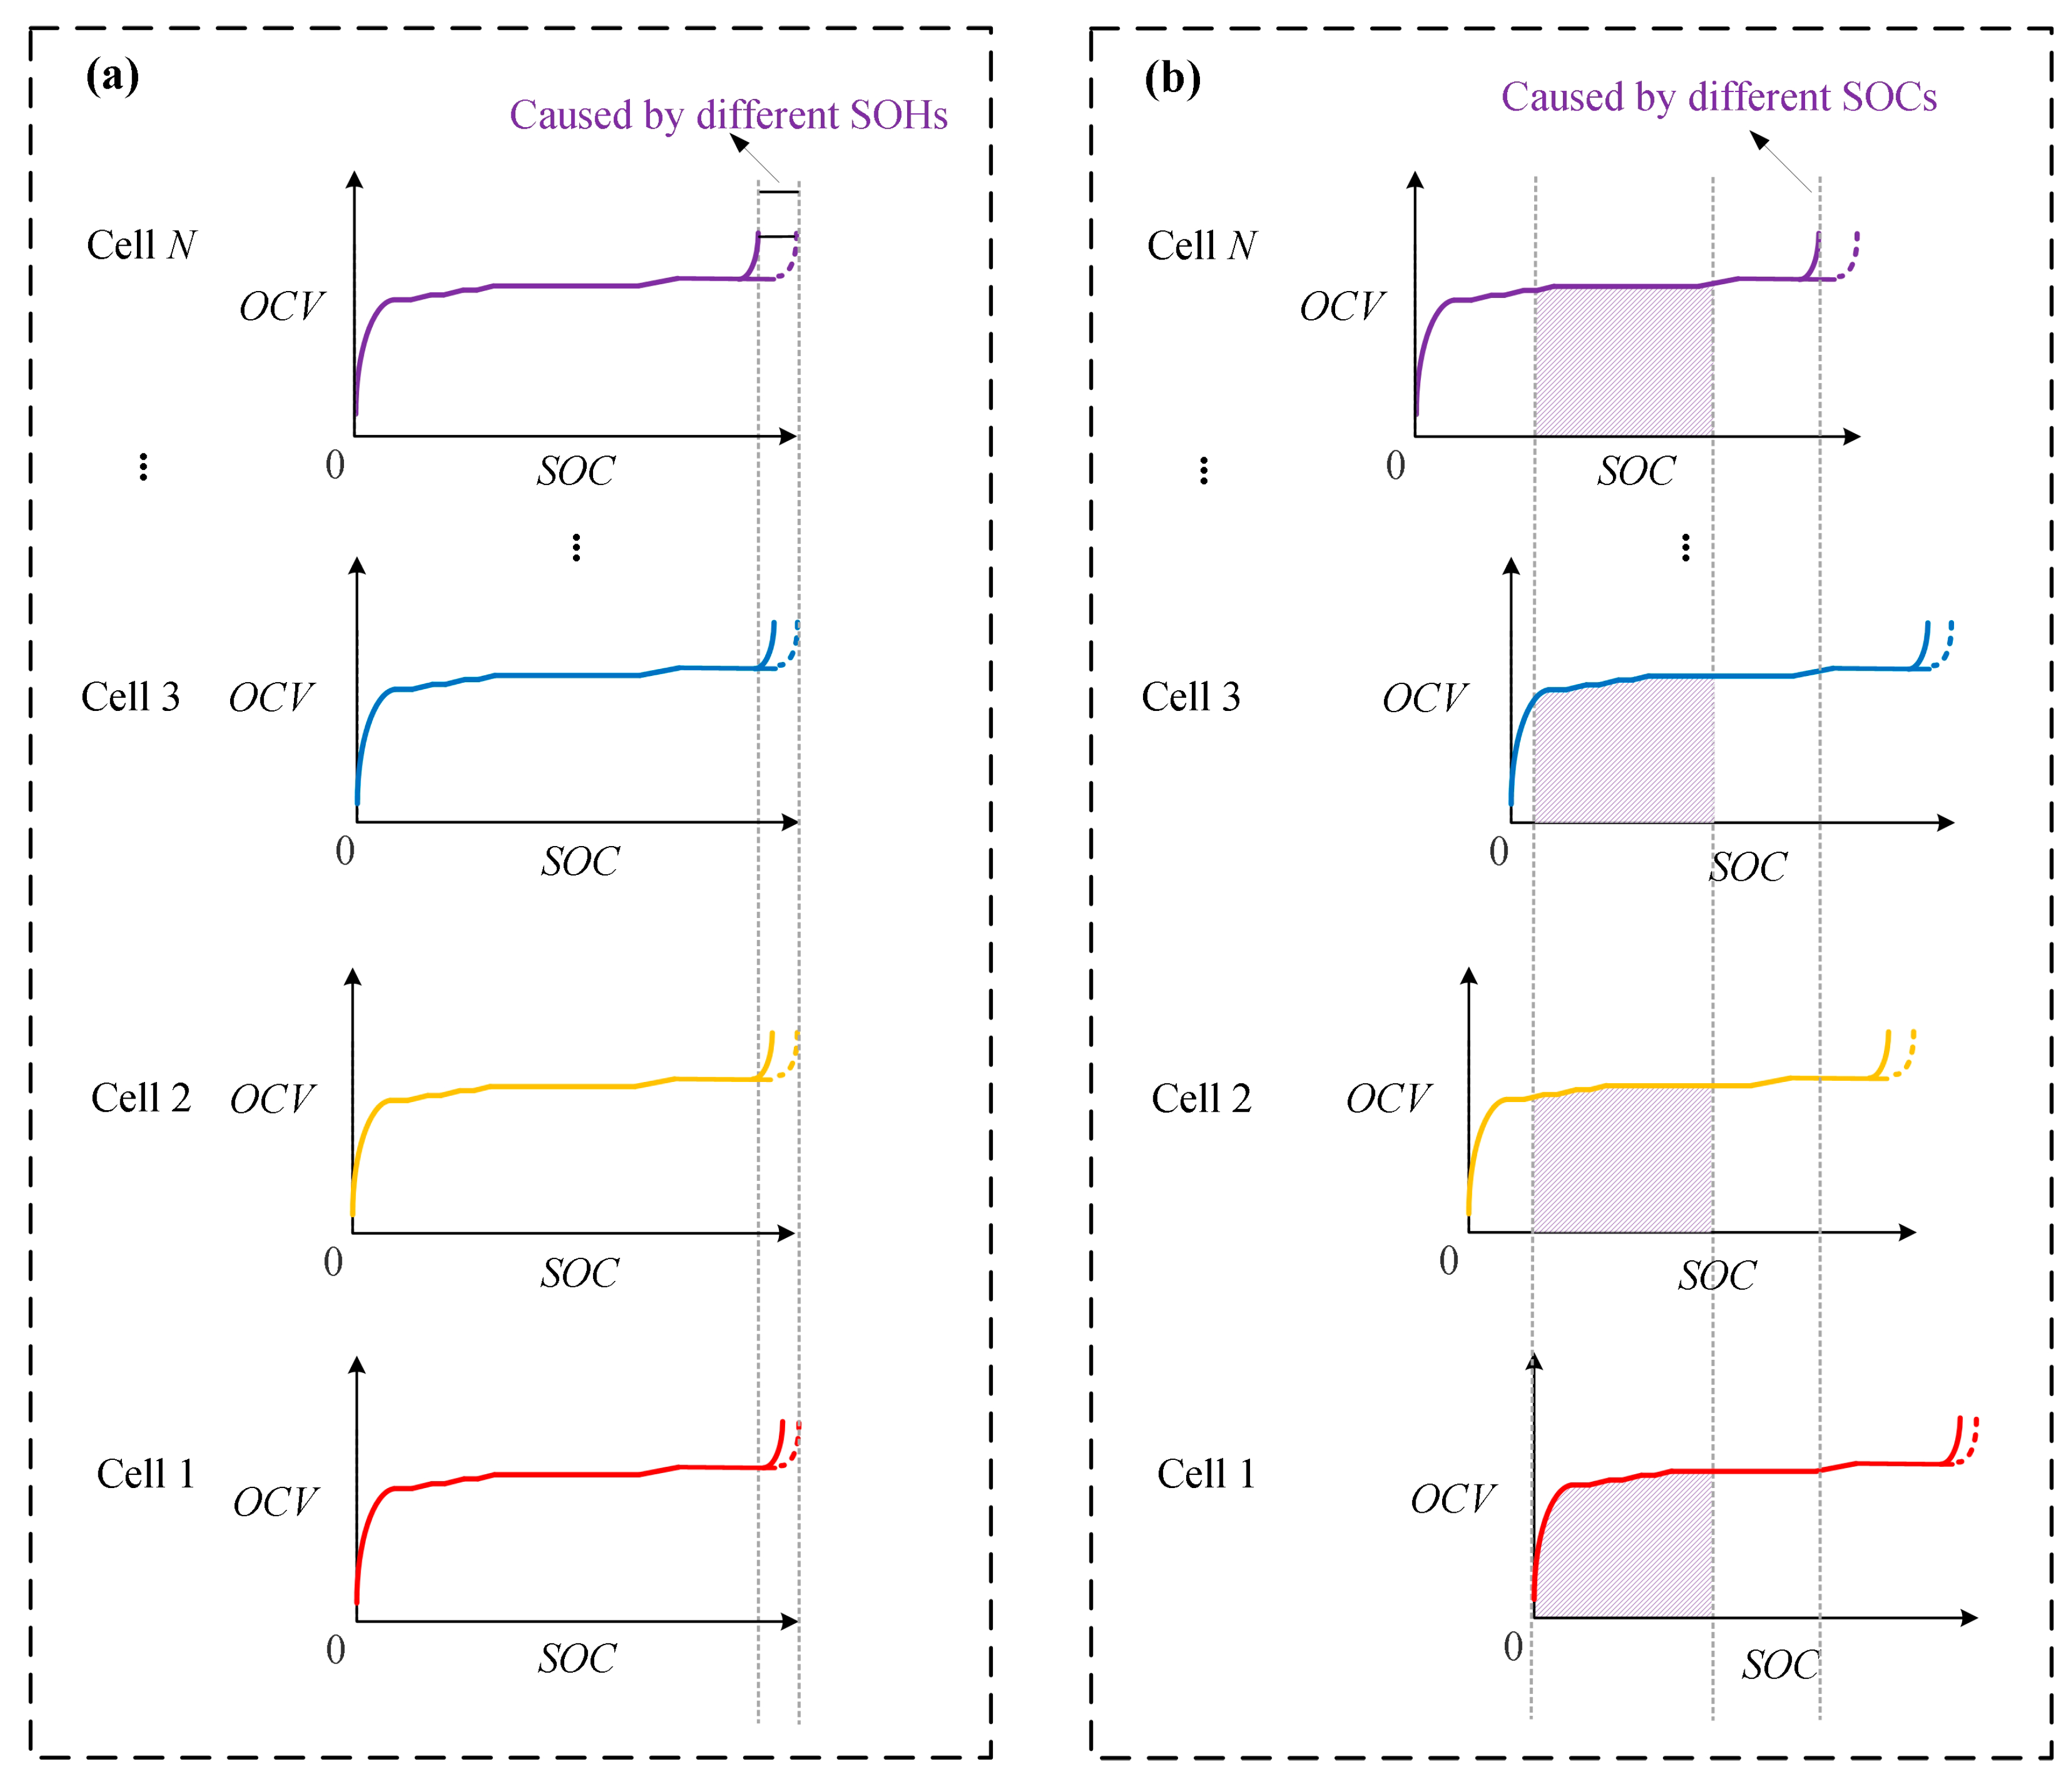
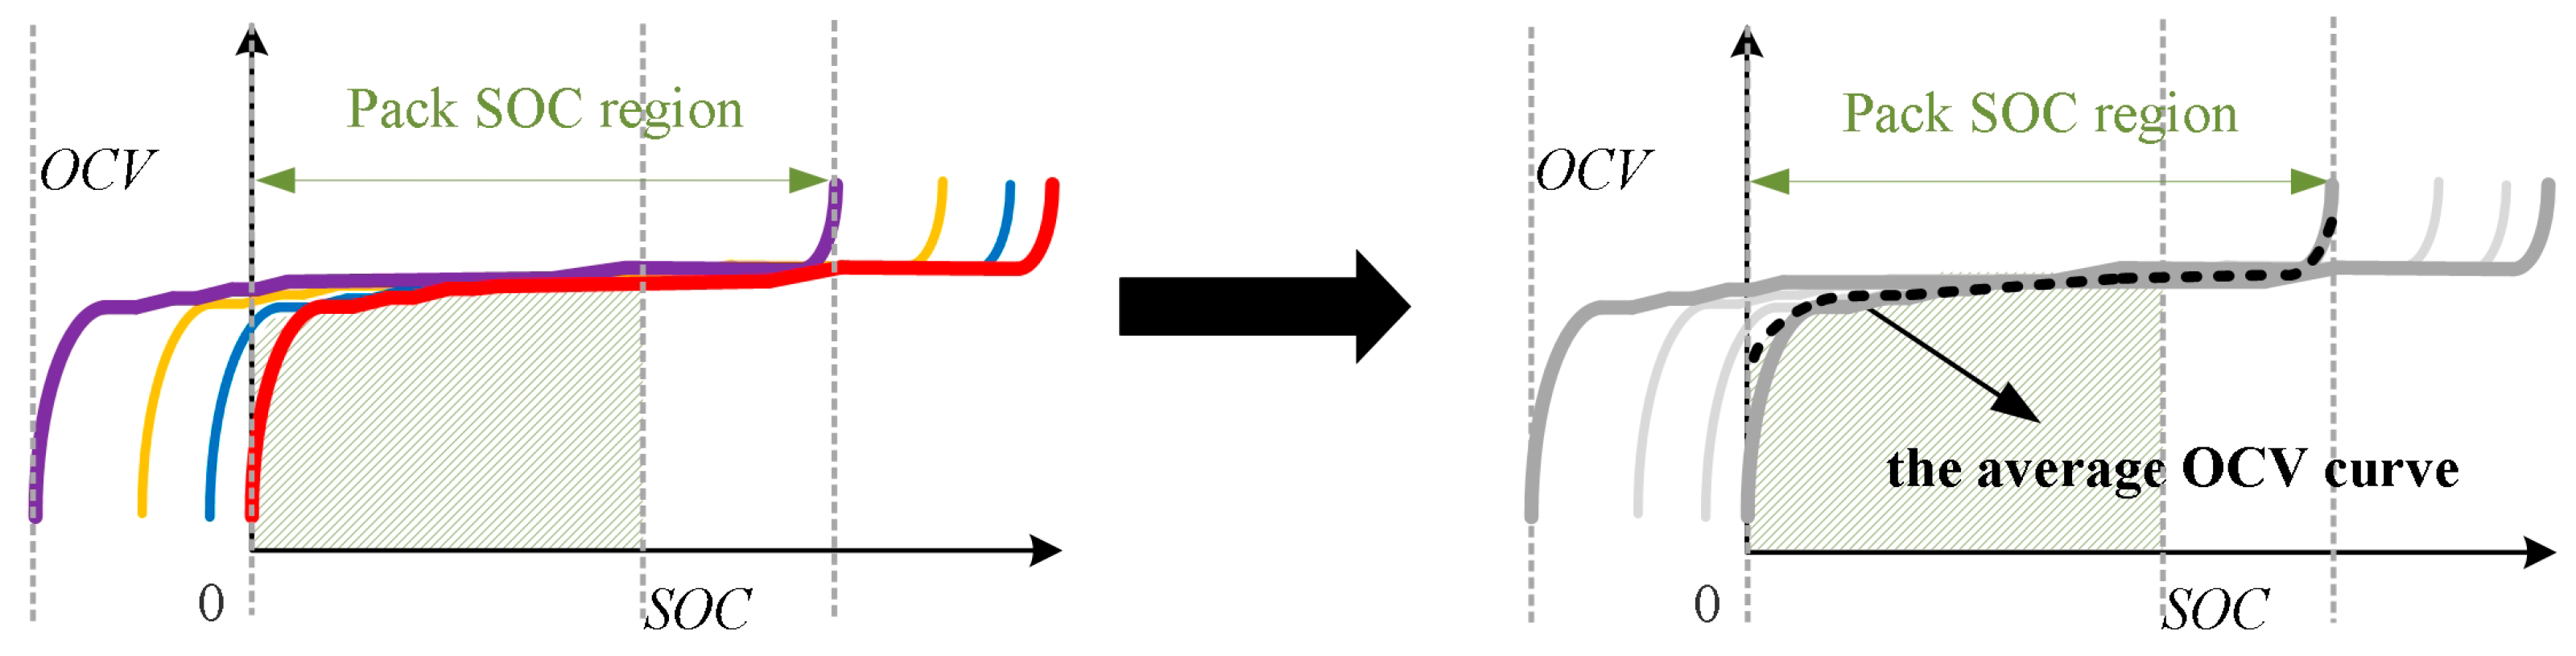
Unfortunately, for a series battery pack, Equation (6) cannot be directly applied. This is due to the inevitable inconsistency between different cells in both OCV curves and integration regions, which are shown in
Figure 1a,b, respectively, wherein
N represents the number of cells in the battery pack.
On the one hand, for the inconsistencies in OCV curves, as shown in
Figure 1a, all cells in the battery pack may have varying degrees of aging (i.e., SOH). This will result in different shapes in the OCV curves for various cells [
21]. On the other hand, although the changes in the SOCs for all cells are the same due to the serial connection characteristics, it is almost impossible for the SOC of each cell to be exactly the same. This will lead to the inconsistent integration regions’ starting point for various cells, as shown in
Figure 1b.
Based on the above two factors, when calculating the SOE, the remaining discharge energy of all cells should be calculated separately. Equation (6) should be further rewritten as Equation (7).
where
is the SOE of the battery pack;
is the remaining discharge energy of the cell;
represents the SOC of the cell;
represents the SOC of the cell when the cell is emptied;
represents the SOH of the cell;
and
represent the ohmic internal resistance and polarization internal resistance of cell; and
represents the cell serial number, where
.
As shown in Equation (7), to accomplish the SOE estimation of the battery pack, there are two constraints that need to be overcome.
First, how to acquire all OCV curves? To obtain an accurate OCV curve of a cell, the prerequisite is that its SOH is known. However, in the LFP battery pack, only the charge-control cell (i.e., the first fully charged cell) can activate its SOH estimation condition [
22,
23]. In other words, only the SOH of the charge-control cell can be reliably estimated online.
Second, how to determine all cells’ OCV integration regions? In a battery pack, only the OCV integration region of the discharge-control cell (i.e., the first fully discharged cell) can be determined quickly, which is from the cell’s current SOC to its (i.e., 0). But, for other cells, their OCV integration regions need to be obtained through exceptionally complex calculations. Therefore, determining the integration regions quickly is one of the important components of battery pack SOE estimation.
Due to the above two points, it is impossible to directly calculate the pack’s SOE by Equation (7). Therefore, in this paper, a novel method will be developed to overcome these constraints.
2.3. Pack’s SOE Estimation Based on an Average OCV Curve
To simultaneously solve the two constraints, a method based on an average OCV curve is developed in this paper. In the method, all OCV curves in
Figure 1b are mapped to the OCV coordinate system of the discharge-control cell, as shown in
Figure 2.
In this coordinate system, the integration regions of all OCV curves (i.e., “Pack SOC region”) are constrained by the OCV curves of the charge-control cell (purple curve) and discharge-control cell (red curves), and the yellow and blue curves represent the OCV curves of other cells that are enclosed by the OCV curves of the charge-control and discharge-control cells. In the “Pack SOC region”, if we can obtain an average OCV curve for all cells [
24], the above two problems will be solved simultaneously. On the one hand, there is only the average OCV curve to be determined, without the need to determine all OCV curves; on the other hand, there is only an OCV integration region to be determined—that is, the integration region of discharge-control cell, which is from its current SOC to 0. As for the current SOC value of the discharge-control cell, this can be obtained through the SOC estimation method [
25].
Then, Equation (7) can be rewritten as Equation (8), where,
represents the average OCV;
represents the SOC of discharge-control cell; and
and
represent the average ohmic internal resistance and polarization internal resistance.
Based on Equation (8), the determination of the average OCV curve will be the key work for the SOE estimation of the battery pack in this paper.
2.4. Determination of Average OCV Curve
For the average OCV curve of a battery pack, not only is the span of the integration region constrained by the SOC overlap between the charge-control and discharge-control cells, but its curve trend will also be surrounded by the curves of this pair of cells. Therefore, if this pair of control cells are selected as the representative cells, theoretically, the average OCV curve can be constructed by the weight of the representative cells’ OCV curve [
7].
Based on the above analysis, a construction method for the average OCV curve is proposed in this section. The specific implementation steps are refined as follows: (1) the selection of representative cells, (2) obtaining OCV curves for representative cells, and (3) the combination of the representative cells’ OCV curves.
2.4.1. The Selection of Representative Cell
To determine the representative cells, a selection method based on steep voltage change detection is adopted in this part. Compared to other existing research, which is always based on the characteristics of voltage, internal resistance, or OCV, our method can not only effectively avoid the influence of polarization effects, but also effectively save time for a large number of pre-experiments [
7,
16,
17,
18].
For a series LFP battery pack during the charging process, when the battery pack starts charging, the cell whose voltage rises sharply last will be determined as the discharge-control cell. Meanwhile, when it is about to be fully charged, the voltage of the charge-control cell will rise sharply first [
17].
So, we can select two representative cells by calculating and judging the rate of voltage change. This judgment method is stable and reliable, as it can eliminate the impact of battery polarization on the selection of representative cells. Through this method, the accurate selection of representative cells can be achieved with only simple voltage difference judgments.
2.4.2. Obtaining OCV Curves for Representative Cells
The OCV of a cell comprehensively reflects the span of both its positive and negative electrodes, as well as their matching relationship [
26]. With the use of cells, OCV curves will continue to change [
27]. This change will result in an inability to obtain accurate OCV curves online, thus affecting the accuracy of SOE estimation. In order to solve this problem, a curve offset method for LFP batteries is proposed in this paper. By using this method, only the fresh OCV curves and the SOH are needed. The principle of curve offset is as follows.
It should be noted that, since the capacity loss of lithium-ion batteries in the vehicle-mounted stage is mainly caused by the loss of lithium inventory (LLI), and there is almost no loss of active material (LAM), this paper only considers the influence of LLI on the OCV [
28,
29,
30,
31].
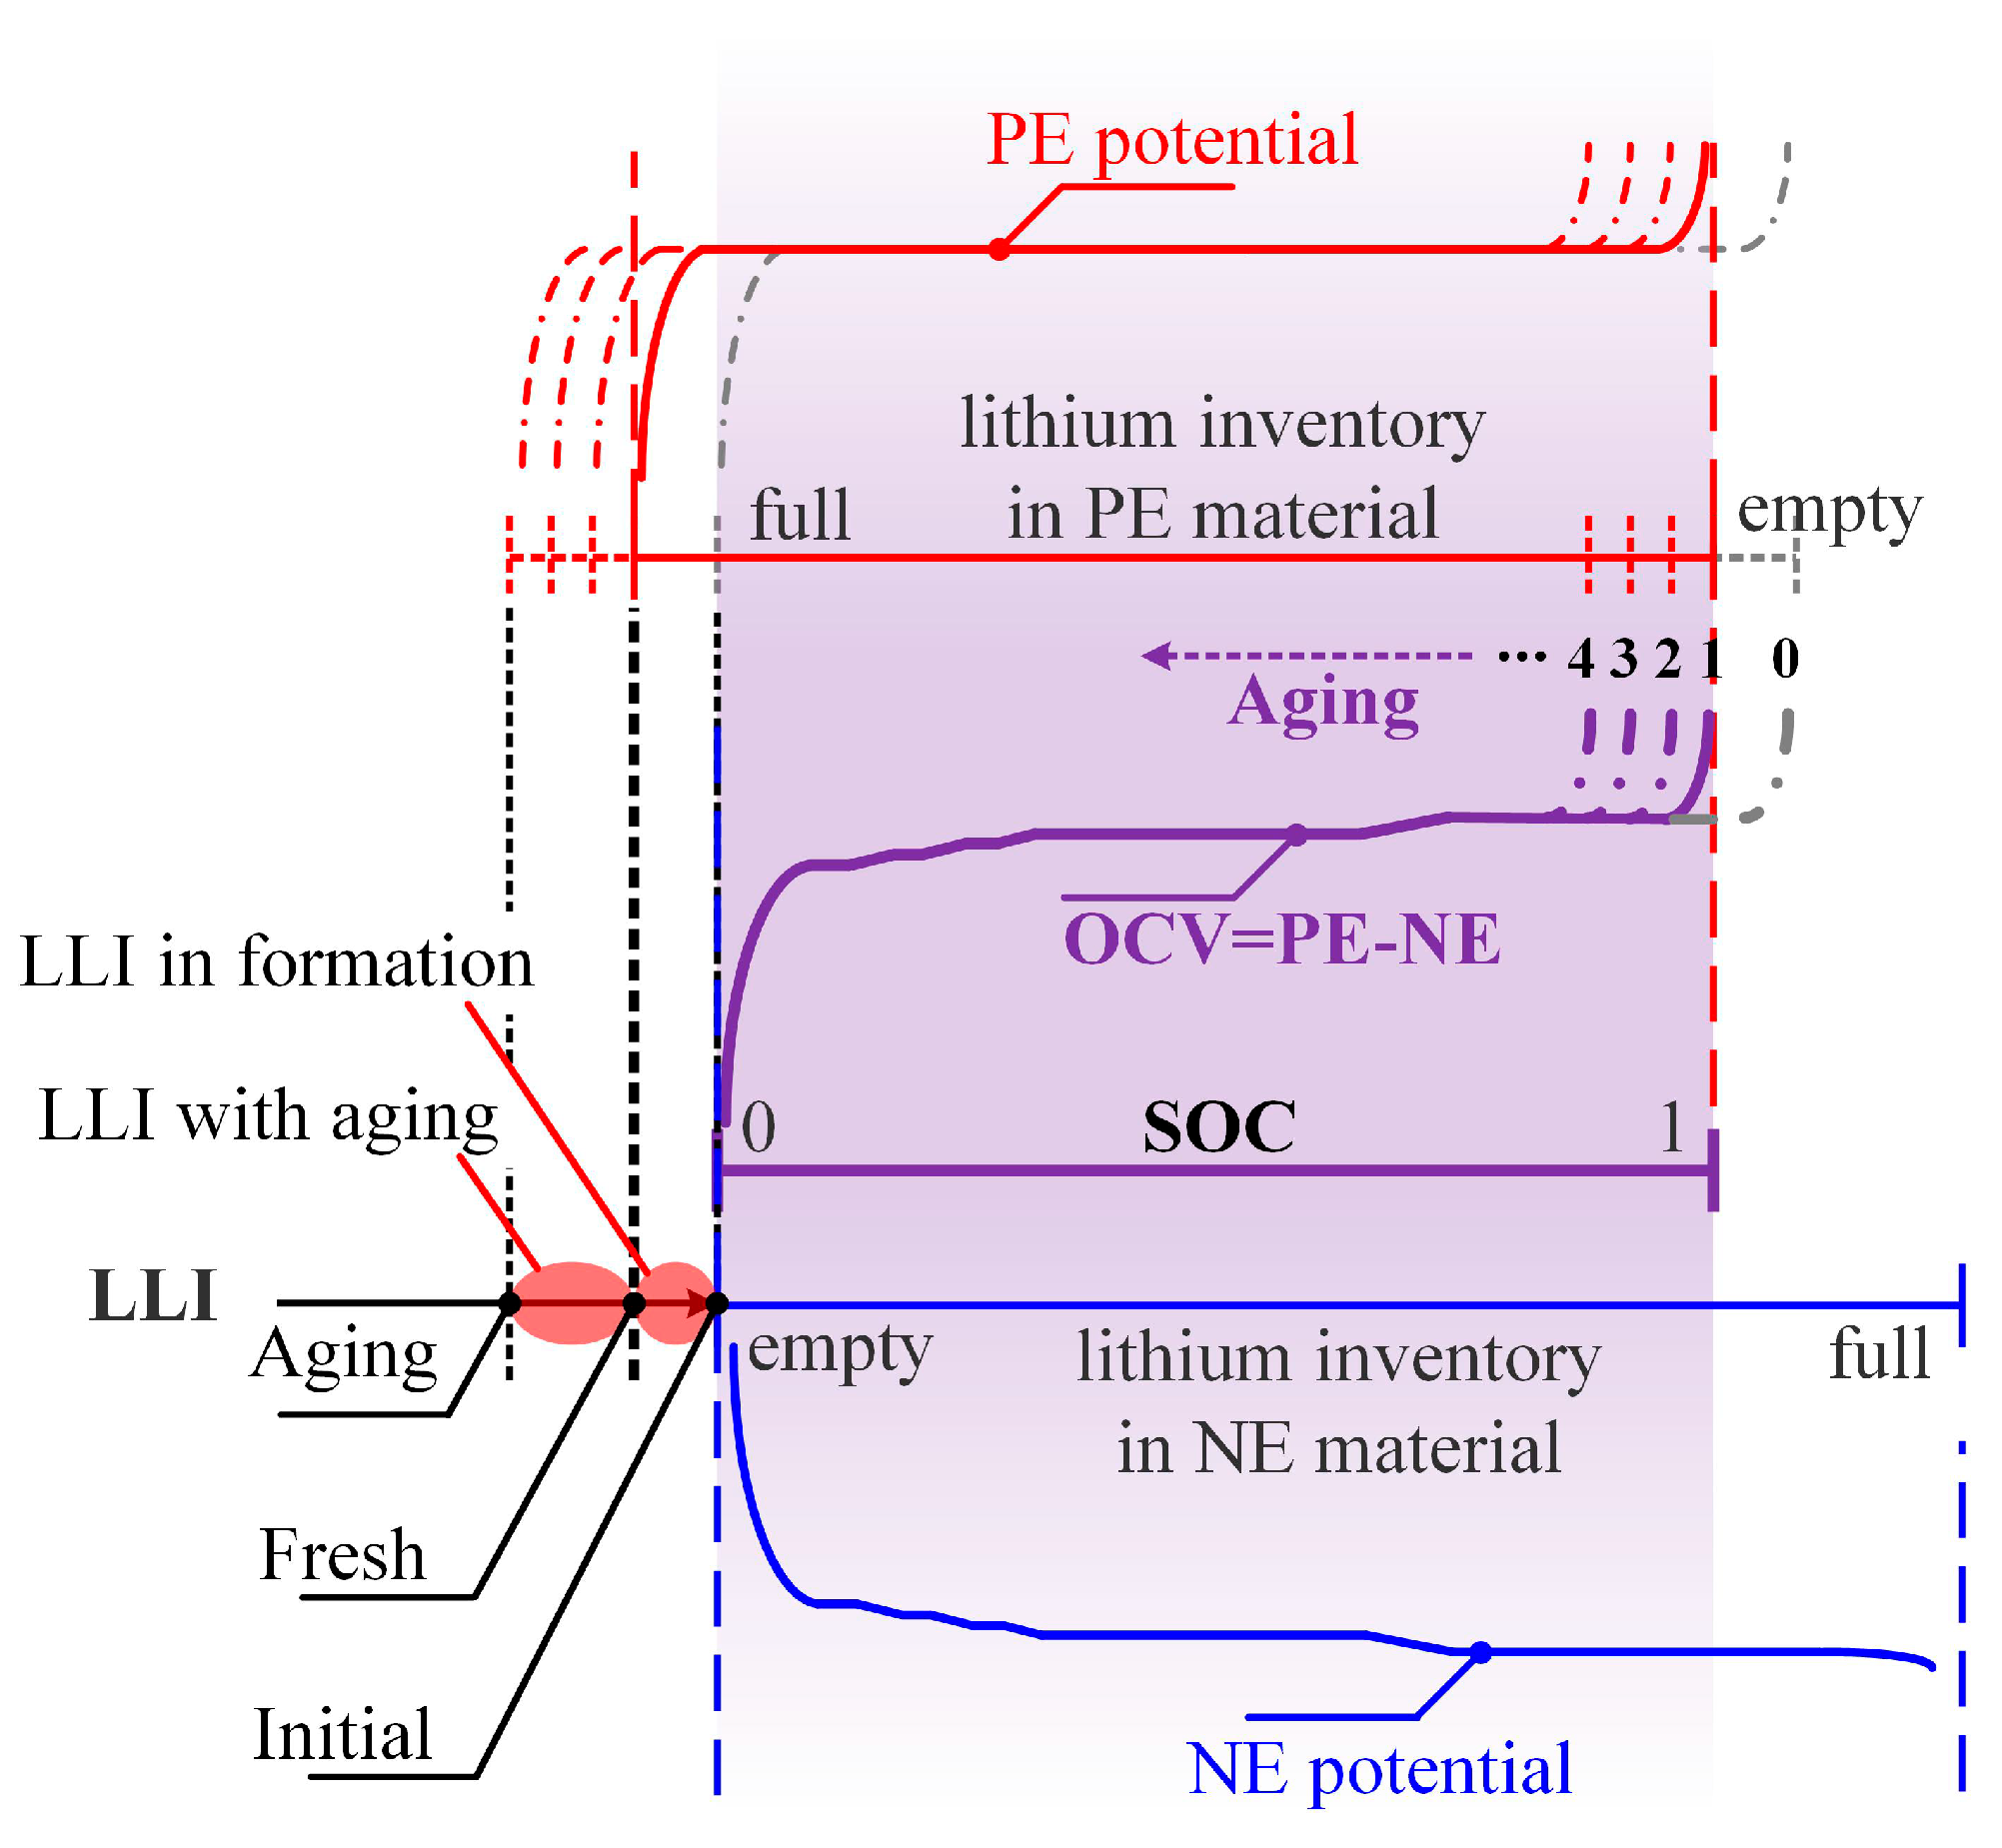
For LFP batteries, as shown in
Figure 3, their OCV is determined by the difference between the positive electrode potential (PE) and the negative electrode potential (NE).
With accumulated LLI, the relative position between the positive and negative electrode potential curves is constantly staggered due to an increasingly scarce lithium inventory, which makes the remaining lithium ions present an increasingly scarce situation for both the PE and NE materials [
32]. Although the curve form of the positive and negative electrodes does not change, the OCV curve will still change accordingly [
31]. Therefore, as shown in
Figure 3, with a continuous increase in the LLI (or as the degree of battery aging deepens), the horizontal shift between the potential curves of the PE and NE will gradually become larger.
According to this principle, it can be known that, as the battery ages, the OCV curve remains unchanged within most SOC regions, and only its voltage plateau gradually disappears in the high SOC region [
25]. To realize the description of this OCV variation feature, the OCV affected by SOC and SOH can be functionalized as shown in Equation (9).
where
represents the functional relation between the OCV and SOC of a fresh battery. Furthermore, when selecting breakpoints for this piecewise function, two factors are considered. On the one hand, when the battery’s SOH is below 0.8, this battery will be discarded. In other words, in the high SOC region, the range of voltage plateau disappearance will not exceed 0.2. On the other hand, the SOC range where OCV rises rapidly is very small, less than 0.05. Therefore, setting the breakpoint at 0.75 is sufficient to describe the characteristics of OCV changes.
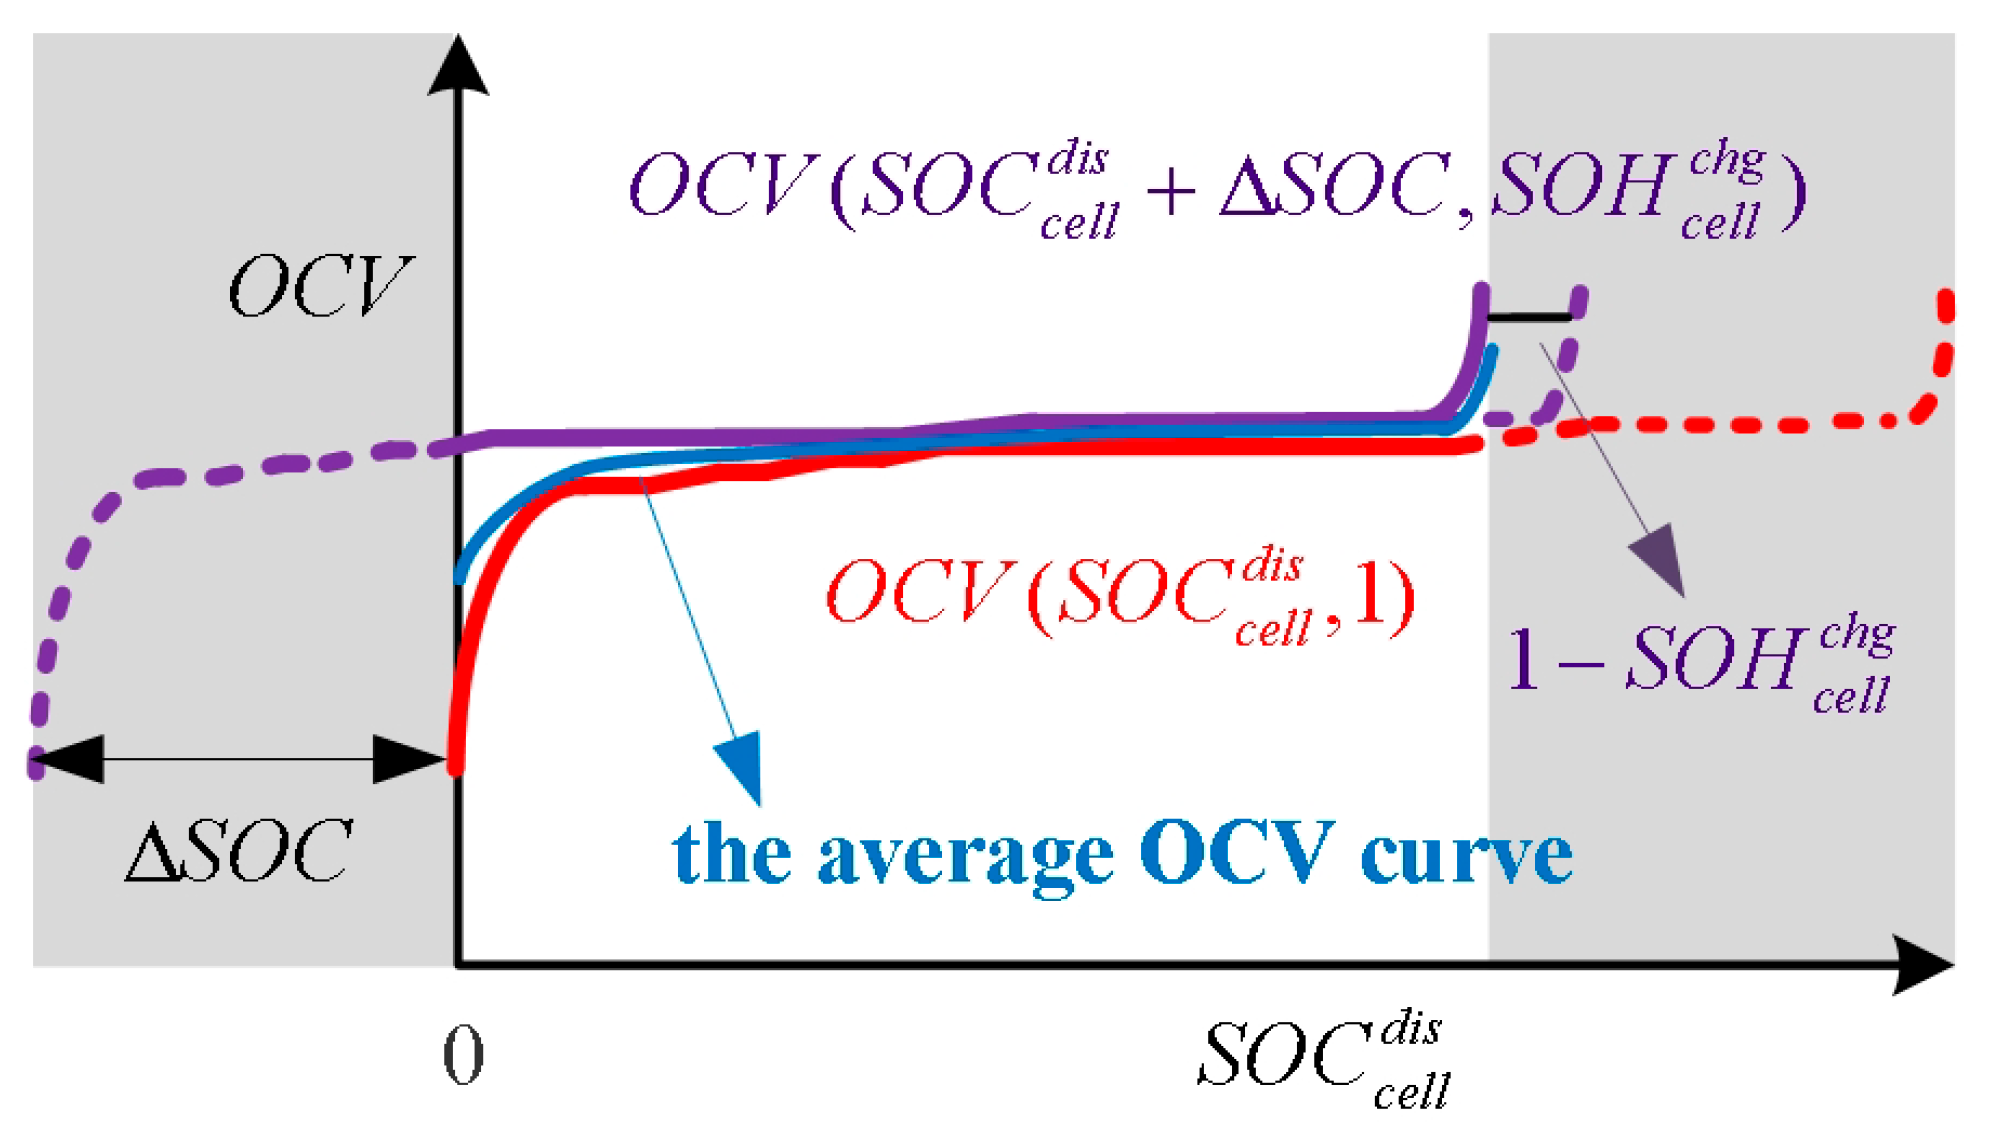
2.4.3. The Construction of the Representative Cells’ OCV Curves
Following the above two steps, the OCV curves of two representative cells and their functional expressions are shown in
Figure 4, as well as the average OCV curve.
For the charge-control cell, combined with the online estimation of its SOH, the offset distance of OCV curve can be calculated as the purple curve [
33], where
represents the SOH of the charge-control cell and
represents the SOC difference value between the charge-control and discharge-control cells. For the discharge-control cell, there is no need to consider its aging behavior, and its OCV curve can be regarded as only the function of
.
In the use of battery packs, with an increase in SOC, the OCV curve of the charge-control cell has a greater impact on the average OCV curve, while, with a decrease in SOC, the OCV curve of the discharge-control cell has a greater impact on the average OCV curve. To combine these two curves, a dynamic weighting method is proposed [
34], and
can be functionalized as shown in Equation (10), where,
and
are the dynamic weights of the charge-control and discharge-control cells.
For
and
, they can be further expressed as shown in Equation (11), where
and
represent the highest and lowest OCVs of the cells, which are obtained through an OCV testing experiment on fresh cells [
35].
In this equation, the weight is calculated by comparing the gap between the average OCV value of the representative cells and the boundary value in real time. During the charging process, the gradual increase in , as per Equation (11), results in an augmented proportion of the charge-control cell’s influence, thereby causing the average OCV curve to progressively approach the OCV curve of the charge-control cell. On the contrary, during the discharge process, the gradual decrease in results in an augmented proportion of the discharge-control cell’s influence, thereby causing the average OCV curve to progressively approach the OCV curve of the discharge-control cell. Thanks to the gradual alterations in the OCV, the variations in and are also gradual, ultimately leading to a seamless transition of the average OCV curve between the two OCV curves.
Finally, the expression of
can be developed as shown in Equation (12).
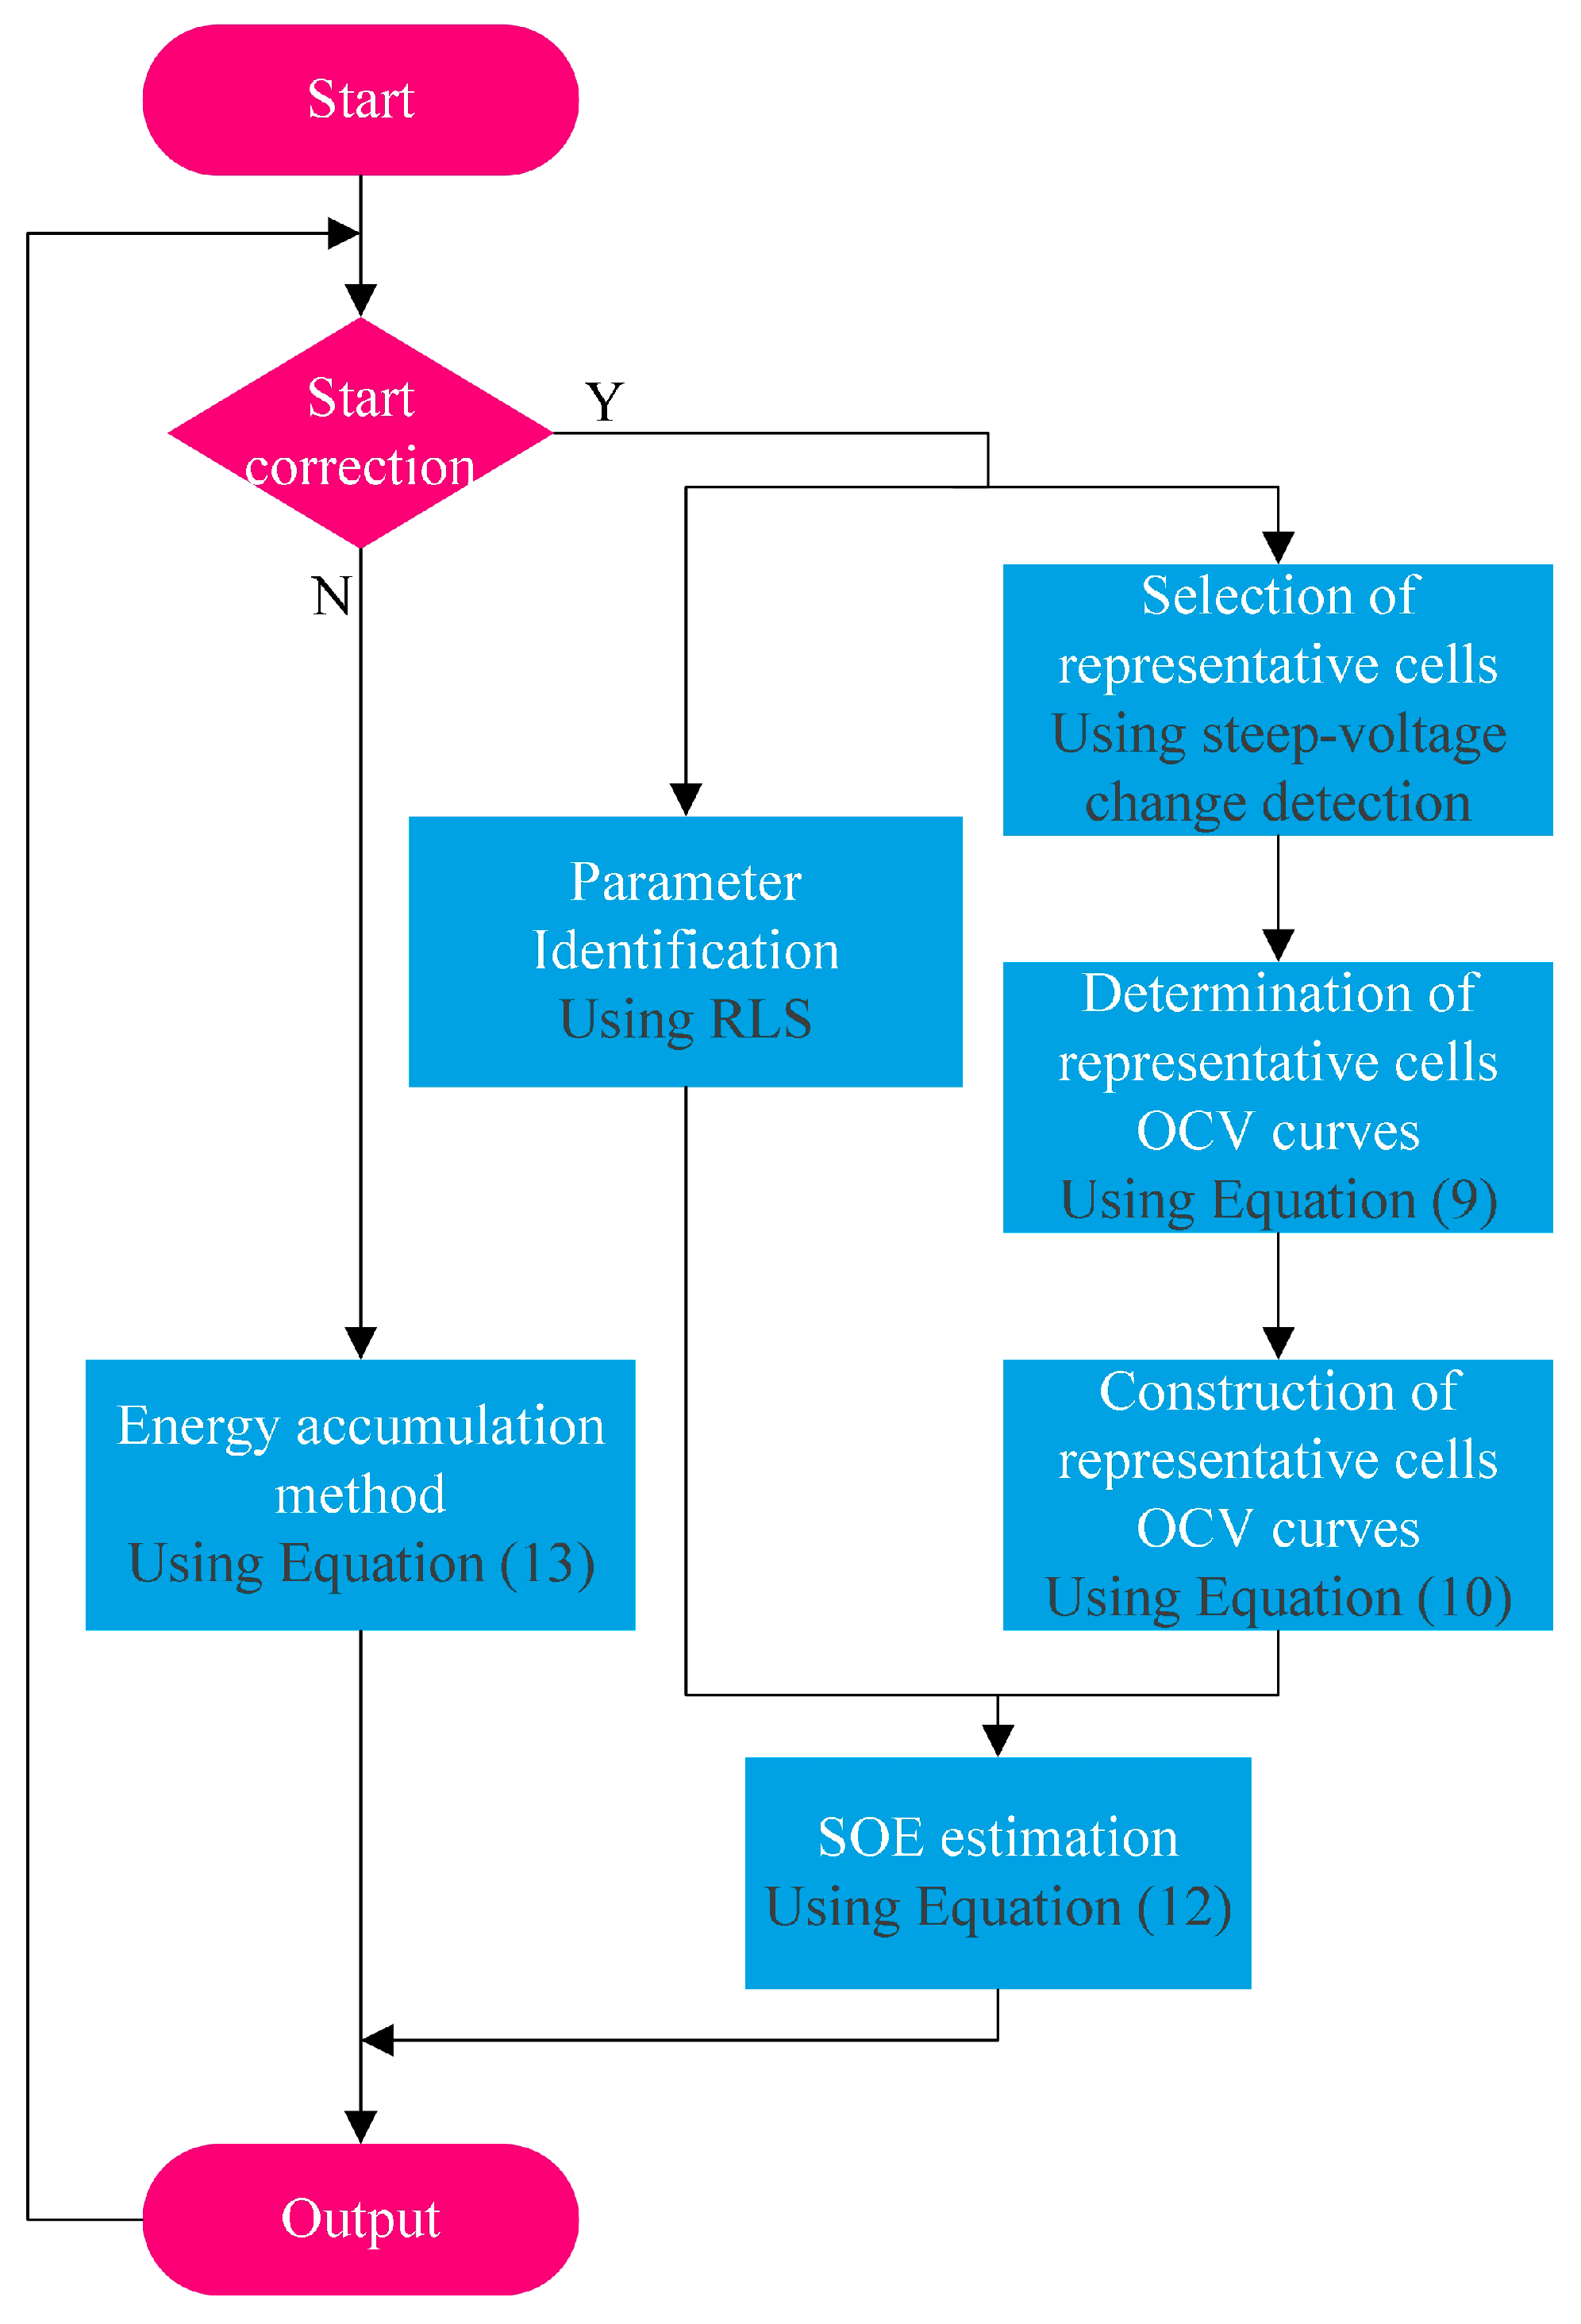
2.5. Battery Pack SOE Estimation Flowchart
The complete SOE estimation of a battery pack in this paper involves the following steps. Initially, it is determined whether the condition for starting correction is met. If it is met, the method proposed in this paper is employed; otherwise, the energy accumulation method is directly used for estimation.
To more intuitively demonstrate the implementation process of the proposed method, the flowchart is provided in this section, as shown in
Figure 5.
Start correction: Since the overall parameter identification of the battery pack is a necessary condition for the proposed method, and dynamic operating conditions are also a necessary condition for parameter identification, our method will start operating after the system enters dynamic operating conditions.
Energy accumulation method: The expression of the energy accumulation method is shown in Equation (13), where
represents the voltage of the battery pack.
Selection of representative cells: Adopting a selection method based on steep voltage change detection, the charge-control and discharge-control cells in the LFP battery pack are effectively determined according to the rate of voltage change.
Determination of representative cells’ OCV curves: For the charge-control cell, combined with its SOH, its OCV curve can be obtained online through the curve offset method. For the discharge-control cell, since the high SOC region is not involved in the construction, its OCV curve can be considered consistent with the OCV curve of a fresh cell.
Construction of representative cells’ OCV curves: By weighting the OCV curves of the charge-control and discharge-control cells to obtain the average OCV curve, this weighting method not only avoids the problem of a decreased accuracy caused by the destruction of linearity, but also enables the average OCV curve to effectively reflect the OCV developing trajectory of all cells.
Parameter identification: To obtain
and
, it is necessary to carry out parameter identification work on the battery pack [
36,
37]. Based on the Thevenin model, using the collected terminal voltage and current data of the battery pack, the recursive least squares identification algorithm (RLS) is applied for parameter identification, thereby determining the ohmic internal resistance and polarization internal resistance of the battery pack. Finally, by dividing the ohmic internal resistance and polarization internal resistance of the battery pack by
N, respectively,
and
can be successfully obtained.
In addition, regarding OCV, although other factors such as temperature and battery type were not specifically discussed regarding their impact on its behavior, based on the construction framework presented in this paper, these factors can be easily introduced without coupling. Taking temperature as an example, in research on the influence of temperature on OCV, previous researchers have conducted extensive and in-depth studies, achieved fruitful results, and established a relatively complete functional relationship between temperature and OCV. These research findings can be directly applied to the determination of the OCV curves of representative cells before the construction of the average OCV, and contribute to the final constructed average OCV curves, thereby facilitating effective estimation of SOE.
3. Experiments
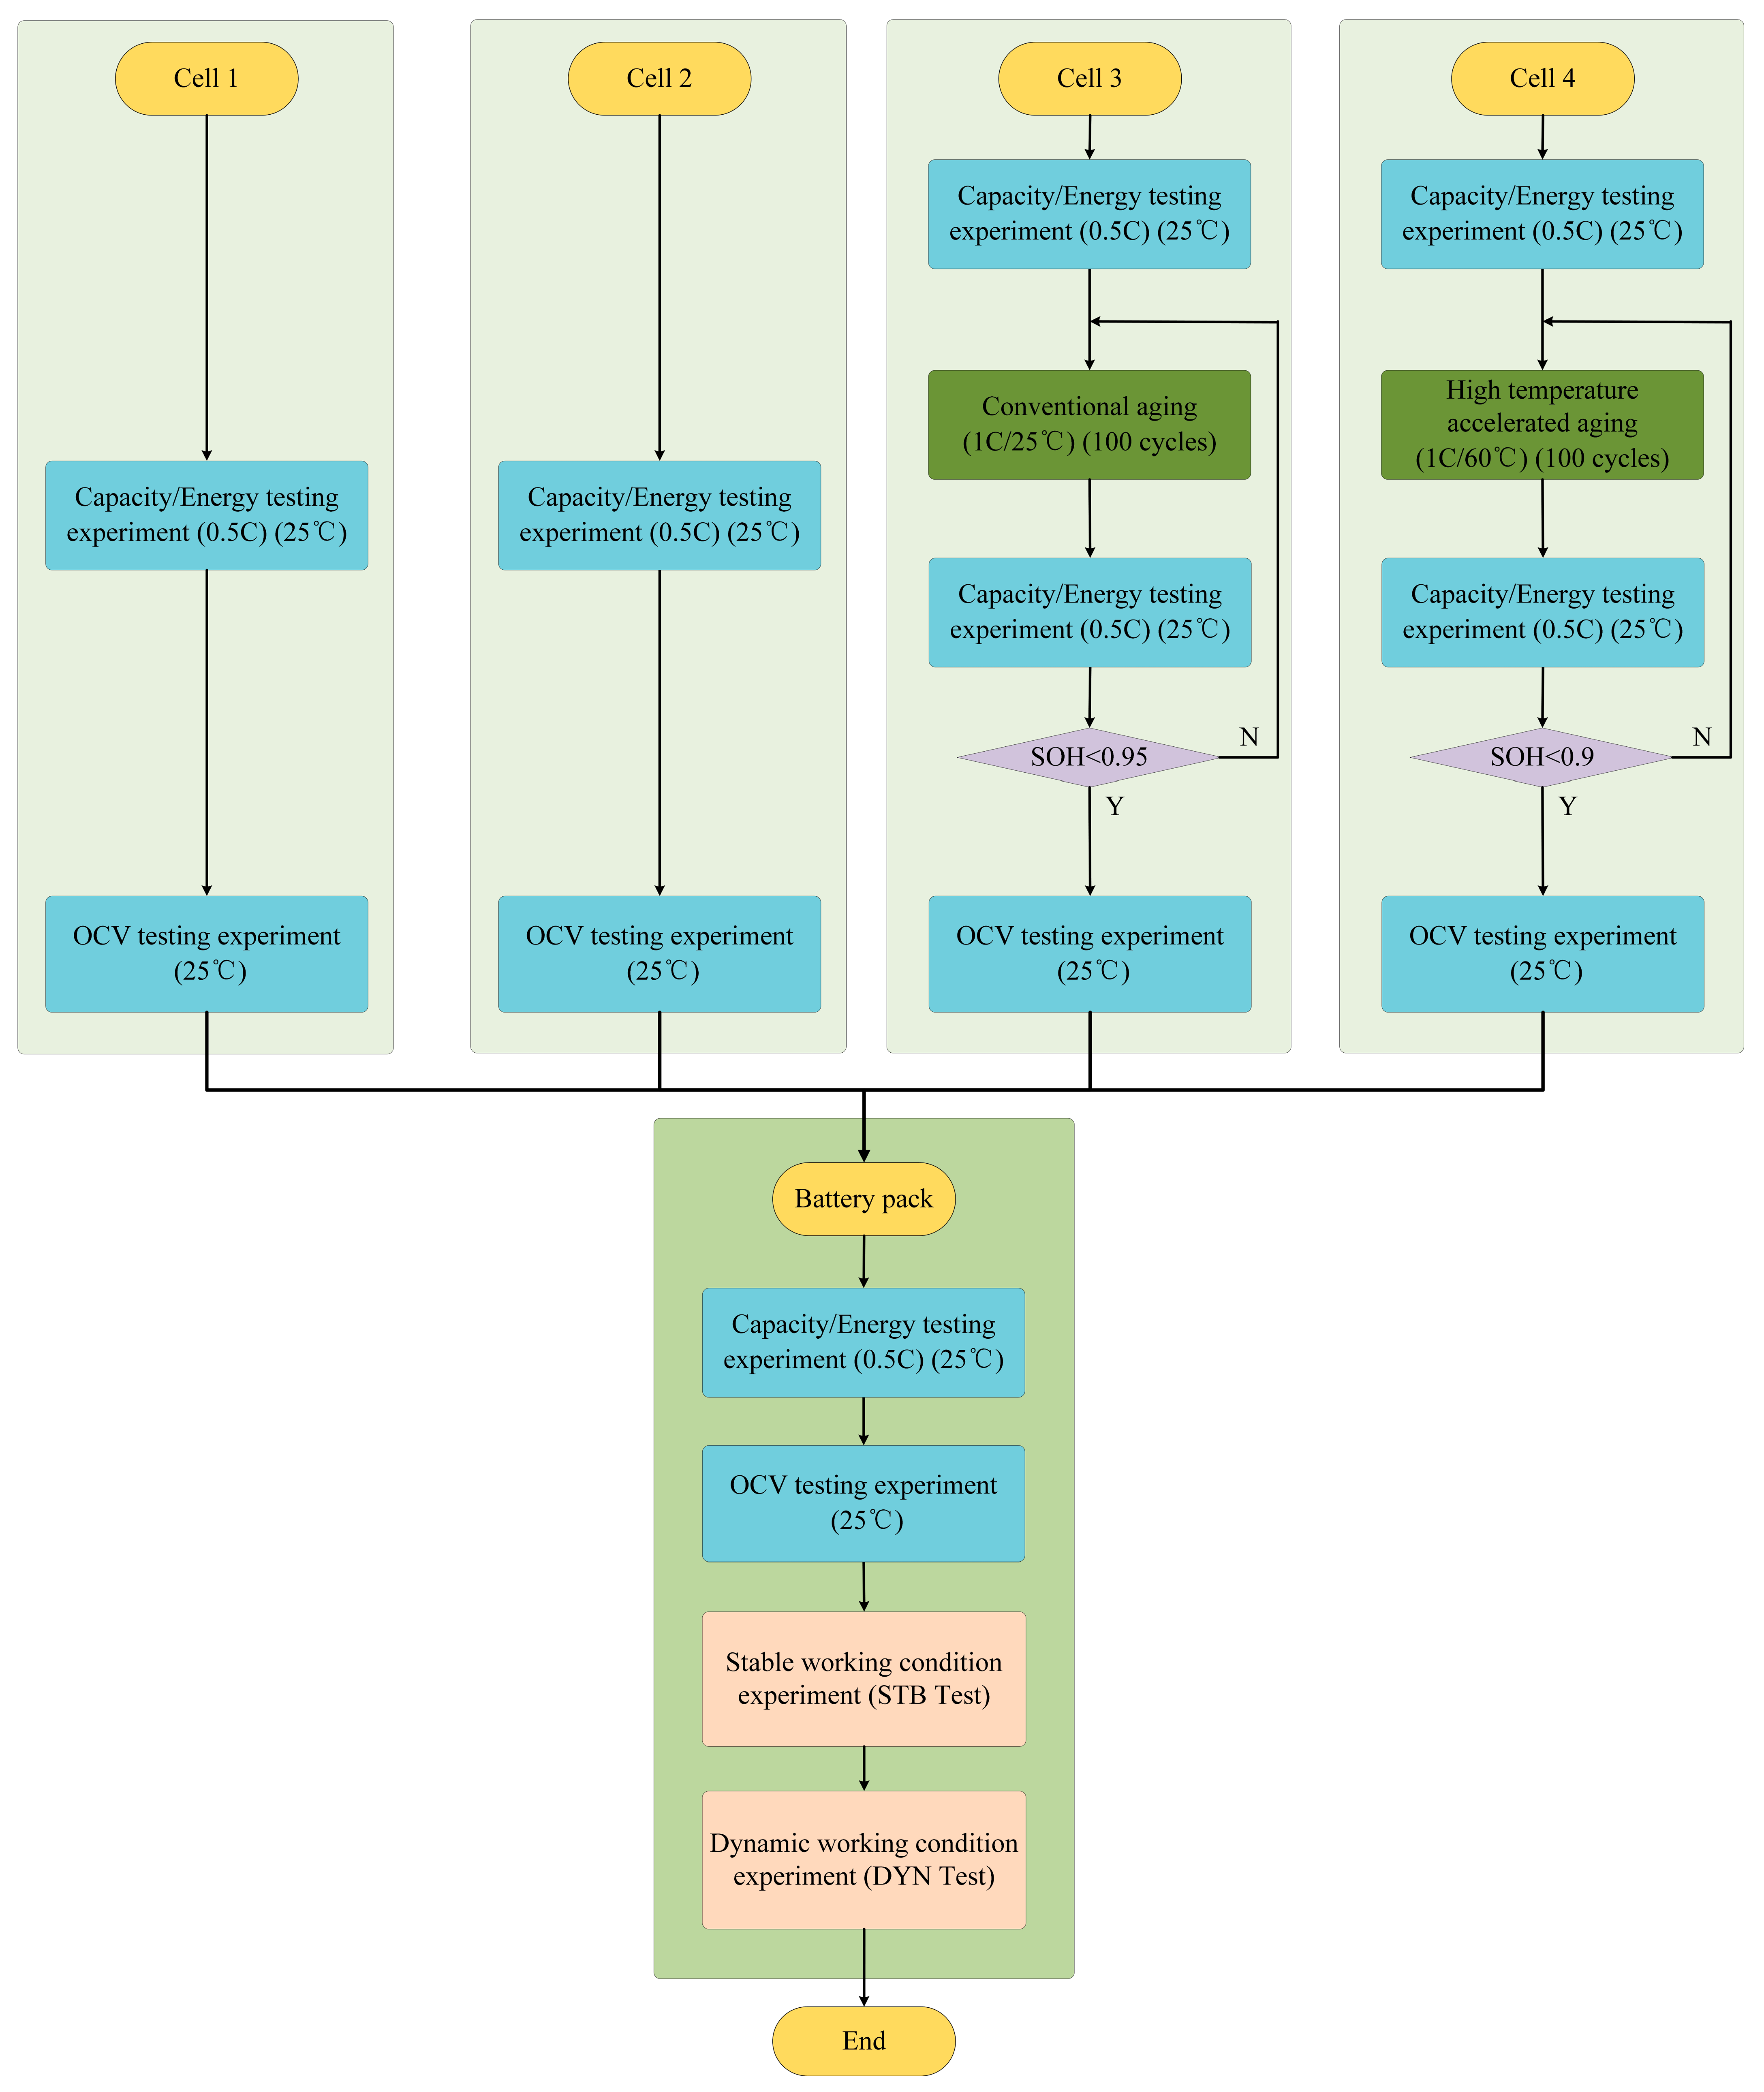
This paper takes the most widely used LiFePO4/graphite (LFP/GIC) batteries as the research object. The specific experimental process is shown in
Figure 6. Characteristic testing experiments and cyclic aging experiments were designed to obtain the SOE and OCV data of a cell under different aging states. Then, cells with different initial SOCs and SOHs were connected in series to form a battery pack, and operating condition validation experiments were designed to verify the estimation accuracy of the proposed battery pack SOE estimation algorithm under complex operating conditions.
The experimental process includes three parts, namely, a characteristic testing experiment, cyclic aging experiment, and operating condition verification experiment.
- (1)
Characteristic testing experiment: This includes three parts, namely, an energy testing experiment, capacity testing experiment, and OCV testing experiment. The experimental method of the energy testing experiment is the same as that of the capacity testing experiment, which obtains the remaining discharge energy of cells by testing the remaining discharge capacity of the cells.
- (2)
Cyclic aging experiment: This includes two types of working conditions, conventional aging and high-temperature accelerated aging. Among them, high-temperature accelerated aging is mainly used to accelerate the aging process, and a capacity test experiment is conducted every 100 charge and discharge cycles.
- (3)
Working condition verification experiment: This consists of two parts, a steady working condition experiment and dynamic working condition experiment. Among them, the steady-state experiment was conducted under constant current charging conditions of 100 A, while the dynamic experiment was conducted under DST conditions with a maximum current of 100 A.
In this experiment, the same characteristic testing experiment was conducted on all four cells, but cells 3 and 4 also needed to be subjected to cyclic aging experiments at their respective temperatures (25 °C and 60 °C) to obtain the OCV curves of the cells at room temperature (25 °C) and different degrees of aging (SOH = 0.95 and 0.9). The feasibility of the proposed cell SOE estimation method can be verified through the OCV curves of cells at different aging levels.
In order to better verify the robustness and accuracy of the battery pack SOE estimation method under complex operating conditions, operating condition verification experiments were conducted on the battery pack. The stationary operating condition experiment was used to simulate vehicle charging conditions, and the dynamic operating condition experiment was used to simulate vehicle driving conditions.
4. Results and Discussion
4.1. The Experimental Results
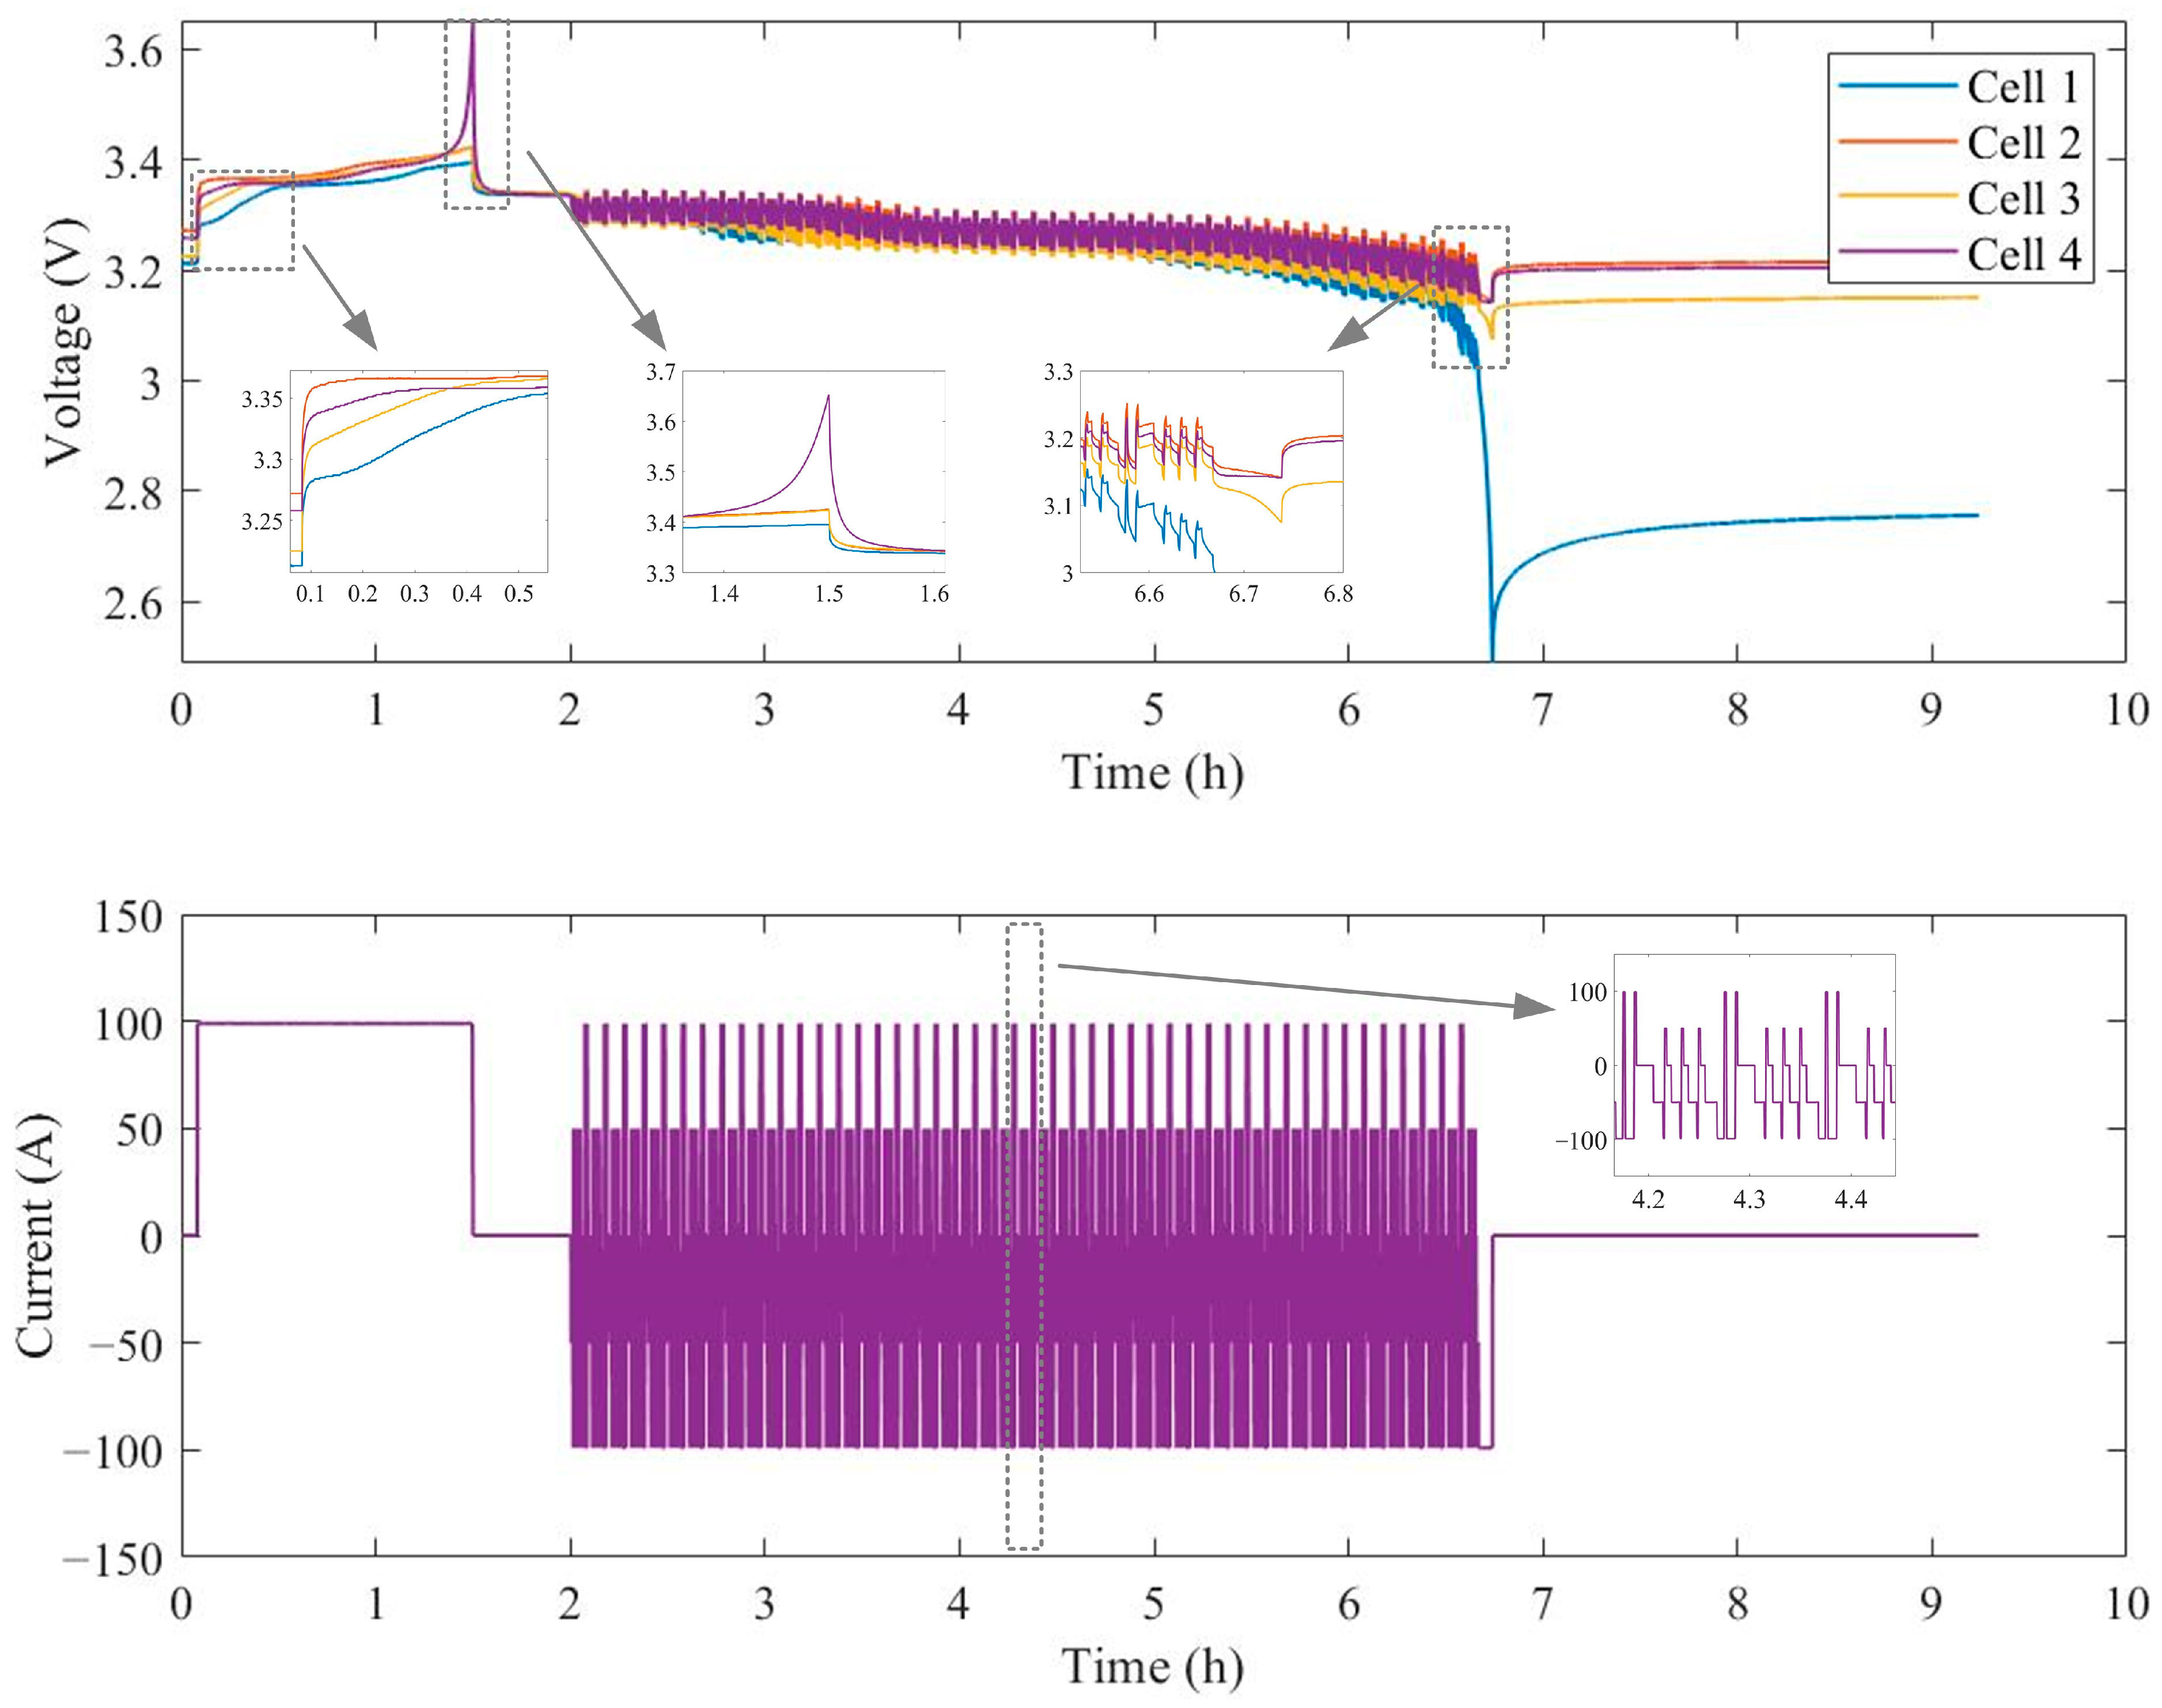
In order to describe the charging and discharging process of cells in the LFP battery pack more clearly,
Figure 7 shows the voltage and current curves of the cells, corresponding to the working condition verification experiment. It can be seen that the battery pack is composed of four cells with different initial SOCs and SOHs connected in series, and the complex operating conditions during the actual use of the battery pack are simulated through verification experiments. Firstly, the stationary operating condition experiment is conducted on the battery pack. The battery pack is charged with a constant current until the voltage of a cell rises to the charging cut-off voltage. Then, after a 0.5 h rest, the dynamic operating condition experiment is carried out on the battery pack until the voltage of a cell drops to the discharging cut-off voltage. Finally, the battery pack is released for a long time.
It can be seen from
Figure 7 that, during the stationary operating condition experiment, the voltage of “cell 1” reaches the voltage plateau last and the voltage of “cell 4” reaches the charging cut-off voltage first. During the dynamic operating condition experiment, the voltage of “cell 1” reaches the discharging cut-off voltage first.
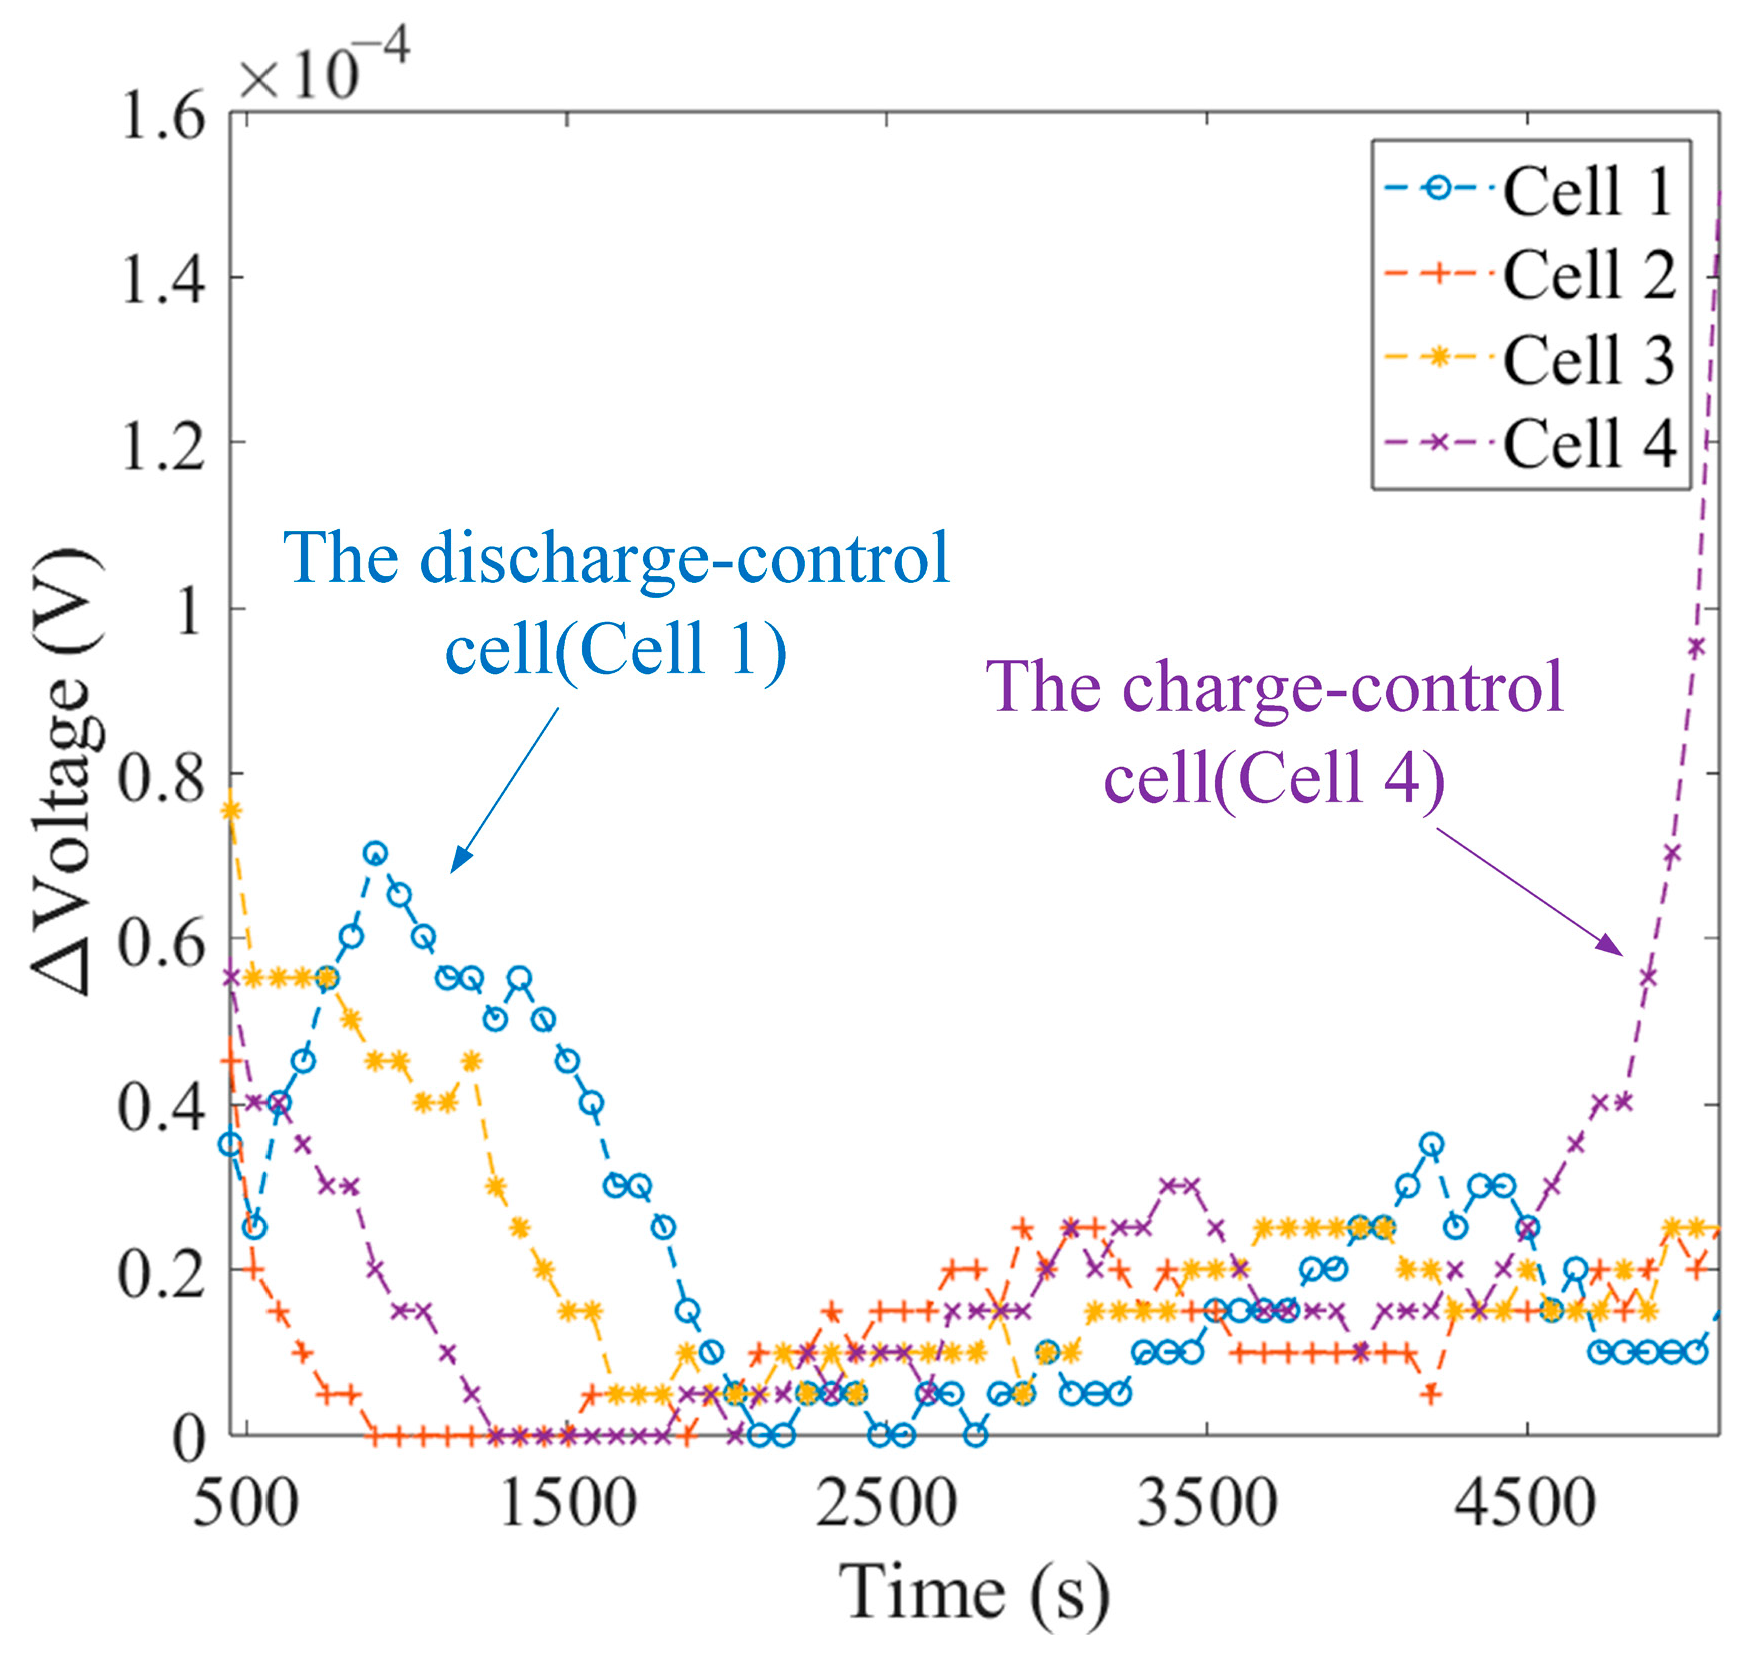
4.2. The Selection Results of Representative Cells
To prove the validity of the proposed method for selecting representative cells in this paper,
Figure 8 shows the variation in the four cells’ voltage differences.
As can be seen from
Figure 8, when the voltage curve changes sharply, the voltage difference also fluctuates correspondingly. In the low SOC region, the blue curve is the last to decrease. This indicates that the voltage of the cell corresponding to its curve rises rapidly last, and this cell is the discharge-control cell. On the contrary, in the high SOC region, the purple curve is the first to rise. This indicates that the voltage of the cell corresponding to its curve rises sharply first, and this cell is the charge-control cell. By employing this methodology, ‘cell 1’ and ‘cell 4’ are ultimately selected as the representative cells. As previously mentioned, under the stationary operating condition, the voltage of “Cell 1” is the last to reach the voltage plateau, while the voltage of “Cell 4” is the first to reach the charging cut-off voltage. This phenomenon is in line with the selection results of the representative cells, which demonstrates the effectiveness of this method.
It should be noted that, in order to avoid conflicts during the selection of representative cells, the condition that the SOC value of the charge-control cell is equal to 0.5 is taken as the dividing line.
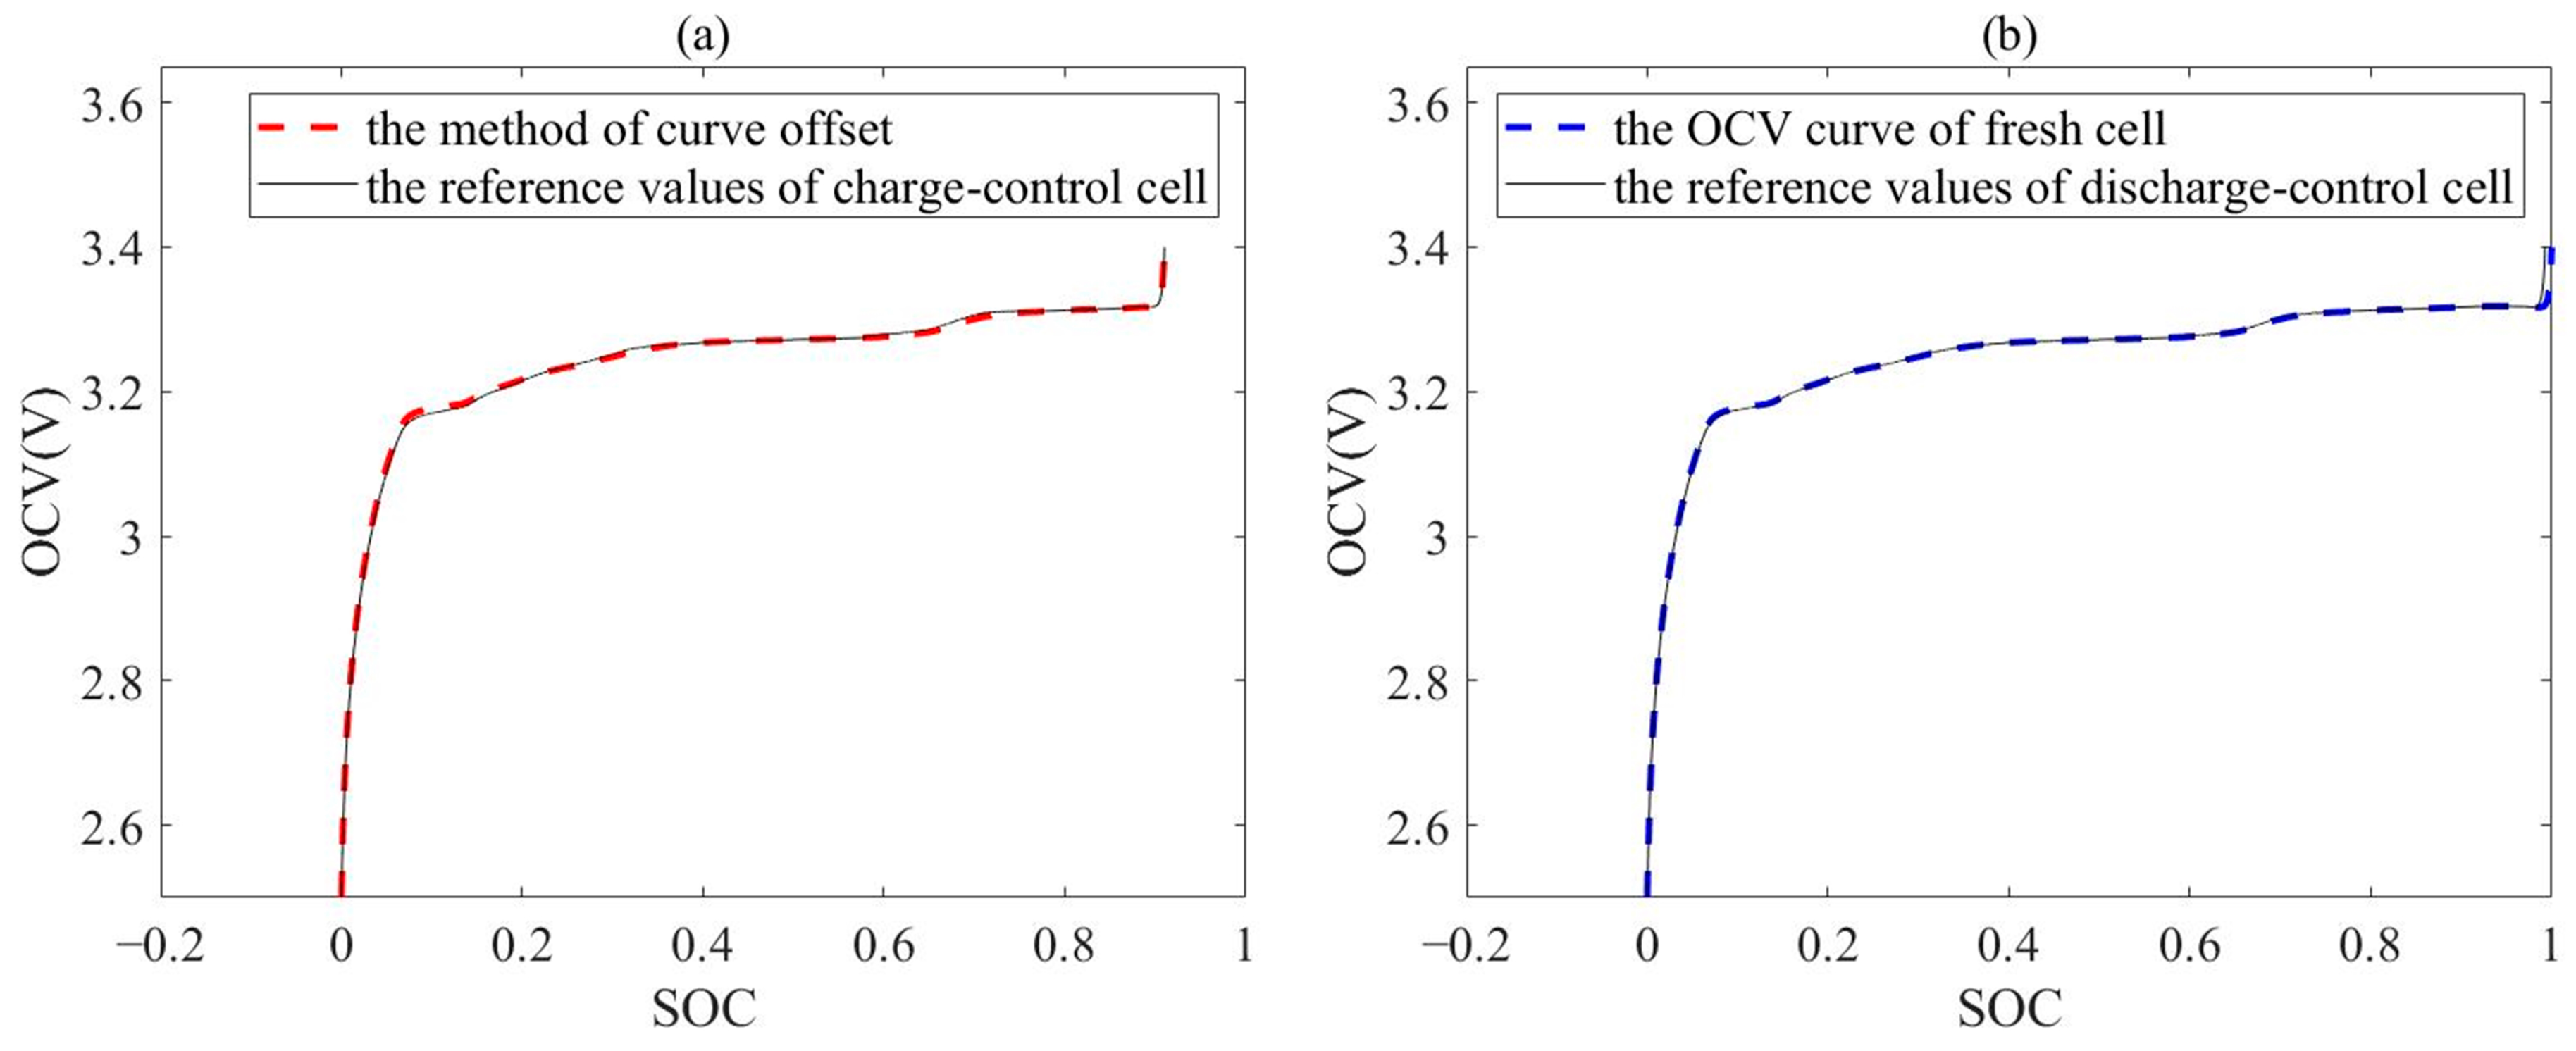
4.3. The Acquisition Results of OCV Curve for Representative Cells
To demonstrate the feasibility of the proposed method for obtaining the OCV curve of the representative cells, the acquisition results of the OCVs of the charge-control and discharge-control cells are shown in
Figure 9, where the reference values of charge-control and discharge-control cells are obtained by conducting the experiment on the cells.
It can be seen that, whether it is the OCV curve of the charge-control or discharge-control cell, the maximum errors (MEs) occur in the regions where the curves have significant bends, which are 0.001 and 0.0003, respectively. These errors can be neglected, and the acquisition results are highly consistent with the reference values. This indicates that the actual variation in the OCV curve is completely consistent with the results of theoretical analysis, providing strong data support for the realization of the SOE estimation of the battery pack.
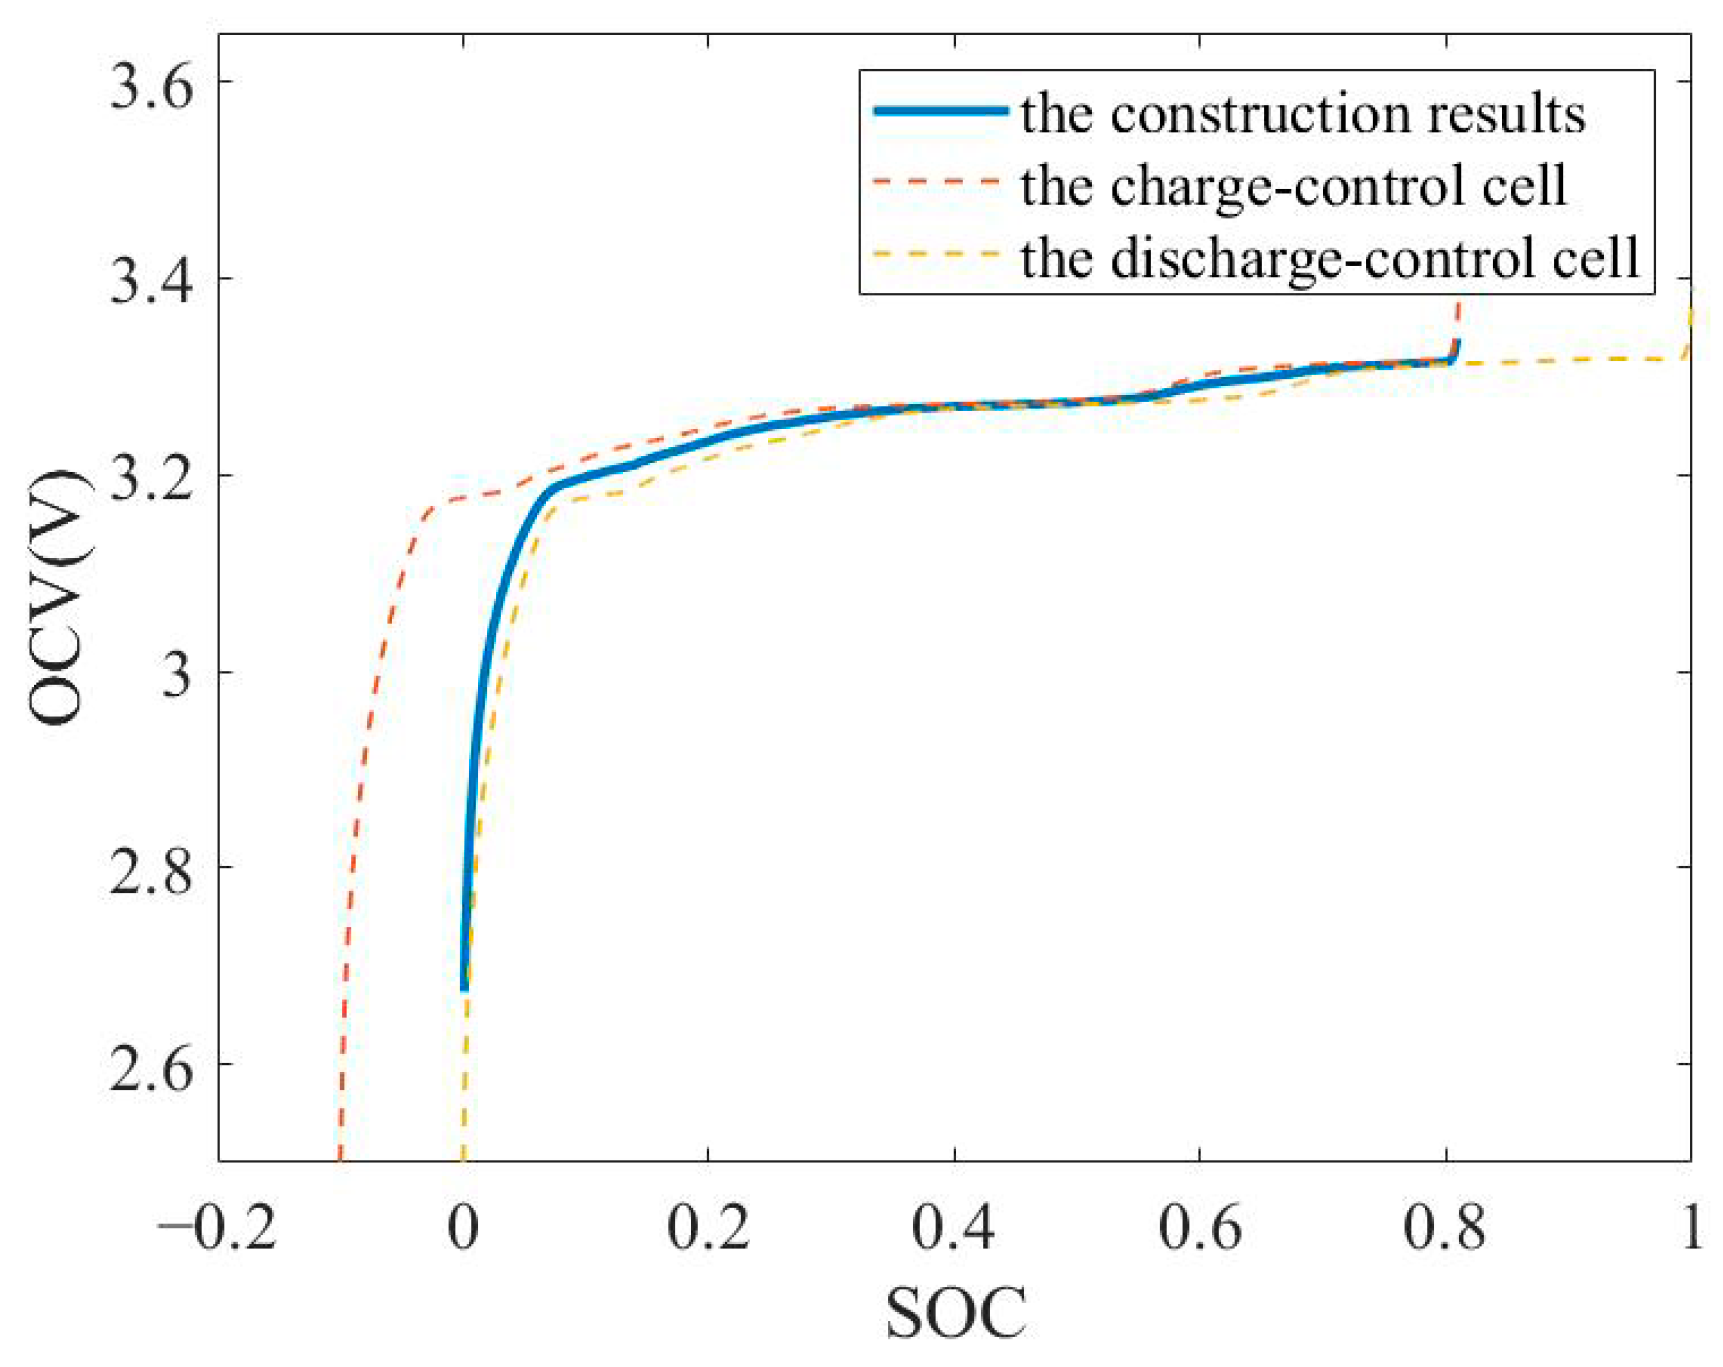
4.4. The Construction Results of Average OCV Curve
Based on adaptive weights and the OCV curves of the two representative cells after offset, the construction of the average OCV curve is achieved, as shown in
Figure 10. It is evident that the average OCV curve consistently falls between the OCV curves of the two representative cells. This signifies that the proposed method effectively takes into account the charging and discharging constraints of the battery pack on its internal cells, thereby ensuring the reliability of the OCV curve construction.
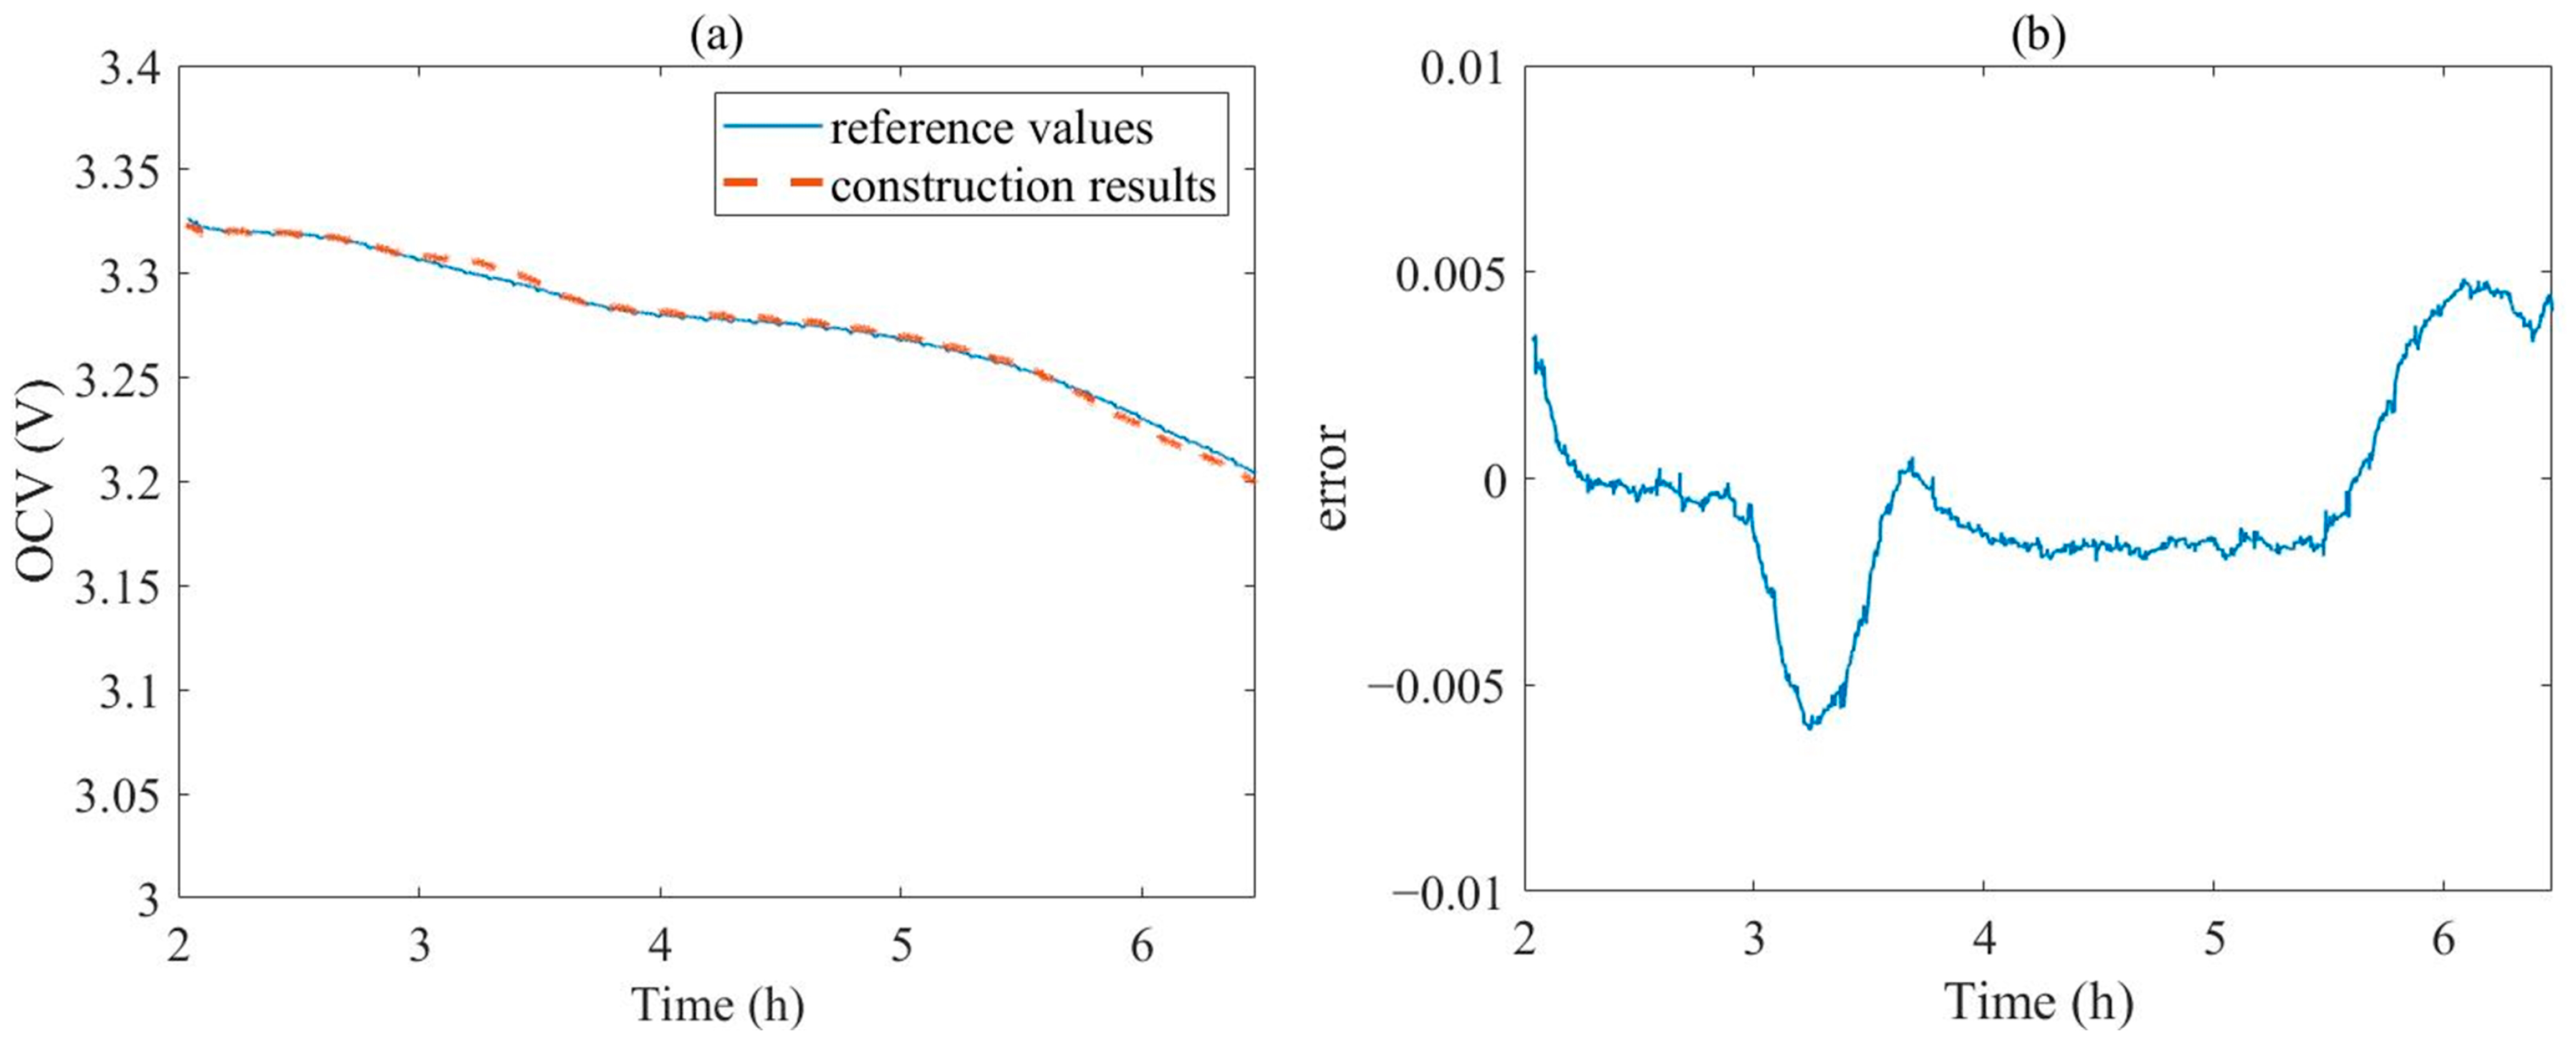
After conducting the experiment on the battery pack, the reference values of the average OCV are obtained. The reference values, online construction results of the average OCV, and the error between them are presented in
Figure 11a,b, respectively.
It can be seen that the difference between the two curves is extremely small. The ME and root mean squared error (RMSE) between them are 0.0048 and 0.0028, respectively. This fundamentally ensures the feasibility of estimating battery pack SOE through the average OCV.
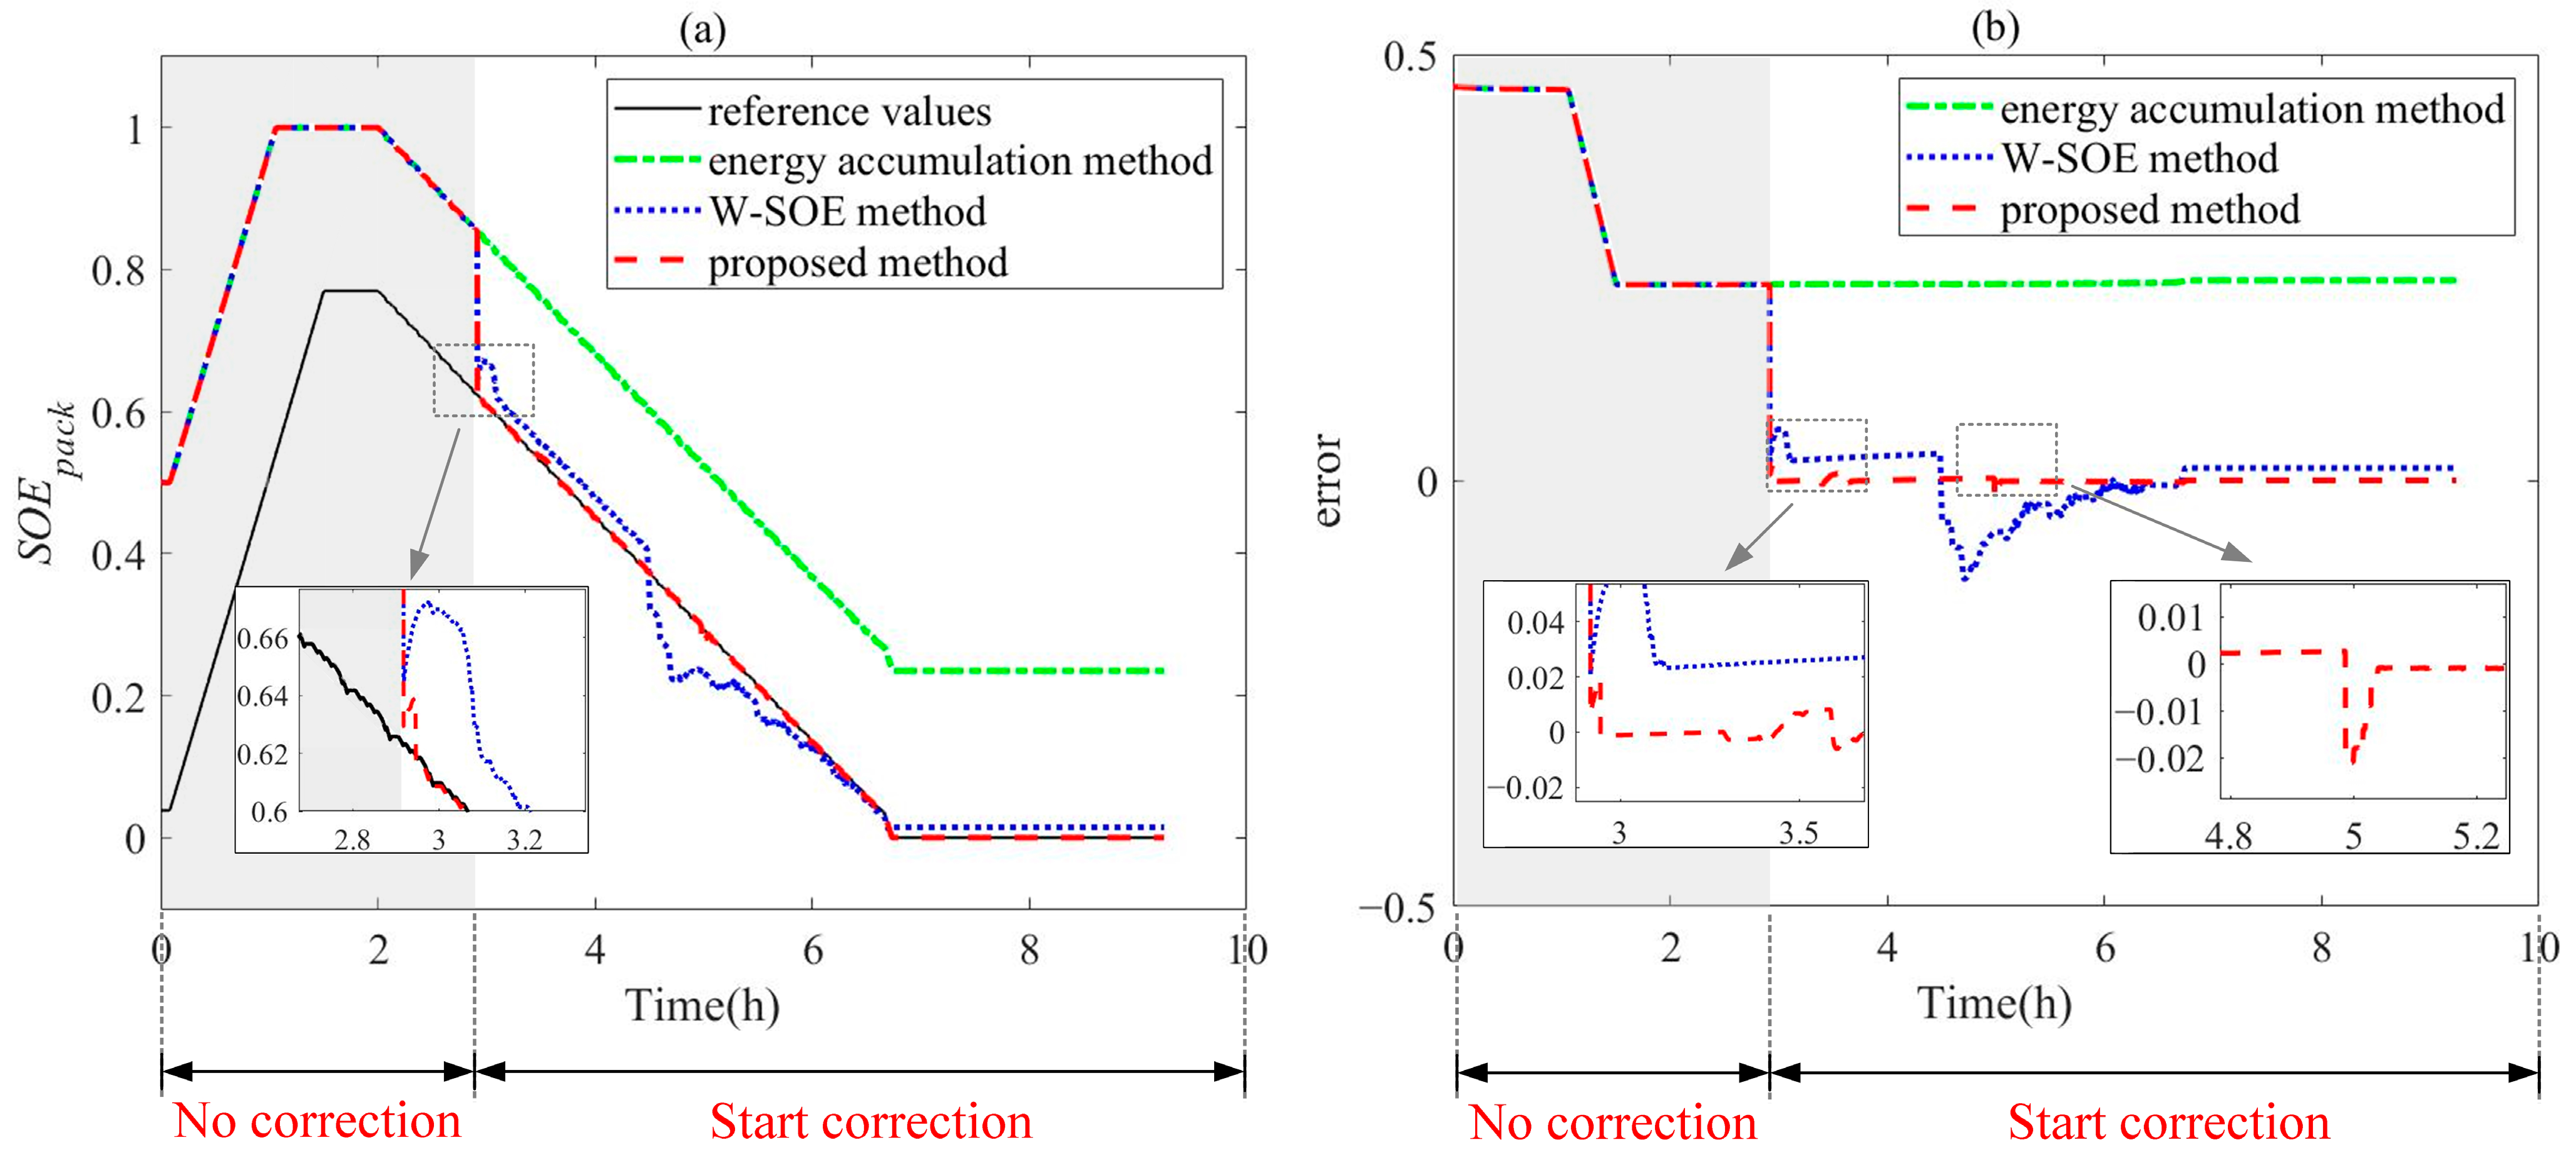
4.5. The SOE Estimation Results of Battery Pack
The SOE of the battery pack was estimated following the flowchart depicted in
Figure 5. The estimation results were compared with reference values obtained by conducting an energy testing experiment on the battery pack, as illustrated in
Figure 12. Furthermore, the pure energy accumulation method and the method based on the direct SOE weighting of representative cells (here, it is abbreviated as the W-SOE method) were utilized as comparison objects [
7].
From
Figure 12, it can be seen that in the “No correction” stage, both the method proposed in this paper and the W-SOE method utilize the principles of the energy accumulation method for the SOE estimation of the battery pack. Therefore, within this stage, there is no difference between the estimation results of these two methods. The actual SOE of the battery pack is 0.05. Since the initial value of SOE cannot be determined, the initial value is set to 0.5, which causes serious initial value errors. If the energy accumulation method continues to be used to estimate the SOE, it will also cause cumulative errors, which is obviously unreasonable.
After entering the “Start correction” stage, the W-SOE method and the proposed method begin to demonstrate their effectiveness. Both methods exhibit a rapid convergence in estimation errors. However, the proposed method outperforms the W-SOE method in terms of lower estimation errors and reduced fluctuations. Most importantly, once the battery pack is depleted, its SOE drops to zero, whereas the results provided by the W-SOE method clearly fail to meet this criterion. In contrast, the method proposed in this paper is based on the OCV curve, rather than utilizing a combination of the SOEs of representative cells, effectively resolving this dilemma.
During the implementation process of the proposed method, although there are some minor fluctuations in certain areas, these fluctuations lead to relatively large errors that still require further improvement. Overall, the proposed method effectively tracks the reference value, with the ME and RMSE being 0.0208 and 0.0011, respectively.

