Article

A Holistic Assessment of Sustainable Energy Security and the Efficiency of Policy Implementation in Emerging EU Economies: A Long-Term Perspective

by
Jarosław Brodny
1,*,
Magdalena Tutak
2,* and
Wieslaw Wes Grebski
3
1
Faculty of Organization and Management, Silesian University of Technology, 44-100 Gliwice, Poland
2
Faculty of Mining, Safety Engineering and Industrial Automation, Silesian University of Technology, 44-100 Gliwice, Poland
3
The Pennsylvania State University, 76 University Drive, Hazleton, PA 18202, USA
*
Authors to whom correspondence should be addressed.
Energies 2025, 18(7), 1767; https://doi.org/10.3390/en18071767
Submission received: 15 February 2025 / Revised: 25 March 2025 / Accepted: 31 March 2025 / Published: 1 April 2025

Abstract

:
One of the foremost challenges in today’s global economy is ensuring energy security for individual countries and regions. In the contemporary context, this security plays a pivotal role in ensuring sovereignty, fostering innovation, and bolstering competitiveness, particularly in knowledge-based economies. The pursuit of energy independence while mitigating adverse environmental impacts stands as a key priority in European Union policy. Efforts towards achieving a zero-carbon economy encompass all member states, including those in Central and Eastern Europe (CEE). This paper delves into this pressing issue by evaluating the sustainable energy security and policy efficiency of CEE countries over a 15-year period. This research employed a well-defined methodology, employing a multidimensional approach to address the complexity of the issue. The outcome of this approach was the development of the Sustainable Energy Security Index (SESI) for the countries under study, serving as a benchmark for evaluating energy security and policy effectiveness. Multiple Multi-Criteria Decision-Making (MCDM) methods, including COPRAS, EDAS, MAIRCA, and the Hurwicz criterion, were utilized to determine the SESI value. Additionally, CRITIC, equal weights, standard deviation methods, and Laplace’s criterion were employed to ascertain the weights of the indices characterizing various dimensions of sustainable energy security. The findings reveal significant disparities in energy security and policy implementation effectiveness among CEE countries. Slovenia, Croatia, Latvia, Romania, and Hungary demonstrated notably strong performance, while Poland and Bulgaria lagged behind. These results underscore the necessity of integrating findings into the energy and climate strategies of both CEE countries and the EU-27 as a whole.

1. Introduction

Access to sufficient energy at affordable prices is essential for fostering stable economic and social development in both individual countries and regions [1,2]. Despite various conservation measures, the global demand for energy continues to rise, driven by the increasing populations and their subsistence needs. This upward trend is further propelled by the dynamic economic growth worldwide and the evolving needs of the populace [3]. These developments underscore the critical importance of access to affordable energy, particularly during periodic global crises. The significant global energy crisis of the 1970s heightened awareness about the need to ensure energy security, a crucial element of both national and international security, thus becoming a vital component of global politics [4]. Consequently, ensuring energy security has emerged as a primary objective in the economic policies of countries and regions worldwide. Furthermore, energy independence has become increasingly vital for securing political and economic freedom. The ongoing dynamic economic development, driven by innovative solutions and coupled with the growing environmental consciousness among societies, has precipitated a transformation in the energy sector towards a low-carbon, cleaner, more efficient, and safer one [5]. These changes are driven by a combination of factors, including escalating energy demands, depletion of conventional energy resources, energy crises, and heightened awareness of global warming and climate change. In this context, implementing the concept of sustainable development pertaining to key economic aspects of the world is paramount [6].
The evolving dynamics within the global economy, alongside the increasing prominence of sustainable practices, are shaping policy decisions for numerous countries and regions worldwide. Leading the charge in embracing modern solutions is the EU, dedicated to fostering an innovative, competitive, and climate-neutral economy. Comprising 27 member countries, the EU has long been at the forefront of implementing regulations aimed at reducing reliance on fossil fuels in favor of renewable energy sources, mitigating greenhouse gas emissions, and enhancing energy efficiency [7,8,9]. These measures are geared towards modernizing the energy sector on the principles of sustainable development, ultimately enhancing the quality of life for present and future generations. Despite these hurdles, the EU remains steadfast in its commitment to achieving carbon neutrality. Key policy initiatives such as the European Green Deal and Fit for 55 [10,11] underscore this dedication, aiming to attain climate neutrality by 2050. Implementing the objectives outlined in these initiatives requires substantial investments and often entails unpopular changes, especially in the energy sector. The adoption of these changes presents unique challenges for the 11 countries of Central and Eastern Europe (CEE), which have traditionally relied heavily on conventional energy sources. They include the following: Bulgaria, the Czech Republic, Estonia, Latvia, Lithuania, Croatia, Hungary, Slovenia, Slovakia, Poland, and Romania. Their integration into the EU has brought about significant economic, social, and political transformations. Despite experiencing substantial economic growth, the CEE region still lags behind the “old EU-14” countries in terms of income and social wealth.
Economic issues also mean that CEE countries have limited opportunities to finance investments related to environmental protection and renewable energy development. For this reason, conservative circles promote the view that the transition is a threat that could undermine the region’s competitiveness and national energy security. Hence, it can be inferred that shifts in climate policy, heightened public consciousness regarding environmental preservation, the armed conflict in Ukraine, and other disruptions in the global energy market are prompting swift alterations in EU energy policy. Given this scenario, it is entirely justified to delve into the assessment of Central and Eastern European countries regarding sustainable energy security and the effectiveness of energy policy implementation. Examining these issues over a 15-year timeframe offers ample opportunities to track and appraise changes in this regard, while also facilitating an assessment of the integration process of this group of countries with the “old EU-14”.
Considering the significance and urgency of the presented problem, the research objectives were established, aiming to determine and evaluate the level of energy security in CEE countries from 2007 to 2021, along with assessing the effectiveness of energy policy implementation during this period. The adopted concept of “effectiveness of energy policy implementation” refers to a country’s ability to achieve measurable progress in key aspects of sustainable energy security within a specified timeframe. The effectiveness of this process is evaluated using indicators of change dynamics, which quantitatively represent progress in various areas (defined by partial indicators) in relation to their initial state.
To accomplish these objectives, the author devised a research methodology and formulated the following research questions:
RQ1. 
What was the extent of sustainable energy security in Central and Eastern European countries during the period under review?
RQ2. 
How effective was the implementation of EU energy policy in the CEE countries during the period under review?
In relation to the above research questions, the following hypotheses were proposed:
H1: 
The level of sustainable energy security in the CEE countries during the period under review may show significant differences depending on the level of energy infrastructure development, national policies, and access to renewable energy sources.
H2: 
The implementation of the European Union’s energy policy in the CEE countries contributed to the improvement of sustainable energy security, particularly in terms of increasing energy source diversification and enhancing energy efficiency. However, its effectiveness varied across different countries.
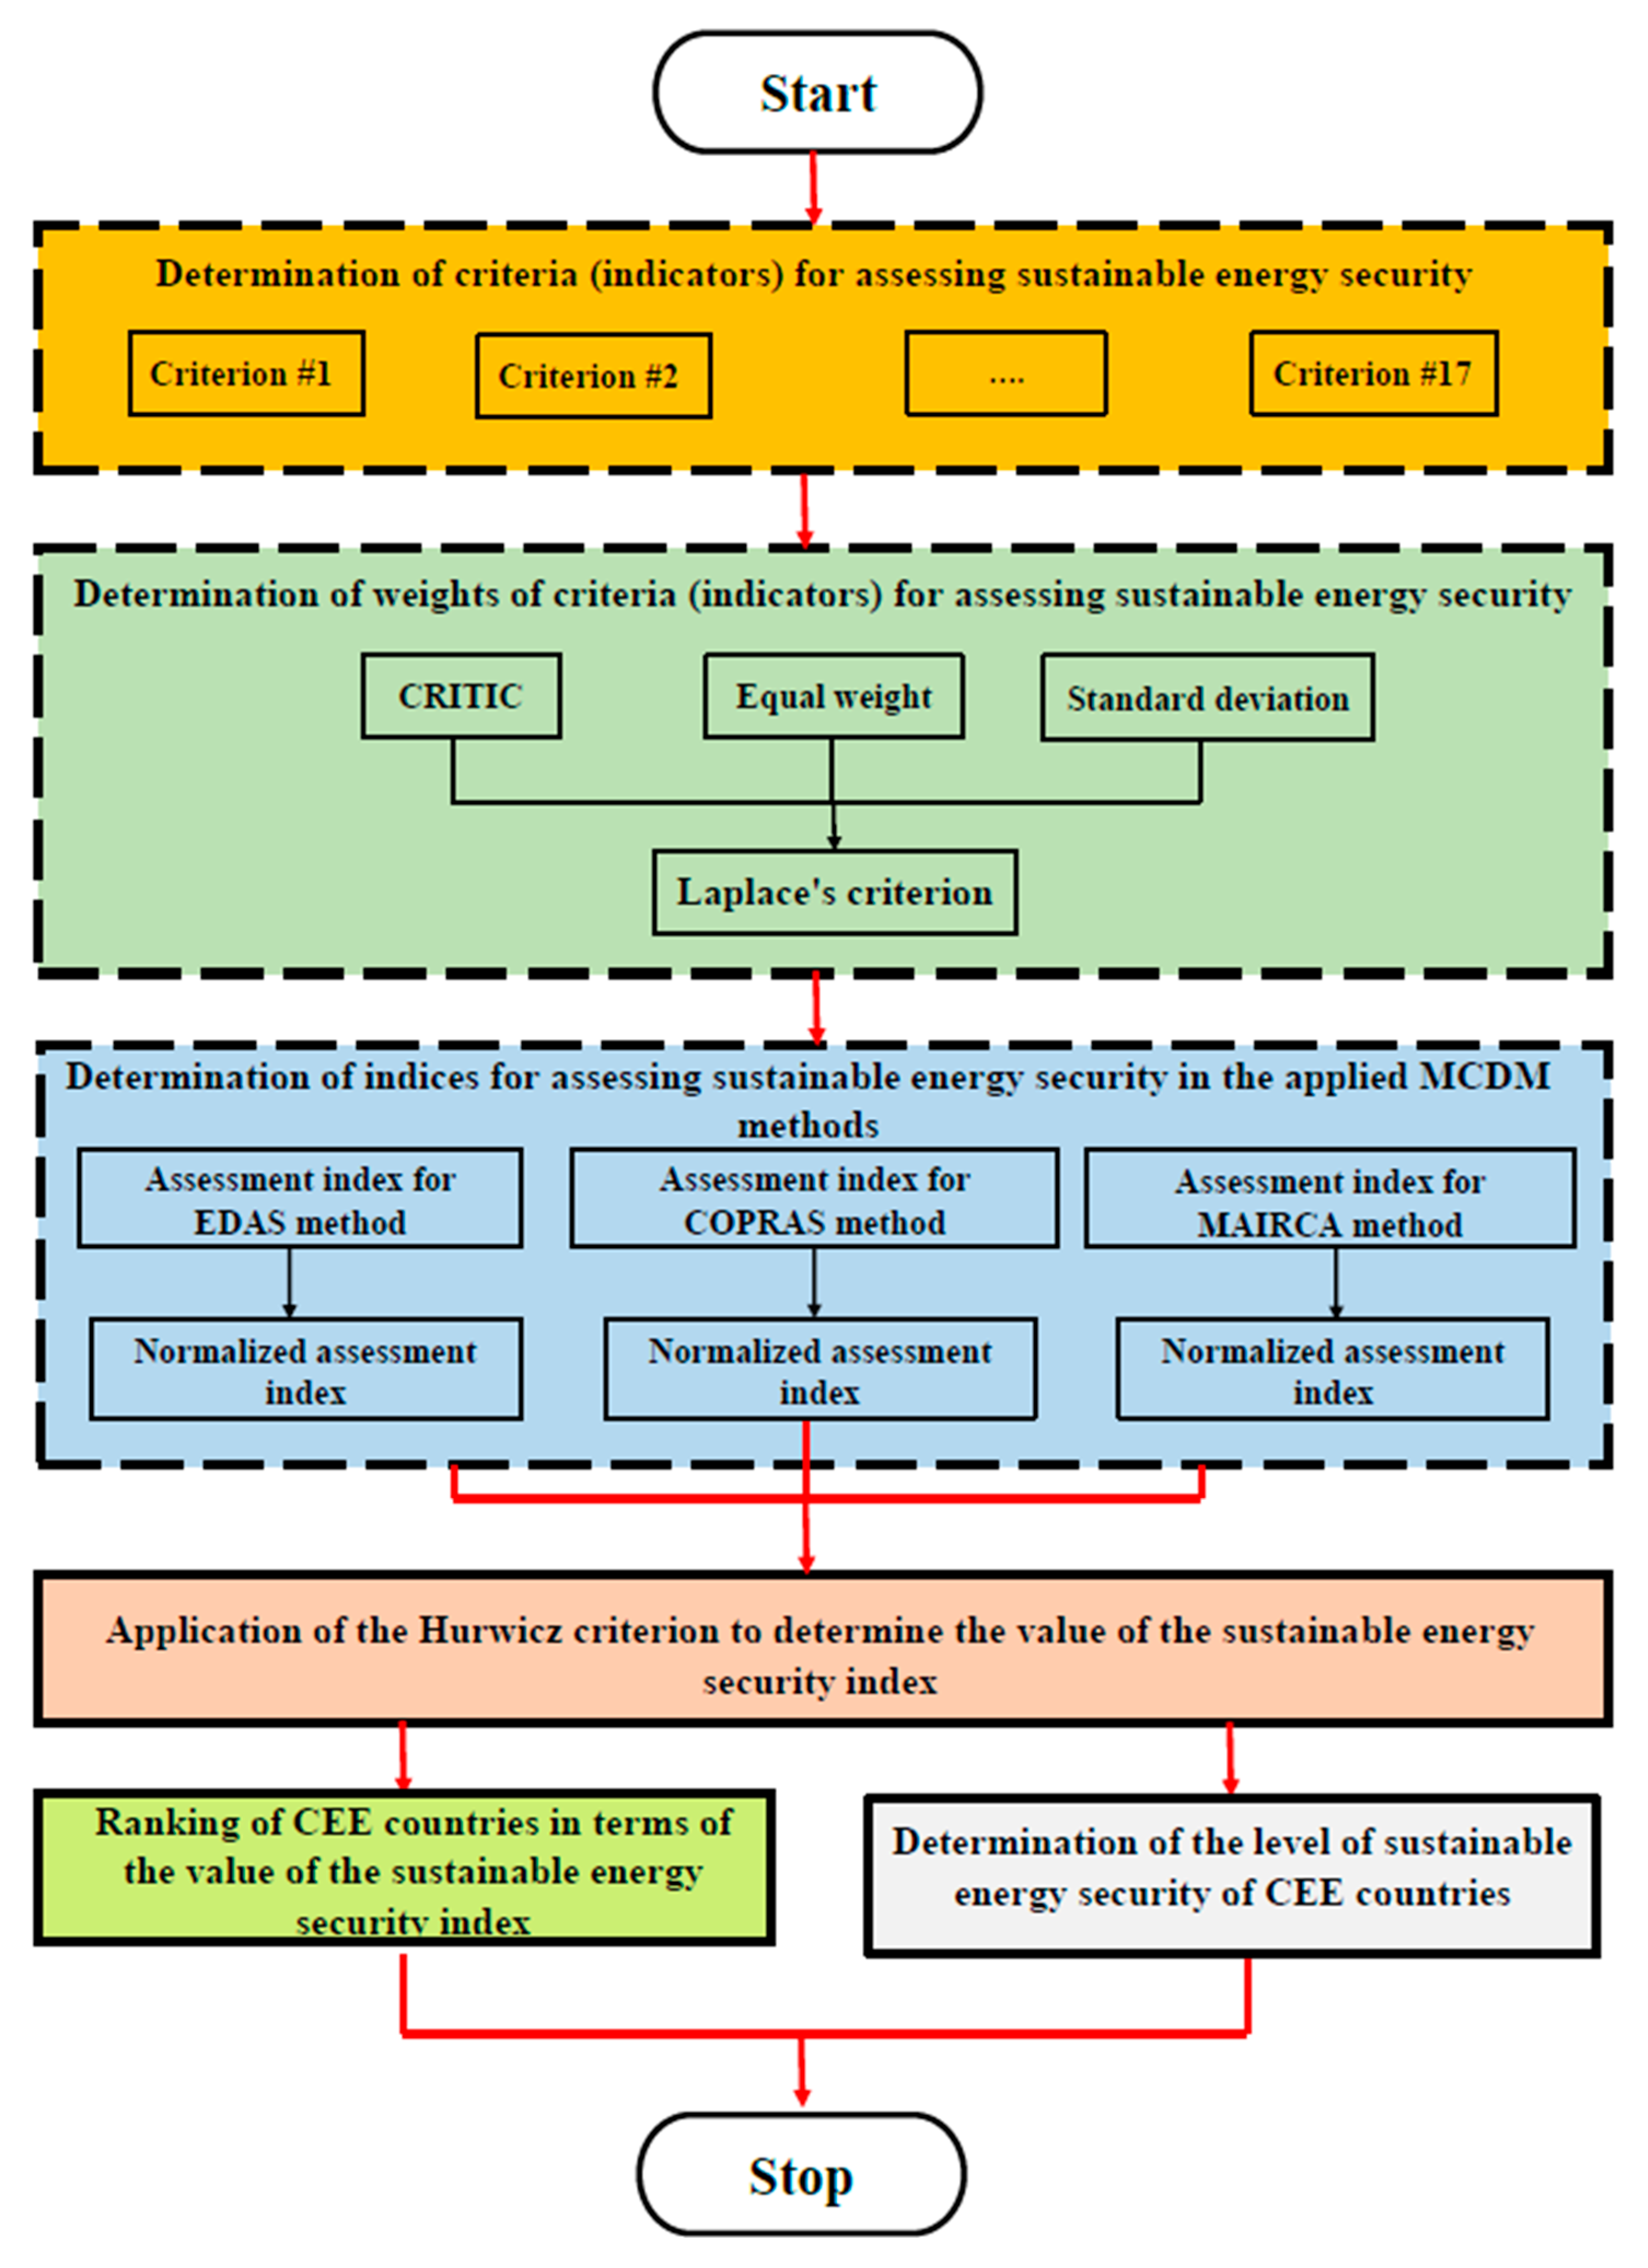
To address these questions and hypotheses and accomplish the specified objectives, a methodological approach was devised, centered on identifying key indicators of sustainable energy security and utilizing Multi-Criteria Decision-Making (MCDM) methods and criteria for decision-making in uncertain scenarios. This approach also aimed to ensure a comprehensive and reliable assessment of energy security by incorporating its four key dimensions: energy, economic, environmental, and social.
The long-term perspective of evaluating sustainable energy security and the efficacy of energy policy implementation in CEE necessitates a comprehensive approach that considers various dimensions and aspects of this issue. Given its multidimensionality and complexity, this study employed multi-criteria decision support methods. The research relied on a set of 17 indicators that characterize sustainable energy security and enable the assessment of the effectiveness of energy policy implementation in CEE countries. An integral aspect of the research involved determining the weights of these indicators. To accomplish this, three objective methods (CRITIC, equal weights, and standard deviation) along with Laplace’s criterion were utilized. The cornerstone for evaluating the issue under study (sustainable energy security of the studied countries) was the Sustainable Energy Security Index (SESI), which was established based on the outcomes derived from the Complex Proportional Assessment (COPRAS), Evaluation Based on Distance from Average Solution (EDAS), and Multi-Attributive Ideal-Real Comparative Analysis (MAIRCA) methods, as well as the Hurwicz criterion.
The novelty of the discussions and research presented in this study is evidenced by several key contributions. It addresses a significant research gap by evaluating sustainable energy security and the effectiveness of energy policy implementation on a regional scale, with a specific focus on Central and Eastern European countries. This study introduces the Sustainable Energy Security Index and evaluates energy security alongside policy effectiveness for 11 CEE countries over a 15-year period, providing a comprehensive perspective on policy impacts over time. Furthermore, it develops a robust and universal methodology for assessing sustainable energy security and policy effectiveness, employing Multi-Criteria Decision-Making and the Hurwicz criterion methods. The research incorporates indicators spanning energy, economic, environmental, and social dimensions, ensuring a holistic assessment, and places emphasis on the energy mix of each country, distinguishing between conventional and zero-carbon sources—an essential consideration in the context of initiatives like the European Green Deal. Ultimately, this study expands the body of knowledge on sustainable energy security and energy policy implementation, particularly in developing countries, while also offering practical recommendations to inform future EU energy strategies and policies. In summary, the chosen subject matter, objectives, and research questions address a significant and timely issue. From both a scientific and practical standpoint, it is justified to explore this topic further.

2. Literature Background

2.1. Policy Background

The European Union’s energy policy, as defined in Article 194 of the Treaty on the Functioning of the European Union (TFEU) [12,13], has long been central to its agenda. Energy security has been a priority since the 1950s, with regulatory frameworks and policies evolving over time. Initial efforts were followed by significant legislative action in the 1990s and early 2000s. Although these measures were broadly accepted, they prompted debates among member states, highlighting the need for a collective energy strategy.
The development of EU energy policy has considered a wide range of factors, including economic, political, social, and environmental aspects. The goals have shifted over time, with a growing focus on improving efficiency, safety, and environmental sustainability. These changes have led to today’s climate-focused energy transition initiatives.
The first EU energy package was implemented between 1996 and 1998, covering electricity in 1998 and gas in 2000. The second package followed in 2003, granting industrial consumers more choice in their energy suppliers. In 2009, the third energy package further liberalized the electricity and gas markets. The fourth package, introduced in 2019, focused on renewable energy and energy storage, with mandates for member states to develop crisis management plans. The most recent legislation, the Fifth Energy Package (2021), is aligned with the “European Green Deal”, which sets climate goals for 2030 and 2050 [14].
In addition to these energy packages, early legislation on renewable energy emerged in 1997, when the European Commission’s White Paper set a goal for renewable sources to account for 12% of energy consumption by 2010. Subsequent directives, such as the 2001 and 2009 initiatives, pushed for increasing renewable energy’s share and improving energy efficiency, encapsulated in the “3 × 20” package. The 2018 directive aimed to achieve a 32% share of renewable energy by 2030, while the 2023 directive raised the target to 42.5%, with a long-term goal of 45% [15,16,17,18,19].
This progression highlights the EU’s commitment to transitioning toward renewable energy, enhancing energy security, and reducing environmental impacts. The focus on renewable energy opens opportunities for regions previously dependent on traditional energy sources to shift toward more sustainable practices.

2.2. Energy Security Assessment

Regarding the issue of energy security, it is worth noting the plethora of literature available that presents research findings on energy security and the transformation of the energy sector across various countries worldwide. These works employ diverse approaches and evaluation criteria to explore this topic.
Energy security, particularly in the context of sustainable development, has garnered interest from various stakeholders and researchers. This interest stems from the crucial role energy security plays in the economic development of individual countries and regions, where ensuring a stable energy supply is paramount for the efficient functioning of the energy and economic systems [5].
While there is not a universally accepted definition of energy security, numerous attempts have been made in the literature [20,21] to define and grasp its essence [20,21,22,23,24]. Originally, energy security denoted the uninterrupted availability of energy sources at affordable prices for consumers.
However, contemporary interpretations emphasize the uninterrupted availability of sustainable (zero-carbon) energy sources at affordable prices, facilitating economic and social development while meeting environmental standards [25]. This evolving definition underscores energy security’s significance as a prerequisite for economic and social development, considering environmental imperatives.
Methodologies for assessing energy security have been developed since the early 21st century, employing various indicators and techniques across different countries and regions worldwide. Studies have extensively covered countries within the European Union [26,27,28,29,30,31,32] and Asia [33,34,35], with a particular focus on China [36,37,38,39,40,41,42]. Studies and assessments of energy security were also conducted for African countries [43,44], as well as Bangladesh [1], Pakistan [45,46,47], and Argentina [48].
The evaluation primarily relied on methods that allow the author to derive a comprehensive assessment index. These methods encompass MCDM [26,41,42,43,49,50], factor analysis [28,44], and the creation of various composite evaluation indices [33,37,39,40,44,47,48]. Assessments considered diverse criteria and indicators, including metrics such as total primary energy supply per capita, energy consumption per capita, energy mix diversification, reliance on energy imports, energy sufficiency, oil, gas, and electricity prices, the proportion of renewable energy in final consumption, and CO2 emissions. Recent research [21,51] indicates that the literature contains over 200 indicators employed for evaluating energy security. These indicators encompass various dimensions of the issue, such as Agility, Architecture, Alignment, and Ability (referred to as the 4-As framework) [1,52,53,54], or dimensions related to energy, economic, and environmental aspects [43,55,56]. An illustrative example is provided by [56], which evaluates the energy security of Asia–Pacific countries using 44 indicators across seven dimensions: Energy supply, Demand management, Efficiency, Economic, Environmental, Human security, Military security, Domestic socio-cultural-political, Technological, International, and Policy. Another study [57] focuses on assessing energy security for OECD countries, emphasizing the diversification of energy supply sources. Similarly, ref. [31] conducts a similar assessment for EU countries, concentrating on the diversification of energy sources. This evaluation relies on 11 indicators to determine the Energy Import Diversification and Security (EIDS) index. In contrast, De Rosa et al. [58] assess energy security in EU countries from the perspective of diversification and concentration of renewable energy sources. An intriguing study discussed in another paper [59] involves the evaluation of energy security for Indonesia. The authors utilized a composite index derived from the aggregation of 14 indicators to assess energy security in the country. Zeng et al. [50] conducted a study on the energy security of the Baltic states, among others, spanning from 2008 to 2012. They employed MCDM methods, including the DEA-linked approach and modified SAW approach, utilizing 9 indicators across three dimensions: economic, energy supply, and environmental. Similarly, Wang and Zhou [39] developed a framework for measuring global energy security for countries, employing MCDM-type methods. Their approach utilized a selected set of indicators and included the Subjective and Objective Weight Allocation (SOWA) and Balance Score Matrix (BSM) methods for evaluation. Tutak and Brodny [55] assessed energy security in the TRI countries using the MCDM methodology and the Gray Relational Analysis method. They employed indicator weighting methods such as CRITIC, entropy, and standard deviation, focusing on indicators related to energy, economic, environmental, and social dimensions. Zhang et al. [60] utilized the Fuzzy AHP-type MCDM method to evaluate the importance of seven dimensions and 28 indicators of energy security. Subsequently, they proposed the GRA-TOPSIS model for assessing energy security in Chinese provinces. Conversely, Gökgöz and Yalçın [61] employed SAW, MARCOS, and CODAS methods, along with IDOCRIW and the Malmquist method, to determine the level of energy security, productivity, and economic growth in the EU. In another study [47], the authors employed factor analysis, specifically the PCA method, to assess energy security in Pakistan from 1991 to 2018. This method was also utilized by Filipović et al. [62], who devised the New Energy Security Index for assessment purposes.
The aforementioned works, chosen from a plethora of studies, underscore the multidimensional nature of energy security. Such an approach is logical given the broad impact of energy security on various aspects of social and economic life. Moreover, the selected indicators in these studies encompass diverse factors influencing energy security. It is notable that there is currently a dearth of research pertaining to the energy security of CEE countries. Undertaking such research is therefore warranted, particularly considering the EU’s leadership in energy transition and climate protection. Assessing the energy security of these nations is crucial due to the economic and social challenges associated with this transition.
Hence, there is ample justification for developing a novel methodology to determine energy security, considering its multidimensionality. Additionally, evaluating the effectiveness of energy policy implementation, a topic hitherto unexplored, warrants attention.

3. Research Methodology

3.1. Data and General Procedure

The basis of the research methodology developed was a set of 17 selected indicators, characterizing the main dimensions included in the assessment relating to sustainable energy security. These included energy, economic, environmental, and social dimensions. In determining the number of indicators, the recommendations included in one work [51] were applied, which assumes that their number should not exceed 20.
The selected indicators, meeting the aforementioned criteria, are outlined in Table 1. The analysis encompassed data from 2007 to 2021, with no data available (EUROSTAT [63]) beyond this timeframe (i.e., for 2022 and 2023).
This study focused on the population of 11 Central and Eastern European countries, all of which are EU members. They include Bulgaria, the Czech Republic, Estonia, Latvia, Lithuania, Croatia, Hungary, Slovenia, Slovakia, Poland, and Romania. Recognizing the complexity of energy security as a multi-criteria issue, this research employed an integrated approach based on methods of the MCDM type. These methods aim to select the most optimal alternative from a range of available options based on an evaluation index, considering specified evaluation criteria and their respective weights. Given the challenge of directly comparing criteria due to differences in measurement units, normalization was necessary.
Despite the availability of numerous MCDM methods, none are universally applicable to solve specific decision-making problems [64,65]. Consequently, the selection of an MCDM method itself becomes a multi-criteria problem. To address this, three distinct methods were incorporated into the study: COPRAS (Complex Proportional Assessment Method), MAIRCA (Multi-Attributive Ideal-Real Comparative Analysis), and EDAS (Evaluation Based on Distance from Average Solution), each offering unique advantages in the assessment process. COPRAS allows for the simultaneous consideration of both stimulating and non-stimulating criteria, enabling proportional and relative evaluation. EDAS, on the other hand, is based on measuring the distance from the average solution, which minimizes the impact of outliers and reduces the risk of ranking reversals. Meanwhile, MAIRCA focuses on analyzing the differences between ideal and actual values, enhancing the stability of the assessment and ensuring greater resistance to data variability. By integrating these three methods, this study achieves a more robust and comprehensive evaluation framework.
Additionally, the Hurwicz criterion, a decision-making criterion under uncertainty, was included. The developed and applied research approach involves the use of three different MCDM methods (COPRAS, MAIRCA, EDAS).
The application of an approach encompassing these three different MCDM methods for determining the SESI index value, along with the Hurwicz criterion, enables a comprehensive and multidimensional assessment. It accounts for various algorithmic decision-making perspectives. The integration of these methods enhances the objectivity of the analysis and reduces the susceptibility of results to fluctuations in input data. Moreover, the application of the Hurwicz criterion, which allows for considering the level of optimism in the decision-making process (α), further strengthens the reliability of the obtained results. As a result, this approach minimizes the need for a separate sensitivity analysis, as the diversity of the applied methods ensures the stability and robustness of the final evaluations against variations in input parameters.
Each method considered the evaluation criteria and their respective weights. Since different methods for determining indicator weights may yield disparate results, three weight-determination methods were employed in this paper: CRITIC, standard deviation, and equal weights. Laplace’s criterion was used to determine the final weight of each indicator. The selection of weight-determination methods was also influenced by practical considerations. Certain methods, like the entropy method and MEREC (Method based on the Removal Effects of Criteria), were unsuitable due to the presence of zero values in some indicators. These methods require logarithmization, rendering them impractical for use in such cases. Since indicator weights were determined solely using objective methods, the AHP method was not applied. The AHP method relies on subjective expert assessments, which introduce an element of arbitrariness into the weight-determination process.
The objective determination of indicator weights using methods like CRITIC, equal weights, and standard deviation is essential for ensuring transparency, eliminating bias, and improving the reliability of the analysis. These methods allow for a fair comparison of different factors, enhance the credibility of the results, and provide a strong foundation for informed decision-making.
A research procedure outlining employing the aforementioned methods and criteria is shown in Figure 1.
The proposed comprehensive approach to evaluating the sustainable energy security of CEE countries integrates multiple MCDM methods and indicator-weighting techniques, providing a robust framework for the assessment.

3.2. Research Methods

3.2.1. Multi-Attributive Ideal-Real Comparative Analysis (MAIRCA) Method

The MAIRCA method is a mathematical tool with a high degree of stability in terms of changes in both the nature and characteristics of the criteria considered [66,67,68]. The result obtained depends on the evaluation of gaps between ideal and actual assessments. Adding up these gaps for each evaluation criterion and for each alternative gives the total gap. Based on the total value of the gaps, the alternatives can be ranked in ascending order. The alternative with the smallest total gap receives the highest ranking. The alternative with the minimum gap has most of the criteria closest to the ideal values. The steps in this method are as follows:
-
To initiate the (initial) decision matrix (Equation (1)):
X = x 11   x 21 x m 1   x 12 x 22 x m 2   x 13 x 23 x m 3     x 1 n x 2 n x m n
where: xij denotes the performance value of -ith alternative on j-th criterion.
-
To determine preference based on an alternative. The preference for choosing one of m candidate alternatives is determined by evaluating the preference order PAi:
P A i = 1 m ;   i = 1 m P A i = 1 ,   i = 1 ,   2 ,   ,   n
where m is the total number of alternatives. The probability of preference for each alternative is equal.
When the decision maker is neutral with respect to all alternatives under consideration, i.e., when preferences are treated as equal, then the following is used:
P A 1 = P A 2 = P A m
The sum of the probabilities of selection in this method is 1.
-
To calculate theoretical evaluation matrix (T)pij. The theoretical evaluation matrix (Tpij) is formulated in m × n format (m is the number of alternatives and n is the number of criteria). The elements of the theoretical evaluation matrix are calculated by multiplying the preferences of alternatives by their corresponding criterion weights:
T p i j = P A j × w j ,   i = 1,2 , ,   m . ; j = 1 ,   2 , , n
where w j denotes the weight of the j-th criterion.
-
To determine elements of the actual rating matrix Trij. Calculation of the elements of this matrix requires the theoretical components of the rating matrix and the initial decision matrix. The actual rating matrix of criteria is determined based on the equation’s benefit type of criteria (Equation (5)) and cost type of criteria (Equation (6)):
T r i j = t p i j × X i j X i X i + X i
T r i j = t p i j × X i j X i + X i X i +
where X i j , X i + m a x v a l u e ,   X i   ( m i n v a l u e ) are the elements of the initial decision matrix. Larger criterion j is better for benefit-type criteria (stimulants), while smaller criterion j is better for cost-type criteria (destimulants), respectively.
-
To calculate the total gap matrix Gij. The gap between the theoretical and actual elements of the rating matrix gives the total gap matrix, calculated from Equation (7):
G i j = t p i j t r i j
-
To determine the final values of the criterion functions Qi (8):
Q i = i = 1 m g i j ,   i = 1 ,   2 , ,   n
where g i j are the gaps for the alternatives. The alternative with the lowest value of the criterion function Qi is best.

3.2.2. Evaluation Based on Distance from Average Solution (EDAS) Method

The EDAS method is based on determining the distance of the evaluated alternatives from the average solution. The method enables the identification of disparities between all alternatives and the average solution (AV), relying on two distance measures: PDA (Positive Distance from Average) and NDA (Negative Distance from Average). The best alternative is the one with the greater positive distance from the mean (PDA) compared to the negative distance from the mean (NDA). As a result, the EDAS method provides a fairly robust solution, free from the outlier effect and the problem of rank reversal and fluctuations in decision-making [69]. The algorithm for this method is as follows:
-
To initiate the (initial) decision matrix (Equation (1)),
-
To calculate the value of the average solution based on all evaluation criteria,
A V = A V j 1 × m
A V j = i = 1 n x i j n
-
To calculate the value of PDA and NDA based on the value of the average solution (AV),
P D A = P D A i j n × m
N D A = N D A i j n × m
where for stimulants
P D A i j = m a x 0 , x i j A V j A V j
N D A i j = m a x 0 , A V j x i j A V j
and for destimulants
P D A i j = m a x 0 , A V j x i j A V j
N D A i j = m a x 0 , x i j A V j A V j
If PDA > 0, then the corresponding NDA = 0, and if NDA > 0, then PDA = 0 for the alternative with respect to the given evaluation criterion.
-
To determine weighted sums of PDA and NDA for all alternatives:
S P i = j = 1 m w j P D A i j
S N i = j = 1 m w j N D A i j
where wj is a weight of j-th criterium.
-
To normalize SP and SN values, according to Equations (19) and (20),
N S P i = S P i m a x i S P i
N S N i = 1 S N i m a x i S N i
-
To determine the Appraisal Score (ASi) index for each alternative,
A S i = 1 2 N S P i + N S N i
where 0 ≤ A S i ≤ 1. The alternative having the highest value A S i is the most favorable alternative.

3.2.3. Complex Proportional Assessment (COPRAS) Method

The Complex Proportional Assessment (COPRAS) method makes it possible to evaluate the values of maximizing (stimulant) and minimizing (destimulant) indicators, the influence of which is considered separately on the results obtained. The algorithm for using this method is as follows:
-
To initiate the (initial) decision matrix (Equation (1)),
-
To determine the normalized decision matrix,
r i j * = r i j i = 1 m r i j
-
To determine the weighted decision matrix (23),
r i j ^ * = r i j * · w j
-
To determine the maximizing or minimizing index of each criterion given its negative or positive mode,
S + i = j = 1 g r i j * ^ ; i = 1 , , m
S i = j = 1 g r i j * ^ ; i = 1 , , m
where g indicates the number of positive attributes and n represents the number of negative attributes, and Si describes the maximizing and minimizing indices of i-th attribute, according to its type.
-
To calculate the relative importance value (Qi) of each alternative (26),
Q i = S + i + min i S i i = 1 m S i S i i = 1 m min i S i S i
-
To choose the best alternative,
Q m a x = max i Q i ,   i = 1 ,   2 . n
-
To determine the performance index for each alternative (the performance index). The performance index is 1 for the alternative that is best:
Q t = Q i Q m a x

3.2.4. Equal Weights Method

The equal weights method assumes that all evaluation indicators are equally important when there is no empirical or statistical evidence to suggest differential weighting values [70,71]. The weights in this method are determined based on the following course of action (29):
w j = 1 n   j 1 ,   2 , , n
where wj is the value of the weight of individual indicators, and n is the number of indicators.

3.2.5. Standard Deviation Method

The standard deviation method focuses exclusively on a mathematical approach that describes a measure of variation in the values of evaluation criteria. This method bears some similarity to the entropy method in that both assign smaller weights to criteria with similar values for different alternatives [71,72]. The weights in this method are determined based on the following course of action:
-
To initiate the (initial) decision matrix (Equation (1)),
To calculate the standard deviation ( σ j ) for each evaluation criterion in the decision matrix according to Equation (30),
σ j = i = 1 m X i j X j ¯ 2 m   i 1 , 2 , , m ; j 1 , 2 , , n
-
The determined standard deviation values are then used to calculate the criteria weights (wj) according to Equation (31):
w j = σ j j = 1 n σ j

3.2.6. Criteria Importance Through Intercriteria Correlation (CRITIC) Method

The CRITIC method makes it possible to obtain objective values for the weights of the evaluation criteria. In this method, the weights are determined by the intensity of the contrast and conflict evaluation of the decision problem. The contrast is determined by the standard deviation, and the conflict is determined by the correlation coefficient between the evaluation criteria. The weight values are obtained by quantifying the inside information for each evaluation criterion. Larger weights are assigned to those evaluation criteria that have high values of standard deviation and, at the same time, low correlation with other criteria [73]. The steps for determining the indicator weights in the CRITIC method are as follows:
-
To initiate the (initial) decision matrix (according to Equation (1));
-
To create a normalized decision matrix,
Normalization of criteria that are benefits follows this equation:
r i j = x i j min j x i j max j x i j min j x i j
Normalization of criteria that are costs follows this equation:
r i j = max j x i j x i j max j x i j min j x i j
-
To calculate standard deviation (SD) values for each criterion in the normalized decision matrix,
S D = i = 1 n r i j r i j ¯ n 1
To calculate correlation coefficients ( r j k ) between the criteria of the normalized decision matrix,
r j k = i = 1 n r i j r i j ¯ r i j r i j ¯ i = 1 n r i j r i j ¯ 2 i = 1 n r i k r i ¯ k 2
To calculate the objective weights ( w i j ),
w i j = C j i = 1 n C j
in which
C j = σ j i = 1 n 1 r j k
where Cj is a measure of the information content of the j-th criterion, σj is standard deviation calculated from the normalized values of the j-th criterion, and rjk is the correlation coefficient between the j-th and k-th criteria.

3.2.7. The Procedure for Determining the Sustainable Energy Security Index

All assessment indices obtained from the individual MCDM methods (i.e., COPRAS, EDAS, MAIRCA) were subsequently subjected to a normalization procedure in accordance with Equations (38) and (39). The purpose of this procedure was to standardize their values and enable comparison of the results obtained from these methods. The process followed the procedure below:
-
If the assessment index is a stimulant, then
A S i j = x i j m i n x i j m a x x i j m i n x i j
-
If the assessment index is a destimulant, then
A S i j = m a x x i j x i j m a x x i j m i n x i j
where ASij is the assessment index in the applied MCDM method.
This normalization allowed the results to be brought to a common scale, eliminating differences arising from varying units of measurement and value ranges used in individual methods. As a result, consistent and comparable outcomes were obtained, enabling further analysis and the identification of coherent trends and differences in assessments stemming from the application of different MCDM approaches.
Subsequently, following the normalization process, the Sustainable Energy Security Index (SESI) was calculated for each CEE country using the Hurwicz criterion, with a decision-making optimism level set at 0.5 (α = 0.5). This procedure ensured methodological consistency and allowed the final results to be obtained in the form of normalized indices, reflecting the relative differences between the studied countries in the context of sustainable energy security.
The SESI values for each CEE country for every year under review were ultimately determined using Equation (40):
S E S I = α × max A S i j + ( 1 α ) × min A S i j
where SESI is the Sustainable Energy Security Index, α is the coefficient of optimism (set at 0.5), max A S i j is the highest value of the normalized assessment index obtained from MCDM methods, and min A S i j is the lowest value of the normalized assessment index obtained from MCDM methods.
Based on the SESI values, the levels of CEE countries in terms of sustainable energy security were determined. This evaluation entailed the application of a statistical metric known as quantiles. Among the quantiles, the most prevalent measure utilized included the first quartile (bottom), the second quartile (median), and the third quartile (top). Using the quartile division, the following levels of sustainable energy security were proposed:
Class 1: High level of sustainable energy security. Countries classified in this group exhibit the best performance (in terms of SESI values), indicating a high level of sustainable energy security. These countries are positioned in the third quartile ( Q 3 ), representing the top 25% of results. The values for this class are calculated using the formula
Q 3 = x 3 + 3 N 4 i 1 k 1 n i n Q 3 i Q 3
Class 2: Medium level of sustainable energy security (safety). This class includes countries that achieve a moderate level of sustainable energy security. They are positioned in the second quartile ( Q 2 ), which corresponds to the range from 25% to 50% of results. The values for this class are calculated using the formula (42)
Q 2 = M e = x M e + N 2 i 1 k 1 n i n M e i M e
Class 3: Warning level of sustainable energy security (warning). Countries in this class are placed in the bottom quartile ( Q 1 ), meaning they belong to the 25% of countries with the lowest SESI values. The values for this class are calculated using the formula (43)
Q 1 = x Q 1 + N 4 i 1 k 1 n i n Q 1 i Q 1
where M e = x N + 1 2 ; Q 1 , Q 2 (Me), Q 3 —first quartile, second quartile (median), and third quartile, respectively; x Q 1 , xMe, x Q 3 —the lower limits of the ranges in which the first, second (median), and third quartiles are located, respectively, i 1 k 1 n i is the sum of the counts from the first class preceding the one in which the first quartile, median, and third quartile are located, respectively, n Q 1 , nMe, n Q 3 —the numbers of the intervals in which the first quartile, median, and third quartile are located, respectively—and i Q 1 , iMe, i Q 3 —intervals of the intervals in which the first quartile, median, and third quartile are located, respectively.

4. Results

4.1. Assessing Sustainable Energy Security

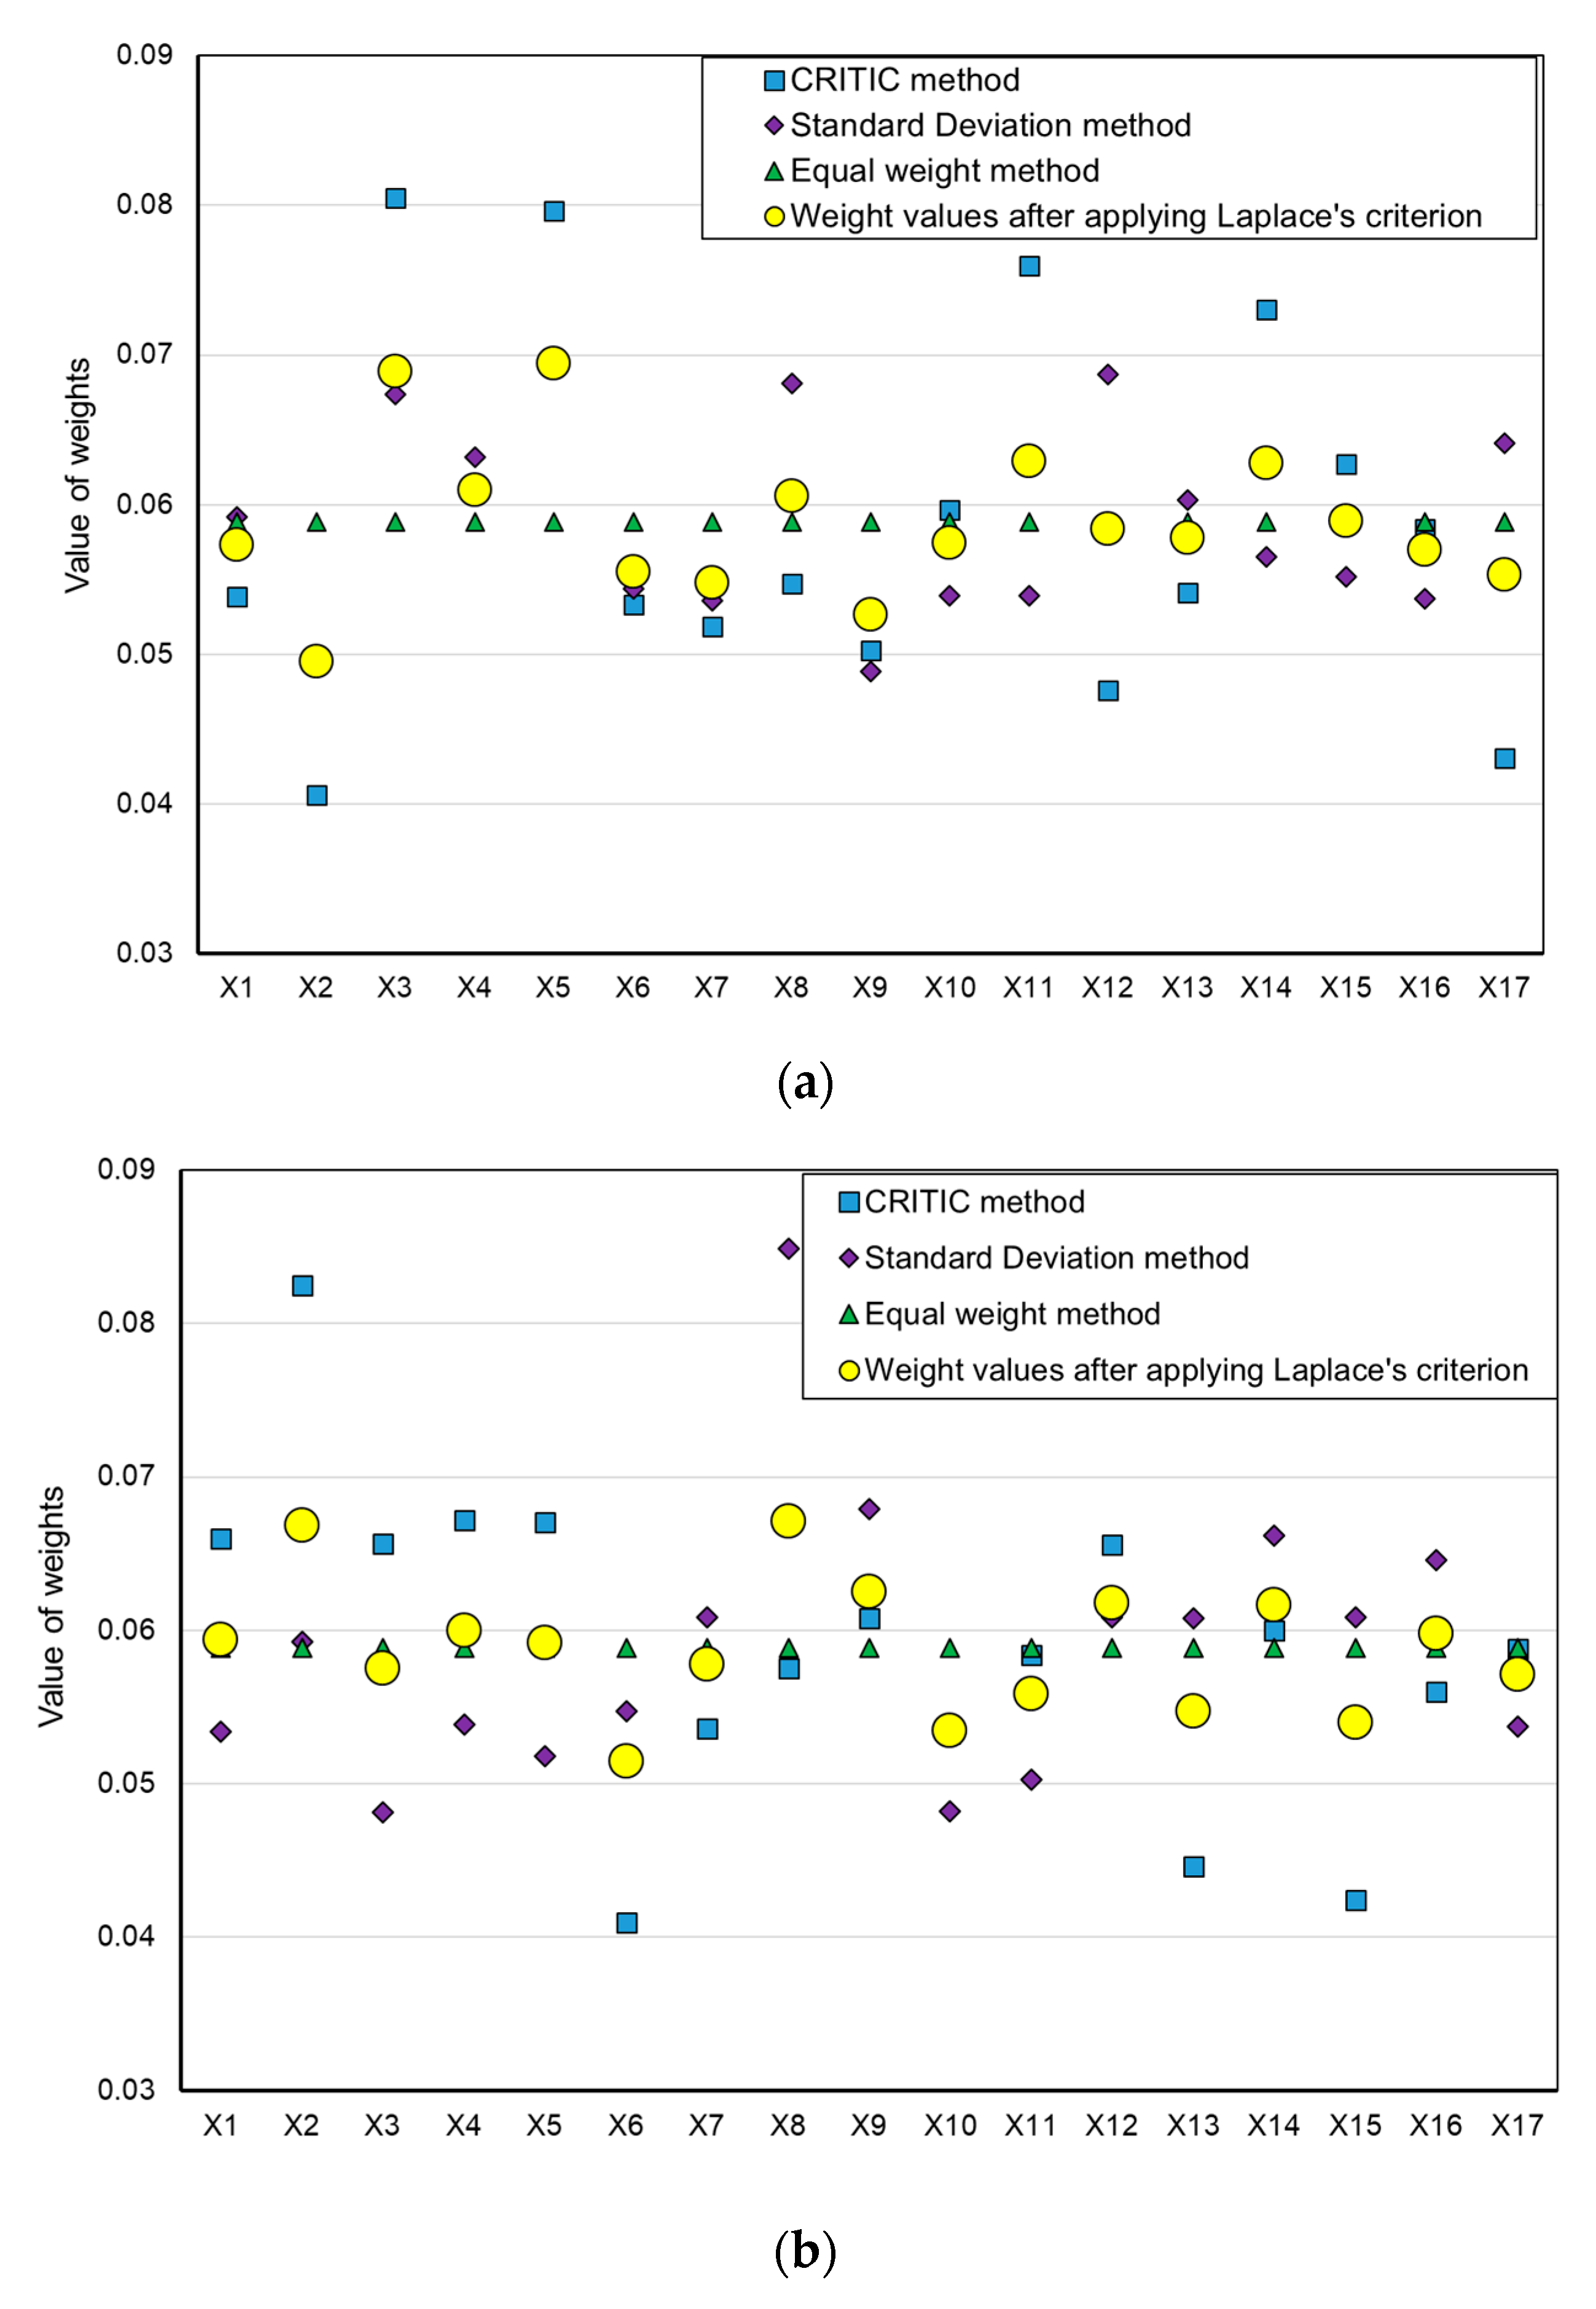
In the initial phase of this study, computations were conducted to ascertain the weights of indicators, serving as criteria for evaluating sustainable energy security. These weights were derived using the CRITIC, Equal weight, and standard deviation methods and were based on Laplace’s criterion, as outlined in the methodology (Section 3). The values of these weights were determined separately for each year under examination. Exemplary calculation outcomes for 2007 and 2021 are outlined in Figure 2.
The final values of the indicator weights determined for all the years studied are shown in Table 2.
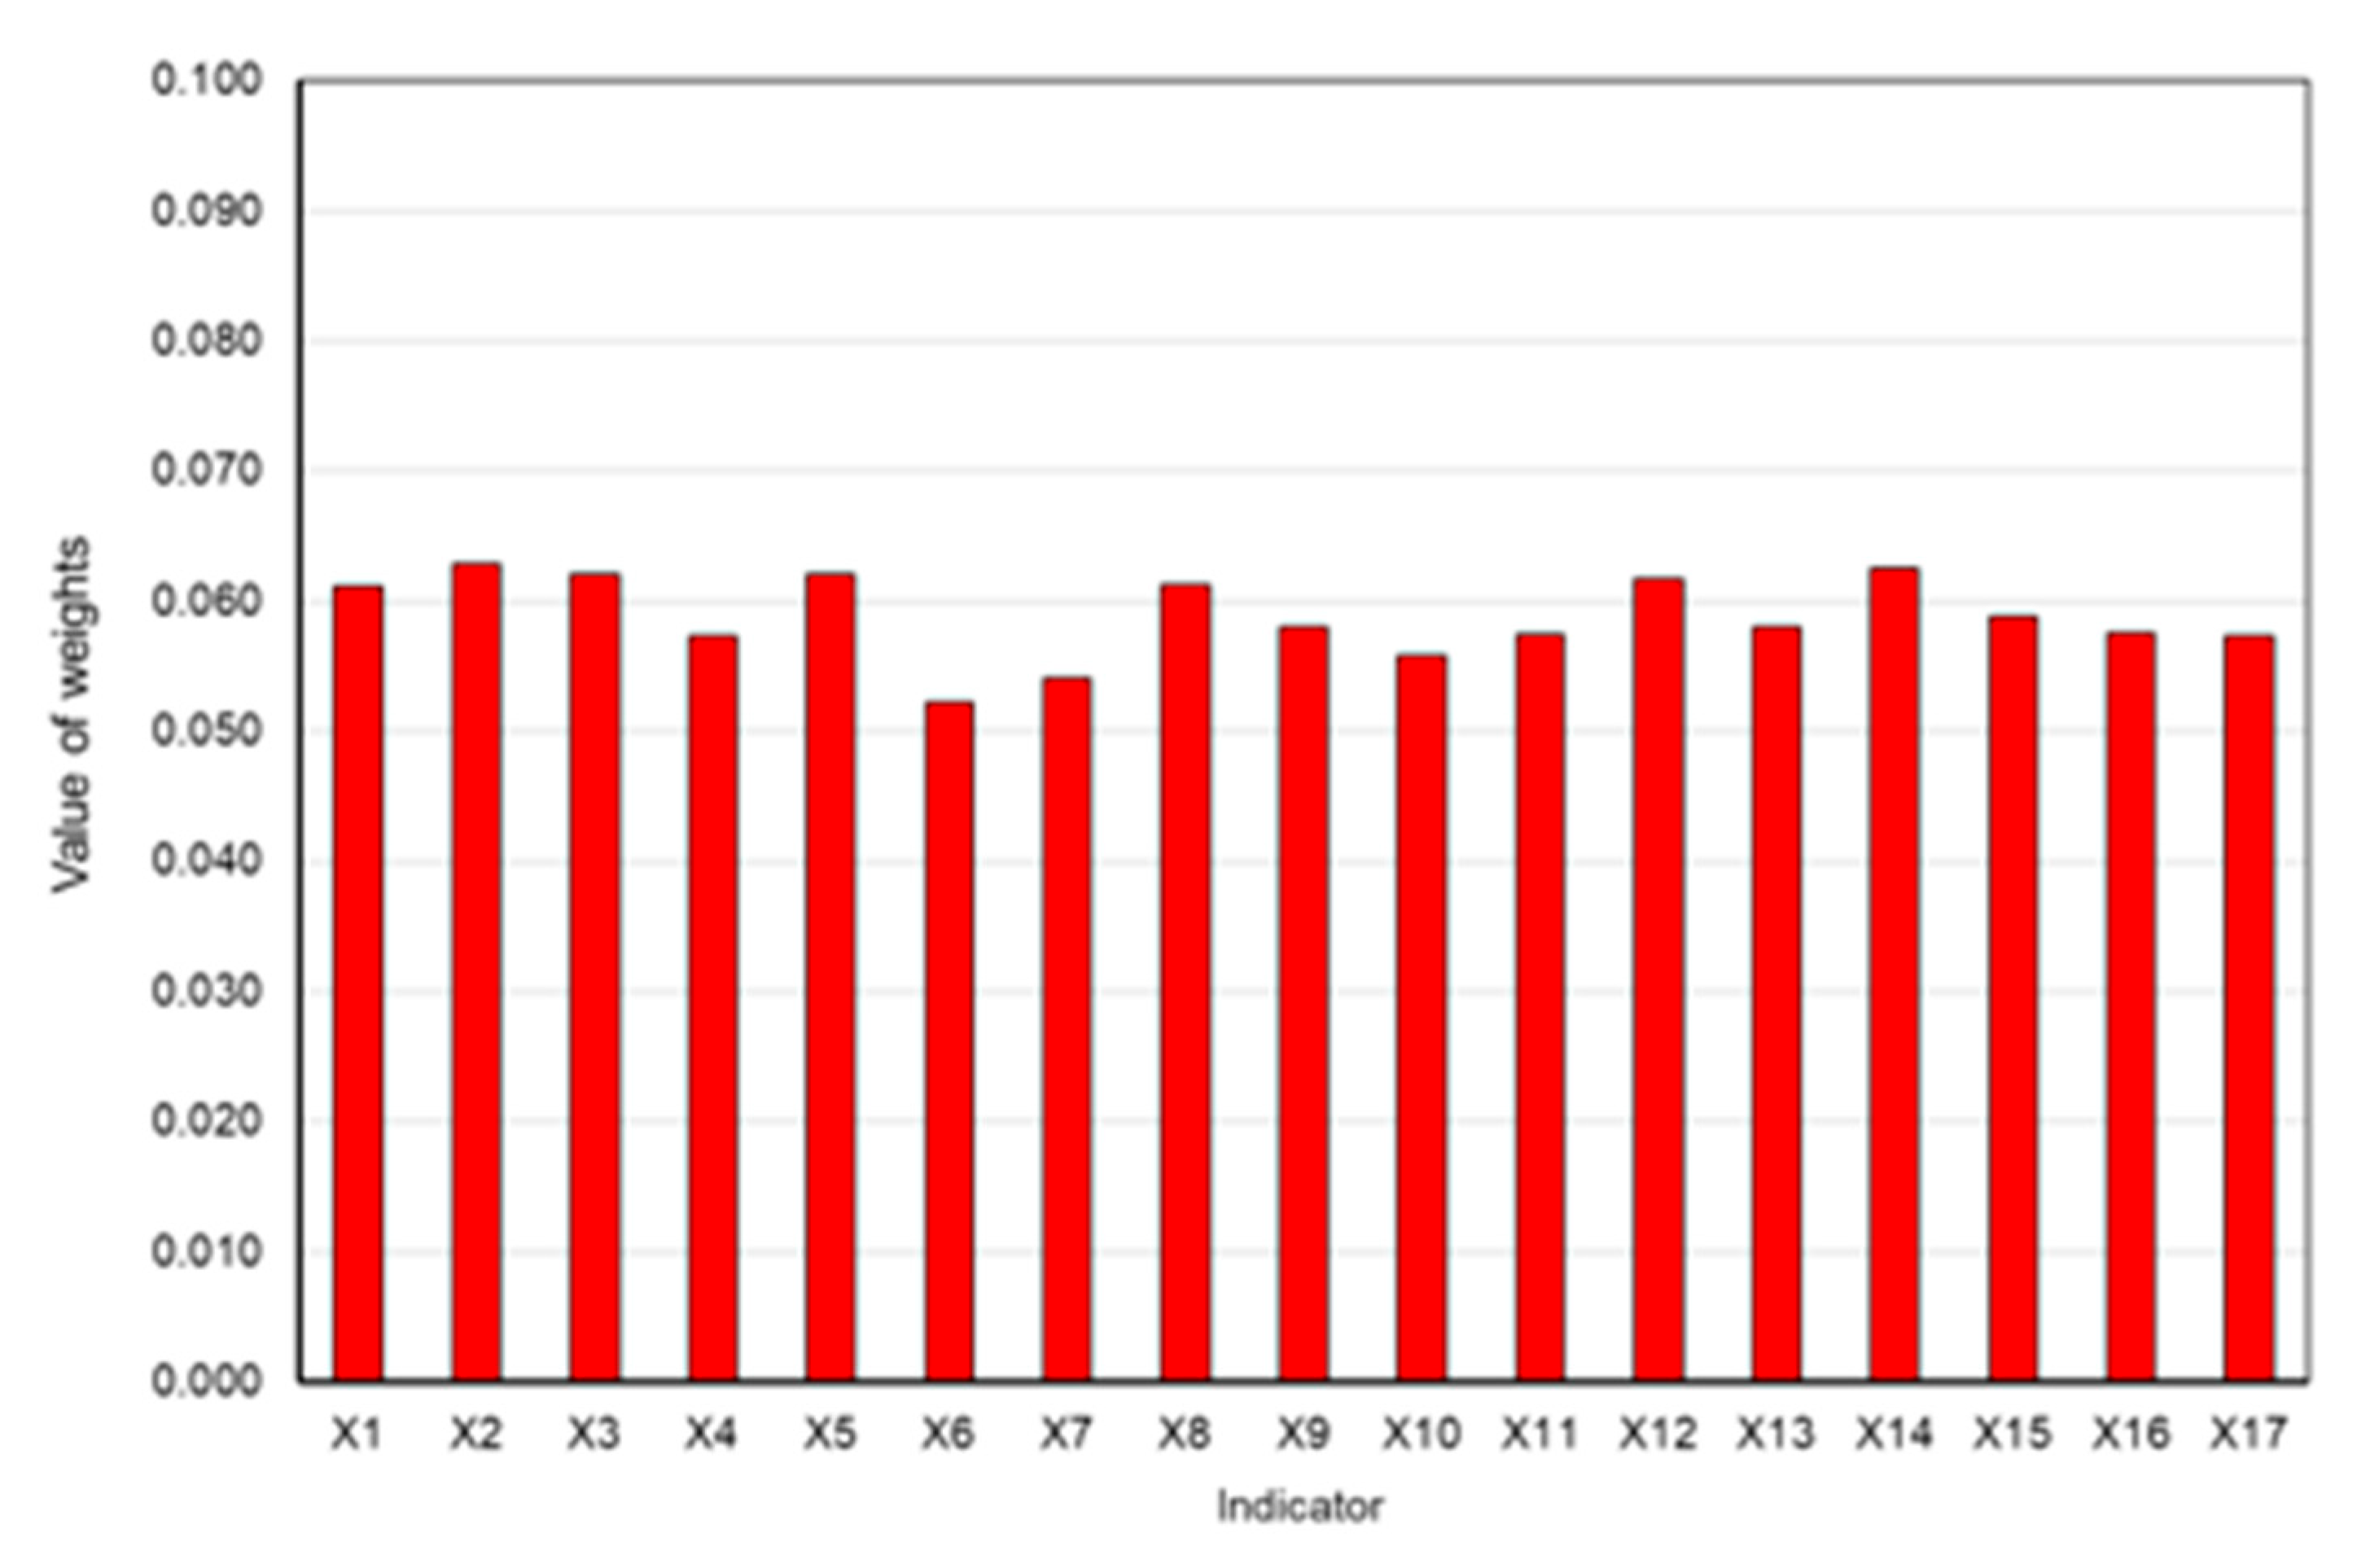
The computed values of the indicator weights (Table 1) exhibit minimal variability. None of the years studied show a coefficient of variation exceeding 10%. Hence, for the ultimate computations, the average values over the entire study period were utilized (Figure 3). This methodology, characterized by a low coefficient of variation, mitigates the impact of varying indicator weight values across different years on the final calculation results.
The findings reveal that the indicators final energy consumption per capita (X2), energy imports dependency (X3), and energy sufficiency (X5) from the energy indicators group garnered the highest weights successively. Conversely, the share of non-renewables in energy mix (X6), also belonging to the energy indicators group, obtained the lowest weight values.
Table 3 provides a summary of the indicator weights for the dimensions analyzed in this study, concerning the assessment of sustainable energy security across the studied CEE countries’ population.
Based on the calculations, it can be concluded that energy and economic indicators are the most important dimensions of the assessment. The environmental dimension is the third most important for assessing sustainable energy security, and the social dimension of the assessment took the last place.
In the subsequent phase of this study, the Sustainable Energy Security Indexes (SESIs) of the CEE countries were computed for the period between 2007–2021. This computation involved employing the indices designated for this study and the corresponding weight values. The calculations adhered to the methodology outlined in Section 3, employing a multi-hybrid approach based on the COPRAS, EDAS, and MAIRCA methods, alongside the Hurwicz criterion. Within each of these methods, method-specific indices were derived. Following a normalization process and application of the Hurwicz criterion, the final SESI values were determined for each country.
Table 4 delineates the outcomes of the sub-indices calculation, their normalization (for each method employed), and the resultant SESI values for 2021 across the CEE countries under study, alongside their respective rankings. Additionally, 
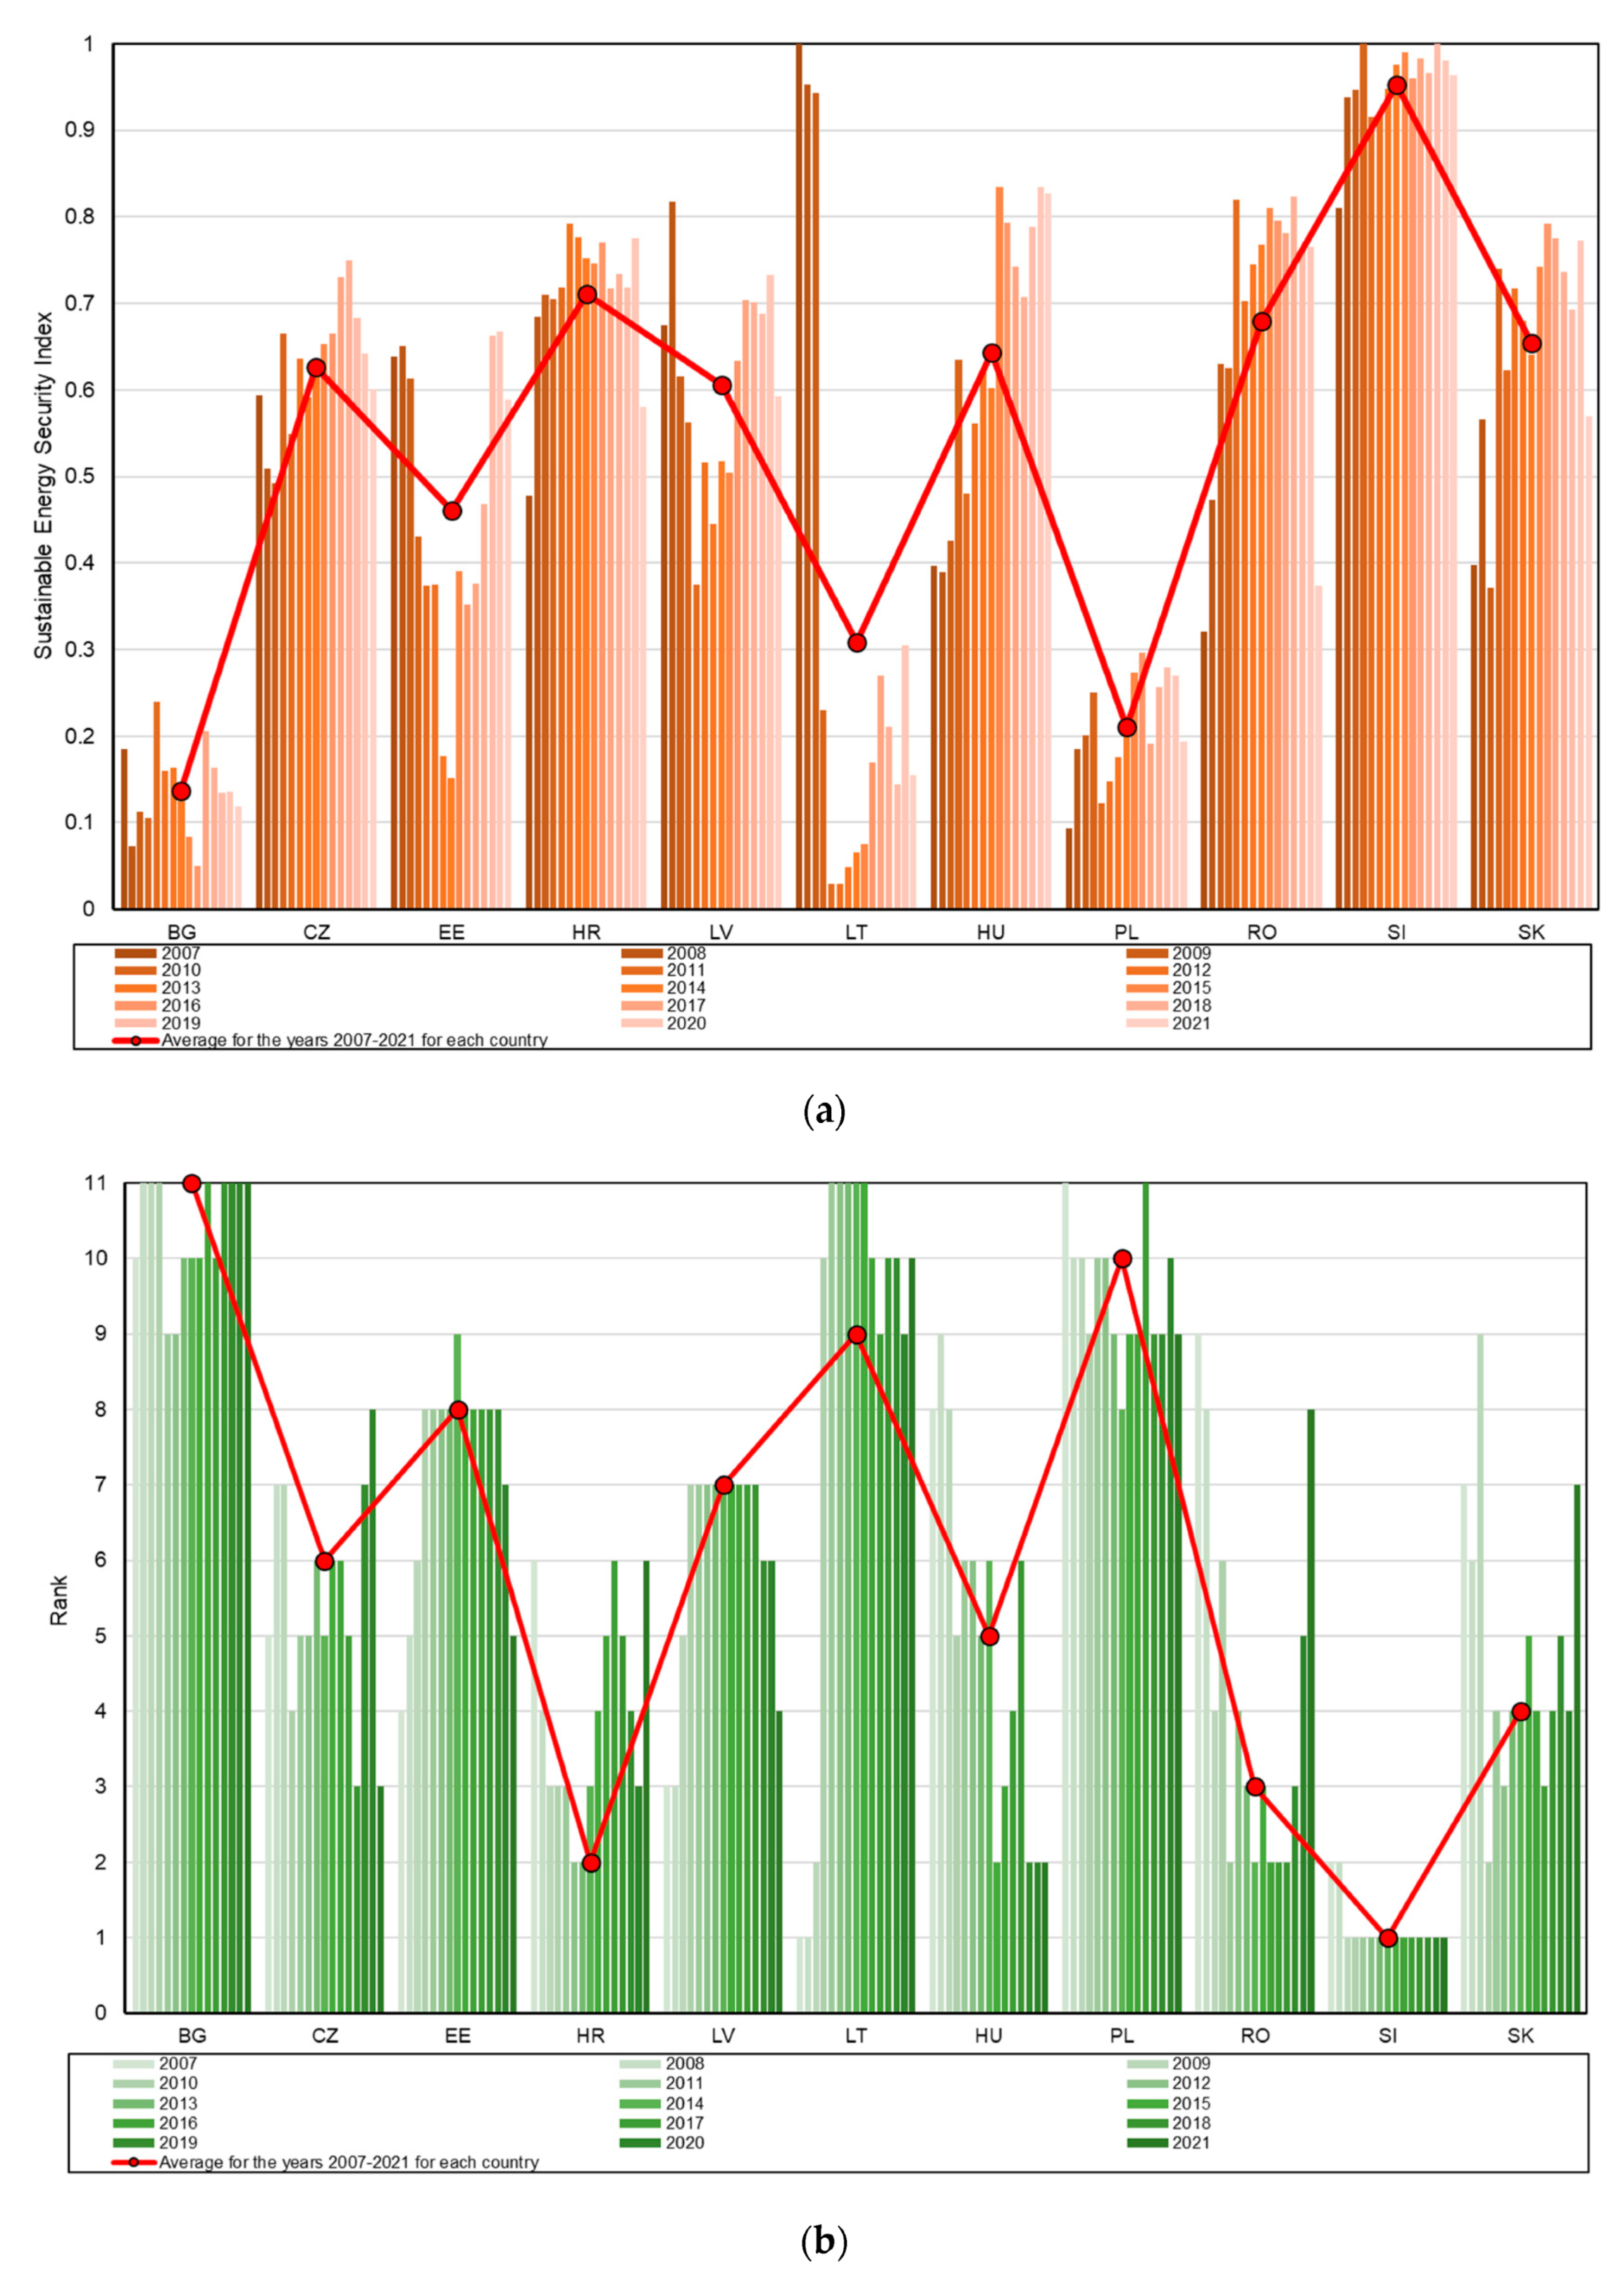
Figure 4 presents the results of the sub-indices and normalized indices calculation, along with the SESI values for the CEE countries from 2007 to 2021, accompanied by their rankings.
The findings displayed in Table 4 reveal notable disparities in the ranking positions of individual countries, contingent upon the survey method utilized to calculate the method-specific index values. Romania stands as the sole country retaining the same ranking position for 2021 across all methods employed. Conversely, slight discrepancies of one ranking position were observed for countries like Bulgaria, Lithuania, Hungary, and Slovakia. Notably, Croatia exhibited a variance of four positions, ranking seventh according to the EDAS method and third according to the MAIRCA method. Hence, to ascertain the final ranking positions based on the index values, employing the Hurwicz criterion with an optimism coefficient set at α = 0.5 was deemed a prudent approach. The normalization of method-specific indices was conducted initially, followed by their utilization to determine the Sustainable Energy Security Index values using the Hurwicz criterion. The outcomes of these calculations are shown in Figure 4.
A comprehensive analysis of the Sustainable Energy Security Index (SESI) values for CEE countries from 2007 to 2021 reveals significant variability. Lithuania secured the highest values in 2007 and 2008, with Slovenia dominating from 2009 to 2021. Lithuania, transitioning from a leading position in 2007 and 2008 to a vice-leading position in 2009, eventually landed in ninth place by 2021. A stark decline in energy security ensued between 2009 and 2010, marked by a SESI index plunge from 0.943 to 0.229, consequently plummeting from second to tenth place. This deterioration stemmed from the closure of Lithuania’s Ignalina nuclear power plant, a critical component of its energy infrastructure. The closure, stipulated in Lithuania’s EU accession treaty, resulted in diminished energy self-sufficiency and heightened dependence on energy imports.
In contrast, Slovenia emerges as the most economically advanced among the CEE countries, boasting an energy self-sufficiency exceeding 50%. The country’s energy landscape leans heavily on renewable and nuclear sources, both zero-emission in terms of greenhouse gas emissions, which significantly bolsters energy security. Consequently, Slovenia exhibits relatively low per capita greenhouse gas emissions within the assessed group of countries, alongside a diminished reliance on imported energy sources. Notably, Slovenia’s energy mix demonstrates remarkable diversity, as evidenced by its low concentration index value of 0.23, second only to Slovakia’s 0.22 throughout the study period.
Conversely, Bulgaria and Poland consistently rank among the lowest in terms of the Sustainable Energy Security Index (SESI), failing to surpass a value of 0.3. Bulgaria faces several challenges contributing to its persistently low rating. Primarily, the country grapples with the lowest per capita GDP values among the assessed nations, severely constraining the pace of energy transition. Despite efforts to integrate renewable energy, Bulgaria’s environmental impact, measured by per capita greenhouse gas emissions, has marginally declined from 9.1 tons of carbon dioxide equivalent in 2007 to 7.9 in 2021. Nevertheless, Bulgaria continues to contend with widespread energy poverty, affecting a significant portion of its population, with an average exceeding 14% throughout the 2007–2021 period.
On the contrary, Poland’s energy landscape remains heavily reliant on conventional sources, particularly coal, owing to historical circumstances and economic legacy. Following World War II, coal emerged as virtually the sole available energy resource in Poland, shaping the country’s economy around this raw material. Despite ongoing transitions, coal continues to wield significant influence in Poland’s energy mix, contributing to the highest per capita greenhouse gas emissions and energy sector emissions among the assessed countries. As Poland gradually shifts away from domestic coal, however, its reliance on imported energy resources escalates. Over the period from 2007 to 2021, Poland’s energy self-sufficiency witnessed a notable decline, plummeting from 78% to slightly over 58%. Concurrently, the country’s energy mix diversification has improved, with the concentration of energy sources dropping from 0.4 in 2007 to 0.29. Nonetheless, Poland contends with elevated energy prices, while its GDP per capita positions the nation at the bottom of the wealth hierarchy among CEE countries, posing obstacles to energy transition. Socially, Poland exhibits moderate performance in energy security indicators relative to the assessed group of countries, although the prevalence of energy poverty has significantly decreased from 10.5% in 2007 to 5.7% in 2021. Overall, Slovenia emerges as the standout performer in terms of sustainable energy security among Central and Eastern European countries throughout the analyzed period, alongside Croatia, Latvia, Romania, and Hungary. Croatia and Slovakia maintained their positions consistently, while Belgium, Estonia, and Latvia experienced marginal declines, and Romania and Slovenia saw slight advancements. Notably, Lithuania witnessed a notable decline, dropping nine positions, whereas Hungary marked the most significant improvement (see Table 5).
In the subsequent phase of this study, the ascertained values of the Sustainable Energy Security Index (SESI) were leveraged to evaluate the degree of sustainable energy security across the surveyed CEE countries between 2007–2021.
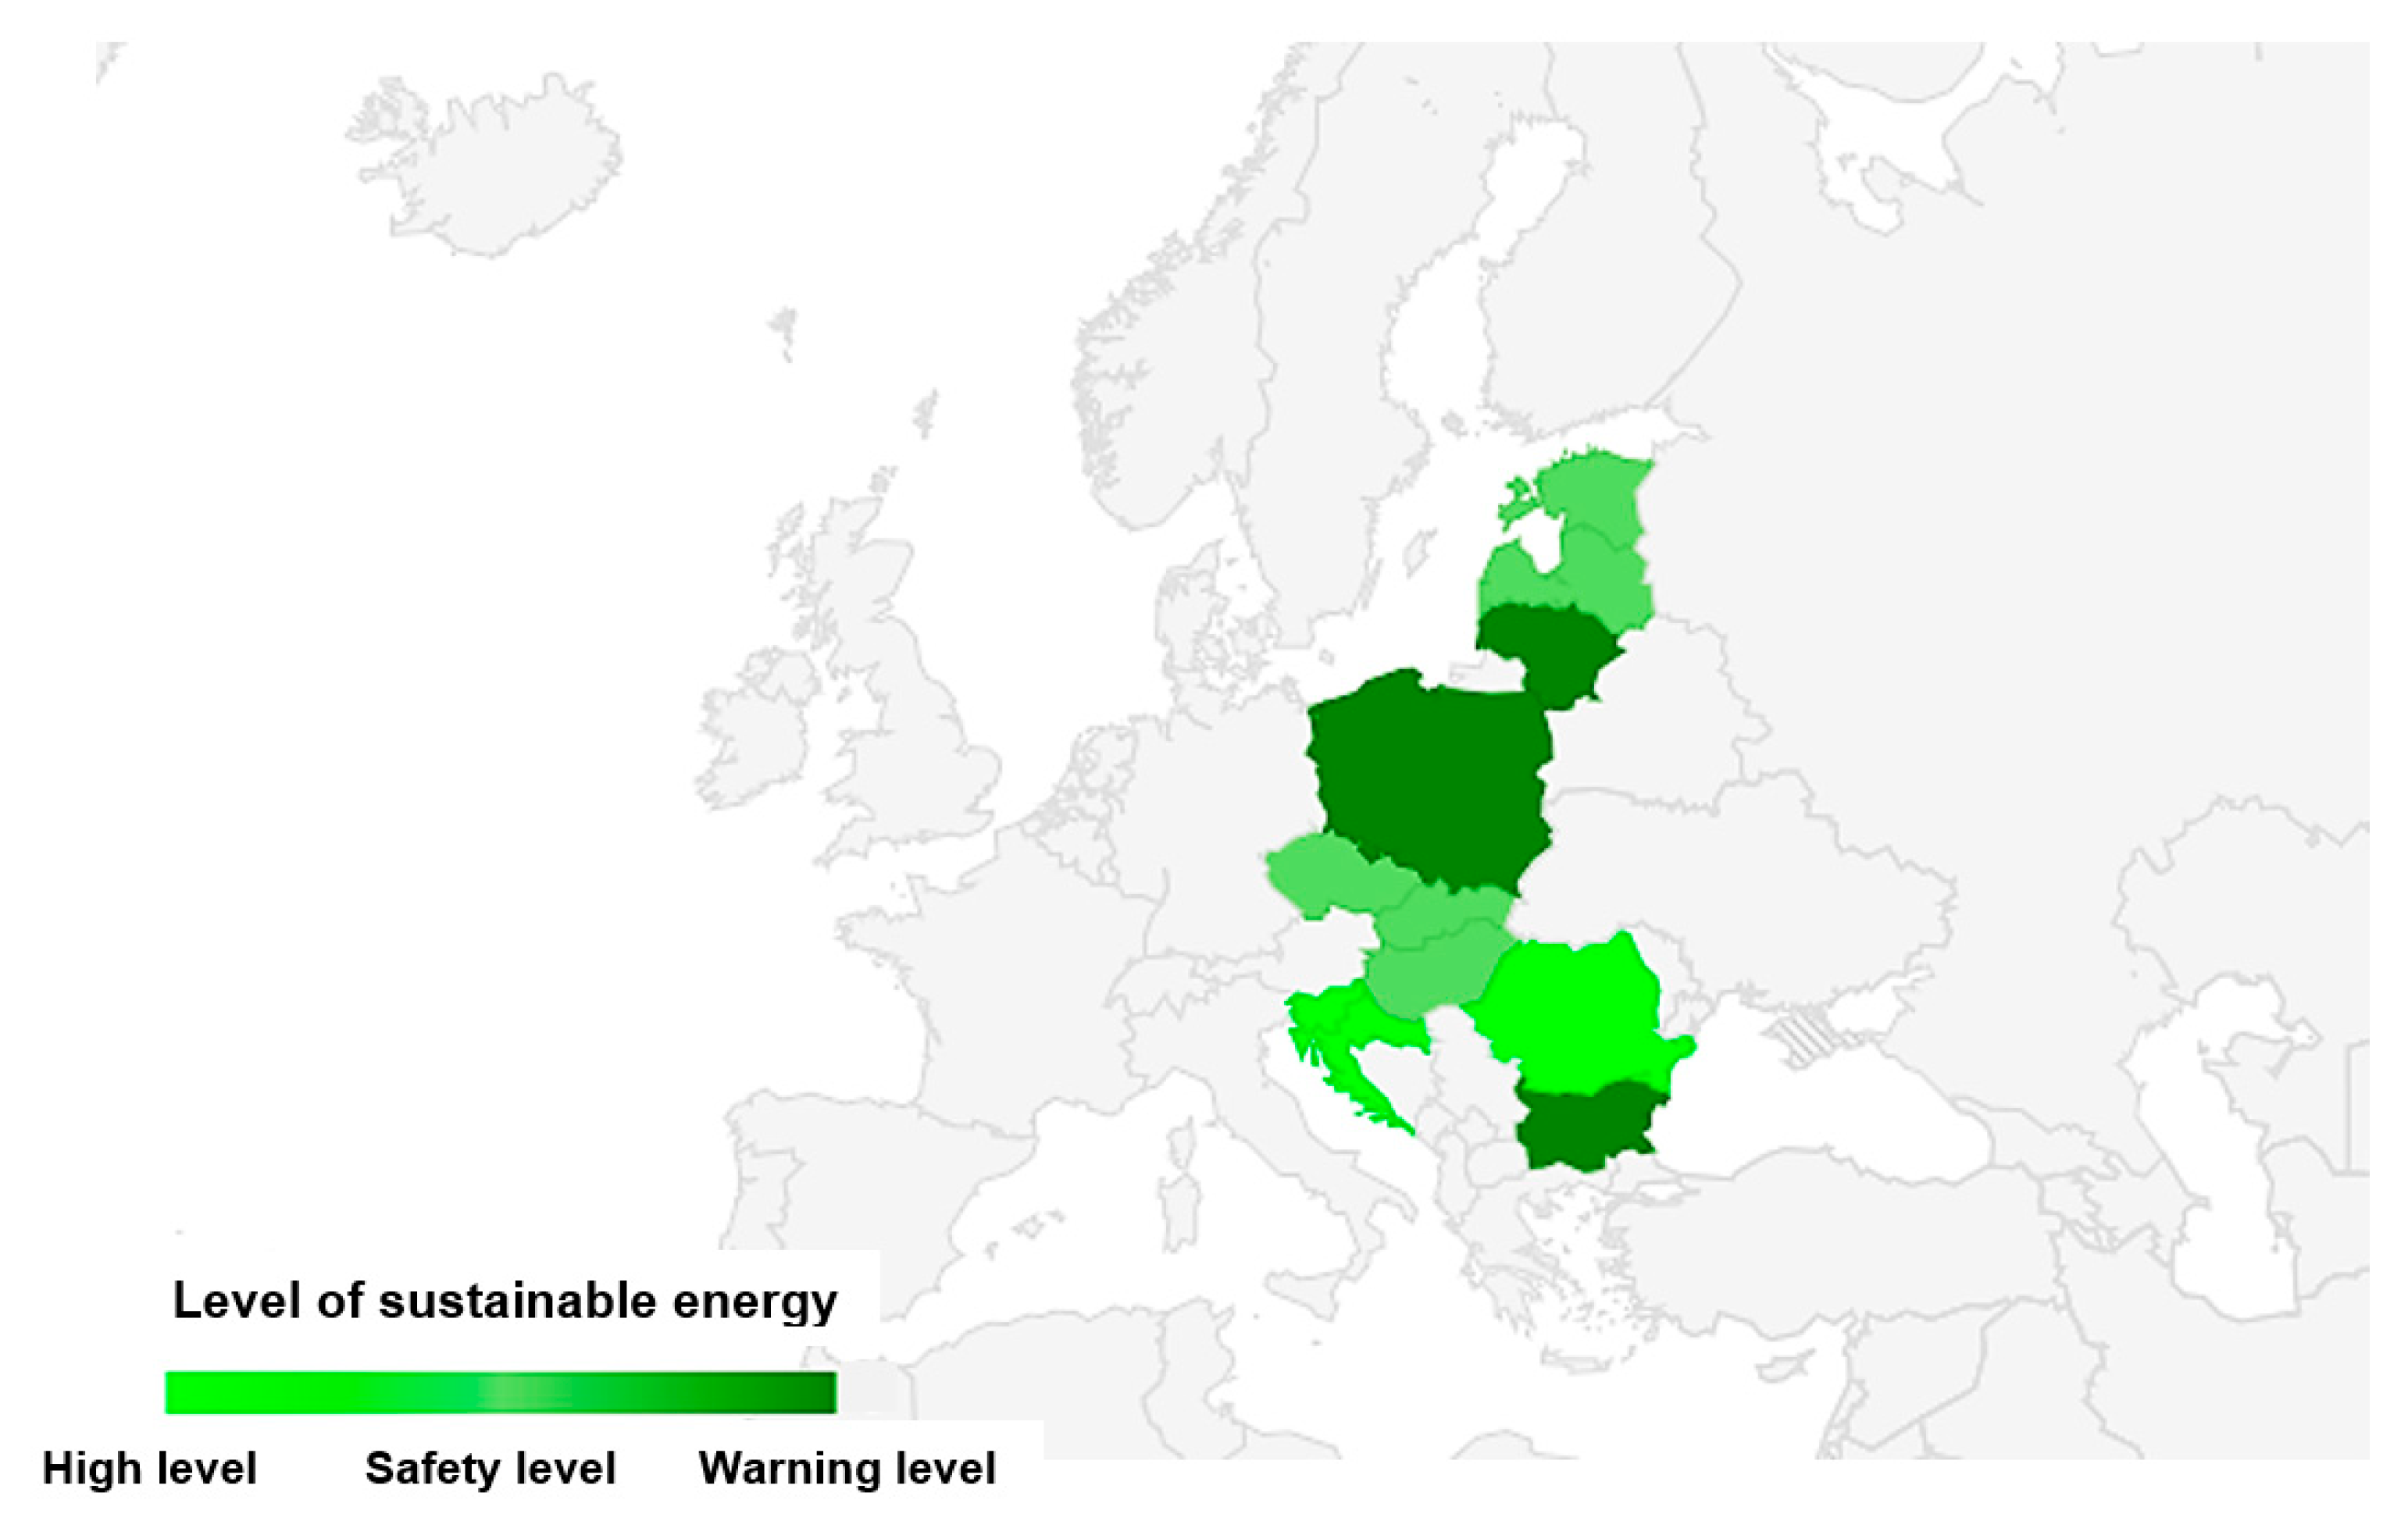
In the next stage of the research, the level of sustainable energy security in CEE countries for the years 2007–2021 was determined. The results of this analysis, conducted based on Equations (41)–(43), are presented in Table 6. This table shows the classification of the studied countries according to their level of sustainable energy security, determined based on the SESI index values.
Only Slovenia consistently attained the highest level of energy security throughout all the years covered by the analysis. Comparable levels were also observed in Lithuania and Latvia during 2007–2009, Croatia during 2009–2013 and 2020, Slovakia in 2010, Romania during 2011 and 2013–2019, Hungary during 2015and 2019–2021, and the Czech Republic during 2018 and 2021.
Conversely, Poland and Bulgaria consistently operated at a warning level for sustainable energy security throughout the entire analysis period. Lithuania also maintained this warning level from 2010 to 2021, with isolated occurrences in Romania (2007), Hungary (2008), and Slovakia (2009).
These delineated levels highlight Romania, Hungary, and Slovakia as the countries that have implemented the most effective measures in ensuring sustainable energy security and have demonstrated significant improvements in this regard.
The average level of sustainable energy security across the studied countries for the entire analyzed period is depicted in Figure 5.
Based on the obtained results, the validity of the first hypothesis can be confirmed. This analysis revealed significant variation in the levels of sustainable energy security among CEE countries. It also highlights the substantial influence of various factors on these results, such as the degree of energy infrastructure development, implementation of national policies, and the availability of renewable energy sources in individual states. Countries like Slovenia, Lithuania, and Latvia achieved higher levels of energy security, while Poland and Bulgaria consistently ranked at the warning level. This confirms the diversity in sustainable energy security levels within the region.

4.2. Assessing the Effectiveness of Energy Policy Implementation in CEE Countries from 2007 to 2021

Utilizing the determined index values of the dynamics of change of the indicators employed in this study (see Appendix A) and following the outlined research methodology (Section 3), an analysis was conducted to establish an index gauging the effectiveness of energy policy implementation in CEE countries over the long term (15 years), and to evaluate this efficacy. The yardstick for measuring the effectiveness of policy implementation was the index value representing the magnitude of changes in the indicators over the period spanning from 2007 to 2021 (see Appendix A, 
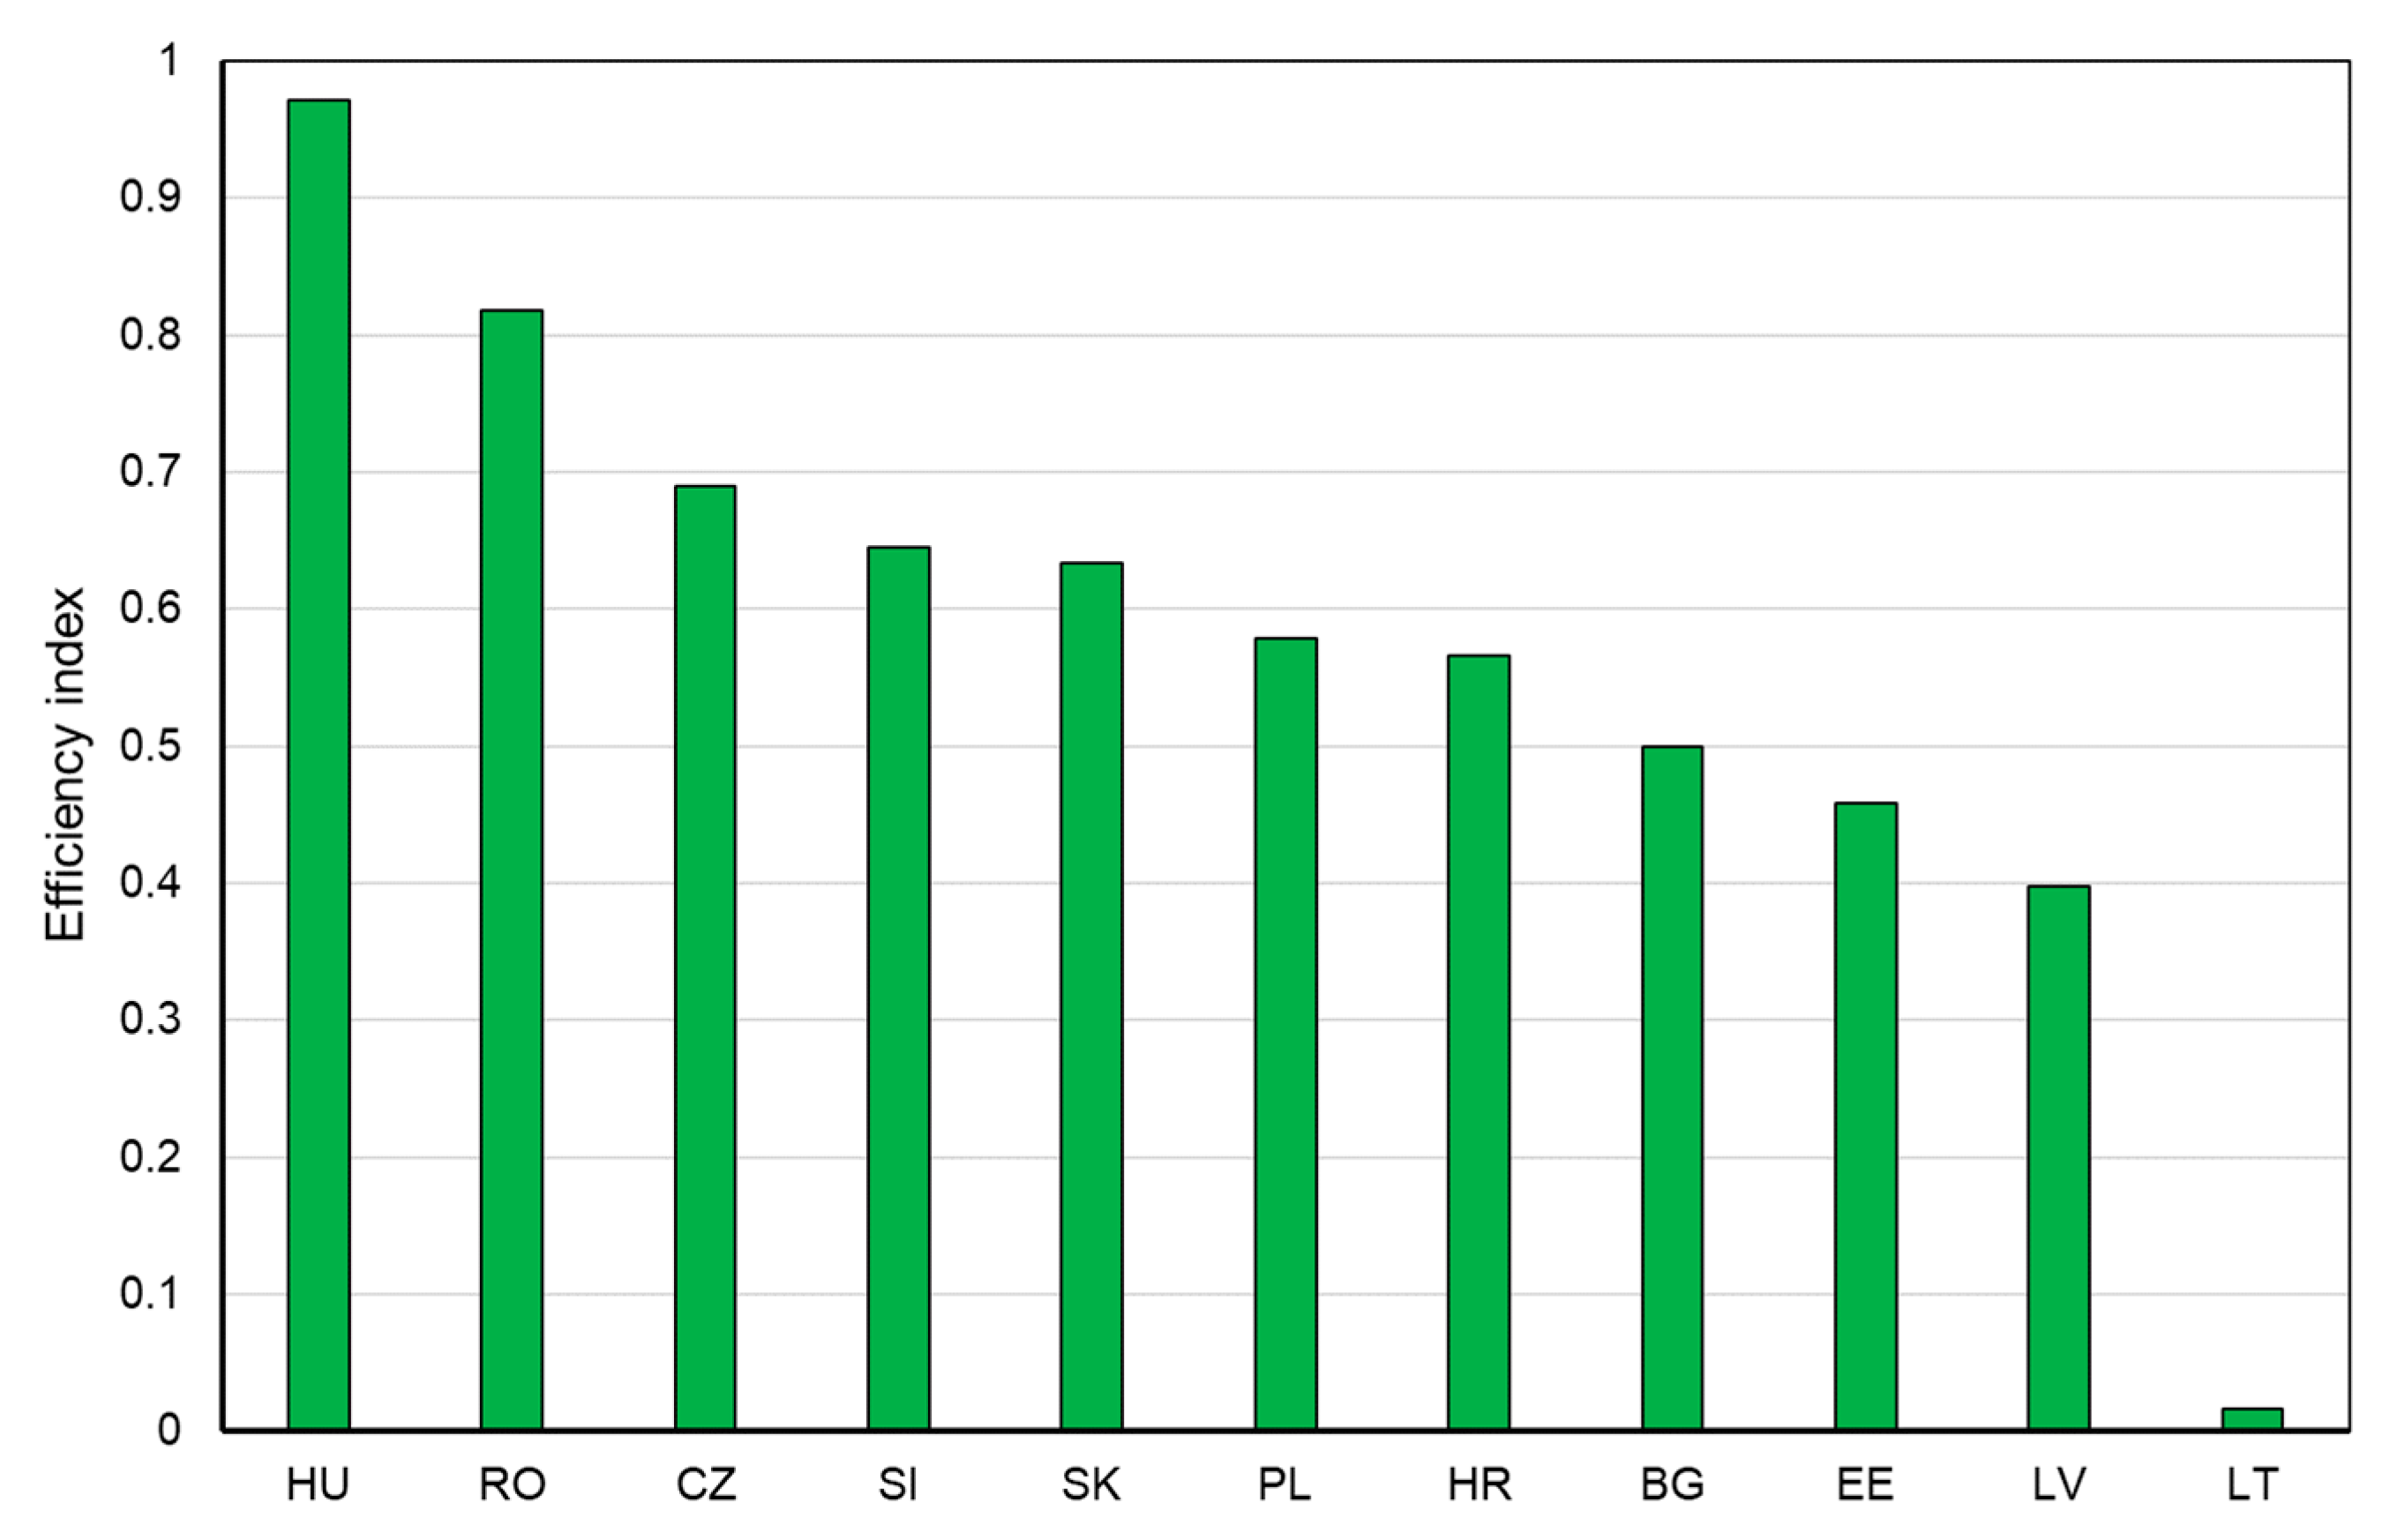
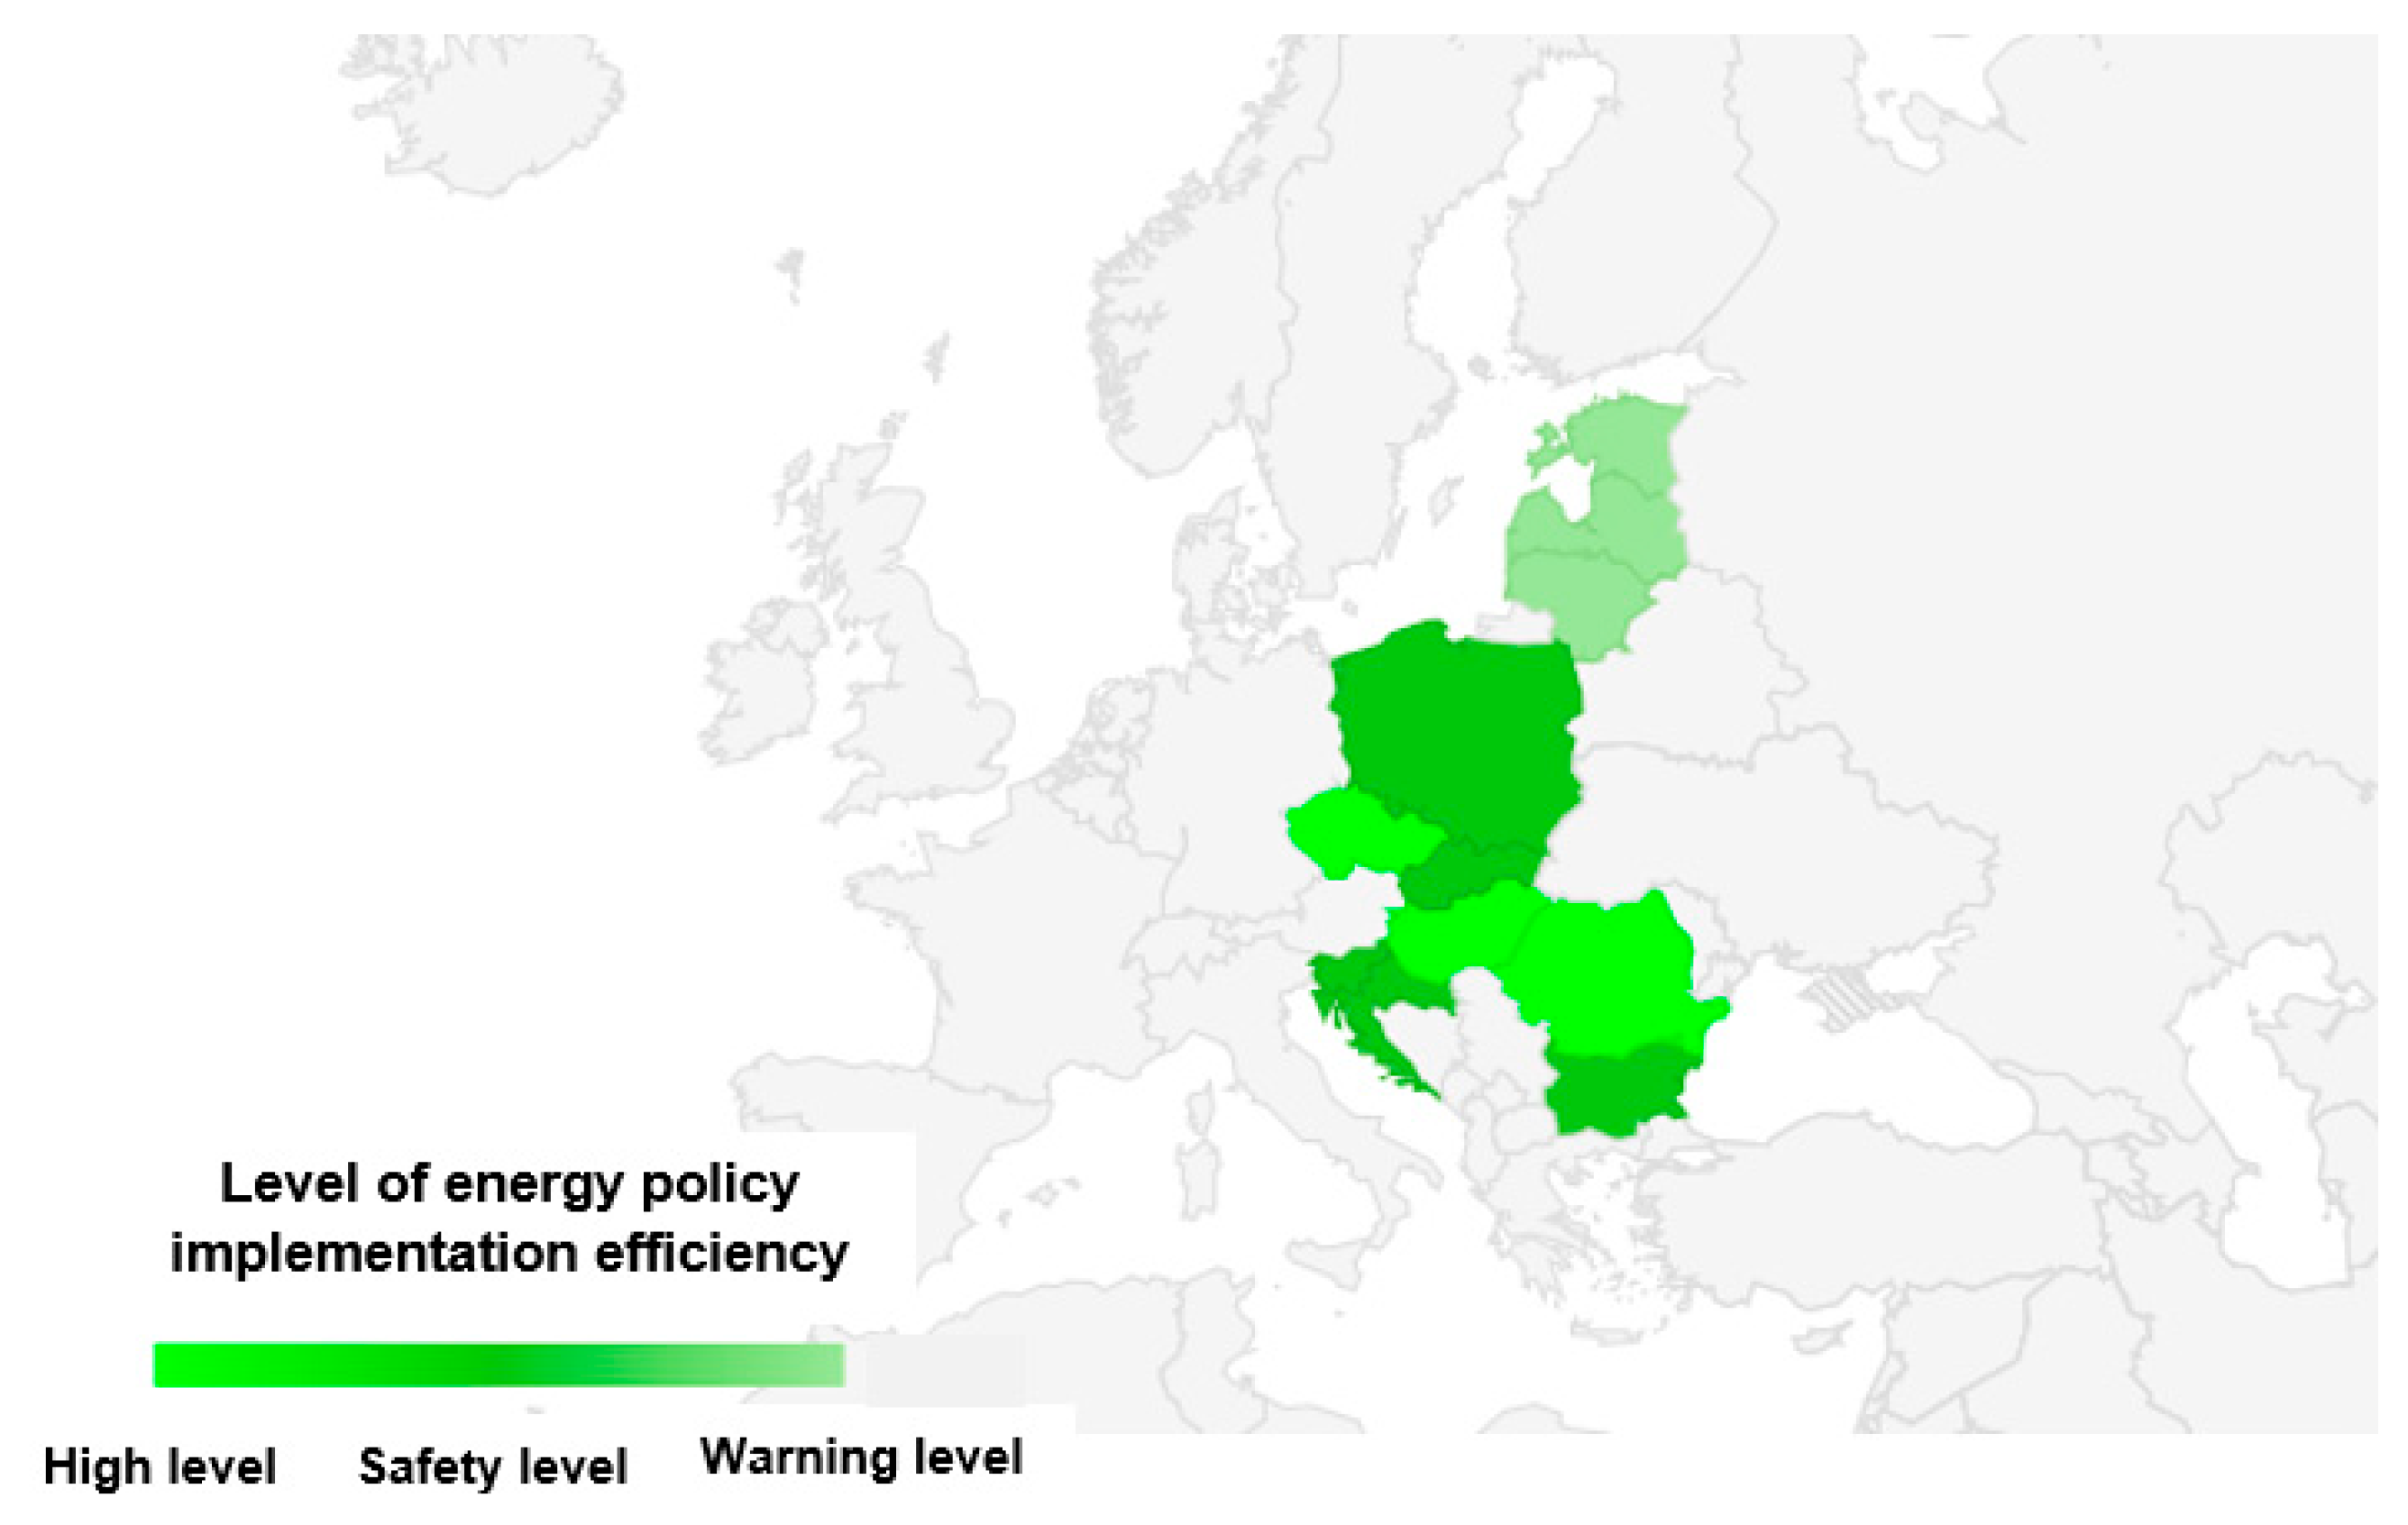
Table A1). The values of the efficiency index for energy policy implementation in CEE countries are shown in Figure 6. Meanwhile, Figure 7 illustrates the level of CEE countries in terms of energy policy implementation efficiency over a 15-year perspective.
Hungary, Romania, and the Czech Republic demonstrated the highest levels of efficiency in implementing energy policies based on the evaluation criteria outlined in this study, while Estonia, Latvia, and Lithuania exhibited the lowest levels. Slovenia, Slovakia, Poland, Hungary, and Bulgaria fell within the moderate range. This discrepancy can be attributed to the fact that countries with weaker assessment indicators at the beginning of the study in 2007 found it comparatively easier to make significant progress, such as in reducing greenhouse gas emissions and increasing the proportion of renewable energy sources in their energy mix while decreasing reliance on conventional sources.
Hungary, which attained a score of 0.971 in terms of energy policy implementation efficiency (see Figure 6), stands out among the assessed countries due to notable increases in total energy supply per capita and enhanced energy self-sufficiency. The substantial impact on this favorable outcome can be attributed to lower energy prices in 2021 compared to 2007 [63]. Hungary experienced a 23% reduction in prices for household consumers, a feat unmatched by any other surveyed country (see Appendix A, Table A1), and a 10% reduction for non-household consumers. Hungary’s energy mix features nuclear power, setting it apart from other nations that do not utilize this energy source. Concurrently, there has been a decline in the share of non-renewable energy sources in the mix alongside an increase in renewable resources. Hungary also demonstrates positive strides in CO2 reduction, evidenced by negative dynamics of change over the review period. Additionally, Hungary has made significant headway in reducing energy poverty among its citizens, trailing only behind Bulgaria, Poland, and Latvia in this aspect. Notably, Hungary has achieved the most substantial reduction in the index of excessive housing costs, which encompass energy expenses, outperforming all other studied countries in this regard. Hence, it can be inferred that the top-ranking positions were primarily influenced by energy prices, social indicators, and shifts in the energy mix impacting energy self-sufficiency.
Romania secured the second position (index value = 0.817). Notably, the country exhibited significant changes in its energy mix, marked by a 12% decrease in non-renewable sources alongside notable increases in renewable sources and nuclear energy—a commendable achievement, with a 68% increase over the 15-year period, marking the highest growth rate among the studied countries. Romania’s above-average GDP per capita growth also contributed to fostering an environment conducive to effective energy policy implementation and energy sector transformation. Additionally, Romania showcased positive strides in CO2 reduction, ranking fourth in this aspect. The noteworthy improvement in energy productivity, reflecting the value or services generated with a given energy consumption, is also noteworthy. Romania and Estonia experienced a remarkable 65% increase in this indicator, while Latvia exhibited the smallest growth at only 13%.
The Czech Republic clinched the third position in terms of energy policy implementation efficiency, securing a score of 0.690. The country excelled in transitioning its energy mix towards zero-carbon alternatives, notably augmenting the share of renewable and nuclear energy sources, resulting in a noteworthy 25% reduction in greenhouse gas emissions. Significant reductions in energy prices, particularly for non-household consumers—7% lower in 2021 compared to 2007—significantly contributed to the Czech Republic’s commendable performance. Furthermore, the country made considerable strides in reducing energy poverty, witnessing a 52% decrease in 2021 compared to 2007 [63].
Following Slovenia, Slovakia received a slightly lower rating but demonstrated commendable achievements in reducing CO2 emissions and decreasing the share of non-renewable sources in its energy mix to 11% over the study period, while concurrently increasing the share of nuclear energy. Slovakia’s GDP per capita growth rate was deemed average within the surveyed group, standing at 56% over the analyzed period.
Three countries fell within the 0.5–0.6 rating range: Poland, Croatia, and Bulgaria. While Bulgaria and Poland notably augmented the share of renewables in their energy mixes, Croatia achieved this to a lesser extent. However, Croatia initially possessed a larger share of renewables at the beginning of the analysis period, resulting in a less dramatic increase over the 15-year period compared to countries with a minimal initial share in 2007. Notably, Croatia and Bulgaria effectively reduced the share of conventional sources in their energy mixes compared to Poland. Moreover, Bulgaria managed to reduce its dependence on imported energy sources, whereas Croatia and Poland witnessed an increase in this dependence, notably soaring by nearly 60% for Poland. These countries, particularly Bulgaria and Croatia, are actively pursuing policies to curtail CO2 emissions per capita, with a negative rate of change observed over the 15-year period. Notably, Bulgaria achieved the most robust results in terms of GDP per capita growth among all CEE countries.
The next group of countries, with overall scores ranging from 0.0 to 0.5, encompassed Estonia, Latvia, and Lithuania, collectively known as the Baltic States. These nations witnessed a significant increase in energy prices for both household and non-household consumers over the 15-year period. Estonia and Latvia notably boosted energy self-sufficiency, while Lithuania experienced a significant decrease, primarily due to the closure of its last nuclear power plant in 2009 and a consequent rise in energy dependency between 2007 and 2021. Consequently, there was a surge in the share of energy derived from conventional sources in Lithuania’s energy mix, nearly 1.5 times that of renewables. Conversely, Estonia achieved near-complete independence from imported energy sources during this period, with the share of renewable energy in its mix nearly tripling. Estonia and Lithuania witnessed a reduction in available energy per capita between 2007 and 2021. While Estonia also decreased final consumption, Latvia and Lithuania saw an increase in their shares. Despite these fluctuations, all three countries exhibited commendable growth rates in GDP per capita.
However, Latvia and Lithuania experienced a notable increase in CO2 emissions per capita and GHG Intensity of Energy. While Estonia and Lithuania marginally reduced the extent of energy poverty, it is noteworthy that these countries had the lowest indicators in this regard in the initial year of analysis (2007).
In summary, countries with more favorable indicator values in 2007 faced challenges in achieving spectacular percentage increases or decreases in subsequent years—a comprehensible phenomenon. Nonetheless, the results obtained facilitate comparisons and evaluations of changes over the study period. Table 7 provides an overview of each country’s best and weakest performances in the analysis of individual indicators.
The analysis of the results presented in Table 7 shows that Central and Eastern European (CEE) countries achieve varied outcomes for the individual indicators studied. Poland stands out with the largest increase in energy supply per capita and an improvement in the diversification of the energy mix (lowest HHI concentration index). Meanwhile, Estonia achieved the best results in reducing energy import dependency and the share of non-renewable sources in the energy mix. Bulgaria recorded the highest increase in the share of renewable energy sources in the mix and the largest growth in GDP per capita—319% and 313%, respectively, compared to the base year.
On the other hand, it can be observed that Latvia experienced a 2% increase in greenhouse gas emissions per capita compared to the base year, and Slovakia saw a 54% rise in the percentage of people at risk of energy poverty.
The results confirm the validity of the second hypothesis. They indicate the effectiveness of implementing EU energy policy in CEE countries. Despite varying results among individual states, there are evident improvements in enhancing sustainable energy security. These findings support the validity of the pursued policies and the efficiency of the measures implemented in the region.

5. Discussion

Ensuring energy security while simultaneously achieving energy policy goals are priorities in EU economic policy. The implementation of these policy objectives is mandatory for all member countries, including those located in the Central and Eastern part of Europe. Despite political and economic setbacks and the resulting economic challenges and social resistance, these countries are obligated to implement the principles of sustainable development, including, notably, the European Green Deal strategy.
The implementation of the highly ambitious goals of EU climate policy, however, entails significant costs and the necessity of transforming the economies of individual countries, particularly in the energy sector. For highly developed and wealthier countries (referred to as the “old EU-14”), these costs seem relatively smaller compared to those for the so-called “new EU-13” countries. In these countries, located in Central and Eastern Europe (CEE), the challenges associated with energy transformation, building energy independence, and overall efficiency in the energy sector are significantly greater than in other EU countries. This is primarily due to the lower wealth of these countries and social resistance to the necessary changes stemming from the considerably shorter period of building a free-market and competitive economy. This situation leads to certain social groups, especially those dependent on conventional energy resources, expressing concerns and opposition to the radical changes associated with energy transformation [74,75,76]. There are also significant concerns about the costs of this process, which must be borne by the entire society [77,78].
On the other hand, these societies are aware that due to the increasingly deteriorating state of the natural environment, changes in energy policy are necessary. In the past two years, this awareness has grown even more due to the armed conflict in Ukraine. This event has made many countries realize the importance of energy independence and sector efficiency, which determine energy security. In this context, undertaking work involving a study of the state of energy security of CEE countries and their implementation of the EU’s common energy policy becomes fully justified.
There is no doubt that the process of ensuring sustainable energy security and effective implementation of energy policy must continue in CEE countries. The principles of EU energy and climate policy apply to all member states. An important aspect of this policy is also the strengthening of regional cooperation among all EU countries, including those in the CEE region. However, it is evident that countries in this region face many common challenges, including a significant share of non-renewable sources in their energy mixes, energy dependence, high greenhouse gas emissions, energy poverty, and high energy prices.
According to the principles of EU energy policy, zero-emission sources, primarily renewables, should become the foundation of sustainable energy security [15,16,17,18,19]. However, as indicated in [79], transitioning the energy sector to a zero-emission economy while maintaining energy security and implementing EU energy policy may not be an easy process for CEE countries. This is due to potential social, technical, and primarily economic challenges. As the results of [80,81] show, the energy transition in CEE countries, as emerging and developing economies, is proceeding at a relatively slow pace. A significant number of CEE countries also face many problems and difficulties in achieving environmental goals, such as reducing greenhouse gas emissions [82], decreasing energy dependence, or eliminating energy poverty [83,84,85]. Among other factors, these challenges led to the adoption of a multidimensional approach in the conducted research to address this crucial issue for the entire European community.
As the results of the conducted research indicate, this broad approach provided an opportunity to assess both the overall energy security of these countries and the individual dimensions included in the analysis. Over a 15-year perspective, a medium-high level of sustainable energy security, covering energy, economic, environmental, and social dimensions, was characterized by Slovakia, Romania, and Croatia, while a warning level was observed in Poland, Bulgaria, and Lithuania. It is evident that the level of designated energy security in CEE countries is diverse. The obstacles to ensuring a high level of sustainable energy security in these countries stem from the complexity of the problem and the economic, social, and political specificities of this group of countries.
The observed differences in energy security levels among Central and Eastern European (CEE) countries highlight the crucial role of political decisions and the implementation of specific strategies in shaping their energy resilience. Countries that achieved higher energy security levels, such as Slovakia, Romania, and Croatia, benefited from a combination of strategic investments and favorable policy measures. Slovakia’s focus on nuclear energy ensured a stable and relatively low-emission energy source while reducing dependence on imported fossil fuels [86,87]. Romania, on the other hand, developed a well-balanced energy mix by integrating hydropower, wind energy, and natural gas while maintaining a strong domestic energy production sector [88]. Croatia leveraged its geographic location to develop LNG infrastructure, creating an alternative supply route and reducing dependence on Russian gas [89]. In addition to diversifying energy sources, these countries actively increased the share of renewable energy by utilizing both national support programs and EU funds. Romania has become a regional leader in wind energy development [63], while Croatia has harnessed its hydro and solar potential to strengthen sustainable energy production [90].
A key factor that also contributed to the higher level of energy security in these countries was the implementation of energy efficiency improvement policies aimed at optimizing energy consumption across various sectors. Slovakia focused on enhancing energy efficiency in industry and residential construction [91]. Meanwhile, Croatia modernized its energy grid and implemented smart grid technologies, improving energy management [92].
In contrast to these countries, Poland, Bulgaria, and Lithuania face challenges that contribute to their lower level of energy security. Poland’s strong dependence on coal, while providing a certain degree of energy independence, simultaneously creates economic and environmental barriers that have hindered the transition to a more sustainable energy model [93]. Bulgaria and Lithuania, historically reliant on imported energy resources, particularly natural gas, have remained vulnerable to geopolitical disruptions affecting their energy stability. One of the key issues in these countries has been the slow pace of renewable energy deployment. Despite efforts to develop renewable energy sources, Poland’s transition away from coal has been significantly slower than in other countries in the region [94,95]. Similarly, Bulgaria and Lithuania struggle with investment and regulatory barriers that hinder the expansion of renewable energy infrastructure.
Another significant factor that contributed to the lower level of energy security in these countries during the analyzed period was the delay in modernizing energy infrastructure. Additionally, these countries have faced—and continue to face—difficulties in implementing energy policies. Socioeconomic factors, such as a high degree of energy poverty and public opposition to certain energy reforms (e.g., the transition away from coal in Poland), represent major obstacles to achieving a more secure and sustainable energy system [96].
Fundamentally, CEE countries remain heavily dependent on conventional energy sources such as coal and natural gas, which significantly hinders the development of a zero-emission economy based on renewables [79,97]. Despite substantial potential for renewable energy development, reliance on traditional sources continues to serve as a major barrier to energy transition, as seen in the case of Lithuania [98,99,100,101]. Another major obstacle is the inadequate infrastructure needed to support renewable energy expansion. Improving this infrastructure requires substantial investments and a coherent European Union policy, particularly regarding financing mechanisms. It is clear that CEE countries need a dedicated program and strategy to accelerate the development of alternative energy sources, ensuring long-term energy security and sustainability in the region.
An important direction for energy transformation that should enhance regional security is the development of nuclear energy, classified as a zero-emission energy source. Currently, it is only utilized in six countries: Bulgaria, Czech Republic, Hungary, Slovenia, Slovakia, and Romania. Some countries, such as Poland, plan to launch nuclear power plants to improve energy independence and increase security in this area, but their construction requires time and adequate resources. The effects of combining different energy sources are evident in Slovenia and Romania, countries with a high level of sustainable energy security. Such combination of non-renewable energy sources with renewable and nuclear energy sources results in these countries having very balanced and diversified energy mixes at the current stage of energy transformation. As highlighted by Marquesa et al. [102], the integration of different energy sources enhances efficiency in both environmental protection and energy security. The findings of this study corroborate these conclusions.
It is also noteworthy that a high level of sustainable security within the CEE group of countries is not limited to countries with high GDP per capita values. While Slovakia and Croatia fall into this category, Romania is among the poorest CEE countries. This is particularly evident in the area of energy poverty, where the highest levels are found in Romania and Bulgaria.
The results also indicate that wealthier CEE countries developing zero-emission energy sources have lower greenhouse gas emissions than less wealthy countries with more conventional energy mixes. This confirms the findings of studies presented in the works [103,104]. This regularity seems logical, as building a zero-emission economy requires significant and costly investments, or incentive programs, for businesses and households to implement such solutions [105].
It can therefore be assumed that the state of energy security in CEE countries is not satisfactory. Its improvement requires substantial investments, but above all, it requires a targeted pro-environmental policy and measures to promote the idea of a zero-emission economy in society.
All measures aimed at improving sustainable energy security require decisive action by government and local authorities, as well as social acceptance for a fair energy transition [106,107]. Energy transition processes in the European Union must take into account, as demonstrated in this study, the specifics of CEE countries and their diversity and problems in implementing a coherent EU energy policy.
However, it is evident, as also demonstrated by the conducted research, that CEE countries have been taking steps to promote renewable energy and systematically increase their share in energy mixes since joining the European Union. This is evident even in final consumption, where the share of energy from renewable sources is growing. Energy efficiency, supply security, reduced energy dependence, and greenhouse gas emissions are also clearly improving in these countries. This results in an overall improvement in the energy security of these countries, which aligns well with the goals of EU energy policy.
The discussion presented here represents only a fraction of the possible implications and interpretations of the results obtained. Their comprehensiveness and multidimensionality, as well as the timeliness and validity of the subject matter undertaken, provide ample opportunities for further evaluation, comparison with other studies, and inference.

6. Conclusions and Future Research Directions

Based on the developed methodology, a study was conducted to assess the sustainability of energy security from 2007 to 2021 in CEE countries and to evaluate the effectiveness of their energy policies during this period.
Assessing the sustainable energy security of these countries is crucial from both scientific and practical perspectives, considering its multidimensional nature and its significance for the development of modern economies. Energy independence serves as a cornerstone for the advancement of free-market principles and competitive economies.
In this study, an original research methodology was devised, considering the multidimensional aspects of energy security. The methodology incorporated Multi-Criteria Decision-Making (MCDM) methods and criteria for decision-making under uncertainty. By examining four dimensions related to the energy sector and utilizing 17 indicators to characterize them, a comprehensive understanding of the issue was achieved. This methodology was applied to assess the sustainability of energy security and the effectiveness of energy policies in 11 CEE countries over the period from 2007 to 2021. The research findings revealed several key insights:
-
CEE countries exhibited spatial and temporal variation in the level of sustainable energy security during the study period.
-
Slovenia consistently demonstrated the highest level of energy security throughout the analysis, with occasional peaks in other countries during specific years.
-
Poland and Bulgaria consistently remained at a warning level for sustainable energy security throughout the study period, with Lithuania also experiencing this warning level from 2010 to 2021.
-
Lithuania experienced significant deterioration in energy security due to the closure of its last nuclear power plant in 2009, leading to increased dependence on imported energy sources and a shift in the energy mix structure.
-
Romania stood out as the top performer in terms of energy security, maintaining an average energy self-sufficiency of 77% over the entire study period.
-
Hungary, the Czech Republic, and Romania demonstrated the most effective implementation of EU energy policies, while Latvia, Estonia, and Lithuania scored lower in this regard.
The assessment methodology developed and implemented in this study holds promise for future research endeavors, both within EU countries and on a broader international scale. Regular studies on sustainable energy security and the effectiveness of energy policies are crucial for evaluating and refining energy and economic strategies over time. The methodology presented in this paper represents a significant cognitive achievement, offering flexibility in criteria selection, the scope of countries studied, and the duration of analysis.
In the context of the conducted research and obtained results, it is also important to highlight their limitations. The analysis of sustainable energy security was based on the assessment of four main dimensions: energy, economic, environmental, and social. While this approach is multidimensional, it does not allow for detailed tracking of progress within each individual dimension. The overall SESI index value does not directly reveal significant differences and trends that occurred between 2007 and 2021 in each of these areas.
Future in-depth research should therefore include detailed analyses of the indices for each dimension, along with their dynamic changes. This would enable a more nuanced understanding of the situation in individual countries, considering their specific contexts. A better understanding of actual changes in the various dimensions within the studied countries would also allow for more detailed conclusions and the development of practical recommendations. The conducted research provides opportunities to assess the situation of a given country in comparison to the entire group of CEE countries. However, it is challenging to clearly evaluate the changes that have occurred in individual countries over the studied period within the specified dimensions. Undoubtedly, such analyses would be extensive, but they should be considered for inclusion in future studies, possibly on a smaller scale.
In this area, for selected countries, it would also be valuable to study changes in the values of individual indicators. This higher level of detail would allow for the precise identification of issues related to sustainable energy security. In the future, it would be beneficial to conduct a more detailed temporal analysis for each country individually, capturing the dynamics of its changes without reference to the results of other nations. Such an approach would enable more accurate monitoring of policy implementation effectiveness and help identify areas requiring additional action within a given country.
The developed methodology, along with the conducted research and obtained results, offer significant potential for further exploration in this field. A logical step would be to extend the analysis to encompass all EU countries, including both the “new EU-13” and “old EU-14” countries. Incorporating data from a wider range of countries would enable more comprehensive comparisons and the identification of clusters of similar nations that could collaborate effectively in establishing a European energy security framework. This becomes particularly vital given the EU’s composition of numerous relatively small countries, emphasizing the need for close cooperation on critical issues like energy security.
Additionally, it is essential to address the utilization of fossil resources while mitigating their environmental impact, especially in light of the costs associated with developing renewable energy sources and the environmental consequences of emerging technologies. Exploring avenues for enhancing energy security, particularly for countries with significant fossil fuel reserves, while minimizing environmental harm should be duly considered.

7. Policy Implications

For CEE countries specifically, there is a pressing need to prioritize sustainable energy security in their policy agendas. Given geopolitical uncertainties and economic vulnerabilities, these nations should strive for energy independence from unreliable and unstable sources as swiftly as possible. Collaborative efforts and regional strategies are essential for balancing access to secure energy sources, enhancing energy efficiency, and safeguarding the environment. Central to these endeavors is ensuring a fair energy transition across the entire region, encompassing actions such as:
1.
Ongoing monitoring of advancements in sustainable energy security and the efficiency of EU energy policy implementation, e.g.:
-
Regular analysis of progress in energy security, covering both the development of renewable energy technologies and the effectiveness of implementing EU energy market regulations.
2.
Increasing the proportion of RES in the energy mix through collaborative investments in renewable energy projects, including cross-border initiatives. These efforts should facilitate the energy and social transformation process while mitigating greenhouse gas emissions, including the following:
-
Joint investments by Central and Eastern European countries in wind and solar farms that can supply energy to multiple nations simultaneously.
-
Promoting innovative solutions such as energy storage and hybrid energy systems that combine different RES sources for supply stability.
-
Collaborating with the private sector to finance green energy projects, e.g., through public–private partnership (PPP) mechanisms.
-
Facilitating administrative procedures related to the construction of new RES installations, e.g., by simplifying permitting and licensing systems.
3.
Implementing energy conservation programs to enhance energy efficiency across economic sectors, municipalities, and residential areas, e.g.:
-
Modernizing buildings for energy efficiency through thermal modernization programs and subsidies for replacing heating sources with eco-friendly alternatives.
-
Implementing smart energy management systems in businesses and local governments, such as intelligent street lighting systems or automated temperature control in public buildings.
-
Promoting solutions to reduce energy consumption in industry, e.g., through energy audits and grants for upgrading production lines.
4.
Investing in modern technologies like smart grids to optimize energy management and promote regional cooperation, e.g.:
-
Developing and implementing smart energy grids to improve energy transmission and distribution management while integrating renewable energy sources.
-
International cooperation in building and modernizing transmission infrastructure to enable flexible adaptation to changes in supply and demand across the region.
5.
Considering greater utilization of nuclear power as a stabilizing energy source to enhance regional energy independence and self-sufficiency, with support from regional cooperation and EU assistance, including:
-
Construction of new nuclear reactors as a stable, low-carbon energy source that can complement the intermittency of renewable energy sources.
-
Joint financing and exchange of nuclear technologies among CEE countries to reduce costs and accelerate the construction of new power plants.
-
Deployment of small modular reactors (SMRs), which offer greater flexibility and easier integration into local energy systems.
-
Ensuring high safety standards and transparency in nuclear energy development to increase public acceptance of this technology.
6.
Engaging in international cooperation in energy matters and leveraging the experiences of countries that have successfully undergone energy transitions, such as Austria, Finland, and Sweden, to facilitate joint projects and strategies, including the following:
-
Collaborating with countries that have successfully implemented energy transitions to adapt proven solutions in CEE countries.
-
Organizing experience-sharing programs for experts and policymakers to learn from energy transition leaders.
-
Establishing regional energy working groups to coordinate actions and jointly implement solutions.
7.
Raising public awareness to garner support for decisive transformative actions aimed at achieving energy security and mitigating the impacts of climate change, including the following:
-
Conducting information campaigns on the benefits of the energy transition, with a particular focus on economic and environmental aspects.
-
Organizing public consultations to increase citizen participation in energy-related decision-making processes.
8.
Adopting a unified regional approach to energy strategies and economic policies, recognizing that collective efforts among CEE countries yield greater potential for success, including the following:
-
Integrating the energy policies of individual CEE countries into a cohesive action plan to optimize resource utilization.
-
Joint procurement of gas, energy, and raw materials to enhance the region’s bargaining power and improve supply stability.
9.
Increasing funding and support for research and development initiatives focused on advancing new energy technologies, with a focus on enhancing energy efficiency, developing renewable energy sources, and promoting sustainable resource utilization, including the following:
-
Expanding the budget for research on new energy technologies, such as hydrogen, geothermal, and battery technologies.
-
Creating specialized grant programs for universities and research institutes working on sustainable energy technology development.
10.
Implementing measures to alleviate poverty and energy exclusion, ensuring that societal benefits are widespread. This could involve developing assistance programs to provide low-income individuals with access to affordable and clean energy, potentially through energy bill subsidies, including the following:
-
Subsidizing energy bills for households facing economic hardship.
-
Supporting the development of energy communities, where local communities can produce and share renewable energy.
It is crucial that these proposed actions are coordinated and tailored to the specific circumstances and capabilities of each country.
The practical implications of the research findings for policymakers include recommendations to support the improvement of sustainable energy security and the efficiency of energy policy implementation. First, policymakers should focus on developing targeted policies that promote the growth of renewable energy sources, such as introducing dedicated subsidies, tax incentives, and simplified administrative procedures for renewable energy sources projects. Second, the results highlight the need to reduce energy import dependency by developing local energy sources and diversifying suppliers. This requires investments in diverse energy storage and transmission infrastructure.

Author Contributions

Conceptualization, M.T. and J.B.; methodology, J.B. and M.T.; software, M.T. and J.B.; formal analysis, J.B. and M.T.; investigation, J.B. and M.T.; resources, M.T., J.B. and W.W.G.; data curation, M.T. and J.B.; writing—original draft preparation, M.T., J.B. and W.W.G.; writing—review and editing, J.B. and M.T.; visualization, M.T.; supervision, M.T. and J.B.; project administration, M.T. and J.B.; funding acquisition, M.T. All authors have read and agreed to the published version of the manuscript.

Funding

This publication was funded by the statutory research performed at Silesian University of Technology, Department of Production Engineering (13/030/BK_25/0089), Faculty of Management and Organization and Department of Safety Engineering (06/030/BK_25/0082), Faculty of Mining, Safety Engineering and Industrial Automation.

Data Availability Statement

The original contributions presented in the study are included in the article, further inquiries can be directed to the corresponding author.

Conflicts of Interest

The authors declare no conflicts of interest.

Appendix A

Table A1. Dynamics indicators for sustainable energy security in CEE countries between 2007 and 2022 (year 2008 = 100).
IndicatorBGCZEEHRLVLTHUPLROSISK
Total energy supply per capita, tons of oil equivalent10489819110996103114958299
Final energy consumption per capita, tons of oil equivalent1069391951041191081181117793
Energy imports dependency, %71160610561124901571019675
The Energy Mix Concentration Index—(HHI)8777120811011009073949889
Energy sufficiency1277912492160671017394102120
Share of non-renewables in energy mix, %82867985841249393888990
Share of RES in energy mix, %319263283180137232171241157147244
Share of nuclear in energy mix, %1201250000105016810798
Gross Domestic Product per capita, euro313192221169199265171210246156191
Energy productivity, euro per kilogram of oil equivalent137133165128113158128143165139136
Electricity prices for household consumers, all taxes and levies included, euro/kilowatt14715720813222616277113138151120
Electricity prices for non-household consumers, all taxes and levies included, euro/kilowatt2239323813620416890122125107126
Total GHG per capita, t CO2 Equation/capita86755883102939196827482
GHG Intensity of Energy, kg CO2 Equation/toe11410782126132184121105127111120
Population unable to keep home adequately warm by poverty status, % of population33489465347844224662154
Housing cost overburden rate by poverty status, % of population5560853949562254388240

References

  1. Amin, S.B.; Chang, Y.; Khan, F.; Taghizadeh-Hesary, F. Energy Security and Sustainable Energy Policy in Bangladesh: From the Lens of 4As Framework. Energy Policy 2022, 161, 112719. [Google Scholar] [CrossRef]
  2. Falchetta, G.; Tagliapietra, S. Economics of Access to Energy. In The Palgrave Handbook of International Energy Economics; Hafner, M., Luciani, G., Eds.; Palgrave Macmillan: Cham, Switzerland, 2022. [Google Scholar]
  3. Raza, M.A.; Khatri, K.L.; Haque, M.I.U.; Shahid, M.; Rafique, K.; Waseer, T.A. Holistic and Scientific Approach to the Development of Sustainable Energy Policy Framework for Energy Security in Pakistan. Energy Rep. 2022, 8, 4282–4302. [Google Scholar] [CrossRef]
  4. Jasiūnas, J.; Lund, P.D.; Mikkola, J. Energy System Resilience—A Review. Renew. Sustain. Energy Rev. 2021, 150, 111476. [Google Scholar] [CrossRef]
  5. Siksnelyte-Butkiene, I. Defining the Perception of Energy Security: An Overview. Economies 2023, 11, 174. [Google Scholar] [CrossRef]
  6. Holechek, J.L.; Geli, H.M.E.; Sawalhah, M.N.; Valdez, R. A Global Assessment: Can Renewable Energy Replace Fossil Fuels by 2050? Sustainability 2022, 14, 4792. [Google Scholar] [CrossRef]
  7. Musiał, W.; Zioło, M.; Luty, L.; Musiał, K. Energy Policy of European Union Member States in the Context of Renewable Energy Sources Development. Energies 2021, 14, 2864. [Google Scholar] [CrossRef]
  8. Szulecki, K.; Fischer, S.; Gullberg, A.T.; Sartor, O. Shaping the ‘Energy Union’: Between National Positions and Governance Innovation in EU Energy and Climate Policy. Clim. Policy 2016, 16, 548–567. [Google Scholar] [CrossRef]
  9. Skjærseth, J.B. Towards a European Green Deal: The Evolution of EU Climate and Energy Policy Mixes. Int. Environ. Agreem. Politics Law Econ. 2021, 21, 25–41. [Google Scholar] [CrossRef]
  10. European Green Deal. Available online: https://www.consilium.europa.eu/en/policies/green-deal/ (accessed on 9 February 2024).
  11. Fit for 55. Available online: https://www.consilium.europa.eu/en/policies/green-deal/fit-for-55-the-eu-plan-for-a-green-transition/ (accessed on 9 February 2024).
  12. The Treaty on the Functioning of the European Union. The Treaty of Lisbon 2018. Available online: https://eur-lex.europa.eu/legal-content/PL/TXT/?uri=LEGISSUM:ai0033 (accessed on 9 February 2024).
  13. Pielow, J.C.; Lewendel, B.J. The EU Energy Policy After the Lisbon Treaty. In Financial Aspects in Energy; Dorsman, A., Westerman, W., Karan, M., Arslan, Ö., Eds.; Springer: Berlin/Heidelberg, Germany, 2011. [Google Scholar]
  14. Internal Energy Market. Available online: https://www.europarl.europa.eu/factsheets/en/sheet/45/internal-energy-market (accessed on 9 February 2024).
  15. Communication from the Commission—Energy for the Future: Renewable Sources of Energy—White Paper for a Community Strategy and Action Plan, COM (1997) 97, p. 599. Available online: https://europa.eu/documents/comm/white_papers/pdf/com97_599_en.pdf (accessed on 9 February 2024).
  16. Directive 2001/77/EC of the European Parliament and of the Council of 27 September 2001 on the Promotion of Electricity Produced from Renewable Energy Sources in the Internal Electricity Market. Available online: https://eur-lex.europa.eu/legal-content/EN/ALL/?uri=CELEX%3A32001L0077 (accessed on 9 February 2024).
  17. Green Paper: A European Strategy for Sustainable, Competitive and Secure Energy. Available online: https://eur-lex.europa.eu/EN/legal-content/summary/green-paper-a-european-strategy-for-sustainable-competitive-and-secure-energy.html (accessed on 9 February 2024).
  18. Directive 2009/28/EC of the European Parliament and of the Council of 23 April 2009 on the Promotion of the Use of Energy from Renewable Sources and Amending and Subsequently Repealing Directives 2001/77/EC and 2003/30/EC. Available online: https://eur-lex.europa.eu/legal-content/EN/ALL/?uri=CELEX%3A32009L0028 (accessed on 9 February 2024).
  19. Directive (EU) 2018/2001 of the European Parliament and of the Council of 11 December 2018 on the Promotion of the Use of Energy from Renewable Sources. Available online: https://eur-lex.europa.eu/legal-content/EN/TXT/?uri=CELEX%3A32018L2001 (accessed on 9 February 2024).
  20. Mara, D.; Nate, S.; Stavytskyy, A.; Kharlamova, G. The Place of Energy Security in the National Security Framework: An Assessment Approach. Energies 2022, 15, 658. [Google Scholar] [CrossRef]
  21. Siksnelyte-Butkiene, I.; Streimikiene, D.; Lekavicius, V.; Balezentis, T. Comprehensive Analysis of Energy Security Indicators and Measurement of Their Integrity. Technol. Forecast. Soc. Change 2024, 200, 123167. [Google Scholar] [CrossRef]
  22. Marhold, A.A. Unpacking the Concept of ‘Energy Security’: Lessons from Recent WTO Case Law. Leg. Issues Econ. Integr. 2021, 48, 147–170. [Google Scholar]
  23. Azzuni, A.; Breyer, C. Definitions and Dimensions of Energy Security: A Literature Review. Wiley Interdiscip. Rev. Energy Environ. 2017, 7, e268. [Google Scholar]
  24. Esfahani, A.N.; Moghaddam, N.B.; Maleki, A.; Nazemi, A. The Knowledge Map of Energy Security. Energy Rep. 2021, 7, 3570–3589. [Google Scholar]
  25. IEA. Energy Security—Areas of Work—IEA. Available online: https://www.iea.org/areas-of-work/ensuring-energy-security (accessed on 9 February 2024).
  26. Brodny, J.; Tutak, M. Assessing the Energy Security of European Union Countries from Two Perspectives—A New Integrated Approach Based on MCDM Methods. Appl. Energy 2023, 347, 121443. [Google Scholar]
  27. Gökgöz, F.; Güvercin, M.T. Energy Security and Renewable Energy Efficiency in EU. Renew. Sustain. Energy Rev. 2018, 96, 226–239. [Google Scholar]
  28. Radovanović, M.; Filipović, S.; Pavlović, D. Energy Security Measurement—A Sustainable Approach. Renew. Sustain. Energy Rev. 2017, 68, 1020–1032. [Google Scholar]
  29. Augutis, J.; Krikštolaitis, R.; Martišauskas, L.; Pečiulytė, S.; Žutautaitė, I. Integrated Energy Security Assessment. Energy 2017, 138, 890–901. [Google Scholar]
  30. Kharlamova, G.; Stavytskyy, A.; Chernyak, O. Analysis of Energy Security Provision in the European Countries. In Innovative Business Development—A Global Perspective, IECS 2018; Springer Proceedings in Business and Economics; Orăștean, R., Ogrean, C., Mărginean, S., Eds.; Springer: Cham, Switzerland, 2018. [Google Scholar]
  31. Streimikiene, D.; Siksnelyte-Butkiene, I.; Lekavicius, V. Energy Diversification and Security in the EU: Comparative Assessment in Different EU Regions. Economies 2023, 11, 83. [Google Scholar] [CrossRef]
  32. Rodríguez-Fernández, L.; Carvajal, A.B.F.; de Tejada, V.F. Improving the Concept of Energy Security in an Energy Transition Environment: Application to the Gas Sector in the European Union. Extr. Ind. Soc. 2022, 9, 101045. [Google Scholar]
  33. Shah, S.A.A.; Zhou, P.; Walasai, G.D.; Mohsin, M. Energy Security and Environmental Sustainability Index of South Asian Countries: A Composite Index Approach. Ecol. Indic. 2019, 106, 105507. [Google Scholar]
  34. Sovacool, B.K. Assessing Energy Security Performance in the Asia Pacific, 1990–2010. Renew. Sustain. Energy Rev. 2013, 17, 228–247. [Google Scholar] [CrossRef]
  35. Selvakkumaran, S.; Limmeechokchai, B. Energy Security and Co-Benefits of Energy Efficiency Improvement in Three Asian Countries. Renew. Sustain. Energy Rev. 2013, 20, 491–503. [Google Scholar] [CrossRef]
  36. Gong, X.; Wang, Y.; Lin, B. Assessing Dynamic China’s Energy Security: Based on Functional Data Analysis. Energy 2021, 217, 119324. [Google Scholar]
  37. Song, Y.; Zhang, M.; Sun, R. Using a New Aggregated Indicator to Evaluate China’s Energy Security. Energy Policy 2019, 132, 167–174. [Google Scholar]
  38. Fang, D.; Shi, S.; Yu, Q. Evaluation of Sustainable Energy Security and an Empirical Analysis of China. Sustainability 2018, 10, 1685. [Google Scholar] [CrossRef]
  39. Wang, Q.; Zhou, K. A Framework for Evaluating Global National Energy Security. Appl. Energy 2017, 188, 19–31. [Google Scholar]
  40. Wang, D.; Tian, S.; Fang, L.; Xu, Y. A Functional Index Model for Dynamically Evaluating China’s Energy Security. Energy Policy 2020, 147, 111706. [Google Scholar]
  41. Yuan, J.; Luo, X. Regional Energy Security Performance Evaluation in China Using MTGS and SPA-TOPSIS. Sci. Total Environ. 2019, 696, 133817. [Google Scholar]
  42. Huang, B.; Zhang, L.; Ma, L.; Bai, W.; Ren, J. Multi-Criteria Decision Analysis of China’s Energy Security from 2008 to 2017 Based on Fuzzy BWM-DEA-AR Model and Malmquist Productivity Index. Energy 2021, 228, 120481. [Google Scholar]
  43. Adun, H. Sustainability Energy Security: 20 Years Assessment of the West African Nations Using a Comprehensive Entropy-TOPSIS Analysis. Environ. Sci. Pollut. Res. 2023, 30, 81093–81112. [Google Scholar]
  44. Alemzero, D.A.; Sun, H.; Mohsin, M.; Iqbal, N.; Nadeem, M.; Vo, X.V. Assessing Energy Security in Africa Based on Multi-Dimensional Approach of Principal Composite Analysis. Environ. Sci. Pollut. Res. 2021, 28, 2158–2171. [Google Scholar]
  45. Lin, B.; Raza, M.Y. Analysis of Energy Security Indicators and CO2 Emissions: A Case from a Developing Economy. Energy 2020, 200, 117575. [Google Scholar]
  46. Malik, S.; Qasim, M.; Saeed, H.; Chang, Y.; Taghizadeh-Hesary, F. Energy Security in Pakistan: Perspectives and Policy Implications from a Quantitative Analysis. Energy Policy 2020, 144, 111552. [Google Scholar]
  47. Abdullah, F.B.; Iqbal, R.; Hyder, S.I.; Jawaid, M. Energy Security Indicators for Pakistan: An Integrated Approach. Renew. Sustain. Energy Rev. 2020, 133, 110122. [Google Scholar]
  48. Fuentes, S.; Villafafila-Robles, R.; Lerner, E. Composed Index for the Evaluation of the Energy Security of Power Systems: Application to the Case of Argentina. Energies 2020, 13, 3998. [Google Scholar] [CrossRef]
  49. Kozłowska, J.; Benvenga, M.A.; Nääs, I.D.A. Investment Risk and Energy Security Assessment of European Union Countries Using Multicriteria Analysis. Energies 2023, 16, 330. [Google Scholar]
  50. Zeng, S.; Streimikiene, D.; Baležentis, T. Review of and Comparative Assessment of Energy Security in Baltic States. Renew. Sustain. Energy Rev. 2017, 76, 185–192. [Google Scholar]
  51. Ang, B.W.; Choong, W.L.; Ng, T.S. Energy Security: Definitions, Dimensions and Indexes. Renew. Sustain. Energy Rev. 2015, 42, 1077–1093. [Google Scholar] [CrossRef]
  52. Fouladvand, J.; Ghorbani, A.; Sarı, Y.; Hoppe, T.; Kunneke, R.; Herder, P. Energy Security in Community Energy Systems: An Agent-Based Modelling Approach. J. Clean. Prod. 2022, 366, 13276. [Google Scholar]
  53. Tongsopit, S.; Kittner, N.; Chang, Y.; Aksornkij, A.; Wangjiraniran, W. Energy Security in ASEAN: A Quantitative Approach for Sustainable Energy Policy. Energy Policy 2016, 90, 60–72. [Google Scholar]
  54. Cherp, A.; Jewell, J. The Concept of Energy Security: Beyond the Four As. Energy Policy 2014, 75, 415–421. [Google Scholar] [CrossRef]
  55. Tutak, M.; Brodny, J. Analysis of the Level of Energy Security in the Three Seas Initiative Countries. Appl. Energy 2022, 311, 118649. [Google Scholar] [CrossRef]
  56. Vivoda, V. Evaluating Energy Security in the Asia-Pacific Region: A Novel Methodological Approach. Energy Policy 2010, 38, 5258–5263. [Google Scholar] [CrossRef]
  57. Cohen, G.; Joutz, F.; Loungani, P. Measuring Energy Security: Trends in the Diversification of Oil and Natural Gas Supplies. Energy Policy 2011, 39, 4860–4869. [Google Scholar] [CrossRef]
  58. de Rossa, M.; Gainsford, K.; Pallonetto, F.; Finn, D.P. Diversification, Concentration and Renewability of the Energy Supply in the European Union. Energy 2022, 253, 124097. [Google Scholar] [CrossRef]
  59. Erahman, Q.F.; Purwanto, W.W.; Sudibandriyo, M.; Hidayatno, A. An Assessment of Indonesia’s Energy Security Index and Comparison with Seventy Countries. Energy 2016, 111, 364–376. [Google Scholar] [CrossRef]
  60. Zhang, L.; Bai, W.; Xiao, H.; Ren, J. Measuring and Improving Regional Energy Security: A Methodological Framework Based on Both Quantitative and Qualitative Analysis. Energy 2021, 227, 120534. [Google Scholar] [CrossRef]
  61. Gökgöz, F.; Yalçın, E. Investigating the Energy Security Performance, Productivity, and Economic Growth for the EU. Environ. Prog. Sustain. Energy 2023, 42, e14139. [Google Scholar] [CrossRef]
  62. Filipović, S.; Radovanović, M.; Golušin, V. Macroeconomic and Political Aspects of Energy Security—Exploratory Data Analysis. Renew. Sustain. Energy Rev. 2018, 97, 428–435. [Google Scholar]
  63. EUROSTAT Database. Available online: https://ec.europa.eu/eurostat/data/database?gclid=CjwKCAiA2pyuBhBKEiwApLaIO8iQvu_6cM_yhwD3iQsRLSVwAJQmaF5zehH8buKu9HCB2ejTmNKkrxoCbUgQAvD_BwE (accessed on 9 February 2024).
  64. Guitouni, A.; Martel, J.M. Tentative Guidelines to Help Choosing an Appropriate MCDA Method. Eur. J. Oper. Res. 1998, 109, 501–521. [Google Scholar] [CrossRef]
  65. Roy, B.; Słowinski, R. Questions Guiding the Choice of a Multicriteria Decision Aiding Method. EURO J. Decis. Process. 2013, 1, 69–97. [Google Scholar]
  66. Pamučar, D.; Vasin, L.; Lukovac, L. Selection of Railway Level Crossings for Investing in Security Equipment Using Hybrid DEMATEL-MARICA Model. In Proceedings of the XVI International Scientific-Expert Conference on Railway, Railcon, Niš, Serbia, 9–10 October 2014; pp. 89–92. [Google Scholar]
  67. Gigović, L.; Pamučar, D.; Bajić, Z.; Milicević, M. The Combination of Expert Judgment and GIS-MAIRCA Analysis for the Selection of Sites for Ammunition Depot. Sustainability 2016, 8, 372. [Google Scholar] [CrossRef]
  68. Chatterjee, S.; Chakraborty, S. A Multi-Attributive Ideal-Real Comparative Analysis-Based Approach for Piston Material Selection. OPSEARCH 2022, 59, 207–228. [Google Scholar]
  69. Ghorabaee, M.K.; Zavadskas, E.K.; Amiri, M.; Turskis, Z. Extended EDAS Method for Fuzzy Multi-Criteria Decision-Making: An Application to Supplier Selection. Int. J. Comput. Commun. Control 2016, 11, 358–371. [Google Scholar]
  70. Ezell, B.; Lynch, C.J.; Hester, P.T. Methods for Weighting Decisions to Assist Modelers and Decision Analysts: A Review of Ratio Assignment and Approximate Techniques. Appl. Sci. 2021, 11, 10397. [Google Scholar] [CrossRef]
  71. Paradowski, B.; Shekhovtsov, A.; Bączkiewicz, A.; Kizielewicz, B.; Sałabun, W. Similarity Analysis of Methods for Objective Determination of Weights in Multi-Criteria Decision Support Systems. Symmetry 2021, 13, 1874. [Google Scholar] [CrossRef]
  72. Deepa, N.; Ganesan, K.; Srinivasan, K.; Chang, C.Y. Realizing Sustainable Development via Modified Integrated Weighting MCDM Model for Ranking Agrarian Dataset. Sustainability 2019, 11, 6060. [Google Scholar] [CrossRef]
  73. Diakoulaki, D.; Mavrotas, G.; Papayannakis, L. Determining Objective Weights in Multiple Criteria Problems: The CRITIC Method. Comput. Oper. Res. 1995, 22, 763–770. [Google Scholar]
  74. Mrozowska, S.; Wendt, J.A.; Tomaszewski, K. The Challenges of Poland’s Energy Transition. Energies 2021, 14, 8165. [Google Scholar] [CrossRef]
  75. Stirling, A. Transforming Power: Social Science and the Politics of Energy Choices. Energy Res. Soc. Sci. 2014, 1, 83–95. [Google Scholar]
  76. Węgrzyn, A.; Spiryndowicz, A.; Grebski, W. Dilemmas of the Energy Transformation in Poland 2021/2022. Min. Mach. 2022, 40, 32–42. [Google Scholar]
  77. Piwowar, A.; Dzikuć, M. The Economic and Social Dimension of Energy Transformation in the Face of the Energy Crisis: The Case of Poland. Energies 2024, 17, 403. [Google Scholar] [CrossRef]
  78. Su, C.-W.; Yuan, X.; Umar, M.; Chang, T. Dynamic Price Linkage of Energies in Transformation: Evidence from Quantile Connectedness. Resour. Policy 2022, 78, 102886. [Google Scholar]
  79. Pakulska, T. Green Energy in Central and Eastern European (CEE) Countries: New Challenges on the Path to Sustainable Development. Energies 2021, 14, 884. [Google Scholar] [CrossRef]
  80. Dokas, I.; Panagiotidis, M.; Papadamou, S.; Spyromitros, E. The Determinants of Energy and Electricity Consumption in Developed and Developing Countries: International Evidence. Energies 2022, 15, 2558. [Google Scholar] [CrossRef]
  81. Esquivias, M.A.; Sugiharti, L.; Rohmawati, H.; Rojas, O.; Sethi, N. Nexus Between Technological Innovation, Renewable Energy, and Human Capital on Environmental Sustainability in Emerging Asian Economies: A Panel Quantile Regression Approach. Energies 2022, 15, 2451. [Google Scholar] [CrossRef]
  82. Grosse, T.G. Low Carbon Economy Policy in Poland: An Example of the Impact of Europeanisation. Equilib. Q. J. Econ. Econ. Policy 2011, 61, 9–39. [Google Scholar]
  83. Tundys, B.; Bretyn, A. Energy Transition Scenarios for Energy Poverty Alleviation: Analysis of the Delphi Study. Energies 2023, 16, 1870. [Google Scholar] [CrossRef]
  84. Streimikiene, D.; Kyriakopoulos, G.L.; Lekavicius, V.; Siksnelyte-Butkiene, I. Energy Poverty and Low Carbon Just Energy Transition: Comparative Study in Lithuania and Greece. Soc. Indic. Res. 2021, 158, 319–371. [Google Scholar]
  85. Joița, D.; Panait, M.; Dobrotă, C.-E.; Diniță, A.; Neacșa, A.; Naghi, L.E. The European Dilemma—Energy Security or Green Transition. Energies 2023, 16, 3849. [Google Scholar] [CrossRef]
  86. Mišík, M.; Oravcová, V. Policy Persistence vis-à-vis a Crisis: The Curious Case of Slovak Energy Policy after the Russian Invasion of Ukraine. Energy Effic. 2024, 17, 33. [Google Scholar]
  87. Karatayev, M.; Gaduš, J.; Lisiakiewicz, R. Creating Pathways toward Secure and Climate-Neutral Energy System through EnergyPLAN Scenario Model: The Case of Slovak Republic. Energy Rep. 2023, 10, 2525–2536. [Google Scholar]
  88. Bulmez, A.-M.; Brezeanu, A.-I.; Dragomir, G.; Talabă, O.-M.; Năstase, G. An Analysis of Romania’s Energy Strategy: Perspectives and Developments since 2020. Climate 2024, 12, 101. [Google Scholar] [CrossRef]
  89. Hebda, W. Gas from the South, Not from Russia: The Possibility of Distributing Natural Gas from the Eastern Mediterranean to Poland and Central Europe. Energies 2024, 17, 1469. [Google Scholar] [CrossRef]
  90. Matulić, D.; Andabaka, Ž.; Radman, S.; Fruk, G.; Leto, J.; Rošin, J.; Rastija, M.; Varga, I.; Tomljanović, T.; Čeprnja, H.; et al. Agrivoltaics and Aquavoltaics: Potential of Solar Energy Use in Agriculture and Freshwater Aquaculture in Croatia. Agriculture 2023, 13, 1447. [Google Scholar] [CrossRef]
  91. Teplická, K.; Khouri, S.; Mehana, I.; Petrovská, I. Energy Cost Reduction in the Administrative Building by the Implementation of Technical Innovations in Slovakia. Economies 2024, 12, 260. [Google Scholar] [CrossRef]
  92. Herenčić, L.; Kirac, M.; Keko, H.; Kuzle, I.; Rajšl, I. Automated Energy Sharing in MV and LV Distribution Grids within an Energy Community: A Case for Croatian City of Križevci with a Hybrid Renewable System. Renew. Energy 2022, 191, 176–194. [Google Scholar]
  93. Jonek-Kowalska, I.; Grebski, W. Comparative Analysis of Domestic Production and Import of Hard Coal in Poland: Conclusions for Energy Policy and Competitiveness. Energies 2024, 17, 5157. [Google Scholar] [CrossRef]
  94. Brodny, J.; Tutak, M.; Grebski, W. Empirical Assessment of the Efficiency of Poland’s Energy Transition Process in the Context of Implementing the European Union’s Energy Policy. Energies 2024, 17, 2689. [Google Scholar] [CrossRef]
  95. Brodny, J.; Tutak, M. Decade of Progress: A Multidimensional Measurement and Assessment of Energy Sustainability in EU−27 Nations. Appl. Energy 2025, 382, 125222. [Google Scholar]
  96. Żuk, P.; Żuk, P. Social and Spatial Determinants of Energy Ageism: Calibrating Social Policy Towards Older People Under the Conditions of Energy Transition in Polish Society. Energy Res. Soc. Sci. 2024, 118, 103795. [Google Scholar]
  97. Ćetković, S.; Buzogány, A. Between Markets, Politics and Path-Dependence: Explaining the Growth of Solar and Wind Power in Six Central and Eastern European Countries. Energy Policy 2020, 139, 111325. [Google Scholar]
  98. Igiliński, B.; Igilińska, A.; Koziński, G.; Skrzatek, M.; Buczkowski, R. Wind Energy in Poland—History, Current State, Surveys, Renewable Energy Sources Act, SWOT Analysis. Renew. Sustain. Energy Rev. 2016, 64, 19–33. [Google Scholar]
  99. Igiliński, B.; Pietrzak, M.B.; Kiełkowska, U.; Skrzatek, M.; Kumar, G.; Piechota, G. The Assessment of Renewable Energy in Poland on the Background of the World Renewable Energy Sector. Energy 2022, 261, 125319. [Google Scholar]
  100. Shabbir, N.; Kütt, L.; Raja, H.A.; Jawad, M.; Allik, A.; Husev, O. Techno-Economic Analysis and Energy Forecasting Study of Domestic and Commercial Photovoltaic System Installations in Estonia. Energy 2022, 253, 124156. [Google Scholar]
  101. Šafařík, D.; Hlaváčková, P.; Michal, J. Potential of Forest Biomass Resources for Renewable Energy Production in the Czech Republic. Energies 2022, 15, 47. [Google Scholar]
  102. Marques, A.C.; Junqueira, T.M. European Energy Transition: Decomposing the Performance of Nuclear Power. Energy 2022, 245, 123244. [Google Scholar]
  103. Balezentis, T. Shrinking Ageing Population and Other Drivers of Energy Consumption and CO2 Emission in the Residential Sector: A Case from Eastern Europe. Energy Policy 2020, 140, 111433. [Google Scholar]
  104. Yu, Z.; Abdul, S.; Khan, R.; Ponce, P.; Beatriz, A.; de Sousa, L.; Charbel, J.; Jabbour, J.C. Factors Affecting Carbon Emissions in Emerging Economies in the Context of a Green Recovery: Implications for Sustainable Development Goals. Technol. Forecast. Soc. Change 2022, 176, 121417. [Google Scholar]
  105. Stern, N.; Valero, A. Innovation, Growth and the Transition to Net-Zero Emissions. Res. Policy 2021, 50, 104293. [Google Scholar]
  106. Bartiaux, F.; Maretti, M.; Cartone, A.; Biermann, P.; Krasteva, V. Sustainable Energy Transitions and Social Inequalities in Energy Access: A Relational Comparison of Capabilities in Three European Countries. Glob. Transit. 2019, 1, 226–240. [Google Scholar] [CrossRef]
  107. Nihal, A.; Areche, F.O.; Araujo, V.G.S.; Ober, J. Synergistic Evaluation of Energy Security and Environmental Sustainability in BRICS Geo-Political Entities: An Integrated Index Framework. Equilib. Q. J. Econ. Econ. Policy 2024, 19, 793–839. [Google Scholar] [CrossRef]
Figure 1. The research procedure using Multi-Criteria Decision-Making methods and decision criteria under uncertainty (Laplace and Hurwicz).
Energies 18 01767 g001
Figure 2. Values of indicator weights determined based on CRITIC, equal weight and standard deviation methods and Laplace’s criterion in 2007 (a) and 2021 (b).
Energies 18 01767 g002
Figure 3. Final values of the indicator weights used for this research.
Energies 18 01767 g003
Figure 4. Values of the Sustainable Energy Security Index (SESI) of CEE countries from 2007 to 2021 (a) and the ranking position of these countries determined by the values of this index (b).
Energies 18 01767 g004
Figure 5. Average level of sustainable energy security of the surveyed CEE countries for the entire 15-year study period.
Energies 18 01767 g005
Figure 6. The CEE energy policy implementation efficiency index in a 15-year perspective period.
Energies 18 01767 g006
Figure 7. The level of energy policy implementation efficiency in CEE countries over a 15-year perspective.
Energies 18 01767 g007
Table 1. Variable and units of data (own elaboration based on [1,21,23,26,51].
DimensionIndicatorThe Significance of the Indicator in the Context of Sustainable Energy Security
EnergyTotal primary energy supply per capita, tons of oil equivalent (X1)Defines the energy available per resident in a country, indicating overall energy resource availability relative to the population. A higher level suggests better energy access.
Energy use per capita, tons of oil equivalent (X2)Defines energy consumption per person in a country, expressed in tons of oil equivalent.
Dependence on imported energy sources, % (X3)Refers to the share of imported energy in total consumption, indicating reliance on external suppliers and energy security.
The Herfindahl–Hirschman index (HHI) (X4)Measures the concentration of energy sources in the mix. A higher HHI indicates greater reliance on a single source.
Energy self-sufficiency coefficient (X5)Measures a country’s ability to meet energy needs from its own resources, calculated as the ratio of domestic production to total consumption. A higher value indicates greater energy independence and resilience.
The share of non-renewable sources in the energy mix (coal, gas, oil), % (X6)Refers to the share of non-renewable energy (coal, oil, natural gas) in total production. A higher value suggests a greater dependence on fossil fuels, which may pose challenges for sustainability and energy transition efforts.
The share of renewable sources in the energy mix, % (X7)Defines the share of renewable energy (solar, wind, hydro, geothermal, biomass) in total production. A higher share indicates greater sustainability, lower greenhouse gas emissions, reduced reliance on imports, and improved energy security.
The share of nuclear energy in the energy mix, % (X8)Defines the share of nuclear energy in total production. Nuclear energy enhances energy security by diversifying sources, reducing fossil fuel dependence, and providing reliable baseload energy.
EconomicGross Domestic Product per capita, euro (X9)Refers to the total value of goods and services produced annually per inhabitant. GDP per capita helps assess a country’s capacity for stability and energy security.
Energy productivity, euro per kilogram of oil equivalent (X10)Refers to the economic efficiency of energy use. A high value indicates higher GDP with lower energy consumption, contributing to reduced energy use and greenhouse gas emissions.
Energy intensity, kilograms of oil equivalent per thousand euros (X11)Refers to energy consumed per unit of GDP, used to assess energy efficiency. A low value indicates that a country generates more GDP with less energy, signaling better efficiency. A high value suggests greater energy consumption per unit of GDP, indicating potential inefficiency.
Electricity prices for household consumers (consumption from 2500 kWh to 4999 kWh), euro/kilowatt (all taxes and levies included) (X12)Shows the cost per kilowatt of electricity, including fees like transmission tariffs, charges, and taxes. High prices impact household costs and daily electricity use. They are key for government energy policies and may lead to regulations protecting consumers or promoting renewables.
Electricity prices for non-household consumers (consumption from 500 MWh to 1999 MWh), euro/kilowatt (all taxes and levies included) (X13)Refers to the cost of electricity paid by businesses and organizations. It plays a key role in assessing the impact of energy costs on economic activity, competitiveness, and energy policy.
EnvironmentalTotal greenhouse gases per capita, t CO2 eq./capita (X14)Measures greenhouse gas emissions per capita. Monitoring these emissions is essential for assessing progress in reduction efforts and meeting climate change commitments.
Greenhouse gases intensity of energy, kg CO2 eq./toe (X15)Measures greenhouse gas emissions per unit of energy, highlighting the environmental impact of energy production. Lower emissions per unit of energy signal a more sustainable and less damaging energy system, which is vital for achieving long-term climate goals and transitioning to greener energy sources.
SocialPopulation exposed to energy poverty, % (X16)Defines the percentage of residents unable to meet their basic energy needs, which negatively impacts their quality of life.
Housing cost overburden rate by poverty status, % of population (X17)Measures the percentage of individuals or households spending a large portion of their income on housing costs. This limits their ability to cover energy expenses, affecting comfort, health, and safety. Energy poverty may also hinder investment in renewable energy sources, reducing potential cost savings.
Table 2. Final values of indicator weights determined for the research period covering 2007–2021.
YearIndicator
X1X2X3X4X5X6X7X8X9X10X11X12X13X14X15X16X17
20070.05730.04950.06890.06100.06940.05550.05470.06050.05260.05750.06290.05840.05780.06280.05890.05700.0553
20080.06080.05570.06980.06080.07000.05450.05330.06270.05460.05510.05480.05980.06120.06190.05610.05620.0525
20090.06040.06440.06170.05880.06350.05440.05300.06000.05850.05560.05630.06400.06070.06180.05590.05880.0522
20100.06300.06600.05990.05500.06030.05190.05450.06240.05620.05520.05680.06310.06350.06210.05670.05670.0567
20110.06240.06270.06070.05470.06030.05360.05380.06120.05740.05630.05750.06330.06090.06240.06430.05690.0518
20120.06180.06360.06190.05490.06060.05320.05320.06060.05830.05650.05670.06310.05940.06210.06110.05610.0570
20130.06230.06300.06190.05520.06110.05470.05410.05940.05890.05710.05780.06010.05640.06120.06090.05730.0586
20140.06130.06330.06130.05510.06110.05320.05490.06030.05840.05680.05690.05930.06130.06100.06200.05580.0581
20150.06040.06290.06100.05540.06020.05450.05730.06040.05790.05510.05570.06080.05910.06280.05990.05680.0600
20160.06140.06240.06080.05610.06020.05560.05580.06170.05850.05570.05600.06170.05520.06220.05980.05790.0588
20170.06110.06180.06180.05660.06080.05220.05470.06200.05780.05410.06140.06090.05510.06130.06140.05850.0586
20180.06130.06280.05940.05780.05950.05250.05420.06390.05890.05600.05650.06410.05250.06230.05820.06010.0600
20190.05890.06430.05930.05790.05720.05240.05550.06530.05940.05500.05690.06250.05410.06440.05760.06010.0593
20200.06520.07340.06550.06100.06710.03370.04400.05090.05940.05810.05910.06210.05780.06790.05570.05550.0636
20210.05940.06680.05750.05990.05920.05150.05770.06710.06250.05340.05580.06170.05470.06160.05400.05980.0571
Coefficient of variation3%8%6%4%6%10%6%6%4%2%4%3%6%3%5%3%6%
Table 3. Summary value of weights included in dimension studies (Energy, Economic, Environmental, Social).
Summary Values of Indicator Weights for Evaluation Dimensions
EnergyEconomicEnvironmentalSocial
0.47300.29080.12130.1149
Table 4. Values of the Sustainable Energy Security Index (SESI) for the examined CEE countries and their respective rankings.
Method-Specific Index ValuesIndex Values After NormalizationIndex Value Determined by the Hurwicz CriterionFinal Rank
EDASMAIRCACOPRASEDASMAIRCACOPRAS
Assessment ScoreRankAssessment ScoreRankAssessment ScoreRankStandardized Assessment ScoreStandardized Assessment ScoreStandardized Assessment ScoreSESI
BG0.153110.050100.691110.0000.2380.0000.11911
CZ0.64930.04050.86160.6540.6130.5480.6013
EE0.58950.04270.88450.5760.5540.6250.5895
HR0.45270.04040.92830.3950.6230.7660.5806
LV0.52860.03930.90440.4960.6470.6900.5934
LT0.155100.04990.775100.0040.3070.2710.15510
HU0.64920.03621.00010.6550.7641.0000.8272
PL0.17190.057110.81190.0240.0000.3880.1949
RO0.36080.04580.83780.2740.4230.4720.3738
SI0.91010.02910.97821.0001.0000.9280.9641
SK0.60740.04160.85870.6000.5870.5380.5697
Notes: BG—Belgium, CZ—Czech Republic, EE—Estonia, HR—Croatia, LV—Latvia, LT—Lithuania, HU—Hungary, PL—Poland, RO—Romania, SI—Slovenia, SK—Slovakia.
Table 5. The rankings of the CEE countries in terms of sustainable energy security and achievements in the 2007–2021 period.
Rank 2007Rank 2021Change in Ranking Between 2007 and 2021
BG1011−1
CZ53+2
EE45−1
HR660
LV34−1
LT110−9
HU82+6
PL119+2
RO98+1
SI21+1
SK770
Table 6. Level of CEE countries in terms of sustainable energy security from 2007 to 2021.
YearHigh LevelSafe LevelWarning Level
2007Lithuania, Slovenia, LatviaEstonia, Czech Republic, Croatia, Slovakia, HungaryRomania, Bulgaria, Poland
2008Lithuania, Slovenia, LatviaCroatia, Estonia, Slovakia, Czech Republic, RomaniaHungary, Poland, Bulgaria
2009Slovenia, Lithuania, CroatiaRomania, Latvia, Estonia, Czech Republic, HungarySlovakia, Poland, Bulgaria
2010Slovenia, Slovakia, CroatiaCzech Republic, Hungary, Romania, Latvia, EstoniaPoland, Lithuania, Bulgaria
2011Slovenia, Romania, CroatiaSlovakia, Czech Republic, Hungary, Latvia, EstoniaBulgaria, Poland, Lithuania
2012Slovenia, Croatia, SlovakiaRomania, Czech Republic, Hungary, Latvia, EstoniaBulgaria, Poland, Lithuania
2013Slovenia, Croatia, RomaniaSlovakia, Hungary, Czech Republic, Latvia, EstoniaPoland, Bulgaria, Lithuania
2014Slovenia, Romania, CroatiaSlovakia, Czech Republic, Hungary, Latvia, PolandEstonia, Bulgaria, Lithuania
2015Slovenia, Hungary, RomaniaCroatia, Slovakia, Czech Republic, Latvia, EstoniaPoland, Bulgaria, Lithuania
2016Slovenia, Romania, HungarySlovakia, Croatia, Czech Republic, Latvia, EstoniaPoland, Lithuania, Bulgaria
2017Slovenia, Romania, SlovakiaHungary, Czech Republic Croatia, Latvia, EstoniaLithuania, Bulgaria, Poland
2018Slovenia, Romania, Czech RepublicSlovakia, Croatia, Hungary, Latvia, EstoniaPoland, Lithuania, Bulgaria
2019Slovenia, Hungary, RomaniaCroatia, Slovakia, Latvia, Czech Republic, EstoniaPoland, Lithuania, Bulgaria
2020Slovenia, Hungary, CroatiaSlovakia, Romania, Latvia, Estonia, Czech RepublicLithuania, Poland, Bulgaria
2021Slovenia, Hungary, Czech RepublicLatvia, Estonia, Croatia, Slovakia, RomaniaPoland, Lithuania, Bulgaria
Table 7. Highest and lowest rated countries for each indicator adopted for this study.
IndicatorBest ResultWorst Result
CountryThe Value of the Dynamics Index Changes Between 2007 and 2021, % (2007 = 100%)CountryThe Value of the Dynamics Index Changes Between 2007 and 2021, % (2007 = 100%)
Total energy supply per capita, tons of oil equivalentPoland114Estonia81
Final energy consumption per capita, tons of oil equivalentSlovenia77Lithuania119
Energy imports dependency, %Estonia6Czech Republic160
The Energy Mix Concentration Index—The Herfindahl–Hirschman index (HHI)Poland73Estonia120
Energy sufficiencyLatvia160Lithuania67
Share of non-renewables in energy mix, %Estonia79Lithuania124
Share of RES in energy mix, %Bulgaria319Latvia137
Share of nuclear in energy mix, %Romania168Estonia, Croatia, Latvia, Lithuania, PolandMissing in the energy mix
Gross Domestic Product per capita, euroBulgaria313Slovenia156
Energy productivity, euro per kilogram of oil equivalentRomania, Estonia165Latvia113
Electricity prices for household consumers (consumption from 2500 kWh to 4999 kWh), all taxes and levies included, euro/kilowattHungary77Latvia226
Electricity prices for non-household consumers (consumption from 500 MWh to 1999 MWh), all taxes and levies included, euro/kilowattHungary90Estonia238
Total GHG per capita, t CO2 Equation/capitaEstonia58Latvia102
GHG Intensity of Energy, kg CO2 Equation/toeEstonia82Lithuania184
Population unable to keep home adequately warm by poverty status, % of populationPoland22Slovakia154
Housing cost overburden rate by poverty status, % of populationHungary22Estonia85
Disclaimer/Publisher’s Note: The statements, opinions and data contained in all publications are solely those of the individual author(s) and contributor(s) and not of MDPI and/or the editor(s). MDPI and/or the editor(s) disclaim responsibility for any injury to people or property resulting from any ideas, methods, instructions or products referred to in the content.

