Article

Plugging Experiments for Ceramic Filling Layer with Different Grain Sizes Under Gas–Water Mixed Flow for Natural Gas Hydrate Development

1
Research Institute of Petroleum Engineering, Sinopec Shengli Oilfield Company, Dongying 257000, China
2
Zhongsheng Petroleum Development Co., Ltd., Sinopec Shengli Oilfield Company, Dongying 257000, China
3
Haian FaDa Petroleum Instrument Technology Co., Ltd., Nantong 226000, China
4
School of Petroleum Engineering, China University of Petroleum, Beijing 102249, China
*
Author to whom correspondence should be addressed.
Energies 2025, 18(7), 1761; https://doi.org/10.3390/en18071761
Submission received: 26 February 2025 / Revised: 28 March 2025 / Accepted: 29 March 2025 / Published: 1 April 2025
(This article belongs to the Special Issue Advances in Reservoir Simulation: 2nd Edition)

Abstract

:
The natural gas hydrate reservoir in the sea area is shallowly buried and mainly composed of silty silt. The reservoir sediment is weakly consolidated and has fine particles, which shows a higher sand production risk and needs sand control. However, the fine silt particles can easily cause blockages in the sand control medium, so the balance between sand control efficiency and gas production should be considered. At present, there is a lack of reasonable and effective measures to prevent pore blockage in the sand control medium. In this study, the influence of the formation of sand on the blockage in sand-retaining mediums under the condition of gas–water mixed flow is discussed, and the plugging process is analyzed. The results show that: (1) Although the ceramic particles have high sphericity and regular shape, they can form higher porosity and permeability, but the finer ceramic particles will also cause blockages in the muddy silt and reduce productivity. (2) The experimental results of different ceramide filling schemes show that Saucier’s empirical criteria are not suitable for hydrate reservoir development and cannot be directly used for reference. In order to balance the problem of sand control and productivity in the development of the hydrate reservoir, it is recommended to use a 40 × 70 mesh ceramide as the critical optimal condition. The experimental results of this paper have important guiding significance for the development of pre-filled sand control screens and the formulation and optimization of sand control schemes.

1. Introduction

The primary purpose of using the pressure drop method in natural gas hydrate production testing is to reduce the pressure in the producing well below the hydrate phase equilibrium pressure, and to disrupt the hydrate phase equilibrium conditions by lowering the pressure, so as to decompose it into natural gas and water, thus realizing the extraction of natural gas [1,2]. This depressurization method is widely adopted in both domestic and international gas hydrate production tests. The depressurization method involves four coupled physical processes: heat transfer, multiphase seepage, formation deformation, and hydrate decomposition phase transition [3,4,5]. During depressurizing production, the solid hydrate is decomposed into a mixture of gas and water, and the large amount of gas released during decomposition leads to a sharp increase in pore pressure. As the effective stress of the sediment skeleton decreases sharply, the bond strength between the particles in the reservoir sediment decreases, the friction decreases, the shear failure increases, and the sediment skeleton sand is transformed into flowing sand, which leads to large-scale sand production, causing blockages, formation settlement, wellbore instability, and other hazards [6,7,8,9]. Currently, sand problems are encountered in almost all hydrate exploration operations worldwide [10,11,12,13,14]. Hydrate reservoirs in the South China Sea are mainly dispersed and weakly cemented [15], and sand is easily generated during the process of depressurization. Therefore, it is an urgent problem for hydrate sand control to select the type of sand control medium and fully consider the balance between sand control efficiency and gas production.
Sand production is one of the main bottleneck problems of natural gas hydrate reservoirs. Scholars at home and abroad have conducted a lot of research on the simulation of hydrate reservoir plugging laws and sand production mechanisms and have conducted a lot of laboratory experiments. Oyama et al. [16,17] found that the driving force of sand production in their 500 mL core drive sand production simulation experimental apparatus was not the gas stream of hydrate decomposition, but the water flow through the pores. Jung et al. [18,19,20] studied the pore throat size ratio of fine particles, the concentration of fine particles, the concentration of fluid ions, and the influence of single-phase/multi-phase fluid flow on the pore throat plugging rule in the porous media of hydrate sediments and on the productivity of hydrate reservoirs. Their results showed that under the conditions of the change in multiphase fluid flow and liquid ion concentration, plugging can occur even at small fine particle pore throat size ratios, and measures must be developed to prevent pore plugging. Lu Jingsheng et al. [21] predicted the production capacity of hydrate reservoirs under sand production conditions based on the experimental data on sand production from indoor hydrate depressurization production and the publicly measured data of marine hydrate production test, proposing that sand control measures could be adopted to balance the sand production rate and gas production efficiency, questioning the feasibility of sand control with an accuracy lower than 4 μm. Qiang Siqi et al. [22] developed a shape-memory polymer sand control material using polyurethane as the matrix and conducted sand control experiments in a laboratory, believing that the shape-memory polyurethane material could meet the demand of sand control in hydrate production test wells when used in combination with mechanical sand control screens. Dong Changyin et al. [23,24] configured simulated formation sand samples from natural gas hydrate reservoirs according to the particle size distribution curve and argillaceous content data from seabed sand samples in the Shenhu Sea area of China and conducted sand retention tests with different sand control media and different screen segments. The test concluded that the sand control performance of four kinds of sand control media with a nominal accuracy of 20 μm and 40 μm, such as wire-wound screen plate, sintered filter screen, metal fiber, and artificial ceramic particle, is basically similar, while the overall fluidity of sand control medium with an accuracy of 20 μm is poor. At the same time, the feasibility of different structure types of screen joint plugging and sand control was evaluated. Eight different types of screen joints with a sand retention accuracy of 20 μm, 40 μm, and 60 μm were used in the experiment. The experimental results showed that the sand control for highly muddy fine silt was feasible based on the auxiliary sand retention and low seepage resistance characteristics of the mud skin. Zhang et al. [25], in order to explore the sand control effect of gravel packing in a natural gas hydrate reservoir, based on a hydrate synthesis and exploitation apparatus independently developed and designed, performed simulation experiments on sand production in vertical and radial wells, carried out using a 120 mesh sand screen, a 400 mesh sand screen, and a 120 mesh screen for gravel packing sand control completion methods. The experimental results show that in the process of hydrate pressure reduction, the radial well is more prone to blockage than the straight well. The combined sand control method of gravel packing and the sand control screen has been adopted. The sand control effect of the radial well and the straight well is obvious, and the sand production rate is greatly reduced. Based on the characteristics of hydrate reservoirs in the South China Sea, Ding et al. [26,27] carried out sand control simulation experiments on four types of sand control elements, namely a stainless steel wire mesh screen (SSWMS), Dutch wire screen (DWS), sintered metal mesh screen (SMMS) and wire wrapped screen (WWS), determining the sand control effects of the different types of screens and revealing the plugging rules and plugging mechanism of screens in the production process. Sand control methods and the sand control accuracy of screens suitable for hydrate reservoirs in the South China Sea are recommended. LI et al. [28] conducted a decompression experiment on natural gas hydrate indoors. In the experiment, four types of 100 mesh, 200 mesh, 300 mesh, and 400 mesh sand control screens and five types of non-sand control working conditions were considered to analyze the gas–liquid sand production behavior of hydrate decompression under different working conditions. The research results show that compared with the average gas production without a sand control screen, the average gas production of a sand control screen is reduced by 76~96% in the depressurization stage. It is suggested that the appropriate mesh size of a sand control screen should be selected after a comprehensive consideration of the sand control effect and gas production. In general, these studies include macroscopic sand retention dynamics and basic design methods used in sand retention media, as well as the blockage of hydrate-bearing sediments by silty silt, but there are several problems: (1) there is an uncontrollable problem of poor uniformity in the synthesized hydrate sediments; (2) it is difficult to observe the sand production process in laboratory experiments due to the influence of the experimental scale; (3) the description of sand production mechanism carried out in experiments differs greatly from the actual working conditions; and (4) most of the current research focuses on plugging experiments on a metal sieve plate medium, and the matching of the sand formation with the filling medium type and filling accuracy. There is little related literature.
Compared with the Nankai Trough site in Japan, where the average particle size of the sand is about 100 μm [29], the sand particle size in the hydrate reservoirs in the sea area of China is extremely small, with the median average particle size ranging from 8 to 16 μm [30,31], with the strong heterogeneity and poor sorting resulting in the difficulty with sand control in the full-size range. The sand control medium in the traditional filling sand control process cannot meet the accuracy requirements of the sand control, and it is easy for mud particles to invade the sand control medium near the well, resulting in a large sand control skin, where the contradiction between sand control and mud control, as well as increasing production, is very prominent. In view of the particularity of hydrate exploitation, the fine sand gravel in the hydrate reservoir needs to be matched with high-precision sand control media, but the high-precision sand control media can hinder the formation fluid flow, which makes it difficult to select the sand retention accuracy of the sand control media. In order to realize the efficient exploitation of hydrate resources, it is necessary to first solve the matching problem between gravel packing and formation sand retention accuracy. Therefore, this study relied on the self-developed sand retention and plugging mechanism evaluation experimental apparatus [32] to carry out the plugging rule experiment using different ceramic filling layers, under the condition of gas–water miscible flow, revealing the plugging mechanisms for the ceramic filling medium, clarifying the sand extraction rule, and providing an important reference for the formulation and optimization of sand prevention and control measures in hydrate reservoirs.

2. Materials and Methods

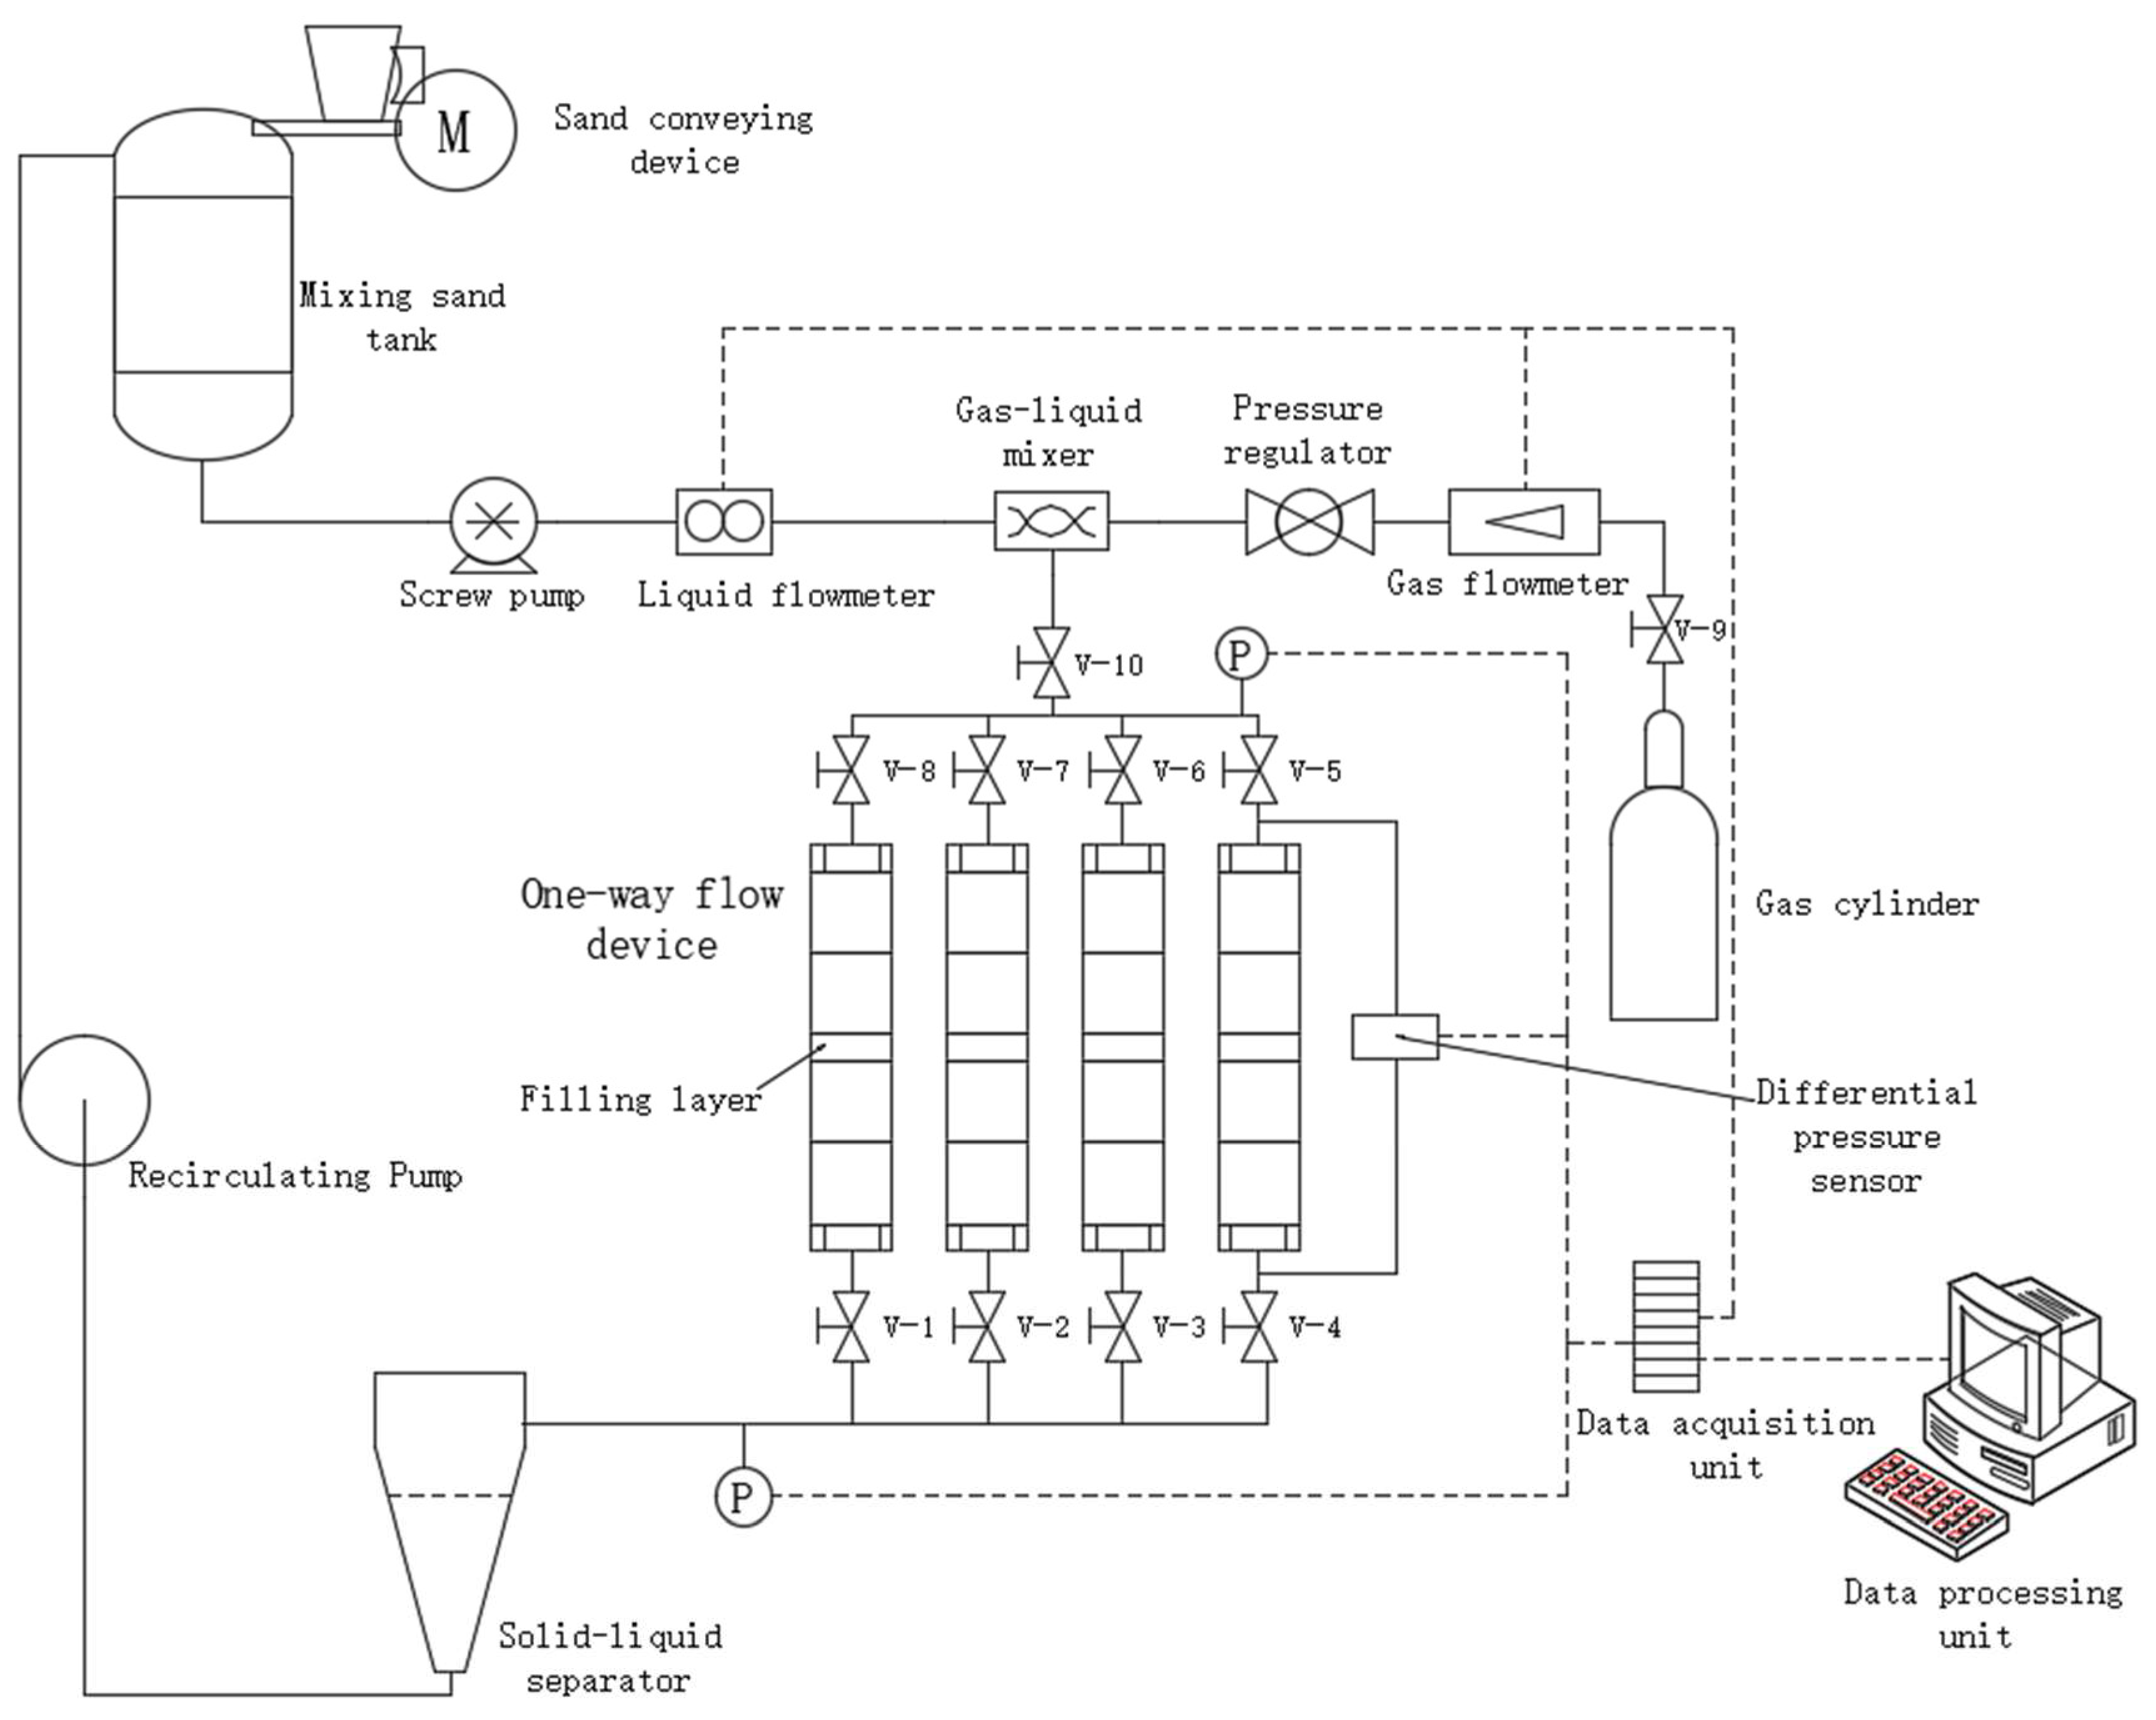
2.1. Experimental Principle and Experimental Apparatus

Hydrate reservoirs in the South China Sea have high water content and abundant edge and bottom water, where hydrate decomposition further leads to an increase in reservoir water content. In addition, the process of hydrate exploitation is mainly a gas–liquid two-phase flow. Under the conditions of low temperature and high pressure in hydrate reservoirs, the viscosity of water is almost two orders of magnitude different from that of methane gas, with the gas viscosity being small and sensitive to pressure changes, and the sand carrying capacity being weak. The ability of water to carry solid particles is much higher than that of methane gas, and the driving force for sand production is the water flow in the pores, rather than the gas generated by decomposition. In order to simulate the change in gas and water passing through the sand control medium layer during the development of a hydrate reservoir in the South China Sea, a one-way flow displacement simulation method was adopted in the experiment, that is, fluid carrying formation sand was used to simulate the gas and water generated by the decomposition of the natural gas hydrate. By measuring the flow rate and the pressure difference in the ceramide packing in real-time, the permeability of the ceramide packing changes with time. At the same time, the blockage formation and the stability of the ceramide packing were observed during the experimental displacement process.
The flow chart of the multi-functional sand retention and plugging mechanism evaluation experimental apparatus used in the experiment is shown in Figure 1. The experimental apparatus consists of a main unidirectional flow displacement unit, liquid storage tank, sand feeder, sand collector, screw pump, data acquisition system, experimental operating platform, etc. The unidirectional flow displacement unit is a sand retention flow simulation apparatus, consisting of a combination of cylindrical joints for filling ceramic particles. It is made of transparent material and has inner diameters of 50 mm, 75 mm, 100 mm, and 125 mm, respectively. The unidirectional flow displacement unit has a length of 150 mm per nipple to allow for the flexible adjustment of the fluid flow rate within the given maximum displacement of the pump and air compressor. The screw pump and air compressor provide water and gas, respectively, to simulate hydrate reservoir gas production. Differential pressure sensors are installed on both sides of the filling ceramic particle to monitor the flow pressure drop, and the data on gas and water flow and pressure are recorded in real-time by the data acquisition system.
In the experiment, the Darcy formula was used to calculate the medium permeability under the three-phase gas–liquid–solid flow condition. The formula is as follows:
k i = q i μ L A Δ P i
where k is the permeability, μm2; qi is the volume flow through the filling layer at the time m3/s; ΔPi is the pressure difference between the inside and outside of the filling medium, MPa; µ is the viscosity of the fluid used in the experiment, mPa·s; A is the cross-sectional area of the gravel packed layer, m2; and L is the thickness of the filling layer, m.

2.2. Experimental Methods and Experimental Materials

2.2.1. Experimental Methods

Considering the match between the displacement of the screw pump and the diameter of the unidirectional flow displacement unit, this experiment mainly uses a cylindrical nipple with a diameter of 50 mm. Firstly, the glass container of the unidirectional flow displacement unit was filled with ceramic particles, and the formation sand was mixed with the water phase before being pumped using the automatic sand feeder. The water–air ratio and flow rate in the displacement apparatus can be adjusted by setting the displacement of the screw pump and the air compressor. After the gas–liquid mixing, the gas–water sand-carrying fluid impinged on the filling ceramic layer in the unidirectional flow displacement unit to simulate the plugging and sand retention process for the filling medium. The data acquisition system recorded the gas–water flow rate, pressure, and the pressure difference between the two ends of the filling ceramics in the process of displacement and the sand retention of the different ceramic layers in real-time, calculated the permeability value of the filling ceramic layers by Darcy’s law, and analyzed the plugging rule for the filling medium.
In this experiment, the same simulated formation sand and different filled ceramic samples were used to conduct the sand retention and displacement experiments. The approximate median particle size of the filled ceramic particles was 80 μm, 120 μm, 200 μm, 250 μm, and 300 μm. In the experiment, the same fluid displacement was set for the given simulated formation sand, and different particle sizes of the ceramic fillings were used for the sand retention and displacement experiments. The fluid-carrying simulated formation sand was used for long-term displacement with stable sand content. The process of displacement is the process of sand retention in the medium of the gravel layer, where it is simultaneously blocked. The fluid flow rate, inlet and outlet pressure, and pressure difference on both sides of the ceramide layer were measured in real-time to calculate the permeability change in the ceramide-packed layer and to evaluate the sand retention ability in the gravel layer. During the experiment, the initial permeability of the gravel layer without sand was measured within 2 to 5 min, then sand displacement was started to simulate the process of sand retention and plugging, and a change in the curve of the experimental pressure difference was observed. When the pressure difference curve is stable, it indicates that the gravel layer has reached the equilibrium state of plugging, that is, the experiment has stopped.

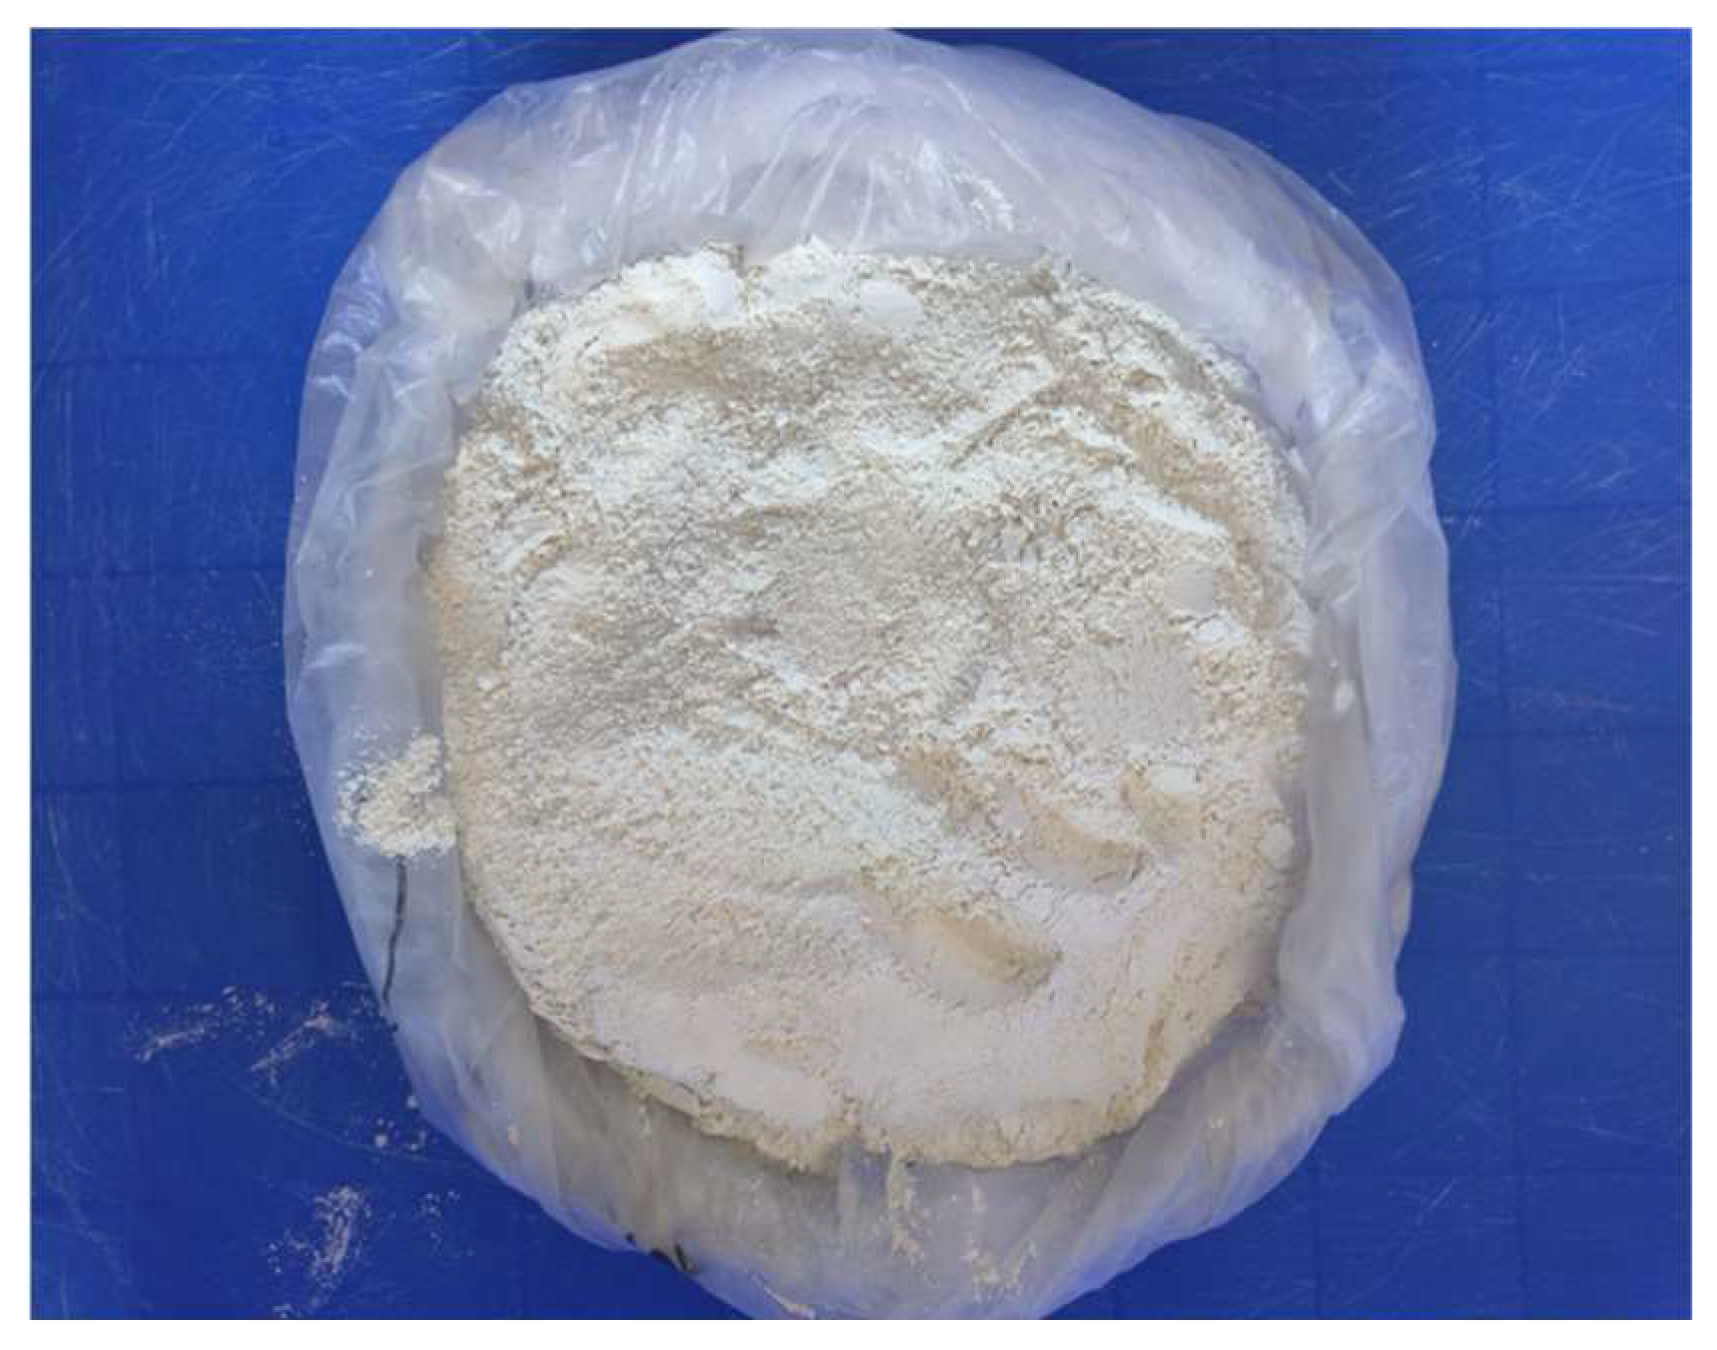
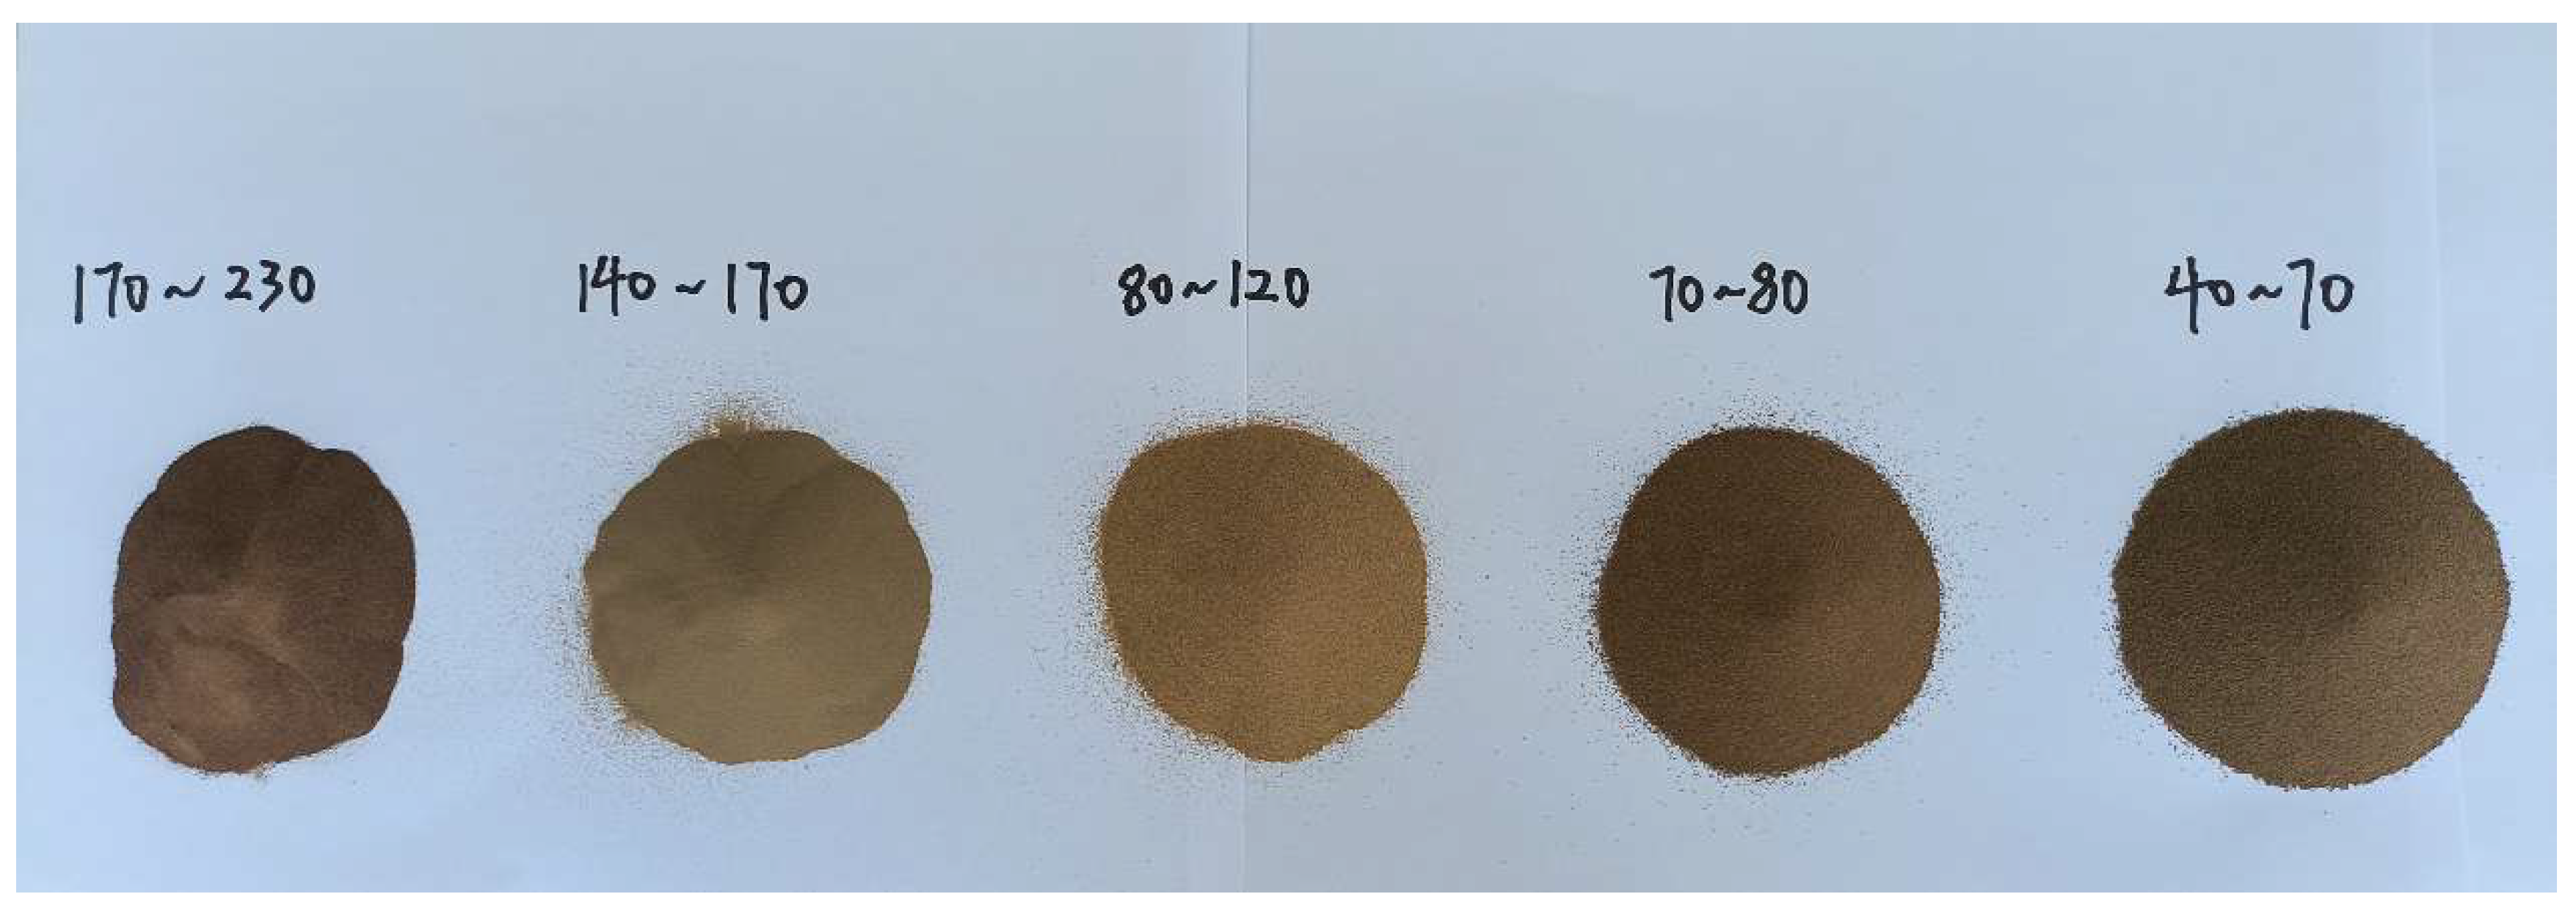
2.2.2. Experimental Materials

Since the actual hydrate sand samples in the South China Sea could not be collected in this study, the samples of muddy fine sand used in the experiments were artificially synthesized according to the grain size distribution curve, and the mud content data from the seabed sand samples in the Liwan Sea area, north of the South China Sea [23,33]. The raw materials used in the composite sand include commercial quartz sand and clay minerals, of which the clay minerals are mainly montmorillonite, illite, and kaolinite. The samples of muddy fine sand obtained by the configuration are shown in Figure 2. The median particle size of the formation sand sample is 10.526 μm, the inhomogeneity coefficient is 12.98, and the mud content is 39%, which belongs to the high-shaliness inhomogeneity of fine sand. The particle size composition and physical property data are basically consistent with the physical properties of the formation sand in the hydrate reservoir in the Liwan area of the northern South China Sea and can be used for the experimental simulation of the sand retention process for the muddy fine silt in the hydrate reservoir.
The South China Sea is a non-diagenetic muddy fine sand gas hydrate reservoir, where the anti-blocking performance and fluid passage performance of quartz sand are significantly weaker than that of ceramics, and the random porosity of a quartz sand filling layer is not suitable for the development of the gas hydrate reservoir [32]. Since the median particle size of the simulated formation sand sample is 10.526 μm (which can be approximated to 10 μm), the matching relationship between the formation sand and the filling layer in the hydrate reservoir is analyzed, referring to the Saucier criteria. For this purpose, a batch of fine ceramic particles with different median particle sizes is customized and processed to realize the various filling–matching relationships. To carry out the blockage rule for the gravel packing in the process of hydrate exploitation, the properties of ceramide are shown below in Table 1.
The ceramic samples used in this experiment are shown in Figure 3.

2.3. Experimental Conditions [32]

The sand retention and blockage in the packed layer depend on the flow rate and the pressure difference inside and outside the packed layer and have nothing to do with absolute pressure. Therefore, a low-pressure system is adopted in this experiment. The outlet pressure of the fluid discharged into the liquid reservoir is atmospheric pressure, and the experimental pressure depends on the experimental discharge rate, the degree of gravel layer blockage, and the flow resistance. Water and air were used to simulate the hydrate reservoir, which produced water and natural gas, respectively. A total of 0.8 m3 of water and 168 m3 of natural gas were produced by the decomposition of 1 m3 of natural gas hydrate. The gas compression factor was 0.75 at the bottom of the well, and the gas–liquid ratio was calculated as approximately 155. In order to improve the reliability and universality of the experimental results, high displacement experimental conditions were adopted in this experiment, that is, the water phase displacement of the screw pump was set at 0.4 m3/h, and the gas displacement of the air compressor was set at 1.0 m3/min. The gas–liquid ratio was set at about 150:1 in the simulation experiment, which was close to the gas–liquid ratio conditions generated by hydrate decomposition. Using the self-developed experimental apparatus to evaluate the sand retention and plugging mechanisms, an experiment on the displacing sand-retaining medium plugging under mixed gas–water flow conditions was carried out with the above-mentioned five schemes for filling ceramics.

3. Results and Discussion

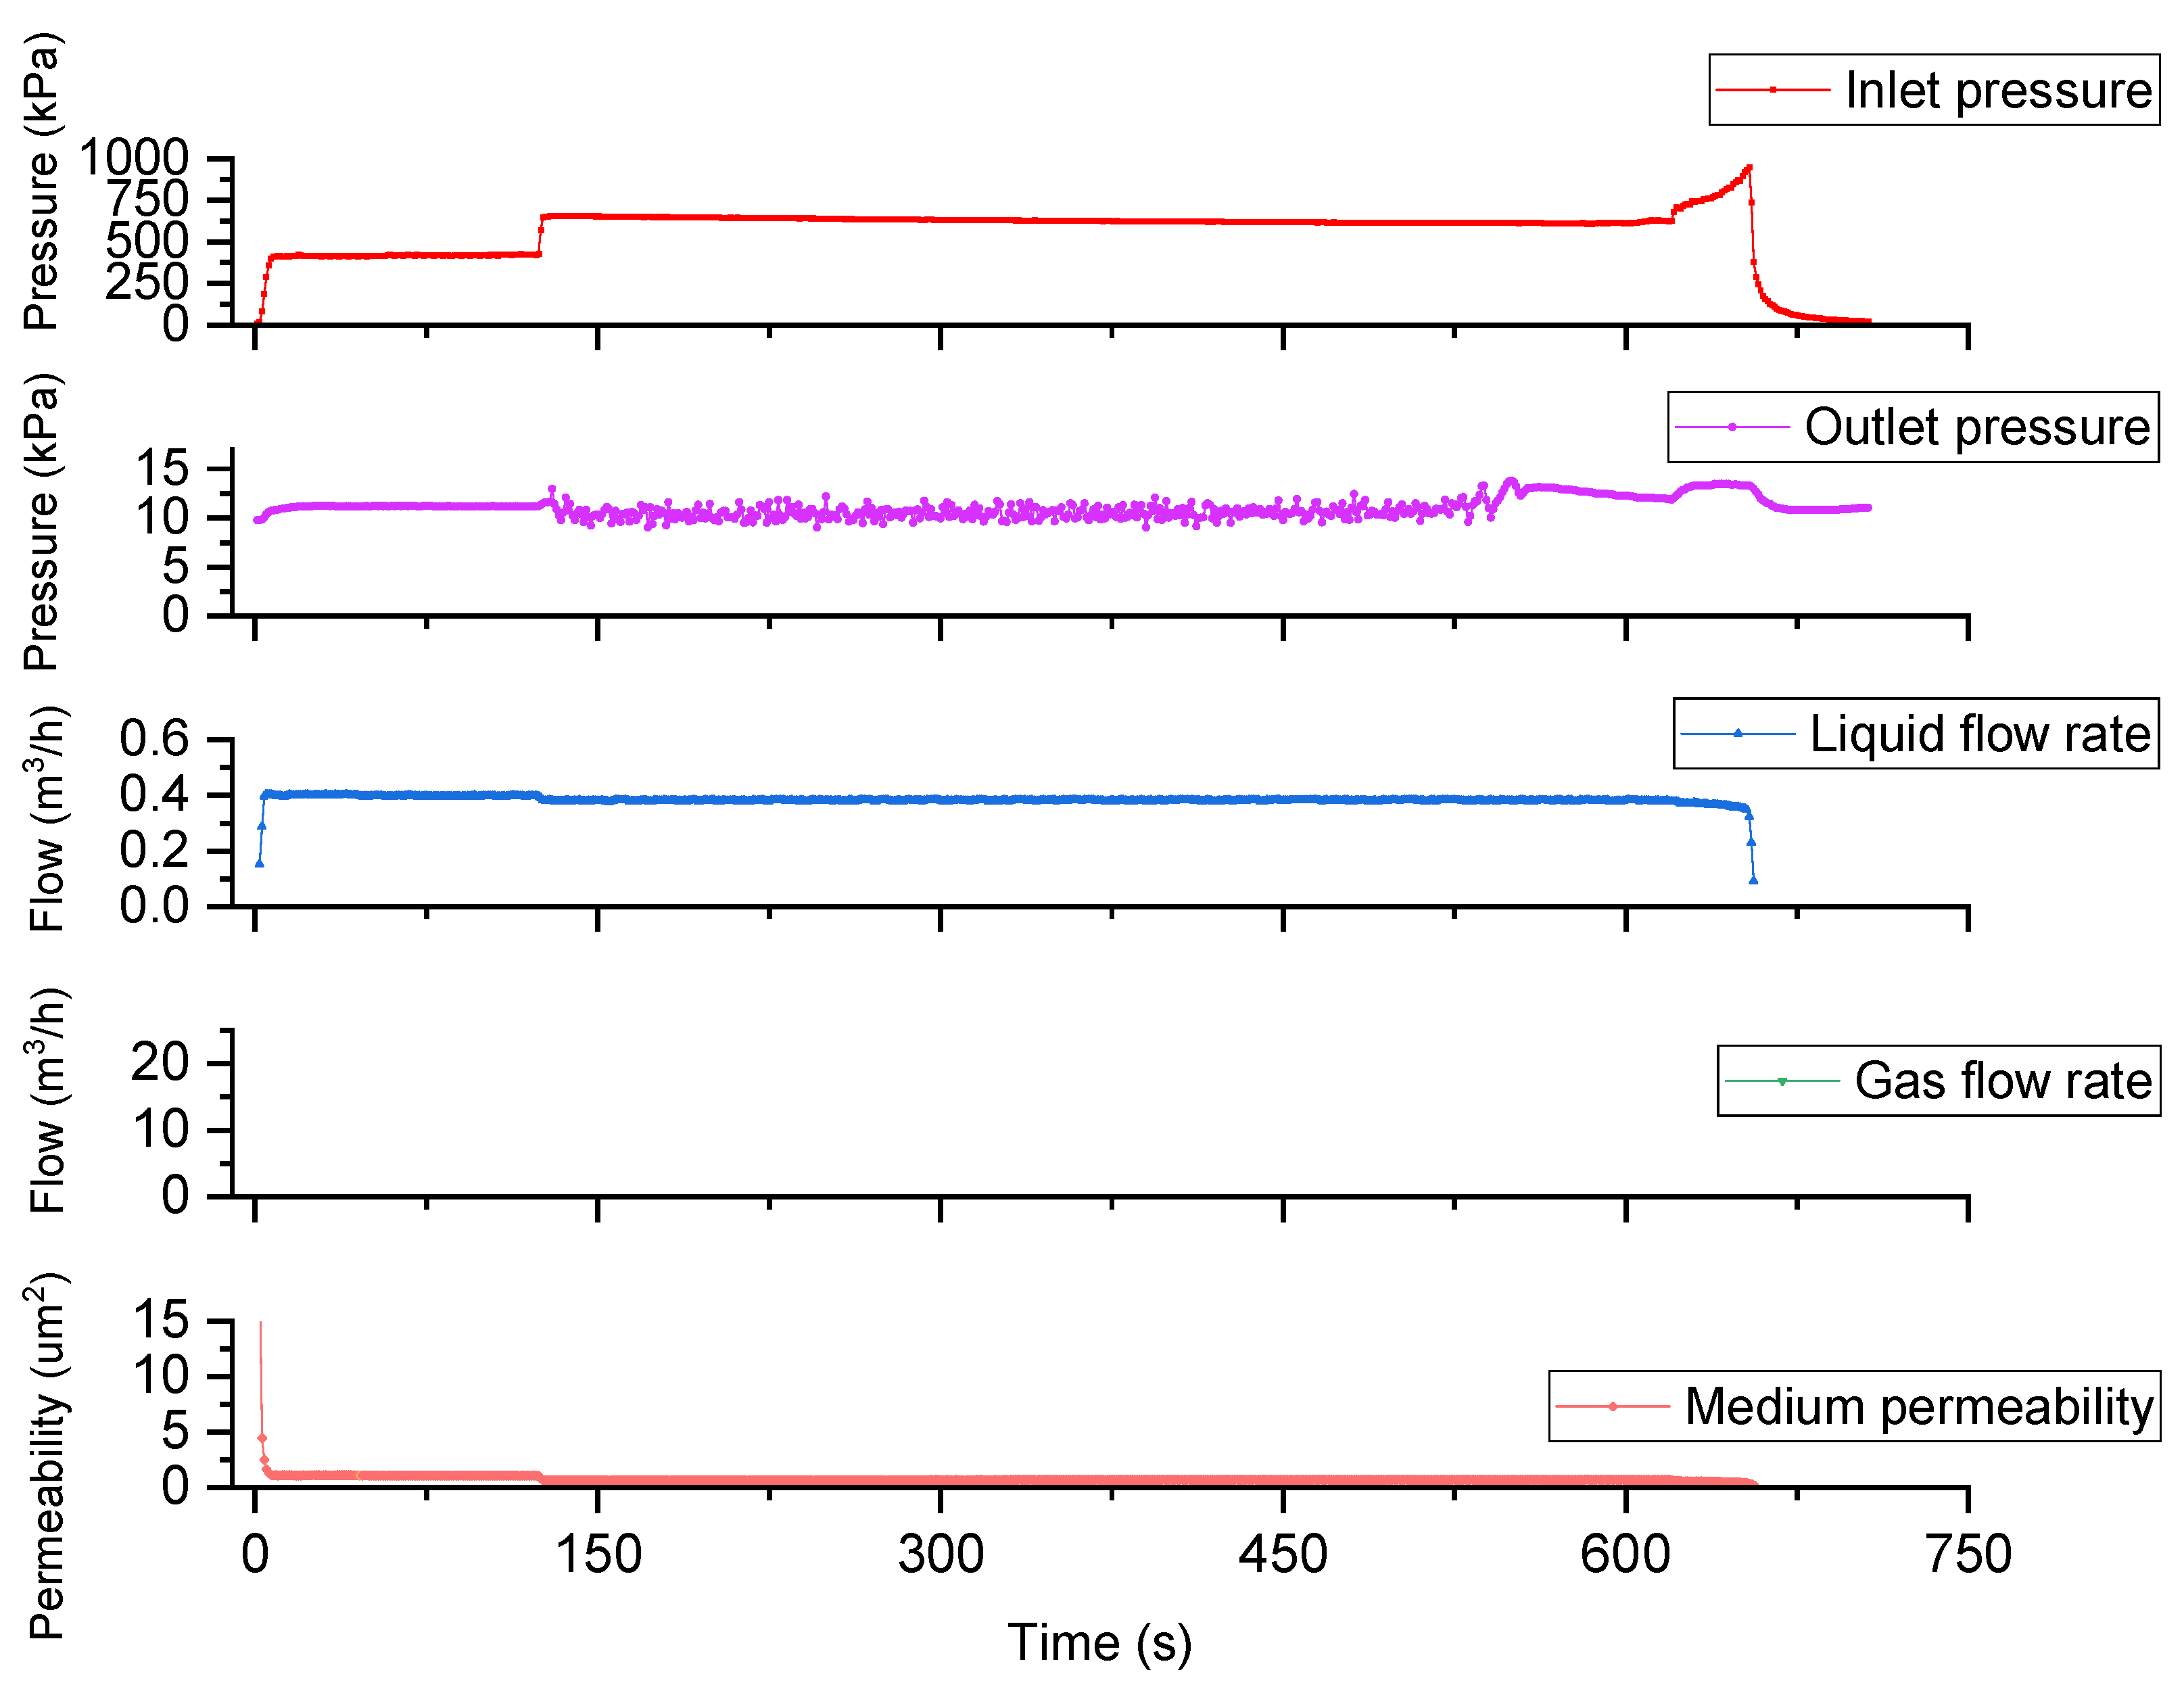
3.1. Fine-Grained Ceramic Layer (170–230 Mesh) Plugging Dynamics

This experiment used a 170–230 mesh for ceramic particles (median grain size = 82 μm) and revealed rapid and severe plugging under a gas–water–sand mixed flow. As shown in Figure 4, during the initial 150–300 s of sand-free displacement, the inlet pressure stabilized at 0.6 MPa. Upon introducing simulated formation sand (d50 = 10.5 μm, 39% clay), the pressure surged to 0.8 MPa within 300 s, nearing the safety limit of the experimental apparatus. This abrupt pressure rise coincided with a permeability decline from 12.5 μm2 to 0.38 μm2 (97% reduction), forcing the premature termination of the test. Post-experiment dissection of the ceramic layer (Figure 5) revealed a dense mud cake (5–8 μm thick) coating the ceramic surface, with clay aggregates (montmorillonite-dominated) bridging pore throats. These observations align with the Kozeny–Carman model, where ultrafine clay particles(<10 μm) migrated into the ceramic matrix, forming stable bridges at constrictions. The Kozeny constant C = 0.2 was selected based on the spherical morphology (sphericity > 0.92) and hexagonal close packing arrangement of ceramic particles [34], which differ from traditional angular quartz sand systems (C = 0.5–1.2) [35]. This parameter choice ensures that the calculated permeability (12.5 μm2) matches the experimental baseline within a ±5% error range, as follows:
k = ϕ 3 C τ 2 S 2
where: ϕ = porosity, τ = tortuosity, S = specific surface area, C = Kozeny constant.

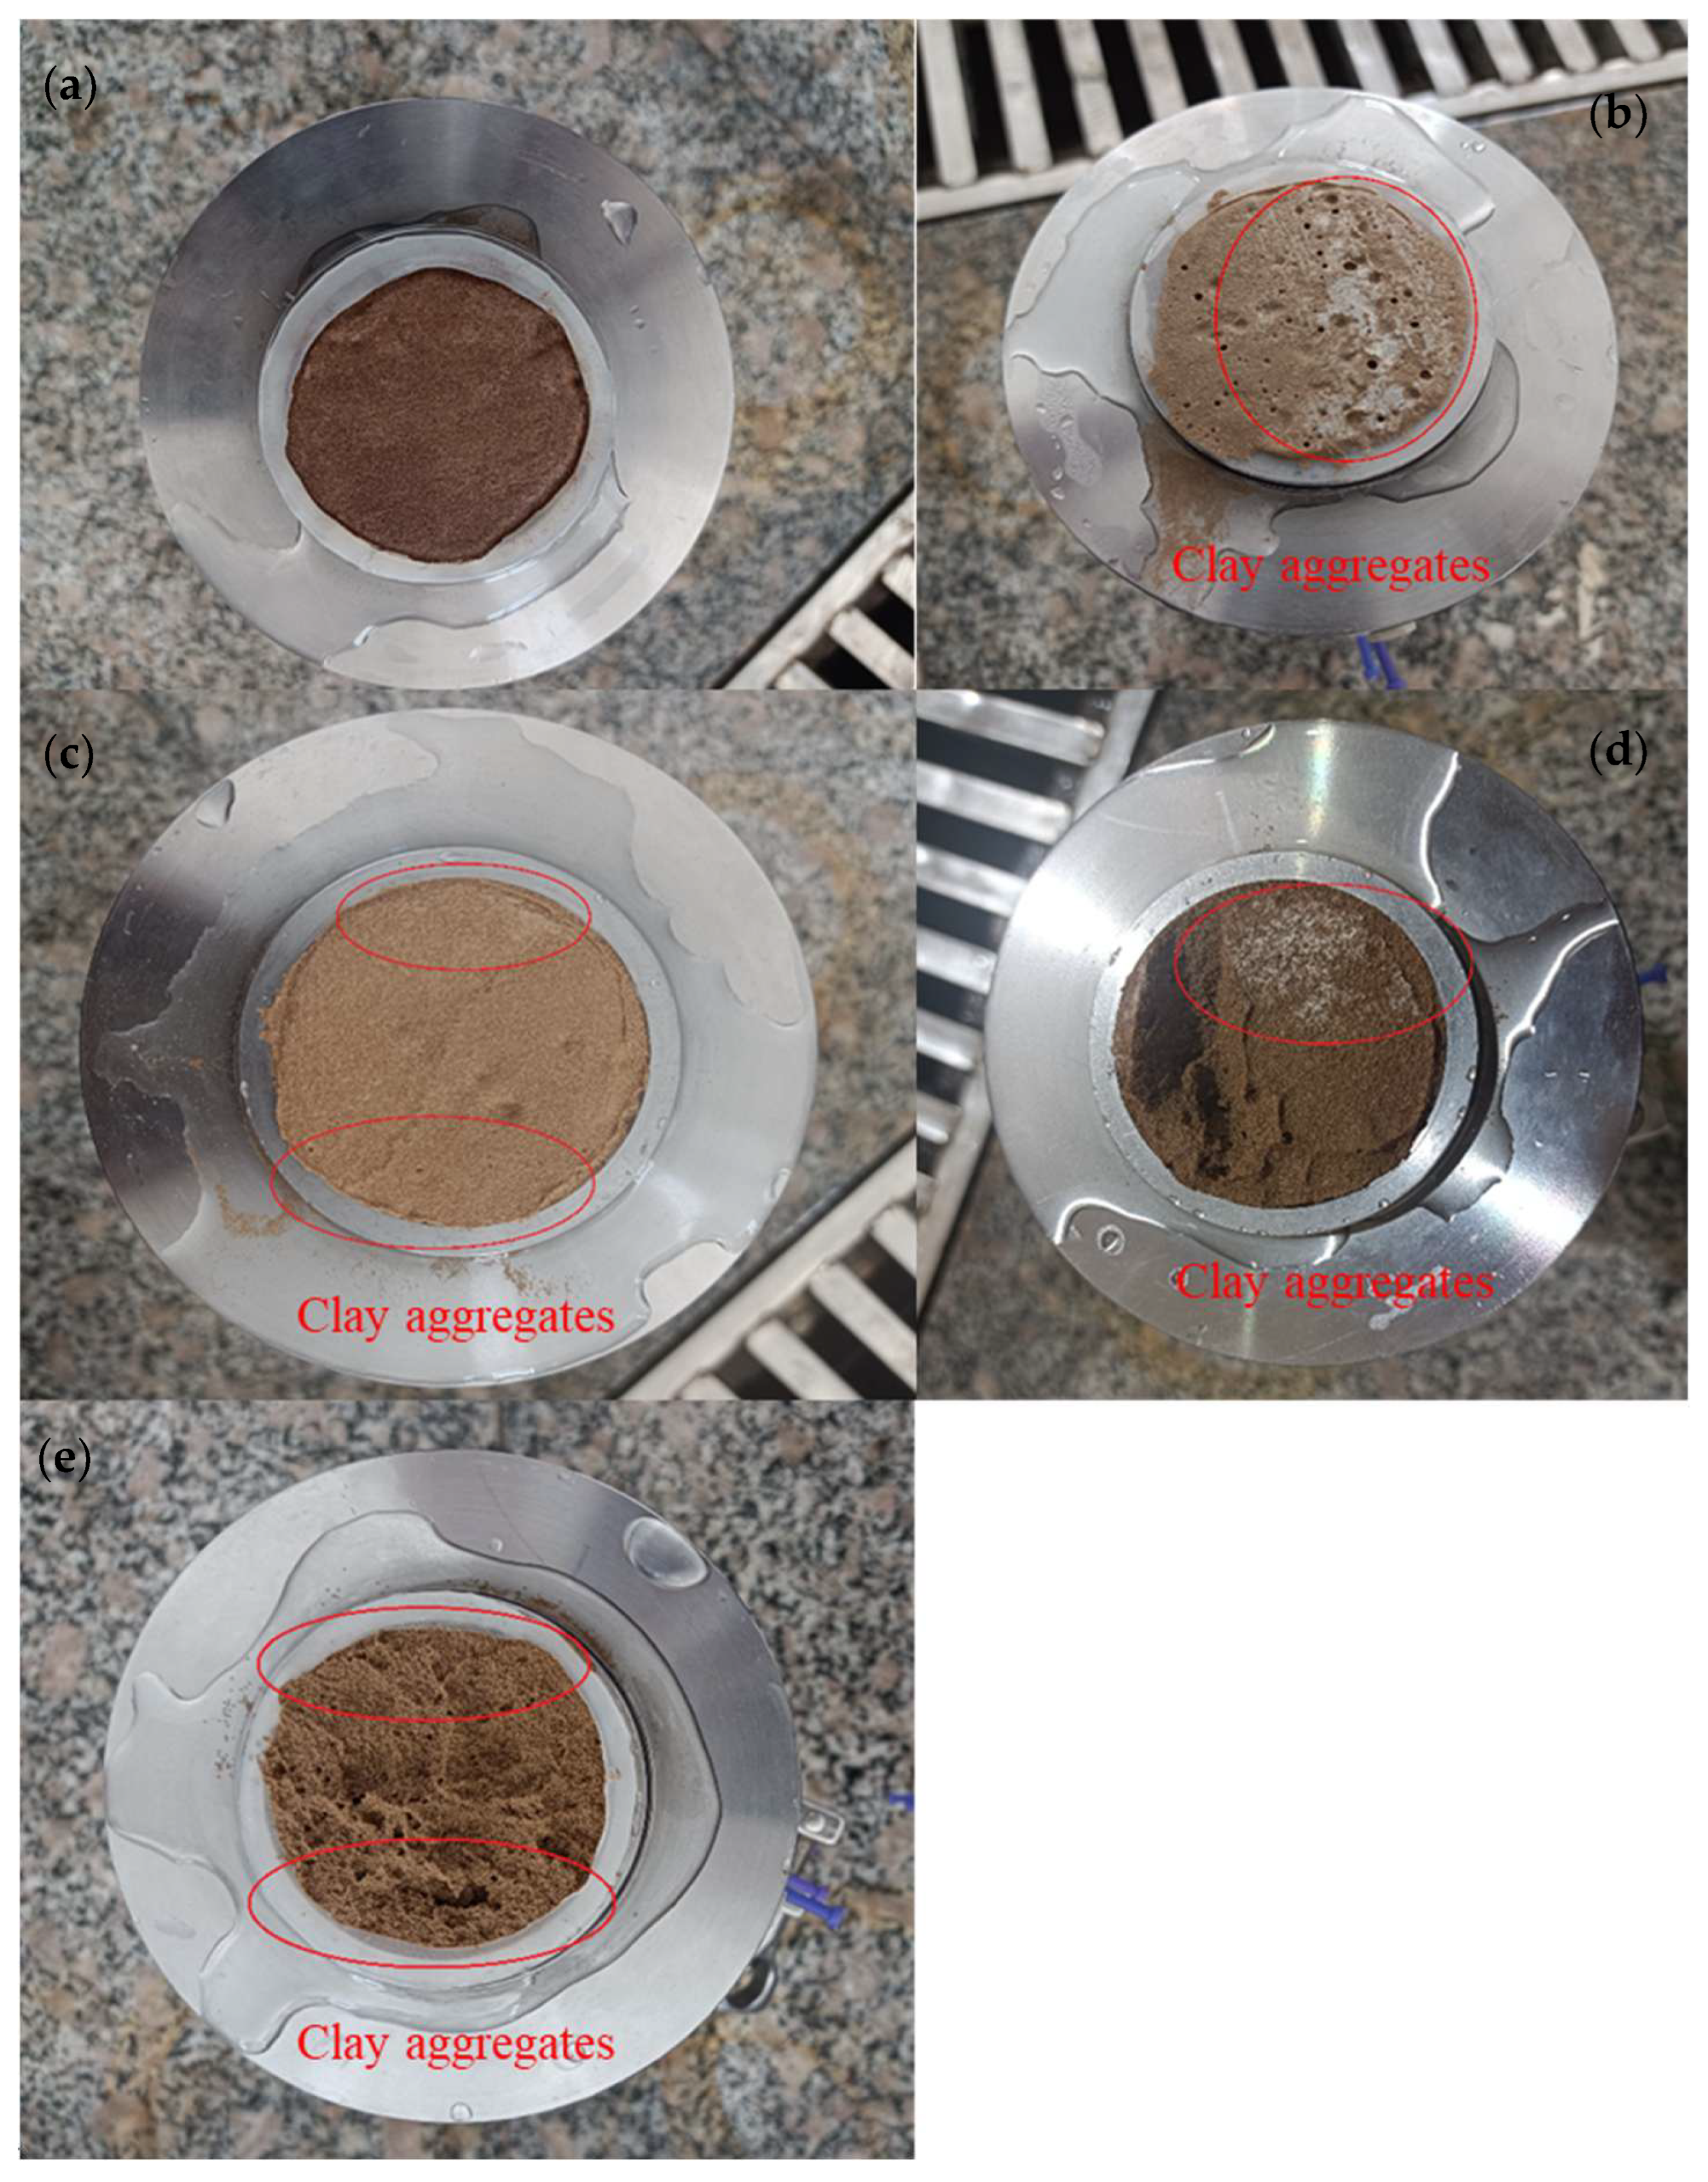
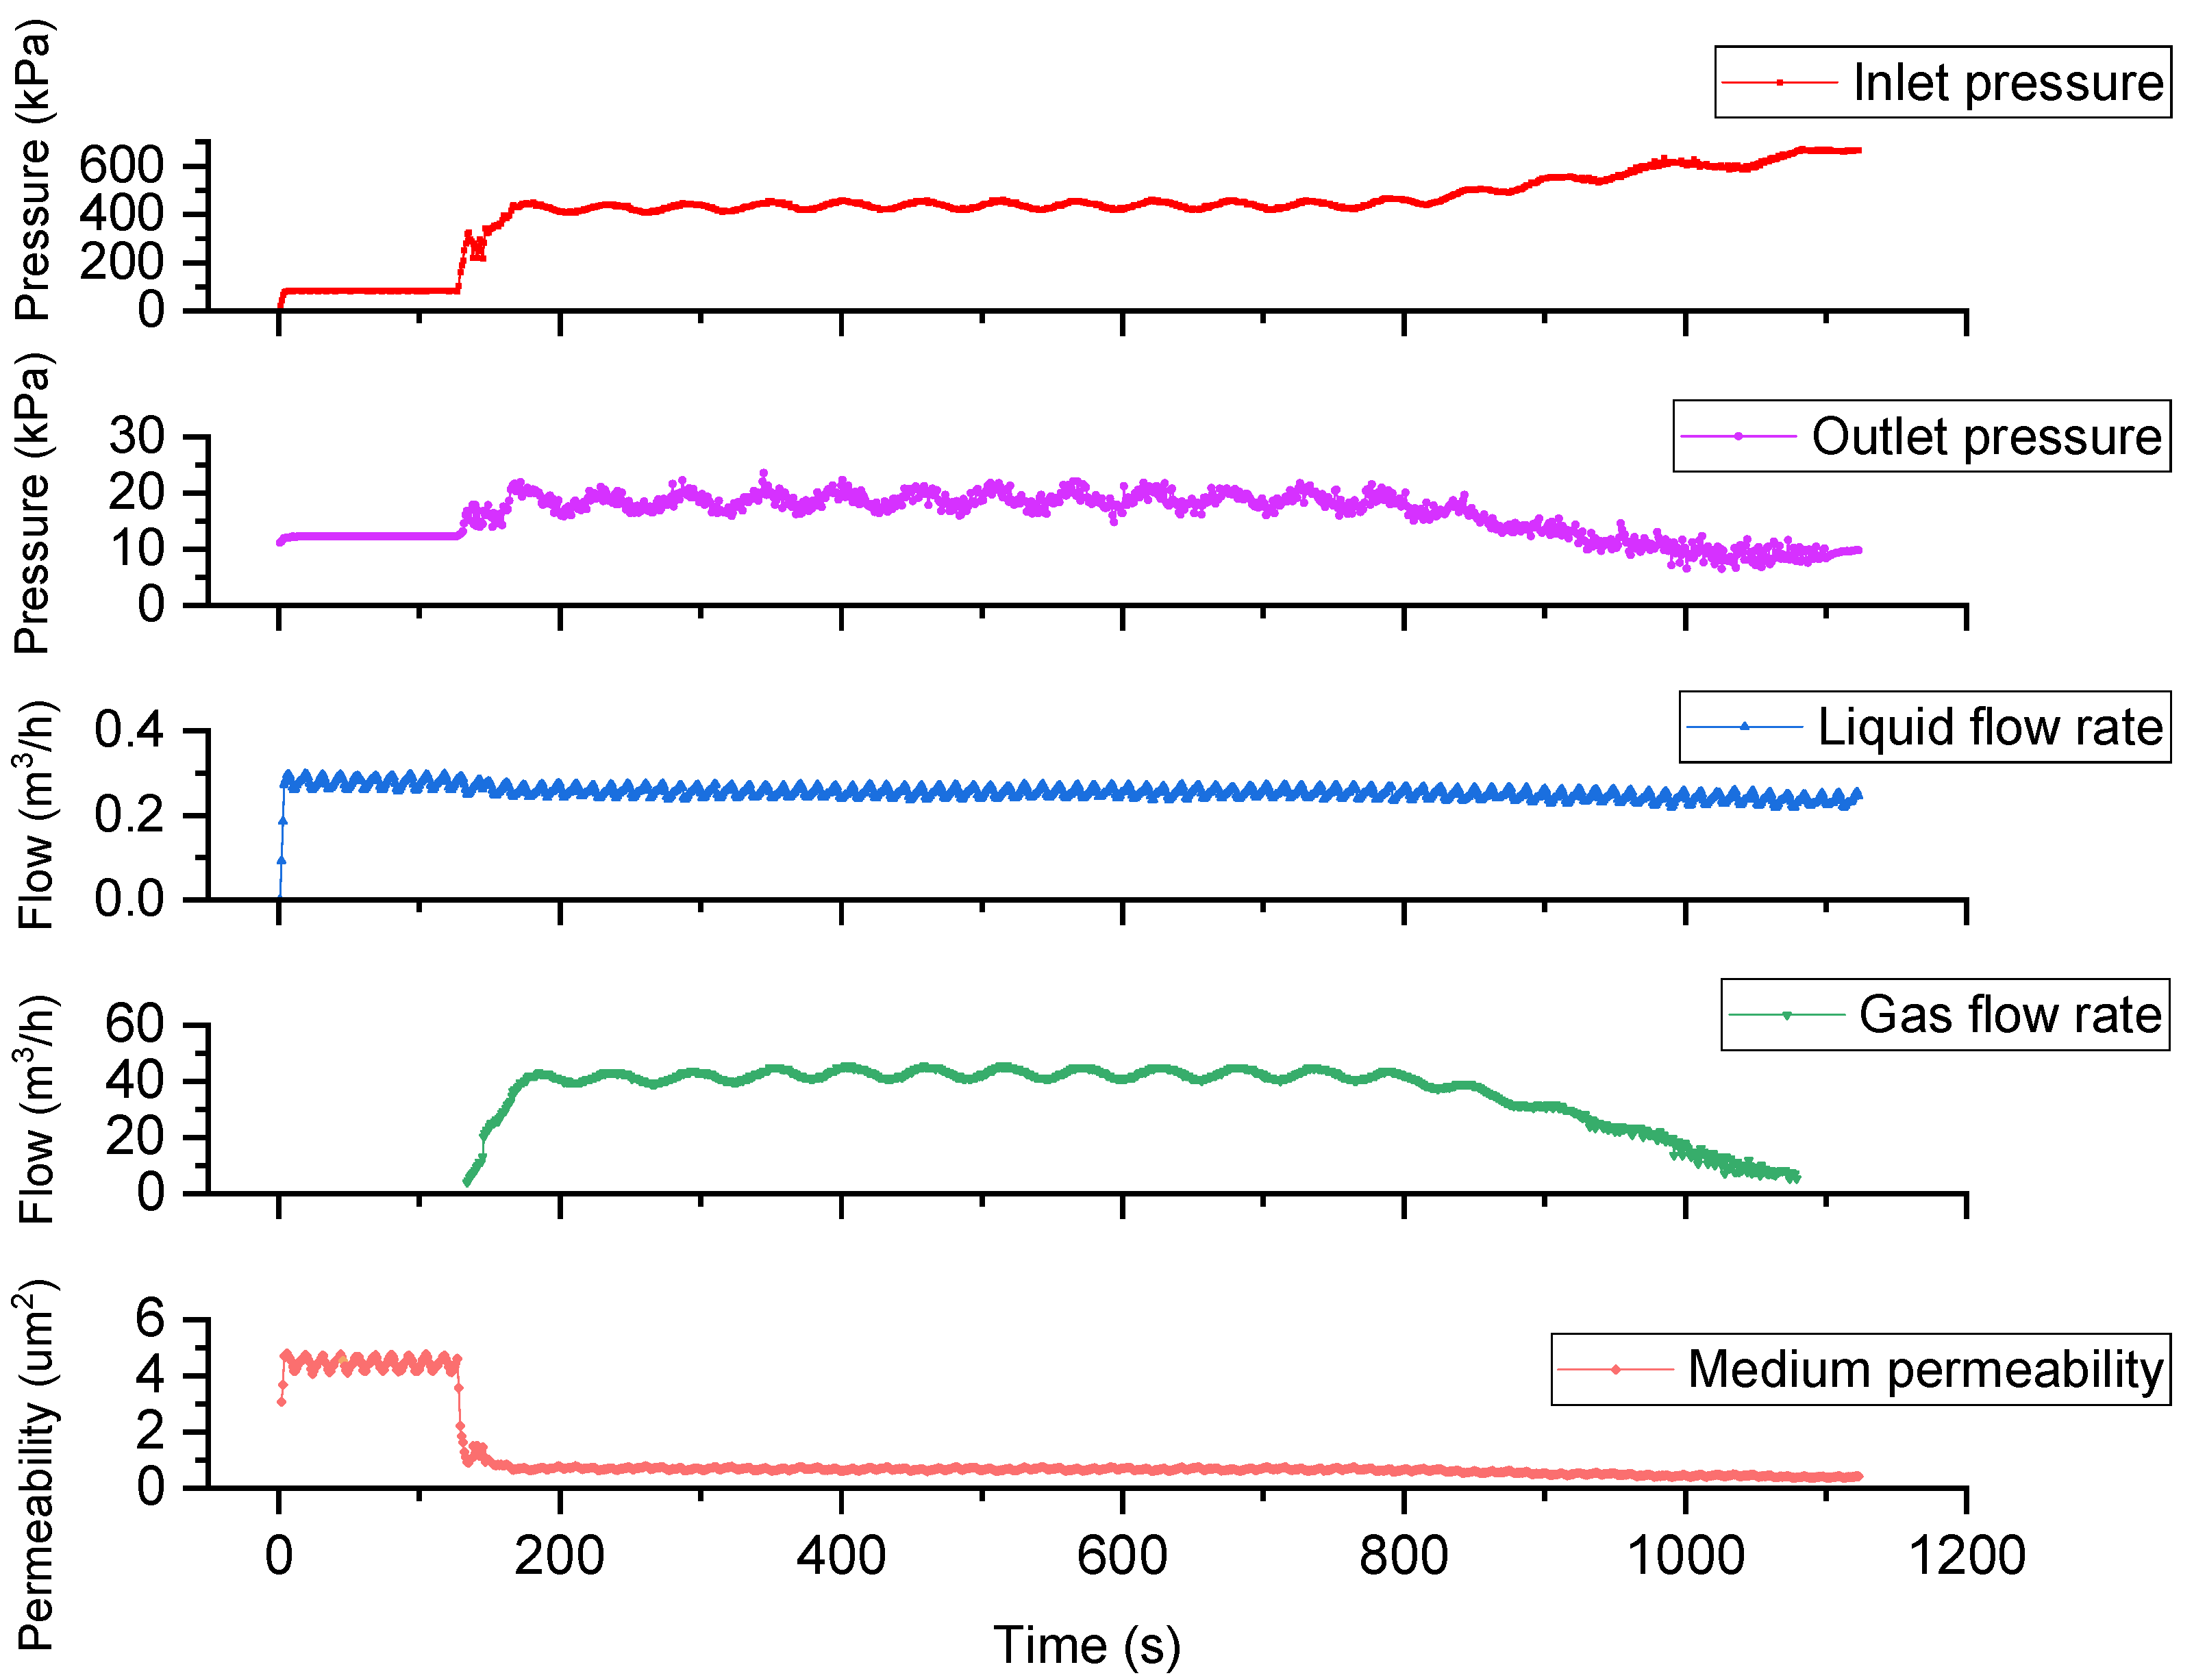
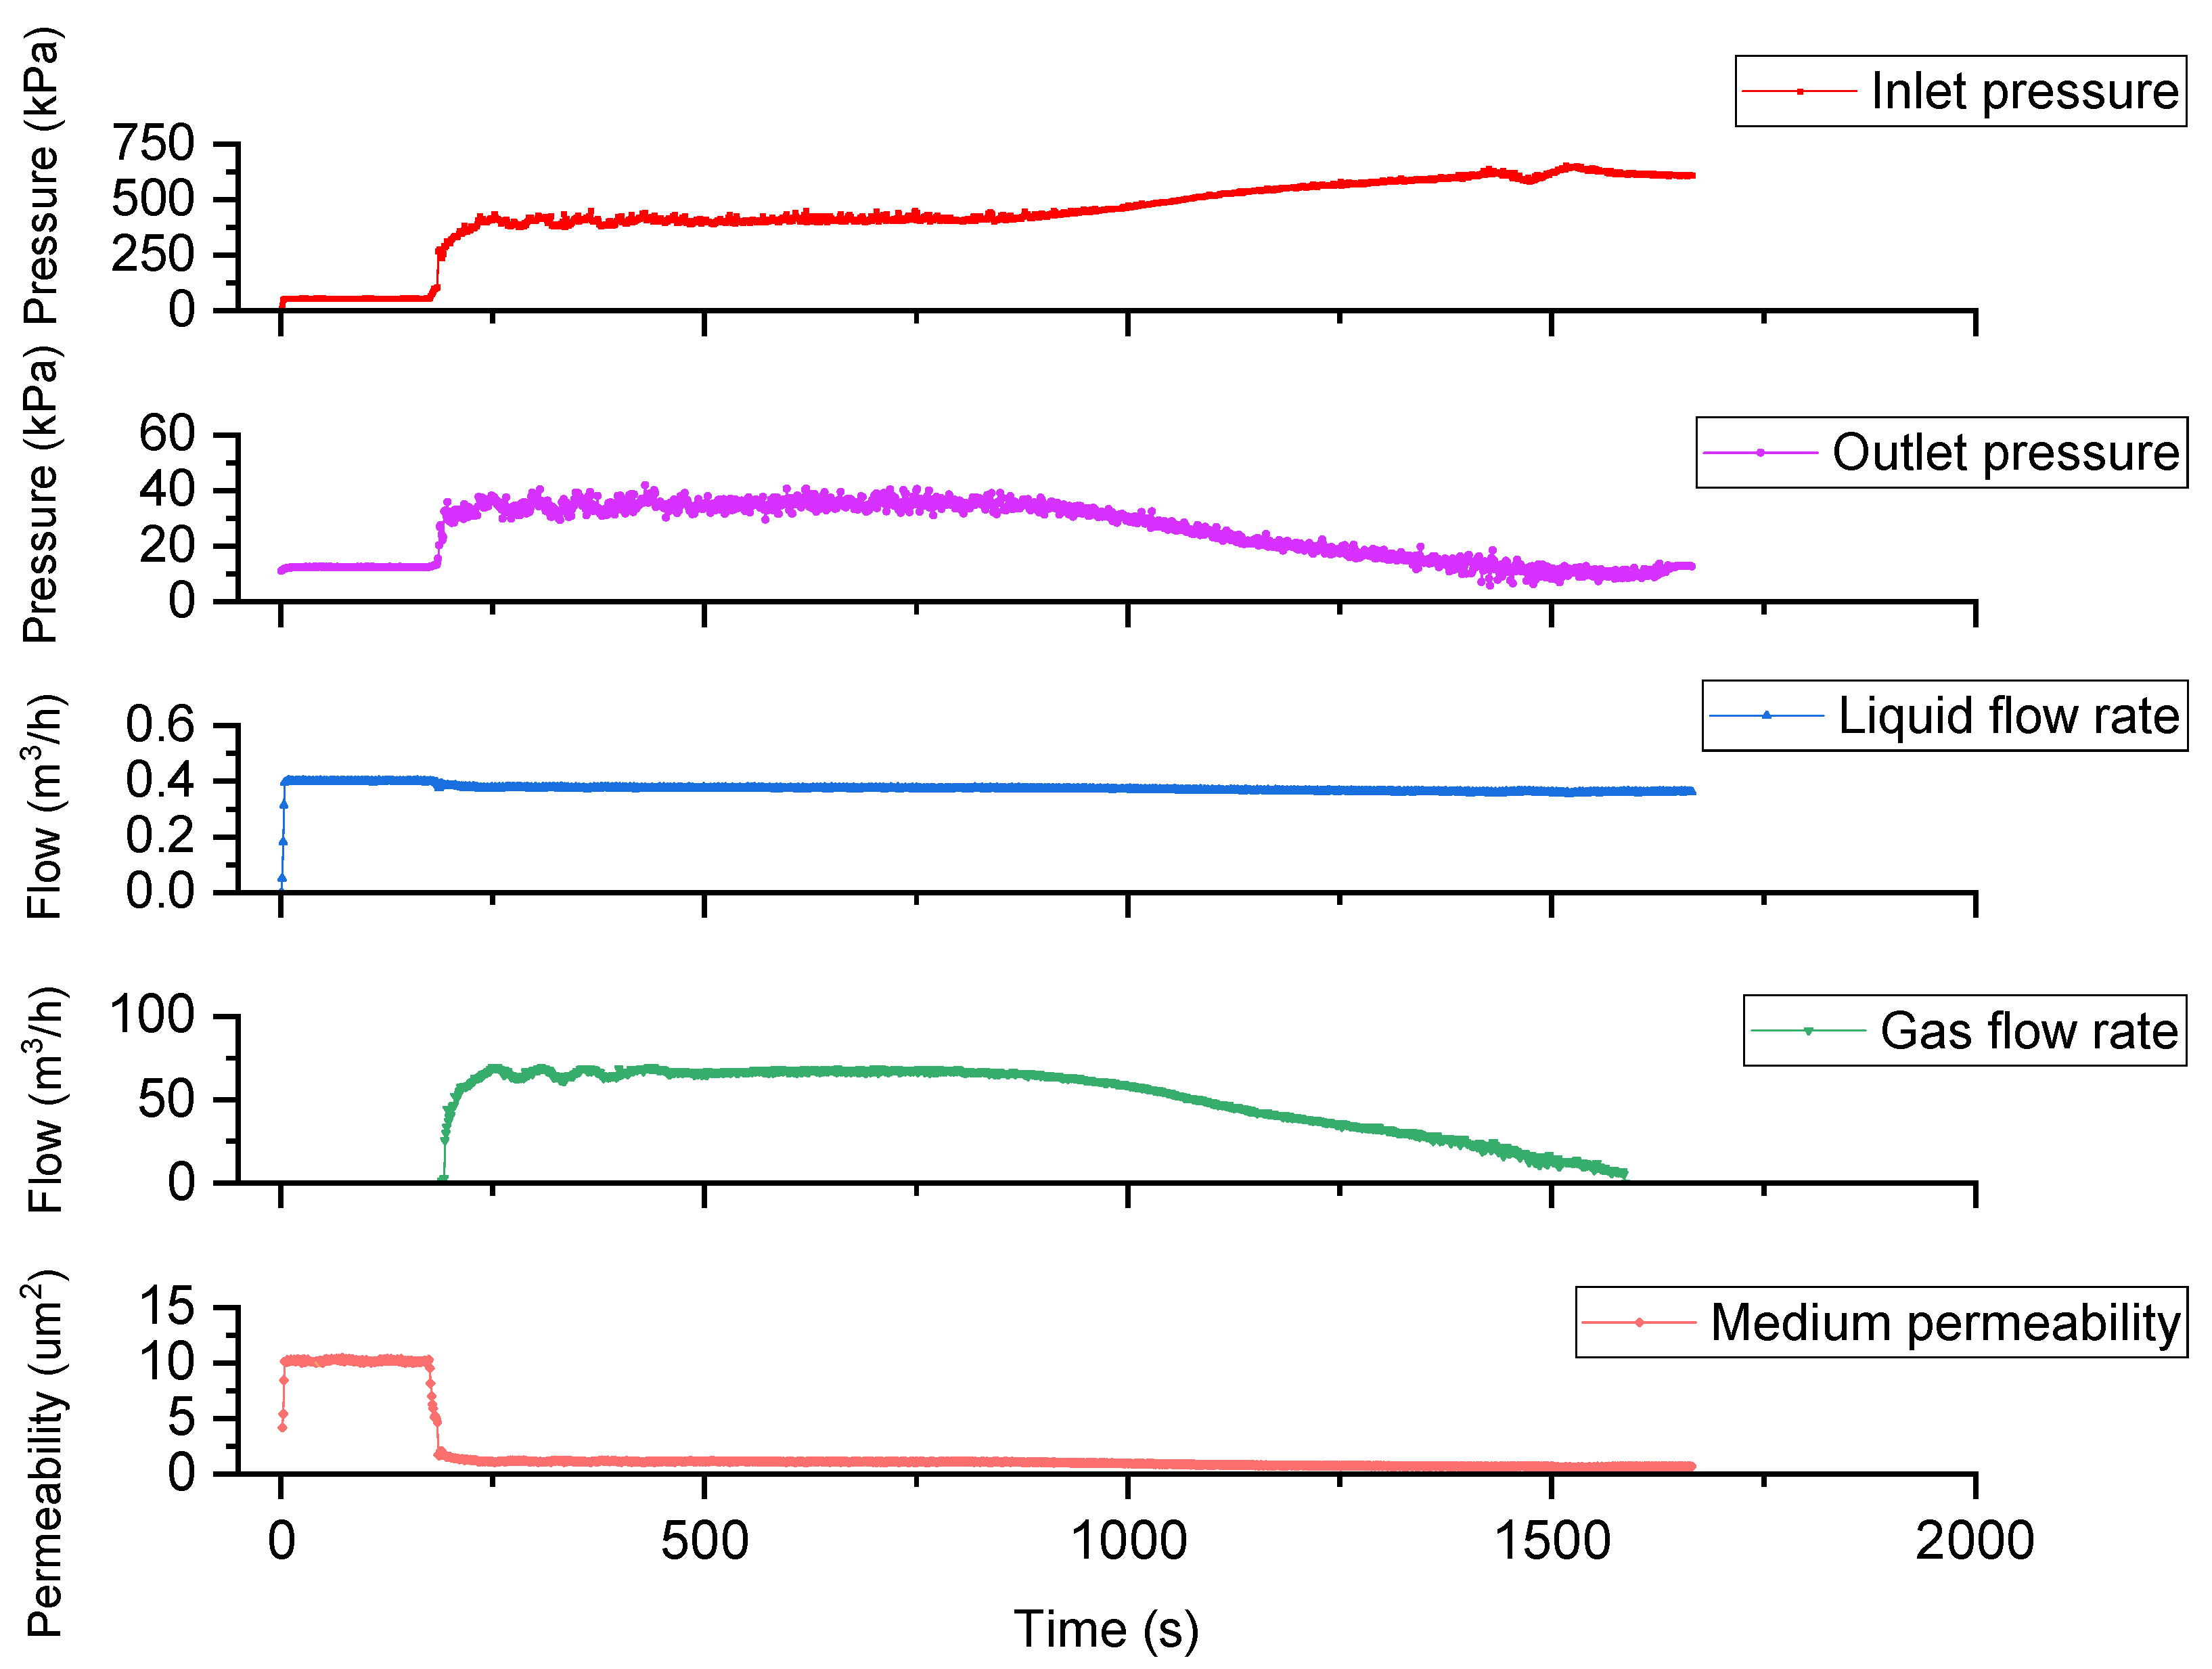
3.2. Medium-to-Coarse Ceramic Layers (140–170, 80–120, and 70–80 Mesh) and Three-Phase Plugging Behavior

For the 140–170 mesh (d50 = 128 μm), 80–120 mesh (d50 = 183 μm), and 70–80 mesh (d50 = 248 μm) ceramics, the plugging process exhibited three distinct phases (Figure 6, Figure 7, Figure 8 and Figure 9). Initial phase (0–120 s): Sand particles freely invaded the ceramic layer with minimal pressure increase (ΔP < 0.1 MPa). The permeability dropped gradually (e.g., from 15.2 μm2 to 12.8 μm2 for the 70–80 mesh), reflecting transient particle migration without significant bridging. Accelerated phase (120–400 s): Localized bridging at critical pore throats triggered exponential pressure growth. For example, the 80-120 mesh ceramic layer showed a sharp permeability decline to 1.5 μm2 (90% loss), accompanied by visible “sand arches” in the inlet region (Figure 5b–d). Equilibrium phase (>400 s): The pressure stabilized (e.g., ΔP ≈ 0.65 MPa for the 70–80 mesh), with the residual permeability plateauing at 2–5% of initial values. The gas–liquid interactions played a key role: periodic gas slugs disrupted the mud cakes, causing pressure oscillations (amplitude 0.15 MPa), a phenomenon that was absent in the single-phase flow. Notably, the 70–80 mesh layer retained higher residual permeability (18% vs. <5% for finer meshes), indicating that the optimal median grain size ratio should be set within the range of 24 to 31 to balance plugging resistance and productivity.

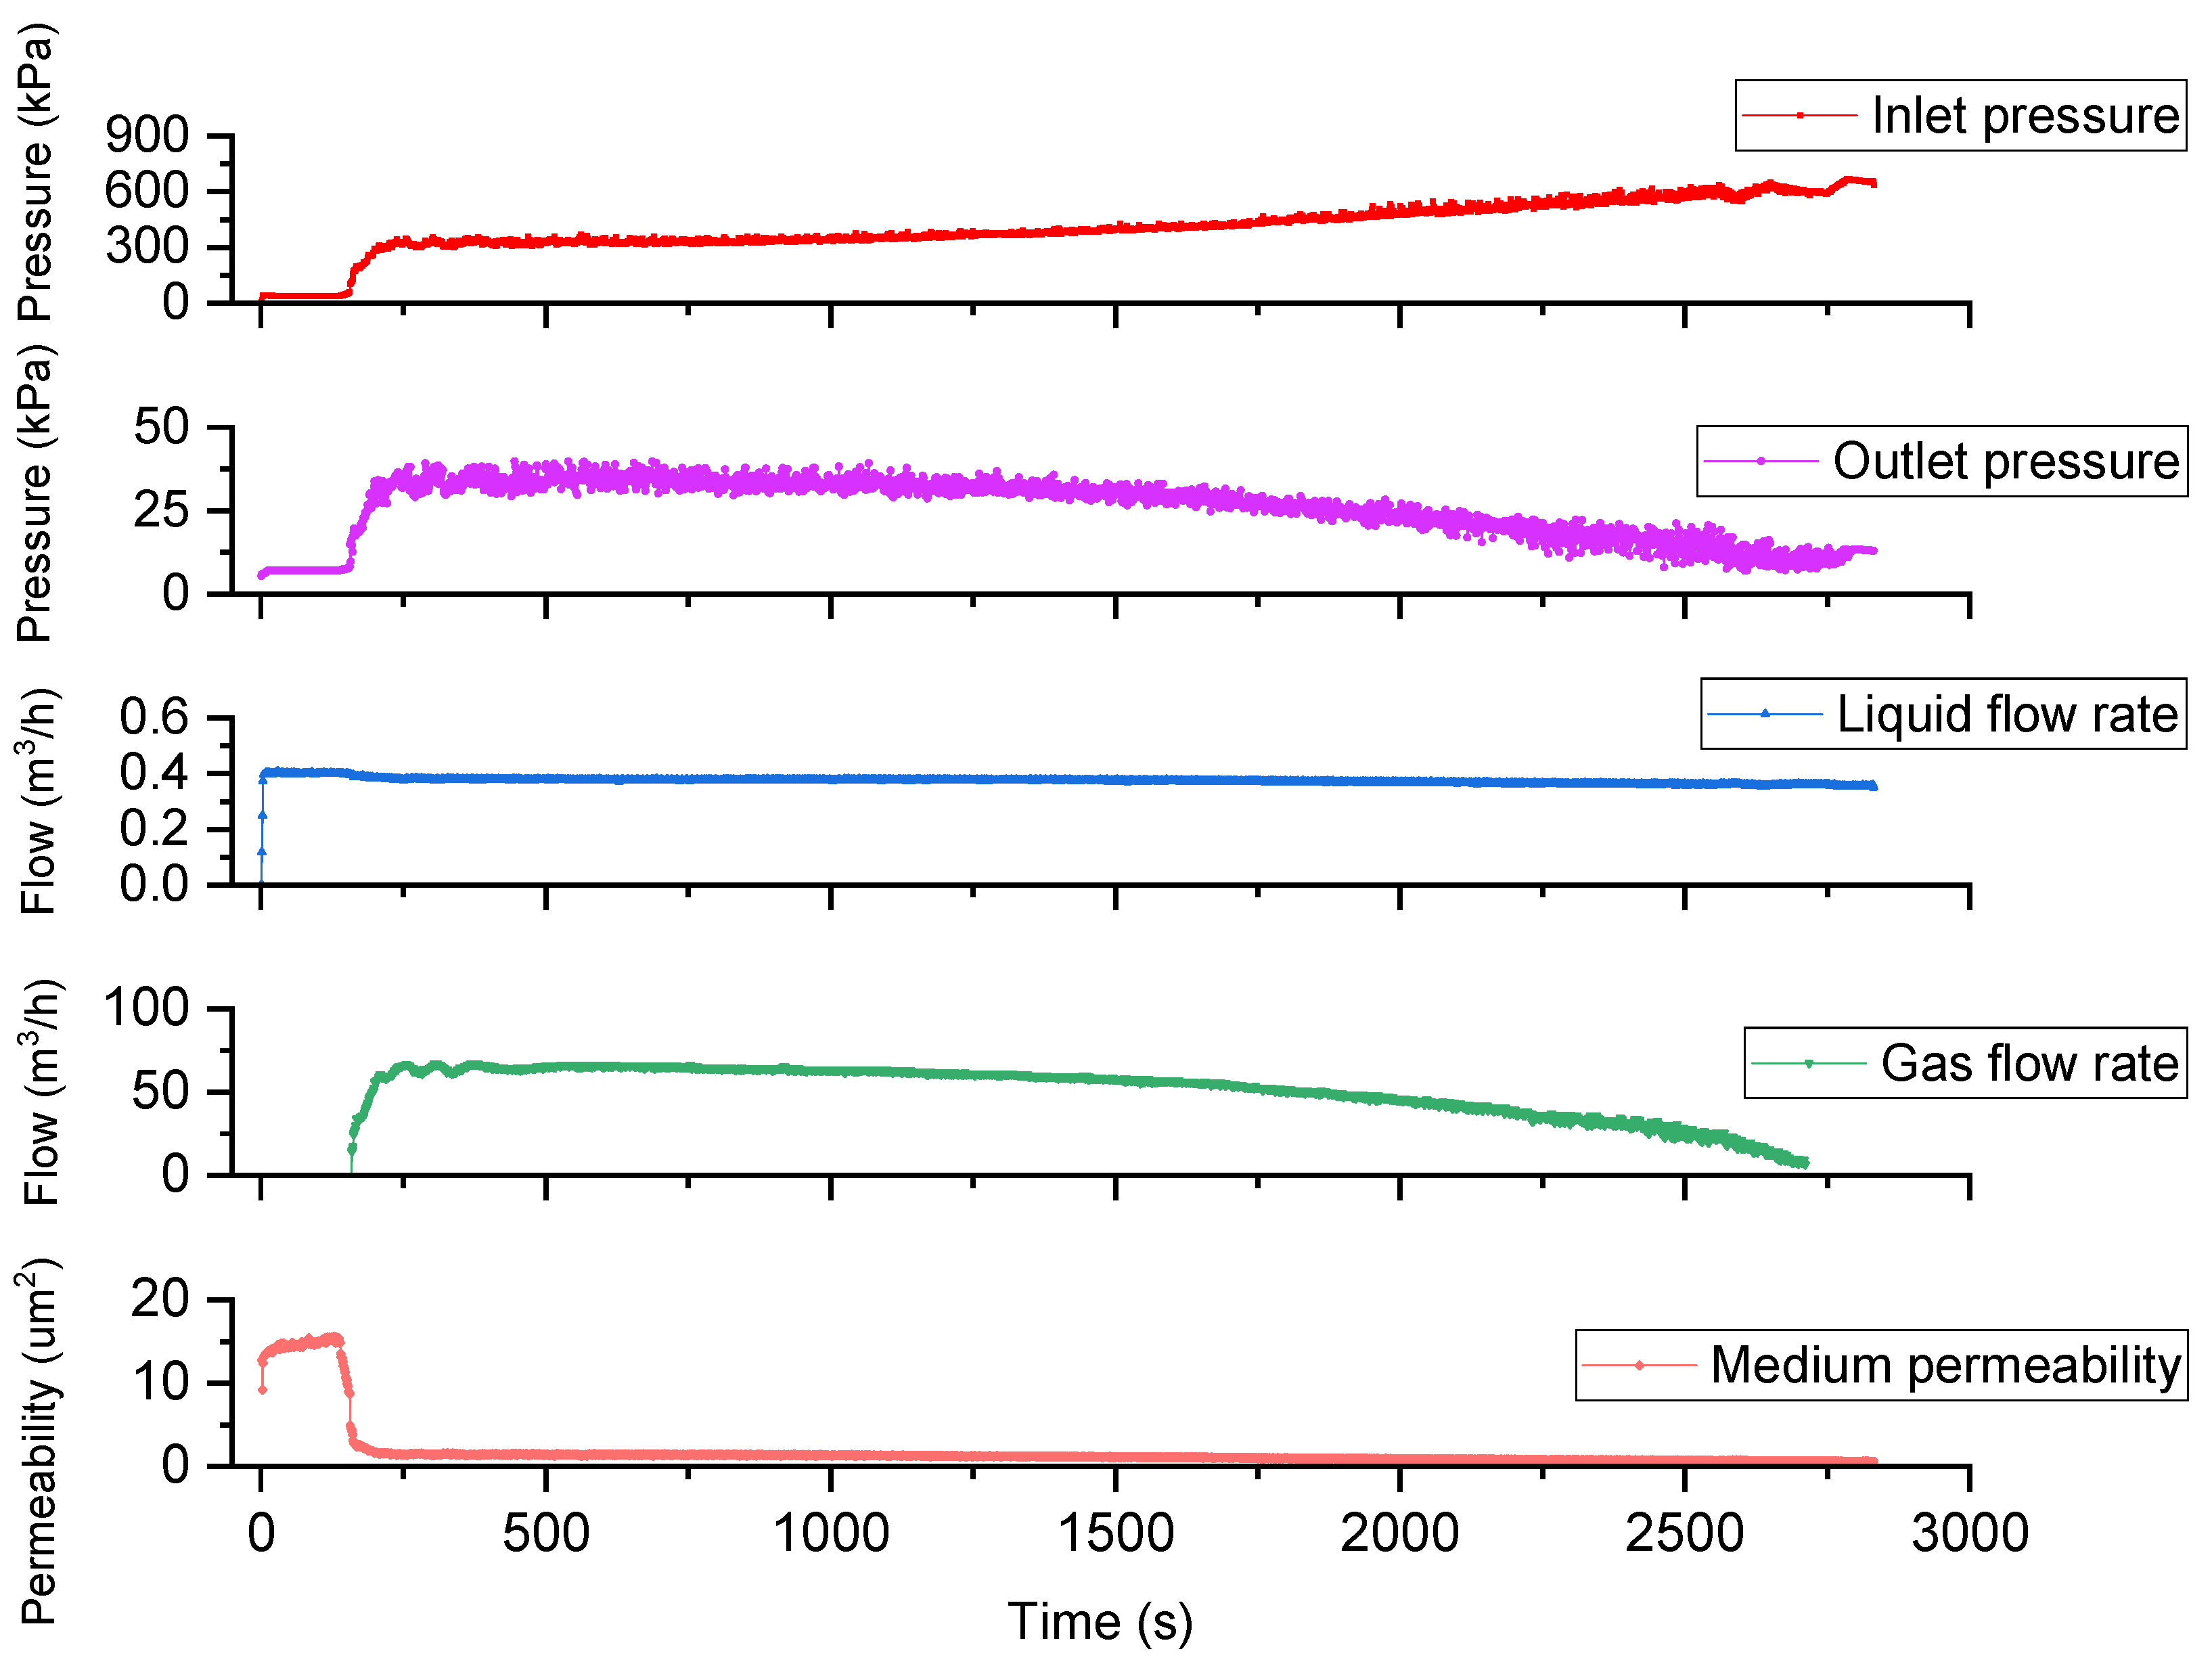
3.3. Coarse Ceramic Layer (40–70 Mesh) and Saucier Criterion Reassessment

The 40–70 mesh ceramic (d50 = 330 μm, median grain size ratio = 31) outperformed the finer meshes, achieving stable permeability (2.3 μm2) after 600 s of displacement (Figure 9 and Figure 10). The pressure increased moderately (ΔP = 0.45 MPa), with no safety-related termination. The post-test analysis (Figure 5e) showed sparse clay deposition and no mud-cake formation, confirming that larger pores resisted bridging. However, this result directly contradicts the Saucier criterion (median grain size ratio = 5–6), which would erroneously recommend finer gravel (e.g., 170–230 mesh). This discrepancy arises from two factors. (1) High clay plasticity: The simulated sand contains 39% montmorillonite-rich clay, which exhibits stress-dependent creep behavior, allowing it to seal pores through deformation even in oversized gravel. Tests revealed that the Young’s modulus of this clay is 45% lower than that of quartz-dominated sands, indicating higher compressibility and deformation capability. (2) Multiphase flow effects: Gas-reduced capillary forces stabilize the clay bridges. In water-saturated conditions, capillary pressure (Pc ≈ 0.2 MPa) promoted stable bridges, but gas intrusion lowered Pc by 60–80%, accelerating bridge collapse. These findings underscore the need to revise the Saucier criterion for hydrate reservoirs by incorporating clay content and multiphase flow dynamics.

3.4. Limitations and Field Implications

This study provides critical insights into ceramic filling layer optimization for hydrate reservoirs, yet several limitations must be acknowledged to guide field applications. The experimental conditions—fixed shale content (39%) and formation sand size (d50 = 10.5 μm)—reflect the Liwan area’s characteristics but omit regional variations in the South China Sea, where shale content ranges from 20% to 45% and sand heterogeneity (d50 = 8–16 μm) is pronounced [15,30]. Future numerical studies should adopt stochastic modeling approaches [22] to evaluate multi-scenario sensitivities. Moreover, the laboratory observation duration of less than one hour only captures the initial plugging dynamics and cannot directly predict long-term ceramic stability. Experimental permeability measurements indicate a rapid decline during the initial clogging phase, with further studies needed to extrapolate these trends to field-scale timelines. The isothermal assumption also overlooks hydrate dissociation-induced cooling (~2 °C [3]), which may amplify clay swelling (montmorillonite expands 150% at 5 °C [16]), necessitating coupled thermal–hydraulic models [5] for field designs. Furthermore, the unidirectional flow in the 50 mm-diameter cell inadequately replicates the convergent radial flow near actual wellbores. The radial flow experiments by Zhang et al. [25] demonstrated that fluid convergence amplifies mud-cake compression at the screen interface, increasing the skin factor by 1.5–2 compared to linear flow. This suggests our setup may underestimate near-wellbore plugging severity. To address scaling discrepancies between laboratory and field conditions, future work should prioritize direct comparisons of experimental results with field data, incorporating geometric and dynamic similarity principles from sand control completion design.

4. Conclusions

(1)
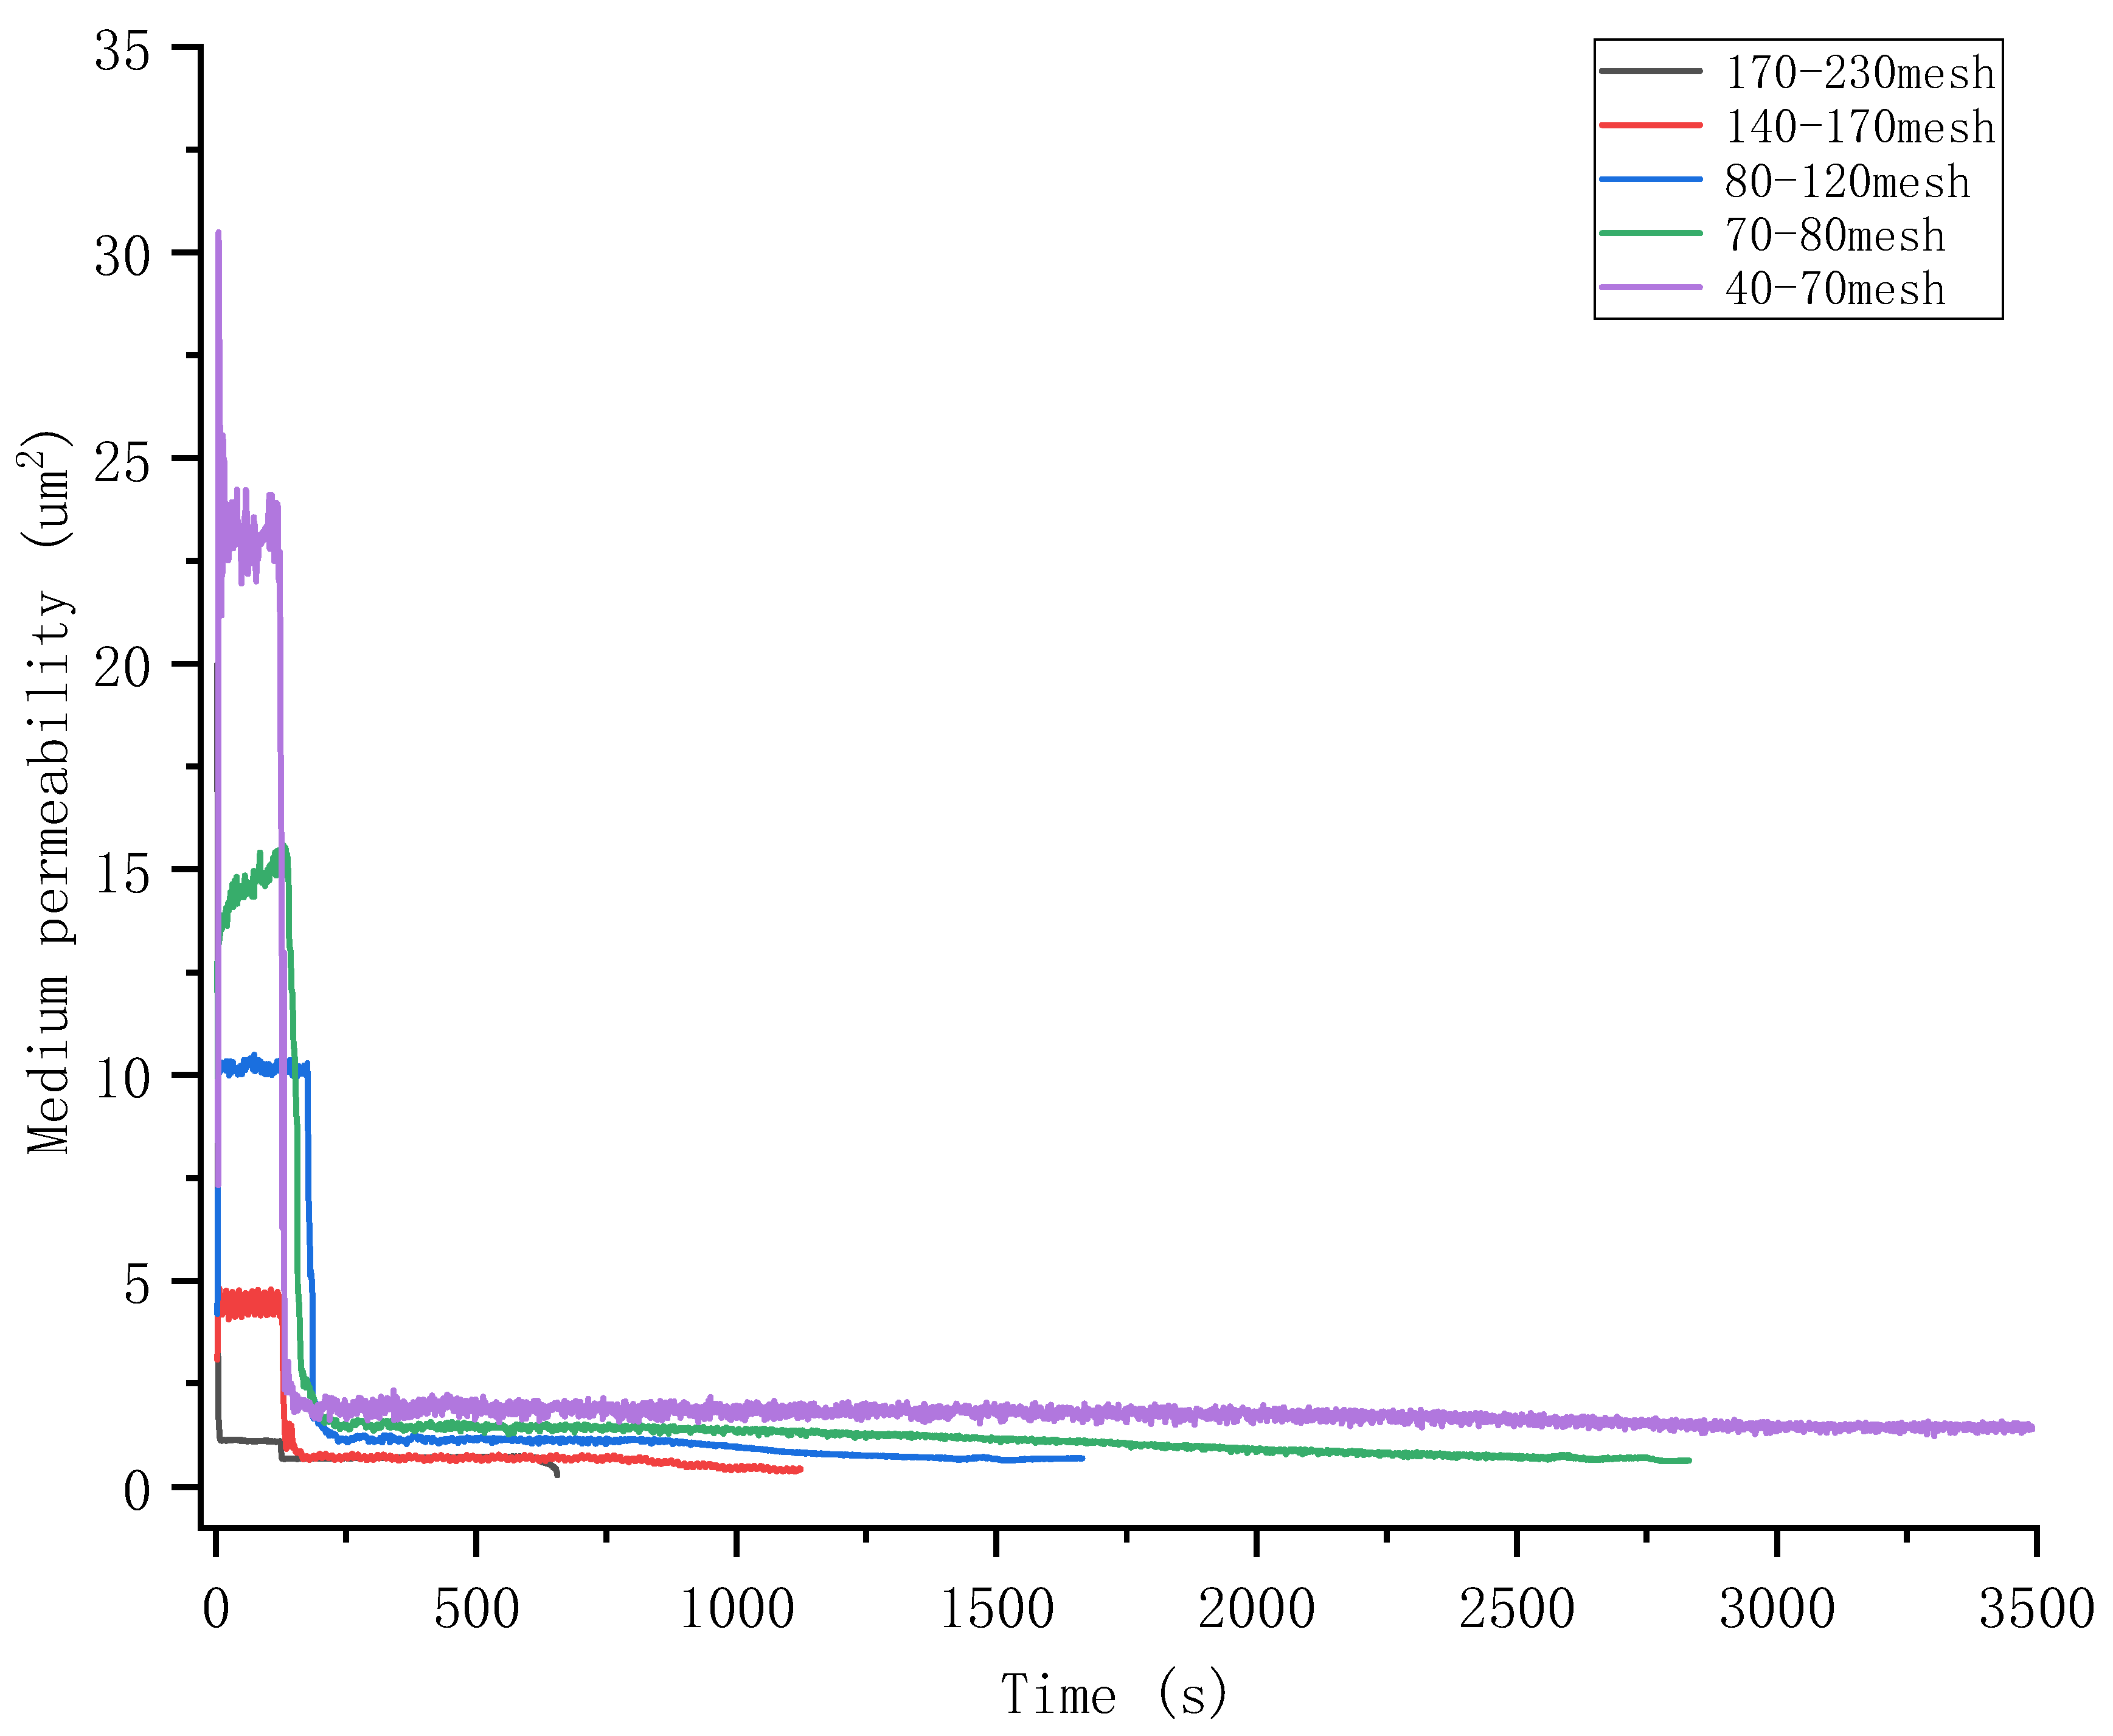
Limitations of Conventional Criteria in Mud-Rich Hydrate Systems: The Saucier criterion (median grain size ratio = 5–6), widely adopted in unconsolidated sandstones, proves inadequate for hydrate reservoirs with high shale content (e.g., 39% clay in South China Sea analogs). Our experiments reveal that even at a median grain size ratio of 24 (70–80 mesh ceramics), rapid plugging occurs due to mud-cake formation under gas–water mixed flow (Figure 5). This challenges the universality of traditional sand control design and necessitates a revised threshold (median grain size ratio ≥ 30) for hydrate-specific conditions, where clay migration dominates permeability loss over mechanical sand retention.
(2)
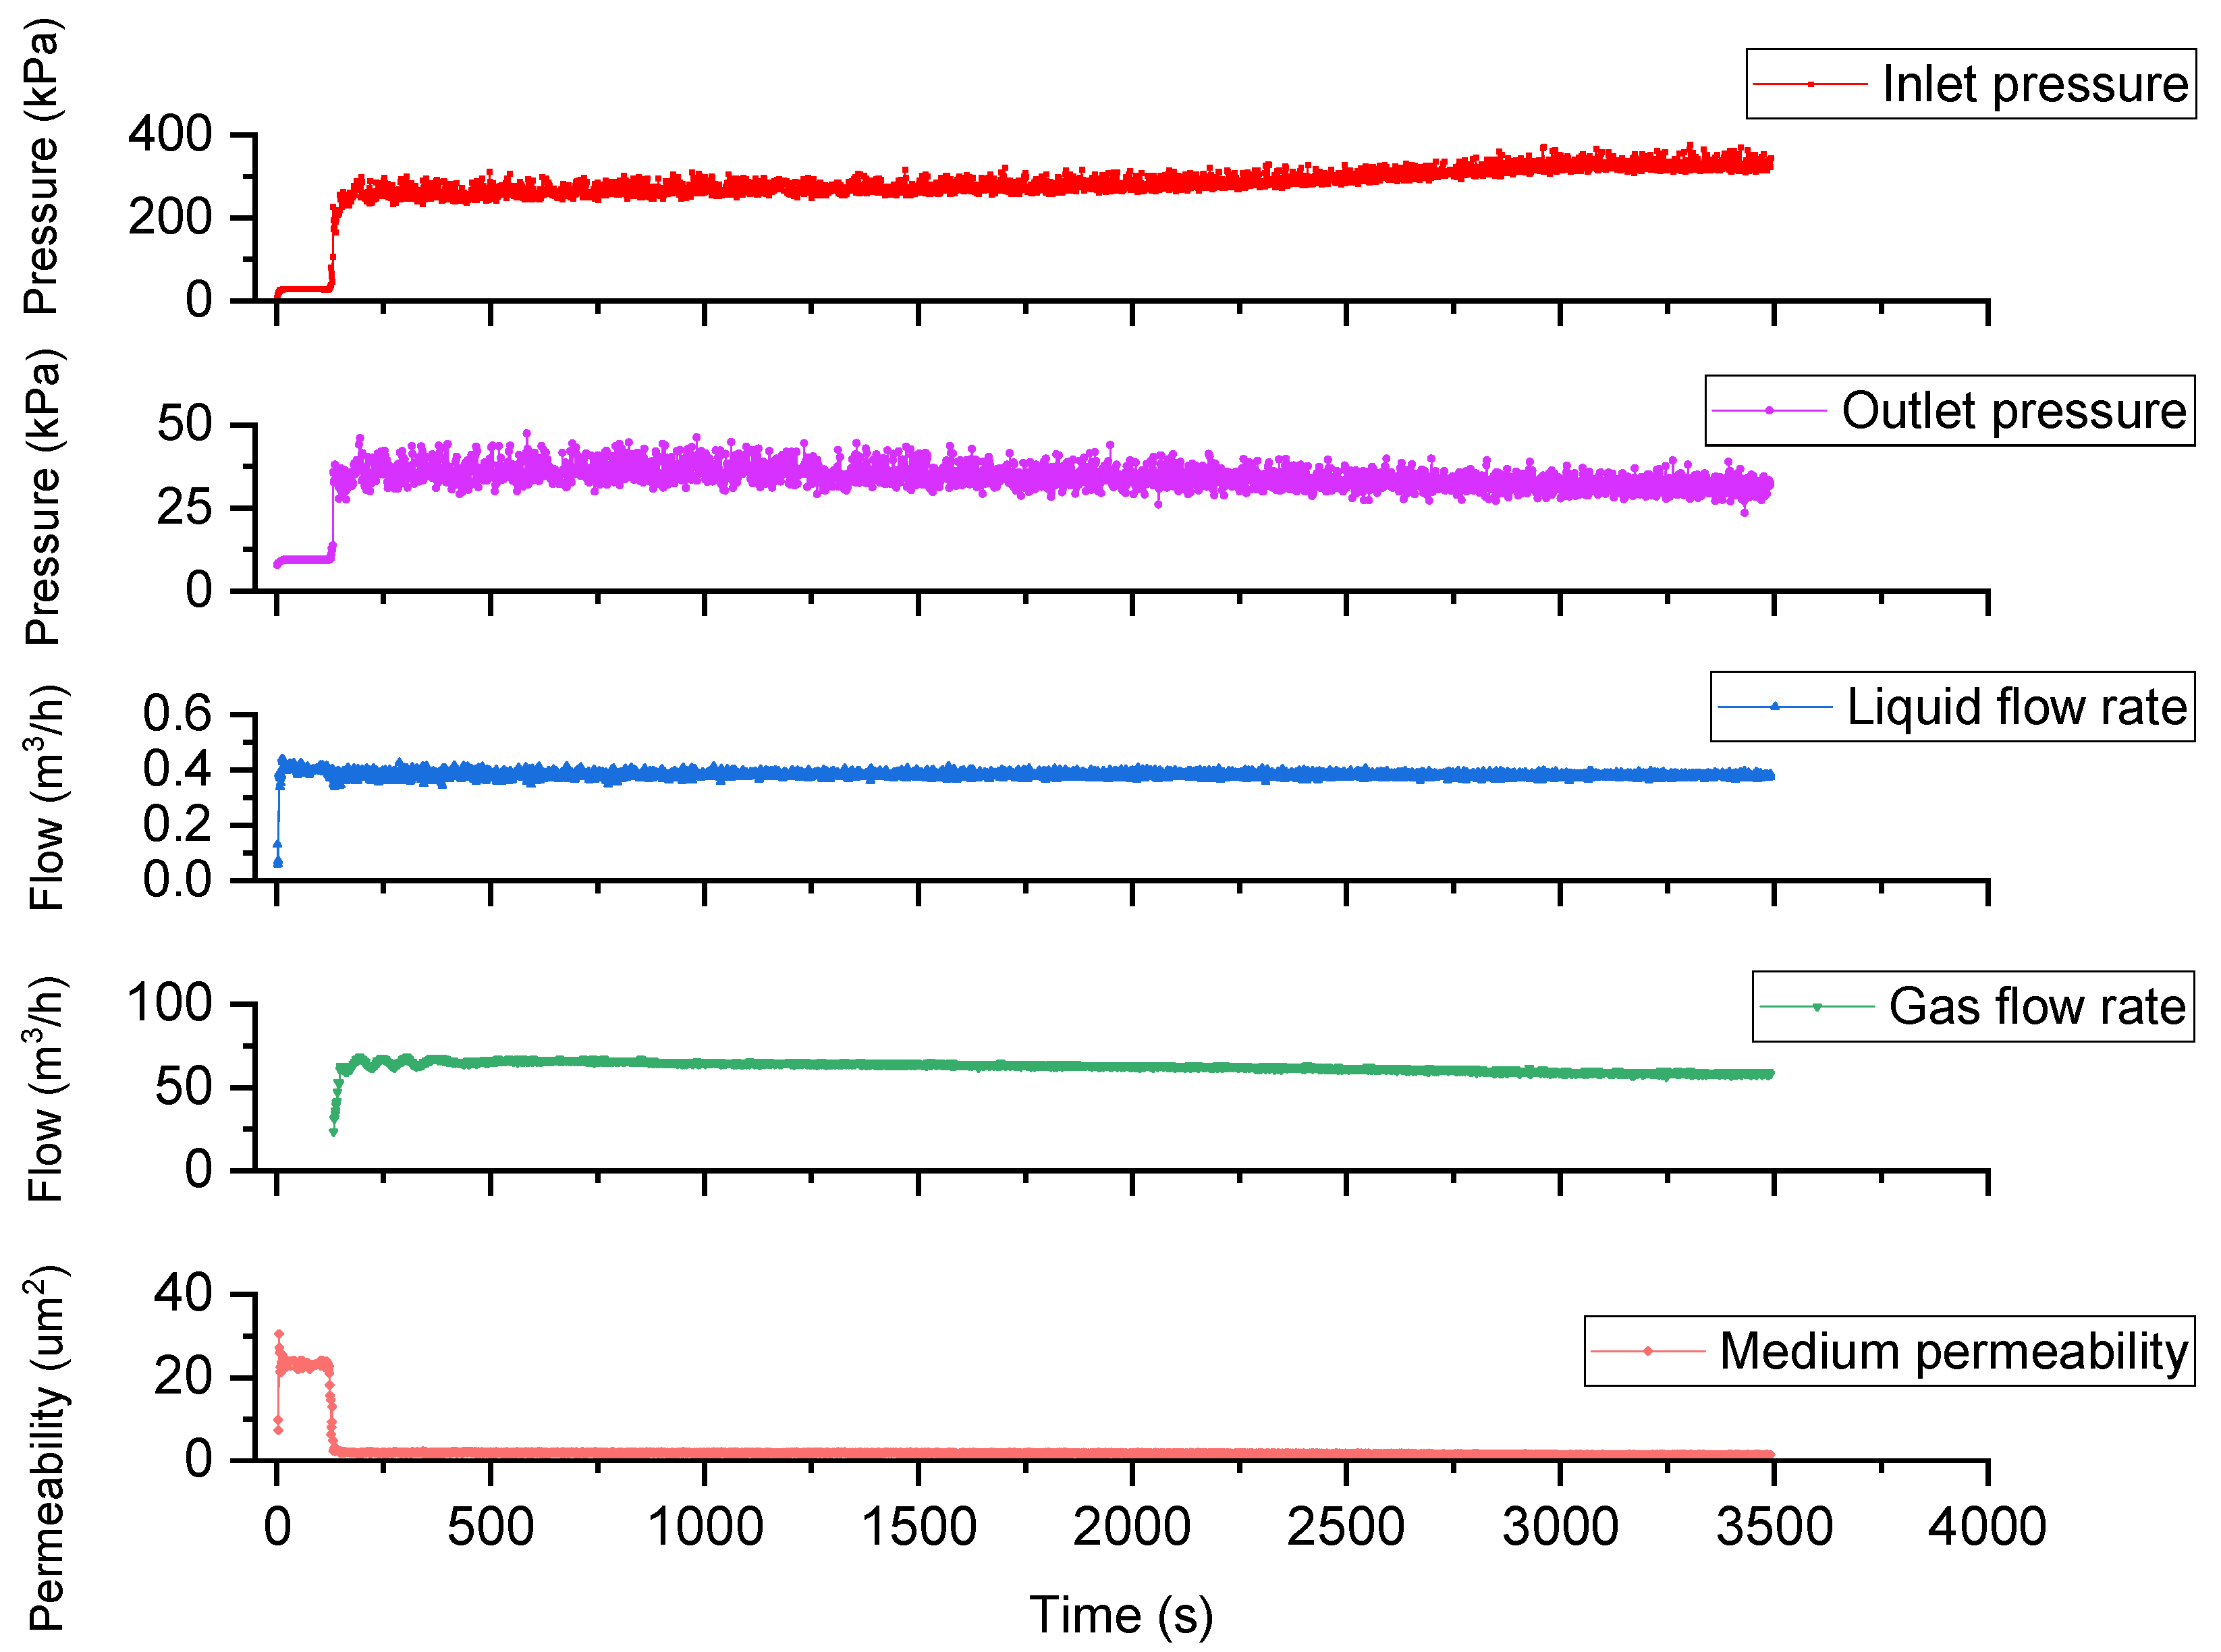
Optimized Ceramic Grading Strategy for Productivity Preservation: The median grain size ratio, gradientally distributed between 24–31, emerges as the critical balance point, achieving 54% retained permeability (initial k = 15.3 μm2, final k = 8.3 μm2) while blocking > 95% of formation sand (>20 μm). To address the transient fines invasion observed in “three-stage plugging” (Section 3.2), we propose a dual-layer graded packing. Primary layer: ceramics with a 40–70 mesh size (critical median grain size ratio of 27 ± 2) used for coarse sand retention through mechanical sieving and pore size optimization. Secondary layer: ceramics with a median grain size ratio in the 24–31 range to mitigate clay migration via gradient pore blocking and electrostatic stabilization. This configuration leverages the self-sealing behavior of mud cakes while minimizing the skin factor, offering a 23% productivity improvement over single-layer designs (vs. Ref. [25]). By selecting an optimal median grain size ratio within the range of 24 to 31 for the secondary layer, both sand control efficiency and permeability retention can be further optimized.
In this dual-layer structure, the primary layer using 40–70 mesh ceramics ensures the effective interception of larger particles, while the secondary layer fine-tunes the median grain size ratio to optimize the management of finer particles and clay, thereby achieving the best overall performance.
(3)
Roadmap for Field Application and Knowledge Gaps: Key barriers to scaling laboratory findings include (a) temperature sensitivity: depressurization-induced cooling (ΔT ≈ −2 °C [4]) may alter clay swelling dynamics, unaccounted for in current isothermal experiments; (b) long-term stability: ceramic abrasion and chemical interactions (e.g., hydrate reformation in pores) require >1000-h cyclic flow tests; and (c) radial flow bias: unidirectional experiments underestimate screen erosion in the radial wells (3× higher plugging rates observed in Ref. [25]). To bridge these gaps, future work should prioritize (a) multi-physics modeling: integrate thermal-hydraulic-mechanical (THM) coupling with DEM to predict mud-cake evolution; (b) material engineering: develop hydrophobic ceramic coatings (e.g., silane grafting [22]) to inhibit clay adhesion; and (c) field pilots: validate graded packing in offshore hydrate trials with real-time P/T/sand monitoring (e.g., China’s Shenhu Area).

Author Contributions

Methodology, A.Z.; Formal analysis, Y.Z. and M.M.; Data curation, F.X.; Writing—original draft, X.Z.; Writing—review & editing, H.Z. All authors have read and agreed to the published version of the manuscript.

Funding

The work described in this paper is supported by the Prospective Research Project of Petroleum and Gas Development Foundation of Science and Technology, Department of Sinopec (P20040-3), Postdoctoral Program of Sinopec Shengli Oilfield (YKB2107), and Dongying Natural Science Foundation (2023ZR013).

Data Availability Statement

The original contributions presented in this study are included in the article. Further inquiries can be directed to the corresponding author.

Conflicts of Interest

Authors Xiaolong Zhao and Meng Mu were employed by the company Research Institute of Petroleum Engineering, Sinopec Shengli Oilfield Company. Author Yizhong Zhao was employed by the company Zhongsheng Petroleum Development Co., Ltd. Author Aiyong Zhou was employed by the company Haian FaDa Petroleum Instrument Technology Co., Ltd. The remaining authors declare that the research was conducted in the absence of any commercial or financial relationships that could be construed as a potential conflict of interest. The authors declare that this study received funding from Sinopec Shengli Oilfield. The funder was not involved in the study design, collection, analysis, interpretation of data, the writing of this article or the decision to submit it for publication.

References

  1. Zhang, X.; Lu, X.; Liu, L. Advances in natural gas hydrate recovery methods. Prog. Geophys. 2014, 29, 858–869. (In Chinese) [Google Scholar] [CrossRef]
  2. Jia, R.; Xu, J.; Hao, D.; Li, Q.; Yang, G. The influence of reservoir and exploitation parameters on production capacity of gas hydrate. Mar. Geol. Quat. Geol. 2023, 43, 202–216. (In Chinese) [Google Scholar] [CrossRef]
  3. Li, S.; Guo, S.; Chen, Y.; Zhang, N.; Wu, D. Advances and recommendations for multi-field characteristics and coupling seepage in natural gas hydrate development. Chin. J. Theor. Appl. Mech. 2020, 52, 828–842. (In Chinese) [Google Scholar] [CrossRef]
  4. Rutqvist, J.; Moridis, G.J.; Grover, T.; Collett, T. Geomechanical response of permafrost-associated hydrate deposits to depressurization-induced gas production. J. Pet. Sci. Eng. 2009, 67, 1–12. [Google Scholar] [CrossRef]
  5. Akaki, T.; Kimoto, S. Numerical modelling of internal erosion during hydrate dissociation based on multiphase mixture theory. Int. J. Numer. Anal. Methods Geomech. 2020, 44, 327–350. [Google Scholar] [CrossRef]
  6. Rutqvist, J.; Moridis, G.; Grover, T.; Silpngarmlert, S.; Collett, T.; Holdich, S. Coupled multiphase fluid flow and wellbore stability analysis associated with gas production from oceanic hydrate-bearing sediments. J. Pet. Sci. Eng. 2012, 92, 65–81. [Google Scholar] [CrossRef]
  7. Yan, C.; Dong, L.; Ren, X.; Cheng, Y. Stability of submarine slopes during replacement of methane in natural gas hydrates with carbon dioxide. J. Clean. Prod. 2023, 383, 135440. [Google Scholar] [CrossRef]
  8. He, Y.; Song, B.; Li, Q. Coupling Submarine Slope Stability and Wellbore Stability Analysis with Natural Gas Hydrate Drilling and Production in Submarine Slope Strata in the South China Sea. J. Mar. Sci. Eng. 2023, 11, 2069. [Google Scholar] [CrossRef]
  9. Jia, R.; Xu, J.; Li, Q.; Yang, G. Analysis of the influence of depressurization amplitude and sand blockage on gas hydrate production capacity. Sci. Technol. Eng. 2023, 23, 6434–6447. (In Chinese) [Google Scholar] [CrossRef]
  10. Guo, W.; Zhang, P.; Zhong, X.; Wang, X.; Jia, R.; Chen, C.; Wang, Y. Retrospect, Exploration, andInnovation: A ReviewontheTenthInternational Conference on Gas Hydrates. J. Jilin Univ. (Earth Sci. Ed.) 2023, 53, 1760–1772. (In Chinese) [Google Scholar] [CrossRef]
  11. Wang, Z.; Gong, J.; Wu, J.; Yin, H.; Shi, S.; Yan, J.; Li, X. Research progress on key technologies for drilling and completion of offshore gas hydrate. Sci. Technol. Rev. 2023, 41, 71–78. (In Chinese) [Google Scholar] [CrossRef]
  12. Shao, M.; Wang, P.; Wu, L.; Zhang, W.; Tian, Q. A comparative analysis of offshore gas hydrates production test in Japan. Mar. Geol. Front. 2022, 38, 8–15. (In Chinese) [Google Scholar] [CrossRef]
  13. Lu, J.; Lin, D.; Li, D.; Liang, D.; Zhang, Y.; Wu, S.; He, Y.; Shi, L. Research Status on Water Controlling and Sand Controlling in Horizontal Well Completion during Gas Hydrate Exploitation. Adv. New Renew. Energy 2022, 10, 447–455. (In Chinese) [Google Scholar] [CrossRef]
  14. Wang, H.; Wang, J.; Yu, C.; Liu, Y. Key Technologies for Natural Gas Hydrate Mining. Drill. Prod. Technol. 2022, 45, 51–56. (In Chinese) [Google Scholar] [CrossRef]
  15. Liu, C.; Ye, Y.; Meng, Q.; Lu, Z.; Zhu, Y.; Liu, J.; Yang, S. Raman Spectroscopic Characteristics of Natural Gas Hydrate Recovered from Shenhu Area in South China Sea and Qilian Mountain Permafrost. Acta Chim. Sin. 2010, 68, 1881–1886. (In Chinese) [Google Scholar]
  16. Oyama, H.; Nagao, J.; Suzuki, K.; Narita, H. Experimental analysis of sand production from methane hydrate bearing sediments applying depressurization method. J. MMIJ 2010, 126, 497–502. [Google Scholar] [CrossRef]
  17. Oyama, H.; Konno, Y.; Masuda, Y.; Narita, H. Dependence of depressurization-induced dissociation of methane hydrate bearing laboratory cores on heat transfer. Energy Fuels 2009, 23, 4995–5002. [Google Scholar] [CrossRef]
  18. Jung, J.; Kang, H.; Cao, S.C.; Al-Raoush, R.I.; Alshibli, K.; Lee, J.Y. Effects of fine-grained particles’ migration and clogging in porous media on gas production from hydrate-bearing sediments. Geofluids 2019, 2019, 1–11. [Google Scholar] [CrossRef]
  19. Cao, S.C.; Jang, J.; Jung, J.; Waite, W.F.; Collett, T.S.; Kumar, P. 2D micromodel study of clogging behavior of fine-grained particles associated with gas hydrate production in NGHP-02 gas hydrate reservoir sediments. Mar. Pet. Geol. 2019, 108, 714–730. [Google Scholar] [CrossRef]
  20. Jung, J.W.; Jang, J.; Santamarina, J.C.; Tsouris, C.; Phelps, T.J.; Rawn, C.J. Gas production from hydrate-bearing sediments: The role of fine particles. Energy Fuels 2012, 26, 480–487. [Google Scholar] [CrossRef]
  21. Lu, J.; Li, D.; He, Y.; Shi, L.; Liang, D.; Xiong, Y. Study on Productivity and Sand Production of Marine Natural Gas Hydrate Development. Adv. New Renew. Energy 2020, 8, 227–233. (In Chinese) [Google Scholar] [CrossRef]
  22. Qiang, S.; Sun, Y.; Zhang, G.; Shen, Y.; Sun, Y.; Li, B. The influence of shape memory on the performance of polymers used for sand control in hydrate production wells. Drill. Eng. 2023, 50, 1–10. (In Chinese) [Google Scholar] [CrossRef]
  23. Dong, C.; Zhong, Y.; Wu, Y.; Zou, Y. Experimental study on sand retention mechanisms and feasibility evaluation of sand control for gas hydrate reservoirs with highly clayey fine sands. J. China Univ. Pet. 2018, 42, 79–87. (In Chinese) [Google Scholar] [CrossRef]
  24. Dong, C.; Zhou, B.; Song, Y.; Liu, C.; Deng, J. Sand-retaining simulation experiment of screen media for formation sand in natural gas hydrate reservoirs and evaluation method. J. China Univ. Pet. 2020, 44, 79–88. (In Chinese) [Google Scholar] [CrossRef]
  25. Zhang, Y.; Wang, W.; Zhang, P.; Li, G.; Tian, S.; Lu, J.; Zhang, B. A solution to sand production from natural gas hydrate deposits with radial wells: Combined gravel packing and sand screen. J. Mar. Sci. Eng. 2022, 10, 71. [Google Scholar] [CrossRef]
  26. Ding, J.; Cheng, Y.; Yan, C.; Song, B.; Sun, H.; Teng, F. Experimental study of sand control in a natural gas hydrate reservoir in the South China sea. Int. J. Hydrogen Energy 2019, 44, 23639–23648. [Google Scholar] [CrossRef]
  27. Ding, J.; Cheng, Y.; Yan, C. Research on sand control effect and micro-plugging mechanism of sand control medium in the development of natural gas hydrate reservoir. J. Pet. Sci. Eng. 2022, 215, 110703. [Google Scholar] [CrossRef]
  28. Li, X.; Hu, H.; Wang, Y. Experimental study of gas-liquid-sand production behaviors during gas hydrates dissociation with sand control screen. Energy 2022, 254, 124414. [Google Scholar] [CrossRef]
  29. Yoneda, J.; Masui, A.; Konno, Y.; Jin, Y.; Egawa, K.; Kida, M.; Ito, T.; Nagao, J.; Tenma, N. Mechanical properties of hydrate-bearing turbidite reservoir in the first gas production test site of the Eastern Nankai Trough. Mar. Pet. Geol. 2015, 66, 471–486. [Google Scholar] [CrossRef]
  30. Ye, J.; Qin, X.; Xie, W.; Lu, H.; Ma, J.; Qiu, H.; Liang, J.; Lu, J.; Kuang, Z.; Lu, C.; et al. Main progress of the second gas hydrate trial production in the South China Sea. Geol. China 2020, 47, 557–568. (In Chinese) [Google Scholar] [CrossRef]
  31. Chen, F.; Zhou, Y.; Su, X.; Liu, G.; Lu, H.; Wang, J. Gas hydrate saturation and its relation with grain size of the hydrate-bearing sediments in the shenhu area of northern south china sea. Mar. Geol. Quat. Geol. 2011, 31, 95–100. (In Chinese) [Google Scholar] [CrossRef]
  32. Zhao, X. Plugging Experiments on Different Packing Schemes during Hydrate Exploitation by Depressurization. Processes 2023, 11, 2075. [Google Scholar] [CrossRef]
  33. Teng, F. Experimental Study on Sand Production of Natural Gas Hydrate Reservoir. Master’s Thesis, China University of Petroleum, Beijing, China, 2018. [Google Scholar] [CrossRef]
  34. Dullien, F.A.L. Porous Media: Fluid Transport and Pore Structure; Academic Press: Cambridge, MA, USA, 1992. [Google Scholar]
  35. Xiao, B.; Zhu, H.; Chen, F.; Long, G.; Li, Y. A fractal analytical model for Kozeny-Carman constant and permeability of roughened porous media composed of particles and converging-diverging capillaries. Powder Technol. 2023, 420, 118256. [Google Scholar] [CrossRef]
Figure 1. Schematic diagram of the experimental apparatus.
Energies 18 01761 g001
Figure 2. Picture of used formation fine sand sample.
Energies 18 01761 g002
Figure 3. Five different mesh samples for ceramic grains.
Energies 18 01761 g003
Figure 4. Experimental curves of ceramic filling layer (170–230 mesh).
Energies 18 01761 g004
Figure 5. Surface view of the ceramic filling layer after the experiment. From left to right and top to bottom (ae), it corresponds to the 170–230 mesh, 140–170 mesh, 80–120 mesh, 70–80 mesh, and 40–70 mesh.
Energies 18 01761 g005
Figure 6. Experimental curves of ceramic filling layer (140~170 mesh).
Energies 18 01761 g006
Figure 7. Experimental curves of ceramic filling layer (80~120 mesh).
Energies 18 01761 g007
Figure 8. Experimental curves of ceramic filling layer (70~80 mesh).
Energies 18 01761 g008
Figure 9. Permeability change curves of ceramic filling layer.
Energies 18 01761 g009
Figure 10. Experimental curves of ceramic filling layer (40~70 mesh).
Energies 18 01761 g010
Table 1. Filling with ceramic grains.
Sample TypesMedian Grain Size (d50)
/μm
Particle Size Interval
/μm
Median Grain Size RatioNote
170–230 mesh82.07517.125~251.1058Custom
140–170 mesh128.1258.041~283.70412Custom
80–120 mesh183.35883.707~409.16317Custom
70–80 mesh248.57106.852~22.29624Custom
40–70 mesh330.396196.714~51.05631Existing
Disclaimer/Publisher’s Note: The statements, opinions and data contained in all publications are solely those of the individual author(s) and contributor(s) and not of MDPI and/or the editor(s). MDPI and/or the editor(s) disclaim responsibility for any injury to people or property resulting from any ideas, methods, instructions or products referred to in the content.

