
Decision-Making and Selection Framework for Potential Implementation of Concentrated Solar Power Technologies: Case Study


Abstract
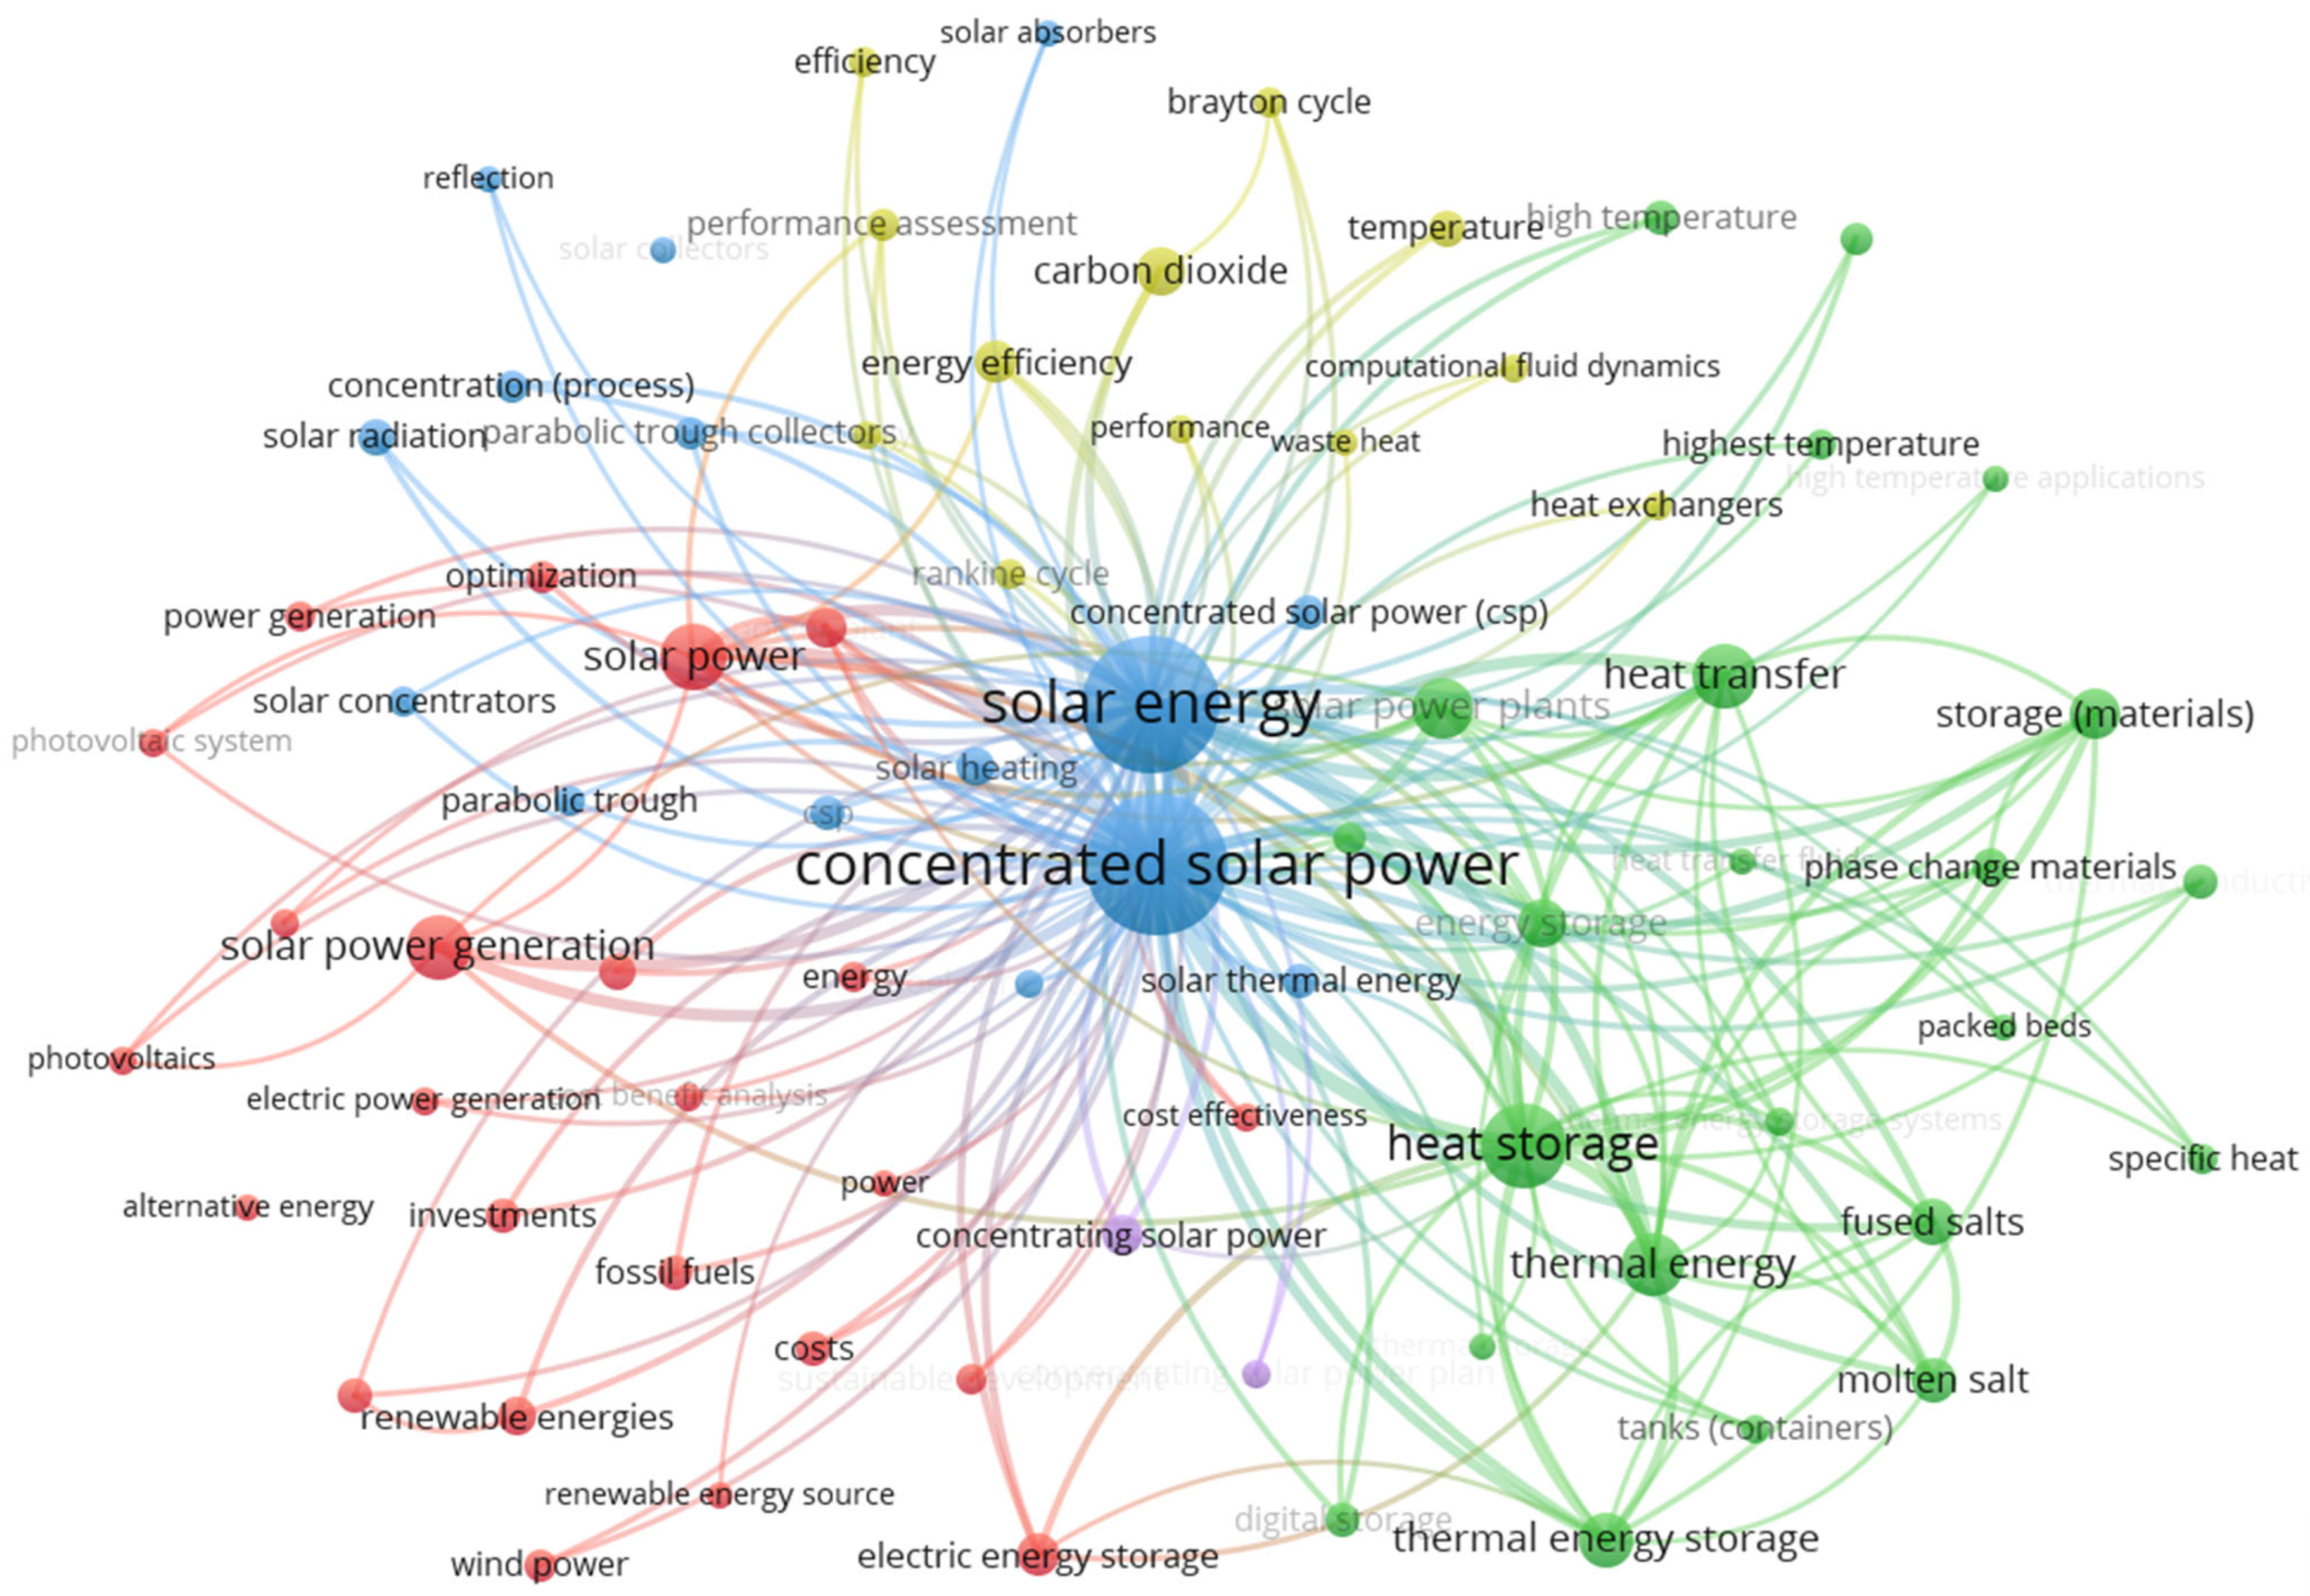
1. Introduction
- A systematic CSP technology evaluation considering environmental, technical, and economic factors.
- Optimized system design using detailed performance simulations.
- A financial feasibility assessment incorporating LCOE and capacity factor (CF) metrics under different operational scenarios.
- Investigation of molten salt as an innovative HTF to enhance efficiency and storage.
- A novel methodology to optimize storage duration, maximizing dispatchability and cost-effectiveness.
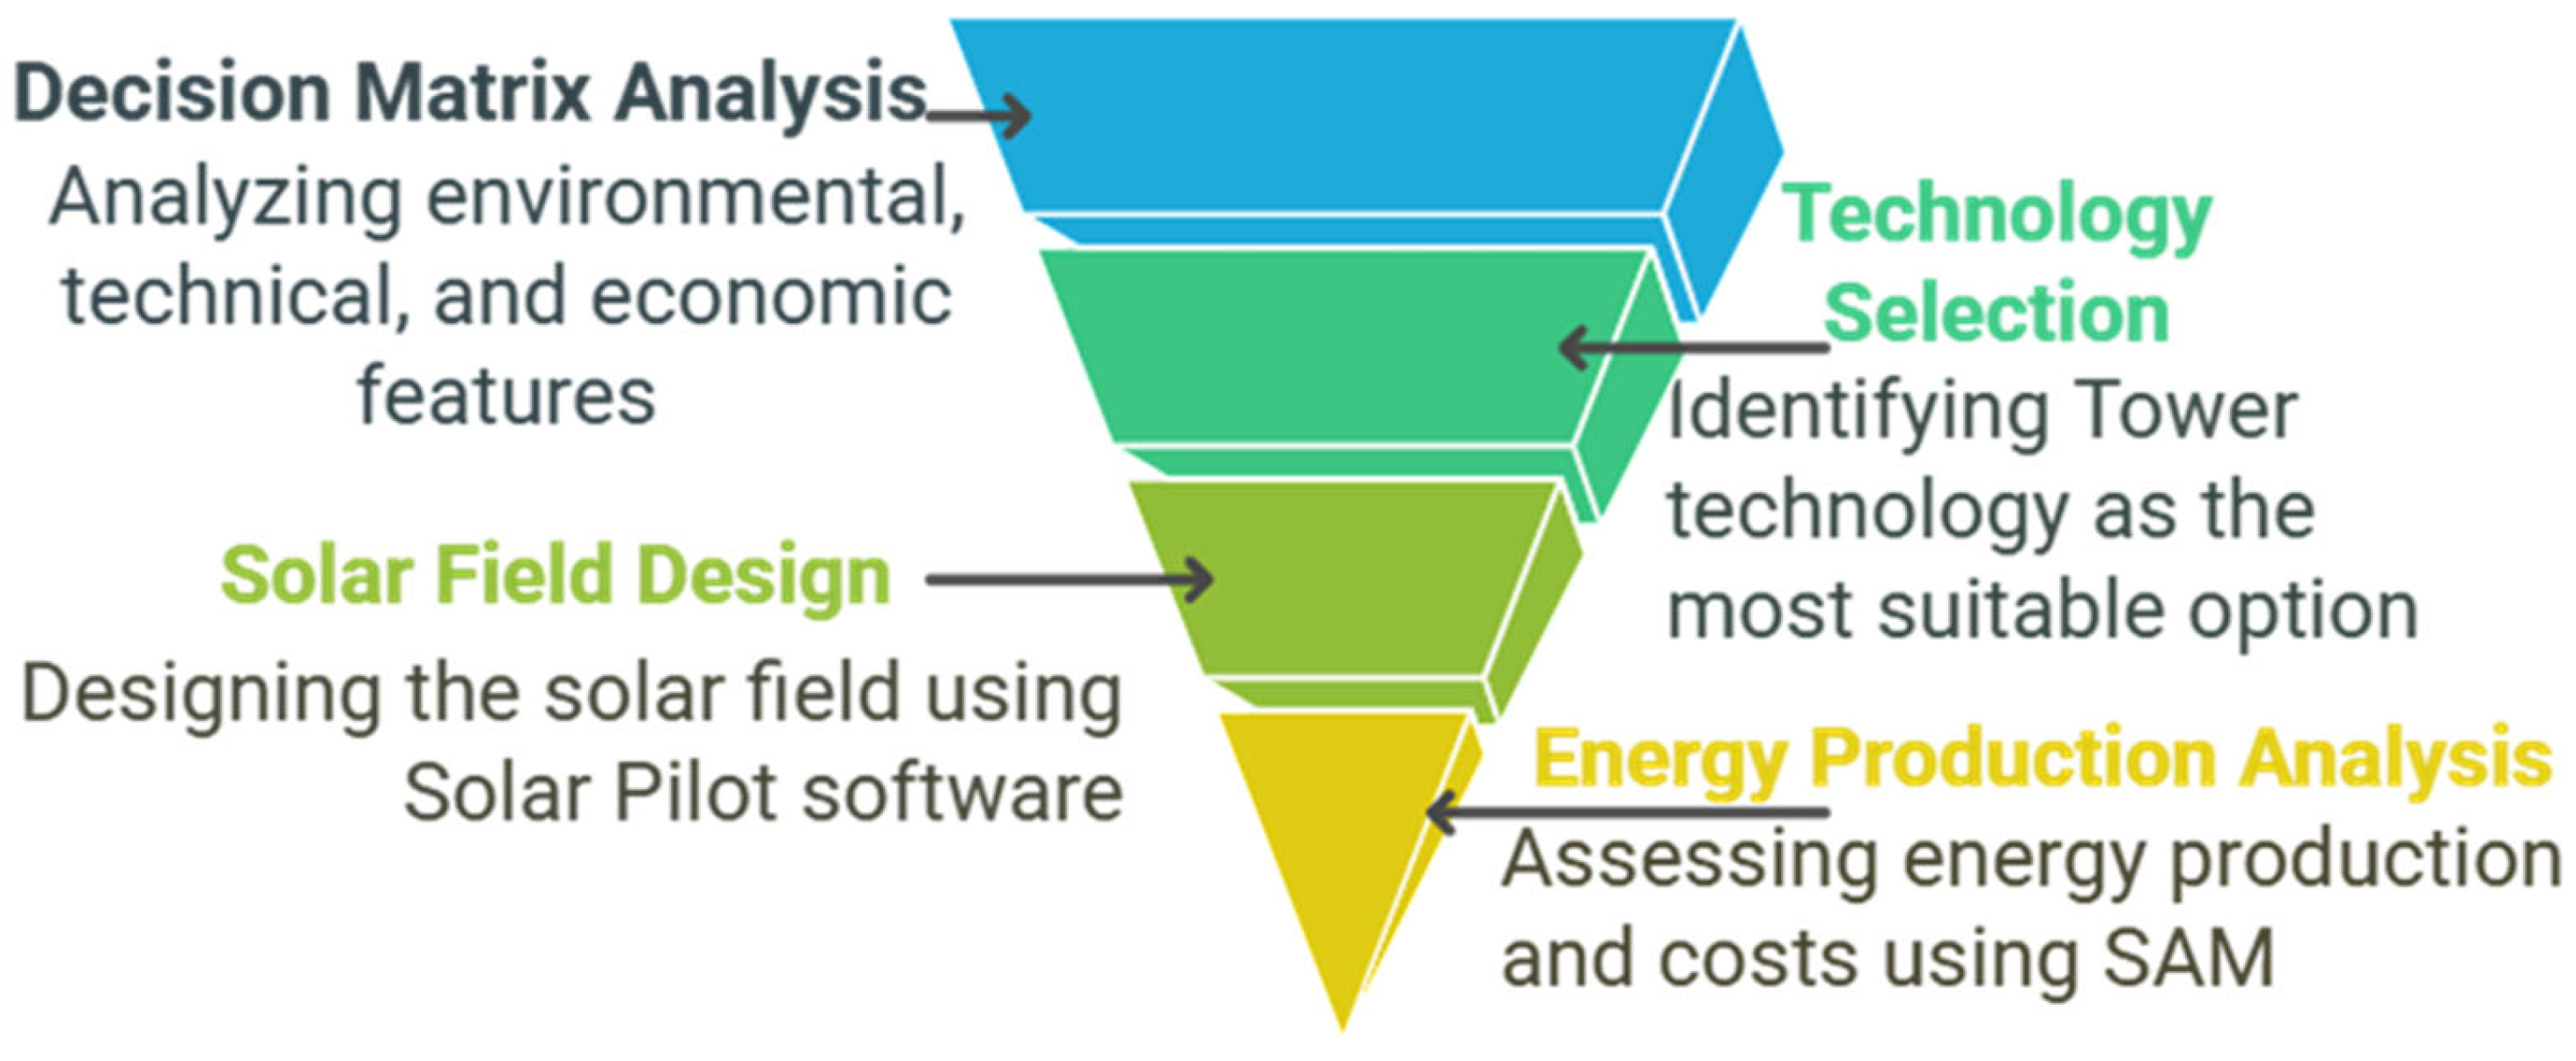
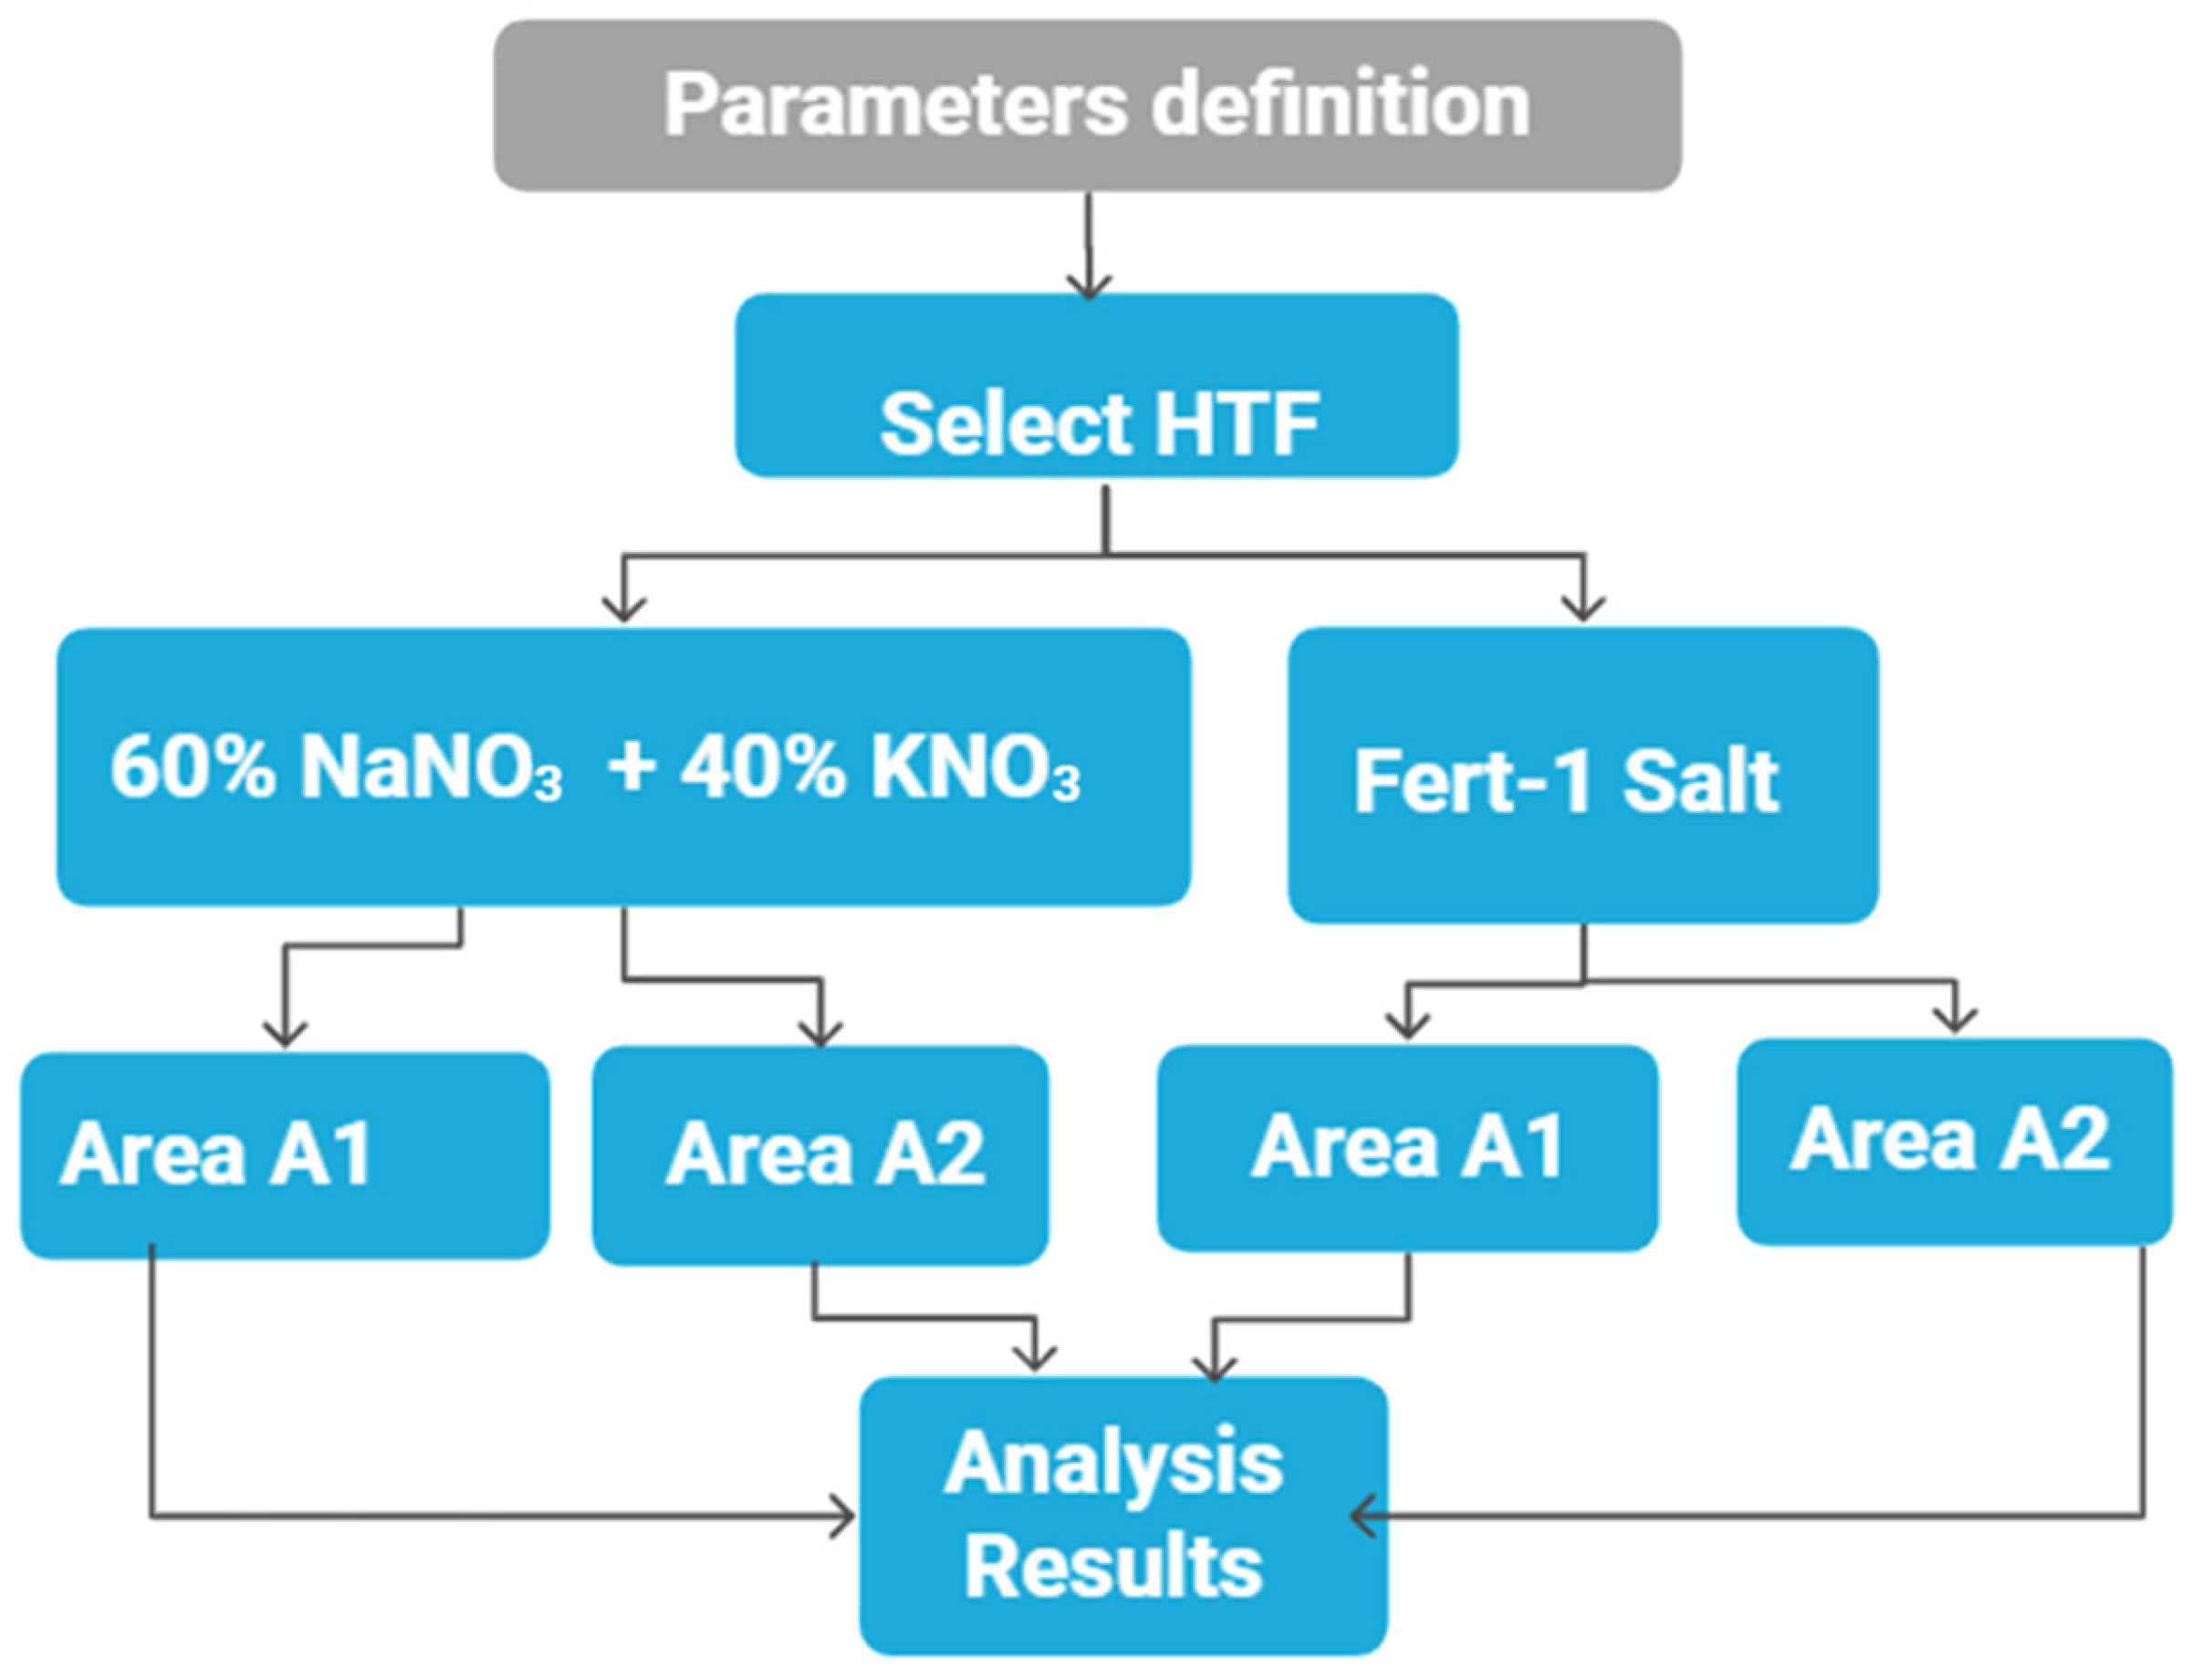
2. Methodology
2.1. Available Areas in the Escombreas Valley
2.2. Technical Features of CSP Technologies
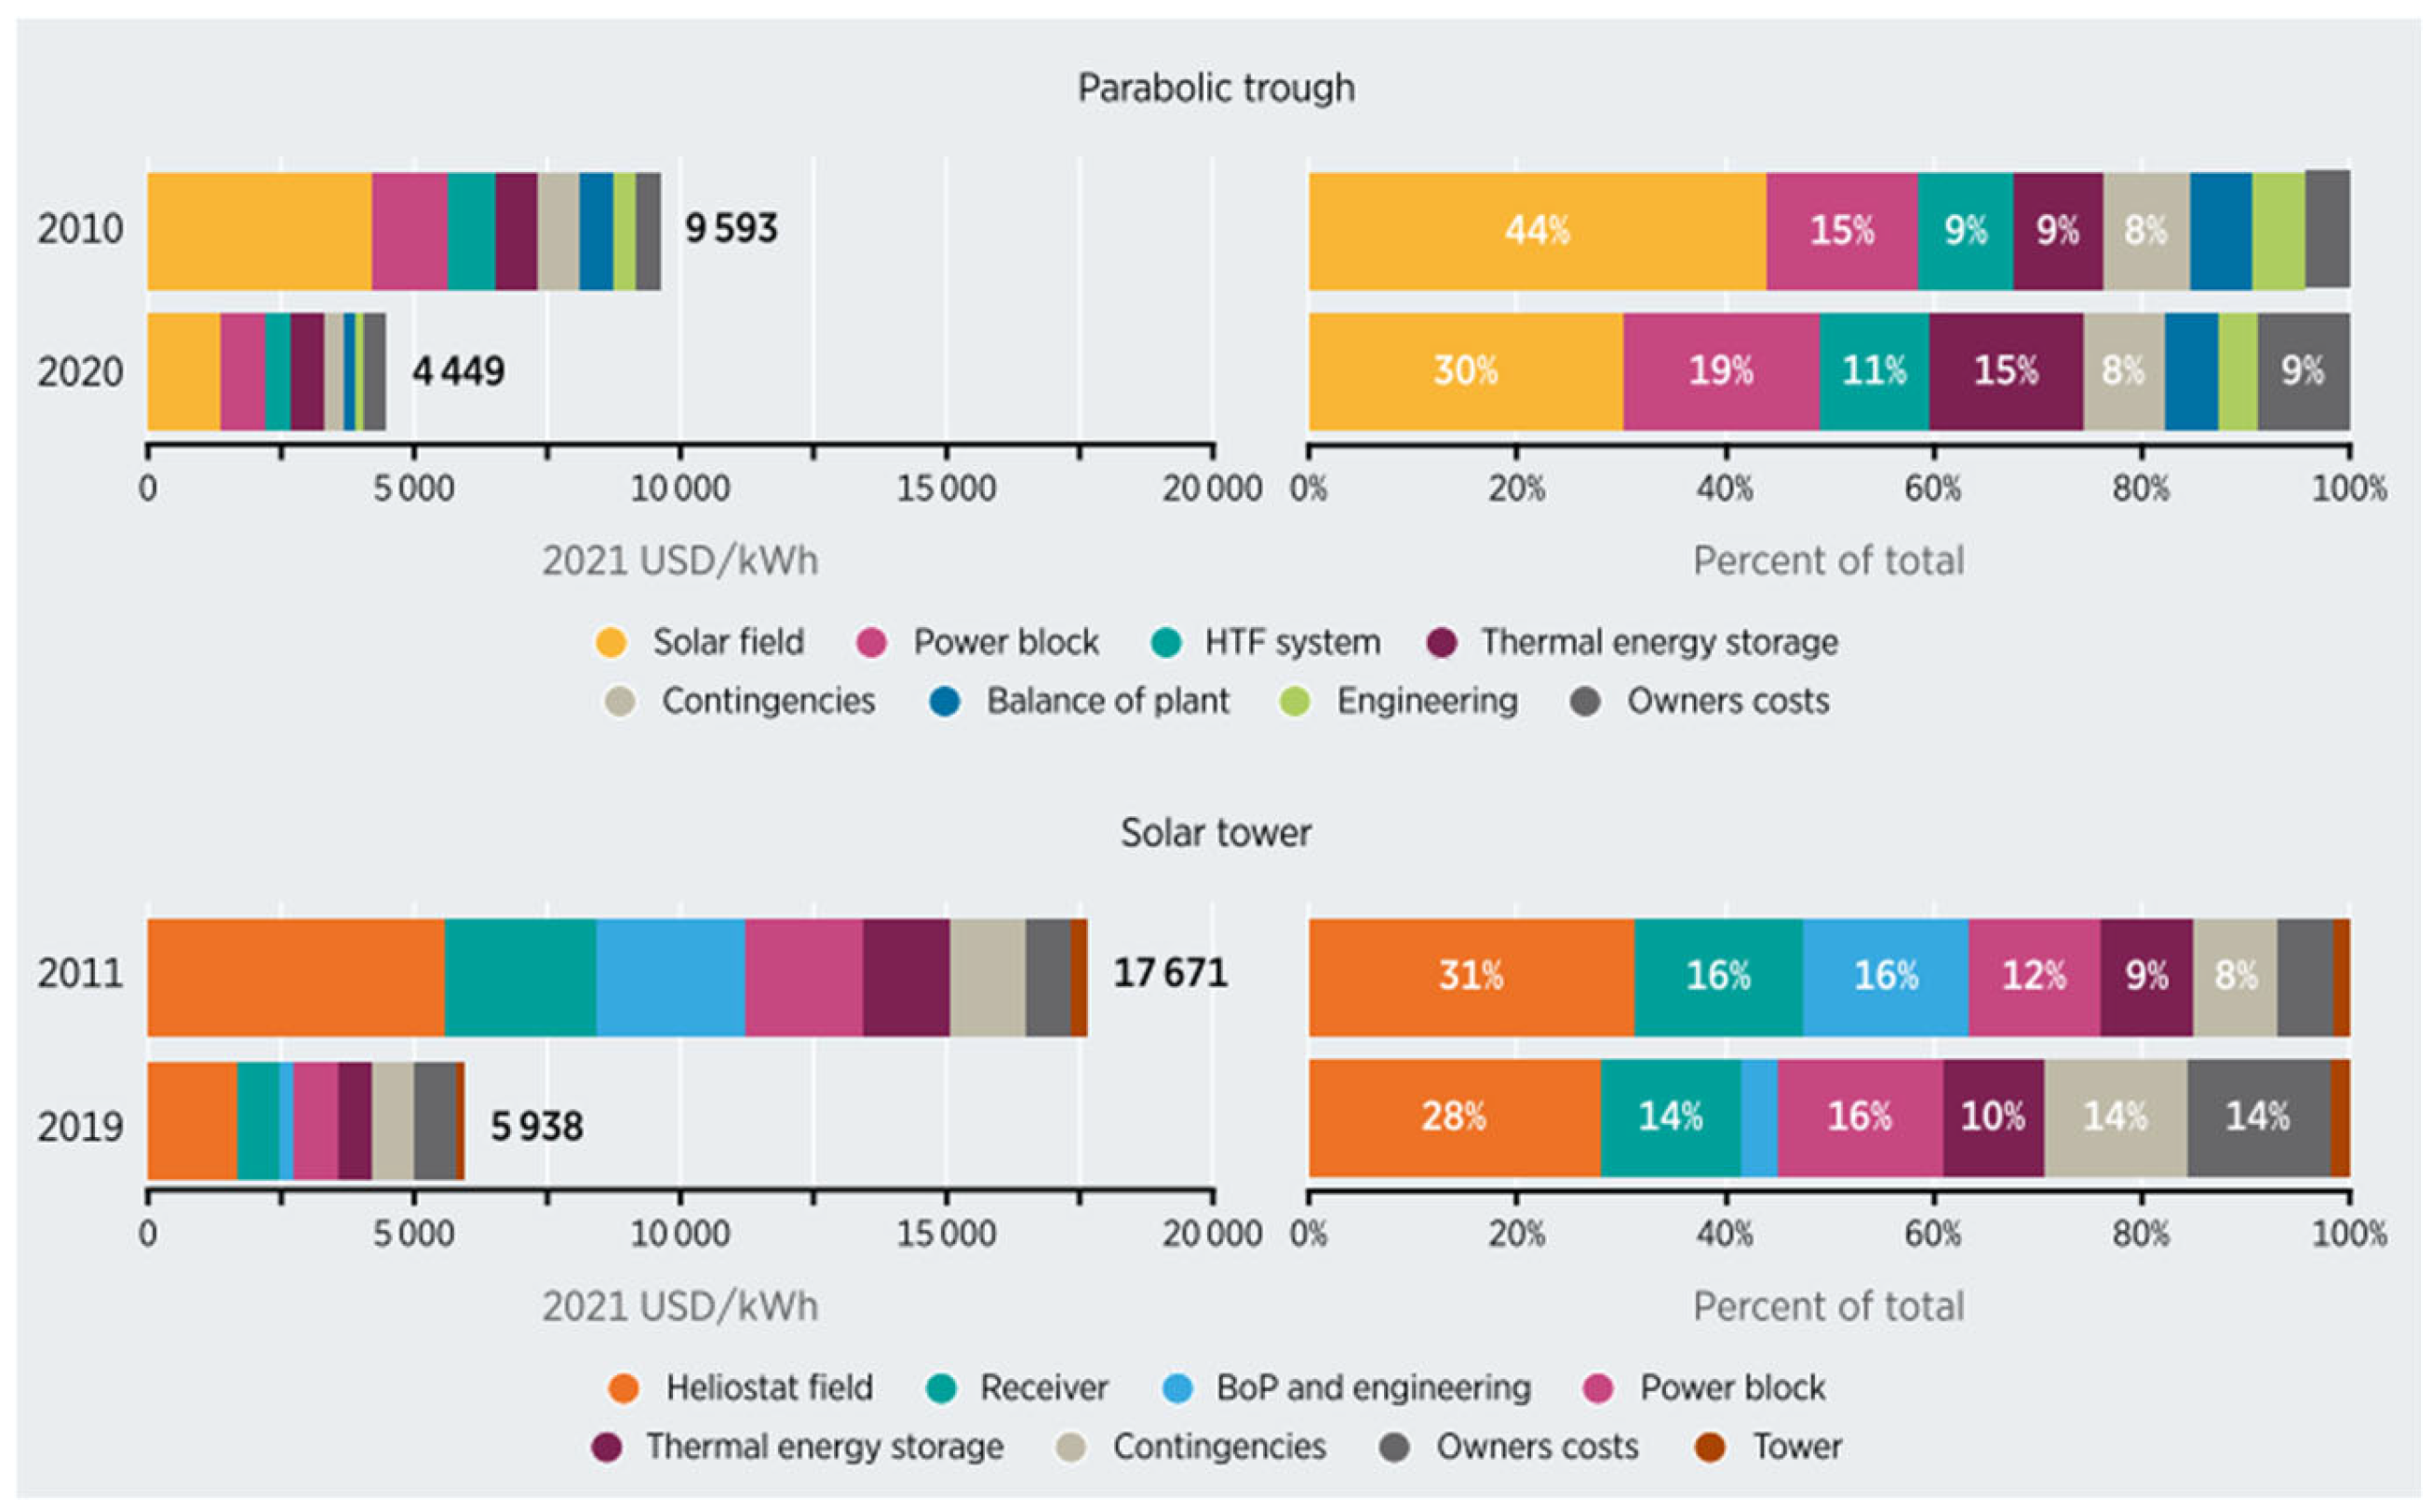
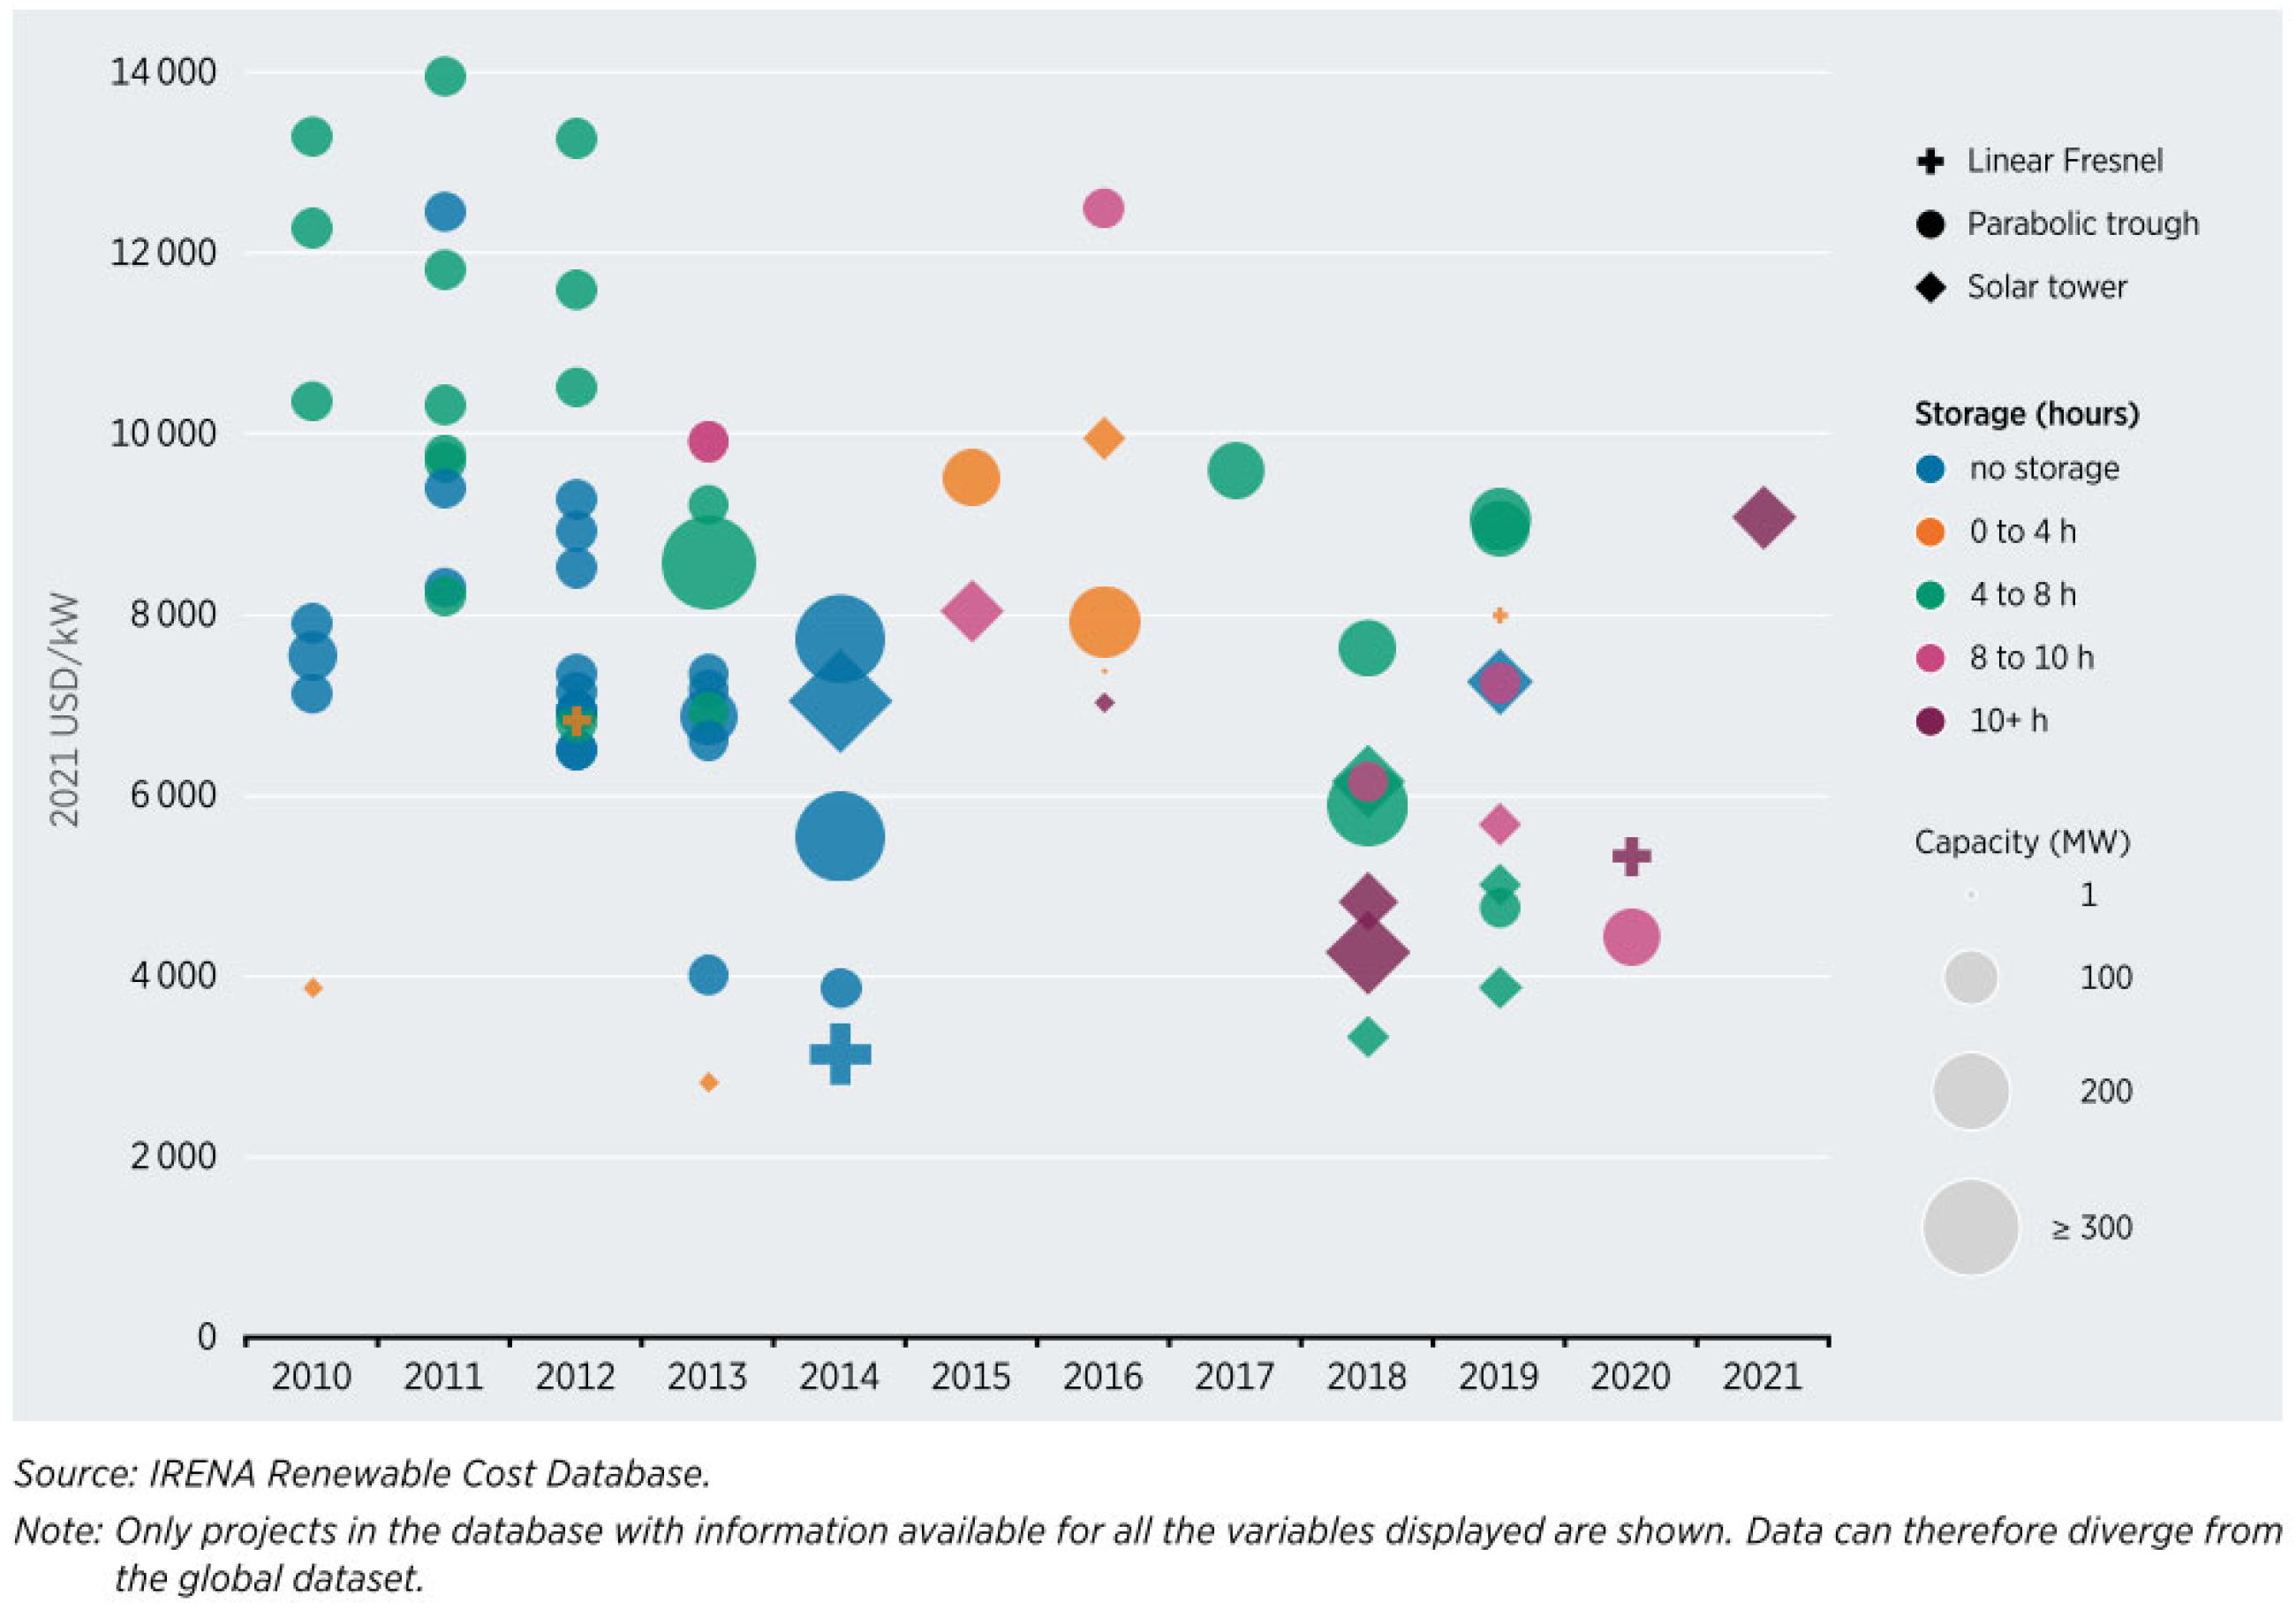
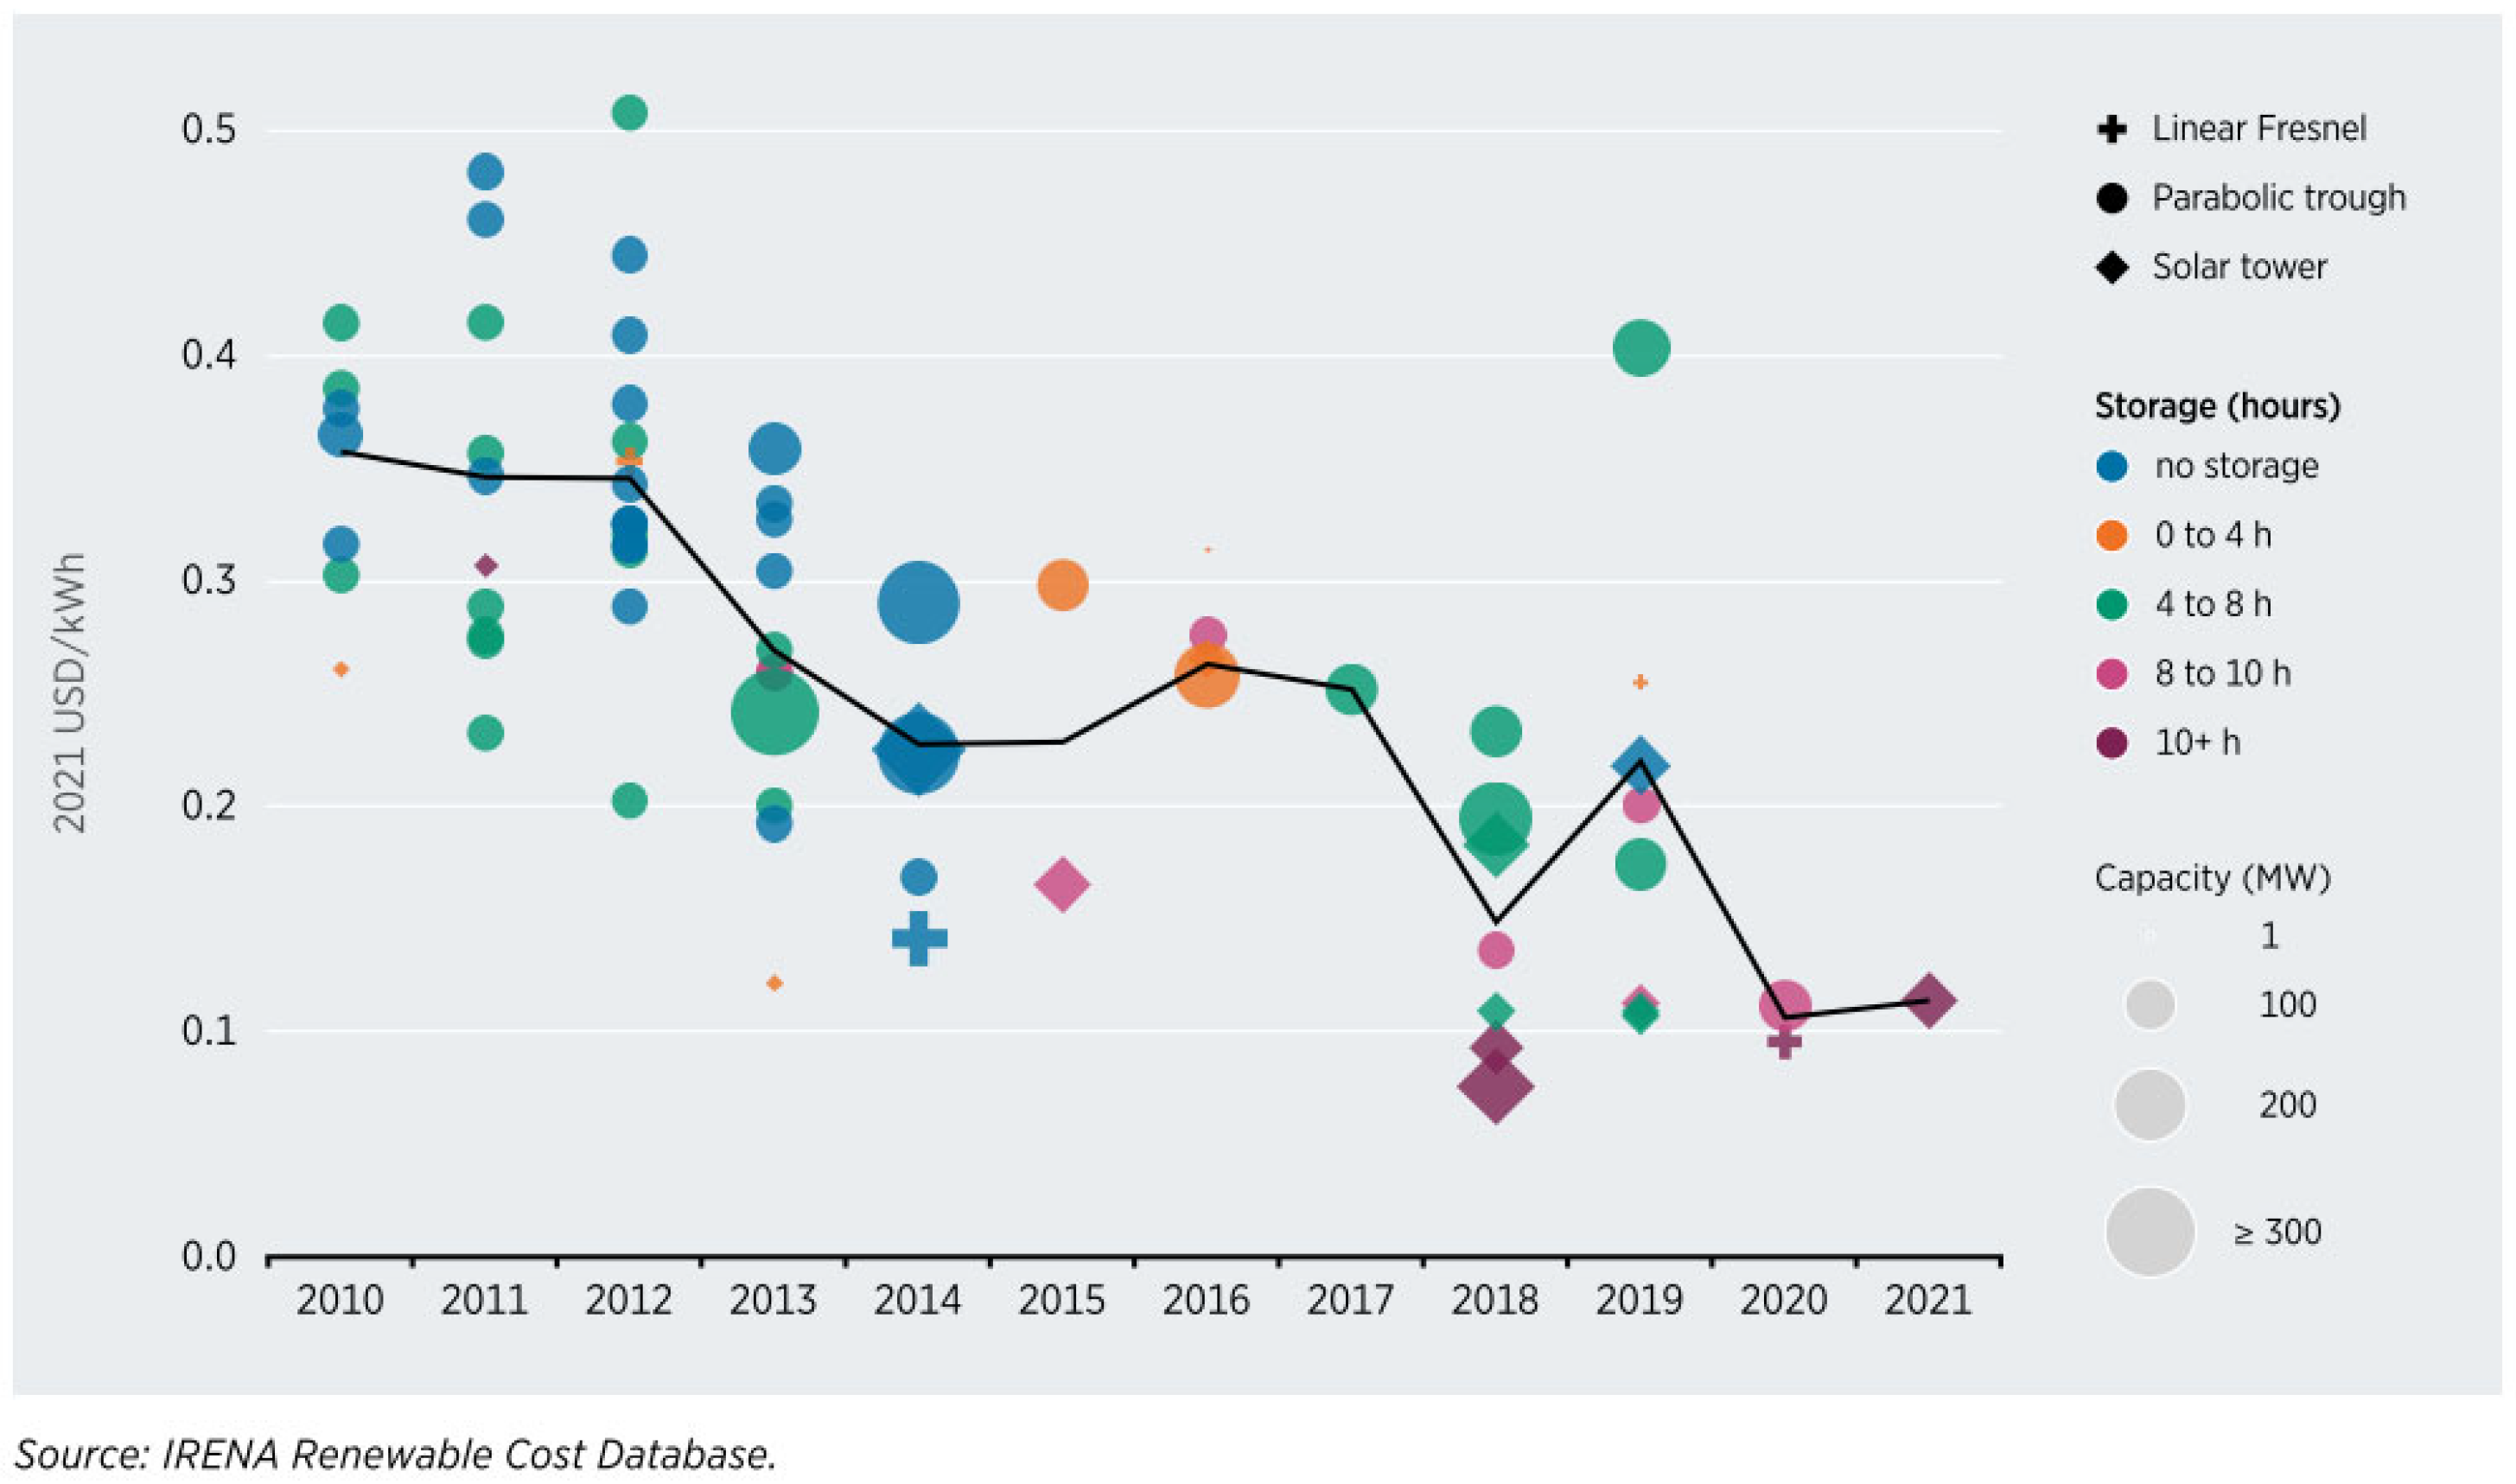
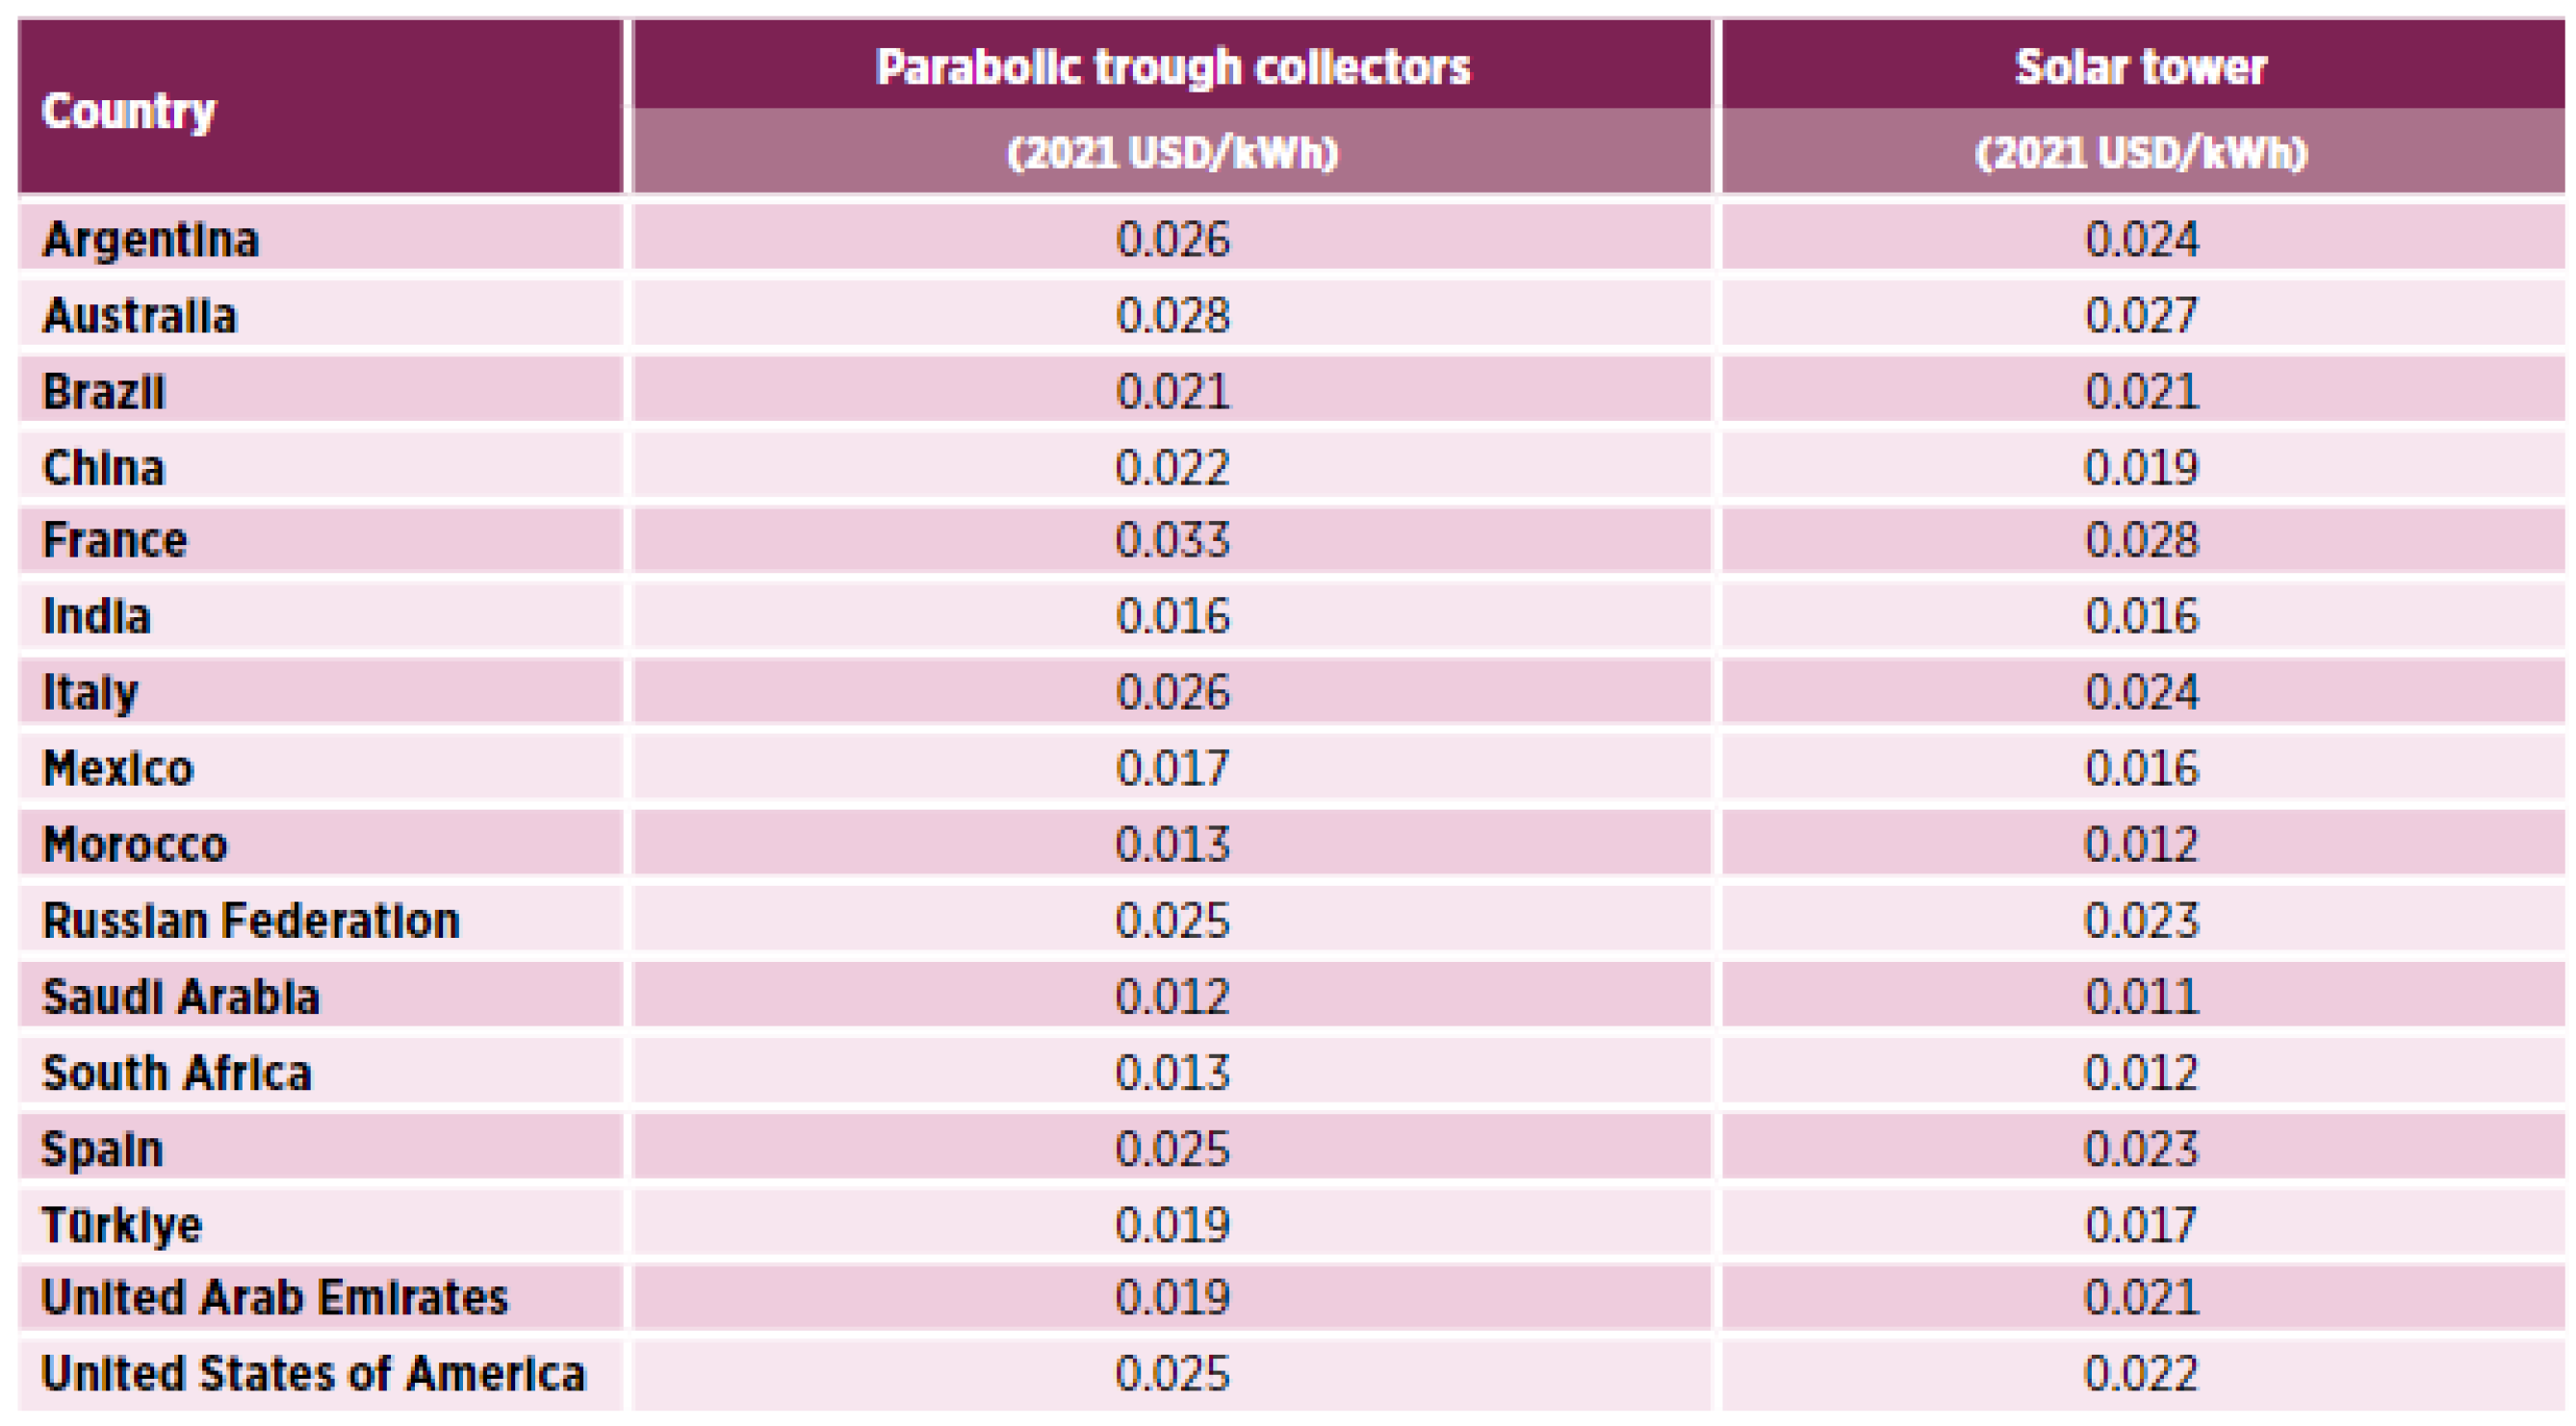
2.3. Economic Trends in CSP Technologies
Total Installed Cost
2.4. Decision Matrix
- Technical.
- Environmental.
- Economic.
- The weightings are established through a combination of expert judgment and empirical data, reflecting the priorities and constraints specific to the Escombreras Valley. This approach ensures that the most relevant factors are prioritized according to their impact on the project’s success.
- Geographic Considerations: Geographic characteristics of the Escombreras Valley, such as land topography, are incorporated into the weighting scheme. This ensures that the decision matrix reflects geographical challenges and opportunities, providing a tailored evaluation for the location.
- The need for efficient power delivery over distance;
- The integration of innovative molten salt technology;
- The adaptation to sloped terrain;
- The optimization of land use and resources.
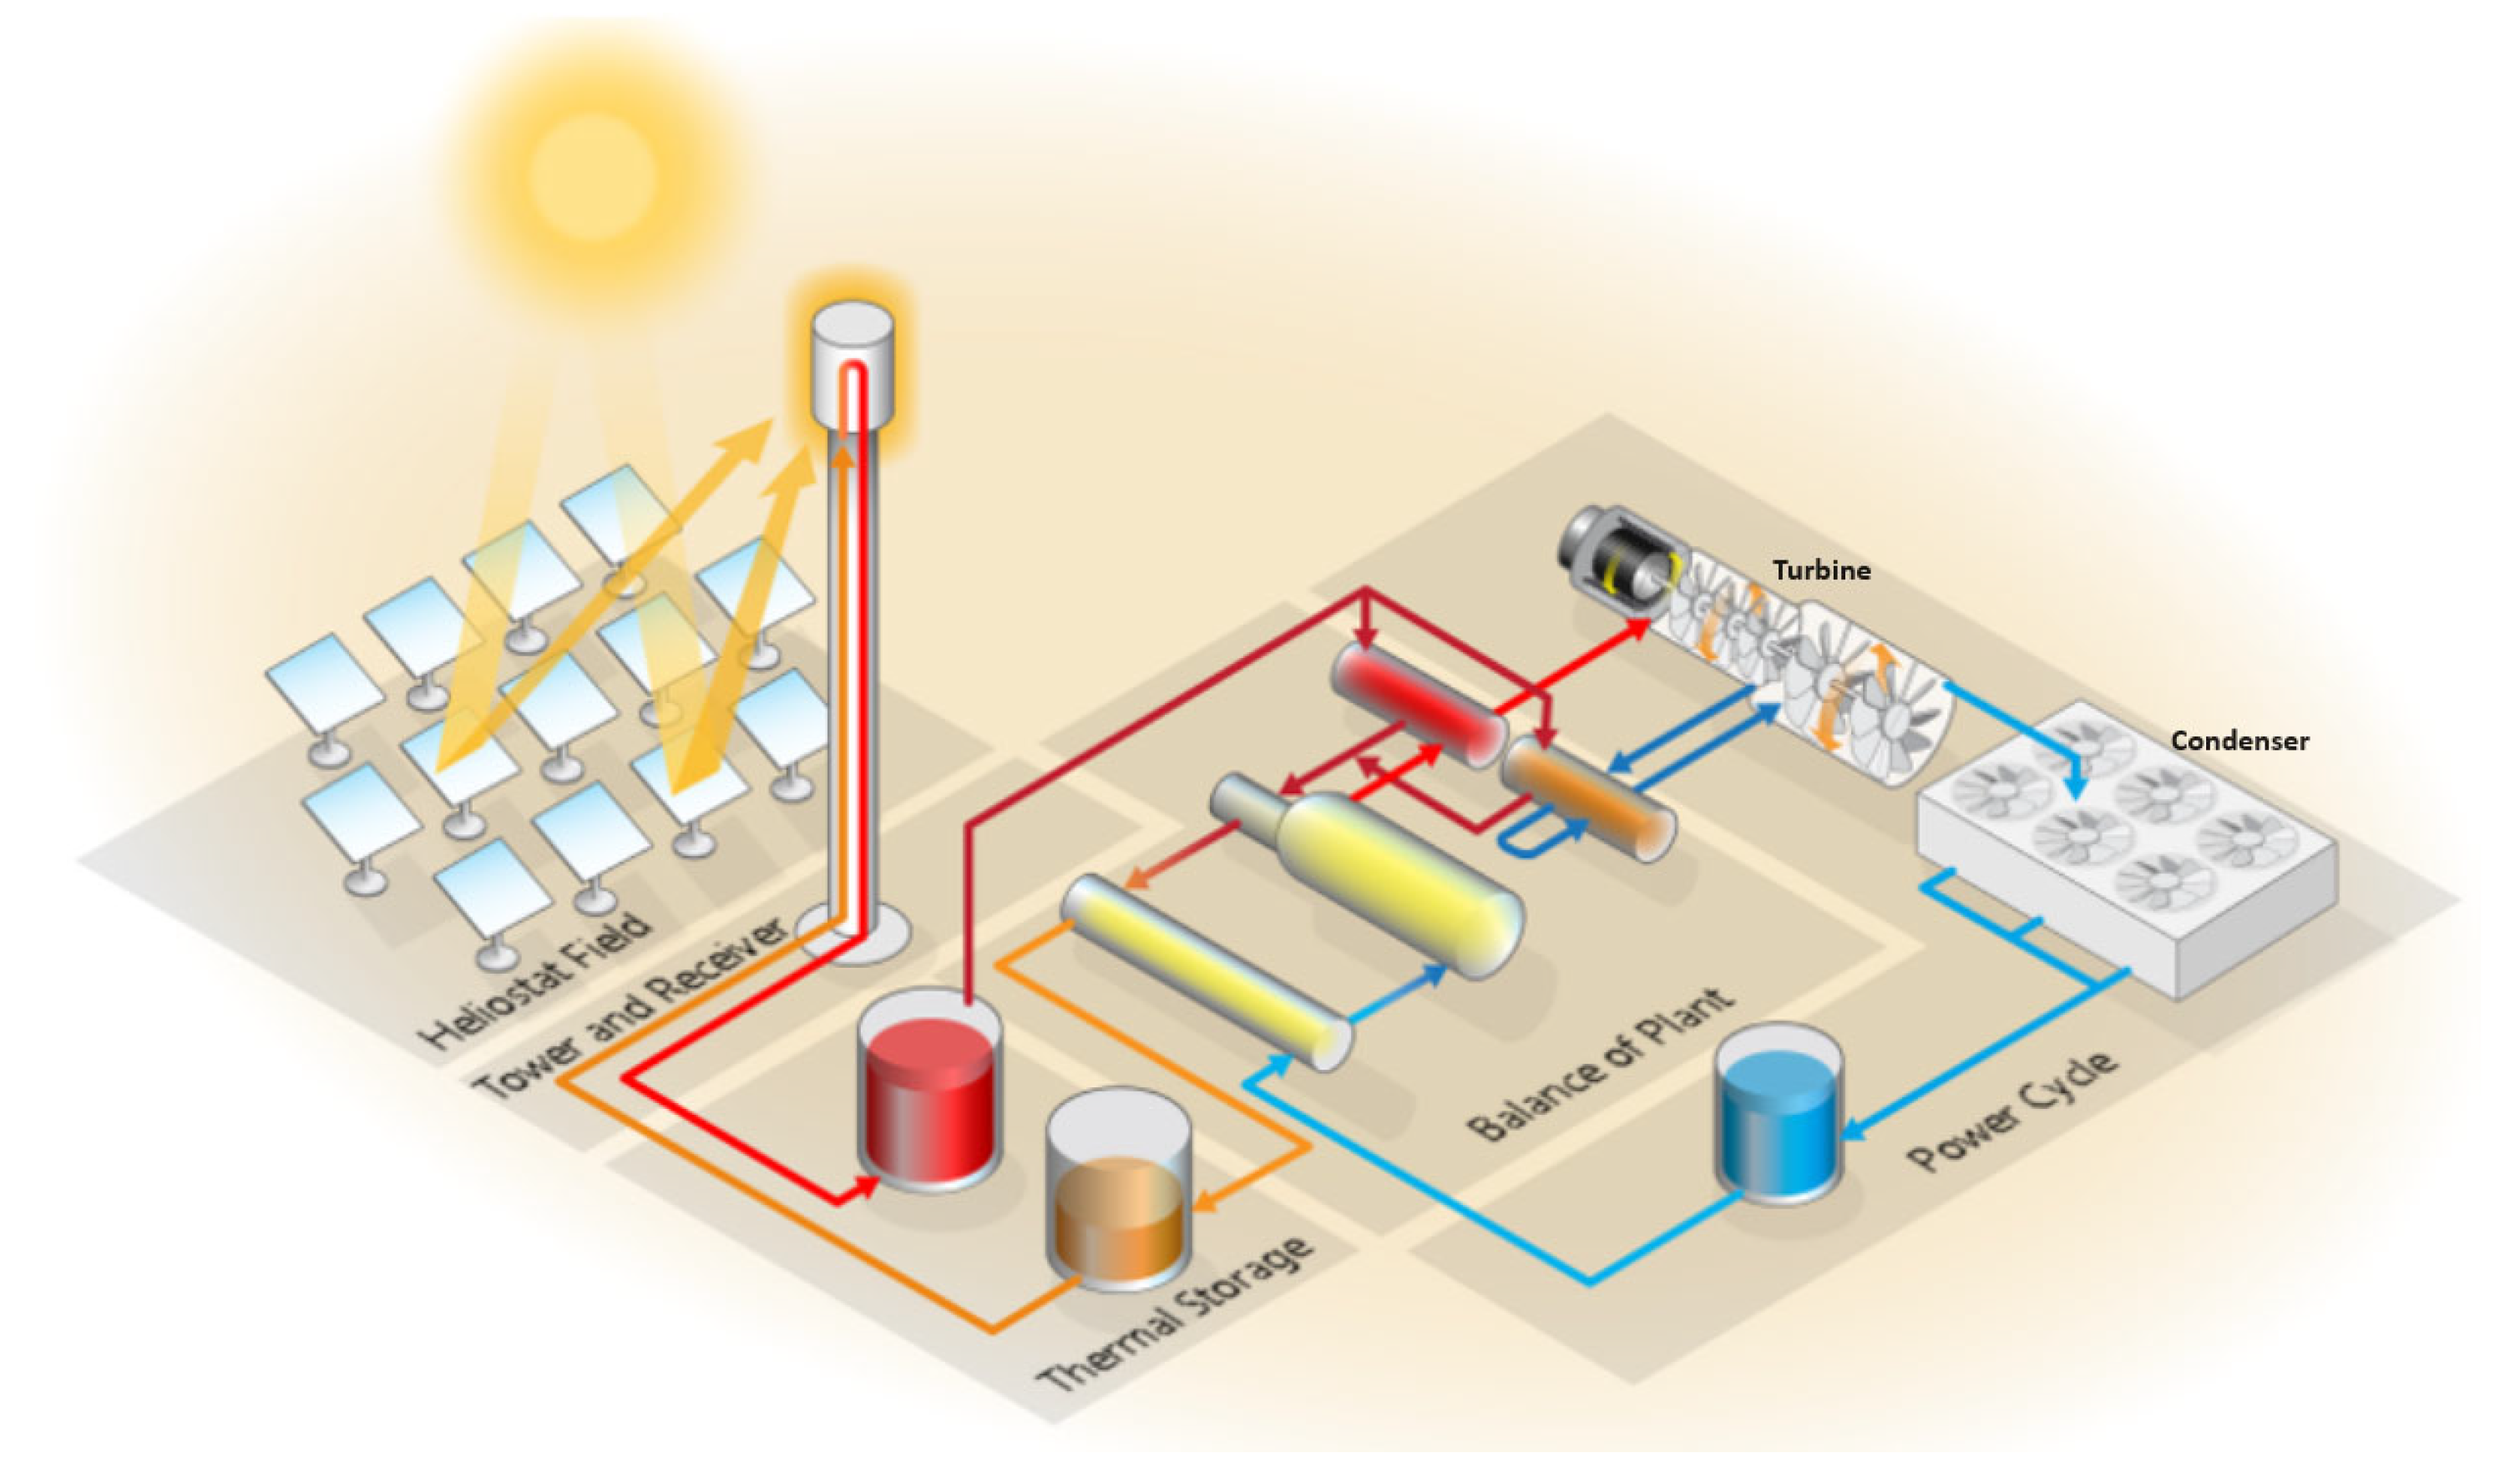
- 1.
- Heliostat Field: This array of mirrors, known as heliostats, tracks the sun and reflects its rays onto a central receiver atop a tower. This arrangement maximizes the concentration of solar energy.
- 2.
- Tower and Receiver: At the top of the tower, the receiver captures the concentrated solar energy. This energy is then transferred to a heat transfer fluid (HTF), which circulates through the receiver.
- 3.
- Thermal Storage: The hot fluid is divided into two streams. One part is stored in a hot storage tank. This storage allows the plant to continue operating even when sunlight is not available, offering flexibility and reliability.
- 4.
- Power Cycle: The second stream of hot fluid transfers its energy via a heat exchanger to a power cycle, typically a Rankine cycle, where it heats water to create steam.
- 5.
- Turbine and Condenser: The steam generated drives a turbine, converting thermal energy into mechanical energy, and subsequently into electrical energy via a generator. After passing through the turbine, the steam is condensed back into water in the condenser.
- 6.
- Make-up Water Tank: This component ensures that there is always sufficient water to convert into steam, compensating for any losses.
3. Results
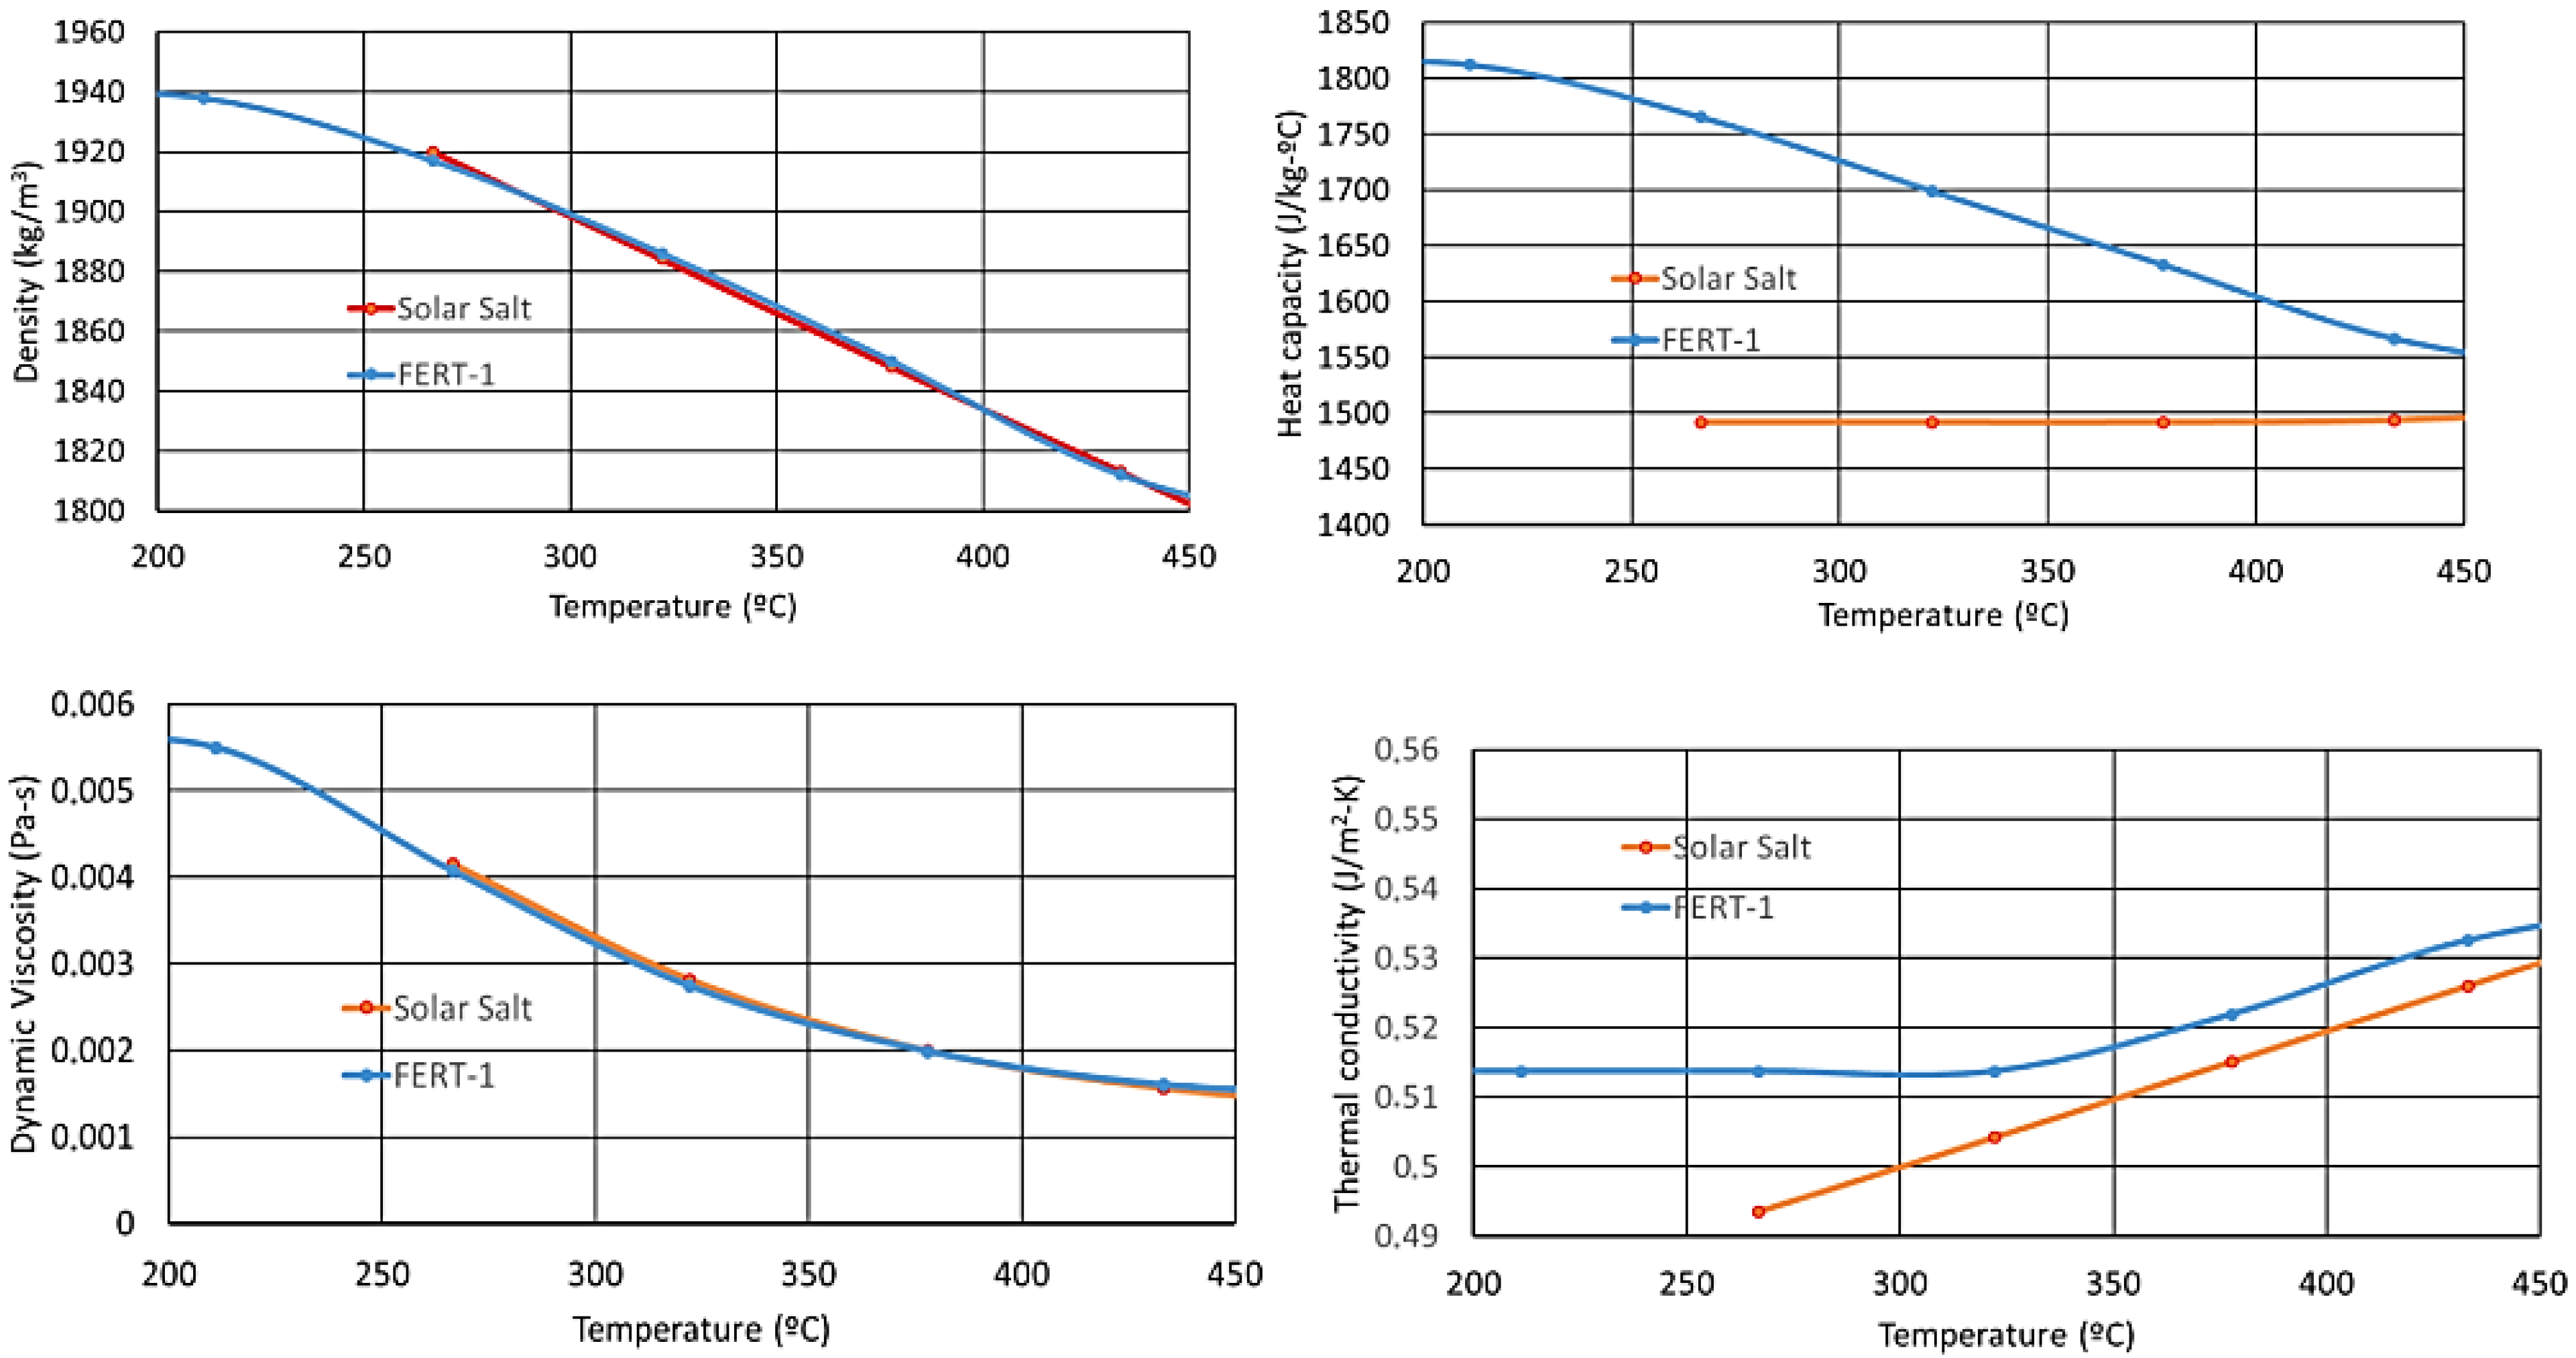
3.1. Innovative Molten Salt FERT-1
3.2. Solar Field
- Capacity Factor (CF): a measure of how much energy a plant produces compared with its maximum output.
- Levelized Cost of Energy (LCOE): the total project lifecycle cost expressed in cents per kilowatt-hour of electricity that the system delivers over its life to the grid for front-of-meter projects or to the grid and load for behind-the-meter projects.
- Annual Energy: measures the system’s total electricity over a year.
- Thermal Energy Storage (TES) Capacity: total capacity of heat transfer fluid storage.
3.3. Comparison Results Between CSP Installed in Areas A1 and A2 Working with Molten Salt (60% NaNO3 + 40% KNO3)
3.4. Comparison Results Between CSP Installed in Areas A1 and A2 Using Molten Salt FERT-1
4. Conclusions
Author Contributions
Funding
Data Availability Statement
Acknowledgments
Conflicts of Interest
References
- Cruz-Robles, I.; Islas-Samperio, J.M.; Estrada, C.A. Levelized Cost of Heat of the CSPth Hybrid Central Tower Technology. Energies 2022, 15, 8528. [Google Scholar] [CrossRef]
- Gajdzik, B.; Wolniak, R.; Nagaj, R.; Žuromskaitė-Nagaj, B.; Grebski, W. Energy Waste as a Side-Effect of Photovoltaic Development: Net Impact of Photovoltaics on CO2 Emissions in European Union Countries. Energies 2025, 18, 78. [Google Scholar] [CrossRef]
- Alami, A.H.; Olabi, A.G.; Mdallal, A.; Rezk, A.; Radwan, A.; Rahman, S.M.A.; Shah, S.K.; Abdelkareem, M.A. Concentrating solar power (CSP) technologies: Status and analysis. Int. J. Thermofluids 2023, 18, 100340. [Google Scholar] [CrossRef]
- National Renewable Energy Laboratory (NREL). NSRDB Data Viewer. Available online: https://nsrdb.nrel.gov/data-viewer (accessed on 27 February 2025).
- González-Roubaud, E.; Pérez-Osorio, D.; Prieto, C. Review of commercial thermal energy storage in concentrated solar power plants: Steam vs. molten salts. Renew. Sustain. Energy Rev. 2017, 80, 133–148. [Google Scholar] [CrossRef]
- Islam, M.T.; Huda, N.; Abdullah, A.B.; Saidur, R. A Comprehensive review of state-of-the-art concentrating solar power (csp) technologies: Current status and research trends. Renew. Sustain. Energy Rev. 2018, 91, 987–1018. [Google Scholar] [CrossRef]
- Zhang, H.L.; Baeyens, J.; Degrève, J.; Cacères, G. Concentrated solar power plants: Review and design methodology. Renew. Sustain. Energy Rev. 2013, 22, 852–860. [Google Scholar] [CrossRef]
- Rodat, S.; Thonig, R. Status of Concentrated Solar Power Plants Installed Worldwide: Past and Present Data. Clean Technol. 2024, 6, 365–378. [Google Scholar] [CrossRef]
- Khan, M.I.; Asfand, F.; Al-Ghamdi, S.G. Progress in research and technological advancements of commercial concentrated solar thermal power plants. Sol. Energy 2023, 249, 183–226. [Google Scholar] [CrossRef]
- Ferruzzi, G.; Delcea, C.; Barberi, A.; Di Dio, V.; Di Somma, M.; Catrini, P.; Guarino, S.; Rossi, F.; Parisi, M.L.; Sinicropi, A.; et al. Concentrating Solar Power: The State of the Art, Research Gaps and Future Perspectives. Energies 2023, 16, 8082. [Google Scholar] [CrossRef]
- Mehos, M.; Turchi, C.; Vidal, J.; Wagner, M.; Ma, Z.; Ho, C.; Kolb, W.; Andraka, C.; Kruizenga, A. Concentrating Solar Power Gen3 Demonstration Roadmap. 2017. Available online: www.nrel.gov/publications (accessed on 13 March 2024).
- Scopus. Scopus Database Data Extraction. Available online: https://www.scopus.com (accessed on 28 February 2025).
- Mselle, B.D.; Medrano, M.; Solé, C.; Martorell, I.; Castell, A. Research progress, trends, roadmap, and new perspectives on radiative cooling towards practical applications. Sustain. Energy Technol. Assess. 2024, 71, 103987. [Google Scholar] [CrossRef]
- van Eck, N.J.; Waltman, L. VOSviewer: A computer program for bibliometric mapping. Scientometrics 2010, 84, 523–538. [Google Scholar] [CrossRef]
- Jacobson, M.Z.; Delucchi, M.A.; Bazouin, G.; Bauer, Z.A.F.; Heavey, C.C.; Fisher, E.; Morris, S.B.; Piekutowski, D.J.Y.; Vencilla, T.A.; Yeskoo, T.W. 100% clean and renewable wind, water, and sunlight (WWS) all-sector energy roadmaps for the 50 United States. Energy Environ. Sci. 2015, 8, 2093–2117. [Google Scholar] [CrossRef]
- Al Garni, H.; Kassem, A.; Awasthi, A.; Komljenovic, D.; Al-Haddad, K. A multicriteria decision making approach for evaluating renewable power generation sources in Saudi Arabia. Sustain. Energy Technol. Assess. 2016, 16, 137–150. [Google Scholar] [CrossRef]
- Aguilar-Jiménez, J.A.; Velázquez, N.; Acuña, A.; Cota, R.; González, E.; González, L.; López, R.; Islas, S. Techno-economic analysis of a hybrid PV-CSP system with thermal energy storage applied to isolated microgrids. Sol. Energy 2018, 174, 55–65. [Google Scholar] [CrossRef]
- Jbaihi, O.; Ouchani, F.-Z.; Alami Merrouni, A.; Cherkaoui, M.; Ghennioui, A.; Maaroufi, M. An AHP-GIS based site suitability analysis for integrating large-scale hybrid CSP+PV plants in Morocco: An approach to address the intermittency of solar energy. J. Clean. Prod. 2022, 369, 133250. [Google Scholar] [CrossRef]
- Liu, M.; Tay, N.H.; Bell, S.; Belusko, M.; Jacob, R.; Will, G.; Saman, W.; Bruno, F. Review on concentrating solar power plants and new developments in high temperature thermal energy storage technologies. Renew. Sustain. Energy Rev. 2016, 53, 1411–1432. [Google Scholar] [CrossRef]
- Jacob, R.; Bruno, F. Review on shell materials used in the encapsulation of phase change materials for high temperature thermal energy storage. Renew. Sustain. Energy Rev. 2015, 48, 79–87. [Google Scholar] [CrossRef]
- Xu, B.; Li, P.; Chan, C. Application of phase change materials for thermal energy storage in concentrated solar thermal power plants: A review to recent developments. Appl. Energy 2015, 160, 286–307. [Google Scholar] [CrossRef]
- Prieto, C.; Cabeza, L.F. Thermal energy storage (TES) with phase change materials (PCM) in solar power plants (CSP). Concept and plant performance. Appl. Energy 2019, 254, 113646. [Google Scholar] [CrossRef]
- Nunes, V.M.B.; Queirós, C.S.; Lourenço, M.J.V.; Santos, F.J.V.; Nieto de Castro, C.A. Molten salts as engineering fluids—A review: Part I. Molten alkali nitrates. Appl. Energy 2016, 183, 603–611. [Google Scholar] [CrossRef]
- Zanganeh, G.; Pedretti, A.; Zavattoni, S.; Barbato, M.; Steinfeld, A. Packed-bed thermal storage for concentrated solar power—Pilot-scale demonstration and industrial-scale design. Sol. Energy 2012, 86, 3084–3098. [Google Scholar] [CrossRef]
- Hänchen, M.; Brückner, S.; Steinfeld, A. High-temperature thermal storage using a packed bed of rocks—Heat transfer analysis and experimental validation. Appl. Therm. Eng. 2011, 31, 1798–1806. [Google Scholar] [CrossRef]
- Cheang, V.T.; Hedderwick, R.A.; McGregor, C. Benchmarking supercritical carbon dioxide cycles against steam rankine cycles for concentrated solar power. Sol. Energy 2015, 113, 199–211. [Google Scholar] [CrossRef]
- Song, J.; Wang, Y.; Wang, K.; Wang, J.; Markides, C.N. Combined supercritical CO2 (SCO2) cycle and organic rankine cycle (ORC) system for hybrid solar and geothermal power generation: Thermoeconomic assessment of various configurations. Renew. Energy 2021, 174, 1020–1035. [Google Scholar] [CrossRef]
- Garbrecht, O.; Al-Sibai, F.; Kneer, R.; Wieghardt, K. CFD-simulation of a new receiver design for a molten salt solar power tower. Sol. Energy 2013, 90, 94–106. [Google Scholar] [CrossRef]
- Yılmaz, İ.H.; Mwesigye, A. Modeling, simulation and performance analysis of parabolic trough solar collectors: A comprehensive review. Appl. Energy 2018, 225, 135–174. [Google Scholar] [CrossRef]
- Hachicha, A.A.; Yousef, B.A.A.; Said, Z.; Rodríguez, I. A review study on the modeling of high-temperature solar thermal collector systems. Renew. Sustain. Energy Rev. 2019, 112, 280–298. [Google Scholar] [CrossRef]
- Jamshed, W.; Nisar, K.S. Computational single-phase comparative study of a Williamson nanofluid in a parabolic trough solar collector via the Keller box method. Int. J. Energy Res. 2021, 45, 10696–10718. [Google Scholar] [CrossRef]
- Fernández-García, A.; Zarza, E.; Valenzuela, L.; Pérez, M. Parabolic-trough solar collectors and their applications. Renew. Sustain. Energy Rev. 2010, 14, 1695–1721. [Google Scholar] [CrossRef]
- Amber, I.; O’Donovan, T.S. Heat transfer in a molten salt filled enclosure absorbing concentrated solar radiation. Int. J. Heat Mass Transf. 2017, 113, 444–455. [Google Scholar] [CrossRef]
- Grosjean, A.; Soum-Glaude, A.; Thomas, L. Influence of operating conditions on the optical optimization of solar selective absorber coatings. Sol. Energy Mater. Sol. Cells 2021, 230, 111280. [Google Scholar] [CrossRef]
- International Renewable Energy Agency (IRENA). Renewable Power Generation Costs 2020. 2021. Available online: https://www.irena.org/-/media/Files/IRENA/Agency/Publication/2021/Jun/IRENA_Power_Generation_Costs_2020.pdf (accessed on 19 December 2022).
- Asociación de Empresas del Valle de Escombreras (AEVE). Escombreras Valley. Available online: https://aeve.org/valley-of-escombreras (accessed on 27 February 2025).
- Google Earth. Land Area at Coordinates 37.575406, −0.955836. 2023. Available online: https://earth.google.com/web/search/Escombreras+Power+Plant,+Avenida+de+la+Caridad,+Cartagena/@37.57328415,-0.95043203,43.35259683a,4423.72333985d,35y,0h,0t,0r/data=CiwiJgokCdbBTtTLykJAEVaD4GBFyUJAGWzDF9ywK-6_IcTz8PFg9O6_QgIIAToDCgEwQgIIAEoNCP___________wEQAA (accessed on 4 February 2025).
- Kassem, A.; Al-Haddad, K.; Komljenovic, D. Concentrated solar thermal power in saudi arabia: Definition and simulation of alternative scenarios. Renew. Sustain. Energy Rev. 2017, 78, 1298–1311. [Google Scholar] [CrossRef]
- International Renewable Energy Agency (IRENA). Renewable Power Generation Costs in 2021. 2022. Available online: https://www.irena.org/-/media/Files/IRENA/Agency/Publication/2022/Jul/IRENA_Power_Generation_Costs_2021.pdf (accessed on 25 May 2023).
- SolarPACES. Concentrating Solar Power Projects Database, National Renewable Energy Laboratory. 2021. Available online: https://solarpaces.nrel.gov/ (accessed on 9 January 2023).
- Nixon, J.D.; Dey, P.K.; Davies, P.A. Which is the best solar thermal collection technology for electricity generation in north-west India? Evaluation of options using the analytical hierarchy process. Energy 2010, 35, 5230–5240. [Google Scholar] [CrossRef]
- Prieto, C.; Blindu, A.; Cabeza, L.F.; Valverde, J.; García, G. Molten Salts Tanks Thermal Energy Storage: Aspects to Consider during Design. Energies 2024, 17, 22. [Google Scholar] [CrossRef]
- Boretti, A.; Nayfeh, J.; Al-Kouz, W. Validation of SAM modeling of concentrated solar power plants. Energies 2020, 13, 1949. [Google Scholar] [CrossRef]
- Wagner, M.J.; Gilman, P. Technical Manual for the SAM Physical Trough Model. 2011. Available online: http://www.osti.gov/bridge (accessed on 10 July 2023).
- Abánades, A.; Rodríguez-Martín, J.; Roncal, J.J.; Caraballo, A.; Galindo, F. Proposal of a thermocline molten salt storage tank for district heating and cooling. Appl. Therm. Eng. 2023, 218, 119309. [Google Scholar] [CrossRef]
- Wagner, M.; SAM Webinar Series. SolarPILOTTM and SolTrace Open Source Software. 2018. Available online: https://sam.nrel.gov/images/webinar_files/sam-webinars-2018-solarpilot-soltrace.pdf (accessed on 4 February 2023).


| Parabolic Trough | Tower | Fresnel | |
|---|---|---|---|
| Application |
|
|
|
| Advantages |
|
|
|
|
|
| |
|
|
| |
|
| ||
| |||
| Disadvantages |
|
|
|
|
|
| |
|
| ||
| |||
| |||
|
 | Parabolic Trough | Score | Solar Tower | Score | Linear Fresnel | Score | Parabolic Dish | Score | |||
|---|---|---|---|---|---|---|---|---|---|---|---|
| Technical | Efficiency | Capacity | MWe | 10–200 | 5 | 10–150 | 5 | 10–200 | 5 | 0.01–0.4 | 1 |
| Solar efficiency max | 20% expected | 2 | 20% demonstrated 35% expected | 4 | 21% demonstrated | 2.5 | 29% demonstrated | 3 | |||
| Plant peak efficiency | % | 14–20 | 3 | 23–35 | 4 | ~18 | 2.5 | ~30 | 4 | ||
| Thermal efficiency | % | 30–40 | 4 | 30–40 | 4 | - | - | 30–40 | 4 | ||
| Ideal conversion efficiency | % | 33% | 3 | 45% | 4.5 | 25% | 2.5 | 65% | 5 | ||
| Collector efficiency | % | 63% | 3.5 | 72% | 5 | 36% | 2 | 66% | 4 | ||
| Stagnation temperature | ºC | 600 | 3 | 1750 | 5 | 300+ | 2 | 1200+ | 5 | ||
| Optical efficiency | % | 80 | 4 | Varied | 3 | 67 | 3 | 94 | 5 | ||
| Concentration ratio | Number *(SUNS) | 30–100 | 2 | 300–1500 | 5 | 70–80 | 2 | 500–1500 | 5 | ||
| Capture efficiency | % | 91 | 4 | Varied | 3 | 76 | 3.5 | 100 | 5 | ||
| Fraction of electrical output | % | 10 | 3 | 10–20 | 4 | Higher | 5 | 4 | 1 | ||
| Compatibility with working fluid | Pressure tolerance | bar | 40–100 | 4 | 100+ | 5 | 69 | 3 | 20 | 2 | |
| Temperature tolerance | ºC | 100–400 | 3 | 150–800 | 5 | 100–300 | 2.5 | 500–1500 | 5 | ||
| Operating temperature of the solar field | ºC | 290–550 | 4 | 250–650 | 5 | 250–390, possibly up to 560 °C | 4.5 | 800 | 5 | ||
| Compatibility of the heat transfer medium | Synthetic oil | 3 | Molten salt | 5 | Water | 1.5 | Air | 1.5 | |||
| Reliability | Reliability | Prediction | 5.5—V. low | 2 | Medium | 3 | Medium | 3 | Med–low | 2.5 | |
| Availability | Use of standard technologies or parts | Med–low | 2.5 | Med–low | 2.5 | High | 3 | V. low | 1 | ||
| Economical | Affordability | Capital cost | USD/kW | 3972 | 4 | 4000 | 4 | 5168 | 3 | 12.578 | 1 |
| USD/m2 | 424 | 3 | 476 | 3 | 234 | 4 | – | ||||
| Maintenance | Total M&O cost in Spain | USD/kWhe | 0.023 | 3 | 0.025 | 3 | Low | 5 | 0.20 | 4 | |
| Maintenance | Total M&O cost | USD/kWhe | 0.012–0.02 | 4 | 0.034 | 3 | Low | 5 | 0.21 | 4 | |
| Cost | Levelized Cost of Electricity (LCOE) | USD/KWh | 0.26–0.37 (no TES) and 0.22–0.34 (with TES) | 4 | 0.2–0.29 (6–7.5 h TES and 0.17–0.24 (12–15 TES) | 4 | 0.17–0.37 (6 h TES) | 4 | - | ||
| Cost | Total cost | USD/kWh | 4449 | 4 | 5938 | 3 | - | - | |||
| Environmental | Resource usage | Land usage | m2/MWh/year | 3.2 | 3 | 4.6 | 5 | 1.8 | 2 | 4.15 | 4 |
| Area requirement | m2/MWh | 4–6 | 4 | 8–12 | 2 | 6–8 | 3 | 30–40 | 1 | ||
| Tolerance of slope | degrees | <1 | 2 | Flexible | 4 | <1 | 2 | Flexible | 4 | ||
| Water-cooled | m3/MWhe | 3.07 | 3 | 2.27 | 4 | - | None | ||||
| Water mirror washing | m3/m2/year | 0.022 | 4 | 0.022 | 4 | 0.022 | 4 | 0.022 | 4 | ||
| Efficiency at different scales | Better | 4 | Poor | 2 | Better | 4 | Better | 4 | |||
| Scalability | Suitable operating range | MW | 0.05–200 | 4 | 0.5–200 | 4 | 0.05–100 | 3 | 0.025–100 | 3 | |
| TOTAL | 101 | 116 | 87.5 | 86 | |||||||
| Parameters | Solar Field A1 | Solar Field A2 |
|---|---|---|
| Heliostat width [m] | 3.75 | 3.75 |
| Heliostat height [m] | 3.75 | 3.75 |
| Single-heliostat area [m2] | 13.64 | 13.64 |
| Number of heliostats | 1111 | 820 |
| Total heliostat reflective area [m2] | 15,127.5 | 11,144.4 |
| Receiver height [m] | 3.23 | 3.20 |
| Receiver diameter [m] | 2.50 | 2.58 |
| Tower height [m] | 29.3 | 30 |
| Receiver number of panels | 20 | 20 |
| Parameters | (60% NaNO3 + 40% KNO3) |
|---|---|
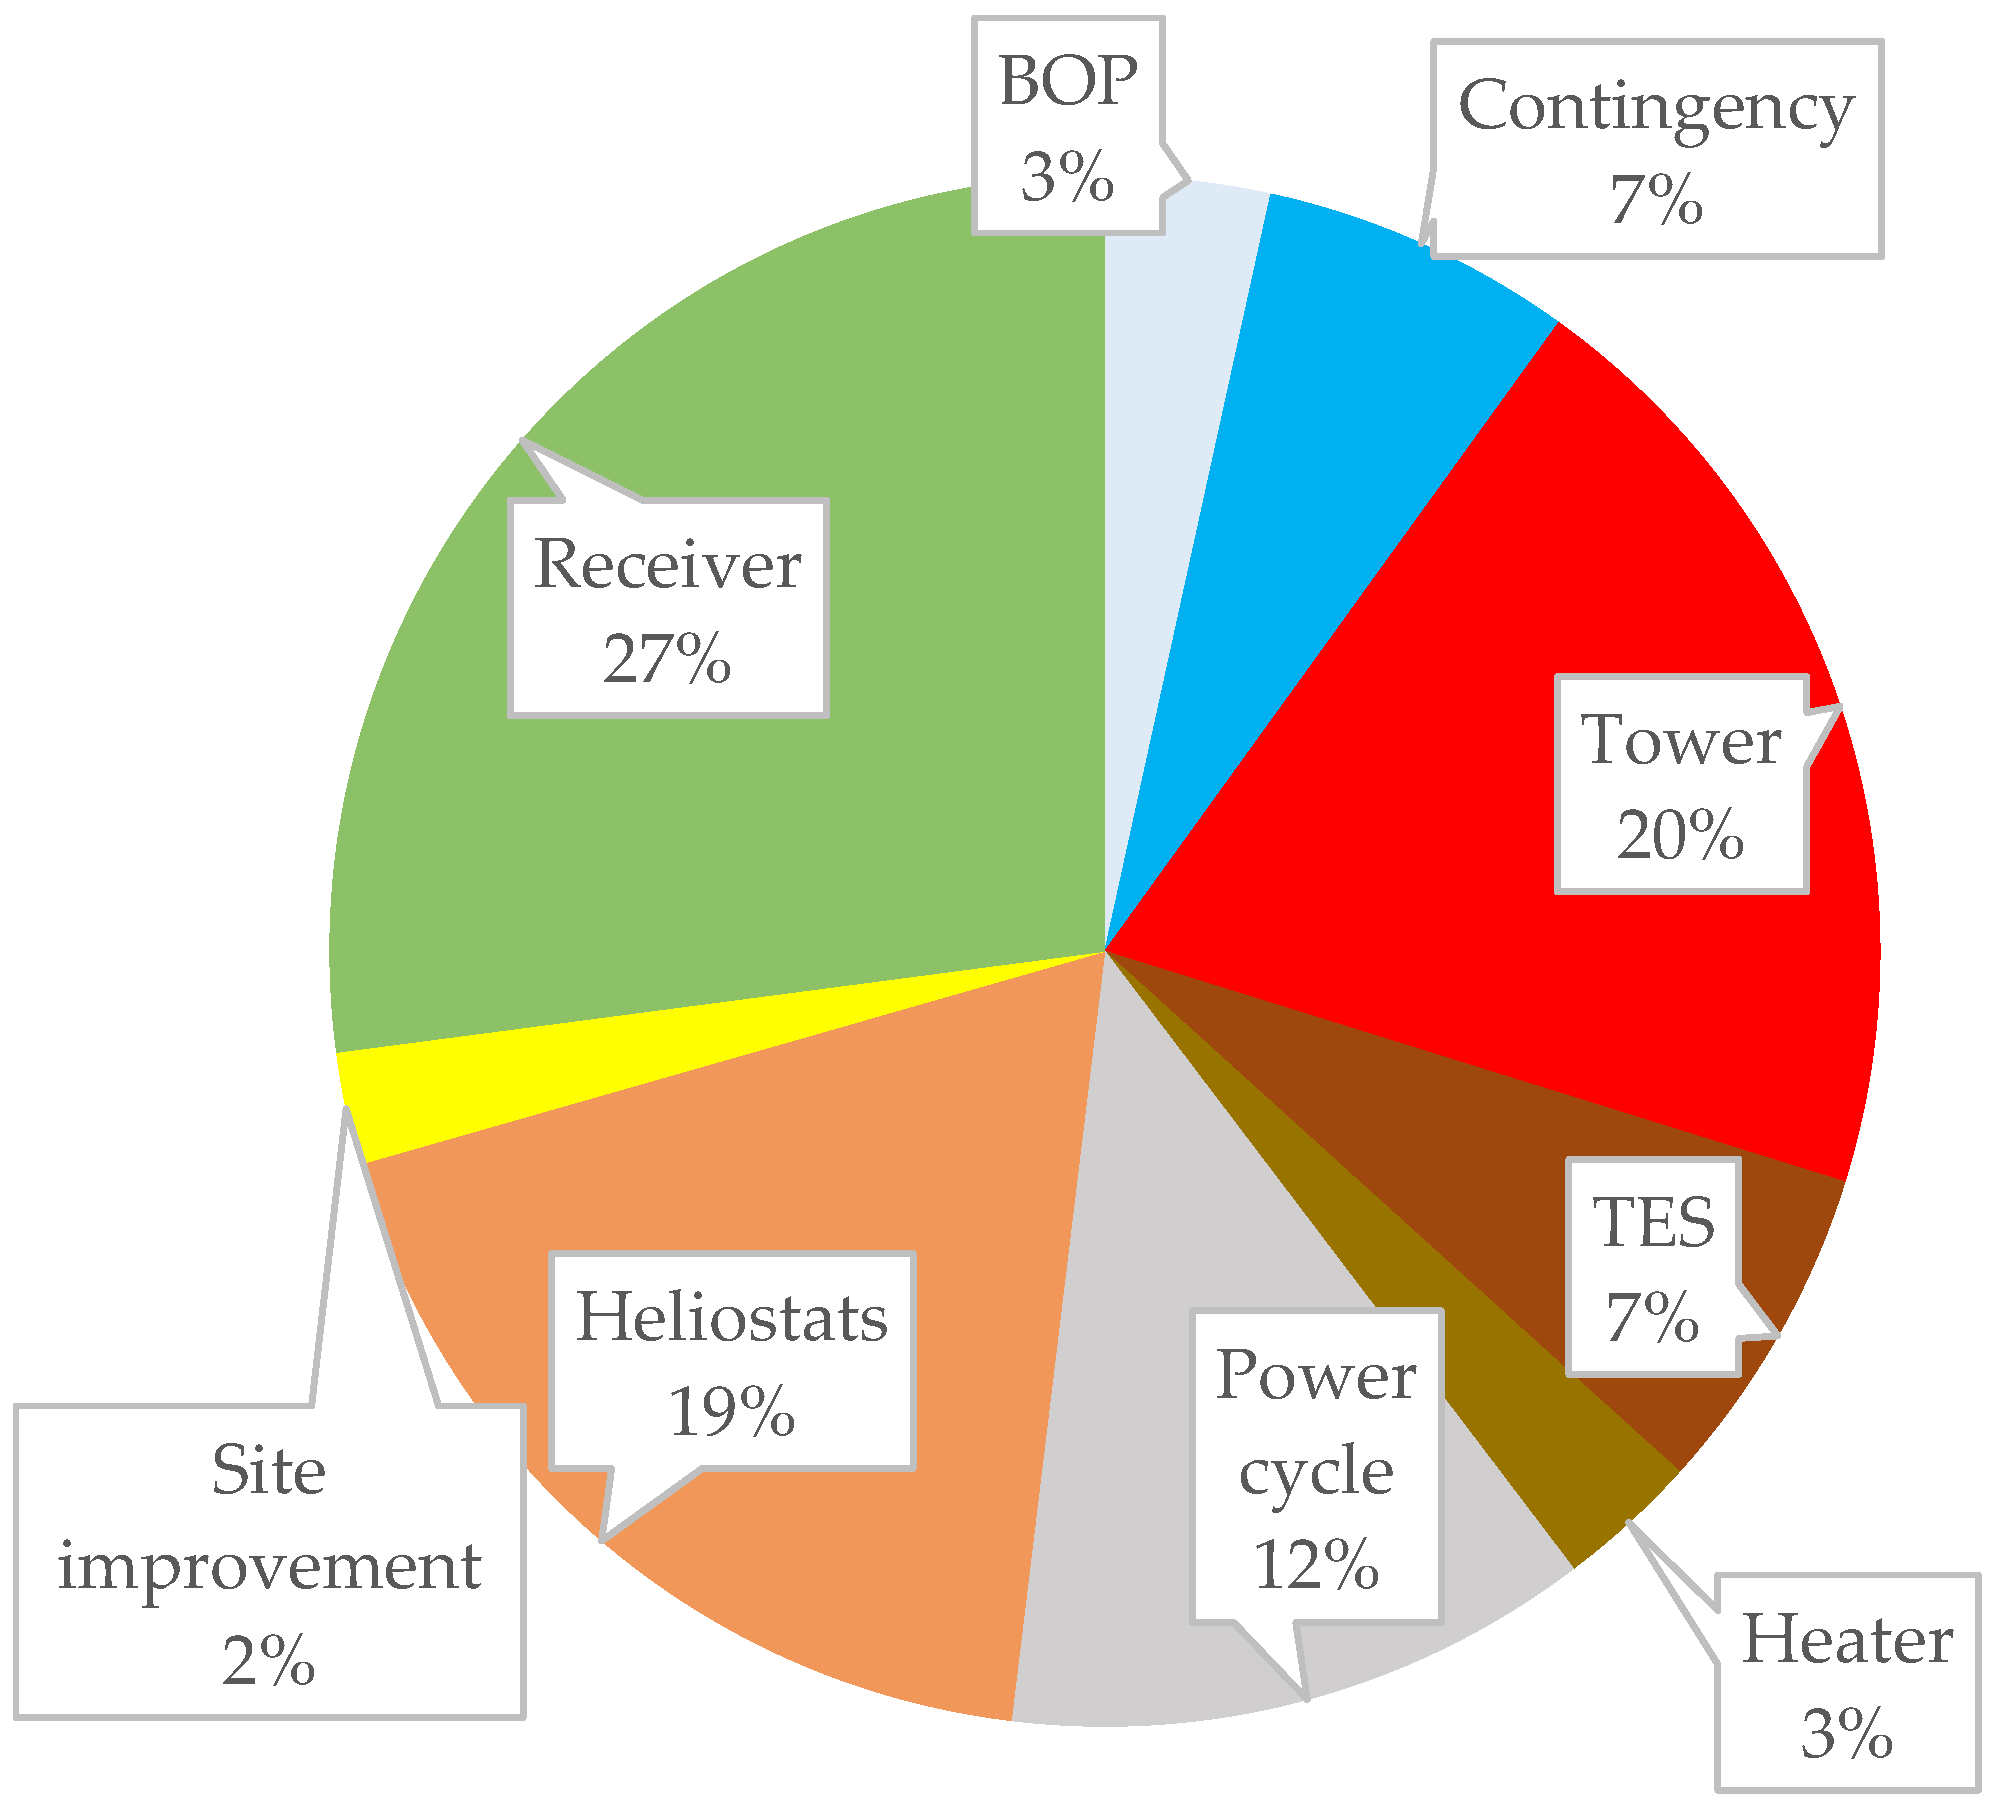
| BOP (M USD) | 0.73 |
| Contingency (M USD) | 1.39 |
| Tower (M USD) | 4.23 |
| TES (M USD) | 1.47 |
| Heater (M USD) | 0.63 |
| Power cycle (M USD) | 2.61 |
| Heliostats (M USD) | 3.97 |
| Site improvement (M USD) | 0.5 |
| Receiver (M USD) | 5.77 |
| Total direct cost (M USD) | 21.31 |
Disclaimer/Publisher’s Note: The statements, opinions and data contained in all publications are solely those of the individual author(s) and contributor(s) and not of MDPI and/or the editor(s). MDPI and/or the editor(s) disclaim responsibility for any injury to people or property resulting from any ideas, methods, instructions or products referred to in the content. |
© 2025 by the authors. Licensee MDPI, Basel, Switzerland. This article is an open access article distributed under the terms and conditions of the Creative Commons Attribution (CC BY) license (https://creativecommons.org/licenses/by/4.0/).
Share and Cite
Magalhães, M.F.; Mselle, B.D.; Galindo, F. Decision-Making and Selection Framework for Potential Implementation of Concentrated Solar Power Technologies: Case Study. Energies 2025, 18, 1753. https://doi.org/10.3390/en18071753
Magalhães MF, Mselle BD, Galindo F. Decision-Making and Selection Framework for Potential Implementation of Concentrated Solar Power Technologies: Case Study. Energies. 2025; 18(7):1753. https://doi.org/10.3390/en18071753
Chicago/Turabian StyleMagalhães, Maycon Figueira, Boniface Dominick Mselle, and Francisca Galindo. 2025. "Decision-Making and Selection Framework for Potential Implementation of Concentrated Solar Power Technologies: Case Study" Energies 18, no. 7: 1753. https://doi.org/10.3390/en18071753
APA StyleMagalhães, M. F., Mselle, B. D., & Galindo, F. (2025). Decision-Making and Selection Framework for Potential Implementation of Concentrated Solar Power Technologies: Case Study. Energies, 18(7), 1753. https://doi.org/10.3390/en18071753