Article

Navigating Environmental Concerns: Unveiling the Role of Economic Governance, Energy Transition, and Population Aging on Transport-Based CO2 Emissions in China

1
School of Management, Jiangsu University, Zhenjiang 212013, China
2
School of Economics and Trade, Guangdong University of Foreign Studies, Guangzhou 510515, China
*
Authors to whom correspondence should be addressed.
Energies 2025, 18(7), 1748; https://doi.org/10.3390/en18071748
Submission received: 16 January 2025 / Revised: 10 February 2025 / Accepted: 28 March 2025 / Published: 31 March 2025
(This article belongs to the Section C: Energy Economics and Policy)

Abstract

:
Achieving the Sustainable Development Goals (SDGs) is crucial for addressing global environmental challenges. SDG 13 calls for urgent climate action, while SDG 7 promotes sustainable energy. These objectives are particularly relevant to China, where transport-related CO2 emissions continue to rise due to urbanization, industrial growth, and increasing energy demand. This study examines the impact of economic governance, population aging, human capital, financial innovation, GDP growth, and energy transition on China’s transport-related CO2 emissions, using quarterly data from 2006Q1 to 2018Q4. The Method of Moments Quantile Regression (MMQR) is applied to analyze heterogeneous effects across different emission levels. The findings reveal that economic governance (ECOG), energy transition (ENT), and human capital (HI) significantly reduce transport CO2 emissions (TCO2E) by enhancing institutional effectiveness and promoting clean energy adoption. In contrast, population aging (POPAGE), financial innovation (FI), and GDP contribute to higher emissions by increasing energy consumption and private transport dependency. These insights highlight the need for stronger governance frameworks, sustainable financial policies, and increased investment in renewable energy. Policymakers should strengthen environmental regulations, expand green financing initiatives, and enhance public transport infrastructure to align with SDGs 7 and 13. By implementing these strategies, China can make significant progress toward reducing transport emissions, achieving carbon neutrality, and ensuring long-term sustainability.

1. Introduction

As global warming intensifies, achieving carbon neutrality has become a pivotal strategy to control and reduce greenhouse gas (GHG) emissions, particularly from key sectors like transportation [1]. These emissions, primarily CO2, CH4, and N2O, pose severe risks to climate stability and human survival [2]. The UNCCC has urged nations to take urgent action to curb CO2 emissions and limit global temperature increases to 1.5 °C by 2050 [3,4]. Similarly, the United Nations General Assembly introduced the 2030 Agenda, which includes 17 Sustainable Development Goals (SDGs) aimed at addressing climate and socioeconomic challenges. This study aligns with these global efforts by developing a comprehensive framework integrating carbon neutrality goals with SDGs 7 (Affordable and Clean Energy), 9 (Industry, Innovation, and Infrastructure), and 13 (Climate Action).
The transport sector is one of the largest contributors to the climate crisis, with millions of vehicles consuming fossil fuels and emitting substantial volumes of GHGs [5]. Since 1990, crude oil consumption in the transport sector has increased nearly eightfold, accounting for approximately 17% of total global GHG emissions. Road transportation alone released 7.3 billion metric tons of CO2 in 2020, representing 41% of global emissions [6]. Without urgent interventions, these emissions are projected to increase by 60% by 2050. Given these alarming trends, assessing emissions from the transportation sector is of critical importance and provides substantial contributions to the literature on environmental sustainability [7].
Several studies have examined the relationship between ECOG and environmental sustainability [8]. Institutional quality, regulatory policies, and governance efficiency are widely recognized as key determinants of a country’s ability to manage CO2 emissions. Empirical evidence suggests that well-structured environmental policies and governance mechanisms can significantly influence industrial emissions and transport-related energy consumption [9]. Furthermore, previous research has highlighted the role of FI in environmental sustainability [10]. FI, through mechanisms such as emissions trading systems, green bonds, and sustainable finance policies, has been shown to either mitigate or exacerbate environmental degradation, depending on the regulatory framework in place [11]. However, the direct impact of FI on transportation emissions remains underexplored, particularly in China.
Among the nations contributing significantly to transportation emissions, China stands out due to its rapid urbanization, economic growth, and rising vehicle ownership, making it a critical focus for understanding carbon neutrality efforts. Specifically, the transportation industry in China ranks as the third-largest sector in terms of energy consumption, positioning it as a significant contributor to CO2E [12]. With increasing global and domestic pressures to safeguard the environment, this sector faces formidable challenges in mitigating its emissions impact. ECOG, POPAGE, and FI are pivotal in shaping transportation emissions. Influencing policies, energy demand, and travel patterns play a critical role in transitioning toward sustainability, particularly in the context of China. These dimensions warrant further exploration, particularly in their potential to align with carbon neutrality goals and sustainable development objectives discussed earlier.
China, as the world’s largest carbon emitter and one of the fastest-growing economies, faces significant challenges in managing TCO2E. Rapid urbanization, economic expansion, and increasing vehicle ownership have positioned the transport sector as the third-largest energy consumer in the country, making it a major contributor to CO2 emissions [3]. In 2019, the transportation sector alone accounted for 13% of China’s total energy-related CO2 emissions [13]. Although the COVID-19 pandemic temporarily reduced transport emissions due to lockdowns, post-pandemic economic recovery has further emphasized the urgency of adopting sustainable transport policies. In this context, key factors such as ECOG, FI, and POPAGE play crucial role in shaping transportation emissions by influencing policies, energy demand, and travel behaviours. Understanding the interplay between these factors and TCO2E is essential for designing effective carbon neutrality strategies. ECOG, FI, and POPAGE play important roles in shaping environmental sustainability by influencing policy implementation, resource allocation, and energy demand [8,14,15]. Many governance frameworks highlight specific dimensions of their efficiency. In the case of transport CO2 emissions (TCO2E), different governance measures yield varying outcomes [16,17]. The significance of institutional quality as a determinant of a country’s environmental well-being is evident from global and regional models [12,18].
Numerous past studies have used panel data models, autoregressive distributed lag (ARDL) models, and structural equation modeling (SEM) approaches to analyze CO2 emissions [19,20,21,22]. However, these models often assume homogeneity in the relationship between variables and do not fully capture the heterogeneity present in real-world emissions data. In contrast, the Method of Moments Quantile Regression (MMQR) approach used in this study allows for a more nuanced understanding of emissions dynamics by estimating effects across different quantiles rather than focusing solely on mean-based outcomes [23]. This methodological advancement provides greater insight into how economic governance, financial innovation, and demographic factors impact TCO2E across varying levels of emissions intensity. Despite the increasing interest in sustainable transportation, the existing literature has largely overlooked the quantitative relationship between economic governance, financial innovation, population aging, and TCO2E in China. While studies have analyzed individual factors in isolation, an integrated framework that examines their combined impact on transportation emissions remains lacking. Furthermore, the application of advanced econometric models such as MMQR to assess transport-sector emissions has been limited.
Given the urgent need to curb TCO2E and align with carbon neutrality objectives, this study aims to empirically investigate the impact of ECOG, FI, and POPAGE on TCO2E in China’s transportation sector. By employing the MMQR technique, this research provides a comprehensive analysis of how these factors contribute to emissions reductions at different levels of CO2 intensity. Unlike conventional econometric models that focus on average effects, MMQR allows for a more nuanced examination of how governance, financial, and POPAGE variables impact emissions across varying quantiles. This methodological approach enhances understanding of the heterogeneous effects of these factors, offering critical insights into China’s carbon neutrality transition.
Furthermore, the study seeks to bridge the existing gap in the literature by integrating findings with SDGs 7 (Affordable and Clean Energy) and 13 (Climate Action), ensuring that the results align with global sustainability efforts. To achieve this goal, this study systematically examines the relationship between ECOG, FI, and POPAGE with TCO2E in China by conducting a quantile-based analysis. It further assesses the extent to which FI and governance mechanisms can influence CO2 reduction strategies. It explores the implications of a POPAGE on transport-related energy demand and emissions patterns. By doing so, this study not only contributes to the theoretical discourse on sustainable transportation but also provides practical recommendations for policymakers to develop data-driven, low-carbon transport policies. The findings will inform strategies to enhance environmental governance, improve financial incentives for clean energy investments, and adopt sustainable mobility solutions for an ageing population.
This research makes several key contributions to the field. First, it employs an advanced MMQR methodology to capture the heterogeneous effects of ECOG, FI, and POPAGE on TCO2E, offering deeper insights than traditional mean-based models. Second, it uniquely focuses on China’s transportation sector, which has received limited attention in the literature despite being a major contributor to CO2 emissions. Third, by explicitly linking its findings to China’s carbon neutrality targets and global SDGs, the study ensures its relevance to both national policymakers and international sustainability initiatives. Fourth, it provides new empirical evidence on the role of FI in CO2 emissions reduction, addressing a largely unexplored dimension in the sustainability discourse. Finally, this study offers actionable policy recommendations to integrate sustainable transportation strategies with economic governance and FI, fostering a more resilient, low-carbon future for China’s transport sector.
Figure 1 shows the TCO2E, FI, ECOG, and POPAGE trends from 2006 to 2018. TCO2E steadily increased over the years, while FI experienced a decline before recovering sharply by 2018. ECOG exhibited fluctuations, with periods of both improvement and decline but steadied by 2018. Meanwhile, Popage gradually rose throughout the period, showing a steady population ageing.
The research is structured as follows: Section 2 provides a comprehensive literature review, Section 3 outlines the data sources and methodology, Section 4 presents the results and discusses them, and Section 5 concludes with policy recommendations.

2. Literature Reviews

The issue of environmental instability is one of the most fundamental and challenging global problems in the present era. The concern of economic activities at the worldwide level is creating a threatening situation for environmental sustainability and anthropogenic health. Various scholars have identified nexuses of air pollution, mainly CO2, with different variables at different times and with varied results, including [24,25,26,27]. This environmental issue still needs full concentration in order for us to come up with sustainable policies for different regions and scenarios. For this reason, we have chosen FI, ECOG, HI, POPAGE, and ENT, commensurate with their impact on environmental degradation along with the acute impact on human beings. In order to follow our objective, a literature review was conducted, and linkages between our concerned variables were established with carbon emissions.

2.1. ECOG and Environment Sustainability

Regulatory quality plays a crucial role in environmental outcomes, as noted by [4,28]. According to [29,30], excessive regulations that hinder firms from entering markets are associated with lower democratic governance, increased corruption, and the expansion of unofficial economies. Overregulation of firm activities can manifest as hidden fees for licenses and permits, arbitrary taxes, and redundant laws. Countries that establish clear policies on permit issuance, fees, and taxes can improve firm compliance with regulatory requirements, promoting responsible industrial production and better management of industrial by-products. Refs. [31,32] suggest that eco-friendly regulations can enhance economic growth, demonstrating that regulation may lead to positive outcomes. The effectiveness of the government in controlling CO2E is another critical factor.
This includes excessive bureaucracy, inefficiencies in public administration, and weak governance or financial mismanagement, especially within the government’s green regulatory agencies [33,34]. Ref. [35] found that countries with better public sector governance featuring solid macroeconomic management and effective public spending experience more robust economic growth. Effective governments, characterized by efficient bureaucracy, swift public services, and sound financial management, can build producer confidence and better enforce CO2E regulations. Political stability is essential in ensuring adherence to governance aspects, such as the rule of law. Political instability often indicates weakness within the governing regime, making it difficult to build robust institutions like the judiciary [12,36]. Political instability weakens state institutions, governance, and regulatory quality and increases corruption, all of which severely hinder efforts to mitigate CO2E.

2.2. POPAGE and Environment Sustainability

Currently, the impact of POPAGE on TCO2E remains uncertain. There are differing perspectives regarding this matter. Some argue that as the elderly population grows, the energy consumption pattern gradually shifts towards more energy-intensive merchandise and services. Consequently, this shift circuitously contributes to an increase in emission levels. On the contrary, alternative viewpoints suggest that the income level and lifestyle choices of the elderly tend to align with low-carbon and atmosphere-friendly consumption patterns. This inclination towards sustainable practices among older adults is believed to improve environmental quality potentially [20,37]. In earlier research, Popage was often included as one of the key demographic indicators in various research models. The authors of [38] inspected the energy use and economic growth ecological model utilizing panel data from OECD economies from 1960 to 2000. Their study employed nonparametric kernel estimation and cross-regional regression to investigate the relationship between economic indicators and population change.
The findings indicated the presence of an inverted U-shaped curve, suggesting a complex association between population dynamics and economic factors. In one such study, the impact of POPAGE on energy utilization and CO2E in the United States was explored by [39]. Surprisingly, future CO2E in the low-population case could be reduced by about 40 per cent. Another surprising finding is that in some scenarios, the impact of POPAGE on CO2E could be comparable to, or even higher than, the effect of technology change. This estimation shows the importance of considering demographic structure while analyzing and dealing with atmospheric challenges. Ref. [40] extends the analysis of macroeconomic emissions by considering population-age structures and birth-year composition. By analyzing data from 26 OECD countries between 1960 and 2005, the authors estimate coefficients that may explain the factors affecting CO2E. Their estimates indicate that both cohort effects and life cycle are significant determinants of CO2E in the OECD.
These findings underline the relevance of demography when uncovering the dynamics of CO2E from a macroeconomic perspective. Recently, over the past years, researchers employed the Stochastic Impacts by Regression on Population, Affluence, and Technology model and its newer versions that take into consideration the population as a dynamic factor in estimating the co-movement between POPAGE and CO2E. Notably, the work of authors [3,41] examines how population influences CO2E in China at both the provincial and national levels, assisted by stochastic impacts based on regression on population, affluence, and technology framework. Utilizing the model, the researchers evaluate the relationship between population and CO2E, further providing significant insight into its functional nature within China.
Later, they found out that ageing contributes to higher CO2E at the national level but with substantial regional differences. Ref. [42] sets the evidence of their study at the provincial level for China. The authors use an advanced type of Stochastic Impact by Regression on Population, Affluence, and Technology model. They found out that the shift in the share of the population in the working age group influences CO2E positively and only in the eastern part of China. Similarly, in the work of [20], the threshold method is developed for asymmetry analysis between the aged population and CO2E in the ten provinces of China. The results indicated that the impact of the aged population on CO2E is negative when the degree of ageing is both above and below the threshold level. These findings underline the complexity and nuances involved in the relationship between the elderly and CO2E, which is very informative for policymakers and researchers alike.

2.3. FI and Environment Sustainability

FI has gotten the attention of researchers and policymakers as an ecological instrument. FI is a vital element of financial inclusion. The previous scholars’ findings looking into the co-movement among financial inclusion, financial development, and environmental mitigation might be efficiently divided into two clusters. The first cluster claims that financial inclusion could mitigate environmental worsening, while the other claims that financial inclusion encourages the enhancement of ecological decrepitude. Most schools of thought authenticate the first sort of inference. In the context of China, the authors of [22] have examined the link between inventions in financial development and transportation infrastructure. Using the wavelet technique [43], the development of financial expenditure significantly reduces environmental degradation. The research into the stimulus of financial development on CO2E expressed geographical erraticism; financial development might enhance CO2E in emerging countries while mitigating CO2E in developed countries [44]. The AMG method was applied to investigate the association between FI, technology innovation, and other helping variables and environmental sustainability in the Asia–Pacific regions from 2004 to 2018. The AMG method’s outcome revealed that financial inclusion enhances eco-sustainability in the selected areas.
In the ECOWAS block framework, Ref. [14] investigates the impact of financial inclusion on eco-friendly sustainability. They felt that financial inclusion degrades eco-sustainability. Moreover, numerous documents have expressed the difference between financial development and financial inclusion on atmosphere devastation [8,43,45]. Nevertheless, the co-movement between FI and TCO2E is attentionally limited and ignored. Recent literature studies have highlighted the emergence of digital financial inclusion as a novel concept within the financial sector. Ref. [46] discusses how FI utilizes innovative approaches to enhance financial operations, aiming to address existing challenges and improve accessibility. In a review article by [47], it is emphasized that FI plays a crucial role in providing equitable access to digital financial services for all individuals. This, in turn, contributes to sustainable financial development and aligns with the objectives of the 2030 SDGs.
By promoting FI, organizations can foster inclusive financial systems while actively supporting the advancement of digital financial inclusion, facilitating progress toward the SDGs. In recent research by [48], the authors conducted massive research on the association between FNI and ecological sustainability while also exploring the moderating part of technological advancement in the twenty-seven European economies from 1995 to 2018. Utilizing the Method of Moments Quantile Regression Technique, their findings demonstrate that FI initially contributes to ecological ruin. Meanwhile, when considering the moderating effect of advancement, the results indicate that FI leads to decreased environmental deterioration within the Eurozone. Ref. [11] investigates the straight and indirect influence of FI on environmental destruction along with technological innovation in the case of China. The document used the ADRL approach to find FI’s influence on the ecology. The study’s outcome reveals that FI overcame the environmental disintegration in China. However, the research shows that technology raises pollution in China’s air. Hence, FI ought to be fortified nationally to complete the neutrality target [14,49].

2.4. Knowledge Gap

Through pragmatic research, scholars have assessed the influence of financial development, financial inclusion, POPAGE, and ECOG on consumption and production-based CO2E. However, a lack of comprehensive investigation remains into the role of TCO2E, POPAGE, ECOG, and FI as key environmental parameters for achieving carbon neutrality goals. To fill the literature gap, this study extensively explores the effects of ECOG, FI, and POPAGE on TCO2E, particularly in China’s economies. This study has thoroughly examined the impact of other control elements, including HI, ENT, and GDP, on TCO2E.

3. Methodology

3.1. Model Specifications

The regression model of the research is developed as follows:
T C O 2 E i t = α i + β 1 E C O G i t + β 2 F I i t + β 3 P O P A G E i t + β 4 E N T i t + β 5 G D P i t + β 6 H I i t + μ i t
where i is a country (China), t is 2006–2018, α i ( α = 1…N) showcases the unidentified intercept for every individual variable, β demonstrates coefficients for the core and control variables, and u i t is the error term. TCO2E refers to transport-based carbon emissions, ECOG refers to economic governance, FI refers to financial innovation, POPAGE refers to population ageing, ENT refers to the energy transition, GDP refers to gross domestic product, and HI refers to the human capital index.

3.2. Data Source

This study obtained data for the China region from different sources such as the Organization for Economic Co-Operation and Development (OECD), World Development Indicators (WDI), Our World Data (OWD), and Penn World Table (PWT 10). This research collected data from 2006 to 2018 due to the availability. The data were converted from a yearly form to a quarterly form for better analysis. This study chose transport-based CO2E as a dependent variable. Population ageing, economic governance, and financial innovation are designated as explanatory variables. GDP per capita, energy transformation, renewable energy consumption, and human capital index were used as a control variable. This research converted all variables data from natural to logarithmic to avoid scale discrepancies. The data-obtaining sources, signs, descriptions, and measurements are displayed in Table 1.

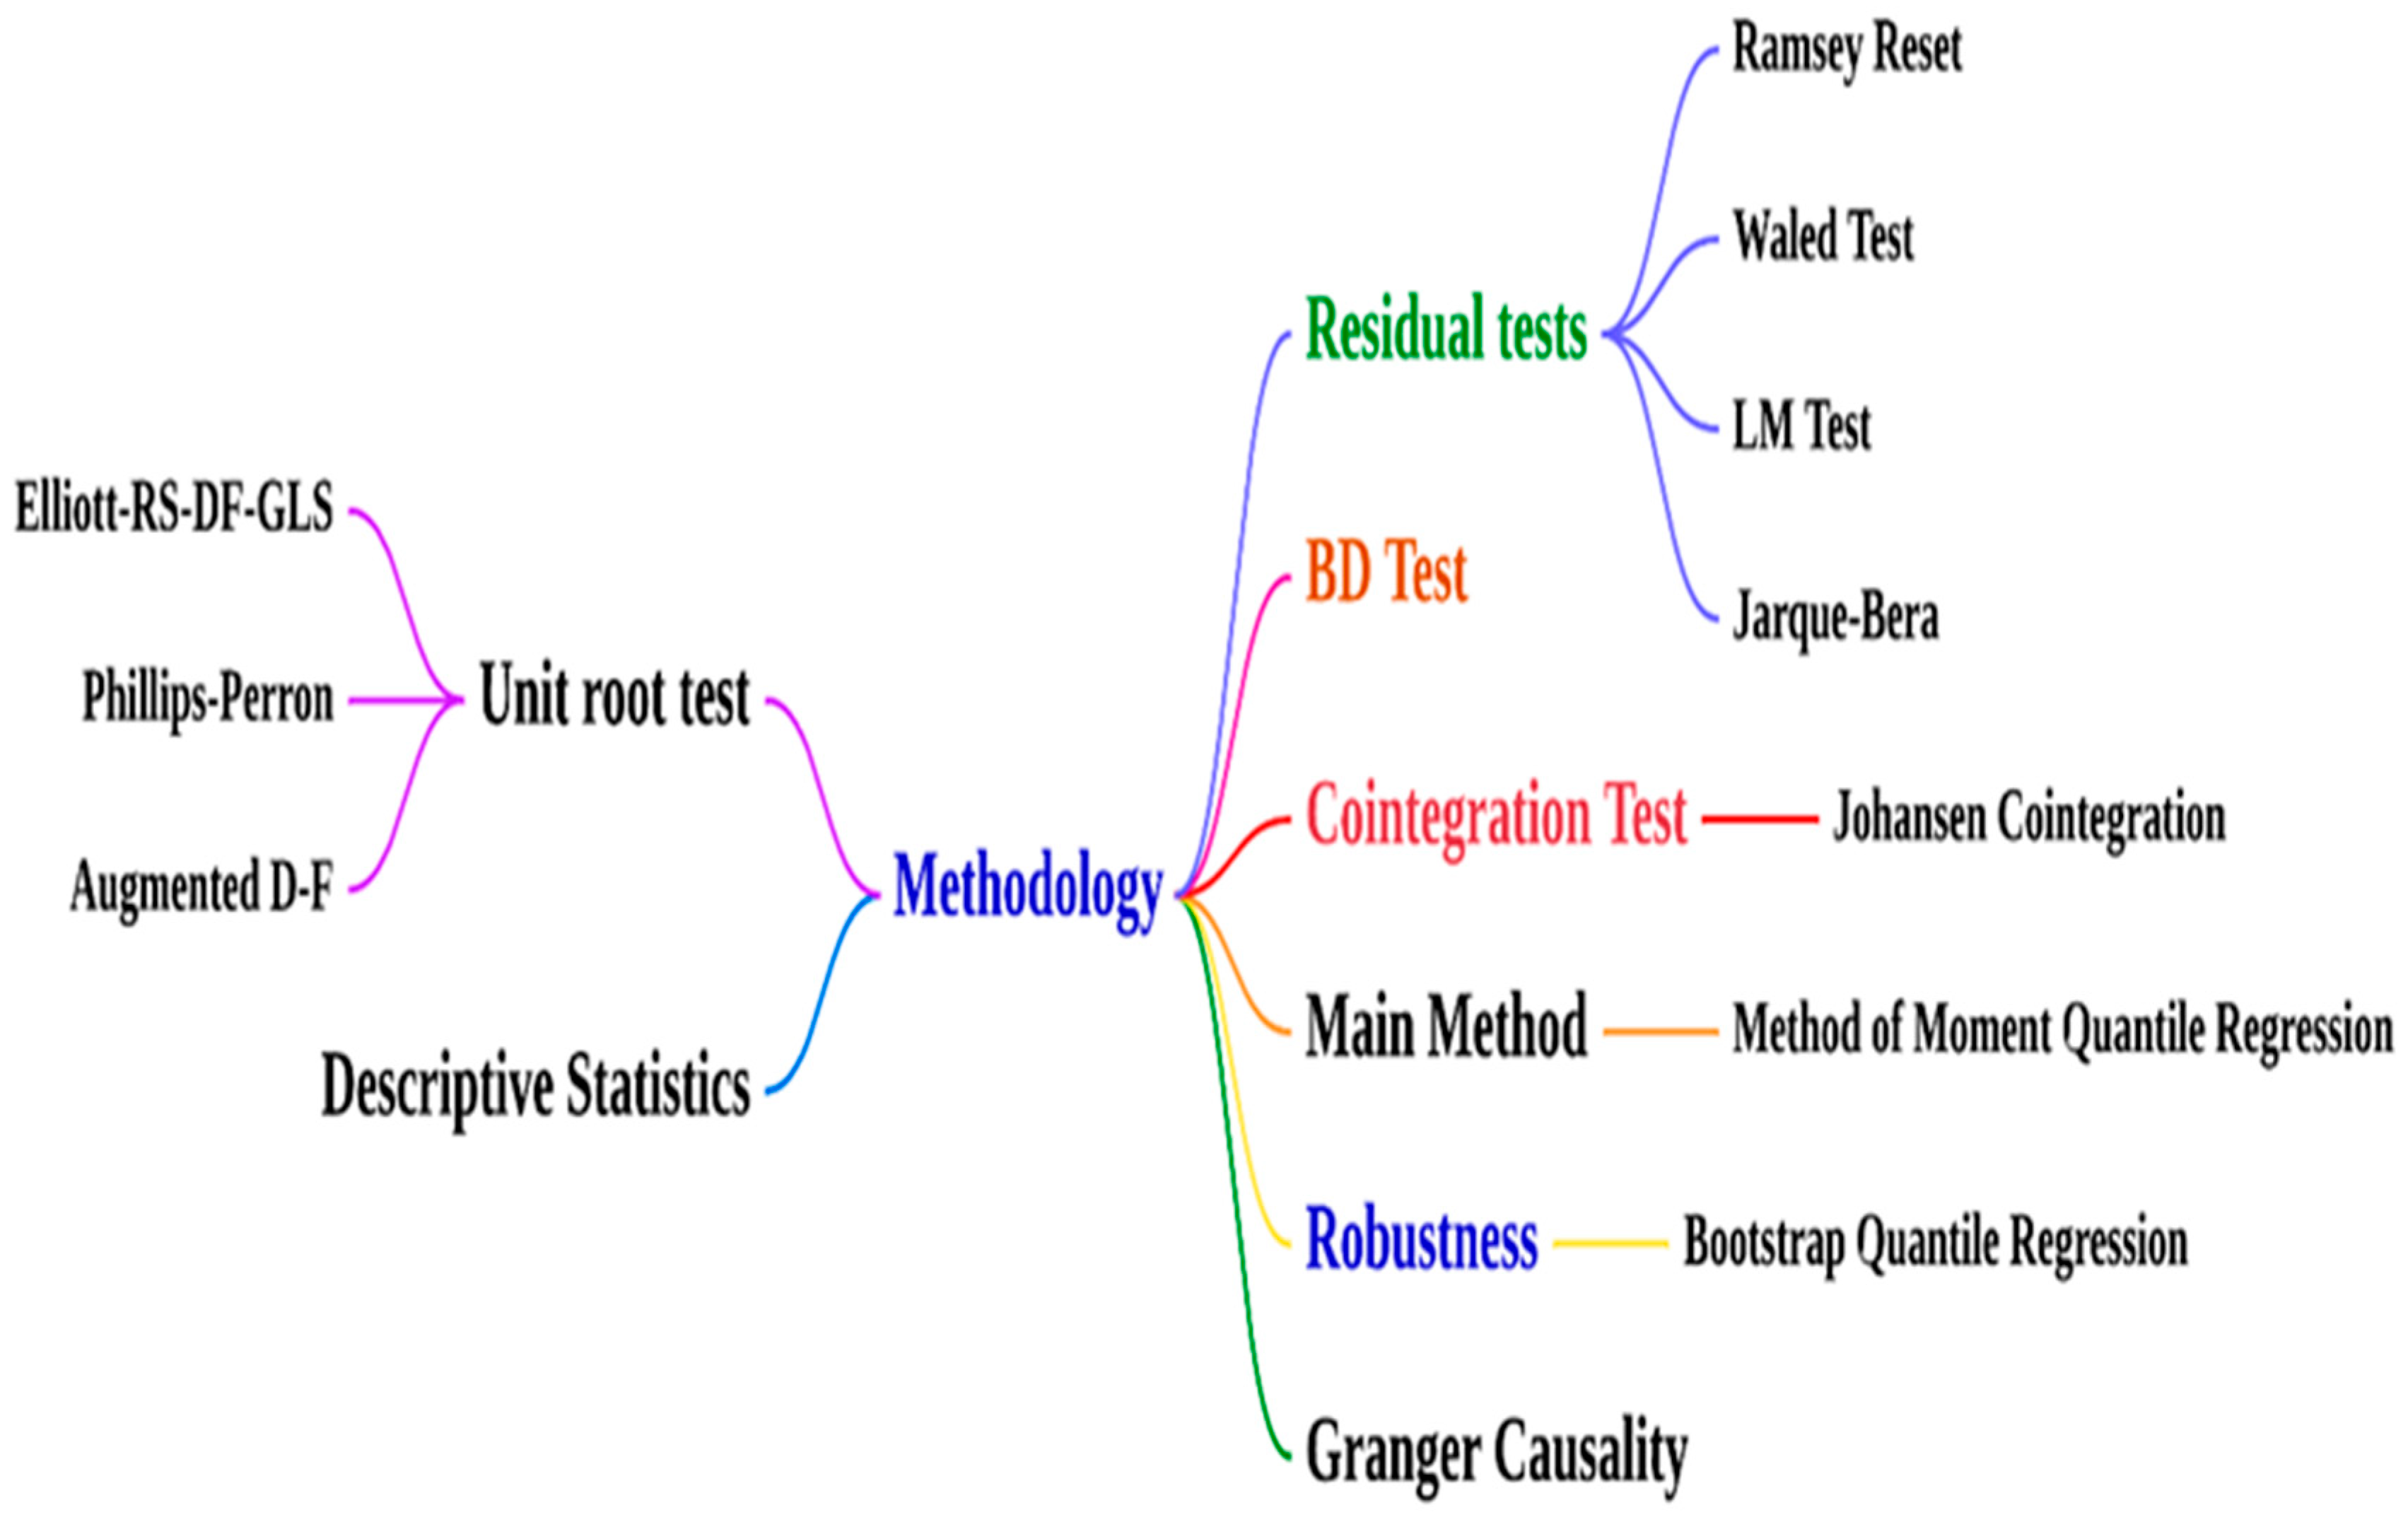
3.3. Econometric Methods

The first stage of the analysis covers a preliminary investigation of the data through descriptive statistics that are used to confirm the correlation among the study variables. After this method, this study [50,51,52] deployed a unit root test to investigate the integration level in the variables. The Arch test exhibits the volatility in the data that indicates the presence of heteroskedasticity; the LM test is deployed to verify the presence of serial correlation; however, the Jarque–Bera test is used to determine whether the data are normally distributed. The Wald test is utilized to evaluate the significance of estimated elements in a statistical model through the investigation of whether they are significantly dissimilar from a particular value. It normally engages in hypothesis examination to determine if the core variables have a significant influence on the dependent parameter, thus validating the association specified within the model. The study deployed the Johansen co-integration test that was introduced by Soren Johansen in 1988. This test was used to find the presence and number of co-integration correlations among the non-stationary time series parameters. This technique is beneficial for the multivariate time series models, permitting scholars to assess the degree of co-movement between the parameters.
Furthermore, this study applied the MMQR approach established by [53] to examine the co-movement between the parameters. The primary objective of this method is to capture the conditional heterogeneity of the dependent variable. MMQR is designed to assess the influence of covariance under conditional heterogeneity while allowing individual effects to impact the entire distribution of the model. The location-scale variant of various quantiles denoted as Q y τ | X is characterized and expressed as follows:
Q y τ / X = X β τ + ρ i + ω i
where
  • ρ i , β and ω ˜ represent the coefficient of the study.
  • An additive term  ρ i reflects the fixed effects in the model.
  • The representative function R(Z) is used for the characteristic variant, and it is defined as follows:
R ( Z ) = Z γ + ε i
where ε i is identically and independently distributed (i.i.d) across all cross-sections of the data over time t. Based on the above discussion and Equation (2), the following model is used to transform the approach introduced by [53]:
Y i t = X i t β τ + ρ i + ω i t ˜
where X represents a set of exogenous parameters, including ECOG, FI, POPAGE, ENT, GDP, and HI, and the quantiles considered in this study are 0.25, 0.50, 0.75, and 0.90, as expressed as follows:
Q τ Y / X = X β τ + ρ i + ω , τ ˜ 0.25 , 0.50 , 0.75 , 0.90
The MMQR approach provides accurate approximations at specific scales and locations, demonstrating the effects at each quantile level. This study is designed to test the robustness of the constructed model, ensuring its validity across different quantile distributions.
Furthermore, the BSQR technique is applied to investigate the model’s robustness. The BSQR is an alternative technique for examining confidence intervals. The benefit of these specifications is that they overcome the factor limitation of asymptotically normal sample diffusion while rearranging the data to make statistical interpretations. The BSQR method utilizes algorithmic pressures to evaluate the factual sampling distribution of the assessed model. It offers valuable estimation techniques and reveals empirical discoveries [54]. Figure 2 interprets the methodology flow chart.

4. Results and Discussion

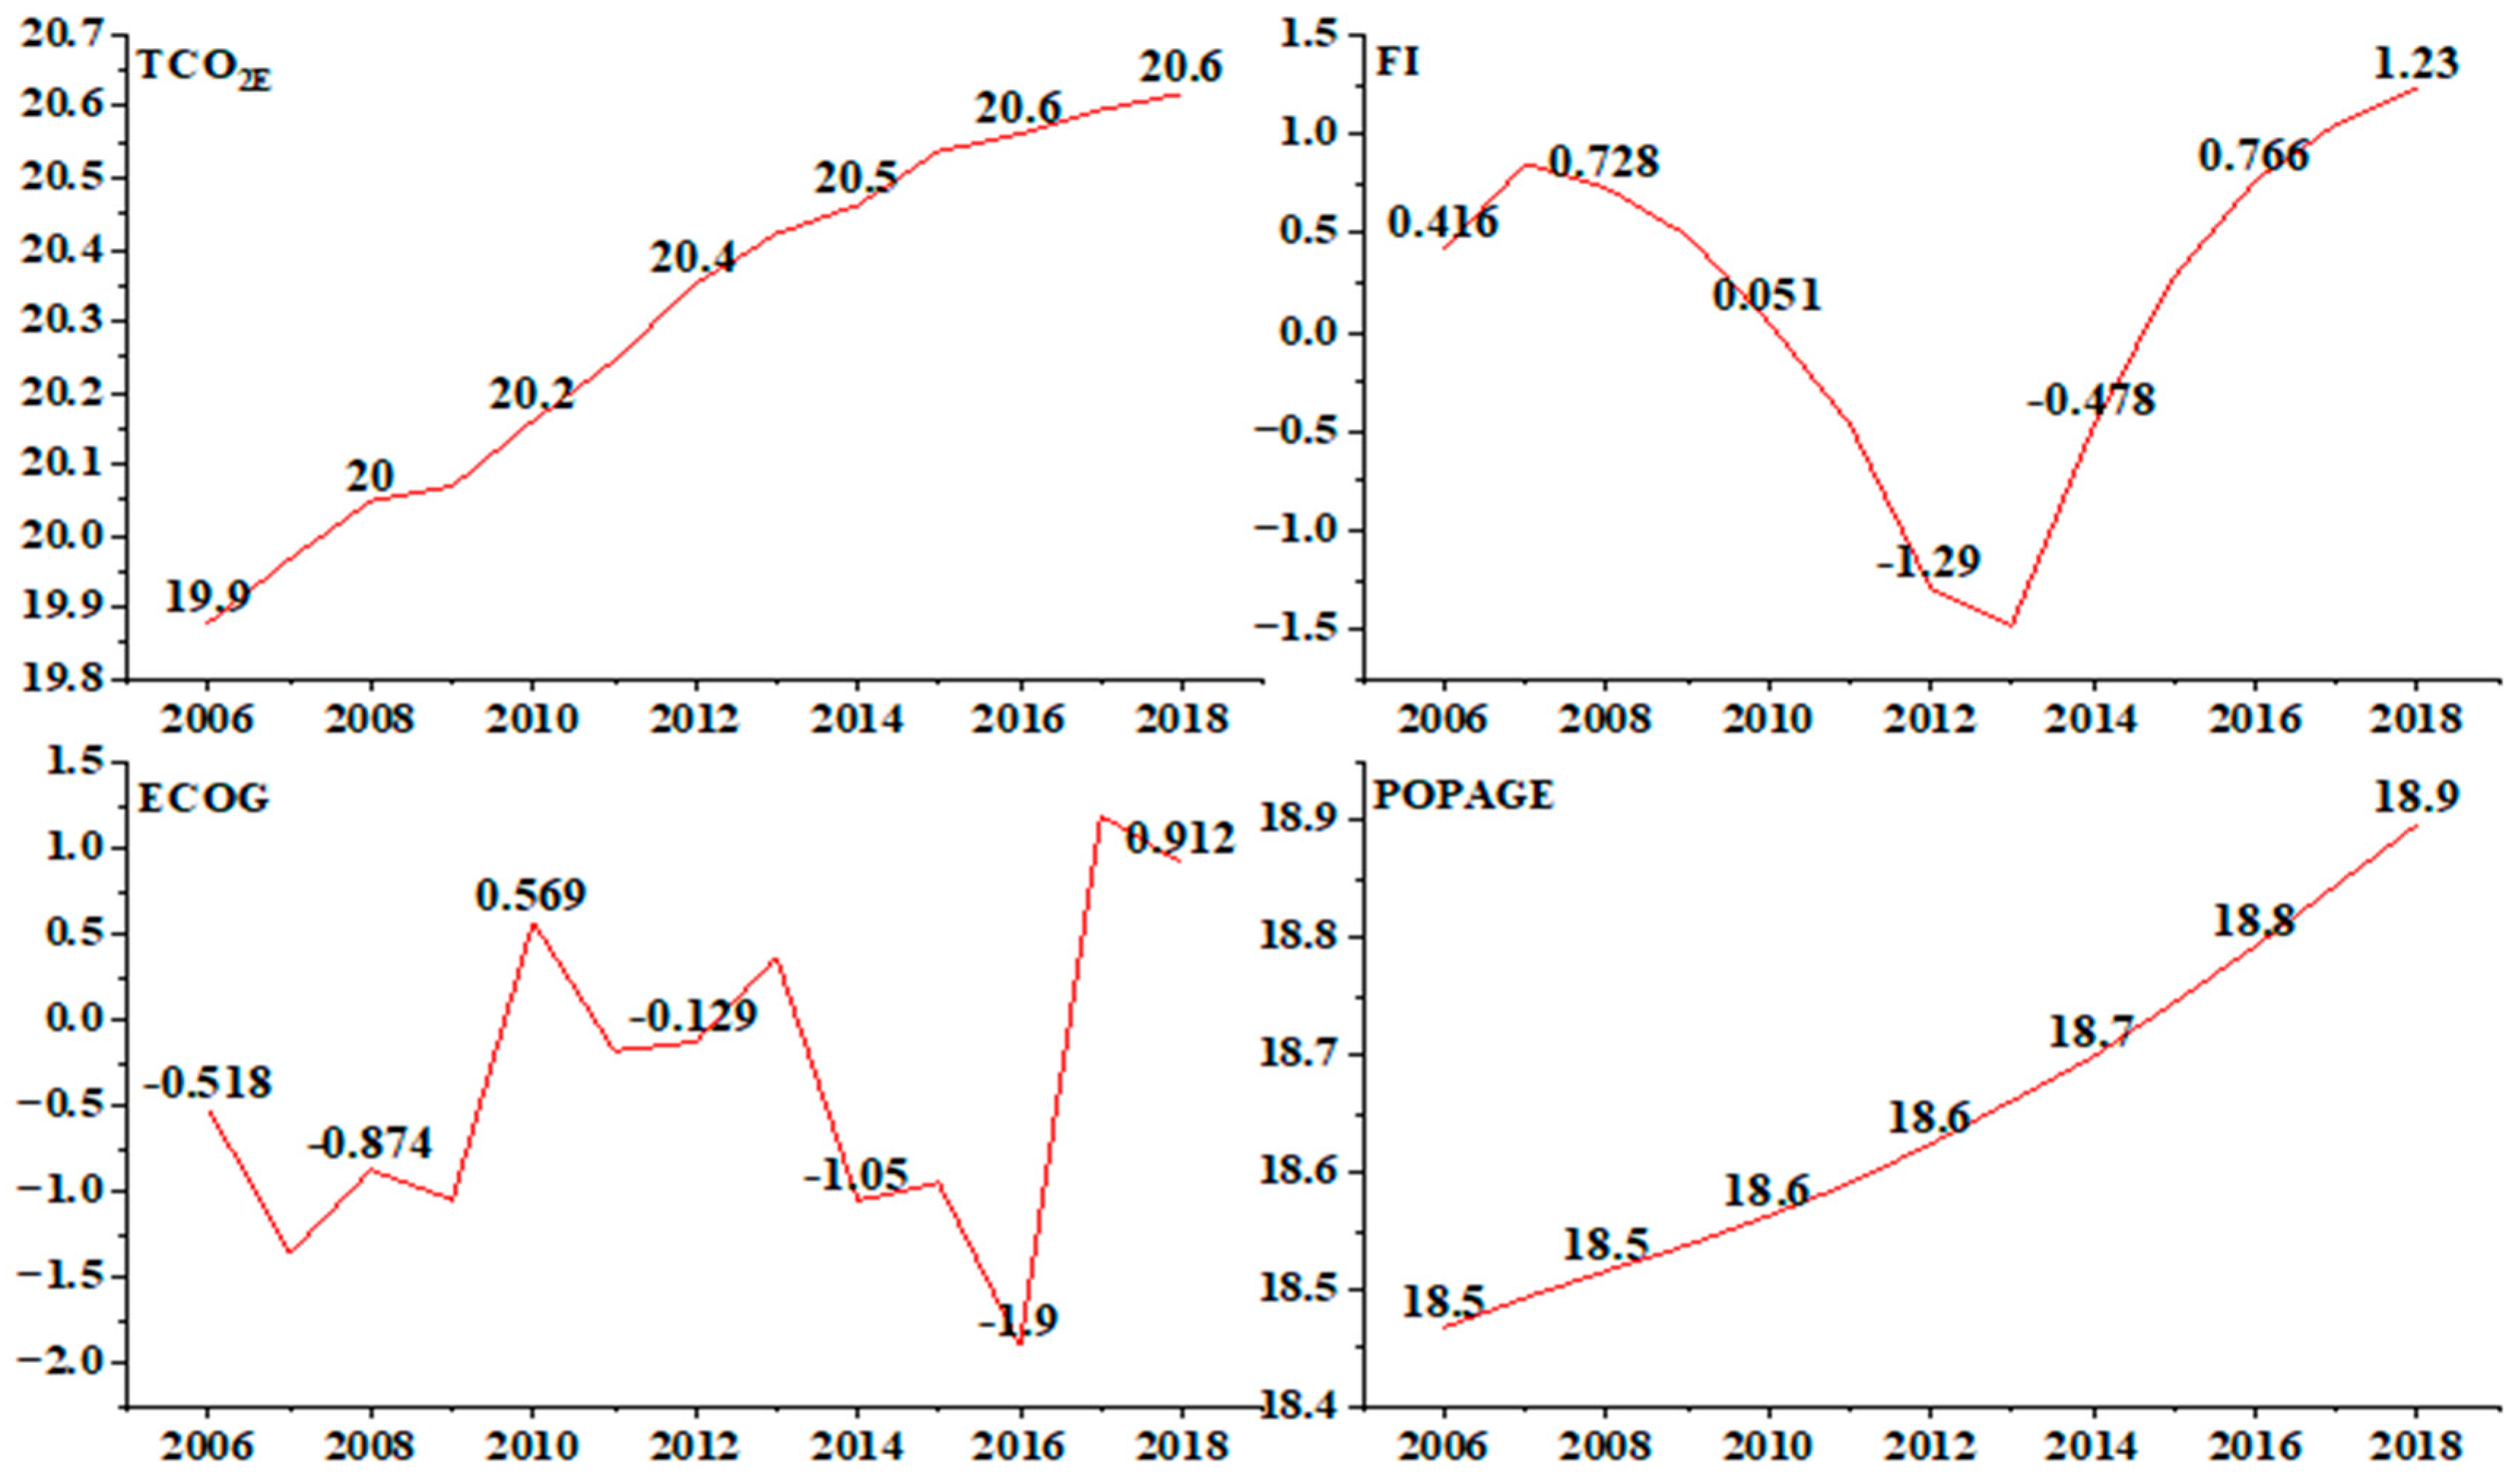
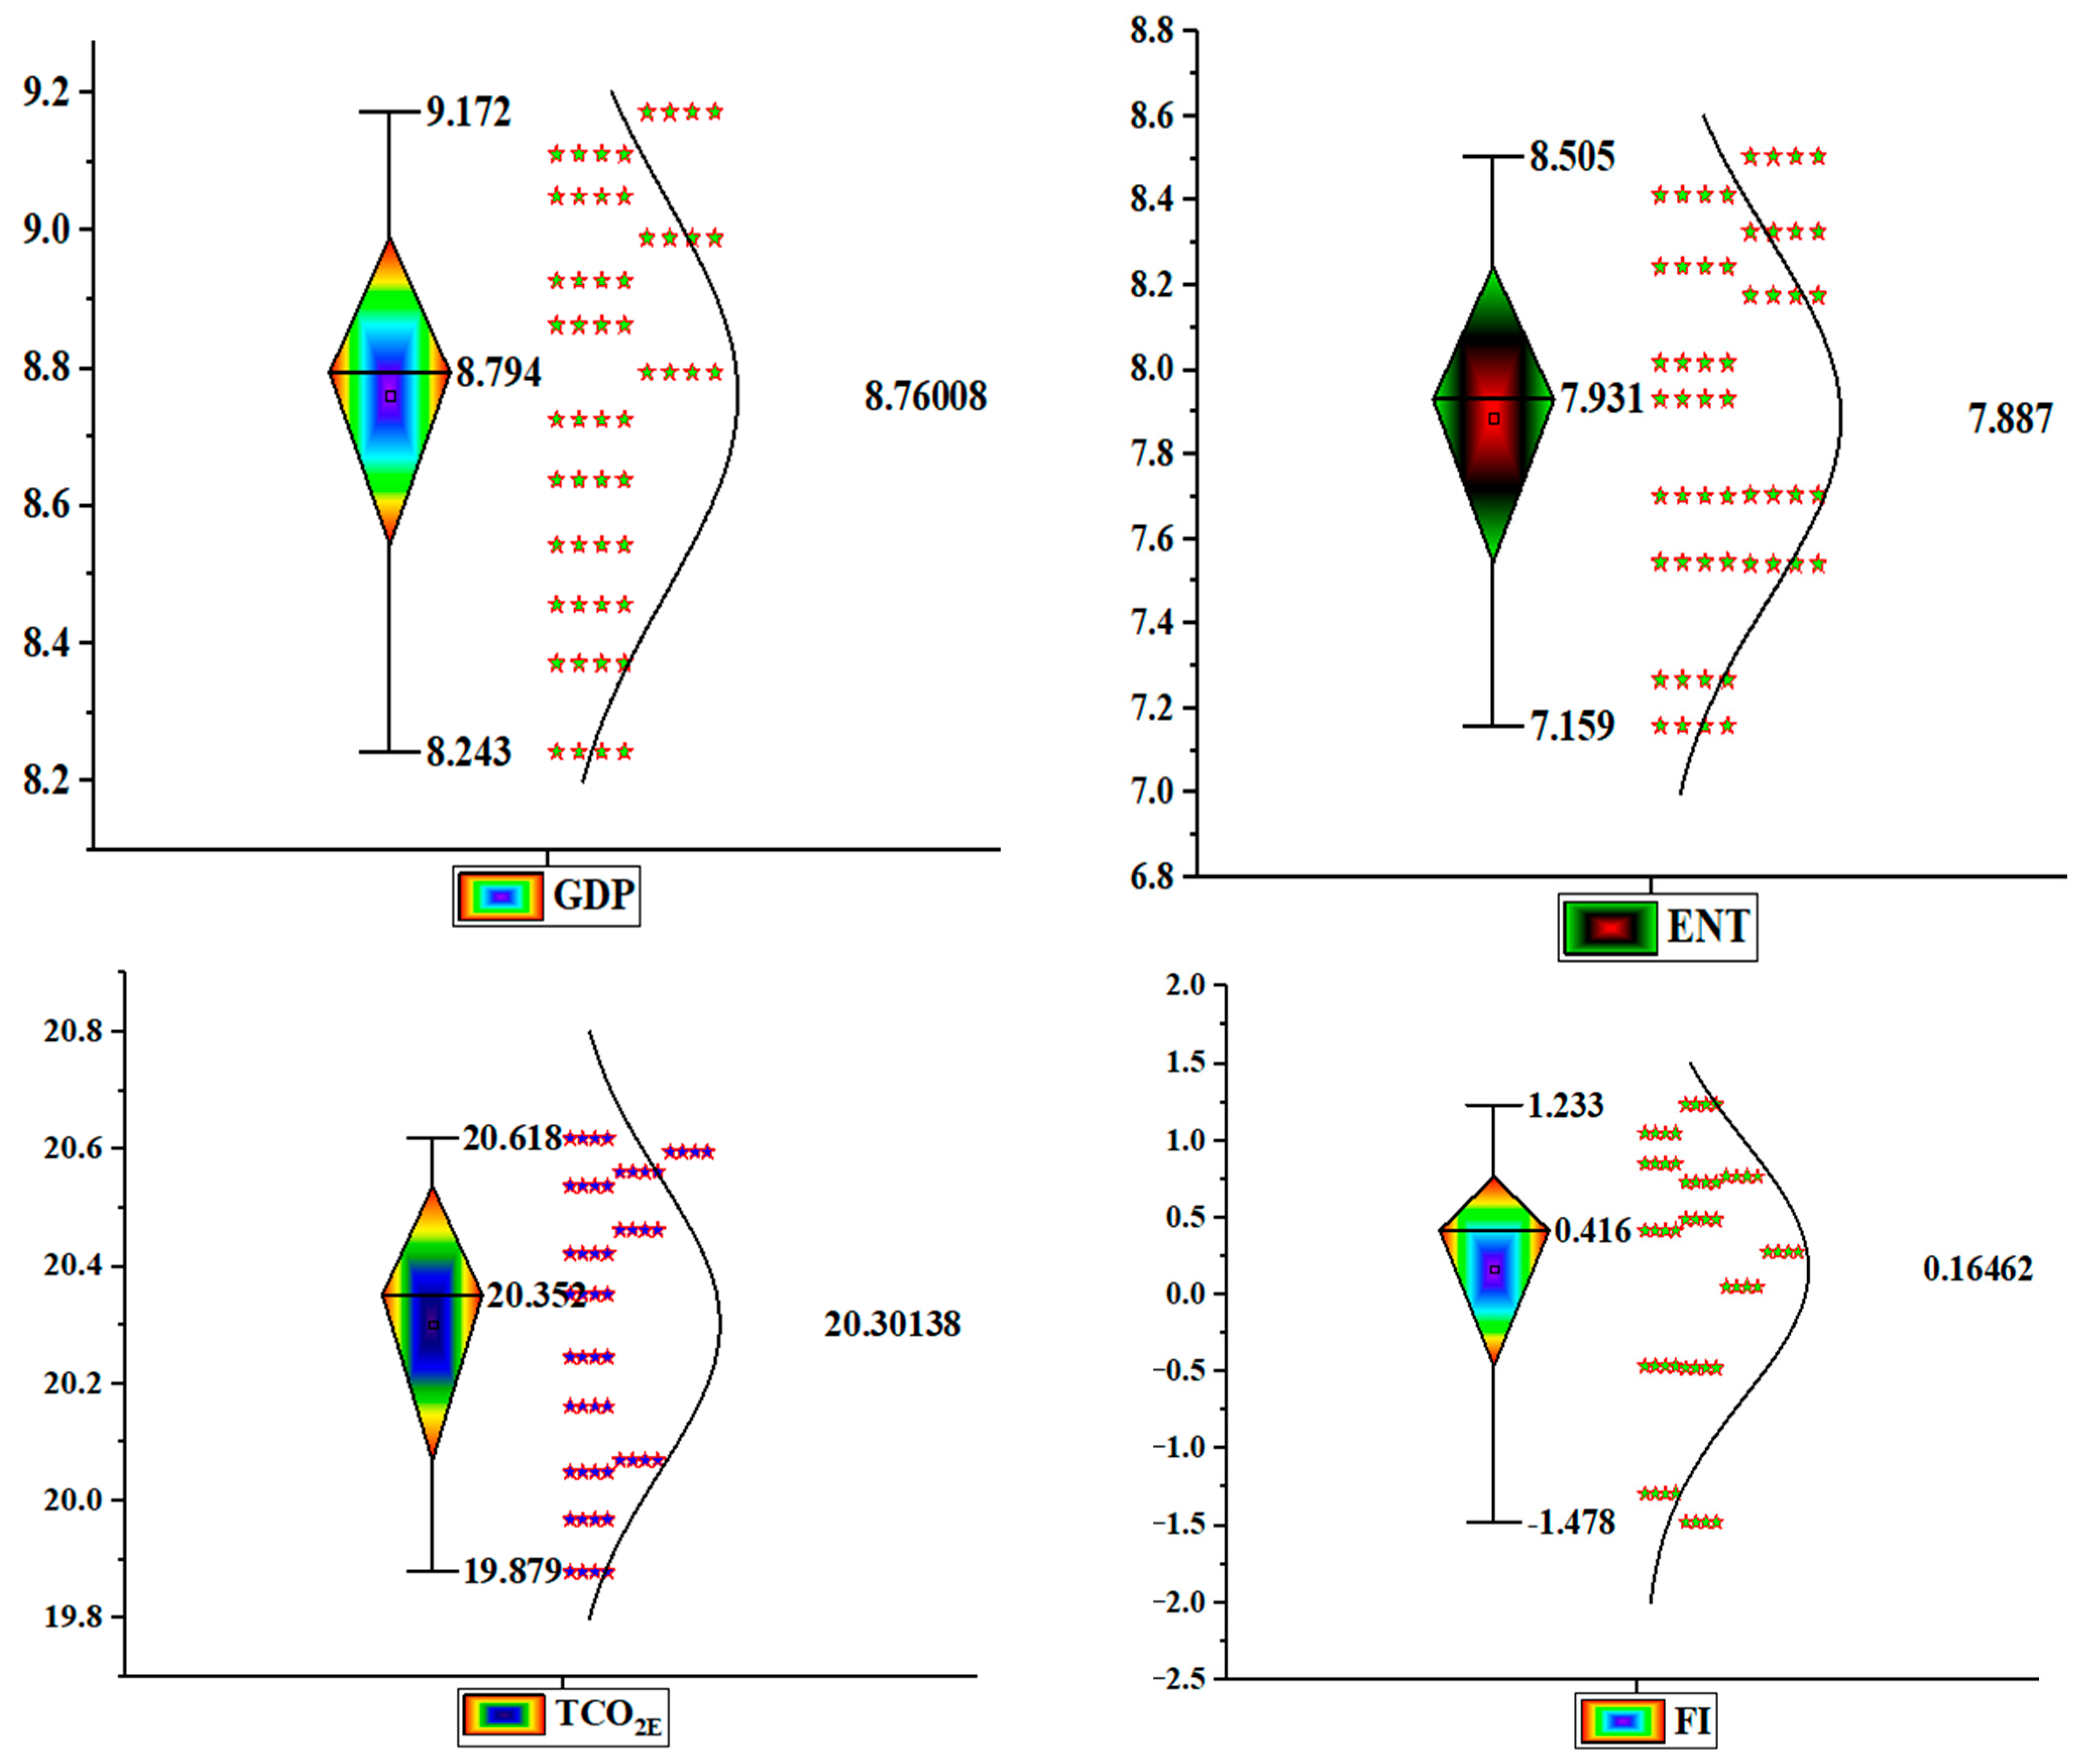
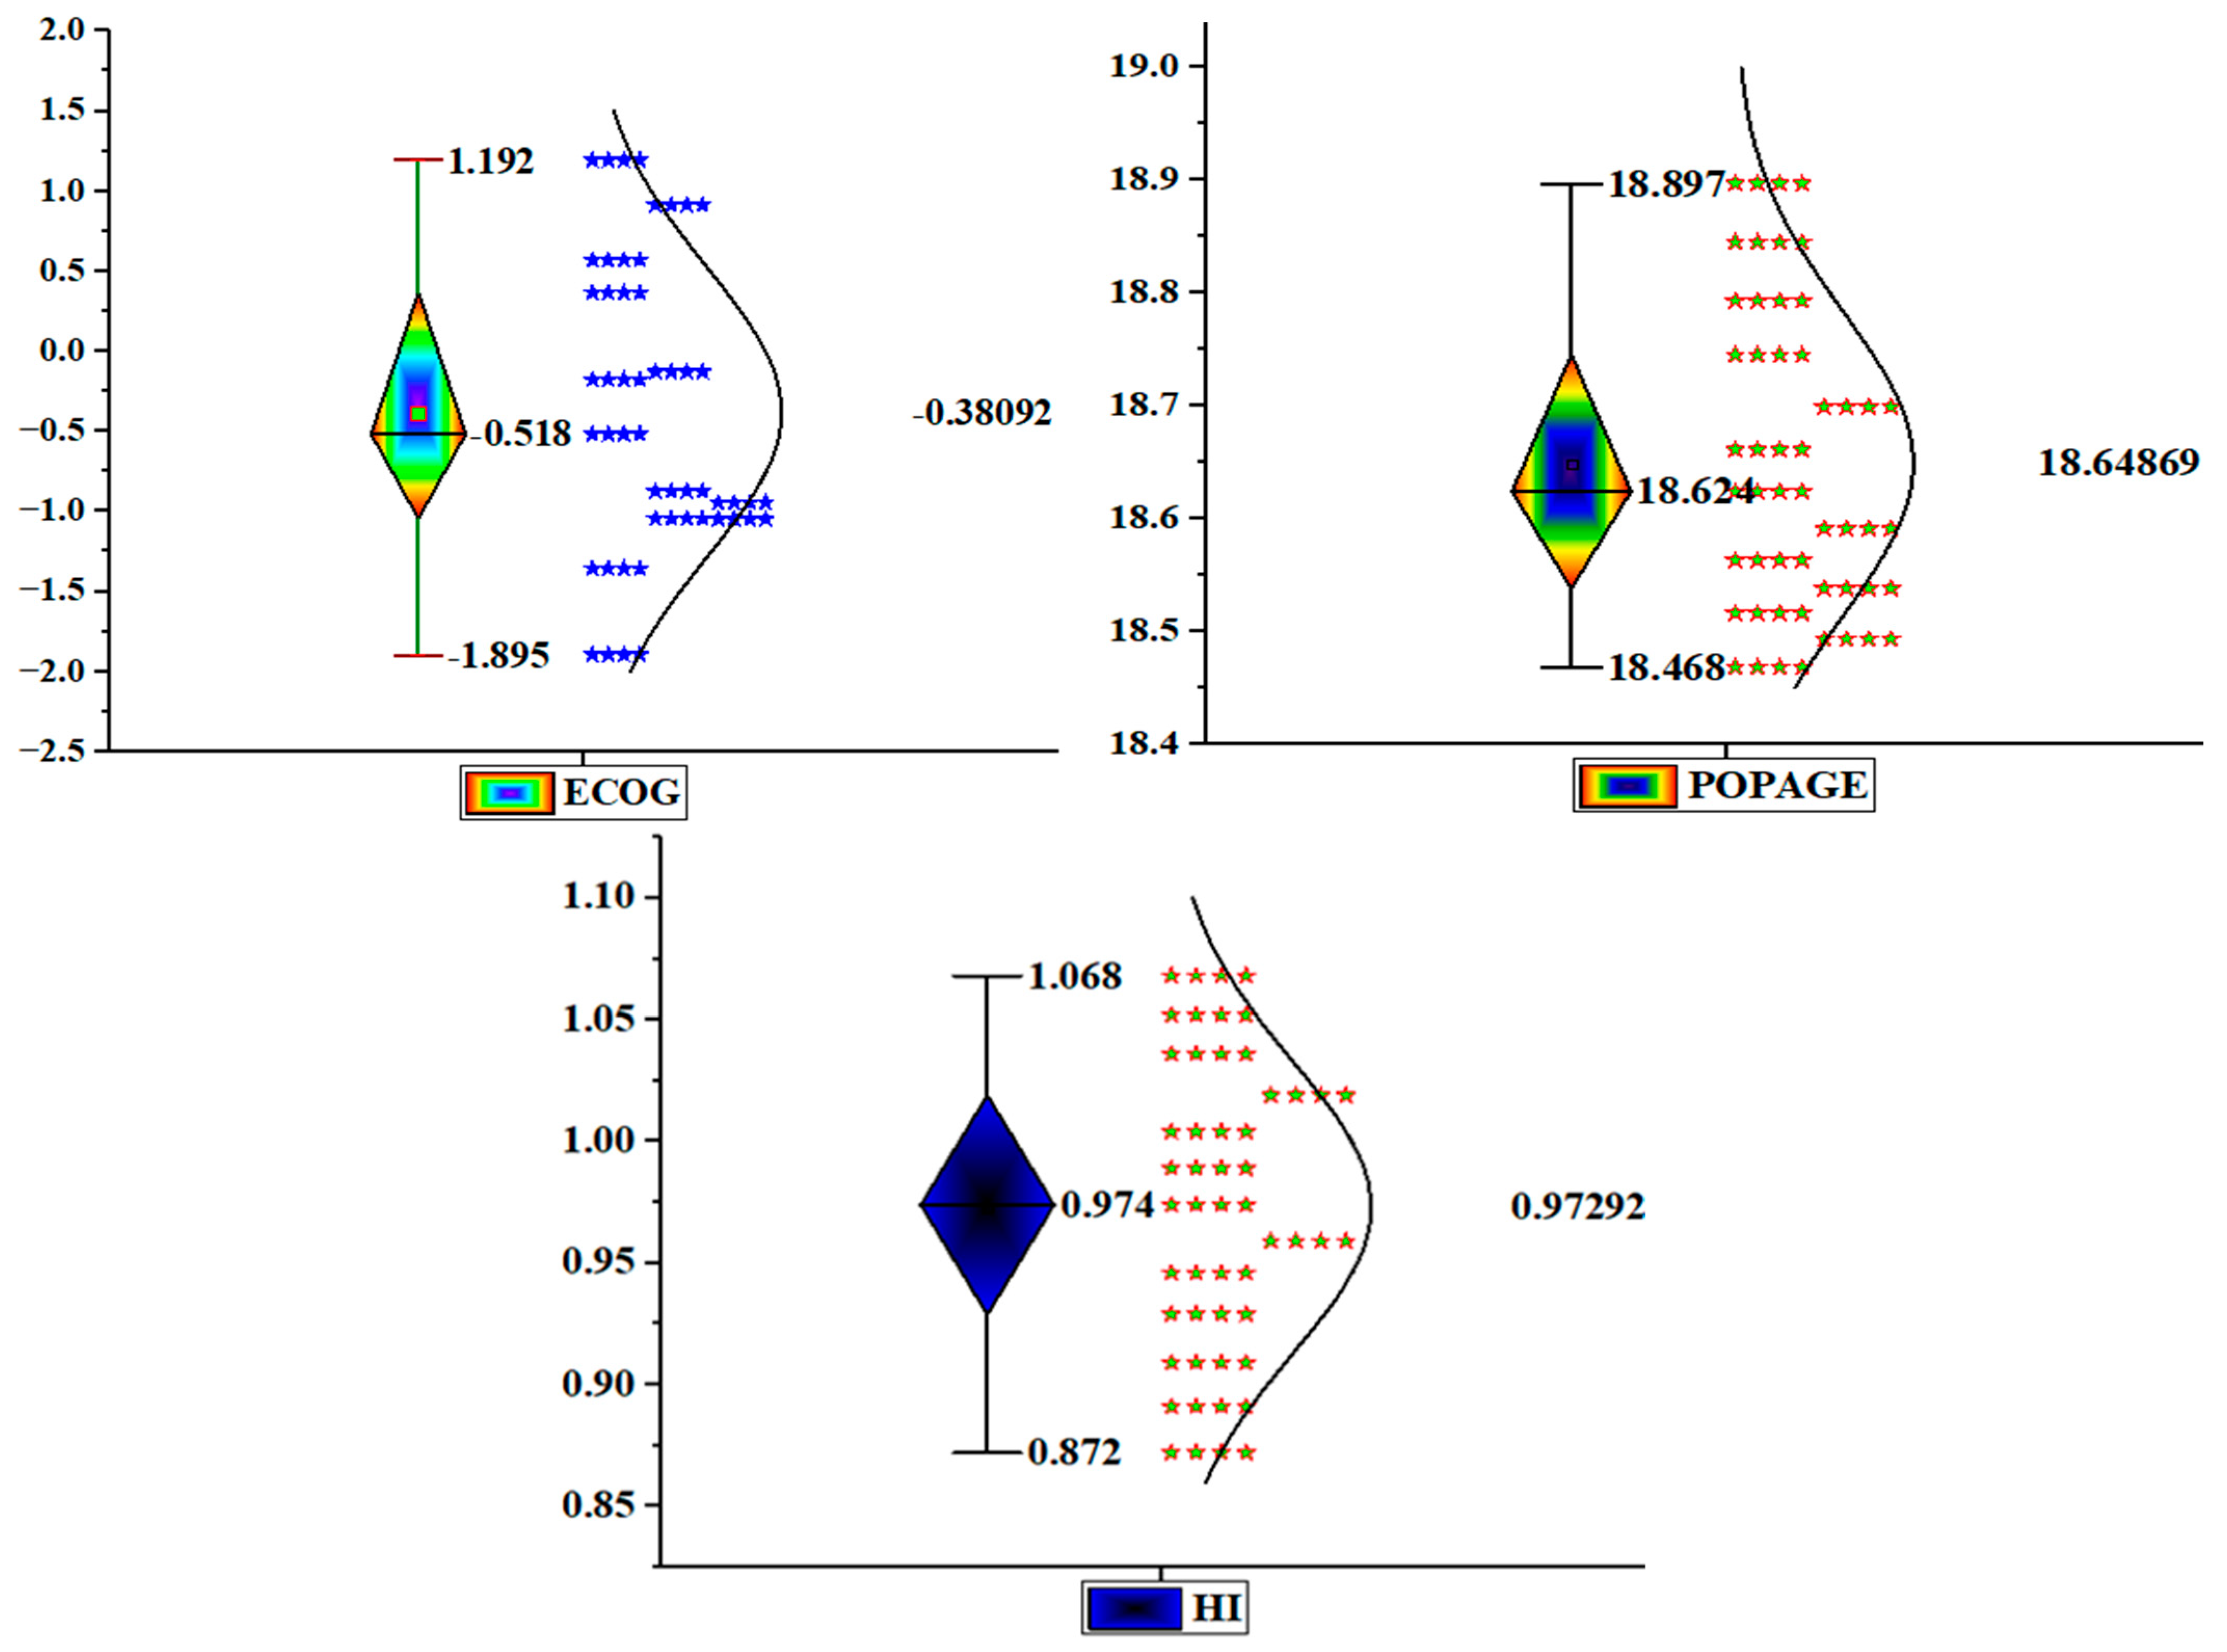
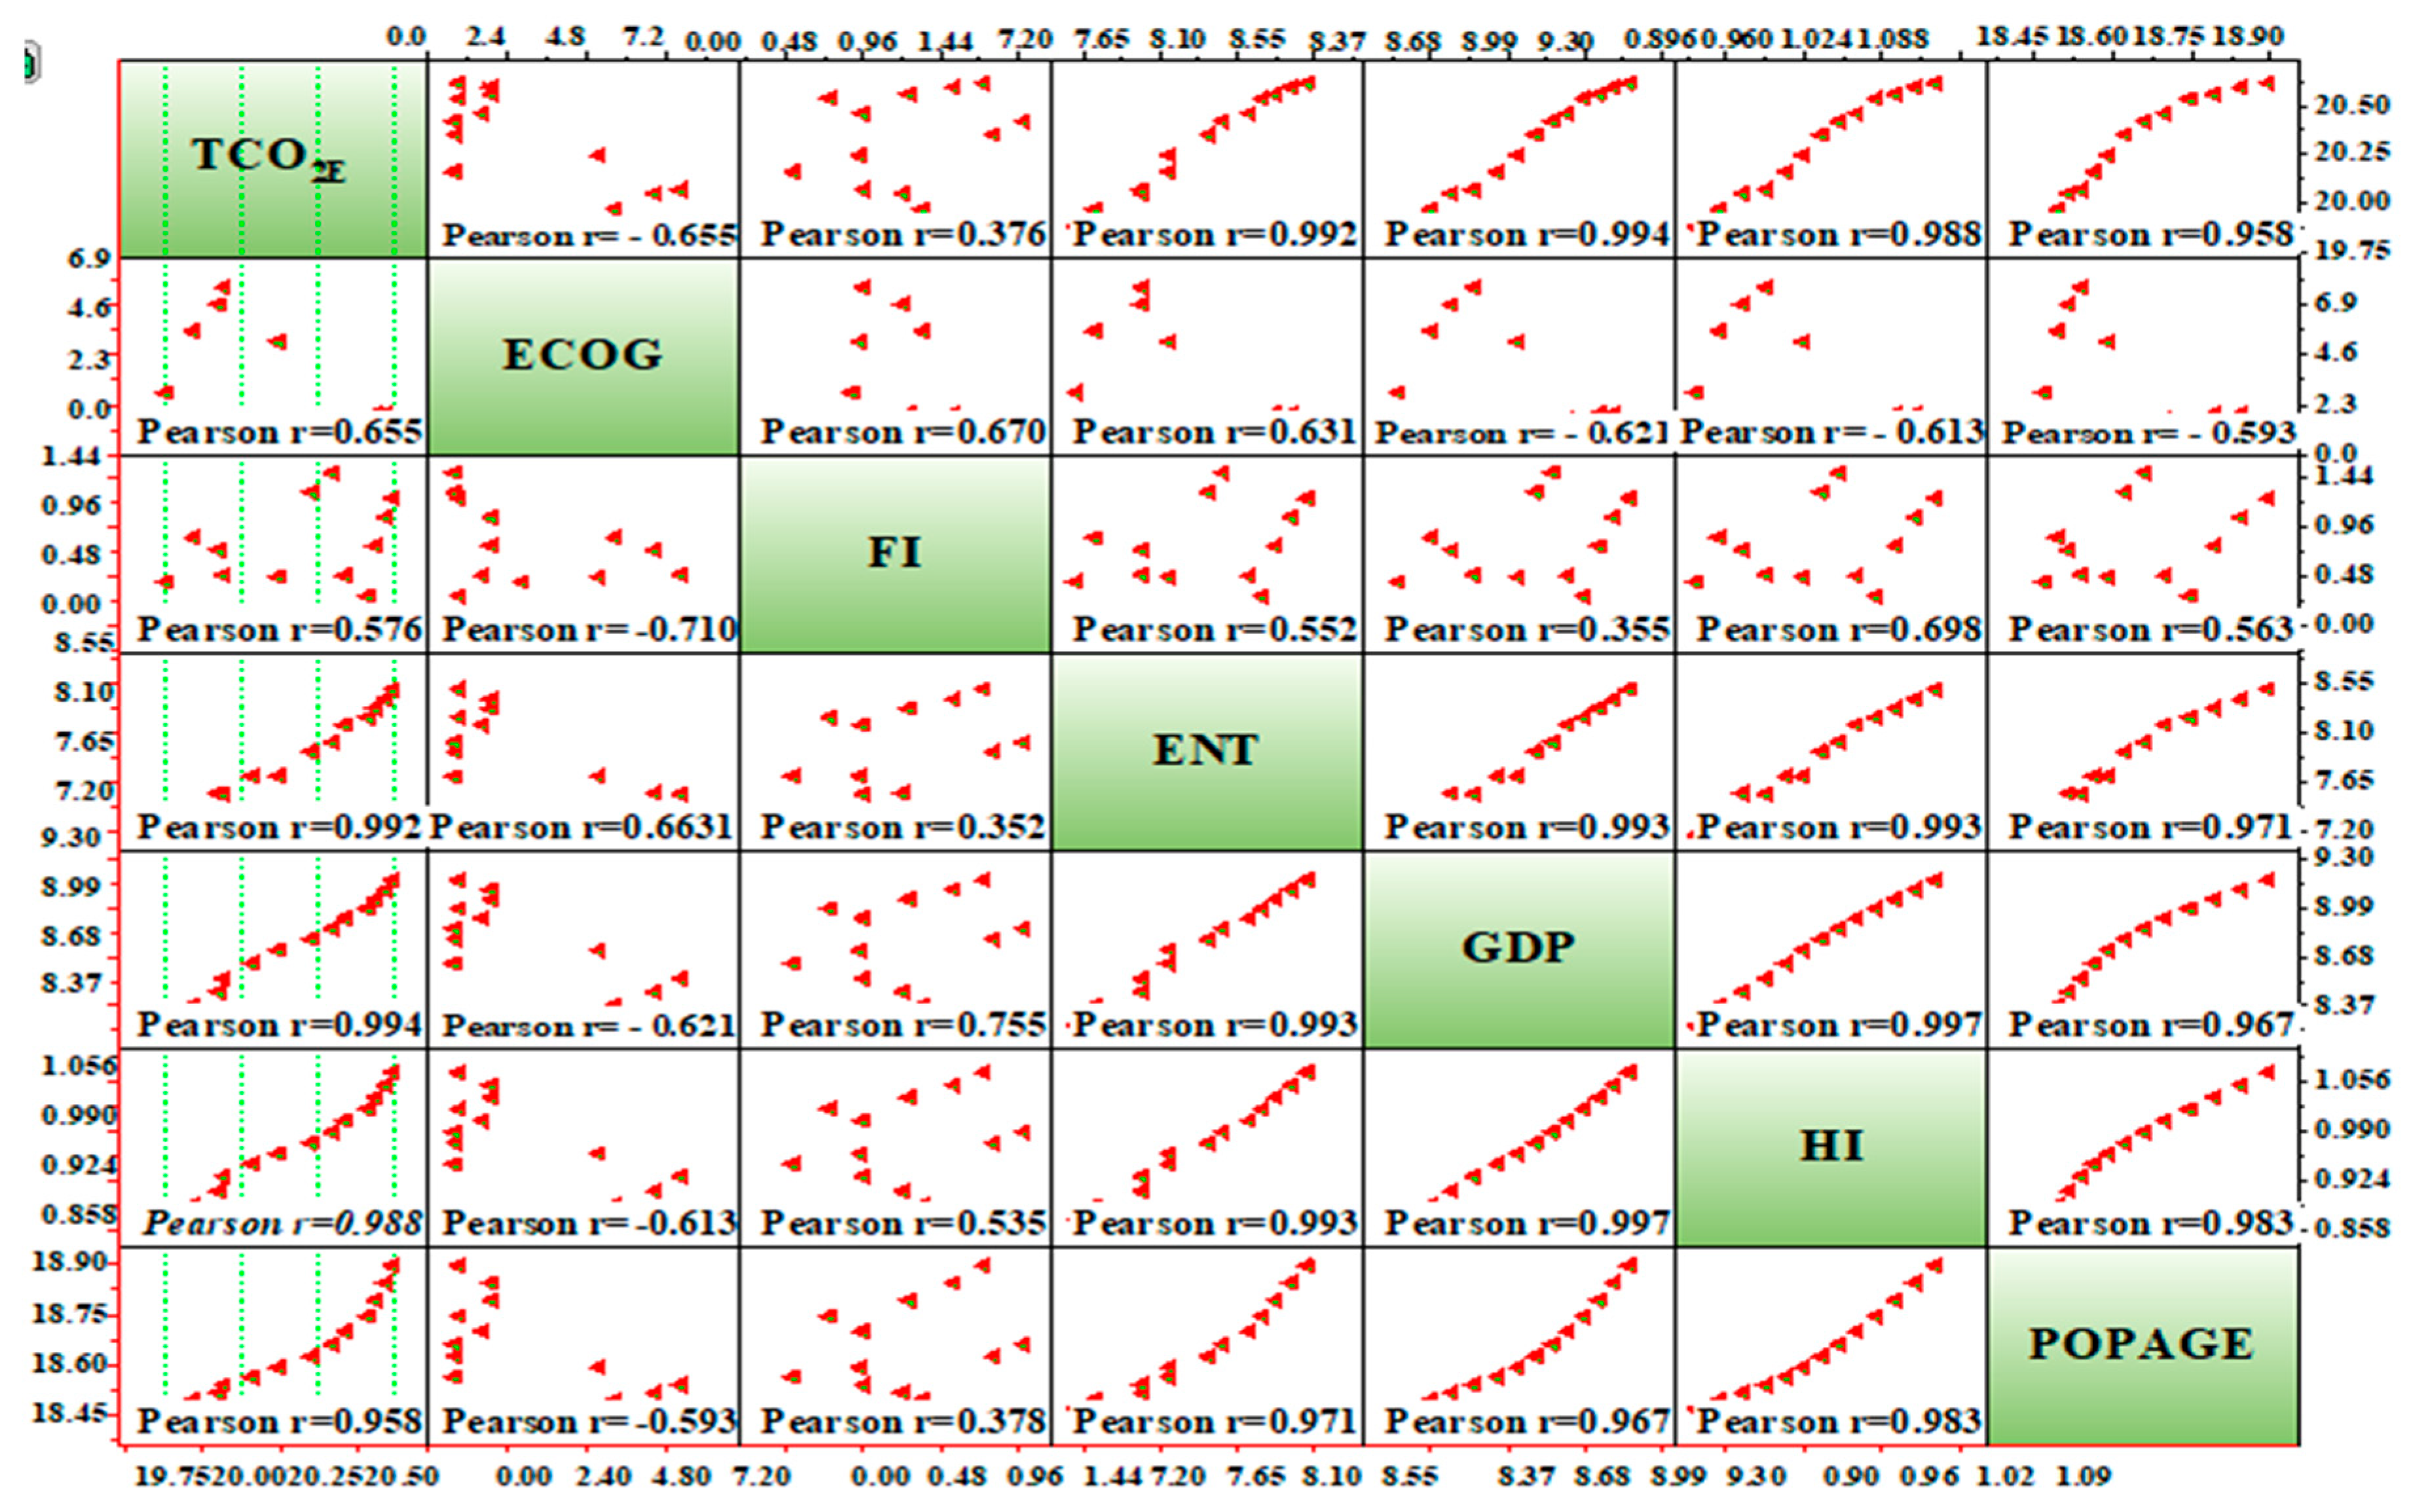
4.1. Descriptive Statistics

Table 2 depicts descriptive statistics of the research variable. All mean values have a positive except ECOG. TCO2E recorded the highest value, 20.302, ranging from 19.879 to 20.618. POPAGE has the second-highest value, 18.648, with a minimum of 18.468 and a maximum of 18.897 values, respectively. The mean value of FI is 0.165, with the highest and lowest being 1.233 to −1.478 one-to-one. The GDP mean value is 8.761, ranging from 9.172 to 8.243. The ENT mean value is 7.887, with the highest maximum value being 8.505 and the minimum value being 7.159. The HI mean value reported is 0.973, ranging from 8.505 to 7.159. The ECOG mean value is −0.381, and the maximum value is recorded as 1.192; the minimum value is reported as −1.895. The value of SD showcases how firmly data are adjacent to the mean; a lower SD indicates a higher attentiveness. This explanation makes it apparent that FI is more adjacent to its mean, followed by ECOG, POPAGE, GDP, TCO2E, HI, and ENT.
In Figure 3, the box plots reveal the statistical factors of key, main parameter, and other respective factors of interest, where 25, 50, and 75 percent are presented across all graphs. The black circle interprets the median, although the square interprets the mean values. The upper and lower lines reflect the maxi and mini values one-to-one.

4.2. Unit Root

Next, the unit root test results exhibiting the PP, ADF, and ERS (DF-GLS) tests point out that most of the parameters are non-stationary at the level but become stationary at the first difference. For the TCO2E, all tests display as stationary at the first difference but as non-stationary at the level. Correspondingly, POPAGE follows the same way, being stationary at the first difference but non-stationary at the level. For FI, both test PP and ADF express non-stationary at the level and are stationary at the first difference. Simultaneously, ERS (DF-GLS) demonstrates mixed outcomes, with significance at the level and borderline consequences at the first difference. All test results display ECOG as non-stationary at the level; however, ERS (DF-GLS) suggests that potentiality is significant at the level, while the first difference approves stationarity. For GDP, all three tests exhibit as nonstationary at the level and as stationary after the first difference. At the same time, HI is non-stationary at the level but becomes stationary at the first difference. In summary, the results of all the tests indicate that the data are stable for further analysis. The results of these tests are depicted in Table 3.

4.3. BDS Test

The BDS (Brock–Dechert–Scheinkman) test results, as presented in Table 4, offer valuable insights into the presence of nonlinear dependencies within the dataset. This test examines whether the model’s residuals follow an independent and identically distributed (i.i.d.) process, which is a key assumption in traditional econometric modeling. The results demonstrate that the null hypothesis of i.i.d. is rejected across all dimensions, as indicated by significant test statistics at different embedding dimensions. More specifically, the BDS test results reveal increasing values for all variables as the embedding dimension increases, which strongly suggests that the dataset exhibits nonlinear dependence structures. For example, in the case of TCO2E, the test statistic rises from 0.197 (at dimension 2) to 0.553 (at dimension 6), indicating that the underlying time series exhibits significant nonlinearities. Similarly, ECOG and FI show increasing values across dimensions, reinforcing the notion that these variables interact in a complex manner rather than following simple linear relationships.
This finding has crucial implications for the study as it validates the choice of advanced econometric techniques such as the MMQR approach. Traditional linear models may not adequately capture these nonlinear interactions, and ignoring them could lead to biased or incomplete conclusions. The presence of nonlinear structures in the data suggests that policy interventions should be designed with a nuanced understanding of how ECOG, FI, and POPAGE influence TCO2E at different quantiles. Therefore, the BDS test results reinforce the robustness of the chosen methodological framework and highlight the necessity of employing quantile regression techniques to account for these complex relationships. Future studies may explore nonlinear modeling approaches, such as machine-learning-based predictive models, to better capture the intricate dynamics between economic factors and environmental outcomes.

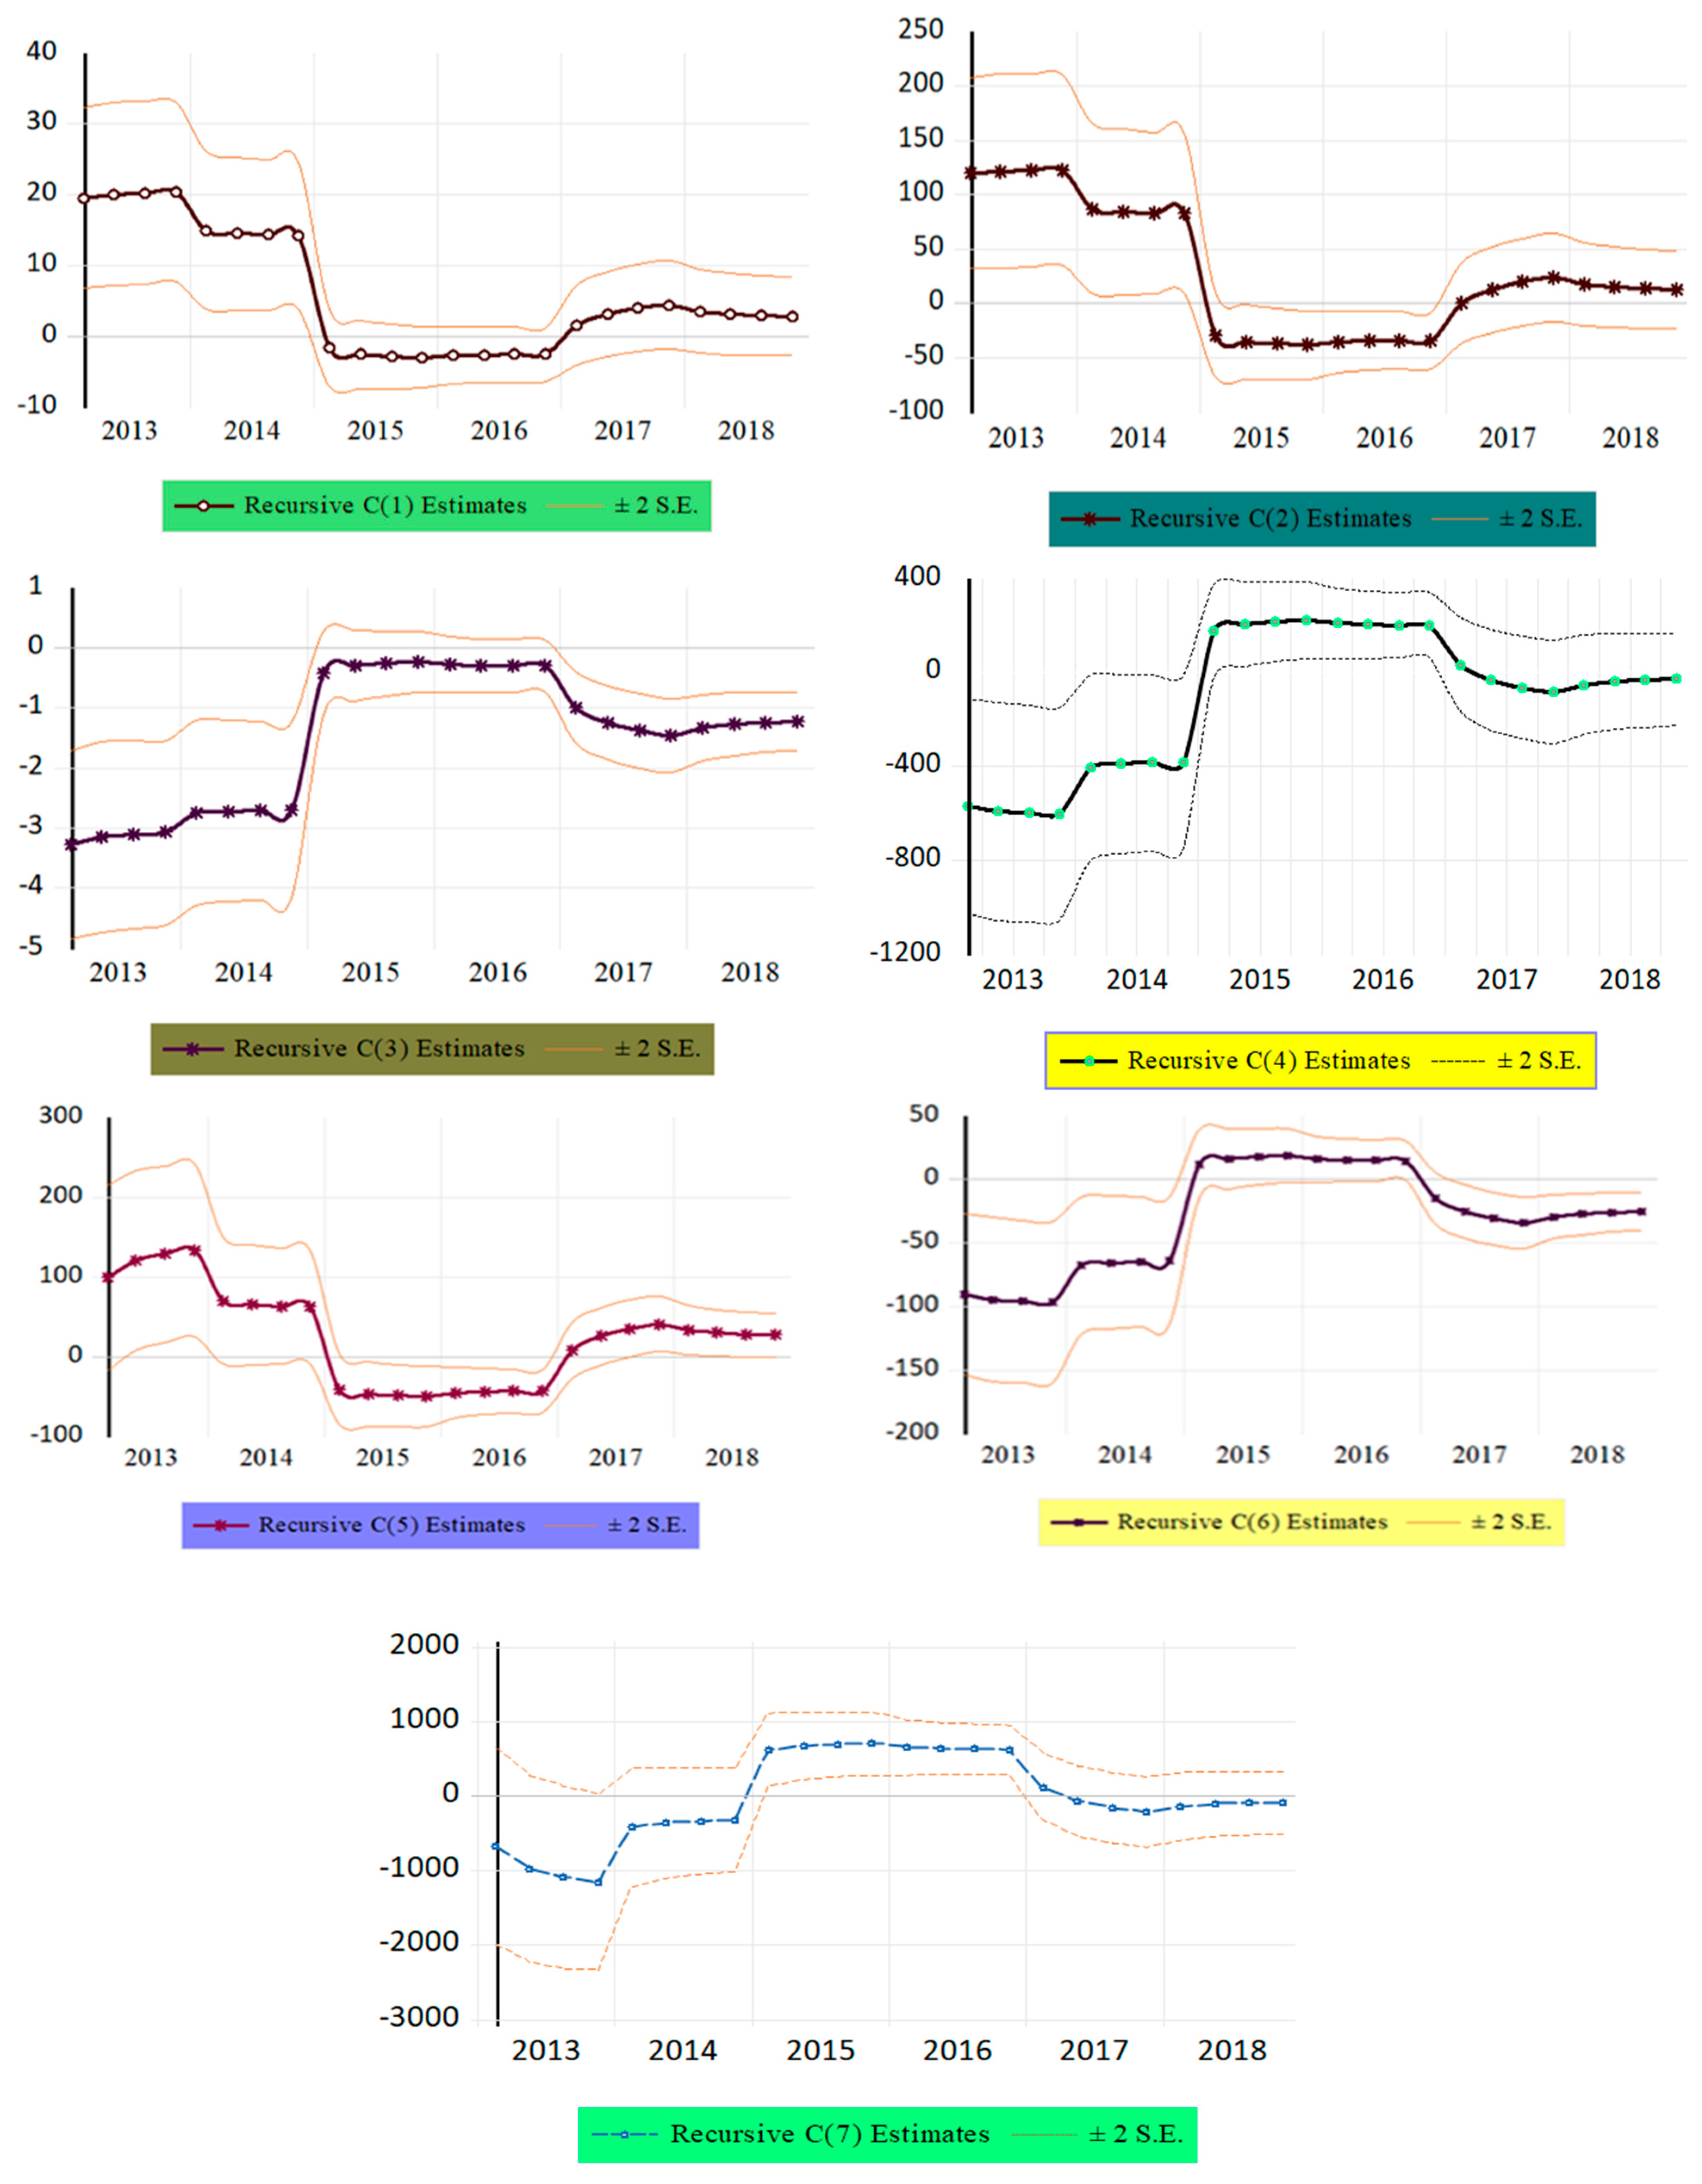
4.4. Diagnostic Test

This study appointed different diagnostic tests, such as ARCH, Breusch–Godfrey serial correlation LM, Ramsey, Jarque–Bera, and Wald tests, to confirm the model’s reliability and stability. The results of these respected approaches are depicted in Table 5. The outcome of the ARCH is χ2-statistic 1.814 with a p-value of 0.116, which indicates no significant autoregression conditional heteroskedasticity upshot in the residuals. LM outcome is χ2-statistic 1.494 with a p-value of 0.184. This shows that there is no significant proof of serial correlation in the residuals, which implies that the model is statically correct in terms of serial correlation.
The result of the Ramsey Reset test is 2.206 with a p-value of 0.145. This displays no important evidence of model misspecification, implying that the original regression model is correctly specified. The Jarque–Bera outcome is 3.042, with a value of 0.218. This demonstrates that there is no substantial evidence against the hypothesis of normality in the residuals, showing that the model’s errors are likely normally distributed. Lastly, the outcome of the Wald test is 3540.346 with a p-value of 0.000. This implies strong testimony against the null hypothesis, implying that the variables tested are intensely significant and contribute meaningfully to the model. Figure 4 presents the correlation between the study variables, and Figure 5 exhibits the data stability.

4.5. Johansen Cointegration Test
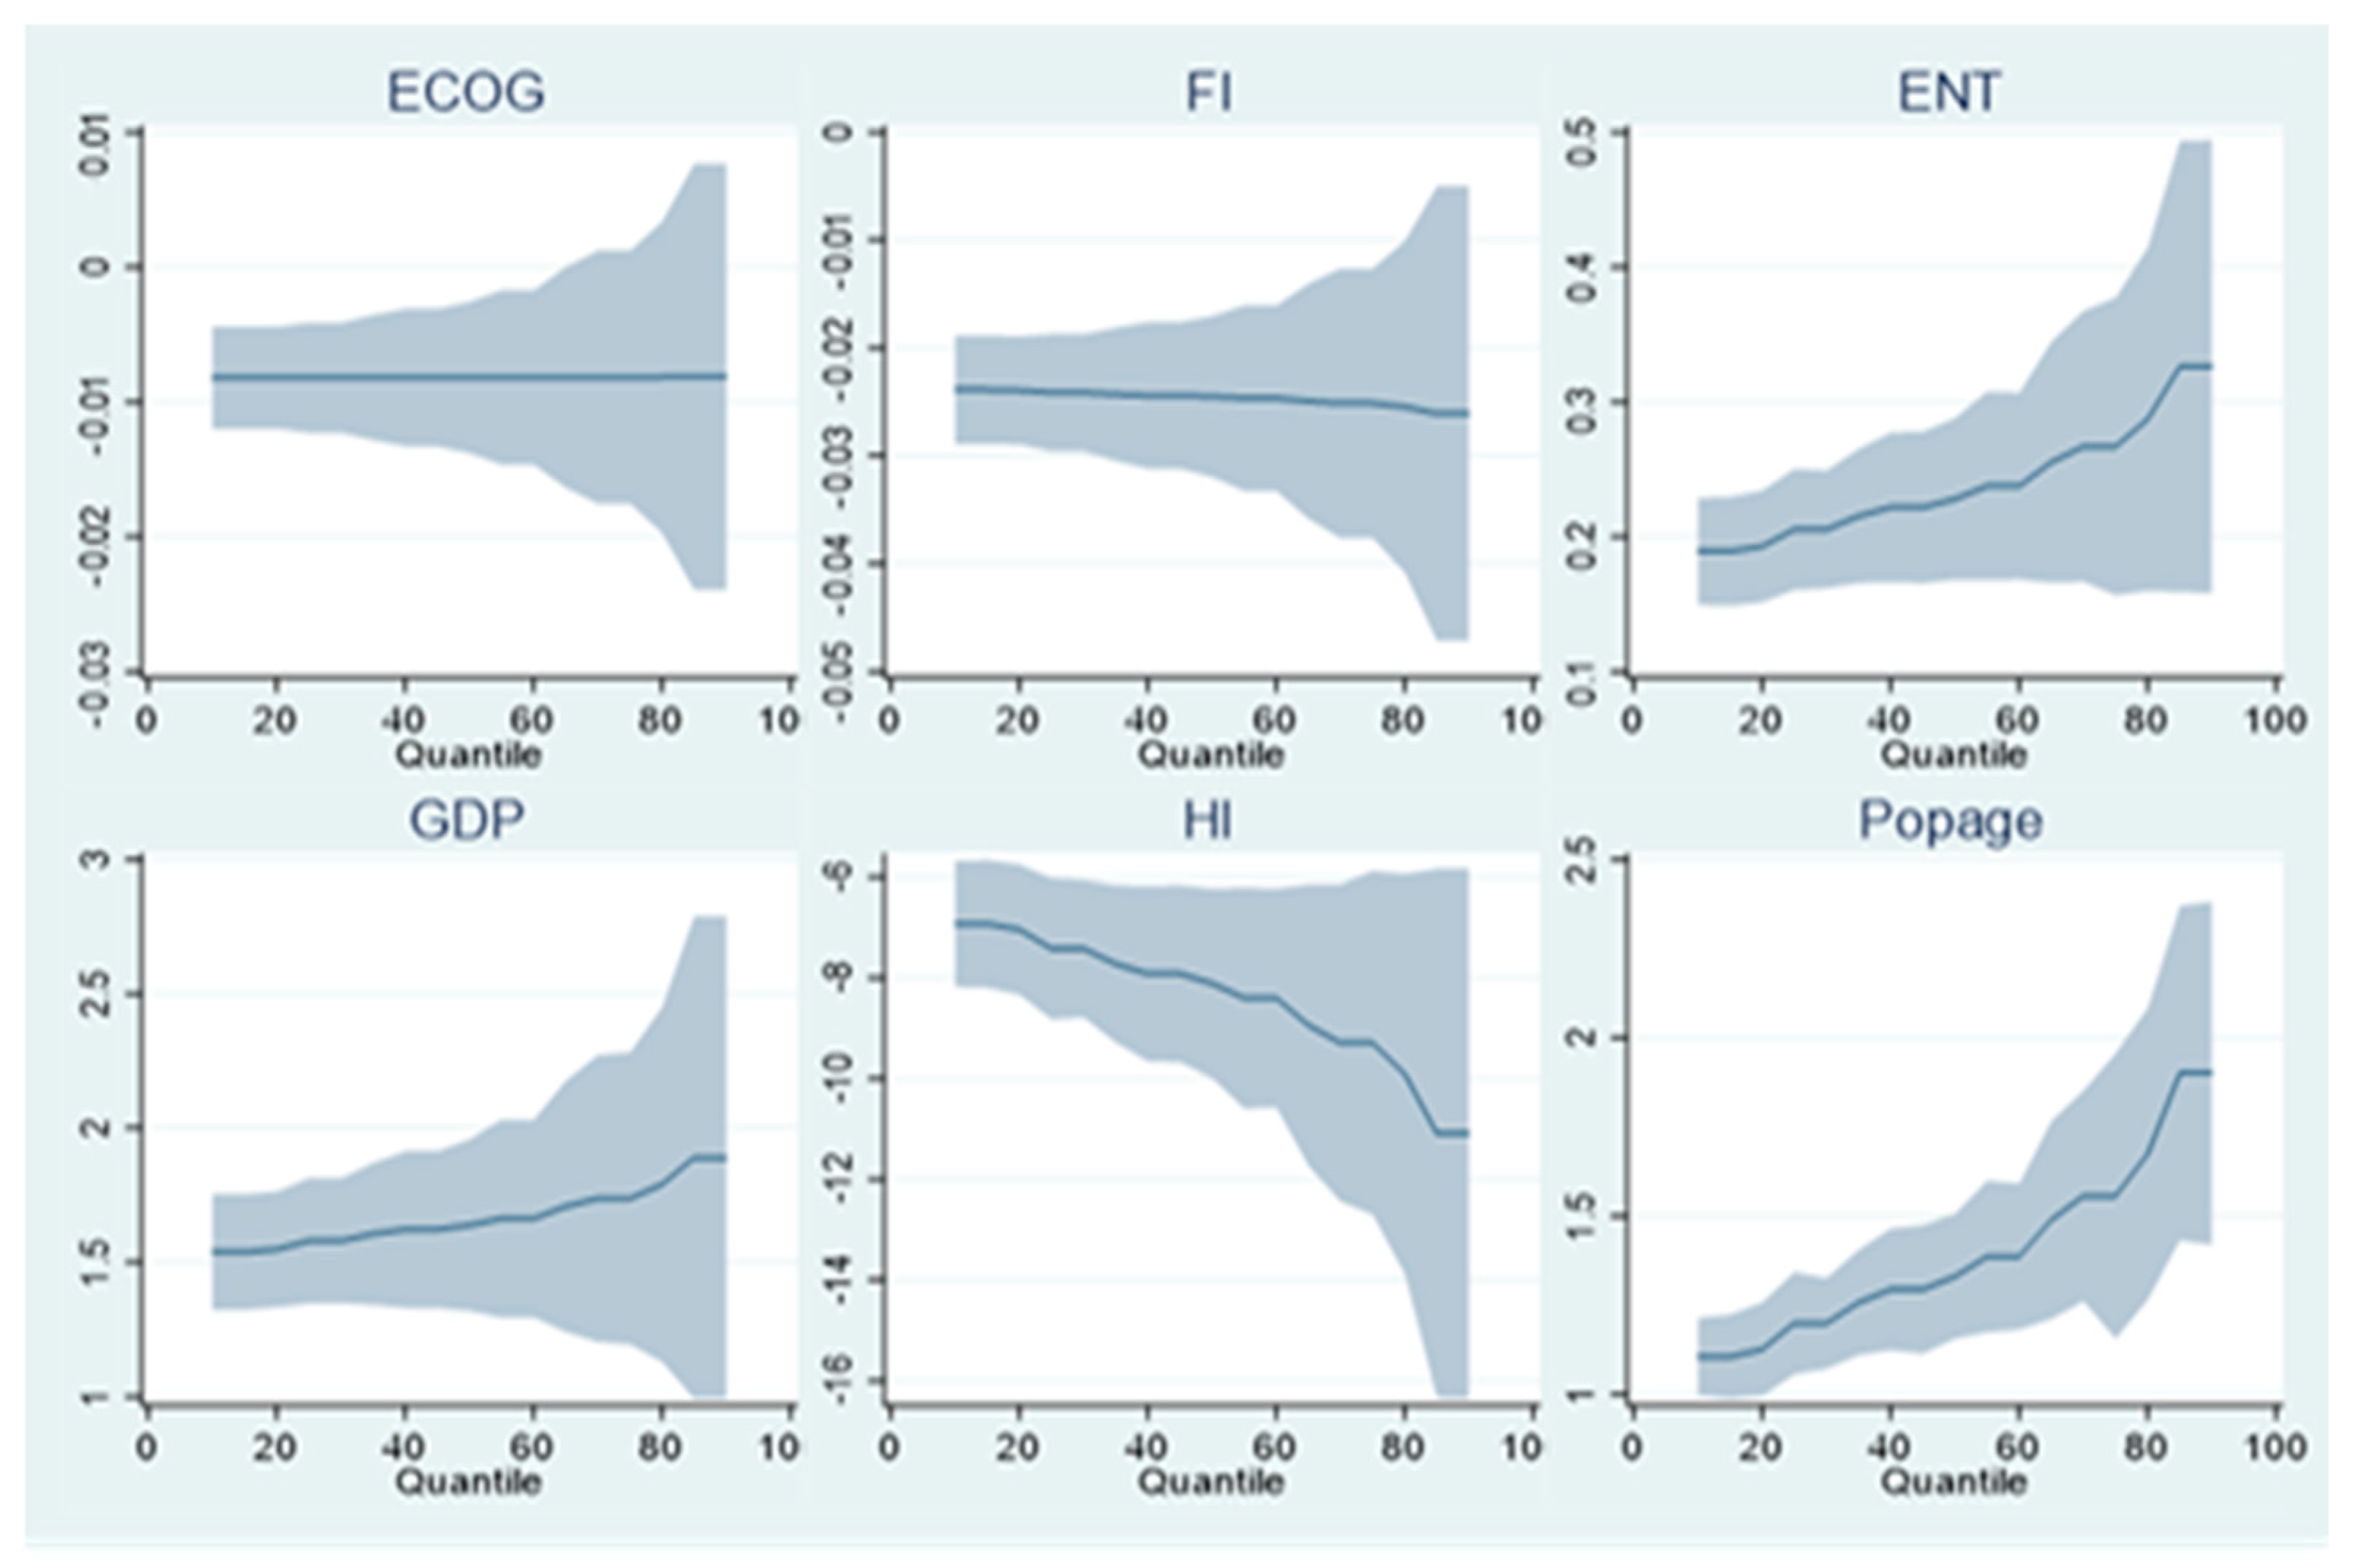
The Johansen cointegration approach was applied to confirm the presence of an equilibrium relationship among the study variables [55,56]. The technique’s results are depicted in Table 6. The Johansen approach is divided into two groups: trace (JTrace) and max-eigenvalue (JMax). The trace results demonstrated that, at most 1, the trace statistic is 175.739, and the critical value is 117.708 with a value of 0.000, indicating a substantial cointegration association.
Moreover, at most 2, the trace statistic is 112.388, with a critical value of 88.804, with a p-value of 0.000. At most 3, the trace statistic is 72.222, a critical value of 63.876, with a p-value of 0.000 confirming the presence of cointegration between the variables. The maximum eigenvalue test points out a significant correlation as well, with a max-eigenvalue statistic of 63.352, which surpasses the critical value of 44.493 with a p-value of 0.000, confirming the existence of a co-integration association. In addition, the max-eigen statistic is 40.166, critical value is 38.331, p-value is 0.031, and max-eigen statistic value is 32.383 (the critical value is 32.118, with a p-value of 0.046), both indicating a significant connection. Overall, the estimation supports the conclusion that substantial co-integration associations exist among the parameters.

4.6. Main Results

The findings of this study provide critical insights into the socio-economic determinants of transport-based CO2 emissions in China. By employing the MMQR, this study captures the heterogeneous effects of ECOG, FI, POPAGE, ENT, GDP, and HI on transport emissions reduction. Unlike traditional mean-based estimations, the quantile approach highlights how these factors influence emissions differently across varying levels of CO2 intensity. Table 7 presents a summary of the findings and policy recommendations. The main results are showcased in Table 8. However, Figure 6 expresses the trend of the variables, and Figure 7 interprets the MMQR approach’s results, which provides a clear, structured view of how each socio-economic factor influences CO2 emissions and what measures can be taken to address them effectively.
The results indicate that stronger ECOG significantly reduces CO2 emissions, particularly in the higher quantiles, emphasizing the importance of policy enforcement and regulatory efficiency in the transport sector. Governments should strengthen environmental regulations, enforce carbon taxes, and invest in sustainable public transport infrastructure to enhance emission reductions. The results of the study are aligned with these authors’ research [8,14,17]. In contrast, financial innovation is found to increase transport emissions, especially in higher quantiles, suggesting that unregulated financial expansion can lead to investments in carbon-intensive transport infrastructure. To counter this, policymakers must promote green finance instruments, such as green bonds, carbon pricing, and sustainable investment funds, to ensure that financial activities align with carbon neutrality objectives. The results of the study are aligned with these authors’ research [10,11,21].
Similarly, POPAGE contributes to higher emissions, particularly at lower and higher quantiles, likely due to increased private vehicle usage and healthcare-related travel. To mitigate this, urban planning should incorporate senior-friendly public transport systems, electric mobility options, and low-carbon healthcare transportation solutions. The results of this research align with these research articles [41,58,59]. On the other hand, energy transition plays a vital role in reducing CO2 emissions, with significant reductions observed across all quantiles. A greater reliance on renewable energy sources and electric transportation can further strengthen this impact. Governments should, therefore, increase investments in renewable energy, offer subsidies for electric vehicle adoption, and encourage the development of energy-efficient transport systems. The present study results are the same as those of these scholars [60,61,62].
Higher GDP levels correlate with increased emissions, indicating that economic expansion leads to a rise in transportation-related energy consumption. While economic growth is essential, sustainable economic policies should be implemented to ensure that industrial expansion does not come at the expense of environmental degradation. Encouraging investments in low-carbon transportation and promoting fuel-efficient technologies can help balance economic progress with environmental sustainability. The present study results are the same as those of these scholars [21,63,64,65]. The study also finds that higher human capital levels reduce emissions significantly, demonstrating the role of education, workforce skills, and technological advancements in driving sustainability. Governments should prioritize investments in environmental education, research in clean energy, and workforce training in green technologies to accelerate the transition toward a low-carbon economy. The results of this research align with these respected authors [12,63,66].

4.7. Discussion

This study provides a comprehensive assessment of the socio-economic and governance factors influencing TCO2E in China. Using the MMQR, we examined the heterogeneous effects of ECOG, FI, POPAGE, ENT, GDP, and HI on transport-sector emissions. The findings contribute to the ongoing discourse on environmental sustainability by demonstrating how these factors interact with emissions at different quantile levels. The results indicate that strong ECOG plays a significant role in reducing CO2 emissions, particularly in the upper quantiles. This highlights the importance of regulatory enforcement, institutional quality, and government-led sustainability initiatives in curbing TCO2E. Countries with well-structured governance frameworks are better equipped to implement stringent emission controls, promote sustainable public transportation, and regulate fuel efficiency standards. This finding aligns with prior studies emphasizing the role of governance in environmental sustainability [67,68]. However, conflicting evidence in some research suggests that governance alone is insufficient unless complemented by financial incentives and technological advancements [69,70].
In contrast, FI was found to increase CO2 emissions, particularly in higher quantiles. This suggests that unregulated financial expansion may lead to investments in carbon-intensive transport infrastructure, increased vehicle ownership, and greater fuel consumption. While financial innovation has the potential to drive technological progress, its environmental benefits depend on whether funds are directed toward sustainable projects. Our study result aligns with the prior study that supports the nation that robust foundations and financial innovation frameworks are vital in sustaining environmental devastation [3,11,71]. The outcomes of the study are not interlinked with these authors’ articles [72,73]. Policymakers must ensure that financial mechanisms such as green bonds, carbon pricing, and clean energy financing are effectively utilized to mitigate the negative environmental consequences of financial expansion.
The study also reveals that POPAGE significantly contributes to higher CO2 emissions, with its effects more pronounced in the higher quantiles. An aging population demands greater mobility, healthcare transportation, and personalized vehicle usage, all of which contribute to increased transport-sector emissions. If not addressed, this demographic shift could exacerbate environmental challenges. Urban planning strategies must, therefore, prioritize low-carbon transportation solutions, improved public transit accessibility, and incentives for eco-friendly mobility options to mitigate the emissions impact of an aging society. This study analysis indicated that the results of this variable are identical to those of this study [74,75,76].
On the other hand, ENT was found to reduce emissions significantly, reaffirming the importance of shifting from fossil fuels to renewable energy sources such as solar, wind, and hydroelectric power. Countries investing in green energy infrastructure, electric vehicle (EV) adoption, and energy-efficient transportation systems are more likely to experience long-term declines in transport-related emissions. The findings underscore the urgency of accelerating clean energy adoption, expanding EV charging networks, and phasing out fuel subsidies to achieve sustainability goals. This study analysis demonstrated that the results of this variable are the same as this [77,78,79,80,81].
GDP was found to have a positive correlation with CO2 emissions, indicating that rapid economic expansion increases energy demand and intensifies transport-sector emissions. While economic development is essential, its environmental costs must be managed through sustainable industrial policies, investments in green transportation, and fuel efficiency improvements. The results highlight the need for policies that balance economic growth with environmental conservation to prevent further ecological degradation. The analysis result of our study confirmed that the variable GDP is in line with the previous research by [81,82,83].
In conclusion, the study confirms that HI has a significant negative effect on CO2 emissions, suggesting that higher levels of education, research, and workforce skill development contribute to sustainability efforts. A well-educated workforce is more likely to embrace eco-friendly technologies, adopt energy-efficient practices, and innovate in clean energy solutions. This finding supports the argument that investments in environmental education, technological research, and workforce training are essential to achieving carbon neutrality in the transport sector. This study analysis confirmed that the results of this variable are the same as those of this study [84,85,86].

4.8. Robustness Results (BSQR)

The study has applied the Bootstrap quantile regression (BSQR) method to ensure robustness. The outcomes are finite in Table 9.

4.9. Granger Causality

The outcome of the pairwise Granger causality is finite in Table 10. The outcome of the study demonstrates that the ECOG granger causes TCO2E, but, in return, TCO2E does not granger cause ECOG. Our result investigates the unidirectional co-movement between the POPAGE and TCO2E. The estimation denotes that POPAGE influences TCO2E. At the same time, we did not find any association between FI and TCO2E. However, with the same method, we examined that the TCO2E granger causes ENT; however, ENT does not granger cause TCO2E.
At the time, we investigated the uni-directional relationship between the TCO2E and GDP but did not discover the association between the GDP and TCO2E. The POPAGE does not cause ECOG, but the ECOG granger causes POPAGE, which means that economic governance can overcome all the problems if it is effective. The study analysis sorts the uni-directional between the ECOG and FI. We do not determine the granger cause between ENT, ECOG, and ENT. However, we evaluate that ECOG is a cause of GDP. Lastly, we express that the study parameter has no bi-directional relationship. However, some parameters have uni-directional relations with each other.

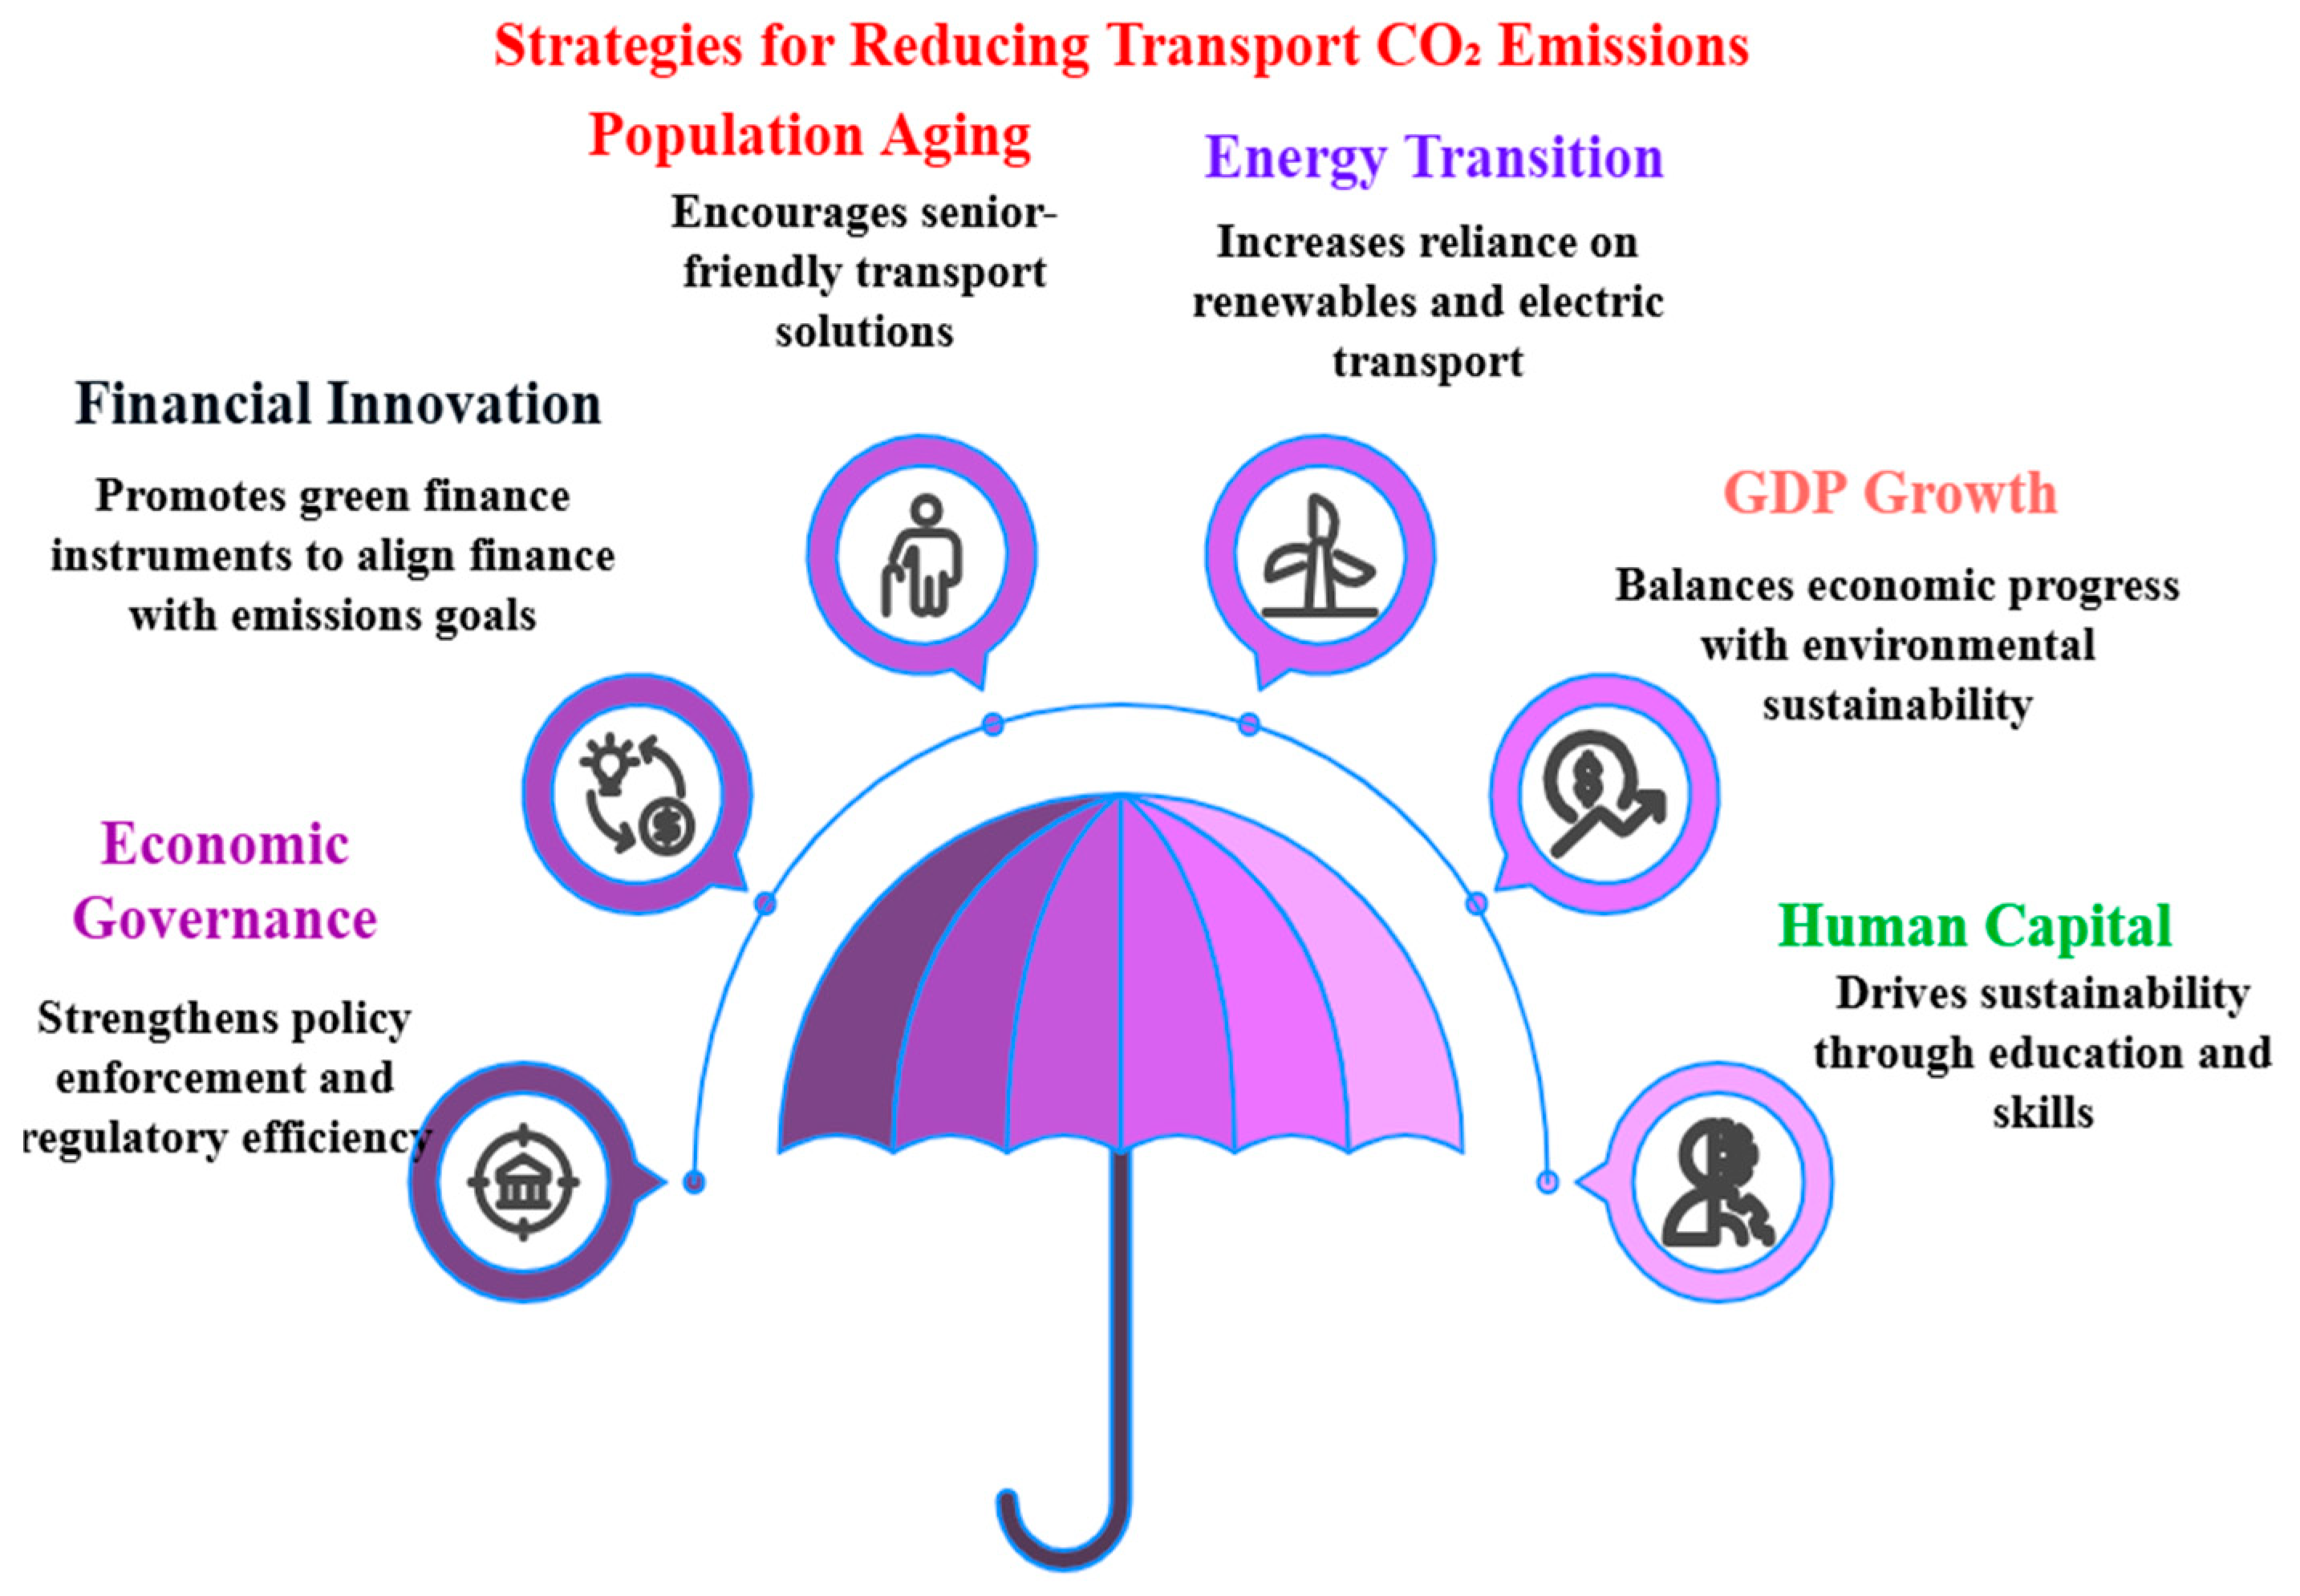
5. Conclusions and Policy Implication

5.1. Conclusions

The study provides empirical evidence on the impact of ECOG, FI, POPAGE, ENT, GDP, and HI on transport-related CO2 emissions in China. Using the MMQR approach, the results demonstrate that ECOG and ENT significantly reduce CO2 emissions, while FI, POPAGE, and GDP contribute to increased emissions. HI is also found to play a crucial role in mitigating emissions by promoting green technological advancements and sustainability awareness. The findings emphasize that strong institutional frameworks, green financial mechanisms, and clean energy investments are essential to controlling TCO2E. The positive impact of the ENT suggests that shifting from fossil fuels to renewable energy sources can significantly curb emissions, making it an urgent priority for policymakers.
Similarly, the negative association between FI and environmental sustainability highlights the need for regulating financial markets to prioritize eco-friendly investments rather than carbon-intensive projects. The study also highlights the complex relationship between demographic changes and environmental sustainability. As China’s population ages, transport-related emissions are likely to rise unless effective policies are implemented to support public transportation, energy-efficient mobility, and urban sustainability programs. Meanwhile, economic growth remains a double-edged sword as it fosters industrial expansion while simultaneously increasing energy consumption and emissions. Therefore, achieving a balance between economic development and ecological sustainability is crucial to long-term environmental resilience.

5.2. Theoretical Implication

The study contributes to the theoretical understanding of the relationship between ECOG and environmental outcomes, particularly in the transport sector. By using advanced econometric techniques, this research extends previous work by showing how governance, FI, and demographic shifts affect emissions differently across various quantiles. The findings reinforce the role of institutional quality in reducing environmental degradation, supporting theories that emphasize the importance of robust governance frameworks in achieving sustainability goals. Moreover, the study addresses a gap in the literature regarding the dual role of financial innovation, which can either exacerbate or mitigate emissions depending on the context. This theoretical contribution broadens the scope of current discussions on financial development and environmental sustainability.

5.3. Managerial Implications

From a practical perspective, this study highlights several managerial and policy-related insights. Policymakers should prioritize the development of governance frameworks that encourage investments in green transportation technologies and align financial innovation with sustainability goals. The results suggest that economic governance plays a pivotal role in reducing emissions, implying that more effective regulation and investment in public transport infrastructure could significantly decrease transport-related CO2 emissions. Additionally, policies that cater to the mobility needs of an aging population while encouraging the use of energy-efficient transport options will be crucial in mitigating emissions in the long term. Financial innovation should be carefully directed toward sustainable projects, such as low-emission transportation alternatives, to ensure that it does not inadvertently increase emissions.

6. Limitations and Future Direction

Future research could explore several avenues to build on the findings of this study. First, there is a need to investigate the specific types of financial innovation that are most effective in reducing transport emissions. While this study found that financial innovation can increase emissions, further research could focus on how green financial instruments, such as green bonds or sustainable investment funds, can be leveraged to promote low-emission technologies. Second, future studies could explore the role of governance quality in different sectors beyond transportation to provide a more comprehensive understanding of its effects on environmental sustainability.
Expanding this research to other countries or regions would offer comparative insights into how different governance and financial systems affect transport-related emissions. Longitudinal studies covering more recent data could also examine the impact of emerging technologies, such as electric vehicles, on emissions reduction. Also, M1, M2, and M3 are used for the financial innovation proxy; further study may incorporate M4 or other instruments. Our study tried to report the influence of CO2 from the transportation sector, while other sectors, such as energy intensity and industrial, can also be investigated. Country-specific investigations for various nations, such as Turkey, Russia, South Africa, and others, can also be conducted in future research works. We deployed the latest MMQR technique for the estimation; however, it may be substituted with QARDL and NARDL in future works.

Author Contributions

Software, Y.R.; Validation, H.W.; Investigation, H.W. and J.D.; Writing—original draft, Y.R.; Writing—review & editing, H.W. and Y.R.; Visualization, H.W.; Funding acquisition, J.D. All authors have read and agreed to the published version of the manuscript.

Funding

This work was supported by the Key Project of the National Social Science Fund of China (under grant 22AGL028) and partly by the Key Research Base of Universities in Jiangsu Province for Philosophy and Social Science “Research Center for Green Development and Environmental Governance”.

Data Availability Statement

The data presented in this study are available on request from the corresponding author.

Conflicts of Interest

The authors declare no conflict of interest.

Abbreviations

TCO2ETransport-related CO2 emissions
ECOGEconomic governance
FIFinancial innovation
POPAGEPopulation ageing
UNCCCUnited Nations Climate Change Conference
SDGs17 Sustainable Development Goals
ENTEnergy transition
HIHuman capital index
GDPGross domestic product
MMQRMethod of Moments Quantile Regression
BSQRBootstrap quantile regression
GHGsGreen gas emissions
OECDOrganization for Economic Co-Operation and Development
ECOWASEconomic Community of West African States

References

  1. Ahmad, M.; Dai, J.; Mehmood, U.; Abou, M. Renewable energy transition, resource richness, economic growth, and environmental quality: Assessing the role of financial globalization. Renew. Energy 2023, 216, 119000. [Google Scholar] [CrossRef]
  2. Adebayo, T.S.; Adedoyin, F.F.; Kirikkaleli, D. Toward a sustainable environment: Nexus between economic growth, renewable energy use, forested area, and carbon emissions in Malaysia. Resour. Conserv. Recycl. Adv. 2023, 15, 200096. [Google Scholar] [CrossRef]
  3. Jianguo, D.; Rasool, Y.; Ali, K.; Kashif, U.; Ahmed, Z. Can financial innovation and environmental policy curb transport-based CO2 emissions? An advanced panel analysis. Geol. J. 2024, 59, 1262–1279. [Google Scholar] [CrossRef]
  4. Naseem, S.; Kashif, U.; Rasool, Y.; Akhtar, M. The impact of financial innovation, green energy, and economic growth on transport-based CO2 emissions in India: Insights from QARDL approach. Environ. Dev. Sustain. 2023, 26, 28823–28842. [Google Scholar] [CrossRef]
  5. Sohail, M.T.; Ullah, S.; Majeed, M.T. Transportation taxes and CO2 emissions nexus in BCIST economies: Implication for environmental sustainability. Energy Environ. 2024, 35, 2829–2845. [Google Scholar] [CrossRef]
  6. Kwilinski, A.; Lyulyov, O.; Pimonenko, T. Reducing transport sector CO2 emissions patterns: Environmental technologies and renewable energy. J. Open Innov. Technol. Mark. Complex. 2024, 10, 100217. [Google Scholar] [CrossRef]
  7. Luderer, G.; Madeddu, S.; Merfort, L.; Ueckerdt, F.; Pehl, M.; Pietzcker, R.; Rottoli, M.; Schreyer, F.; Bauer, N.; Baumstark, L.; et al. Impact of declining renewable energy costs on electrification in low-emission scenarios. Nat. Energy 2021, 7, 32–42. [Google Scholar] [CrossRef]
  8. Jianguo, D.; Ali, K.; Alnori, F.; Ullah, S. The nexus of financial development, technological innovation, institutional quality, and environmental quality: Evidence from OECD economies. Environ. Sci. Pollut. Res. 2022, 29, 58179–58200. [Google Scholar] [CrossRef]
  9. Nguyen, Q.K.; Dang, V.C. Renewable energy consumption, carbon dioxide emission and financial stability: Does institutional quality matter? Appl. Econ. 2023, 56, 8820–8837. [Google Scholar] [CrossRef]
  10. Chishti, M.Z.; Sinha, A. Do the shocks in technological and financial innovation influence the environmental quality? Evidence from BRICS economies. Technol. Soc. 2022, 68, 101828. [Google Scholar] [CrossRef]
  11. Huo, W.; Zaman, B.U.; Zulfiqar, M.; Kocak, E.; Shehzad, K. How do environmental technologies affect environmental degradation? Analyzing the direct and indirect impact of financial innovations and economic globalization. Environ. Technol. Innov. 2023, 29, 102973. [Google Scholar] [CrossRef]
  12. Rasool, Y.; Jianguo, D.; Ali, K. Exploring the linkage between globalization and environmental degradation: A disaggregate analysis of Indonesia. Environ. Dev. Sustain. 2023, 26, 16887–16915. [Google Scholar] [CrossRef]
  13. IEA. World Energy Outlook 2019; International Energy Agency: Paris, France, 2019; Volume 1.
  14. Ali, K.; Jianguo, D.; Kirikkaleli, D. Modeling the natural resources and financial inclusion on ecological footprint: The role of economic governance institutions. Evidence from ECOWAS economies. Resour. Policy 2022, 79, 103115. [Google Scholar] [CrossRef]
  15. Akhtar, S.; Li, C.; Sohu, J.M.; Rasool, Y.; Hassan, M.I.U.; Bilal, M. Unlocking green innovation and environmental performance: The mediated moderation of green absorptive capacity and green innovation climate. Environ. Sci. Pollut. Res. Int. 2024, 31, 4547–4562. [Google Scholar] [CrossRef]
  16. Kashif, U.; Shi, J.; Naseem, S.; Dou, S.; Zahid, Z. ICT service exports and CO2 emissions in OECD countries: The moderating effect of regulatory quality. Econ. Change Restruct. 2024, 57, 94. [Google Scholar] [CrossRef]
  17. Ali, K.; Hongbing, H.; Liew, C.Y.; Jianguo, D. Governance Perspective and the Effect of Economic Policy Uncertainty on Financial Stability: Evidence from Developed and Developing Economies; Springer: New York, NY, USA, 2023; ISBN 0123456789. [Google Scholar]
  18. Obobisa, E.S.; Chen, H.; Mensah, I.A. The impact of green technological innovation and institutional quality on CO2 emissions in African countries. Technol. Forecast. Soc. Change 2022, 180, 121670. [Google Scholar] [CrossRef]
  19. Wang, Q.; Li, L. The effects of population aging, life expectancy, unemployment rate, population density, per capita GDP, urbanization on per capita carbon emissions. Sustain. Prod. Consum. 2021, 28, 760–774. [Google Scholar] [CrossRef]
  20. Yang, T.; Wang, Q. The nonlinear effect of population aging on carbon emission-Empirical analysis of ten selected provinces in China. Sci. Total Environ. 2020, 740, 140057. [Google Scholar] [CrossRef]
  21. Jianguo, D.; Cheng, J.; Ali, K. Modelling the green logistics and financial innovation on carbon neutrality goal, a fresh insight for BRICS-T. Geol. J. 2023, 58, 2742–2756. [Google Scholar] [CrossRef]
  22. Umar, M.; Ji, X.; Kirikkaleli, D.; Xu, Q. COP21 Roadmap: Do innovation, financial development, and transportation infrastructure matter for environmental sustainability in China? J. Environ. Manag. 2020, 271, 111026. [Google Scholar] [CrossRef]
  23. Koenker, R.; Zhao, Q. L-Estimation for linear heteroscedastic models. J. Nonparametr. Stat. 1994, 3, 223–235. [Google Scholar] [CrossRef]
  24. Liu, Y.; Feng, C. Decouple transport CO2 emissions from China’s economic expansion: A temporal-spatial analysis. Transp. Res. Part D Transp. Environ. 2020, 79, 102225. [Google Scholar] [CrossRef]
  25. Aminzadegan, S.; Shahriari, M.; Mehranfar, F.; Abramović, B. Factors affecting the emission of pollutants in different types of transportation: A literature review. Energy Rep. 2022, 8, 2508–2529. [Google Scholar] [CrossRef]
  26. Avotra, A.A.R.N.; Nawaz, A. Asymmetric impact of transportation on carbon emissions influencing SDGs of climate change. Chemosphere 2023, 324, 138301. [Google Scholar] [CrossRef]
  27. Zhao, C.; Wang, K.; Dong, X.; Dong, K. Is smart transportation associated with reduced carbon emissions? The case of China. Energy Econ. 2022, 105, 105715. [Google Scholar] [CrossRef]
  28. Ibrahim, R.L.; Ajide, K.B. The dynamic heterogeneous impacts of nonrenewable energy, trade openness, total natural resource rents, financial development and regulatory quality on environmental quality: Evidence from BRICS economies. Resour. Policy 2021, 74, 102251. [Google Scholar] [CrossRef]
  29. Ali, K.; Jianguo, D.; Kirikkaleli, D.; Oláh, J.; Altuntaş, M.; Ali, K. Do green technological innovation, financial development, economic policy uncertainty, and institutional quality matter for environmental sustainability? uncertainty, and institutional quality matter for environmental sustainability? All Earth 2023, 35, 82–101. [Google Scholar] [CrossRef]
  30. Zahid, Z.; Zhang, J.; Shahzad, M.A.; Junaid, M.; Shrivastava, A. Green Synergy: Interplay of corporate social responsibility, green intellectual capital, and green ambidextrous innovation for sustainable performance in the industry 4.0 era. PLoS ONE 2024, 19, e0306349. [Google Scholar] [CrossRef]
  31. Abid, M. Does economic, financial and institutional developments matter for environmental quality? A comparative analysis of EU and MEA countries. J. Environ. Manag. 2017, 188, 183–194. [Google Scholar] [CrossRef]
  32. Nwani, C.; Adams, S. Environmental cost of natural resource rents based on production and consumption inventories of carbon emissions: Assessing the role of institutional quality. Resour. Policy 2021, 74, 102282. [Google Scholar] [CrossRef]
  33. Fremstad, A.; Paul, M. The Impact of a Carbon Tax on Inequality. Ecol. Econ. 2019, 163, 88–97. [Google Scholar] [CrossRef]
  34. Zahid, Z.; Zhang, J.; Gao, C.; Oláh, J. ICT-Driven Strategies for Enhancing Energy Efficiency in G20 Economies: Moderating the Role of Governance in Achieving Environmental Sustainability. Energies 2025, 18, 685. [Google Scholar] [CrossRef]
  35. Pushak, T.; Tiongson, E.R.; Varoudakis, A. Public Finance, Governance, and Growth in Transition Economies: Empirical Evidence from 1992–2004. In World Bank Policy Research Working Paper; World Bank: Washington, DC, USA, 2007; pp. 1–31. [Google Scholar]
  36. Al-Mulali, U.; Ozturk, I. The effect of energy consumption, urbanization, trade openness, industrial output, and the political stability on the environmental degradation in the MENA (Middle East and North African) region. Energy 2015, 84, 382–389. [Google Scholar] [CrossRef]
  37. Akhtar, M.; Haris, M.; Naveed, H.M.; Rasool, Y.; Al-Faryan, M.A.S. Electricity shortfalls and financial leverage of listed firms in Pakistan. Util. Policy 2024, 87, 101719. [Google Scholar] [CrossRef]
  38. Yang, X.; Li, N.; Mu, H.; Pang, J.; Zhao, H.; Ahmad, M. Study on the long-term impact of economic globalization and population aging on CO2 emissions in OECD countries. Sci. Total Environ. 2021, 787, 147625. [Google Scholar] [CrossRef]
  39. Wang, Q.; Wang, L. The nonlinear effects of population aging, industrial structure, and urbanization on carbon emissions: A panel threshold regression analysis of 137 countries. J. Clean. Prod. 2021, 287, 125381. [Google Scholar] [CrossRef]
  40. Kim, J.; Lim, H.; Jo, H.H. Do aging and low fertility reduce carbon emissions in Korea? Evidence from IPAT augmented EKC analysis. Int. J. Environ. Res. Public Health 2020, 17, 2972. [Google Scholar] [CrossRef]
  41. Zhang, C.; Tan, Z. The relationships between population factors and China’s carbon emissions: Does population aging matter? Renew. Sustain. Energy Rev. 2016, 65, 1018–1025. [Google Scholar] [CrossRef]
  42. Liu, Y.; Gao, C.; Lu, Y. The impact of urbanization on GHG emissions in China: The role of population density. J. Clean. Prod. 2017, 157, 299–309. [Google Scholar] [CrossRef]
  43. Kirikkaleli, D.; Adebayo, T.S. Do renewable energy consumption and financial development matter for environmental sustainability? New global evidence. Sustain. Dev. 2021, 29, 583–594. [Google Scholar] [CrossRef]
  44. Shabir, M. Does Financial Inclusion Promote Environmental Sustainability: Analyzing the Role of Technological Innovation and Economic Globalization. J. Knowl. Econ. 2022, 15, 19–46. [Google Scholar] [CrossRef]
  45. Kirikkaleli, D.; Güngör, H.; Adebayo, T.S. Consumption-based carbon emissions, renewable energy consumption, financial development and economic growth in Chile. Bus. Strateg. Environ. 2022, 31, 1123–1137. [Google Scholar] [CrossRef]
  46. Yu, M.; Tsai, F.; Jin, H.; Zhang, H. Digital finance and renewable energy consumption: Evidence from China. Financ. Innov. 2022, 8, 58. [Google Scholar] [CrossRef]
  47. Tay, L.Y.; Tai, H.T.; Tan, G.S. Digital financial inclusion: A gateway to sustainable development. Heliyon 2022, 8, e09766. [Google Scholar] [CrossRef]
  48. Fareed, Z.; Rehman, M.A.; Adebayo, T.S.; Wang, Y.; Ahmad, M.; Shahzad, F. Financial inclusion and the environmental deterioration in Eurozone: The moderating role of innovation activity. Technol. Soc. 2022, 69, 101961. [Google Scholar] [CrossRef]
  49. Luo, R.; Ullah, S.; Ali, K. Pathway towards sustainability in selected Asian countries: Influence of green investment, technology innovations, and economic growth on CO2 emission. Sustainability 2021, 13, 12873. [Google Scholar] [CrossRef]
  50. Paparoditis, E.; Politis, D.N. The asymptotic size and power of the augmented Dickey–Fuller test for a unit root. Econom. Rev. 2013, 37, 955–973. [Google Scholar] [CrossRef]
  51. Phillips, P.C.B.; Perron, P. Testing for a unit root in time series regression. Biometrika 1988, 75, 335–346. [Google Scholar] [CrossRef]
  52. Elliott, G.; Rothenberg, T.J.; Stock, J.H. Efficient Tests for an Autoregressive Unit Root. Econometrica 1996, 64, 813. [Google Scholar] [CrossRef]
  53. Machado, J.A.F.; Santos Silva, J.M.C. Quantiles via moments. J. Econom. 2019, 213, 145–173. [Google Scholar] [CrossRef]
  54. Efron, B.; Tibshirani, R.J. An Introduction to the Bootstrap; Monographs on Statistics and Applied Probability, No. 57; Chapman and Hall: London, UK, 1994; 436p. [Google Scholar]
  55. Kapusuzoglu, A.; Karacaer Ulusoy, M. The interactions between agricultural commodity and oil prices: An empirical analysis. Agric. Econ. 2015, 61, 410–421. [Google Scholar] [CrossRef]
  56. Lajdova, Z.; Lajda, J.; Bielikv, P. The impact of the biogas industry on agricultural sector in Germany. Agric. Econ. 2016, 62, 1–8. [Google Scholar] [CrossRef]
  57. MacKinnon, J.G.; Haug, A.A.; Michelis, L. Numerical Distribution Functions of Likelihood Ratio Tests for Cointegration. J. Appl. Econom. 1999, 14, 563–577. [Google Scholar] [CrossRef]
  58. Wang, Q.; Ge, Y.; Li, R. Does improving economic efficiency reduce ecological footprint? The role of financial development, renewable energy, and industrialization. Energy Environ. 2023, 36, 755. [Google Scholar] [CrossRef]
  59. Yu, Y.; Deng, Y.; Chen, F. Impact of population aging and industrial structure on CO2 emissions and emissions trend prediction in China. Atmos. Pollut. Res. 2018, 9, 446–454. [Google Scholar] [CrossRef]
  60. Meng, Y.; Wu, H.; Wang, Y.; Duan, Y. International trade diversification, green innovation, and consumption-based carbon emissions: The role of renewable energy for sustainable development in BRICST countries. Renew. Energy 2022, 198, 1243–1253. [Google Scholar] [CrossRef]
  61. Zhen, Z.; Ullah, S.; Shaowen, Z.; Irfan, M. How do renewable energy consumption, financial development, and technical efficiency change cause ecological sustainability in European Union countries? Energy Environ. 2022, 34, 2478–2496. [Google Scholar] [CrossRef]
  62. Lee, C.C.; Yuan, Z.; Lee, C.C.; Chang, Y.F. The impact of renewable energy technology innovation on energy poverty: Does climate risk matter? Energy Econ. 2022, 116, 106427. [Google Scholar] [CrossRef]
  63. Wang, Z.; Rasool, Y.; Asghar, M.M.; Wang, B. Dynamic linkages among CO2 emissions, human development, financial development, and globalization: Empirical evidence based on PMG long-run panel estimation. Environ. Sci. Pollut. Res. 2019, 26, 36248–36263. [Google Scholar] [CrossRef]
  64. Wang, Z.; Rasool, Y.; Zhang, B.; Ahmed, Z.; Wang, B. Dynamic linkage among industrialisation, urbanisation, and CO2 emissions in APEC realms: Evidence based on DSUR estimation. Struct. Change Econ. Dyn. 2020, 52, 382–389. [Google Scholar] [CrossRef]
  65. Rasool, Y.; Anees, S.; Zaidi, H.; Zafar, M.W. Determinants of carbon emissions in Pakistan’ s transport sector. Environ. Sci. Pollut. Res. 2019, 26, 22907–22921. [Google Scholar]
  66. Ahmed, Z.; Wang, Z. Investigating the impact of human capital on the ecological footprint in India: An empirical analysis. Environ. Sci. Pollut. Res. 2019, 26, 26782–26796. [Google Scholar] [CrossRef] [PubMed]
  67. Dash, A.K.; Panda, S.P.; Sahu, P.K.; Jóźwik, B. Do green innovation and governance limit CO2 emissions: Evidence from twelve polluting countries with panel data decision tree model. Discov. Sustain. 2024, 5, 198. [Google Scholar] [CrossRef]
  68. Sachan, A.; Pradhan, A.K.; Mohindra, V. How do governance indicators, trade openness, industrialization, and population growth affect environmental degradation in BRICS Nations? Discov. Sustain. 2024, 5, 193. [Google Scholar] [CrossRef]
  69. Naz, A.; Aslam, M. Green innovation, globalization, financial development, and CO2 emissions: The role of governance as a moderator in South Asian countries. Environ. Sci. Pollut. Res. 2023, 30, 57358–57377. [Google Scholar] [CrossRef]
  70. Kakar, A.; Khan, A.; Khan, A. Analyzing the Role of Governance, ICT, and Urbanization on Environment in South Asian Countries. J. Knowl. Econ. 2024, 15, 2682–2703. [Google Scholar] [CrossRef]
  71. Mohamed, A.A.; Mohamud, F.A.S. The power of financial innovation in neutralizing carbon emissions: The case of mobile money in Somalia. Environ. Dev. Sustain. 2024, 26, 23151–23174. [Google Scholar] [CrossRef]
  72. Xu, T.; Zhao, J.; Chen, T. The role of financial innovation in carbon intensity reduction: Perspectives from energy structure transition and fiscal policies. Environ. Sci. Pollut. Res. 2024, 31, 38448–38464. [Google Scholar] [CrossRef]
  73. Al-Zubairi, A.; AL-Akheli, A.; ELfarra, B. The impact of financial development, renewable energy and political stability on carbon emissions: Sustainable development prospective for Arab economies. Environ. Dev. Sustain. 2024, 26, 1–23. [Google Scholar] [CrossRef]
  74. He, X.; Gao, W.; Guan, D.; Zhou, L. Nonlinear mechanisms of CO2 emissions in growing and shrinking cities: An empirical study on integrated effects of aging and industrial structure in Japan. J. Clean. Prod. 2024, 462, 142665. [Google Scholar] [CrossRef]
  75. Guo, H.; Jiang, J.; Li, Y.; Long, X.; Han, J. An aging giant at the center of global warming: Population dynamics and its effect on CO2 emissions in China. J. Environ. Manag. 2023, 327, 116906. [Google Scholar] [CrossRef]
  76. Liu, Y.; Huang, L.; Onstein, E. How do age structure and urban form influence household CO2 emissions in road transport? Evidence from municipalities in Norway in 2009, 2011 and 2013. J. Clean. Prod. 2020, 265, 121771. [Google Scholar] [CrossRef]
  77. Jahanger, A.; Ali, M.; Balsalobre-Lorente, D.; Samour, A.; Joof, F.; Tursoy, T. Testing the impact of renewable energy and oil price on carbon emission intensity in China’s transportation sector. Environ. Sci. Pollut. Res. 2023, 30, 82372–82386. [Google Scholar] [CrossRef]
  78. Raihan, A.; Tuspekova, A. Dynamic impacts of economic growth, renewable energy use, urbanization, industrialization, tourism, agriculture, and forests on carbon emissions in Turkey. Carbon Res. 2022, 1, 20. [Google Scholar] [CrossRef]
  79. Azizi, S.; Radfar, R.; Ghatari, A.R.; Nikoomaram, H. Assessing the impact of energy efficiency and renewable energy on CO2 emissions reduction: Empirical evidence from the power industry. Int. J. Environ. Sci. Technol. 2024, 22, 2269–2288. [Google Scholar] [CrossRef]
  80. Hasni, R.; Dridi, D.; Ben Jebli, M. Do financial development, financial stability and renewable energy disturb carbon emissions? Evidence from asia–pacific economic cooperation economics. Environ. Sci. Pollut. Res. 2023, 30, 83198–83213. [Google Scholar] [CrossRef]
  81. Onyeneke, R.U.; Chidiebere-Mark, N.M.; Ayerakwa, H.M. Impact of Information and Communication Technologies and Renewable Energy Consumption on Carbon Emissions in Africa. Carbon Res. 2024, 3, 53. [Google Scholar] [CrossRef]
  82. Koçak, S.; Banday, T.P.; Awan, A. Is the environmental Kuznets curve valid for transport sector in Pakistan? New evidence for non-renewable energy and urbanization using the QARDL approach. Environ. Sci. Pollut. Res. 2024, 31, 46194–46206. [Google Scholar] [CrossRef]
  83. Huang, L.; Quddoos, M.U.; Akhtar, M.H.; Haseeb, A.; Khan, M.B.; Rafique, A. Nexuses between carbon emissions, trade openness, transport services, globalization index, and growth in China: Targeting the sustainable development goals. Environ. Sci. Pollut. Res. 2024, 31, 46342–46356. [Google Scholar] [CrossRef]
  84. Appiah, F.; Xingle, T. Human Capital, Trade Competitiveness and Environmental Efficiency Convergence Across Asia Pacific Countries. Environ. Resour. Econ. 2023, 85, 109–132. [Google Scholar] [CrossRef]
  85. Fakhri, I.; Alqahtani, M.; Jamee, A. Effects of CO2 Emissions on the Human Development Index: Application to the Case of the Kingdom of Saudi Arabia and Other Developed Countries. J. Knowl. Econ. 2024, 15, 15453–15484. [Google Scholar]
  86. Yasmin, B.; Bibi, R. Measuring the asymmetric effect of corruption on environmental degradation in Pakistan: Role of human capital. Environ. Dev. Sustain. 2024, 26, 1–24. [Google Scholar] [CrossRef]
Figure 1. Multiple Plots.
Energies 18 01748 g001
Figure 2. Methodology flow chart.
Energies 18 01748 g002
Figure 3. Normal box plots.
Energies 18 01748 g003aEnergies 18 01748 g003b
Figure 4. Corrélation matrix box plots. TCO2E displayed the correlation among the study parameters, ECG showcased the correlation among the variables, FI showcased the correlation among the variables, ENT showcased the correlation among the variables, GDP showcased the correlation among the variables, HI showcased the correlation among the variables, POPAGE showcased the correlation among the variables.
Energies 18 01748 g004
Figure 5. The figure displays the data stability.
Energies 18 01748 g005
Figure 6. The figure presents the study variables trend.
Energies 18 01748 g006
Figure 7. Graphical explanation of the results.
Energies 18 01748 g007
Table 1. Variable indicators and data sources.
VariablesSignDescriptionsSources
Transport CO2 emissionsTCO2EMt per capitaOWD
Economic governanceECOGRegulatory quality, government effectiveness, and political stabilityWDI
Population agingPOPAGEPopulation ages 65 and above and % of the total populationWDI
Financial innovationFINarrow money (M1) and broad money (M3), where M1 and M3 are measured as seasonally adjusted indices based on 2015 = 100, and M2 is automated teller machines (ATMs) (per 100,000 adults)OECD
WDI
Energy transitionENT% equivalent primary energyOWD
Gross domestic productGDPConstant 2015 USDWDI
Human capital indexHIBased on the education ages and return to schoolingPWT 10
Table 2. Descriptive statistic.
TCO2EECOGPOPAGEFIGDPHIENT
Mean20.302−0.38118.6480.1658.7610.9737.887
Median20.352−0.51818.6240.4168.7940.9747.931
Maximum20.6181.19218.8971.2339.1721.0688.505
Minimum19.879−1.89518.468−1.4788.2430.8727.159
Std. Dev.0.2470.9040.1350.8350.2860.0610.425
Skewness−0.2630.2210.414−0.731−0.278−0.083−0.185
Kurtosis1.6482.0061.9492.3841.9141.8941.824
Table 3. Unit root test.
Phillips-PADFERS (DF-GLS)
VariableLevel1st DifferenceLevel1st DifferenceLevel1st Difference
TCO2E−1.588−9.511 a−1.515−8.735 a−0.028−1.819 b
POPAGE2.567−10.195 a−1.633−8.368 a0.147−6.576 a
FI−0.751−6.956 a−2.268−6.956 a−2.159 b−1.688 c
ECOG−2.323−6.945 a−2.139−6.945 a−2.174 b−7.013 a
ENT−1.266−15.442 a−0.441−2.624 c1.067−2.304 b
GDP−1.725 −12.249 a−1.979−2.912 b1.341−2.867 a
HI−0.839−21.519 a−0.526−9.155 a1.361−7.137 a
a, b and c indicate the 1%, 5% and 10% significant level, respectively.
Table 4. BDS test.
Table 4. BDS test.
DimensionTCO2EECOGFIPOPAGEHIENTGDP
20.197 a0.147 a0.167 a0.184 a0.189 a0.193 a0.194 a
30.334 a0.222 a0.27 a 0.303 a0.316 a0.322 a0.326 a
40.429 a0.254 a0.332 a0.383 a0.405 a0.409 a0.421 a
50.501a0.258 a0.363 a0.438 a0.469 a0.473 a0.491 a
60.553 a0.2490.376 a0.478 a0.526 a0.518 a0.546 a
a, indicate the 1% significant level, respectively.
Table 5. Residual diagnostic approaches.
ModelsValuesProbability
ARCH test
χ2-statistic1.8140.116
LM test
χ2-statistic1.4940.184
Ramsey RESET test
F-statistic2.2060.145
Jarque–Bera test
F-statistic3.0420.218
Wald test
F-Statistic3540.346 a0.000
Note: Authors’ estimations. a Indicate the 1% significant level. a, indicate the 1% significant level.
Table 6. Johansen co-integration test.
(Trace)
HypothesizedEigenvalueTrace Statistic0.05 Critical LevelProb. **
None *0.974350.412150.5580.000
At most 1 *0.733175.739117.7080.000
At most 2 *0.567112.38888.8040.000
At most 3 *0.49172.22263.8760.008
At most 40.35539.83842.9150.098
At most 50.20718.79525.8720.293
At most 60.1477.63812.5180.283
(Maximum Eigenvalue)
HypothesizedEigenvalueMax-Eigen Statistic0.05 Critical LevelProb. **
None *0.974174.67250.5990.000
At most 1 *0.73363.35244.4970.000
At most 2 *0.56740.16638.3310.031
At most 3 *0.49132.38332.1180.046
At most 40.35521.04325.8230.188
At most 50.20711.15719.3870.497
At most 60.1477.63812.5180.282
Max-eigenvalue and trace’s analysis specifies four cointegrating equation(s) at the 0.05 significant level. * Shows the rejection point at a 5% significant level. ** Indicates p-values estimated through work by MacKinnon, Haug, and Michelis (1999) [57].
Table 7. Summary of findings and policy recommendations.
VariablesImpact on CO2 EmissionsNumerical Results (MMQR Coefficients)Policy Recommendations
ECOG↓ Reduces emissions−0.008 (Q0.50), −0.008 (Q0.75)Strengthen regulations and improve governance effectiveness
FI↑ Increases emissions0.025 (Q0.50), 0.026 (Q0.90)Promote green finance and limit funding to carbon-intensive projects
POPAGE↑ Increases emissions1.368 (Q0.25), 1.901 (Q0.90)Implement senior-friendly low-carbon transport solutions
ENT↓ Reduces emissions−0.235 (Q0.50), −0.326 (Q0.90)Expand renewable energy use and support electric vehicles
GDP↑ Increases emissions1.65 (Q0.50), 1.889 (Q0.90)Balance economic growth with sustainability policies
HI↓ Reduces emissions−8.305 (Q0.50), −11.094 (Q0.90)Invest in education, green technology, and R&D
↑ indicate increase emissions; ↓ indicate decrease emissions.
Table 8. Estimation of quantile regression—MMQR.
Quantiles
VariablesLocationScaleQ0.25Q0.50Q0.75Q0.90
ECOG−0.008 a0.0001 a−0.008 a−0.008 a−0.008 c−0.008 a
FI0.025 a0.001 a0.024 a0.025 a0.025 a0.026 b
POPAGE1.368 a0.233 a1.199 a1.331 a1.557 a1.901 a
ENT−0.235 a−0.041 a−0.205 a−0.228 a−0.267 a−0.326 a
GDP1.65 a0.103 a1.581 a1.638 a1.738 a1.889 a
HI−8.305 a−1.219 c−7.421 a−8.109 a−9.292 a−11.094 a
Cont…−13.478 a−4.365 a−10.309 a−12.779 a−17.011 a−23.465 a
Note: Authors’ estimations a, b and c indicate the 1%, 5% and 10% significant level, respectively.
Table 9. Estimations of Bootstrap quantile regression—BSQR.
Quantile
Variables Q 0.25 Q 0.50 Q 0.75 Q 0.90
ECOG −0.005 a −0.006 a −0.006 c −0.013 a
FI 0.031 a 0.029 a 0.029 a 0.151 c
POPAGE 1.239 a 1.489 a 1.489 a 1.952 c
ENT −0.234 a −0.205 a −0.205 a −0.358 b
GDP 1.353 a 1.468 a 1.468 a 2.409 c
HI −6.737 a −7.451 a−7.451 a −13.979 c
Constant −9.947 a −14.693 a−14.693 a−26.403 a
Authors’ estimations a, b, and c indicate a significant level of 1%, 5%, and 10%, respectively.
Table 10. Pairwise Granger causality.
Null HypothesisF-StatisticProb
ECOG–TCO2E3.772 a0.008
TCO2E–ECOG0.2900.982
POPAGE–NTCO2E3.5830.011 b
TCO2E–POPAGE1.0810.436
FI–TCO2E0.7160.717
TCO2E–FI0.1370.999
ENT–TCO2E40.7343.009
TCO2E–ENT4.396 a0.004
GDP–TCO2E1.6630.175
TCO2E–GDP5.958 a0.000
HCI–TCO2E15.5922.006
TCO2E–HI0.9470.531
POPAGE–ECOG0.3590.959
ECOG–POPAGE2.308 c0.064
FI–ECOG0.3910.946
ECOG–FI2.890 b0.028
ENT–ECOG0.3840.949
ECOG–ENT1.2440.340
GDP–ECOG0.2270.993
ECOG–GDP5.459 a0.002
HI–ECOG0.5120.876
ECOG–HI0.0591.000
FI–POPAGE1.2270.348
POPAGE–FI1.4220.257
ENT–POPAGE3.063 b0.022
POPAGE–ENT1.0990.424
GDP–POPAGE1.4370.251
POPAGE–GDP12.6899.006
HI–POPAGE1.7890.143
POPAGE–HI10.0544.005
ENT–FI1.9190.116
FI–ENT1.2140.356
GDP–FI0.2990.979
FI–GDP17.3561.006
HI-FI2.469 b0.051
FI–HI1.0730.442
GDP–ENT10.8693.005
ENT–GDP1.4280.254
HI–ENT8.8699.005
ENT–HI0.6170.798
HI–GDP24.3061.007
GDP–HI8.097 a0.000
a, b and c indicate the 1%, 5% and 10% significant level, respectively.
Disclaimer/Publisher’s Note: The statements, opinions and data contained in all publications are solely those of the individual author(s) and contributor(s) and not of MDPI and/or the editor(s). MDPI and/or the editor(s) disclaim responsibility for any injury to people or property resulting from any ideas, methods, instructions or products referred to in the content.

