Abstract
This article provides an overview of the requirements for a grid-oriented integration of hydrogen energy storage (HES) and components into the power grid. Considering the general definition of HES and the possible components, this paper presents future hydrogen demand, electrolysis performance, and storage capacity. These parameters were determined through various overall system studies aiming for climate neutrality by the year 2045. In Germany, the targeted expansion of renewable energy generation capacity necessitates grid expansion to transport electricity from north to south and due to existing grid congestions. Therefore, electrolysis systems could be used to improve the integration of renewable energy systems, by reducing energy curtailment and providing grid services when needed. Currently, however, there are hardly any incentives for a grid-friendly allocation and operation of electrolysis or power-to-gas plants. Two possible locations for hydrogen plants from two current research projects HyCavMobil (Hydrogen Cavern for Mobility) and H2-ReNoWe (Hydrogen Region of north-western Lower Saxony) are presented as practical examples. Using power grid models, the integration of electrolysis systems at these locations in the current high and extra-high voltage grid is examined. The presented results of load flow calculations assess power line utilization and sensitivity for different case scenarios. Firstly, the results show that power lines in these locations will not be overloaded, which would mean an uncritical operation of the power grid. While the overall grid stability remains unaffected in this case, selecting suitable locations is vital to prevent negative effects on the local grid.
1. Introduction
In order to store electric energy using hydrogen (H2), systems for generation, storage, and reconversion are required [1,2,3,4,5]. Figure 1 illustrates the key components and process steps of a hydrogen energy storage (HES) system. It depicts the integration of renewable energy sources with an electrolyser for hydrogen production, various storage methods (geological, above ground, and gas grid storage), and re-electrification pathways such as fuel cells and gas turbines. These elements collectively demonstrate the role of HES in sector coupling and its potential impact on power grid operations and industrial usage. A combination of polymer electrolyte membrane (PEM) electrolysis, salt caverns, and fuel cells are often considered in comparative energy storage studies [6,7]. In addition to this integrated design of a hydrogen energy storage system (HES), the individual components are also considered separately for their individual potentials.
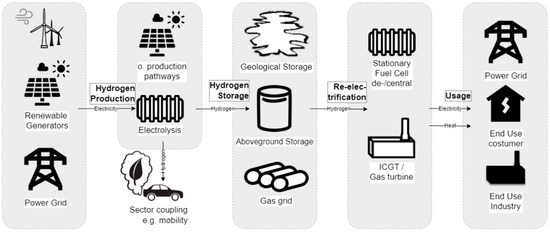
Figure 1.
The possible components of HES, and process steps. ICGT: Integrated Combined Gas Turbine.
Demonstration projects in Germany have predominantly electrolysis and power-to-gas (PtG) systems [8], along with geological storage testing in their scope. The produced hydrogen is often intended for mobility applications [9] or for decarbonizing industrial products such as in steel production and chemical processing. So far, hydrogen reconversion has been used separately in micro, combined heat and power (CHP) systems [10]. With the planned import of hydrogen and hydrogen educts [11], stand-alone plants for reconversion to electricity can be considered. A spatial separation of the components can lead to synergies for the power grid, e.g., by using transport capacities of the natural gas grid or utilizing a potential hydrogen grid. This approach reduces congestion and avoids overloading the electrical grid, which would otherwise occur if electricity had to be transported long distances solely to produce hydrogen elsewhere. While earlier research has concentrated on hydrogen production capability, economic viability, or local grid integration, this paper presents a thorough technical feasibility analysis of HES at high and extra-high voltage levels. Our methodology combines steady-state load flow calculations to assess power line utilization and the congestion effect under various case scenarios. The use of actual system parameters of ongoing projects ensures relevance for future grid planning. The results represent a starting point to analyze the possible contributions of HES for maintaining power grid stability and preventing redispatch necessity.
The purpose of this paper is to analyze the requirements for the integration of HES and its components into the power grid. The prospective future power grid is depicted by using an overview over various studies that aim to illustrate pathways to achieve climate neutrality in the power grid in Germany by 2045. This paper also presents the results of two current research projects in Germany that deal with the integration of HES in the existing power grid. The paper focuses on the technical feasibility of HES system integration into the existing high and extra-high voltage grids in Germany. Thus, hydrogen prices and operational costs (e.g., hydrogen market costs and maintenance) are not considered as these are beyond the scope of our analysis. We focus on steady-state load flow calculations, analyzing power line utilization based on line loading and sensitivity across different case scenarios to assess grid stability and the operation of hydrogen energy storage (HES) in the power grid. The grid stability assessment in this study is based on standard AC load flow calculations, assuming steady-state conditions. The key assumptions include maintaining nodal voltage levels within ±5% of nominal values, consistent with the permissible deviation for steady-state voltage magnitude in the transmission network under N-1 conditions, and also ensuring that line loading remains below 100% to prevent congestion.
The modelling approach applied in this study has been utilized in other regions by other internal projects, ensuring that the analysis is applicable for grid systems. The model validation for both studies requires initially running a comparison against the existing grid conditions (“status quo”) which is the load flow results, voltage stability, and line utilization, and these are cross checked with available open grid data. In this way, it is ensured that models reliably reflect the actual power system prior to the future case analysis. Dynamic effects and real-time market interactions were not included in this steady-state analysis and their effects on the grid can therefore not be analyzed.
The remaining paper is organized as follows: Section 2 describes HES in a future energy system by implementing electrolysis systems in the power grid. Section 3 provides examples of project results dealing with the integration of hydrogen production plants in the existing power grid in Germany. Section 4 concludes the paper and discusses future work.
2. Hydrogen Energy Storage in the Future Power Grid
The need for energy storage, including seasonal storage, in a fully renewable energy (RE) system has been known from studies for many years. The required energy storage capacity is estimated at 0.3 GW per percentage point increase in a variable renewable energy (VRE) share, assuming a balanced mix of generation sources for Germany [12]. Additionally, studies that incorporate flexibility options such as curtailment and imports/exports to neighboring countries estimate an energy storage requirement ranging between 0.05 and 1.1 TWh per %VRE share [12]. With a full RE system, as is to be created in Germany by 2045, various models result in storage requirements of between 35 and 74 TWh (Table 1). Depending on the design of the scenarios, energy storage is also directly used in industry, building, or transport sectors. The demand and supply of hydrogen in all sectors is estimated to lie between 400 to 800 TWh for “hydrogen-heavy” scenarios for Germany in 2050 (approx. 80 TWh in 2030) [13]. Studies including a precise modelling of the power grid or “electricity-heavy” scenarios indicate a hydrogen requirement between 240 and 450 TWh (max. 50 TWh in 2030) [14,15].

Table 1.
The results of various studies and assumptions on future electrolysis sites, storage capacity, and reconversion.
The electrolysis capacity installed in Germany is estimated to reach between 40 and 111 GW. The national capacity depends on the availability and price of imported hydrogen or hydrogen educts in particular. Table 1 summarizes findings from multiple studies [14,15,16,17,18,19], highlighting the identified regions most suitable for electrolysis and power-to-gas (PtG) systems under different scenarios. These projections underscore regional variations in hydrogen deployment potential and the role of renewable energy distribution in determining optimal electrolysis locations.
Since HES can be used as seasonal storage, its grid-oriented operation is of great interest to power grids. In the overall system cost optimization, electrolysers, like other loads, are operated as flexible consumers with short operating times (3400 to 3800 h) and mostly in times of high feed-in from RE. Table 2 provides an overview of various studies’ assumptions on hydrogen demand, electricity consumption, and electrolysis capacity, highlighting the role of flexible operation in different scenarios. For short- and mid-term storage, a need of an approx. 100 to 560 GWh storage capacity is estimated which is supplied by technologies other than HES, in particular batteries.
Table 2.
The results of various studies and assumptions on the future demand, production, and storage of hydrogen in a climate-neutral energy system in Germany (year 2045 or 2050). Many of the cited studies contain additional scenarios with different results.
For periods of a very low (national) feed-in from RE (“Dunkelflaute” or dark doldrums), 29 to 90 GW are specified as required controllable back-up power plants. They are specified as gas turbines, combined cycle power plants, or fuel cells using hydrogen or synthetic methane as fuel. These might be operated with very short operating times of less than 1500 h in 2045 [19]. According to [18], power plants for reconversion should be located in the vicinity of main consumption points and the security of supply could be ensured by nearby HES facilities.
The quick expansion of renewable energy capacity also requires power grid expansion, which is expected to exceed the already planned measures in the German grid development plan (“NEP2035”) by around a third [15]. Figure 2 illustrates the projected grid expansion requirements, showing the expected growth in transmission grid length and the associated annuity costs for distribution grids under the TN-Strom scenario of one of the long-term studies. The data highlights the phased expansion of both distribution and transmission networks, emphasizing the financial and infrastructural investments needed to support large-scale RE integration [15].
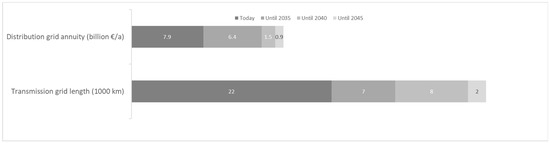
Figure 2.
Grid expansion requirements for transmission grids and annuity costs for distribution grinds in the TN-Strom scenario [15].
The grid expansion requirements in distribution grids, especially in the high-voltage (110 kV) grid, is also expected to be substantial [20]. Figure 3 and Figure 4 illustrate the impact of current transmission capacity constraints, emphasizing the role of redispatch and congestion management measures in stabilizing the grid. Figure 3 presents the distribution of energy among regular power plants, reserve power plants, and curtailed renewable energy (RE) from 2017 to 2022, highlighting the extent to which RE curtailment and redispatch actions are necessary due to grid limitations. Figure 4 further visualizes the duration of redispatch interventions across the most affected grid elements in Q1/2022, as reported by the German Federal Network Agency, identifying critical areas where congestion management was required most often. These figures underscore the need for a grid-friendly placement and optimized operation of electrolysis or power-to-gas (PtG) systems to alleviate congestion and enhance renewable energy integration.
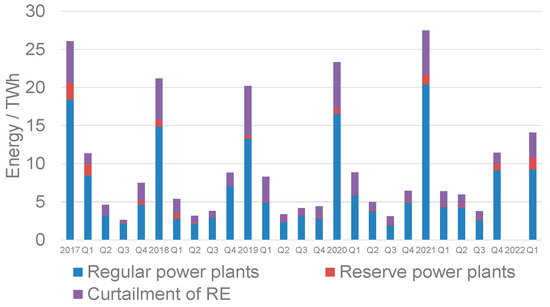
Figure 3.
Grid congestion management measures implemented from 2017 to 2022, highlighting the energy distribution among regular power plants, reserve power plants, and curtailed renewable energy (RE) [21].
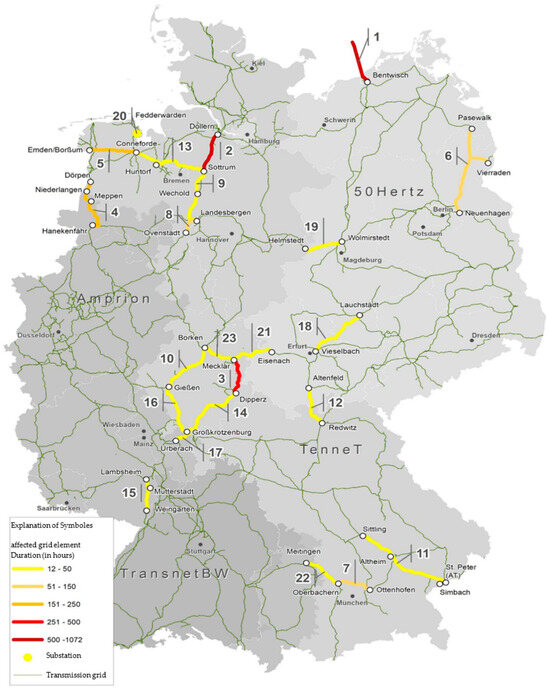
Figure 4.
The duration of electricity-related redispatch measured on the most affected grid elements in Q1/2022, illustrating areas with the highest congestion management interventions, including redispatch actions, renewable energy curtailment, and network reserve activation [21]. Copyright: Monitoringbericht 2022 von Bundesnetzagentur und Bundeskartellamt [22].
The companies Gasunie, Tennet, and Thyssengas have identified five potential regions for electrolysers that would allegedly benefit Tennets power grid [23]. The criteria considered were current and planned electricity and gas grid infrastructures, as well as hydrogen requirements in industry, water availability, and the demand for by-products. The use of electrolysis or PtG systems decrease power surplus and can thus reduce redispatch costs. The most suitable regions are north-west Lower Saxony and Schleswig-Holstein from 2035 onwards. These regions are characterized by a future high-offshore wind energy feed-in and, in Lower Saxony, by the existing low caloric (L)-gas grid infrastructure. In particular, a repurposing of the previous L-gas grid as the first part of a new hydrogen grid is also envisaged by other studies [24]. Further possible placements are on-site electrolysers at industrial sites. However, in order to exploit its benefits, the operation has to be adapted to the availability of RE. For this purpose, 5000 full-load hours in 2025 were assumed in accordance with the German Renewable Energy Sources Act (EEG) exemption for green hydrogen (article § 69b, EEG 2021) and the definition of “green hydrogen” according to the article § 12i in Renewable Energy Sources decree (EEV). For the year 2035, 3500 h of full use were assumed according to the grid development plan NEP2035 [25]. The draft of the new scenario framework for NEP2037 proposes placing electrolysers at locations with a high generation from RE or potential to avoid grid congestions [14]. The use of electrolysers in areas of high renewable energy (RE) production has the potential to greatly minimize grid congestion. By being flexible in operation, these electrolysers can utilize surplus electricity during times of excess supply and produce hydrogen, thus avoiding possible overloads in the electrical grid. This not only stabilizes the grid but also maximizes the utilization of renewable energy resources by minimizing curtailment [26]. A German Association for RE (BEE) also demands that no electrolysers should be permitted in southern Germany in order to reduce the required grid expansion [27].
In addition to “offsite” electrolysers used to support the grid, the scenario framework draft for NEP2037 [14] also includes “onsite” electrolysers with an initially (2037) similarly high generation capacity to cover local demand. Regional studies focus on the potentials and demand of local hydrogen production. An analysis of the development of electricity and hydrogen demand in the 50-Hertz grid area located in eastern Germany identifies a potential of a 2 GW electrolysis and 7 TWh hydrogen demand by 2030 [28]. In the hydrogen roadmap of North Rhine-Westphalia (NRW), a low hydrogen production capacity of approx. 10% of the total German electrolysis output is assumed, despite the high hydrogen demand [18].
As illustrated above, there is currently no consensus to steer the expansion of electrolysis capacity so that it is beneficial to the power grid. After the EEG reallocation charge was abolished in 2022, there is no longer any incentive to operate the electrolysis systems in a grid-friendly manner through a reduced number of full-load hours or the simultaneous consumption of RE generation.
The abolition of the EEG reallocation charge, which was reduced from 3.723 cents per kilowatt-hour (ct/kWh) to 0 ct/kWh effective from 1 July 2022 [29], has removed a significant financial barrier for electrolysis system investments but has simultaneously eliminated a key incentive for grid-friendly hydrogen production. This created a policy gap that could be addressed through, for example, dynamic electricity pricing that would reward electrolyser operation during the high availability of RE generation [30]. Another option is contracts for difference (CfDs) for hydrogen production. These types of policy measures are currently discussed at both European and national levels to bridge the cost gap between conventional and green hydrogen [31], under which the electrolysers operators would receive a guaranteed pricing support if they meet specific conditions, helping to ensure flexible and grid-friendly operation.
3. Project Examples: The Grid Integration of Hydrogen Production Plants
This chapter presents the first results of the grid integration of individual hydrogen production plants in the current power grid, which are examined in two research projects. In the HyCavMobil (Hydrogen Cavern for Mobility) project, hydrogen is to be generated for use in the mobility sector and stored underground in a research salt cavern [32]. The grid integration of an electrolysis plant at the cavern site in Brandenburg is being investigated. In the H2-ReNoWe (Hydrogen Region of north-western Lower Saxony) research project, the existing compressed air energy storage (CAES) power plant in Huntorf is being investigated. A concept for the progression towards a CO2-free energy storage system through the use of hydrogen is proposed [33]. Here, the grid integration of an electrolysis system at the power plant site, but also the optimized overall use of the power plant, is examined.
3.1. Hycavmobil: Hydrogen Production and Storage in Brandenburg
The HyCavMobil research project investigates the storage of hydrogen in salt caverns [32]. To analyze the integration of this system into the existing power grid at the 110 kV level, a simulation model for the regional power grid was developed using open-access grid data from the open_eGo project [34]. Figure 5a provides a georeferenced representation of this model, showing the spatial distribution of power lines, nodes, transformers, and connected generators and loads. The dataset contains geographic information of the grid elements (power lines, nodes, transformers, generators, and loads) derived from OpenStreetMap. Furthermore, electrical parameters of these elements are available, including node voltage levels, power line length, line impedances, generators, load and transformer ratings, the annual power consumption of the loads, and information about the connected generators and loads. This data serves as input data for modelling the power grid in PowerFactory [35].
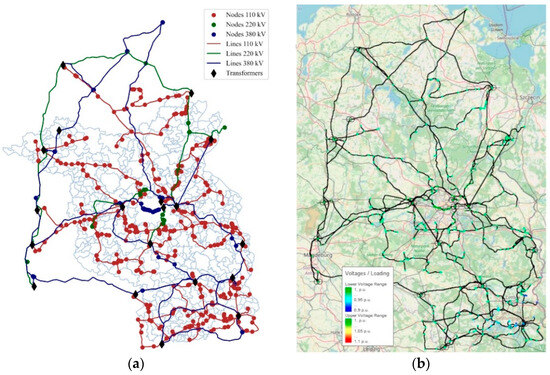
Figure 5.
(a) A georeferenced representation of the power lines and voltage levels in the grid region (Brandenburg); (b) results from the load flow simulation.
The location of the HES plant was predetermined relative to the cavern site identified by the partner project. The 110-kV connection level was chosen to facilitate regional integration, allowing the storage system to absorb excess renewable energy locally while minimizing its effect on the extra-high voltage transmission grid.
The power grid models in the projects HyCavMobil and H2-ReNoWe were developed as AC load flow models in which the active and reactive power flows are modelled, calculated, and evaluated [36]. This modelling methodology considers the reactance of the power lines and both the capacitive and inductive behavior of the power lines. Hence, reactive power compensation and voltage stability can also be examined, which is relevant when considering the distribution grid (110 kV). Figure 5a shows the simulation model of the power grid of the modelled region, created with QGIS 3.8.3 (geographic information software) [37]. Figure 5b presents the results of the load flow simulation performed in DIgSILENT PowerFactory, depicting voltage levels and power loading across the network. Based on this, the impact of HES integration for the power grid and system stability was assessed.
The input data from open_eGo was developed for three different scenarios, which are also used for the analyzes in the HyCavMobil project:
- Scenario 1 (Scen1) is based on the current status of the power grid when the open_eGo dataset was created. The installed capacities of the power plant park in Germany were taken from the registry of power plants [34].
- Scenario 2 (Scen2) is based on the grid development plan NEP2035. The scenario includes an increased share of RE generation capacity and natural gas as well as reduced outputs from conventional generators.
- Scenario 3 (Scen3) is based on the study “e-Highway 2050 Modular Development Plan of the Pan-European Transmission System 2050”. This scenario describes a future electric power system that is 100% supplied with renewable energies in Germany and includes limited gas power plant capacities.
Table 3 shows the number and installed power of the generators and loads in the simulated region (Brandenburg) for the different scenarios. The number of generators will increase in the two future scenarios, whereas the total generation capacity first increases in Scenario 2 and slightly decreases in Scenario 3 because conventional generation is phased out. The total number of loads are assumed to be constant in these scenarios, with an installed capacity of 1.76 GW and an annual energy consumption of 15.45 TWh. In contrast, recent studies [15,19] assume both a stronger increase in generation capacity and a sharp increase in the demand for electricity due to new consumers.
Table 3.
The number and installed power of generators and loads in the simulated regions for different scenarios.
Table 4 shows the installed generation capacity, disaggregated for the different power sources. In the first two scenarios (Scen1 and Scen2), electrical energy is generated from conventional and RE sources, while in Scen3 there are only RE sources with higher installed capacities than in Scen1 and Scen2. The data illustrates the phased reduction of conventional power, where coal, lignite, and gas capacities decrease to zero in Scenario 3. Simultaneously, the installed capacity of renewable sources (wind, photovoltaic, and biomass) increases, ensuring a fully renewable-based electricity system. These shifts reflect the modeled transition toward a decarbonized energy system and its implications for grid stability.
Table 4.
The installed power of different technologies for the simulated region for different scenarios.
Table 5 presents the results of the load flow calculations, comparing the initial state of the power grid with various installed capacities of a hydrogen energy storage (HES) facility. The analysis was performed for all three scenarios, assessing the impact on line loading at 110 kV, 220 kV, and 380 kV voltage levels. Contrary to expectations, the increasing renewable energy capacity in Scenarios 2 and 3 does not lead to a higher maximum line loading but instead results in a reduction. This suggests that the integration of HES and electrolysis facilities can help alleviate grid congestion by absorbing excess renewable energy, improving the overall grid utilization. In the simulation model of the region, we have simulated a future HES facility with different dimensions from 2 MW to 200 MW and grid connection in the distribution grid (110 kV). An installed power of 200 MW corresponds to around 11% of the connected load in the simulation model. The installed power of the facility comprises the electrolyser, compressors for filling the storage cavern, and further subsystems. The aim of this simulation was to evaluate the stability of the power grid in terms of node voltage and power line loading. The simulation results show for an assumed power of 100 MW or higher, the maximum line loading of the 110 kV lines increases sharply. This is caused by the nearest lines to the connection point. The power lines are not overloaded, which indicates a non-critical operation of the power grid. A slight decrease in the line loading with an increased installed capacity of the H2-facility can be observed for the 220 kV grid levels. Although the grid stability is not compromised in these scenarios, careful site selection remains essential to mitigate potential negative impacts on local grid infrastructure.
Table 5.
The results of the load flow calculations for different scenarios.
3.2. H2-Renowe—The Hydrogen-CAES Power Plant in North-West Lower Saxony
The H2-ReNoWe research project also investigates the integration of a HES system into the existing power grid. A concept for the use of hydrogen as an energy source is being developed for the existing Huntorf CAES power plant. The hydrogen is proposed to replace the infeed of natural gas needed to run the turbine in addition to the compressed air. This innovative H2-CAES power plant includes the generation, storage, and reconversion by means of electrolysis, hydrogen storage in a former natural gas cavern, and hydrogen combustion in the existing gas turbine in addition to the compressed air components [38]. The grid connection of the H2-CAES system lies at the 220 kV voltage level. The connection point was predefined based on the existing infrastructure of the Huntorf CAES plant. In addition to the examination of all individual components and the overall concept, operation strategies were developed with the help of revenue optimization. Various scenarios and the resulting operation time series of the power plant were made available within the project [39] and are evaluated with regard to their grid impact. Additionally, the integration of the electrolyser system with shorter operation times that match RE production is examined, incorporating the results from the overall system studies (see Table 1 and Table 2).
The grid data is acquired from the open_eGo Database and processed similarly, as described above [34]. A grid model was created that includes the grid topology in the vicinity of the power plan in detail, as well as the remaining power grid in Germany as clustered nodes plus one node for each neighboring country. Firstly, it was examined to what extent a change in power at the grid connection point of the power plant influences the line loading. For that, line sensitivities were analyzed using the grid admittance matrices [40]. Figure 6 illustrates the results, showing the power line sensitivity for a 1 MW power change at the Huntorf grid connection point. The area of influence of the power plant extends beyond the region that was modelled in detail into the surrounding grid.
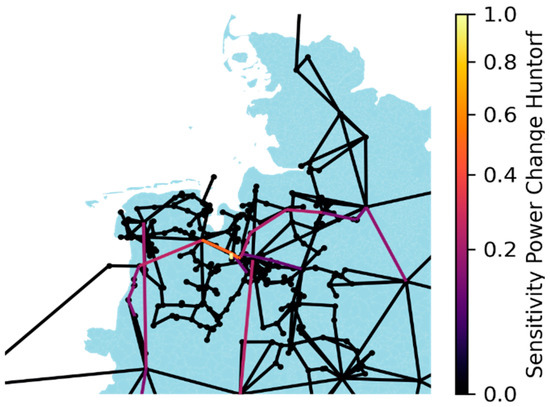
Figure 6.
The modelled grid region for the integration of a H2-CAES facility in north-west Lower Saxony. Figure shows the power line sensitivity for a power change of 1 MW at the Huntorf grid connection point.
Generation and load time series from the SMARD data portal [41] for the year 2020 in 15-min resolution were used for the following analyzes. The data contains load data, generation time series, and capacities for each technology for the whole of Germany. The available installed generation capacity was distributed to the model grid nodes proportionally, using location data from the German energy market data register (MaStR) [42]. The SMARD dataset also contains other energy market data such as prices for energy and balancing power. These are the basis for the optimization strategies carried out in the project [43]. Two of these operation scenarios were made available within the project and examined with regard to their grid reciprocation. In these operation scenarios, revenues are generated through trading on the day-ahead market, the provision of secondary control power and minute reserves, and the sale of the produced hydrogen.
In the first scenario, long operation times of electrolysis are achieved due to low electricity prices (compared to 2022) and high hydrogen revenues (3.5 €/kg). In the second scenario, a 50% increase in the price of hydrogen on sale is assumed. Table 6 presents the full-load hours (FLH) of the power plant components under revenue-optimized operation, as well as an additional three scenarios based on onshore and offshore wind energy availability. The results indicate that the electrolyser operates significantly longer in revenue-optimized scenarios (up to 8479 FLH) compared to wind-based operation scenarios, where FLH is constrained to 1500, 3000, or 4500 h, as derived from overall energy system studies (Table 1 and Table 2). The findings highlight the strong dependence of electrolyser utilization on electricity market conditions and hydrogen price assumptions.
Table 6.
The full-load hours of the power plant components for various operating scenarios at the Huntorf power plant site.
Figure 7 shows the average power change for the power lines with an active power sensitivity greater than 0.2 MW/MW, as previously identified in Figure 6. The change from the base case is presented as power rather than loading in percentage in order to improve comparability. Since the grid connection is in the 220 kV voltage level, the lines with the highest sensitivity can be found here. The 220 kV power lines are hardly loaded in the basic simulation and are therefore largely subject to a higher load. In the 380 kV voltage level, the long operation times in the revenue-optimized scenarios reduce power line loading.
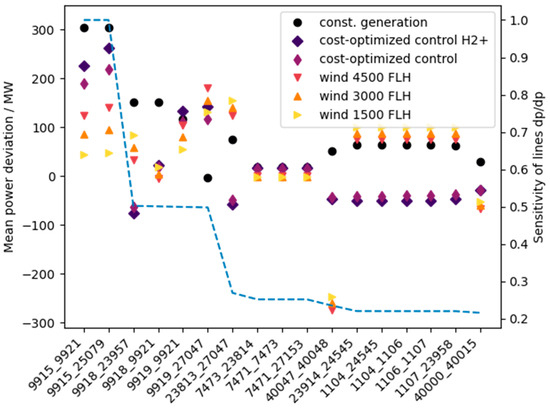
Figure 7.
The power deviation (right axis) of the most sensitive lines (sensitivity values are displayed as the blue line) in the grid region under consideration for different operating concepts of the H2-CAES system with an electrolysis capacity of 300 MW.
The congestion on the Conneforde–Huntorf–Sottrum line (see Figure 4, element/power line 13) as depicted in the grid congestion report could not be reproduced in the simulation model, as it is due to through (N-1) considerations [44]. However, it can be assumed that the additional load on the 220 kV power lines increases the overload in the (N-1) considerations.
Since generation and load time series were taken from the SMARD data portal and regionalization was based on the installed capacity and not on regionalized wind profiles, the simulation model is not able to depict extreme grid conditions. Curtailments and redispatch measures are already included in the time series.
4. Conclusions and Future Work
In the examined scenarios, a selectively higher utilization at the connection point of the respective hydrogen plant can be observed, but no significant influence on the transmission grid, due to their small dimensions compared to the total installed capacity of RE generators. A potential for the reduction in grid congestion or redispatch measures by HES appears realistic, especially when selecting the grid connection points for precisely this purpose. With a higher RE feed-in and the assumption of several or larger electrolysis or general PtG plants, it is expected that they could contribute to reducing grid congestions [23]. In the draft of the scenario framework for the network development plan 2037 NEP2037, it is also assumed that electrolysers should be placed at locations with a particularly high regional excess of produced electricity, as otherwise the need for grid expansion could be underestimated [14]. Irrespective of the possible reduction in grid congestions through the flexible use of electrolysers in the short term, the evaluated overall grid studies show that adequate grid expansion is an essential part of the energy transition. A reduced grid expansion leads to higher overall system costs, as it requires significantly more generation and storage capacity [15,17].
To efficiently integrate electrolysers, they should be placed in the areas with a high surplus of renewable energy such as north-west Lower Saxony and Schleswig-Holstein. At these locations, they can use solely renewable energy and have the potential to reduce redispatch measures (Figure 3 and Figure 4). The identified locations align with findings from previous studies, which suggest prioritizing regions with a strong renewable generation potential and grid optimization needs (Table 1 and Table 2).
Future research should incorporate a higher resolution in grid modeling when extending the analysis to distribution grids, as electrolysers may have a more localized impact at lower voltage levels. The contribution of electrolysers to reactive power and voltage management could be included into the load flow analysis in order to evaluate system benefits beyond flexible operations. Future research may also fill the gap by using dynamic models and market-driven dispatch in simulations and reinforcing the steady-state analysis process. Future work could incorporate regionalized wind generation profiles rather than relying solely on installed capacity data that were taken from SMARD, to accurately simulate extreme grid conditions.
Furthermore, integrating dynamic simulations alongside steady-state analyzes would enable a more comprehensive evaluation of system services, frequency stability, and market-based dispatch strategies.
Author Contributions
Conceptualization M.S., D.P. and M.T.; writing—original draft preparation M.S., D.P. and M.T.; writing—review and editing M.S., D.P., M.T., F.S. and K.v.M. All authors have read and agreed to the published version of the manuscript.
Funding
The research project HyCavMobil is funded by the German Federal Ministry for Digital and Transport (BMDV) under grant no. 03B10902B within the National Innovation Programme for Hydrogen and Fuel Cell Technology (NIP 2) coordinated by NOW GmbH (the National Organization for Hydrogen and Fuel Cell Technology). The H2-ReNoWe research project is funded by the Lower Saxony Ministry of Science and Culture as part of the “innovation laboratory for hydrogen technology” under grant no. VW ZN 3773. The authors thank Ann-Kathrin Klass from the TU Clausthal for providing the optimized operating time series of the H2-CAES simulation based on real operating data as CAES out of more than thirty years.
Data Availability Statement
The original contributions presented in the study are included in the article, further inquiries can be directed to the corresponding author.
Conflicts of Interest
The authors declare no conflicts of interest.
References
- Xiong, Y.; Chen, L.; Zheng, T.; Si, Y.; Mei, S. Electricity-Heat-Hydrogen Modeling of Hydrogen Storage System Considering Off-Design Characteristics. IEEE Access 2021, 9, 156768–156777. [Google Scholar] [CrossRef]
- Wen, T.; Zhang, Z.; Lin, X.; Li, Z.; Chen, C.; Wang, Z. Research on Modeling and the Operation Strategy of a Hydrogen-Battery Hybrid Energy Storage System for Flexible Wind Farm Grid-Connection. IEEE Access 2020, 8, 79347–79356. [Google Scholar] [CrossRef]
- Zhang, M.; Zhang, N.; Guan, D.; Ye, P.; Song, K.; Pan, X.; Wang, H.; Cheng, M. Optimal Design and Operation of Regional Multi-Energy Systems With High Renewable Penetration Considering Reliability Constraints. IEEE Access 2020, 8, 205307–205315. [Google Scholar] [CrossRef]
- Yin, W.; Liu, L.; Rui, X. Analysis, Modeling and Control of a Hybrid Drive Wind Turbine With Hydrogen Energy Storage System. IEEE Access 2020, 8, 114795–114806. [Google Scholar] [CrossRef]
- Sun, W.; Harrison, G.P. Active Load Management of Hydrogen Refuelling Stations for Increasing the Grid Integration of Renewable Generation. IEEE Access 2021, 9, 101681–101694. [Google Scholar] [CrossRef]
- Steward, D.; Saur, G.; Penev, M.; Ramsden, T. Lifecycle Cost Analysis of Hydrogen Versus Other Technologies for Electrical Energy Storage; Tech. Report NREL/TP-560-46719; NREL: Golden, CO, USA, 2009. [Google Scholar]
- Takach, M.; Sarajlić, M.; Peters, D.; Kröner, M.; Schuldt, F.; von Maydell, K. Review of Hydrogen Production Techniques from Water Using Renewable Energy Sources and Its Storage in Salt Caverns. Energies 2022, 15, 1415. [Google Scholar] [CrossRef]
- Bartels, J.; Varela, C.; Wassermann, T.; Medjroubi, W.; Zondervan, E. Integration of water electrolysis facilities in power grids: A case study in northern Germany. Energy Convers. Manag. X 2022, 14, 100209. [Google Scholar] [CrossRef]
- Hernández, B.; Alkayas, A.; Azar, E.; Mayyas, A.T. Mathematical Model for the Placement of Hydrogen Refueling Stations to Support Future Fuel Cell Trucks. IEEE Access 2021, 9, 148118–148131. [Google Scholar] [CrossRef]
- Elkhatib, R.; Kaoutari, T.; Louahlia, H. Green Hydrogen Energy Source for a Residential Fuel Cell Micro-Combined Heat and Power. Appl. Therm. Eng. 2024, 248, 123194. [Google Scholar] [CrossRef]
- Pandey, A. Namibia Pitches Green Hydrogen to Europe at Davos. 2022. Available online: https://www.dw.com/en/namibia-pitches-green-hydrogen-to-europe-at-davos/a-61936601 (accessed on 8 February 2023).
- Cebulla, F.; Haas, J.; Eichman, J.; Nowak, W.; Mancarella, P. How much electrical energy storage do we need? A synthesis for the U.S., Europe, and Germany. J. Clean. Prod. 2018, 181, 449–459. [Google Scholar] [CrossRef]
- Wietschel, M.; Hebling, C.; Ragwitz, M. Metastudie Wasserstoff—Auswertung von Energiesystemstudien; Tech. Report Studie im Auftrag des Nationalen Wasserstoffrats; Fraunhofer: Frankfurt am Main, Germany, 2021. [Google Scholar]
- Szenariorahmen zum Netzentwicklungsplan Strom 2037 mit Ausblick 2045; Tech. Report; 50Hertz Transmission GmbH: Berlin, Germany; Amprion GmbH: Dortmund, Germany; TenneT TSO GmbH: Bayreuth, Germany; TransnetBW GmbH: Wendlingen, Germany, 2022.
- Langfristszenarien für die Transformation des Energiesystems in Deutschland; Tech. Report; Fraunhofer ISI: Karlsruhe, Germany; Consentec: Aachen, Germany; Institut für Energie- and Umweltforschung: Heidelberg, Germany; TU Berlin: Berlin, Germany, 2022.
- Stolten, D.; Markewitz, P.; Schöb, T.; Kullmann, F.; Risch, S.; Groß, T.; Hoffmann, M.; Franzmann, D.; Triesch, T.; Kraus, S.; et al. Neue Ziele Auf Alten Wegen? Strategien Für Eine Treibhausgasneutrale Energieversorgung Bis Zum Jahr 2045; Tech. Report; IEK-3 Institute of Energy and Climate Research: Jülich, Germany, 2021. [Google Scholar]
- Fette, M.; Brandstätt, C.; Gil, H.-C.; Fardian, H.; Pregger, T.; Schaffart, J.; Tali, E.; Brücken, N. Multi-Sektor-Kopplung: Modellbasierte Analyse der Integration Erneuerbarer Stromerzeugung Durch Die Kopplung der Stromversorgung Mit Dem Wärme-, Gas- und Verkehrssektor; Tech. Report; Fraunhofer IFAM, DLR TT, Brennstoff- und Gerätetechnik, Gas- und Wäreme-Institut Essen: Bremen, Germany, 2020. [Google Scholar]
- Cerniauskas, S.; Markewitz, P.; Linßen, J.; Kullmann, G.; Lopion, P.-M.; Heuser, P.-M.; Grube, T.; Robinius, M.; Stolten, D. Wissenschaftliche Begleitstudie der Wasserstoff Roadmap Nordrhein-Westfalen; Forschungszentrum Jülich: Jülich, Germany, 2021. [Google Scholar]
- Gierkink, M. Vergleich der “Big 5”-Klimaneutralitätsszenarien; Tech. Report Kopernikus Projekt Ariadne; EWI Institute of Energy Economics at the University of Cologne: Cologne, Germany, 2022. [Google Scholar]
- Bericht zum Zustand und Ausbau der Verteilernetze; Tech. Report; Bundesnetzagentur: Bonn, Germany, 2021.
- Zahlen zu Netzengpassmanagementmaßnahmen—Erstes Quartal 2022; Tech. Report; Bundesnetzagentur: Bonn, Germany, 2022.
- Monitoring Report 2022, Bundesnetzagentur, Bundeskartellamt, Germany, Tech. Report. 2023. Available online: https://www.bundesnetzagentur.de/DE/Fachthemen/ElektrizitaetundGas/Monitoringberichte/start.html (accessed on 12 February 2025).
- Quo Vadis, Elektrolyse? Identifikation Gesamtenergiesystemdienlicher Power-to-Gas-Standorte in der Potentialregion Nord-Westliches Niedersachsen und Schleswig-Holstein; Tech. Report; Gasunie Deutschland Transport Servies GmbH: Hannover, Germany; TenneT TSO GmbH: Bayreuth, Germany; Thyssengas GmbH: Dortmund, Germany, 2022.
- Amber Grid; Bulgartransgaz; Conexus; CREOS; DESFA; Elering, Enagás; Energinet; Eustream; FGSZ; FluxSwiss; et al. European Hydrogen Backbone: A European Hydrogen Infrastructure Vision Covering 28 Countries; Tech. Report; Guidehouse: Utrecht, The Netherlands, 2022. [Google Scholar]
- Netzentwicklungsplan 2035; Tech. Report; 50Hertz Transmission GmbH: Berlin, Germany; Amprion GmbH: Dortmund, Germany; TenneT TSO GmbH: Bayreuth, Germany; TransnetBW GmbH: Wendlingen, Germany, 2021.
- Cozzolino, R.; Bella, G. A review of electrolyzer-based systems providing grid ancillary services: Current status, market, challenges and future directions. Front. Energy Res. 2024, 12, 1358333. [Google Scholar] [CrossRef]
- Stark, M.; Widdel, F. Kritische Einordnung des Szenariorahmenentwurfs—Die Richtigen Weichenstellungen für das Gelingen der Energiewende Setzen; Tech. Report; Bundesverband Erneuerbare Energien: Berlin, Germany, 2022. [Google Scholar]
- Golling, C.; Jarolin, M. Regionale Entwicklung des Strom- und Wasserstoffbedarfs: Ergebnispräsentation für die 50Hertz Regelzone; Tech. Report; 50Hertz Transmission GmbH: Berlin, Germany, 2022. [Google Scholar]
- TransnetBW. Charging of Levy Under German Renewable Energy Act (EEG) from 1 July 2022. Available online: https://www.transnetbw.de/en/energy-market/renewables-and-levies/eeg-support/charging-of-levy-under-german-renewable-energy-act-eeg-from-1-july-2022 (accessed on 12 March 2025).
- CEER Paper on Electricity Distribution Tariffs Supporting the Energy Transition; Distribution Systems Working Group, Ref: C19-DS-55-04; CEER: Brussels, Belgium, 2020; Available online: https://www.ceer.eu/wp-content/uploads/2024/04/C19-DS-55-04_CEER-paper-electricity-distribution-tariffs.pdf (accessed on 12 February 2025).
- Neuhoff, K.; Richstein, J.; Schwenen, S.; Vasa, A.; May, N. Carbon Contracts for Difference: Expanding Clean Hydrogen Production; DIW Discussion Papers; DIW: Berlin, Germany, 2021. [Google Scholar]
- Hoidis, J.; Kroener, M.; Agert, C. Salzkavernen Speichern Wasserstoff für Mobilitätsswende. Available online: https://www.dlr.de/content/de/artikel/news/2020/04/20201217_salzkavernen_speichern_wasserstoff_fuer_mobilitaetswende.html (accessed on 4 October 2021).
- Peters, D. Innovationslabor H2-ReNoWe Wasserstoffregion Nord-West-Niedersachsen. Available online: https://www.dlr.de/ve/desktopdefault.aspx/tabid-16121/26108_read-67233/ (accessed on 5 October 2021).
- open_eGo Project Website. Available online: https://openenergy-platform.org (accessed on 4 October 2021).
- DIgSILENT PowerFactory Official Website. Available online: https://www.digsilent.de/en/powerfactory.html (accessed on 12 February 2025).
- Sarajlic, M.; Peters, D.; Beckmann, R.; Liere-Netheler, I.; Schuldt, F.; von Maydell, K. Application of Open Source Models and Data Sets for Energy System Research: (User) Experiences from Ongoing and Completed Projects. In Proceedings of the 2022 Open Source Modelling and Simulation of Energy Systems (OSMSES), Aachen, Germany, 4–5 April 2022; pp. 1–6. [Google Scholar] [CrossRef]
- QGIS Official Website. Available online: https://www.qgis.org/en/site/ (accessed on 12 February 2025).
- Fries, A.; Kaiser, F.; Beck, H.; Weber, R. Huntorf 2020—Improvement of Flexibility and Efficiency of a Compressed Air Energy Storage Pant based on Synthetic Hydrogen. In Proceedings of the Conference on Sustainable Energy Supply and Energy Storage Systems, NEIS 2018, Hamburg, Germany, 20–21 September 2018; pp. 1–5. [Google Scholar]
- Klaas, A.-K.; Beck, H.-P.; Hauer, I. Sizing of Hydrogen Energy Storage Concepts for Simultaneous Participation in Various Energy Markets. In Proceedings of the 2023 19th International Conference on the European Energy Market (EEM), Lappeenranta, Finland, 6–8 June 2023; pp. 1–8. [Google Scholar] [CrossRef]
- Liere-Netheler, I.; Schuldt, F.; von Maydell, K.; Agert, C. Optimised curtailment of distributed generators for the provision of congestion management services considering discrete controllability. IET Gener. Transm. Distrib. 2020, 14, 735–744. [Google Scholar] [CrossRef]
- Bundesnetzagentur. SMARD Strommarktdaten. Available online: www.smard.de (accessed on 22 November 2022).
- Bundesnetzagentur. Marktstammdatenregister. Available online: www.marktstammdatenregister.de/MaStR (accessed on 22 November 2022).
- Klaas, A.-K. Speicherauslegung und Betriebsführung von Wasserstoff-Druckluftspeicherkraftwerken (HCAES) bei Simultaner Teilnahme an Verschiedenen Energiemärkten; Cuvillier Verlag: Göttingen, Germany, 2022; Available online: https://cuvillier.de/de/shop/publications/8915 (accessed on 21 March 2025).
- Medjroubi, W.; Müller, U.P.; Scharf, M.; Matke, C.; Kleinhans, D. Open Data in Power Grid Modelling: New Approaches Towards Transparent Grid Models. Energy Rep. 2017, 3, 14–21. [Google Scholar] [CrossRef]
Disclaimer/Publisher’s Note: The statements, opinions and data contained in all publications are solely those of the individual author(s) and contributor(s) and not of MDPI and/or the editor(s). MDPI and/or the editor(s) disclaim responsibility for any injury to people or property resulting from any ideas, methods, instructions or products referred to in the content. |
© 2025 by the authors. Licensee MDPI, Basel, Switzerland. This article is an open access article distributed under the terms and conditions of the Creative Commons Attribution (CC BY) license (https://creativecommons.org/licenses/by/4.0/).