Article

Numerical Simulation Study on the Feasibility of Cyclone PIV Tracer Particle Seeder in Microgravity

1
Fluid Machinery Engineering Technology Research Center, Jiangsu University, Zhenjiang 212013, China
2
Institute of Engineering Thermophysics, Chinese Academy of Sciences, Beijing 100190, China
3
Binzhou Institute of Technology, Binzhou 256600, China
4
National Key Laboratory of Science and Technology on Advanced Light-Duty Gas-Turbine, Beijing 100190, China
*
Author to whom correspondence should be addressed.
Energies 2025, 18(7), 1700; https://doi.org/10.3390/en18071700
Submission received: 7 March 2025 / Revised: 24 March 2025 / Accepted: 25 March 2025 / Published: 28 March 2025

Abstract

:
The Particle Image Velocimetry (PIV) Unit in the Combustion Science Experimental System (CSES) aboard the China Space Station (CSS) is designed for flow field measurements in microgravity combustion experiments. However, the lack of a reliable microgravity-compatible tracer particle seeder has hindered its practical application. To address this issue, the cyclone PIV particle seeder was proposed and evaluated through steady and transient numerical simulations using the Reynolds Stress Model (RSM) and Eulerian multiphase model to assess the effects of geometric parameters, gravity, and particle accumulation on flow characteristics and particle seeding performance. Ground-based cold jet and premixed combustion PIV experiments were also conducted. Results show that while the flow field of the cyclone particle seeder is generally similar to conventional cyclone separators, localized differences exist. Traditional optimization strategies of cyclone separators may not be applicable, while a longer vortex finder improved particle seeding performance compared to the shorter configuration and the guide vane design. By combining numerical simulations and experiment results, this study demonstrates the feasibility of using the cyclone particle seeder under microgravity conditions, provides key theoretical support for optimizing cyclone seeders, and enables flow field measurements in future microgravity combustion experiments aboard the China Space Station.

1. Introduction

The Combustion Science Experimental System (CSES) was successfully launched to the China Space Station (CSS) in 2022 [1]. Since then, numerous experiments have been scheduled, and related research findings are progressively being published [2].
Microgravity experiments offer unique advantages by eliminating the influence of natural convection in combustion, thereby simplifying combustion processes and revealing distinct physical and chemical phenomena that significantly differ from those observed under normal gravity. These include variations in flame structure, temperature distribution, propagation speed, and particulate formation [3,4]. Conducting combustion experiments in microgravity is not only crucial for advancing fundamental combustion science but also holds significant engineering value for developing high-efficiency, low-emission combustion technologies and space fire prevention strategies [5].
The velocity of the combustion flow field plays a pivotal role in flame stabilization, flame structure, flame propagation, heat and mass transfer, and energy dissipation [6,7]. A systematic study of flow velocity distribution in combustion systems could facilitate a deeper understanding of the intrinsic coupling mechanisms between combustion and fluid dynamics. Such investigations not only enhance the understanding of flame structures and provide essential validation data for combustion models but also contribute to advancing fundamental combustion theories, thereby improving the predictive capabilities for complex combustion phenomena.
The PIV (Particle Image Velocimetry) Unit within the CSS-CSES includes the optical modules, marking the first attempt to employ this technique for measuring combustion velocity fields in a space station environment [8]. However, due to constraints such as high experimental costs, complex operational conditions, and stringent safety requirements, microgravity combustion PIV experiments have not yet been conducted as planned. Despite the critical role of PIV technology in combustion diagnosis, its successful application in microgravity remains extremely limited [9,10,11]. Furthermore, theoretical foundations and engineering designs for such applications are scarce [12,13], and research on tracer particle seeding technology in microgravity has been largely unexplored. Therefore, developing a reliable PIV tracer particle seeding technique suitable for microgravity is an urgent engineering challenge.
Due to the absence of a feasible PIV tracer particle seeding system, current microgravity combustion experiments lack the ability to directly measure flow velocity fields during flame evolution and extinction [2]. This limitation hinders the observation of key local flow behaviors, such as flame-induced recirculation, jet deflection, and shear layer instabilities, which are often difficult to infer from scalar-based diagnostics alone. In particular, PIV could reveal whether rotational or accelerated flow structures exist near flame front features. These measurements would provide deeper insight into the coupling between flow disturbances and flame extinction mechanisms in microgravity.
Solid particle seeders, also known as aerosols generators, can be broadly classified into active and passive types. Active aerosols generators rely on the mechanical movement of active moving parts to break up particle agglomeration and generate uniform aerosols, such as stirring generators and rotating brush generators [14]. Passive aerosols generators are typically categorized as cyclone-based [15] or fluidized-bed-based [16], both utilizing high-speed airflow to efficiently mix with tracer particles, forming aerosols that are subsequently introduced into the main flow. In addition to these fundamental types, various hybrid generators have been developed, such as stirring-fluidized bed and cyclone-fluidized bed aerosols generators [17].
Considering the spatial constraints and power limitations within the CSES, active particle seeders also face substantial challenges regarding sealing, power supply, and long-term stability. In contrast, cyclone particle seeders offer a passive and energy-efficient alternative. Previous studies [15,16,17,18] have demonstrated that cyclone geometry can uniformly generate aerosols and effectively introduce tracer particles into the main flow under normal gravity conditions, making them a promising candidate for microgravity tracer particle seeding applications.
Currently, extensive numerical simulations of cyclone separators have been conducted [19,20,21], while research on cyclone particle seeders has primarily remained at the fundamental level, with limited numerical studies focusing on their internal flow fields. Although cyclone separators and the PIV tracer particle seeder share similarities in both principle and geometry, they exhibit key differences:
  • Contrasting design objectives: The cyclone separator separates particles from the gas flow to obtain a clean gas phase, whereas the cyclone particle seeder generates and delivers aerosols, ensuring a well-mixed gas-particle flow;
  • Different inlet flow compositions: The cyclone separator involves gas–solid two-phase flow at the inlet, whereas the cyclone particle seeder only has one fluid phase at the inlet;
  • Different structural features: The cyclone separator typically includes a dust hopper for collecting solid particles carried by the fluid, while the cyclone particle seeder does not include a dust hopper.
Given these distinctions, conducting a numerical simulation of cyclone particle seeders is scientifically significant. Since the design of cyclone particle seeders is inspired by conventional cyclone separators, turbulence models commonly used in cyclone separator studies, such as the Reynolds Stress Model (RSM) [22], are also suitable for analyzing the internal flow characteristics of such devices.
In gas–particle two-phase flow simulations, commonly used numerical methods include the Eulerian–Lagrangian (E–L) approach [23] and the Eulerian–Eulerian (E–E) approach [24]. In the E–E method, both phases are treated as continua; in the E–L approach, the fluid is modeled as a continuous phase, while the particles are treated as a discrete phase.
In cyclone separator simulations, the Eulerian–Lagrangian approach is widely used, particularly in CFD-DPM (Discrete Phase Model) and CFD-DEM (Discrete Element Method) studies. Although the Lagrangian approach can describe particle flow in both dilute and dense suspensions across various particle size ranges, it is computationally more expensive than the Eulerian approach under the same conditions. Given that the tracer particles used in this study are in the nanometer scale, employing an E–L approach would require unacceptable computational resources. Furthermore, as this study focuses primarily on two-phase flow behavior rather than individual particle trajectories, the E–E method was chosen to reduce computational cost while ensuring reliable results.

2. Physical and Mathematical Model

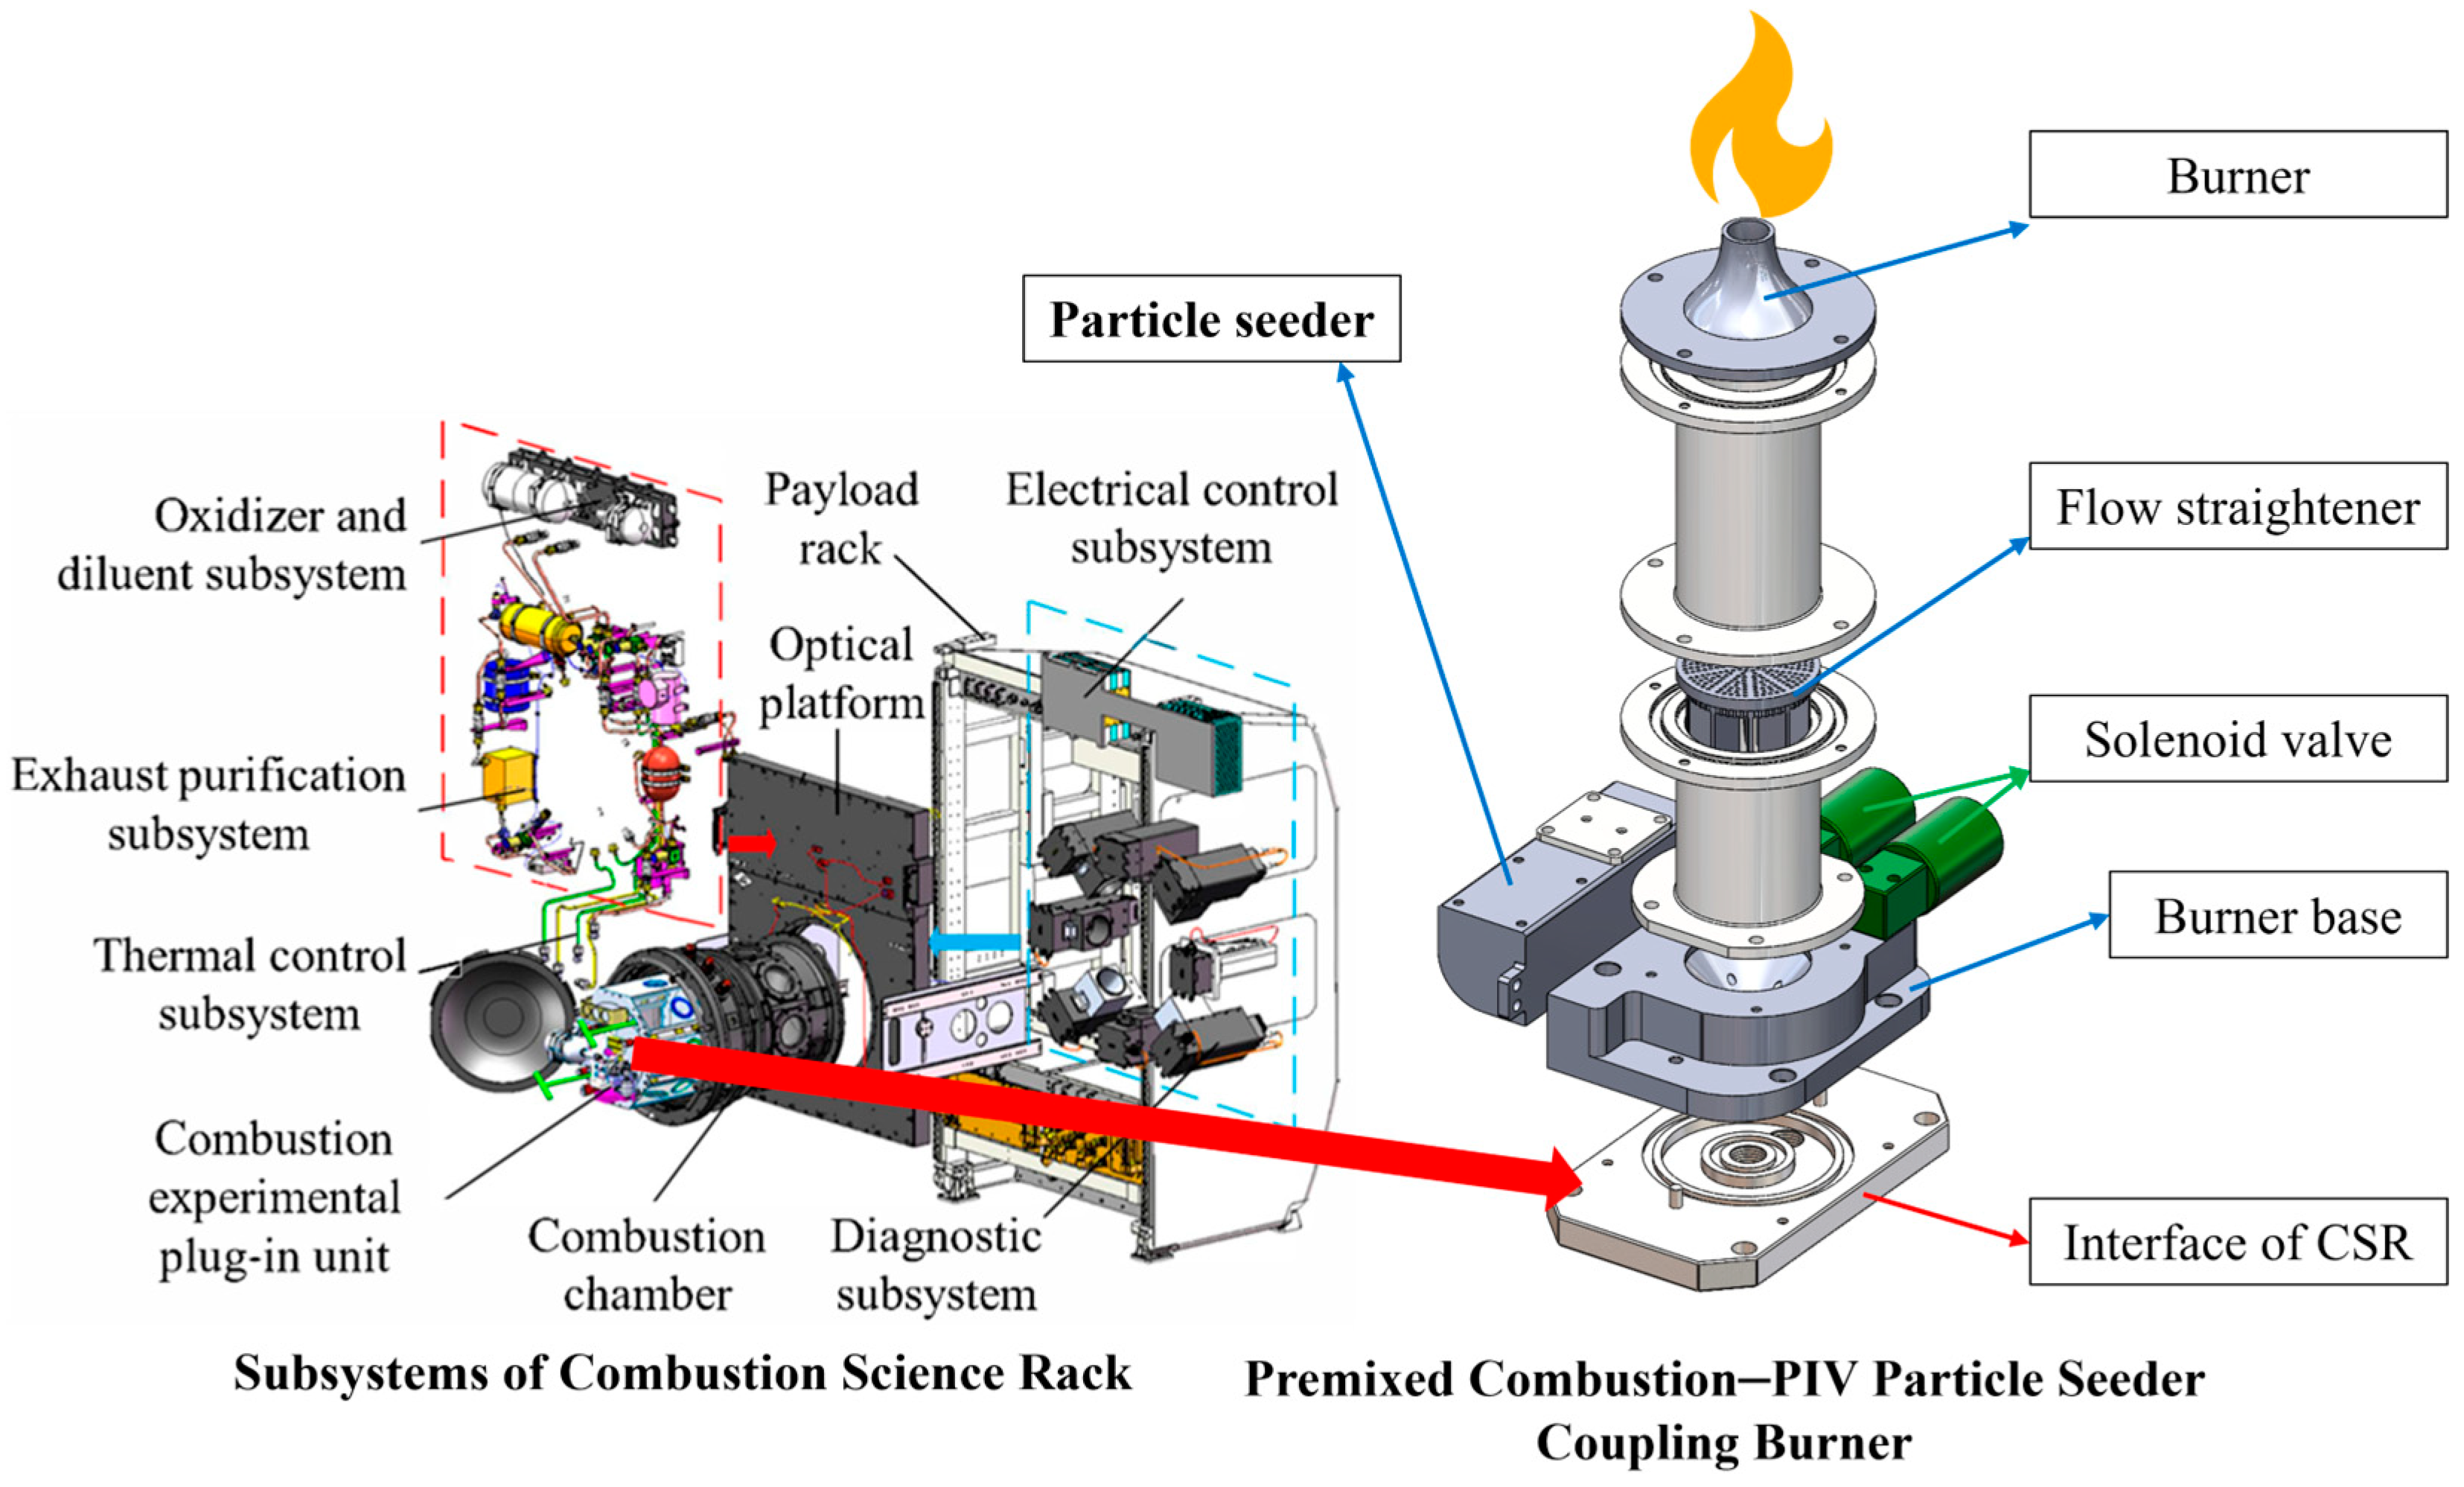
2.1. Structure and Working Principle of the PIV Particle Seeder–Premixed Combustion Coupling Burner

As shown in Figure 1, the Combustion Science Experimental System (CSES) currently includes a gas experiment module, which provides an internal interface allowing research teams to customize combustion experimental devices based on their specific scientific requirements. Our team designed a PIV Particle Seeder–Premixed Combustion Coupling Burner, primarily intended for conducting ground-based PIV validation experiments on premixed combustion, aiming to develop PIV technology applicable to microgravity combustion experiments in the CSS-CSES.
The coupling burner consists of three main components: Burner Base—this includes two solenoid valves, responsible for distributing fuel and oxidizer at a controlled ratio to the coupling burner; Premixed Burner—this contains a flow straightener to ensure a uniform flow field before combustion; the combustible gas mixture will be ignited after exiting the burner nozzle; Particle Seeder—this supplies granular flow containing tracer particles for PIV diagnosis.
This study primarily focuses on the Particle Seeder component, analyzing its operational characteristics and performance in generating uniform tracer particle aerosols for flow visualization.

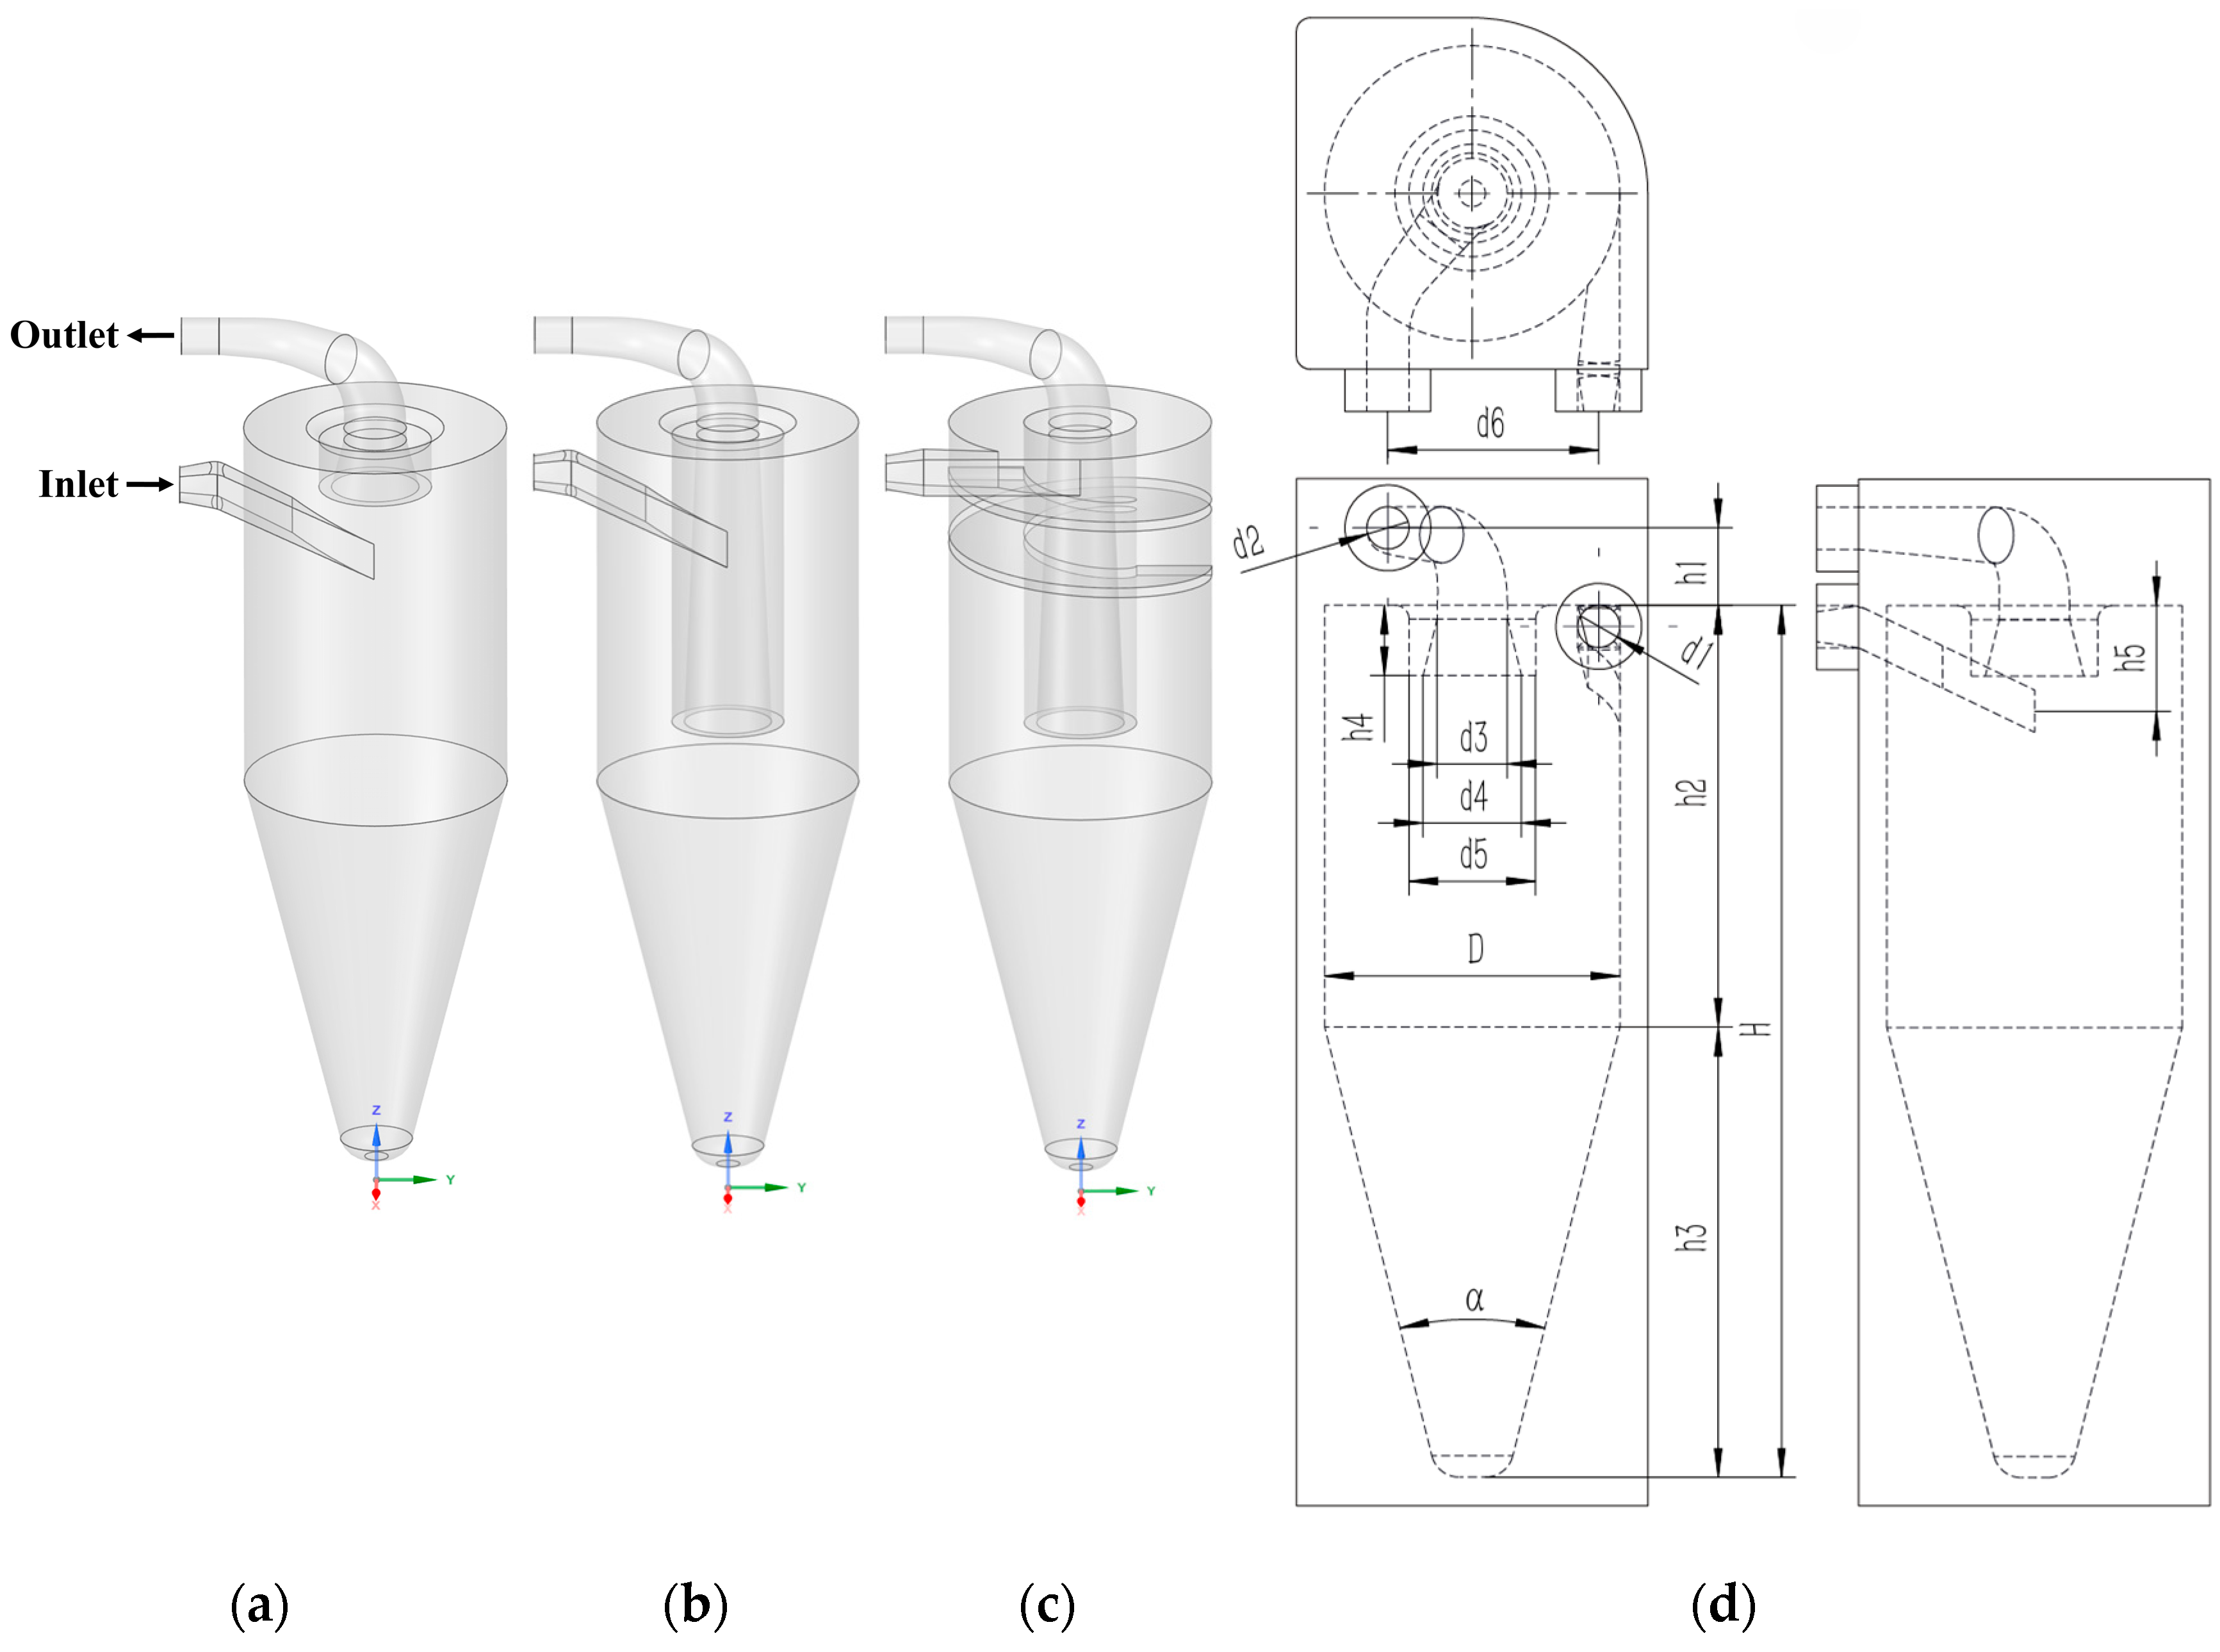
2.2. The Geometrical Model

In the optimization design of traditional cyclone separators, both an extended vortex finder and the addition of a guide vane can enhance separation efficiency. Therefore, this study applies these optimization strategies to design three different seeder geometries: Model 1: a short vortex finder version; Model 2: a long vortex finder version; Model 3: a version based on a long vortex finder version, with an additional guide vane [25].
As illustrated in Figure 2a–c, these models are designated as Model 1, Model 2, and Model 3, respectively. The geometric dimensions are shown in Figure 2d, where
H = 69 mm, h1 = 7 mm, h2 = 30 mm, h3 = 32 mm, h4 = 5 mm/25 mm, h5 = 7.5 mm, D = 21 mm, d1 = 3 mm, d2 = 3 mm, d3 = 5 mm, d4 = 7 mm, d5 = 9 mm, d6 = 15 mm, and α = 30°. For Model 3, the guide vane forms 1.5 helical turns, with a pitch of 5.5 mm.

2.3. Gas Phase Turbulence Model

Although the cyclone particle seeder has a simple structure and is without active moving parts, the internal airflow exhibits highly complex, turbulent-dominated flow. Previous studies have demonstrated that the Reynolds Stress Model (RSM) can effectively simulate the internal flow field of cyclone separators [26,27,28], accurately predicting the anisotropy of turbulent stresses. Given the structural similarities between the two systems and both being turbulence-dominated flows, this study also employs the RSM turbulence model for gas-phase flow field simulations.
The governing equations of the RSM model are as follows:
Equation (1) represents the Continuity Equation:
ρ t + ρ U i x i = 0
where ρ is the fluid density and U i is the Reynolds-averaged velocity component.
Equation (2) represents the Reynolds-Averaged Navier–Stokes (RANS) Momentum Equation:
ρ U i t + ρ U i U j x j = p x i + x j μ U i x j x j ρ u i u j ¯ + ρ g i
where p is the time-averaged pressure, μ is the molecular viscosity, u i u j ¯ is the Reynolds stress, and ρ g i represents gravitational or other body force terms.
Equation (3) represents the Reynolds Stress Transport Equation:
ρ u i u j ¯ t + x k ρ U k u i u j ¯ = D i j + P i j + Π i j ϵ i j
where the two terms on the left-hand side correspond to the time derivative of the pressure term and the convective transport term, respectively. The four terms on the right-hand side are as follows:
The diffusion term D i j , which can be computed using Equation (4):
D i j = x k ρ u i u j u k ¯ + p δ k j u i + δ i k u j ¯ + x k μ x k u i u j ¯
The stress production term P i j , which can be obtained using Equation (5):
P i j = ρ u i u k ¯ u j x k + u j u k ¯ u i x k
The pressure–strain term Π i j , which can be obtained using Equation (6):
Π i j = p u i x j + u j x i ¯
The dissipation term ϵ i j , which is solved using the dissipation rate transport equation from the standard k ε model.

2.4. The Two-Phase Simulation Model

The Eulerian–Eulerian (E–E) method is a commonly used multiphase flow numerical simulation approach, in which all phases are treated as interpenetrating continuous media. This method has demonstrated high effectiveness in solving multiphase swirling flows [29].
In this study, the tracer particles are in the submicron scale and the particle bulk fraction is approximately 10%; a rough estimate suggests that around 1.5 × 10¹² titanium dioxide particles with a nominal diameter of 500 nm may be present within 1 cm3. Tracking each of these particles individually using a Lagrangian approach would result in an overwhelming computational burden. Therefore, given the extremely large number of particles implied by this estimation, the Eulerian–Eulerian method was adopted to reduce computational costs and ensure numerical feasibility.
According to a previous study [30], submicrometric particles in swirling flows are predominantly affected by the drag force exerted by the fluid, while other secondary forces, such as virtual mass force and lift force, have relatively minor effects, differing by 3 to 13 orders of magnitude. According to Ref. [31], among the various forces exerted on the particles, only gravity and buoyancy are affected by gravitational acceleration g , and both can be neglected under microgravity conditions theoretically. Therefore, in current study, only the drag force is considered in the particle force balance, along with the influence of gas-phase turbulence on particle motion.
Among various drag models, the Wen and Yu drag model [32] is suitable for cases where the solid-phase volume fraction αs less than 0.2, and it has been demonstrated to provide accurate predictions in numerical simulations [33]. Consequently, this study adopts the Wen and Yu drag model to characterize particle–fluid interactions.
Equation (7) represents the Continuity Equation for phase q:
t α q ρ q + α q ρ q v q = p = 1 n m ˙ p q m ˙ q p
where v q is the velocity of phase q, m ˙ p q and m ˙ q p are the mass flow rates from phase p to phase q and from phase q to phase p, respectively.
Equation (8) represents the Conservation of Momentum for phase q:
t α q ρ q v q + α q ρ q v q v q = α q p + τ ̿ q + α q ρ q g + p = 1 n R p q + m ˙ p q ν p q m ˙ q p ν q p + F s u m
where τ ̿ q is the stress–strain tensor for phase q; F s u m is the sum of all other forces acting on phase q, and R p q is the interphase interaction force, in the Wen and Yu drag model, which can be calculated using Equation (9):
R p q = R s l = K s l W e n & Y u v p v q
where K s l W e n & Y u is the interphase momentum exchange coefficient, which can be computed using Equation (10):
K s l W e n & Y u = 3 4 C D α s α l ρ l v s v l d s α l 2.65
where C D is the drag coefficient and can be obtained using Equation (11):
C D = 24 α l R e s 1 + 0.15 α l R e s 0.687 ,   R e < 1000 0.44 ,   R e 1000
where R e s is the solid-phase Reynolds number and can be obtained using Equation (12):
R e s = ρ l d s v s v l μ l

3. The Computational Domain Model

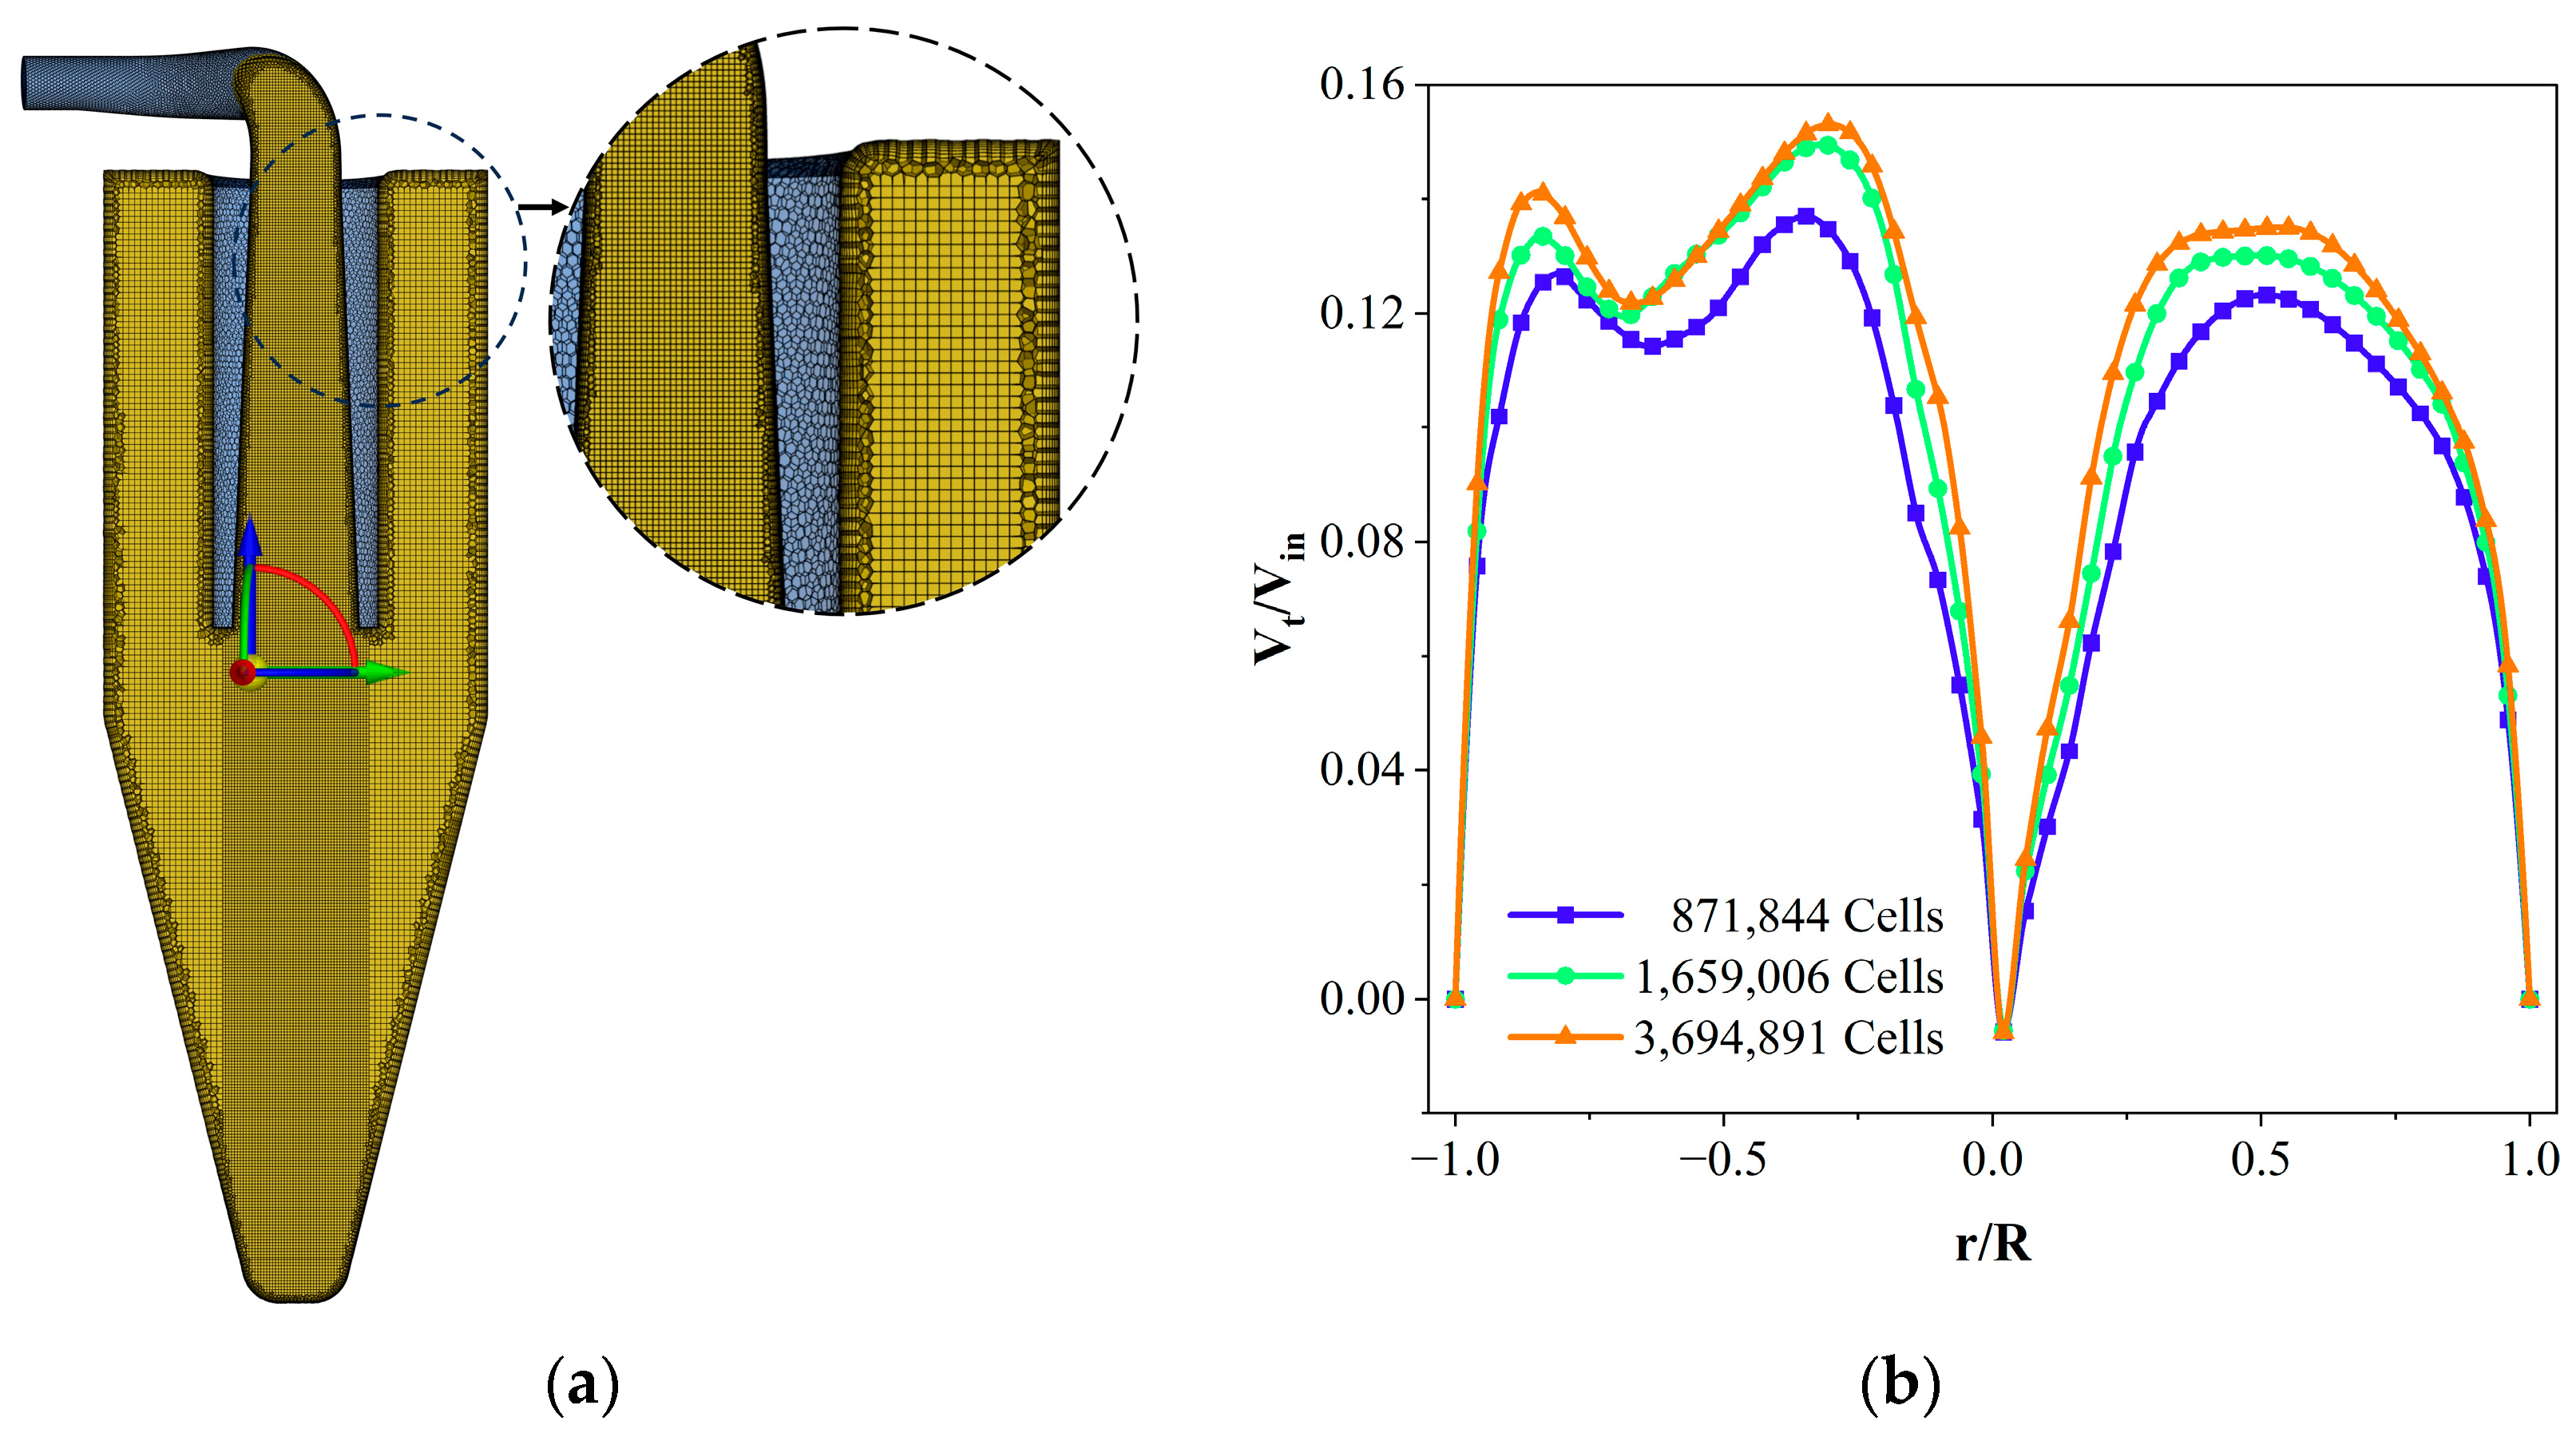
3.1. Grid Partition and Independence Check

To verify the grid independence of the computational domain, the Meshing module in ANSYS Fluent 2020 R2 was used for grid generation. The inlet, outlet, central axis, and boundary layer grids were locally refined to ensure that the solution accuracy remains within the acceptable engineering error range. The structured grid is shown in Figure 3a.
Three different grid resolutions (871,844, 1,659,006, and 3,694,891 cells) were selected for grid independence analysis. Under an inlet airflow velocity of 11.79 m/s, the tangential velocity coefficient distribution at the cylinder–cone interface was compared.
As shown in Figure 3b, when increasing the grid size from 871,844 to 3,694,891, minor variations in the tangential velocity coefficient distribution were observed. The relative error between the 871,844-cell case and the 1,659,006-cell case was 10.51%, while that between the 1,659,006-cell case and the 3,694,891-cell case was 6.63%.
Considering the subsequent two-phase flow simulations, the 1,659,006-cell grid and its corresponding grid refinement strategy were selected to balance computational accuracy and efficiency. Average cell orthogonal quality was 0.98, suitable for numerical simulation.

3.2. Boundary Conditions and Solving Methods

In this study, 500 nm rutile titanium dioxide (TiO₂) particles were selected as the tracer particles, with a particle density of 4.23 g/cm3. Based on the data given by the supplier and experimental validation, the bulk fraction of the particles under normal gravity was determined to be 0.1.
Three distinct scenarios (Scen hereafter) were designed for simulation, as summarized in Table 1:
Scen 1 simulates ground-based normal gravity experimental conditions, while Scen 2 is designed to serve as a comparison with Scen 1 in order to evaluate the influence of gravity. Scen 3 represents the microgravity environment aboard the China Space Station (CSS). In this scenario, after the seeder is transported to the space station, tracer particles inside are expected to disperse upon external mechanical perturbation—a common practice used in ground-based PIV experiments to enhance the particle release mass flow rate.
A total of 12 simulations were conducted: 3 steady-state simulations for different device configurations, focusing on the gas-phase flow field, and 9 transient gas–particle two-phase simulations, accounting for different gravity conditions, particle accumulation states, and device configurations.
The boundary conditions were set as follows: The inlet boundary condition was set to velocity inlet, with an inlet velocity of 11.79 m/s, calculated from an airflow rate of 4.71 L/min. The outlet boundary condition was set to pressure outlet, with 1 atm. The temperature was set to 300 K. The turbulence intensity was calculated using the following empirical equation: I = 0.16 ( R e D ) 1 / 8 [34]; this yielded a turbulence intensity of 6.1%. The Non-equilibrium Wall Functions approach was applied to handle wall boundary conditions.
For gas-phase simulations, the SIMPLE algorithm was employed for pressure–velocity coupling. For two-phase flow simulations, the Phase-Coupled SIMPLE algorithm was used. The PRESTO! scheme was adopted for pressure interpolation, while the QUICK scheme was adopted for all convective terms.
The simulation process was conducted in ANSYS Fluent. Steady-state simulations were first performed to analyze the internal flow field of the particle seeders, and calculate 10,000 iterations. Transient two-phase flow simulations were then conducted using the Eulerian multiphase model, with a time step of 10−5 s, and 100 iterations were performed per time step.
For two-phase flow simulations, the domain was initialized first, followed by cell registers and patch to establish different particle accumulation conditions at the bottom of the computational domain.

3.3. Validation of the Computational Model

The accuracy of the computational model was verified by measuring the pressure drop, a critical parameter in cyclone separators [35,36,37]. To verify the accuracy of the computational model developed for the cyclone particle seeder, pressure drop measurements were conducted using three metal seeders manufactured via metal 3D printing. According to the manufacturer, the internal surface roughness of the seeders is approximately Ra 8. When the experimental inlet and outlet boundary conditions were set to match those in the numerical model, a U-tube manometer was employed to measure the pressure drop across each seeder.
Since the minimum scale interval of the U-tube manometer is 10 Pa, the readings were rounded to the nearest multiple of 10 Pa. The measurement results are presented in Figure 4. The maximum deviation between the measured values and simulation results was 5.9%, while the minimum deviation was only 2.0%, with an average deviation of approximately 4.5%. The observed deviation between the simulation and experimental results can be attributed to both machining precision, experimental measurement limitations and uncertainties inherent in the numerical model, including mesh discretization error, turbulence model assumptions, and boundary condition approximations, etc. Even so, the simulation results show good agreement with the experimental data, within an acceptable margin of uncertainty.
These results demonstrate that the computational model accurately captured the internal flow characteristics of the cyclone particle seeders.

4. Experiment Setup

Due to the ground-based mirror system being occupied with other normal-gravity reference experiments for comparison with in-orbit microgravity experiments, a new experimental platform was established to replicate the PIV subsystem of the Combustion Science Experiment System (CSES), as shown in Figure 5. This setup follows the same design principles, with only minor variations in component specifications and layout, including the camera, lens, laser, and piping.
During PIV experiments, the laser beam path and camera optical axis were arranged perpendicularly, with the burner outlet central axis positioned at their intersection. This configuration ensured that the tracer particles were illuminated by the laser sheet, allowing the camera to capture a two-dimensional flow field image.
Since the experimental platform is still under construction, the current experiment focused only on normal gravity PIV tests, including the cold jet flow PIV experiment and the methane–air premixed combustion experiment at an equivalence ratio of 1.1.
For the cold jet flow experiment, the total air mass flow rate was 4.71 L/min, corresponding to an exit velocity of theoretically 1.0 m/s at a 10 mm circular nozzle.
For the premixed combustion experiment, the total gas volumetric flow rate was also 4.71 L/min, consisting of 4.22 L/min air and 0.49 L/min methane. Both experiments were conducted under ambient temperature and pressure conditions.
During the PIV experiment, a narrowband optical filter (532 ± 2.5 nm) was installed in front of the camera to eliminate environmental noise interference. The detailed experimental equipment operating parameters are listed in Table 2.

5. Results and Discussion

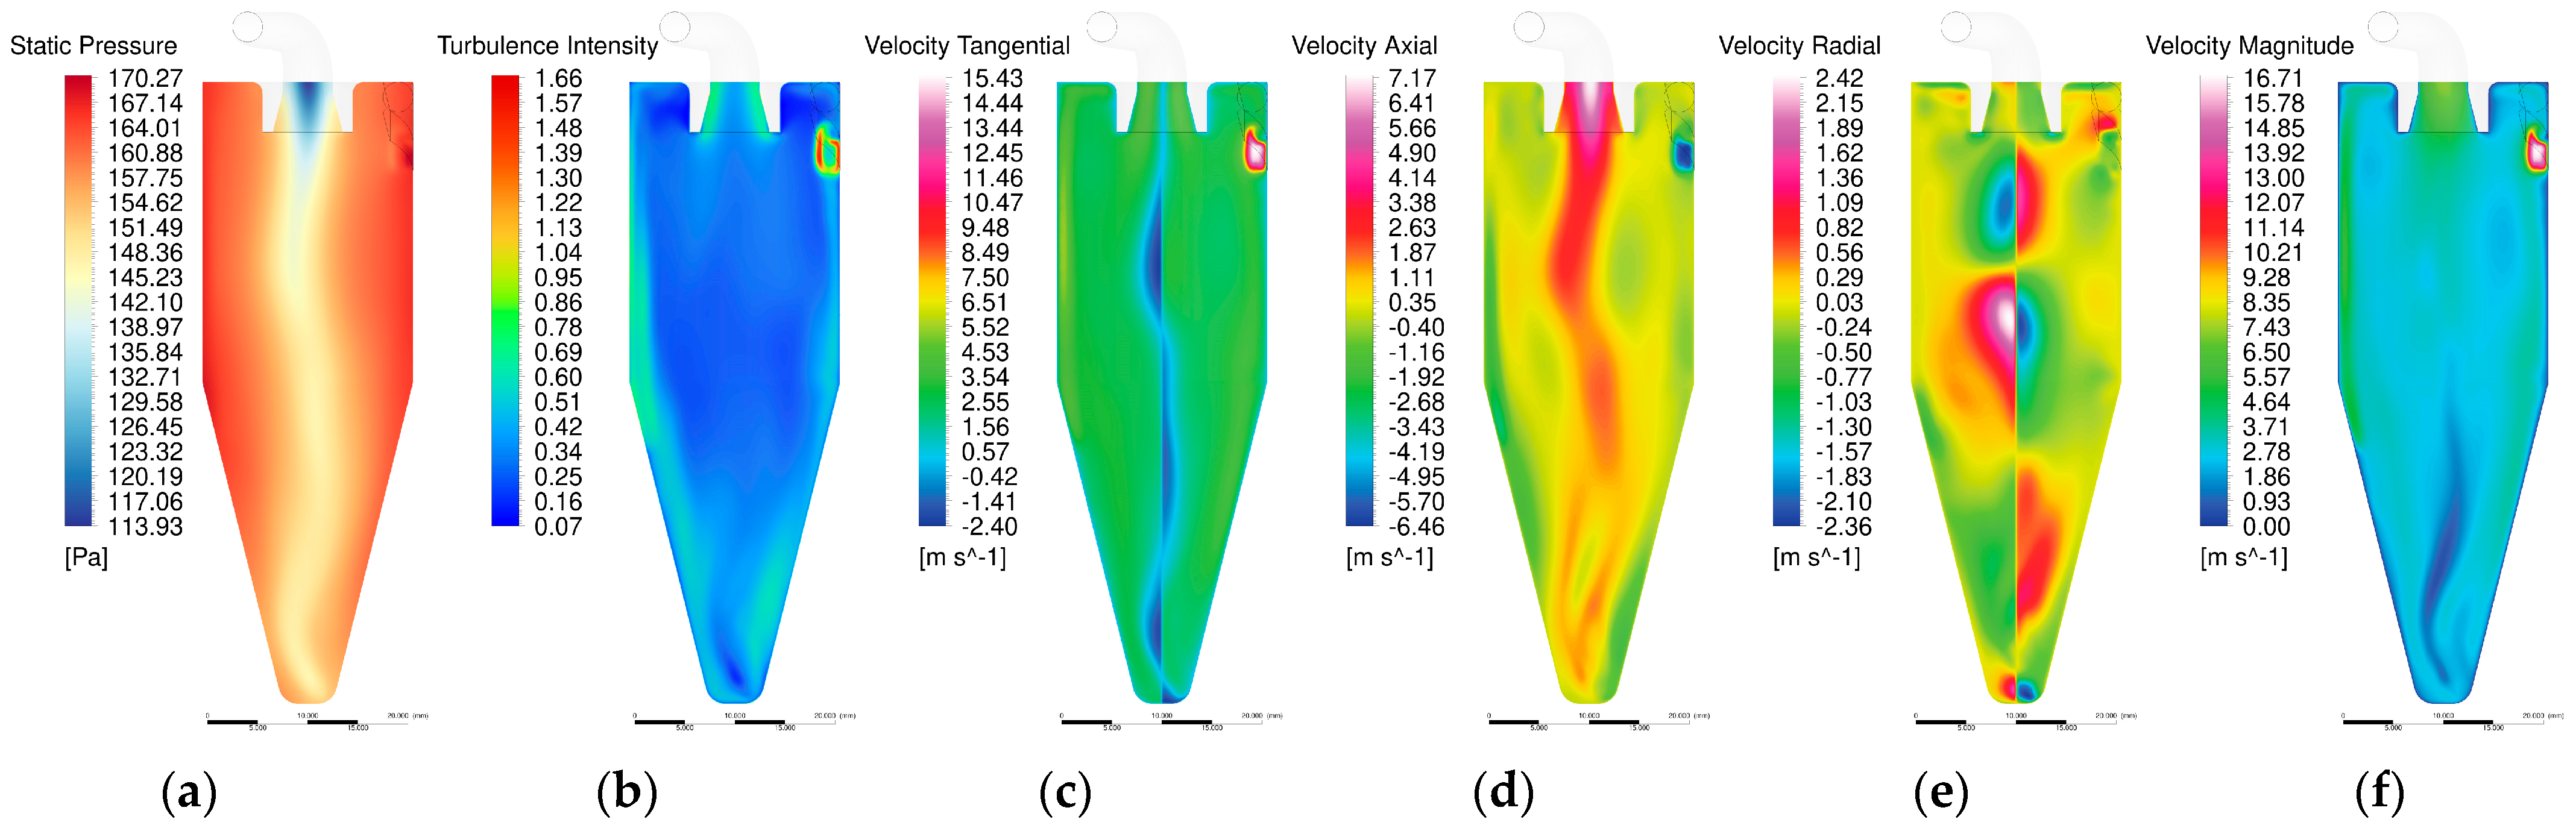
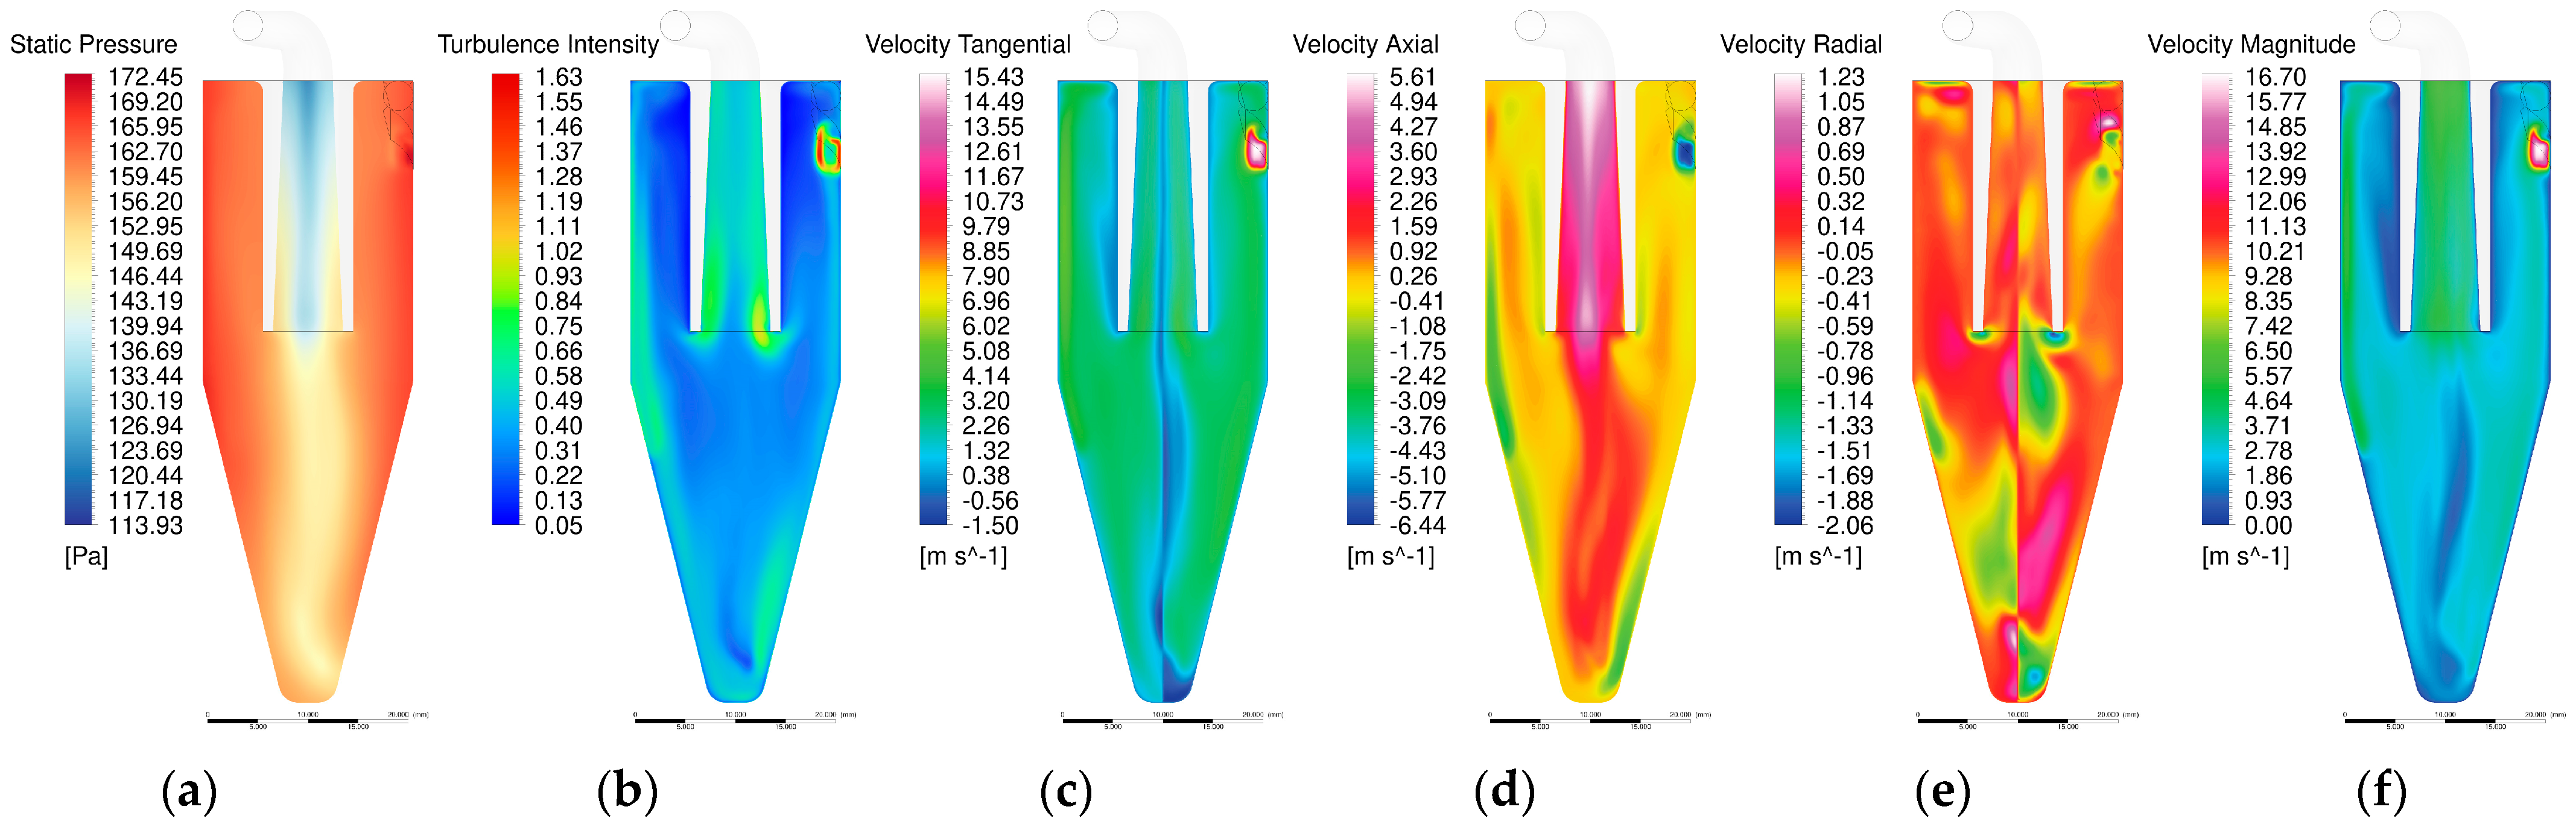
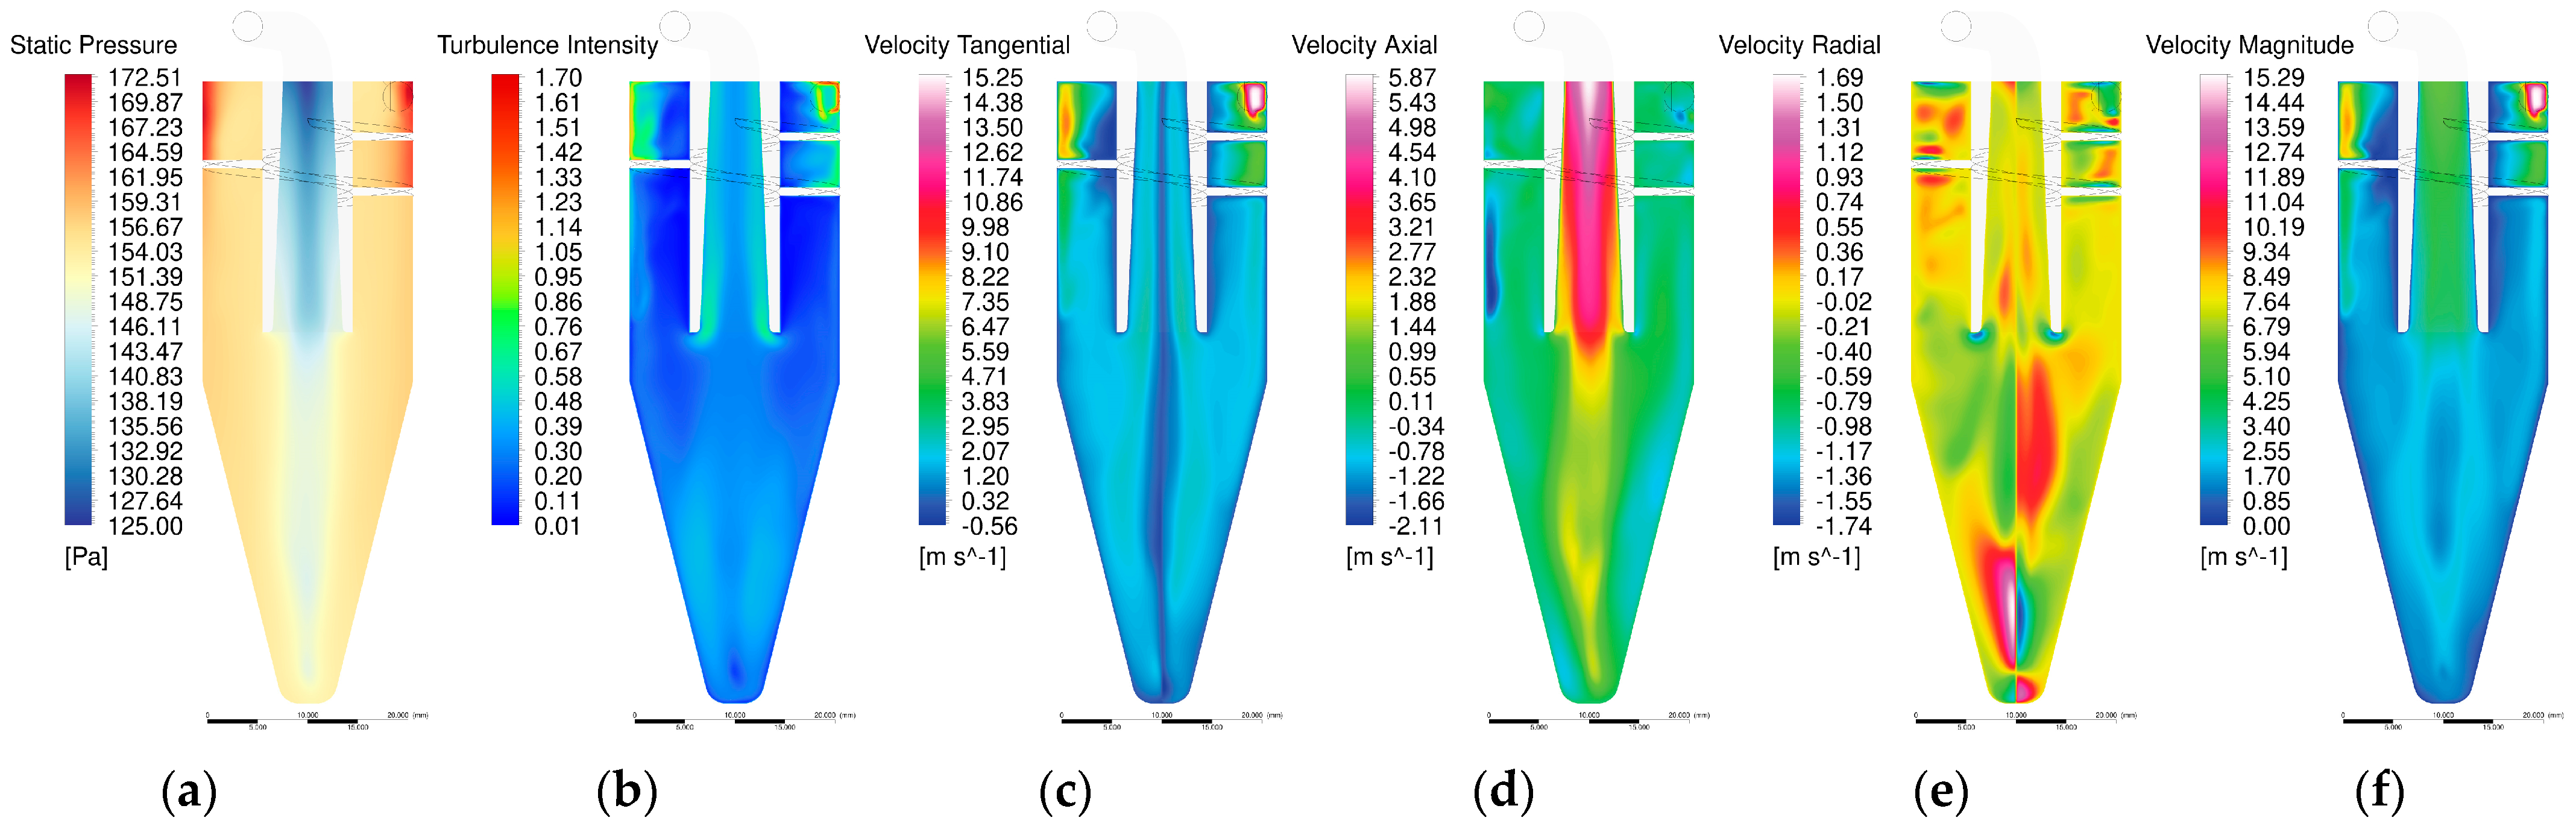
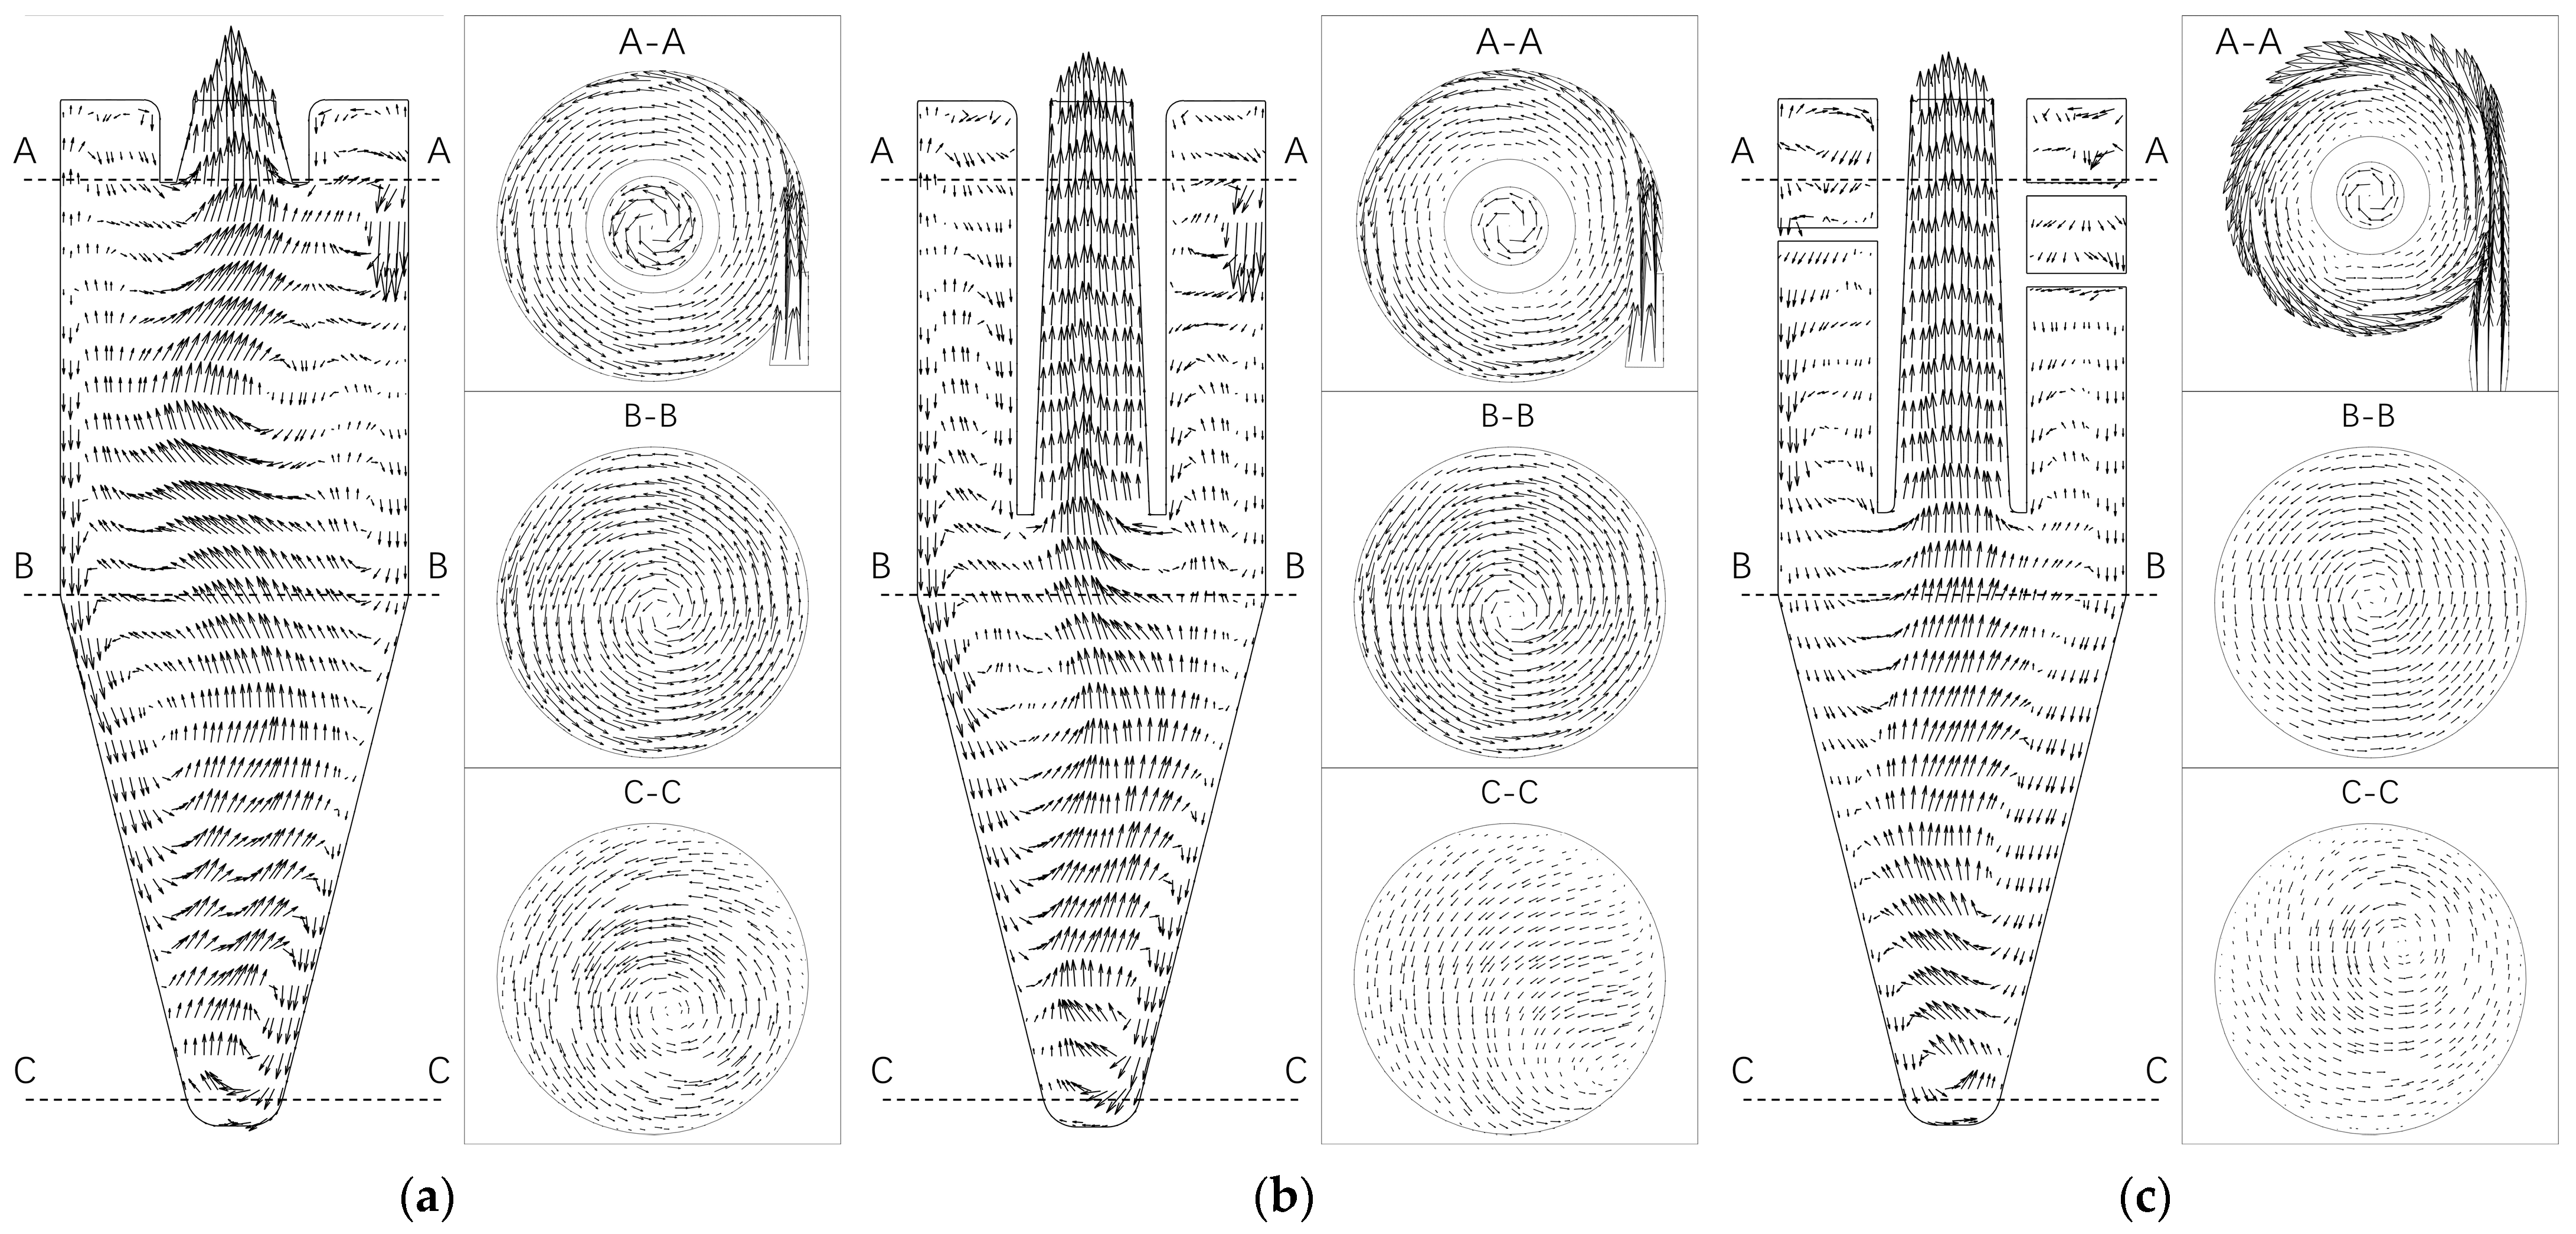
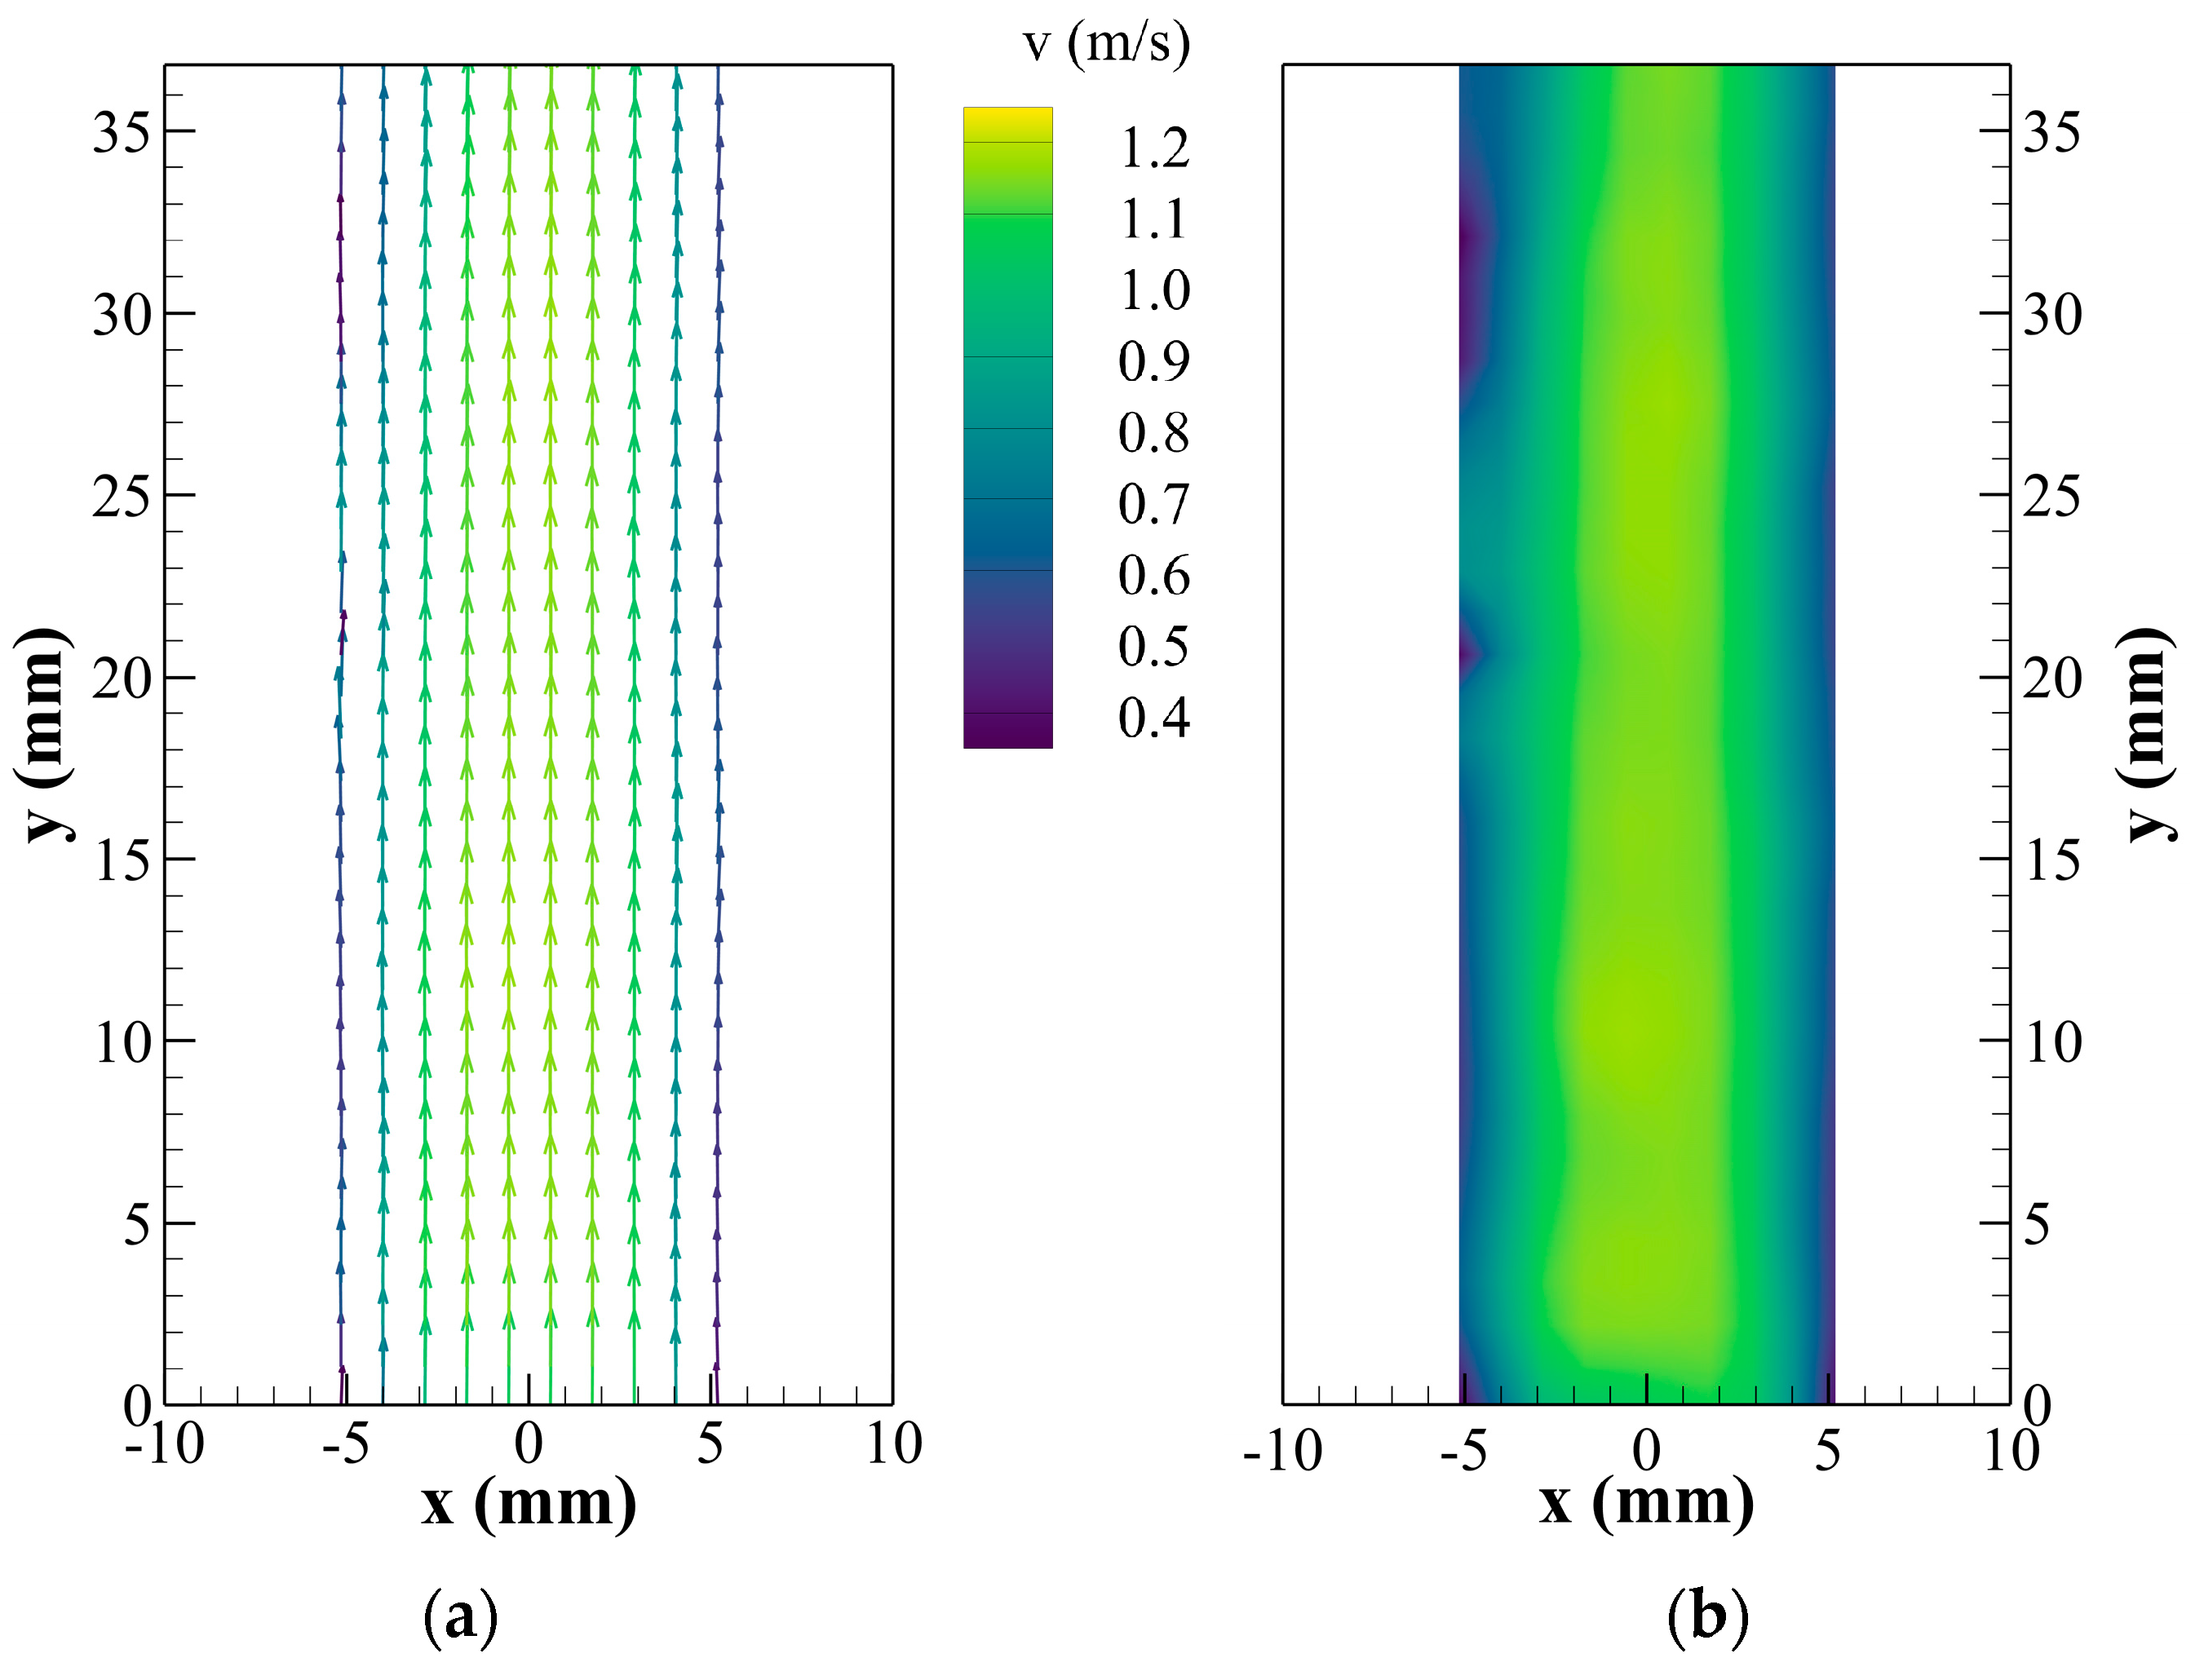
5.1. Steady Flow Field in Different Seeder Geometries

Figure 6, Figure 7 and Figure 8 illustrate the influence of different device geometries on the internal flow field.
First, according to the static pressure distribution, the static pressure of Model 1 and Model 2 gradually decrease radially inward, with a steeper pressure gradient near the central axis. This is likely due to the presence of a forced vortex region, where high-intensity airflow generates greater pressure gradients. Along the axial direction, static pressure variations are relatively small.
Second, the turbulence intensity contour plots indicate that high-turbulence regions are observed at the outer wall, the lower-middle section of the conical segment, and the inner wall of the vortex finder. This suggests that airflow in these regions exhibits strong turbulent motion, increasing the likelihood of short-circuit flow, which refers to the portion of the flow that bypasses the main circulation path and exits the system prematurely without fully participating in the intended flow process. In contrast, the upper section of the conical segment and the upward flow region show lower turbulence intensity, which may be attributed to the absence of geometric features that force abrupt changes in the flow direction, resulting in relatively smooth flow paths and more stable gas motion.
Third is the velocity distribution. The tangential velocity fields of Model 1 and Model 2 are generally similar. However, for axial velocity, the longer vortex finder (Model 2) exhibits a greater velocity gradient near the central axis. This indicates a stronger axial flow acceleration in that region, which, combined with the extended vortex finder, increase the volume of airflow being guided and extracted through the vortex finder. In the shorter vortex finder (Model 1), axial velocity reduction is observed both upstream and downstream of the conical segment. Regarding radial velocity, the shorter vortex finder exhibits a distribution similar to that of traditional cyclone separators [33], where maximum radial velocity occurs before the airflow enters the conical segment. Combined with axial velocity contours, radial velocity significantly influences particle transport, particularly affecting particle uplift and release from the bottom region. The longer vortex finder effectively mitigates excessive radial velocity variations before and after entering the conical segment, which may improve particle dispersion characteristics.
Compared to Model 1 and Model 2, Model 3 exhibits the following differences: It has higher pressure gradients inside the guide vane channels, with high-pressure regions concentrated within the guide vane passages, while other regions exhibit a more uniform pressure distribution. It also has greater flow symmetry outside the guide vane structure, but lower tangential velocity within the conical segment compared to the first two models. Maximum radial velocity appears in the lower half of the conical segment, which may enhance particle mixing performance. However, the axial velocity in this region is lower than that of Model 2, necessitating further analysis through two-phase flow simulations to evaluate its impact on particle outflow performance.
Figure 9 illustrates the velocity vector of flow in the XZ plane for different device configurations.
In Model 1 and Model 2, which lack the guide vane, a significant presence of longitudinal recirculation can be observed. Combined with the velocity distribution contours, wall contraction at the bottom of the device enhances frictional effects on the airflow, leading to forced flow reversal. This results in sudden flow variations, forming eccentric recirculation. These phenomena suggest that cyclone particle seeders without a guide vane can promote particle–airflow mixing. However, short–circuit flow is observed at the vortex finder inlet, meaning that some of the airflow exits the device before fully mixing with the particles, potentially reducing mixing efficiency.
Previous numerical simulations of conventional cyclone separators have identified a negative pressure zone along the central axis [38]. However, in the cyclone particle seeder investigated in this study, no negative pressure zone was observed along the central axis. Additionally, a study reported the presence of three distinct flow structures within conventional cyclone separators [30], including two downward flows: one along the outer wall and another along the central axis, as well as one upward flow located near the wall of the vortex finder.
Only two primary flow structures were present: a downward flow along the outer wall and an upward flow near the central axis.
These differences can be attributed to geometric modifications, such as the curved outlet and the absence of a dust hopper at the bottom, as well as the combined effects of boundary conditions and geometric parameters.
Model 3, which incorporates guide vanes, effectively reduces short-circuit flow at the vortex finder inlet and enhances flow symmetry inside the device. However, airflow velocity outside the guide vanes is lower than in configurations without a guide vane. This reduction in velocity may be due to energy dissipation within the guide vane passages, resulting in lower kinetic energy in the external airflow region.

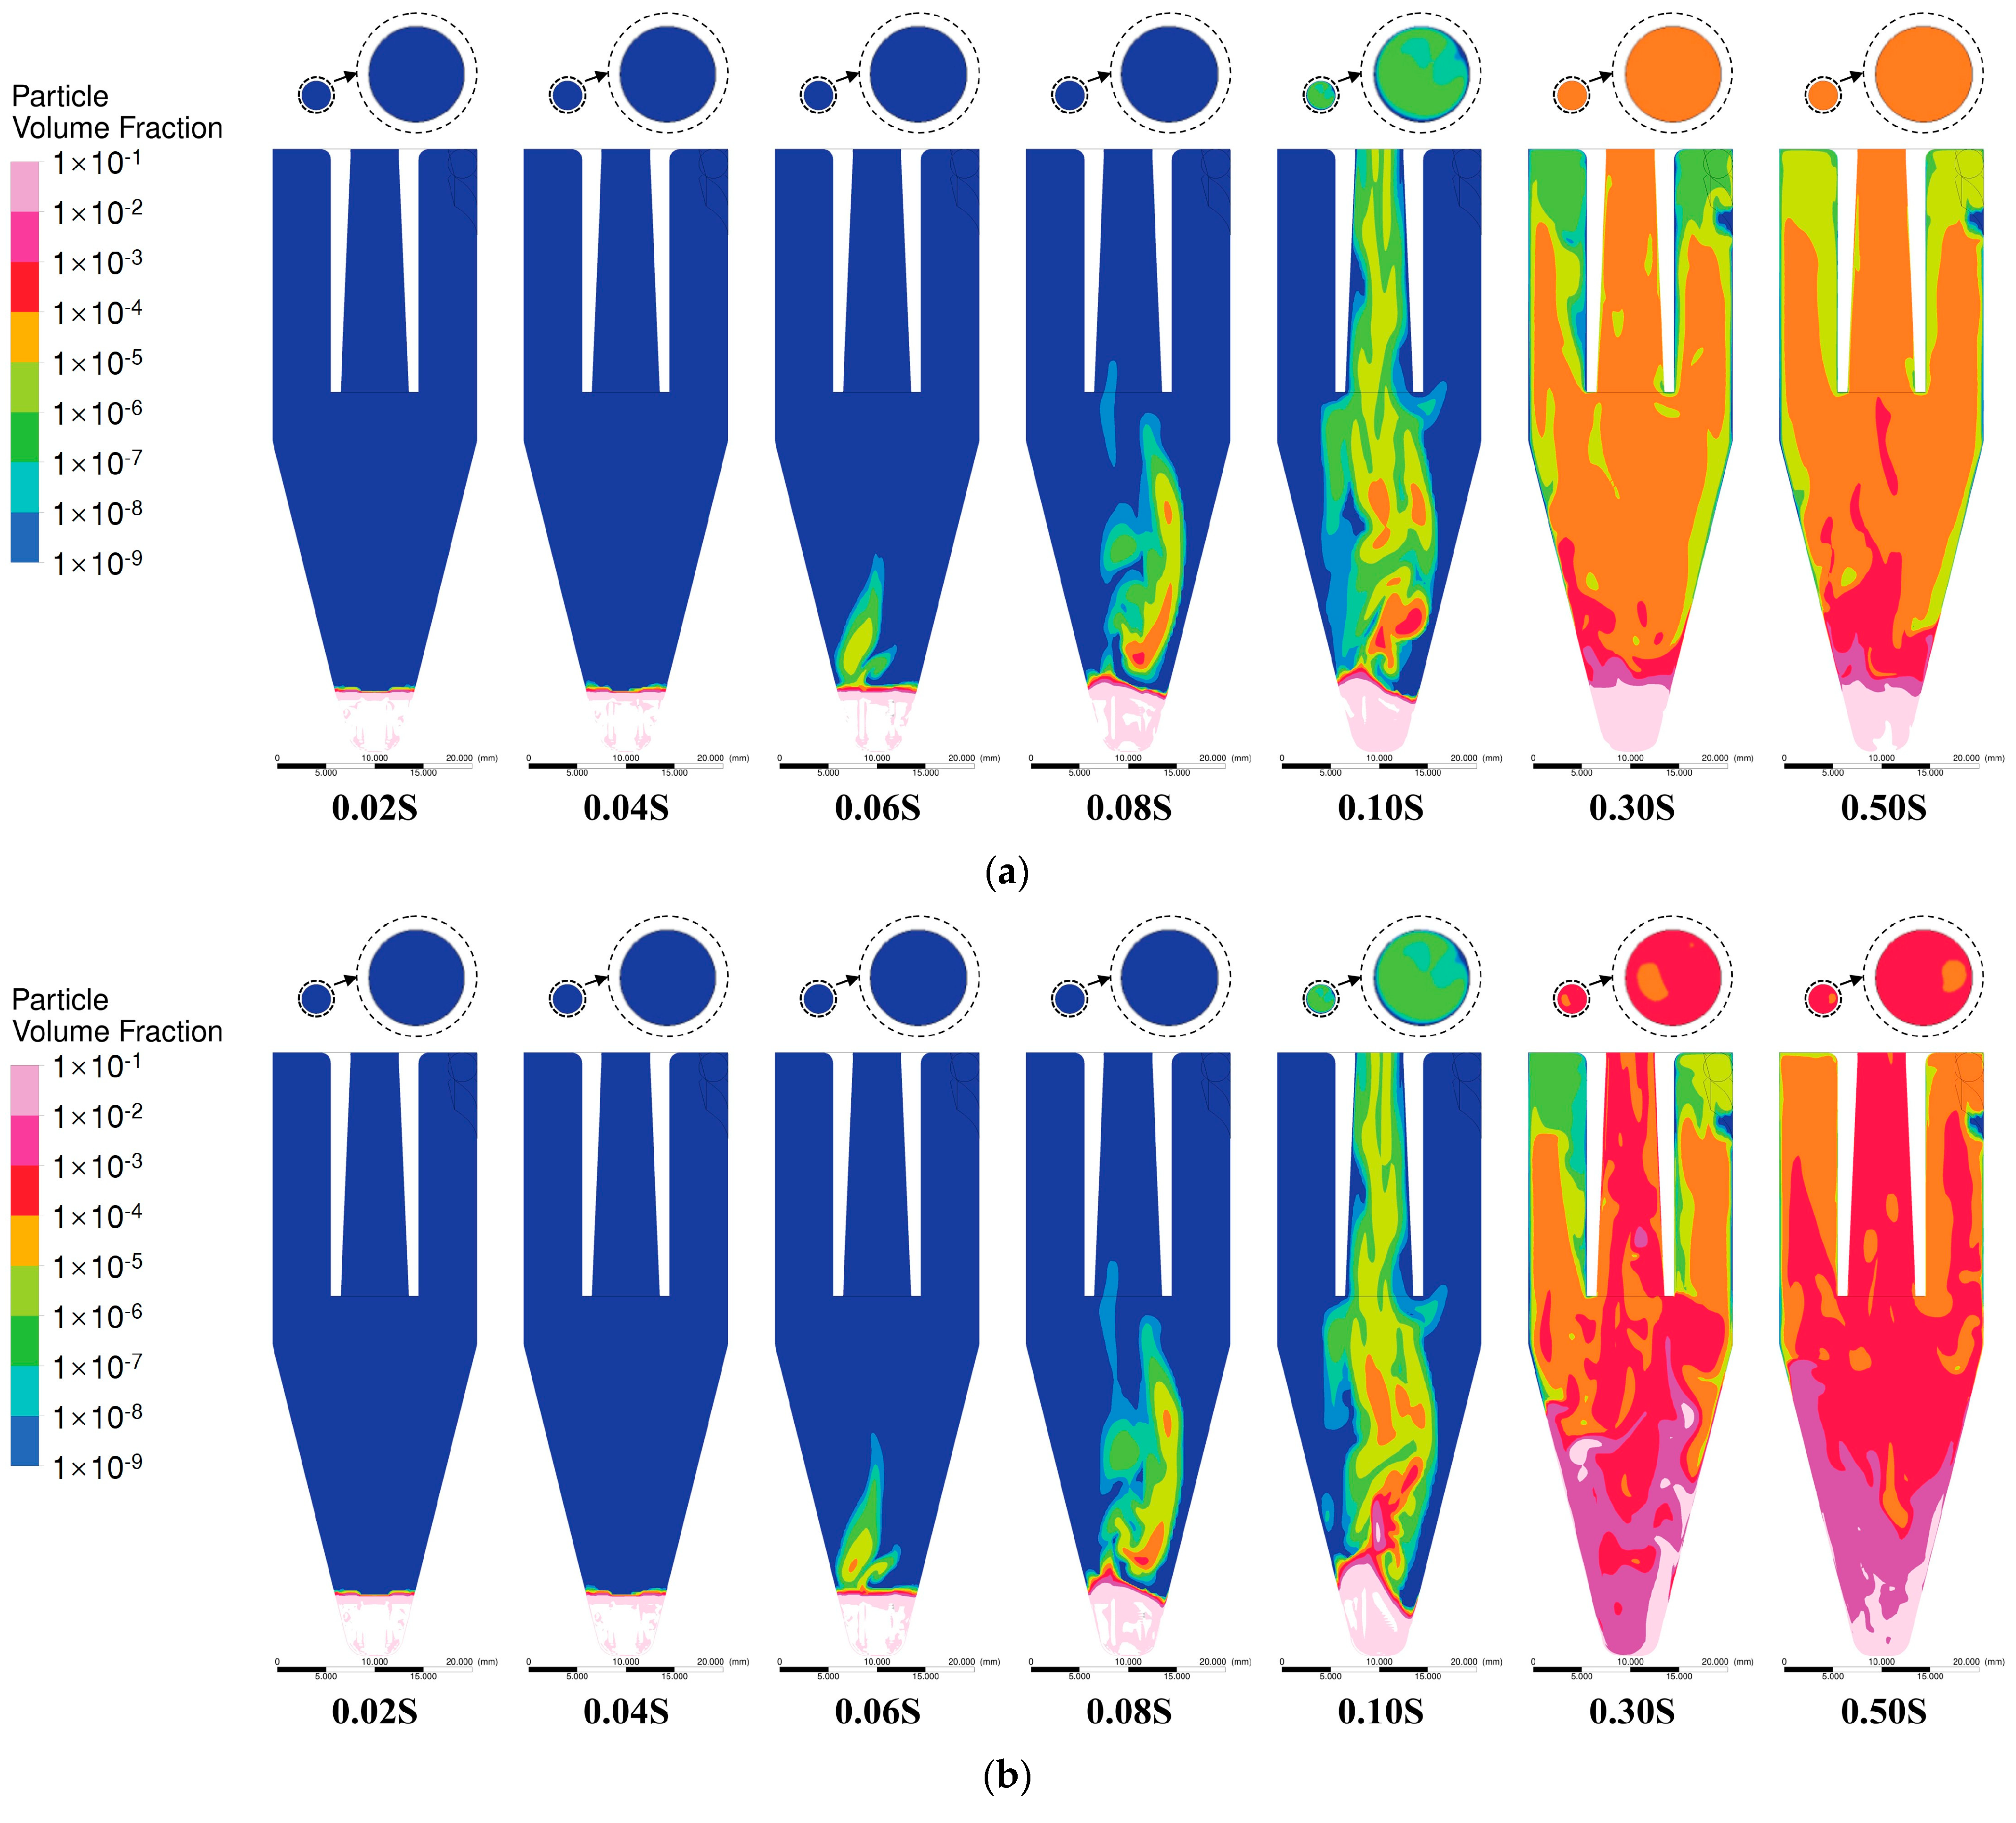
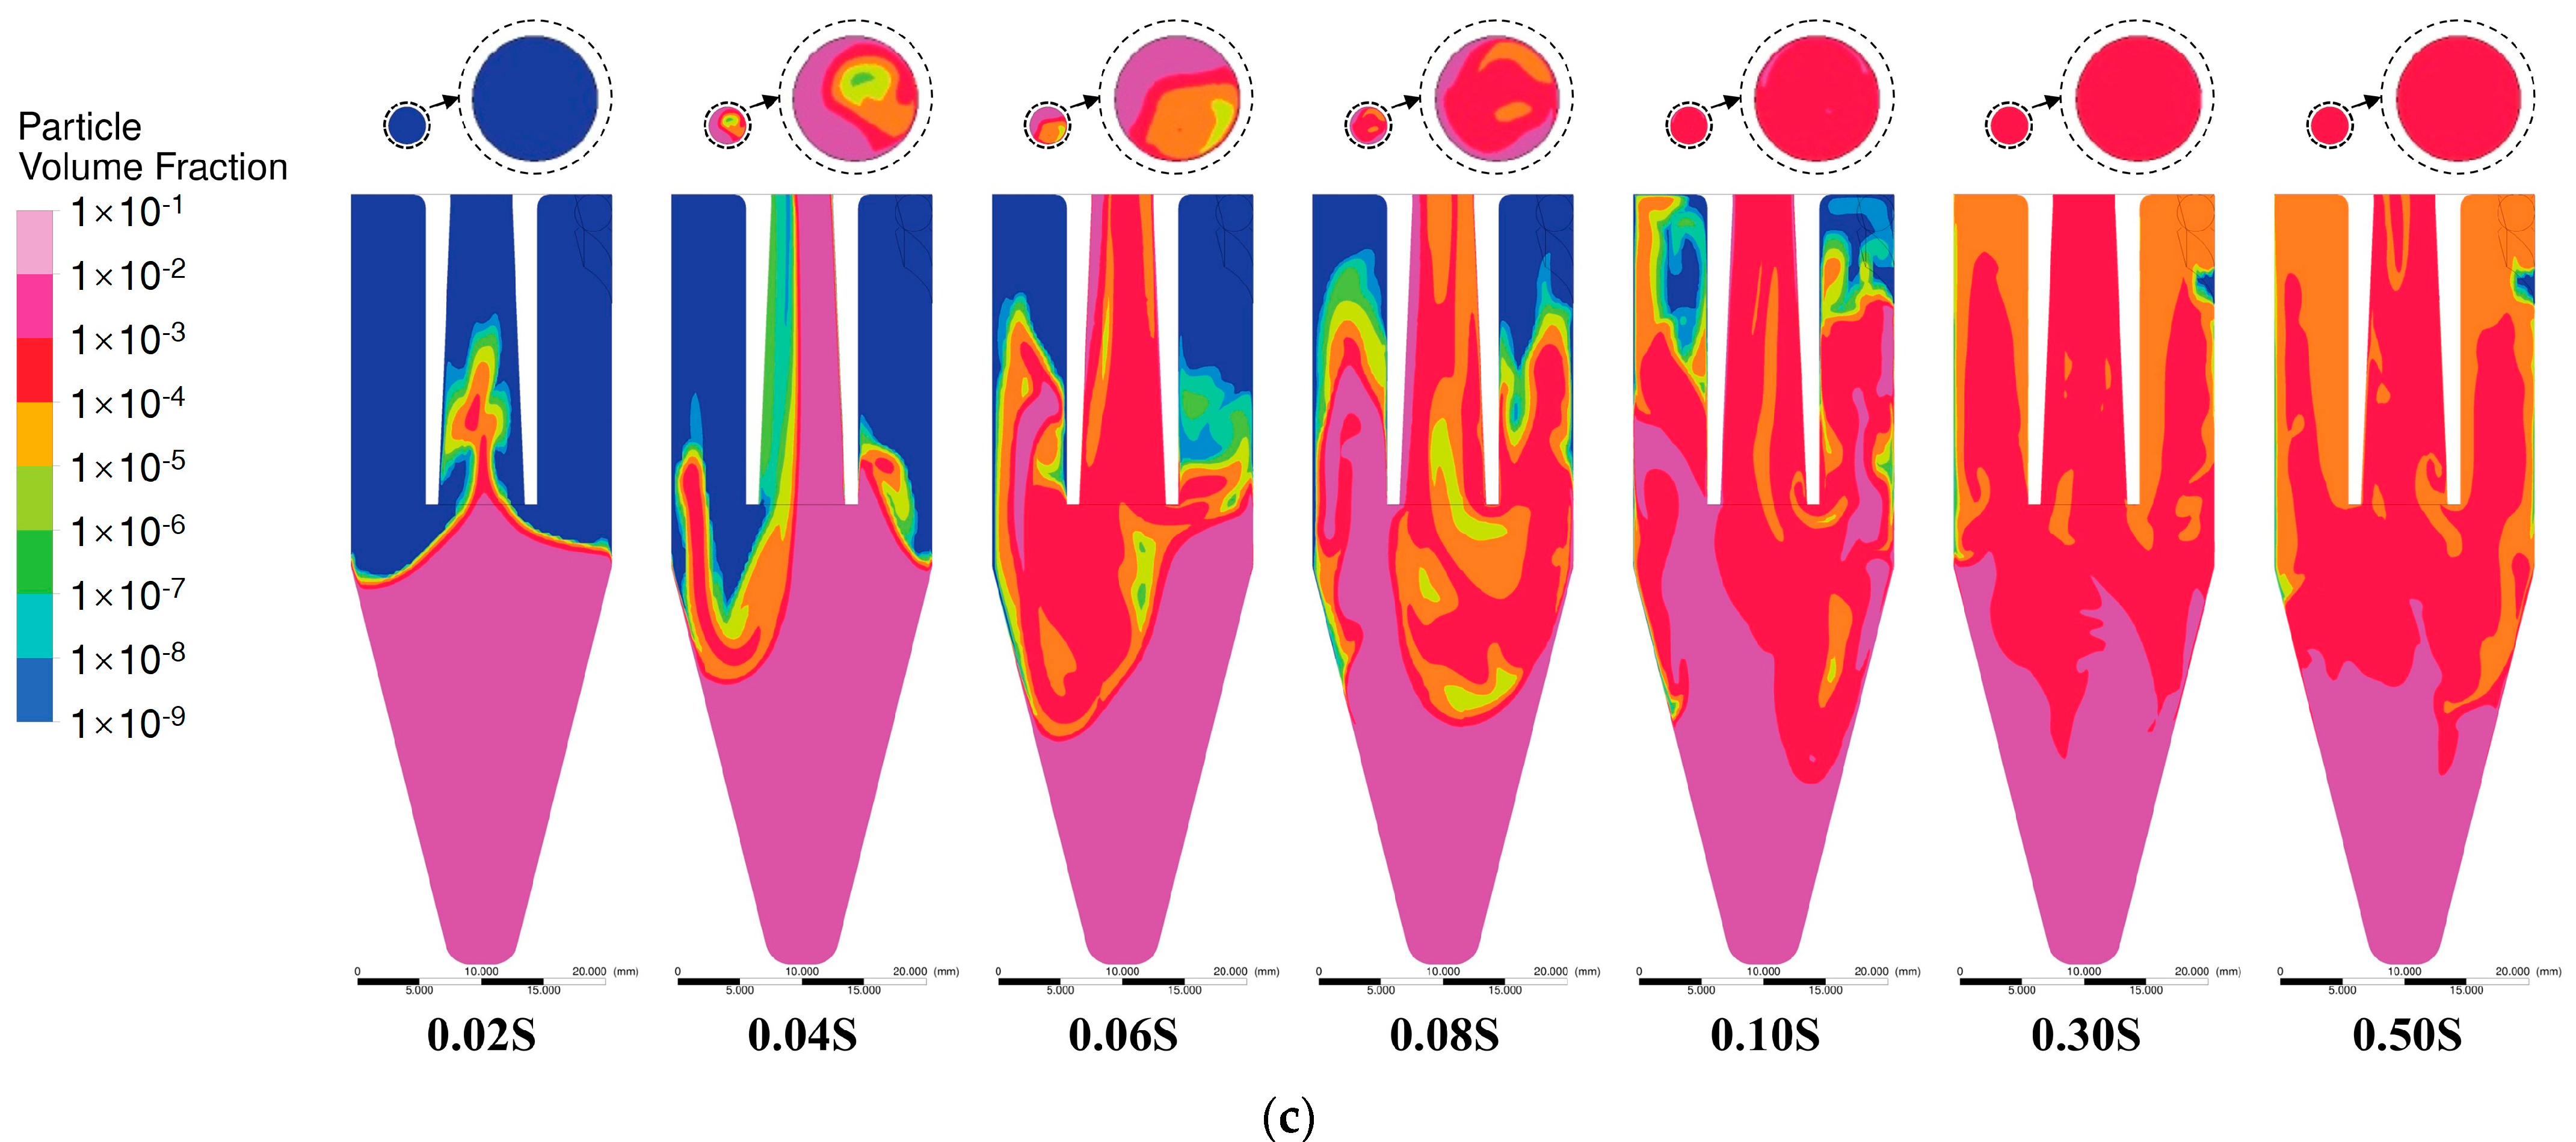
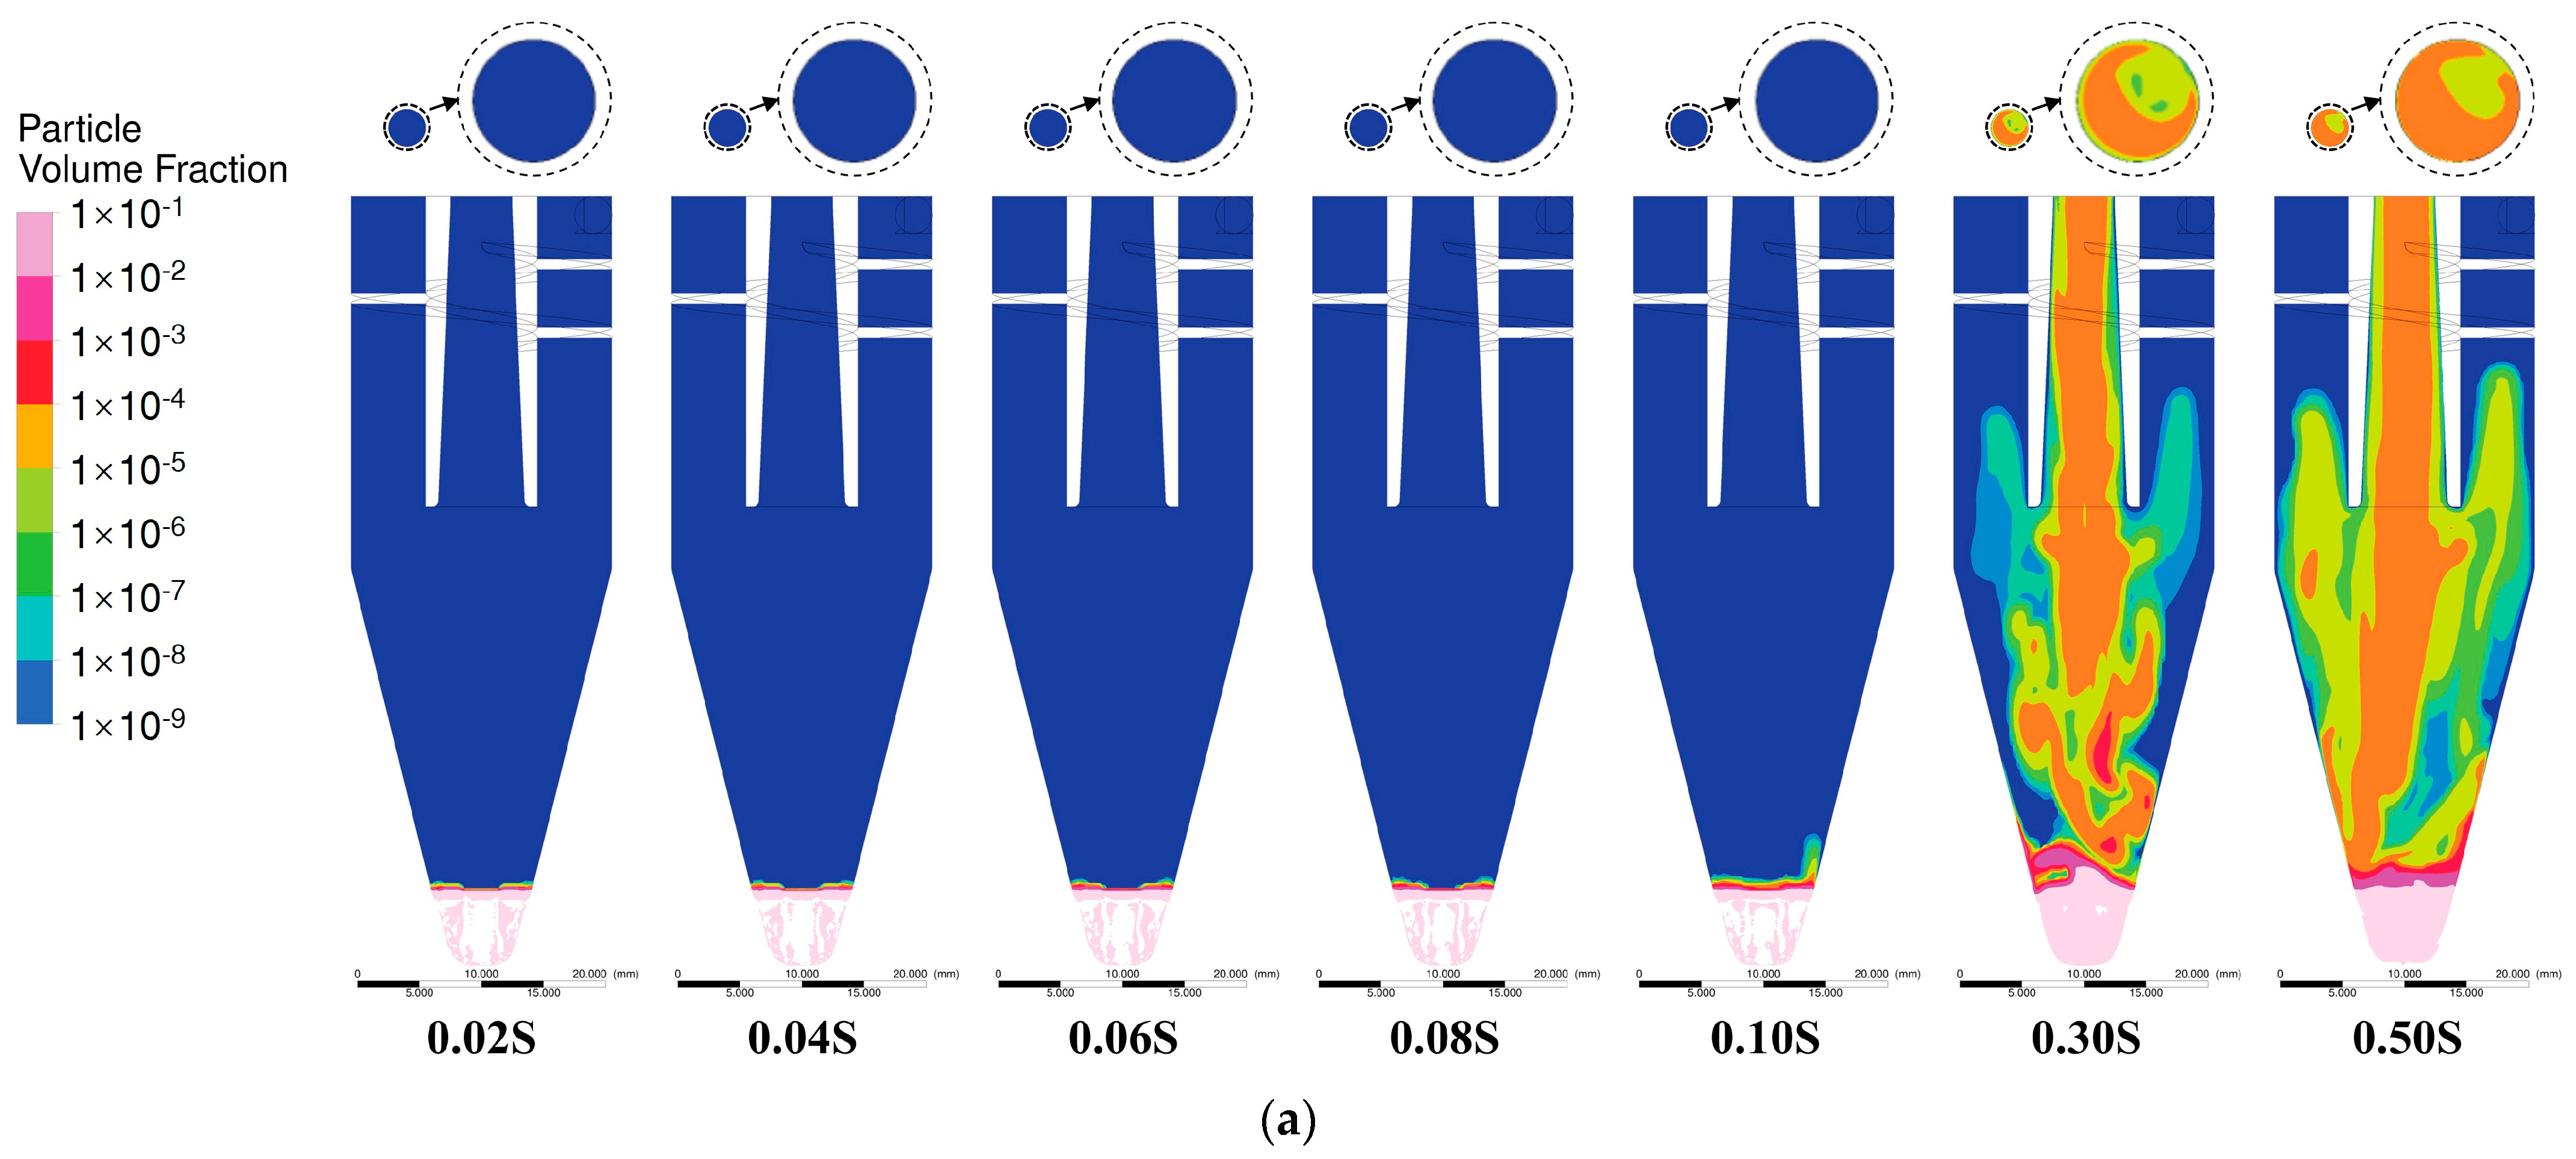
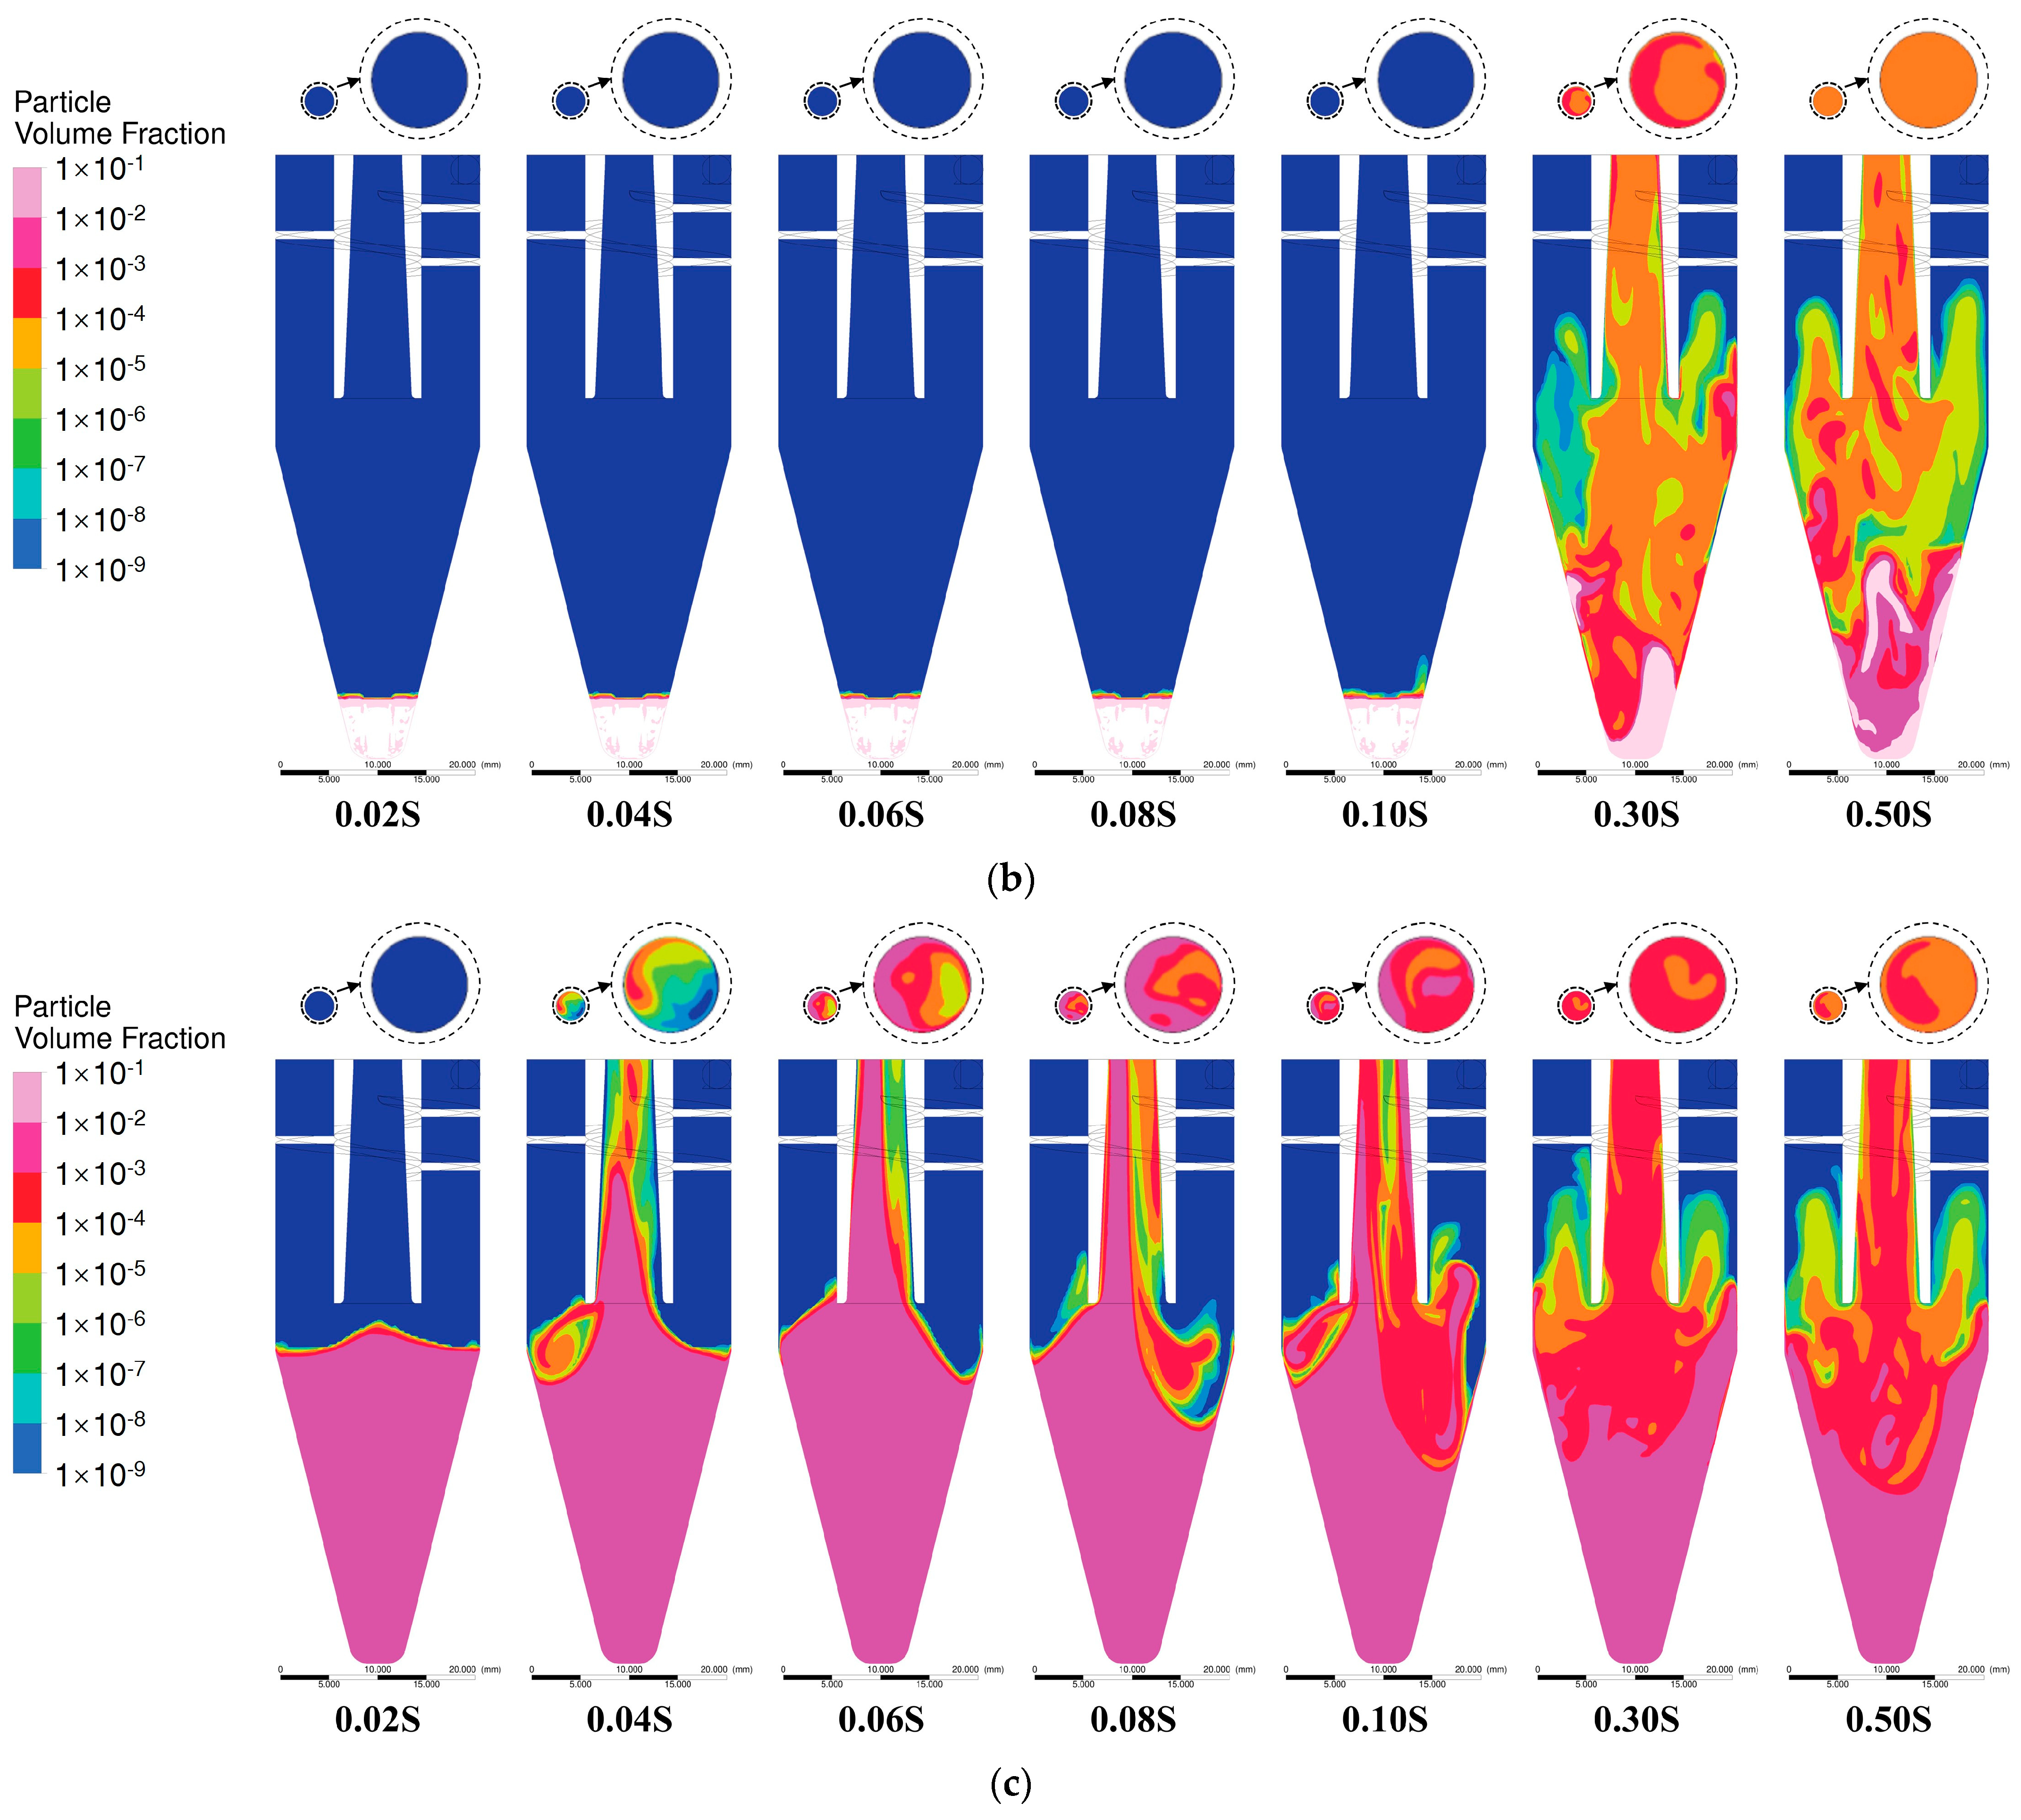
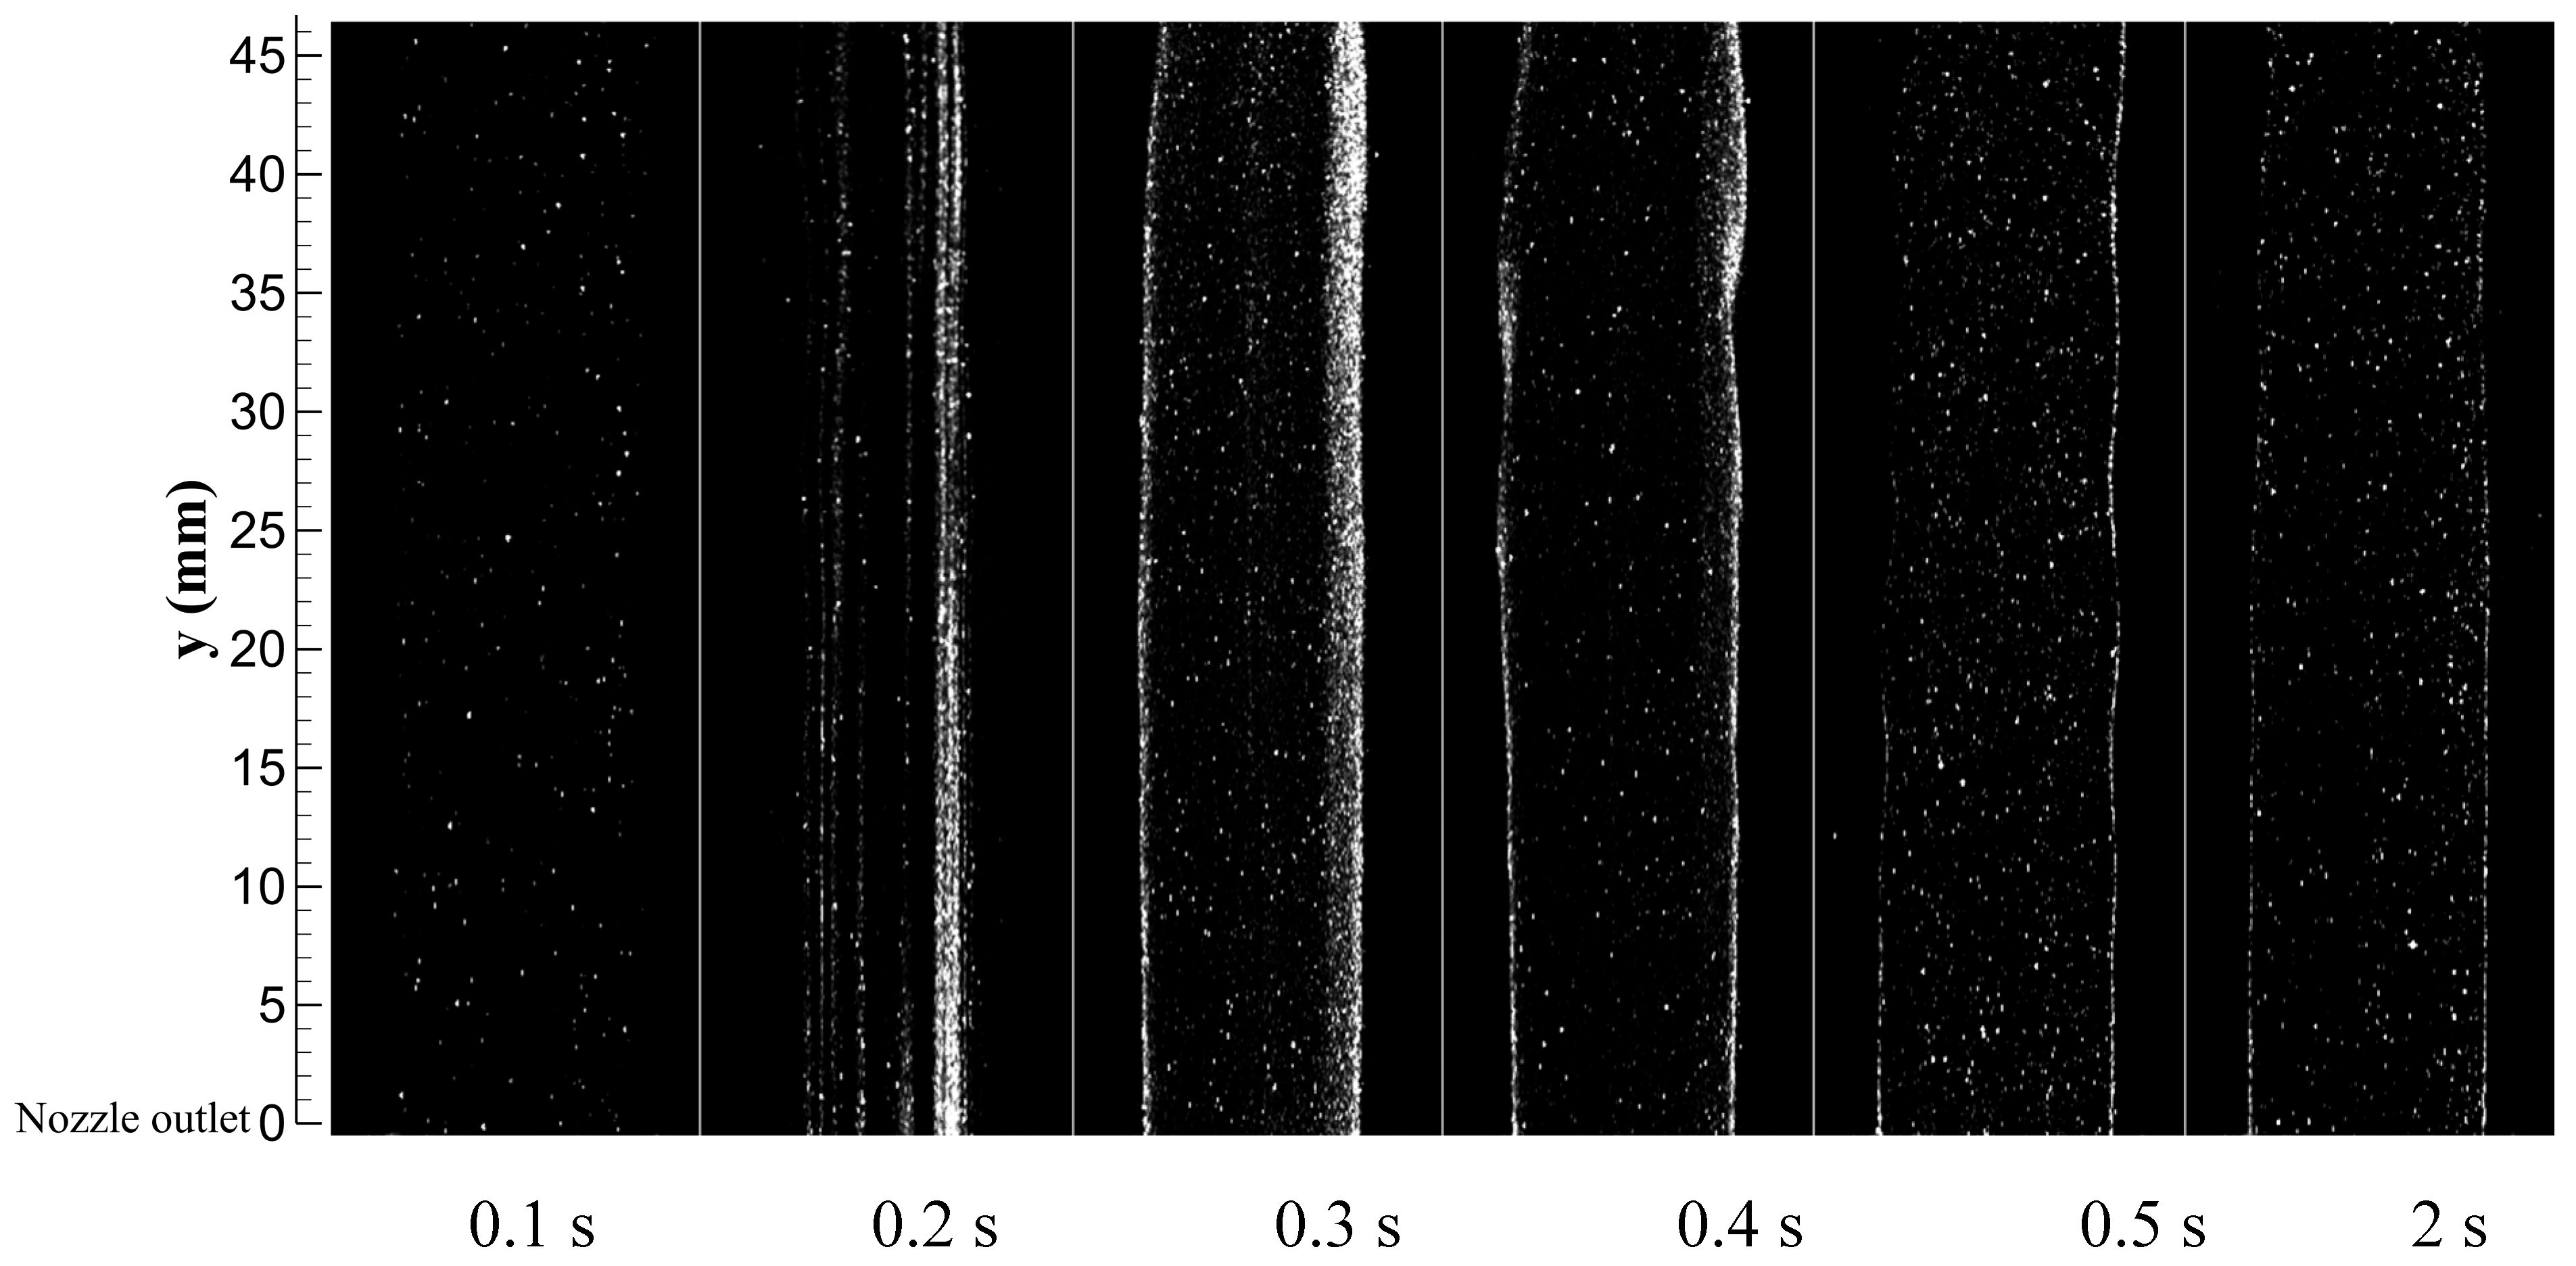
5.2. Spatiotemporal Evolution of Particle Distribution in Unsteady Flow

The time evolutions of particle distributions within the XZ cross-sections of different particle seeder configurations, characterized by particle volume fraction, are illustrated in Figure 10, Figure 11 and Figure 12.
Figure 10 shows that in Scen 1 and Scen 2, the airflow in Model 1 begins interacting with particles around after 0.06 s, initiating particle entrainment toward the outlet. Up to 0.3 s, the particle distribution remains similar in both Scen 1 and Scen 2. As time progresses, phases mixing intensifies, and turbulent diffusion becomes more pronounced, leading to a more uniform particle distribution inside the device. Notably, Scen 2 exhibits a more homogeneous particle distribution, resulting in more uniform particle ejection at the outlet.
In Scen 1, due to the influence of gravity, a persistent particle bulk region with a volume fraction near 0.1 remains at the bottom of the device. Under an inlet airflow velocity of 11.79 m/s, not all bottomed particles mix with the airflow; only the upper layer of the particle bulk interacts with the airflow to form aerosol, while the lower-layer particles remain trapped due to gravitational settling.
In contrast, in Scen 2, where gravity is absent, the particles mix more efficiently with the airflow, facilitating aerosol formation. Consequently, the particle concentration at the outlet in Scen 1 is lower than that in Scen 2 due to the influence of gravity.
In Scen 3, the interaction between the airflow and particles occurs earlier, leading to faster mixing within the device.
From the flow field evolution, the particle concentration at the outlet in Scen 3 reaches its peak value earlier than in the other scenarios. However, the particle concentration at the outlet in Scen 3 exhibits greater fluctuations and lower uniformity compared to those in Scen 1 and Scen 2.
As shown in Figure 11, the particle transport characteristics of Model 2 are similar to those of Model 1. However, the particles inside Model 2 reach the device outlet faster. This observation aligns with steady-state flow field analysis, in which Model 2 exhibited a higher axial velocity along the centerline.
Compared to Model 1 and Model 2, Model 3 consistently demonstrates lower particle transport efficiency under all operating conditions, as clearly shown in Figure 11. The primary reason for this inefficiency is likely the presence of the guide vane, which constrains the airflow within the vane passage, forcing it to take a more circumferential motion. Consequently, the airflow must take a longer path to reach the same axial distance, increasing energy dissipation compared to the other models. Additionally, particle distribution at the outlet of Model 3 is the least uniform.

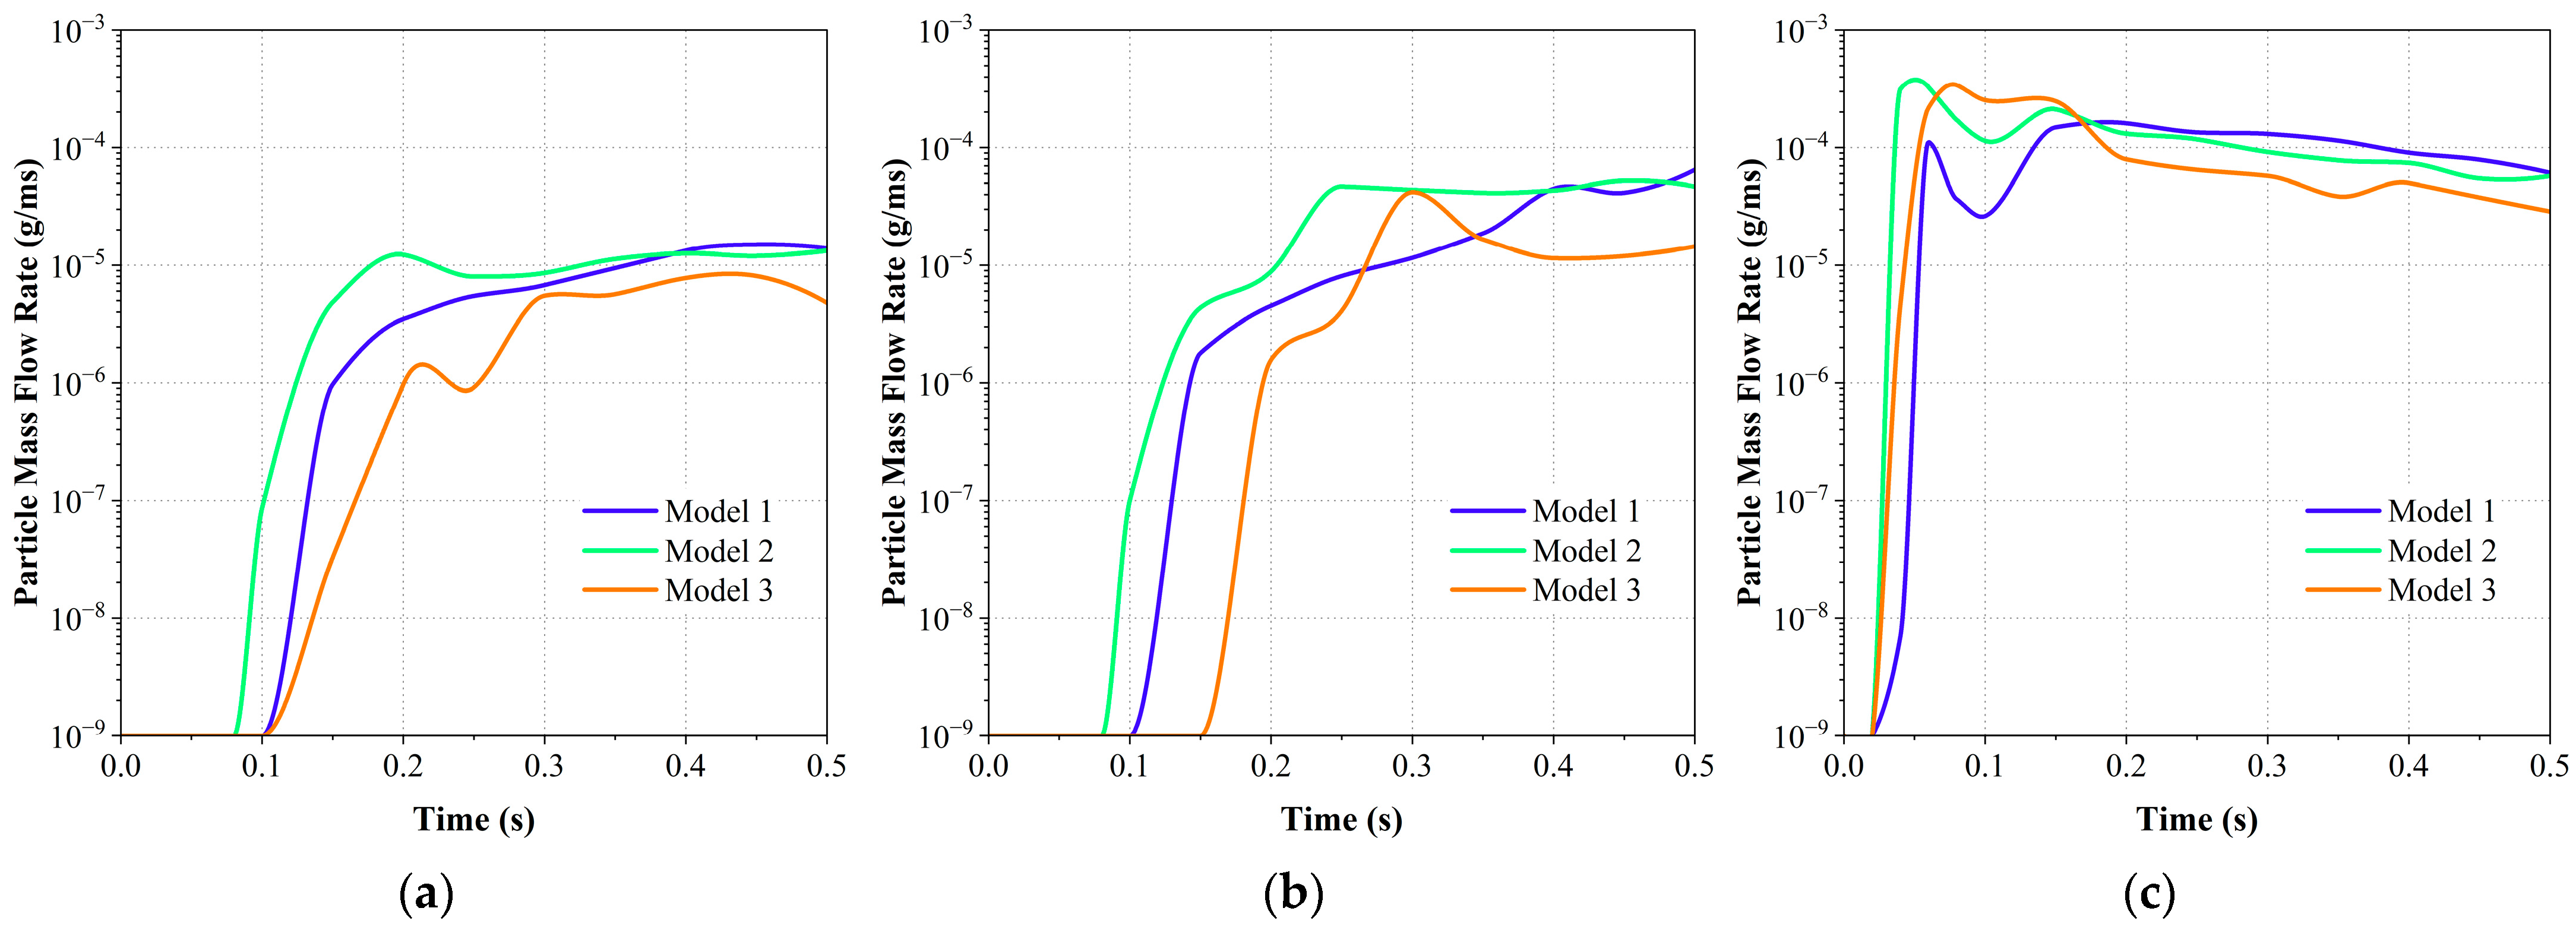
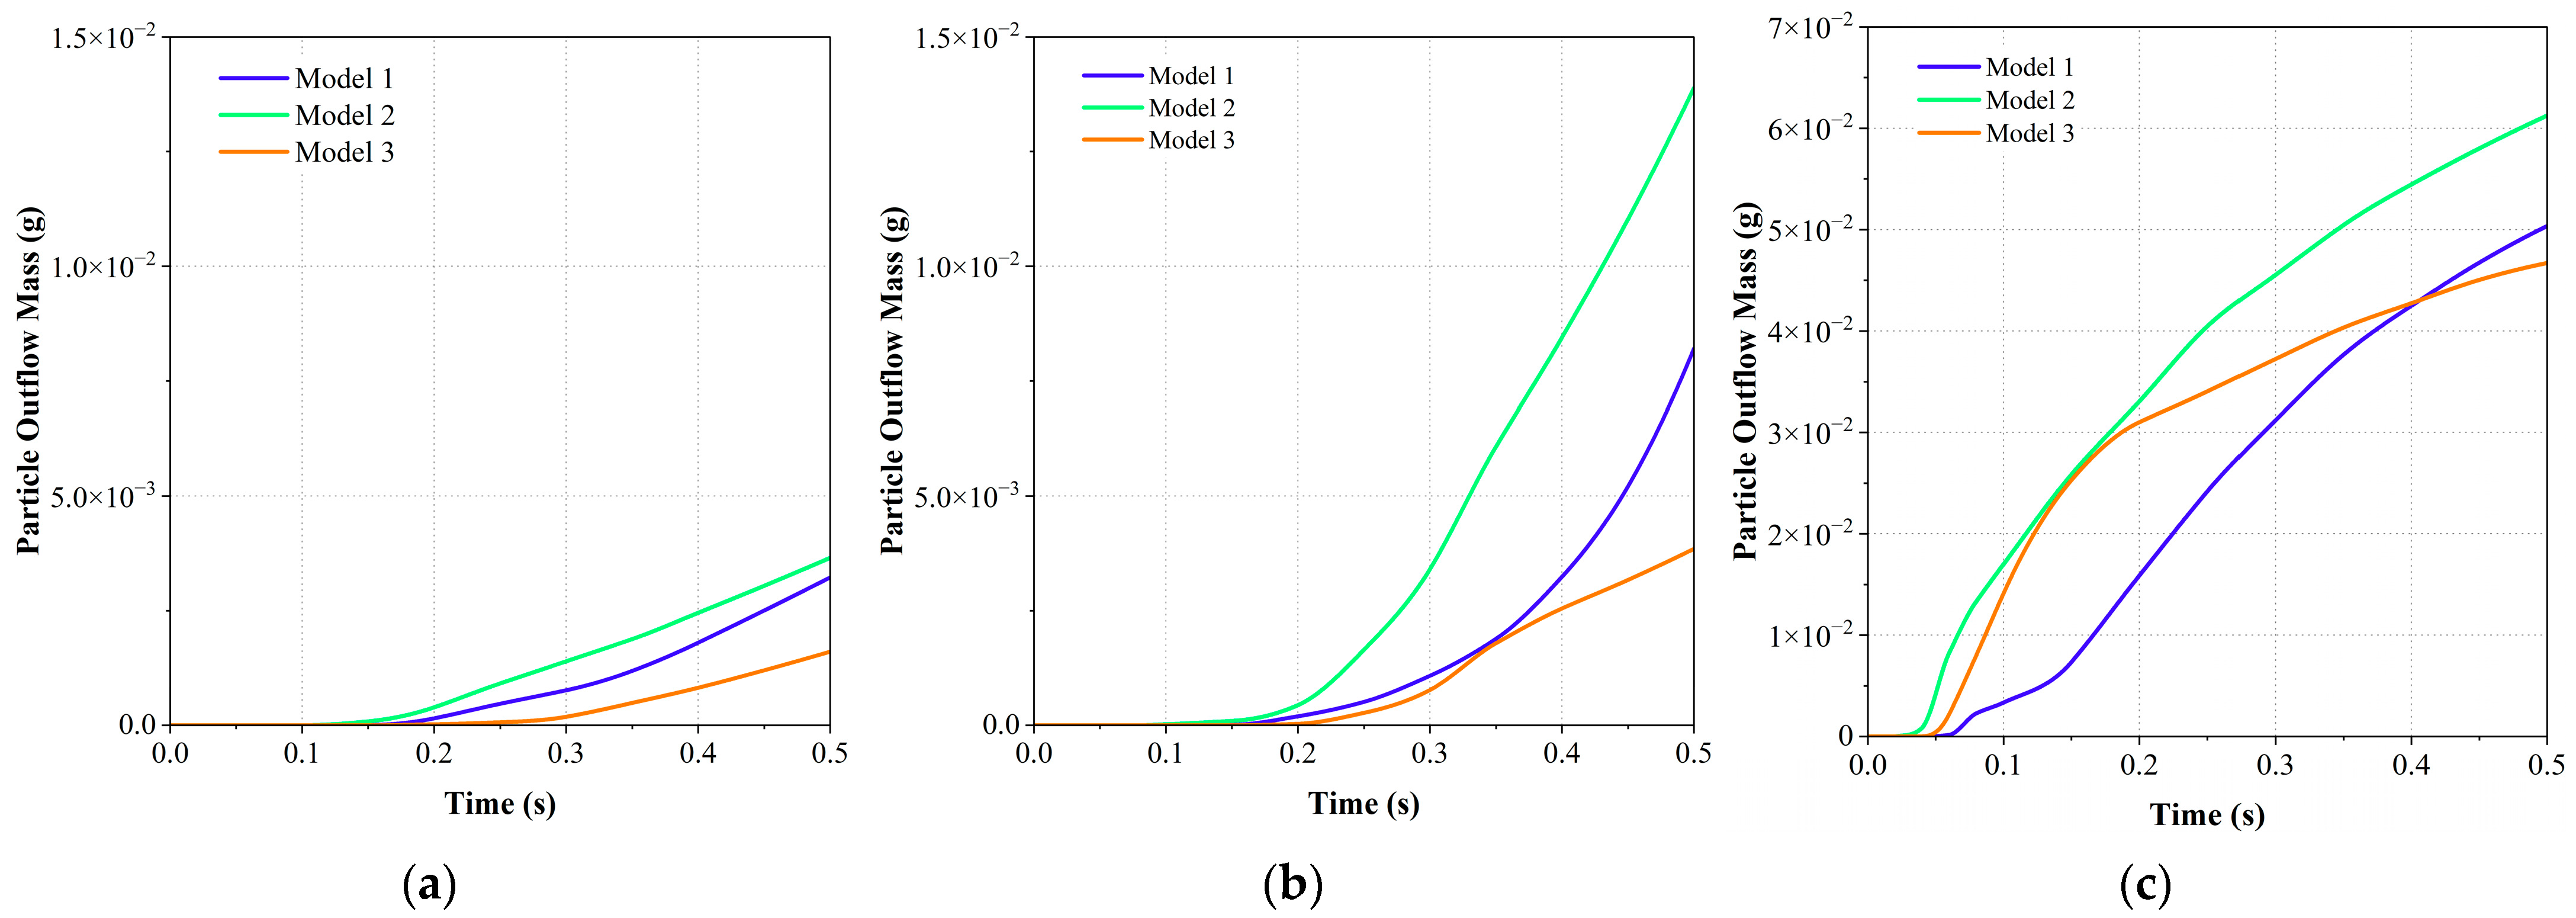
5.3. Particle Outflow in Different Gravity and Seeder Geometries

Figure 13 and Figure 14 illustrate how the vortex finder length, the presence of guide vanes, gravity conditions, and particle accumulation states influence the tracer particle release characteristics.
As shown in Figure 13a and Figure 14a, under Scen 1, the outlet particle mass flow rate of Model 2 leads those of Model 1 by 21.7% and Model 3 by 146.5% within 0.5 s. Before 0.4 s, the outlet particle mass flow rate of all three models generally increases, followed by a gradual decline or stabilization. In terms of vortex finder length, throughout the first 0.4 s, Model 2 consistently maintains the highest mass flow rate and finally releases 13.0% more particles than Model 1 and 126.7% more than Model 3. Model 3, featuring a guide vane, exhibits the lowest outlet particle mass flow rate and lags behind the non-guide-vane designs in terms of release rate. Moreover, the particle mass flow rate curve of Model 3 fluctuates significantly, whereas Models 1 and 2 display smoother release curves.
As shown in Figure 13b and Figure 14b, under Scen 2, Model 2 leads Model 1 by 46.4% and Model 3 by 181.6% within 0.5 s. Models 1 and 2 exhibit relatively stable particle mass flow rates, whereas Model 3 shows significant fluctuations at around 0.3 s. Similar to Scen 1, Model 2 reaches the peak mass flow rate first, maintaining dominance until 0.4 s, after which it slightly trails Model 1. Model 2 releases the highest total amount of particles in Scen 2, 69.2% more than Model 1 and 260.8% more than Model 3, reaffirming its superior performance under reduced gravity conditions.
As shown in Figure 13c and Figure 14c, under Scen 3, all three models exhibit higher release rates compared to Scen 1 and Scen 2. Unlike the previous two cases where the mass flow rate gradually increased until 0.4 s, in Scen 3, the mass flow rate peaks at around 0.05 s, followed by sharp oscillations near 0.1 s, before gradually declining. Model 2 again reaches the highest particle release mass flow rate earliest, reaching 4.04 × 10⁻⁴ g/ms at around 0.04 s. Model 1 and Model 3 lag by approximately 0.02 s before reaching their respective peak release rates. Within 0.5 s, Model 2 leads Model 1 by 58.9% and Model 3 by 22.7%. Model 2 also releases the largest amount of particles, 21.6% more than Model 1 and 31.2% more than Model 3.
Under Scen 2 and Scen 3, particle release mass flow rates exhibit greater fluctuations compared to Scen 1, but the overall release rates are higher. This suggests that in the absence of gravity, particle motion becomes more chaotic, reducing uniformity in the release process.
After 0.5 s of operation, the total particle release in Scen 1 for Model 1 is only 6.4% of that in Scen 3, while for Model 2 and Model 3, the values are 5.7% and 3.4%, respectively. However, Model 2 consistently achieves higher particle release amounts than Model 1 under both conditions, indicating that a longer vortex finder provides a more reliable tracer particle supply for both microgravity experiments and ground-based validation experiments.
As the numerical simulation results indicate that Model 2 achieves an order-of-magnitude higher particle seeding efficiency under microgravity compared to normal gravity conditions, verifying its effective operation on the ground also indirectly supports its feasibility in microgravity. Therefore, a ground-based PIV experiment was conducted to validate the seeder’s performance under normal gravity conditions, as detailed in the following section.

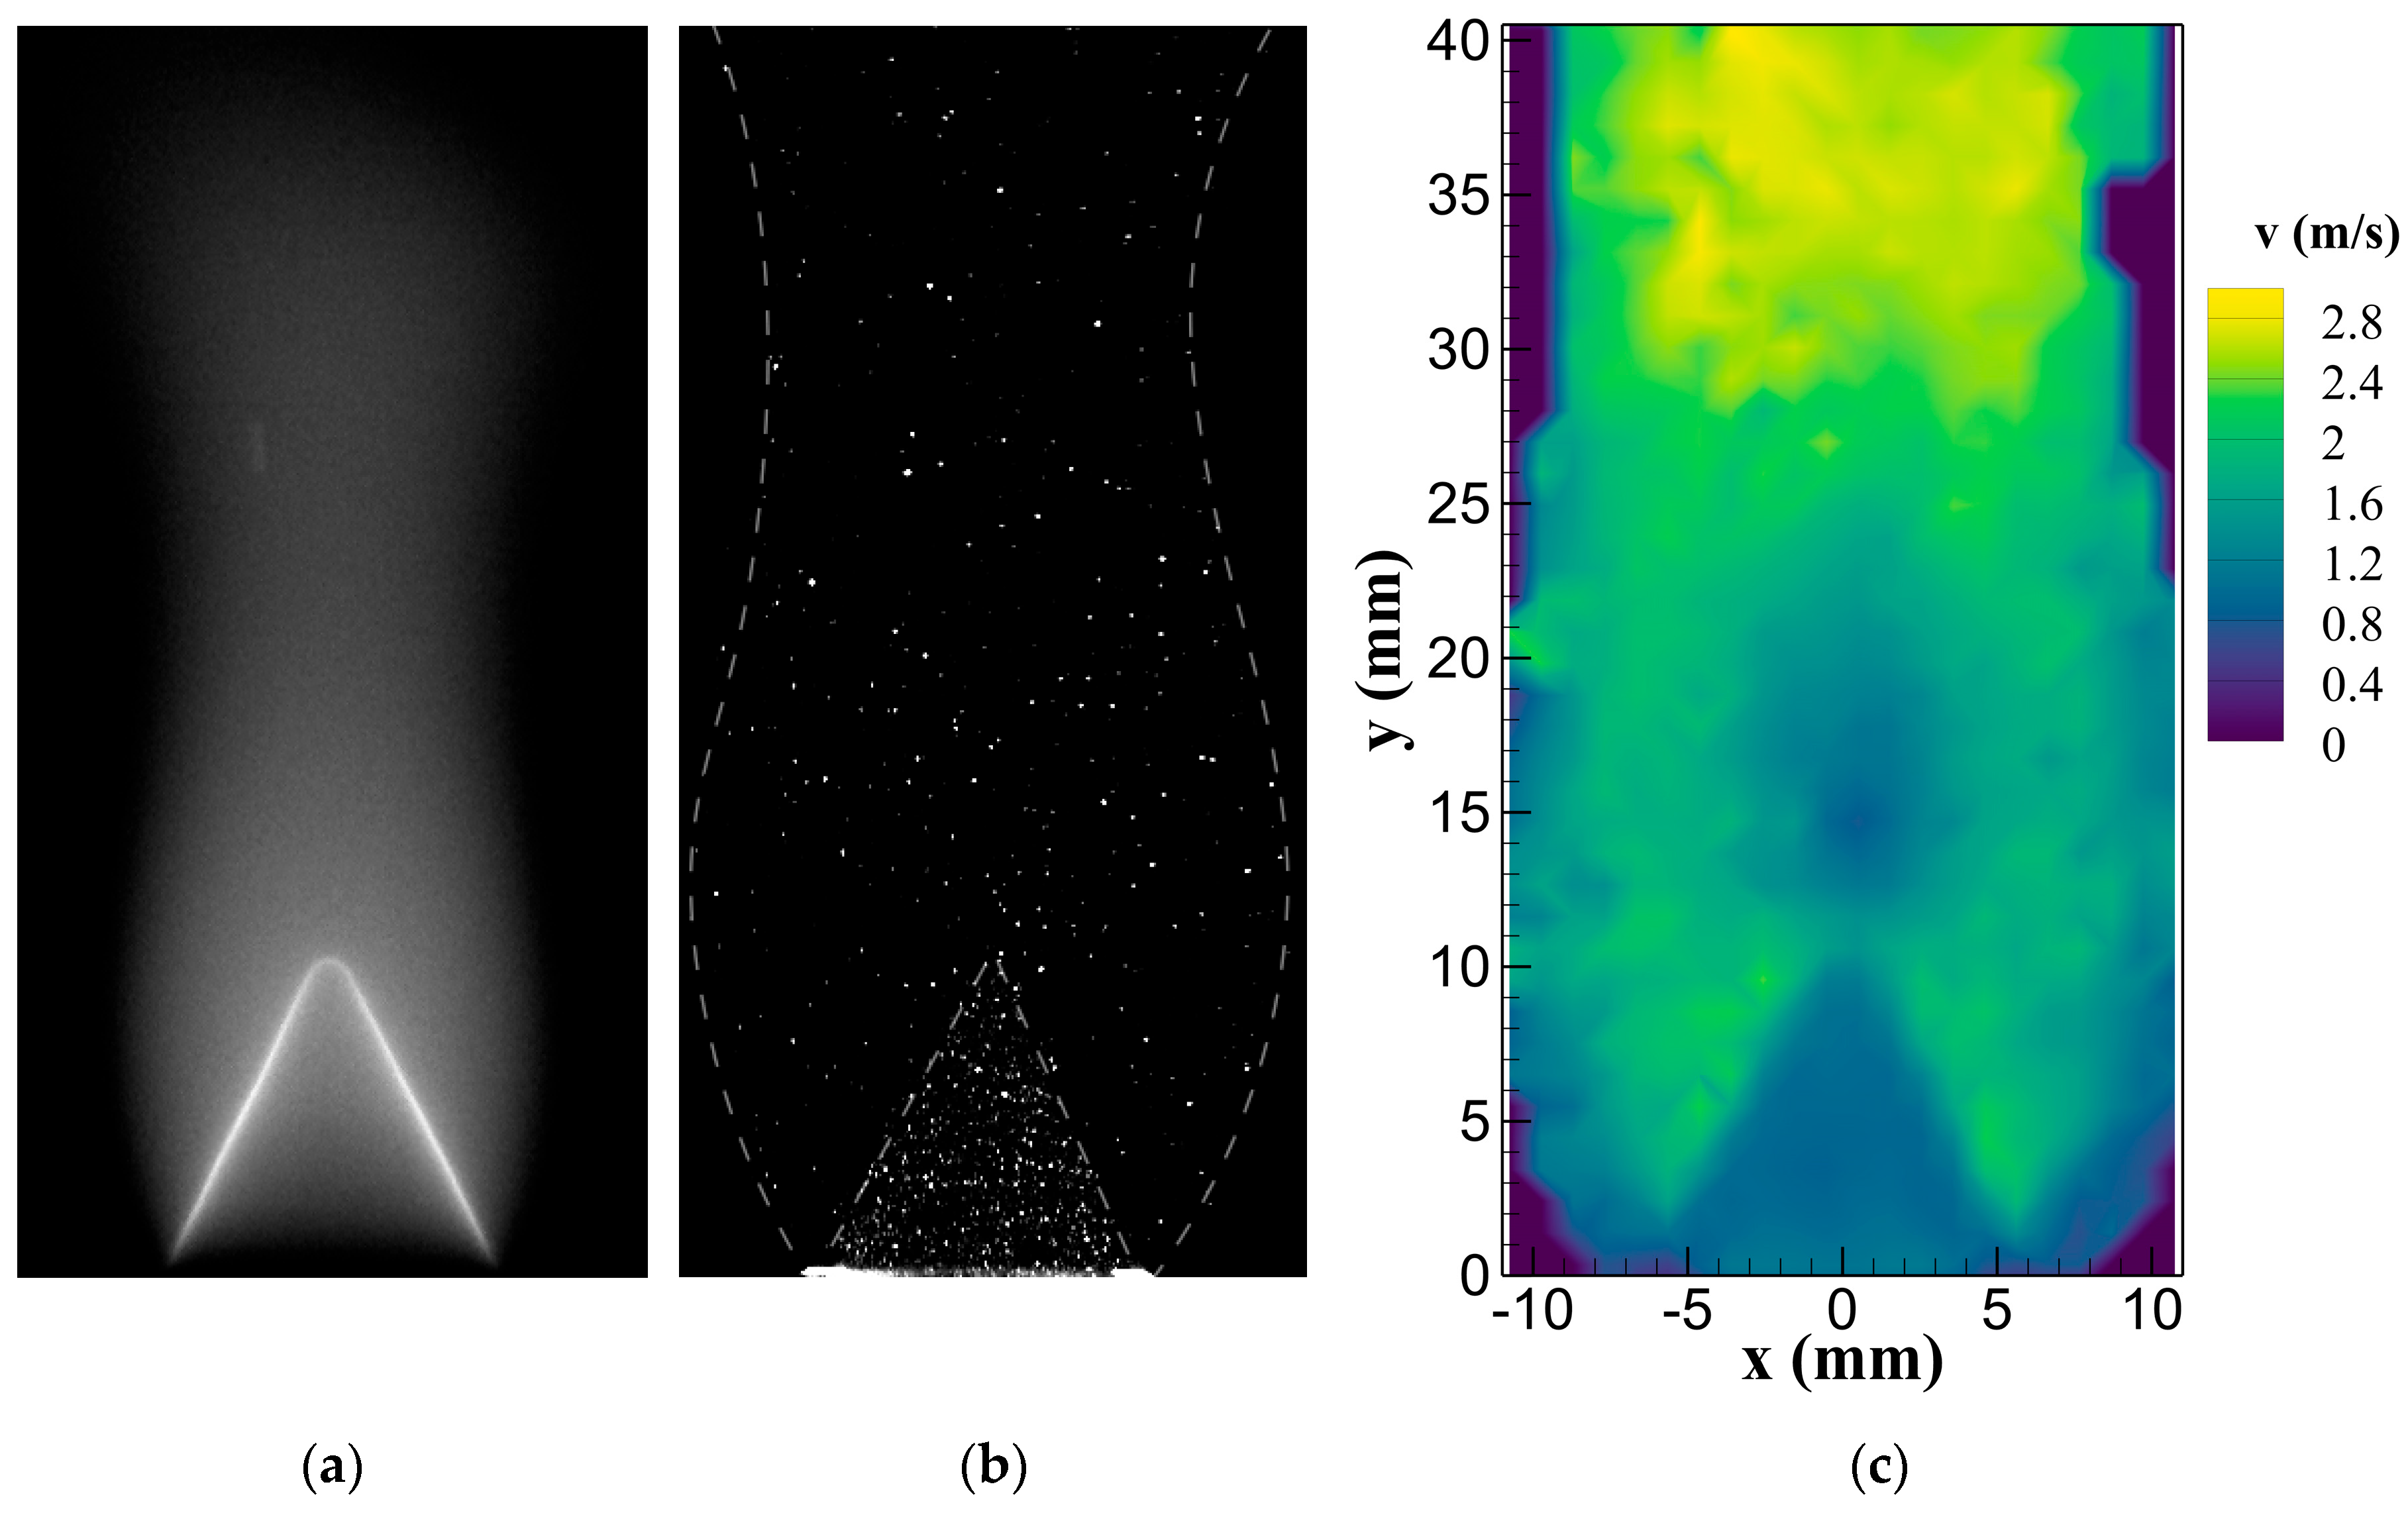
5.4. Ground-Based PIV Experiment

As shown in Figure 15, the particle concentration variation profile in the normal gravity cold jet PIV experiment aligns well with the trends of particle mass flow rate variation presented in Figure 13a, with a slight lag. Since the particles must travel through the internal flow channel in the base and the burner before being released from the burner nozzle, this lag occurs. Additionally, it is evident that at the initial stage of the release process, the particle distribution at the outflow is not uniform, consistent with the two-phase flow simulation results presented in Figure 11a. In Figure 15, this manifests as an asymmetric concentration distribution on both sides of the flow field. As the seeder continues operating, the particle concentration gradually becomes more uniform.
To further analyze the steady-state cold jet flow field, an open source software called PIV Lab V3.07 [39] was used to process the particle images. As shown in Figure 16, within 37 mm above the burner outlet, the measured exit velocity remains at around 1 m/s. Additionally, using a hot-wire anemometer, the maximum velocity at the burner centerline, 10 mm above the outlet, was 1.26 m/s, which closely matches the PIV measurement result, which was also 1.26 m/s.
Figure 17 presents the methane–air premixed combustion images. In Figure 17a, the combustion state without tracer particles exhibits the classical Bunsen flame structure [7]. Figure 17b,c show the flame structure with tracer particles and the processed velocity field, respectively. The combustion PIV experiment results accurately reflect the structure of the Bunsen flame.
Through normal gravity ground-based PIV experiments, the PIV tracer particle seeder with an extended vortex finder functions effectively under normal gravity conditions. Furthermore, when combined with the numerical simulation results and analysis, these findings strongly suggest that the cyclone particle seeder is likely to operate successfully under microgravity conditions.

6. Conclusions

This study systematically investigated the effects of different particle seeder structures, gravity conditions, and particle bulk states on the internal airflow field and tracer particle motion using steady-state airflow simulations and transient Eulerian multiphase flow simulations. Additionally, ground-based cold jet flow PIV experiments and premixed combustion PIV experiments were conducted under normal gravity conditions using existing experimental facilities. The findings provide theoretical and numerical support for simulating, designing, and optimizing the cyclone particle seeder. The following conclusions can be drawn from this study:
(1) The internal flow field of the cyclone-based particle release device is similar to that of traditional cyclone separators, yet localized differences exist, such as the absence of a negative pressure zone near the central axis. This phenomenon may be attributed to the lack of a dust hopper structure at the bottom, the curved outlet, and the combined effects of boundary conditions and geometric parameters.
(2) The addition of a guide vane enhances flow field symmetry within the device and effectively suppresses short-circuit flow. However, this geometric modification may also lead to energy dissipation within the guide vane channels, reducing the velocity of both the upward and downward airflow and significantly decreasing particle release performance.
(3) Although gravity conditions and particle accumulation states exert non-negligible influences on the particle release process, the longer vortex finder geometry consistently demonstrates superior particle seeding performance in terms of release velocity, uniformity, and quantity under various gravity conditions and particle bulk states. By comparing experimental and simulation results, this study theoretically validates the feasibility of using this device under microgravity conditions.
This research establishes a comprehensive understanding of the flow characteristics and particle motion behavior in cyclone particle seeders. Its findings hold significant implications for future applications in microgravity environments and contribute to optimizing of the CSES-PIV Unit aboard the China Space Station.

Author Contributions

Conceptualization, H.Z.; methodology, X.P. and H.Z.; validation, X.P. and Y.F.; formal analysis, X.P.; investigation, X.P., Y.F. and X.L.; data curation X.P.; writing—original draft preparation, X.P.; writing—review and editing, H.Z., X.P., X.Z., X.Y. and Y.F.; supervision, H.Z. and X.Y.; project administration, H.Z.; funding acquisition, H.Z. All authors have read and agreed to the published version of the manuscript.

Funding

This research received no external funding.

Data Availability Statement

The original contributions presented in the study are included in the article, further inquiries can be directed to the corresponding author.

Acknowledgments

The authors sincerely appreciate the support provided by the China Space Station Combustion Science Experimental System Project.

Conflicts of Interest

The authors declare no conflicts of interest.

References

  1. Zhang, Z.; Kong, W.; Zhang, H. Design of combustion science experimental system for China Space Station. Chin. J. Space Sci. 2020, 40, 72. [Google Scholar]
  2. Wen, Y.; Li, L.; Li, X.; Luo, L.; Chen, T.; Zhang, W.; Zhou, H.; Chen, S.; Sun, Y.; Shi, J. Extinction of microgravity partially premixed flame aboard the Chinese Space Station. Proc. Combust. Inst. 2024, 40, 105574. [Google Scholar]
  3. Li, Y.; Guibaud, A.; Citerne, J.-M.; Consalvi, J.-L.; Coimbra, A.; Sarazin, J.; Bourbigot, S.; Torero, J.; Legros, G. Effects of flame retardants on extinction limits, spread rate, and smoke release in opposed-flow flame spread over thin cylindrical polyethylene samples in microgravity. Proc. Combust. Inst. 2023, 39, 3919–3928. [Google Scholar]
  4. Li, D.; Wen, Y.; Liu, Y.C.; Wang, S. On the transition modes and mechanisms for laminar to turbulent lifted jet diffusion flames at normal-and micro-gravity. Combust. Flame 2024, 260, 113269. [Google Scholar]
  5. Law, C. Combustion in microgravity-Opportunities, challenges, and progress. In Proceedings of the 28th Aerospace Sciences Meeting, Reno, NV, USA, 8–11 January 1990; p. 120. [Google Scholar]
  6. Su, Y.; Zhang, B.; Chen, Y.; Sui, C.; Chen, W. 3D velocity and temperature distribution measurement and characteristic analysis of swirling combustion. Measurement 2022, 193, 110949. [Google Scholar]
  7. Turns, S.R. Introduction to Combustion; McGraw-Hill Companies: New York, NY, USA, 1996; Volume 287. [Google Scholar]
  8. He, L.; Zheng, H.; Wang, X.; Yang, X.; Zhang, X. Ground Experiment Investigation of PIV Unit for Combustion Science Experimental System of China Space Station. Chin. J. Space Sci. 2022, 42, 1152. [Google Scholar]
  9. Greenberg, P.S.; Wernet, M.P.; Yanis, W.; Urban, D.L.; Sunderland, P.B. Development of PIV for microgravity diffusion flames. In Proceedings of the 7th International Workshop on Microgravity Combustion and Chemically Reacting Systems, Cleveland, OH, USA, 3–6 June 2003. [Google Scholar]
  10. Kato, H.; Kunieda, S.; Enomoto, H. Effects of Co-flowing Air on Behavior of Gas jet Diffusion flames under Normal-and Micro-gravity Fields. Space Forum 2000, 6, 269–276. [Google Scholar]
  11. Most, J.M.; Most, A.; Susset, A.; Baillargeat, J.; Joulain, P. Flame characterization by PIV in microgravity conditions. In Proceedings of the 10th International Symposium on Applications of Laser Techniques to Fluid Mechanics, Lisbon, Portugal, 10–13 July 2001. [Google Scholar]
  12. Boxx, I.G.; Idicheria, C.A.; Clemens, N.T. Kilohertz PIV/PLMS of low-gravity turbulent flames in a drop tower. In Proceedings of the 12th International Symposium on Application of Laser Techniques to Fluid Mechanics, Lisbon, Portugal, 12–15 July 2004. [Google Scholar]
  13. Wernet, M.P.; Greenberg, P.S.; Sunderland, P.B.; Yanis, W. A PIV investigation of weakly buoyant laminar jet diffusion flames. In Proceedings of the 38th Aerospace Sciences Meeting and Exhibit, Reno, NV, USA, 10–13 January 2000; p. 694. [Google Scholar]
  14. Albrecht, H.-E.; Damaschke, N.; Borys, M.; Tropea, C. Laser Doppler and Phase Doppler Measurement Techniques; Springer Science & Business Media: Berlin, Germany, 2013. [Google Scholar]
  15. Glass, M.; Kennedy, I. An improved seeding method for high temperature laser Doppler velocimetry. Combust. Flame 1977, 29, 333–335. [Google Scholar]
  16. Scheel, F. PIV Measurement of a 3-Dimensional Reacting Flow in a Scramjet Combustion Chamber. In Proceedings of the 42nd AIAA Aerospace Sciences Meeting & Exhibit, Reno, NV, USA, 5–8 January 2004. [Google Scholar]
  17. Chen, F.; Liu, H.; Yang, Z.; Hu, H. Tracking characteristics of tracer particles for PIV measurements in supersonic flows. Chin. J. Aeronaut. 2017, 30, 577–585. [Google Scholar]
  18. Anderson, D.; Greated, C.; Jones, J.; Nimmo, G.; Wiseall, S. Fibre optic PIV studies in an industrial combustor. In Proceedings of the 8th International Symposium on Applications of Laser Techniques to Fluid Mechanics, Lisbon, Portugal, 8–11 July 1996. [Google Scholar]
  19. Hoekstra, A.J. Gas Flow Field and Collection Efficiency of Cyclone Separators. Ph.D. Thesis, Delft University of Technology, Delft, The Netherlands, 2000. [Google Scholar]
  20. Liang, Y.; Cheng, T.; Li, Q.; Liu, J.; Li, Q.; Li, J.; Ma, S.; Jiang, X.; Wang, H.; Fu, P. CFD-DEM simulation of cyclone self-rotation drying: Particle high-speed self-rotation and heat transfer. Energy 2024, 290, 130277. [Google Scholar] [CrossRef]
  21. Matsuzaki, K.; Ushijima, H.; Munekata, M.; Ohba, H. Numerical study on particle motions in swirling flows in a cyclone separator. J. Therm. Sci. 2006, 15, 181–185. [Google Scholar]
  22. Cokljat, D.; Slack, M.; Vasquez, S.; Bakker, A.; Montante, G. Reynolds-stress model for Eulerian multiphase. Prog. Comput. Fluid Dyn. Int. J. 2006, 6, 168–178. [Google Scholar]
  23. Ma, L.; Ingham, D.; Wen, X. Numerical modelling of the fluid and particle penetration through small sampling cyclones. J. Aerosol Sci. 2000, 31, 1097–1119. [Google Scholar]
  24. Meier, H.; Mori, M. Gas-solid flow in cyclones: The Eulerian-Eulerian approach. Comput. Chem. Eng. 1998, 22, S641–S644. [Google Scholar]
  25. Li, Q.-P.; Xu, Y.-J.; Du, L.-H.; Xie, J.; Cheng, J.-W.; Wang, Y. Numerical simulation of JLX cyclone separator with guiding vane. Chem. Engineeing 2015, 43, 37–41. [Google Scholar]
  26. Kitamura, O.; Yamamoto, M. Proposal of a Reynolds Stress Model for Gas-Particle Turbulent Flows and its Application to Cylone Separators. In Engineering Turbulence Modelling and Experiments 4; Elsevier: Amsterdam, The Netherlands, 1999; pp. 893–902. [Google Scholar]
  27. Argyropoulos, C.D.; Markatos, N. Recent advances on the numerical modelling of turbulent flows. Appl. Math. Model. 2015, 39, 693–732. [Google Scholar] [CrossRef]
  28. Safikhani, H. Modeling and multi-objective Pareto optimization of new cyclone separators using CFD, ANNs and NSGA II algorithm. Adv. Powder Technol. 2016, 27, 2277–2284. [Google Scholar]
  29. Mao, Y.; Chen, J.-l.; Chen, Z.-b.; Liu, N.; Lyu, Y.-l. Comparative Study on Cyclone Gas-Solid Two-phase Flow Using Lagrange Method and Euler Method. Bull. Chin. Ceram. Soc. 2017, 36, 459–465. [Google Scholar]
  30. Song, C.; Pei, B.; Jiang, M.; Wang, B.; Xu, D.; Chen, Y. Numerical analysis of forces exerted on particles in cyclone separators. Powder Technol. 2016, 294, 437–448. [Google Scholar]
  31. Fan, L.-S.; Zhu, C. Principles of Gas-Solid Flows, 1st ed.; Cambridge University Press: Cambridge, UK, 1998; pp. 87–101. [Google Scholar]
  32. Wen, C.Y. Mechanics of fluidization. Fluid Part. Technol. Chem. Eng. Progress. Symp. Ser. 1966, 62, 100–111. [Google Scholar]
  33. Upadhyay, M.; Kim, A.; Kim, H.; Lim, D.; Lim, H. An assessment of drag models in eulerian–eulerian cfd simulation of gas–solid flow hydrodynamics in circulating fluidized bed riser. ChemEngineering 2020, 4, 37. [Google Scholar] [CrossRef]
  34. Schlichting, H.; Gersten, K. Boundary-Layer Theory; MacGraw Hill: New York, NY, USA, 1979. [Google Scholar]
  35. Zhu, Z.; Na, Y.; Lu, Q. Pressure drop in cyclone separator at high pressure. J. Therm. Sci. 2008, 17, 275–280. [Google Scholar] [CrossRef]
  36. Wang, B.; Xu, D.; Chu, K.; Yu, A. Numerical study of gas–solid flow in a cyclone separator. Appl. Math. Model. 2006, 30, 1326–1342. [Google Scholar] [CrossRef]
  37. Ling, Z.; Deng, X. Study of a novel rotary cyclone gas-solid separator. J. Therm. Sci. 2003, 12, 275–278. [Google Scholar] [CrossRef]
  38. Ter Linden, A. Investigations into cyclone dust collectors. Proc. Inst. Mech. Eng. 1949, 160, 233–251. [Google Scholar] [CrossRef]
  39. Thielicke, W.; Sonntag, R. Particle Image Velocimetry for MATLAB: Accuracy and enhanced algorithms in PIVlab. J. Open Res. Softw. 2021, 9, 12. [Google Scholar] [CrossRef]
Figure 1. Schematic diagram of the CSES and the coupling burner.
Energies 18 01700 g001
Figure 2. Geometries and dimensions of cyclone particle seeders: (a) Model 1; (b) Model 2; (c) Model 3; (d) dimensions of seeder.
Energies 18 01700 g002
Figure 3. Grid partition and independence: (a) grid partition; (b) grid independence.
Energies 18 01700 g003
Figure 4. Pressure drop comparison.
Energies 18 01700 g004
Figure 5. Schematic diagram of the ground-based PIV experiment platform.
Energies 18 01700 g005
Figure 6. Steady flow field in XZ plane of Model 1: (a) static pressure; (b) turbulence intensity; (c) tangential velocity (counterclockwise is positive); (d) axial velocity (upward is positive); (e) radial velocity (outward is positive); (f) velocity magnitude.
Energies 18 01700 g006
Figure 7. Steady flow field in XZ plane of Model 2: (a) static pressure; (b) turbulence intensity; (c) tangential velocity; (d) axial velocity; (e) radial velocity; (f) velocity magnitude.
Energies 18 01700 g007
Figure 8. Steady flow field in XZ plane of Model 3: (a) static pressure; (b) turbulence intensity; (c) tangential velocity; (d) axial velocity; (e) radial velocity; (f) velocity magnitude.
Energies 18 01700 g008
Figure 9. Computed velocity vector plots at the XZ plane and at various cross-sectional heights for different geometries: (a) Model 1; (b) Model 2; (c) Model 3.
Energies 18 01700 g009
Figure 10. Computed solid volume fraction contour of XZ plane of Model 1: (a) Scen 1; (b) Scen 2; (c) Scen 3.
Energies 18 01700 g010
Figure 11. Computed solid volume fraction contour of XZ plane of Model 2: (a) Scen 1; (b) Scen 2; (c) Scen 3.
Energies 18 01700 g011aEnergies 18 01700 g011b
Figure 12. Computed solid volume fraction contour of XZ plane of Model 3: (a) Scen 1; (b) Scen 2; (c) Scen 3.
Energies 18 01700 g012aEnergies 18 01700 g012b
Figure 13. Outlet particle mass flow rate of seeders: (a) Scen 1; (b) Scen 2; (c) Scen 3.
Energies 18 01700 g013
Figure 14. Particle outflow mass: (a) Scen 1; (b) Scen 2; (c) Scen 3.
Energies 18 01700 g014
Figure 15. Time sequence of particle images in cold jet flow from the nozzle.
Energies 18 01700 g015
Figure 16. Cold jet flow field: (a) velocity vector; (b) velocity field.
Energies 18 01700 g016
Figure 17. Methane premixed combustion at Φ = 1.1: (a) flame structure; (b) particle image; (c) velocity contour.
Energies 18 01700 g017
Table 1. Physical properties of simulation.
PropertyScen 1Scen 2Scen 3
Gravity1 G0 G0 G
Particle total mass8.29 × 10−4 kg8.29 × 10−4 kg8.29 × 10−4 kg
Particle bulk volume196 mm3196 mm34777 mm3
Particle bulk fraction0.10.10.004
Table 2. Operating parameters.
FacilityItemOperating Parameter
CW LaserPower10 W
Wave length532 nm
Camera
(Photron fastcam mini ax100)
Resolution1024 × 880
Frame rate5000
Exposure time40 μs
Lens
(Tamron macro 100 mm)
Focal length100 mm
ApertureF 2.8
Disclaimer/Publisher’s Note: The statements, opinions and data contained in all publications are solely those of the individual author(s) and contributor(s) and not of MDPI and/or the editor(s). MDPI and/or the editor(s) disclaim responsibility for any injury to people or property resulting from any ideas, methods, instructions or products referred to in the content.

