Article

An Experimental Study on Wave Force and Run-Up of Wind Turbine Foundation on Breakwater Under Wave Action

1
The College of Harbour, Coastal and Offshore Engineering, Hohai University, Nanjing 210024, China
2
National Engineering Research Center of Port Hydraulic Construction Technology, Tianjin Research Institute for Water Transport Engineering, M.O.T., Tianjin 300456, China
*
Authors to whom correspondence should be addressed.
Energies 2025, 18(7), 1676; https://doi.org/10.3390/en18071676
Submission received: 4 March 2025 / Revised: 22 March 2025 / Accepted: 25 March 2025 / Published: 27 March 2025
(This article belongs to the Special Issue Advances in Ocean Energy Technologies and Applications)

Abstract

:
With the development and utilization of offshore wind turbines in the field of existing breakwaters, its foundation is affected by the dual effects of waves and different structures. In order to ensure structural safety and evaluate the impact on breakwaters, A6 and A7 wind turbine foundations in the breakwater head area were selected, and a 1:40 scale model test was conducted. The results showed the following: (1) After the implementation of the wind turbine project, the wave height of the breakwater only increased by 10%, and its stability was basically not affected; (2) The basic design elevation does not meet the requirements for run-up, and it is feasible to raise it by 1.0~1.5 m; (3) The wave force on A7 foundation is 2~4 times that of A6, and after the elevation is raised, the wave force decreases by 50%. Therefore, the structural design can be considered to adopt differentiated design according to different positions and types; (4) The experimental results are 1.2~1.5 times the standard formula calculation results, and the research results can enrich the current standard calculation basis. This study can not only solve practical problems in engineering but also provide basic data for similar projects in the future.

1. Introduction

With the global energy structure transformation and rapid development of renewable energy, offshore wind turbines, as a clean and renewable form of energy, have received widespread attention and rapid development in recent years [1]. Due to the complex marine environmental conditions faced in the development and construction of offshore wind farms, such as wind, waves, currents, sea ice, typhoons, and even earthquakes, the safety and stability of wind turbines and their supporting structures are important aspects of offshore wind power research under the influence of the marine environment [2]. At present, the main forms of offshore wind turbine foundations include gravity type [3], single pile [4], multi-pile [5], guide frame [6], suction bucket type [7], and floating foundation [8]. In the actual marine environment, whether it is a fixed foundation or a floating foundation when the incident wave propagates to the supporting structure, the free liquid surface around the supporting structure will undergo significant changes. That is, some water waves will bypass the supporting structure and continue to propagate forward, while another part of the water waves obstructed by the supporting structure will convert the kinetic energy of forward propagation into upward potential energy, causing the wave to attack the foundation structure, generating wave forces and rising broken waves. The broken waves will quickly run up a certain vertical distance along the surface of the foundation structure [9], and in severe cases, water will be generated, further causing damage or corrosion to the local structure of the application equipment. Therefore, the study of wave forces and wave run-up on wind turbine foundations is of great significance for the safe design of offshore wind turbine foundation platforms and has become a hot topic in the research of ocean engineering hydrodynamics [10,11].
The calculation of wave forces on wind turbine foundations has been extensively studied by scholars both domestically and internationally [12,13,14,15,16,17,18], and the structures are mainly cylindrical. Among them, the Morison formula is commonly used for small-scale pile foundations ( D / L < 0 .2):
F = F I + F D = 1 2 ρ C M A u t + 1 2 ρ C D D u | u |
where F is the total wave force acting on the object; F I is the inertial force; F D is the drag force; ρ is the density of seawater; C M is the inertia force coefficient; A is the projected area of the object perpendicular to the direction of water flow; u t is the horizontal acceleration of water quality points; C D is the drag coefficient; D is the characteristic scale of the object (such as cylinder diameter); and u is the horizontal velocity of the water quality point.
The research results on pile foundations with relatively large scales [19,20,21,22] often adopt the wave diffraction theory proposed by Maccamy and Fuchs, assuming that the water is non-viscous and the waves move with potential. The linearized Bernoulli equation is used to calculate the wave forces acting on the pile foundation. The calculation methods for wave forces on different cylindrical structures are clearly provided in China’s “Hydrological Code for Ports and Navigational Channels”. In recent years, with the continuous development of computers, more and more scholars have used numerical simulations to calculate the wave forces acting on pile foundations. Bredmose [23] used the DHI-developed program NS3 to solve the three-dimensional N-S equations and simulated the extreme wave loads and wave run-up of gravity-based foundations. Markus [24] used OpenFoam-2.1.x to establish a numerical wave tank and simulated the wave forces acting on a gravity-based foundation under actual engineering conditions. On the basis of Markus, Guan Ning [25] used OpenFoam to analyze the hydrodynamic characteristics and structural wave forces around a cylindrical foundation under different combinations of wave and current effects.
Similarly, a large amount of research has been conducted on the wave run-up characteristics of wind turbine foundations, including single pile foundations. Unlike the wave run-up characteristics of sloping breakwaters (generally wave barriers) in port engineering, the most widely used wave run-up prediction methods for pile column foundations are diffraction theory prediction, velocity head theory prediction, and machine learning method prediction.
In 1954, R. Mccamy [26] solved the wavefront equation of the free surface near the pile based on linear diffraction theory and provided an estimation formula for the wave run-up ( R 1 % ) in front of the vertical pile, which is as follows:
R 1 % η m a x = ( 1 + ( 2 k a ) 2 ) 1 / 2
where R 1 % is the run-up with a cumulative frequency of 1%; η m a x is the maximum height of the free wave surface; k is the wave number; and a is the radius of the vertical circular pile.
DE Kriebel [27] conducted research on predicting the wave run-up of different forms of wind turbine foundations using irregular wave action and provided the wave run-up ( R 1 % ) for single pile foundations and conical foundations. The calculation formulas for the wave run-up of single pile foundations and conical foundations are as follows:
R 1 % = η m a x + 2.71 ( U 2 / 2 g )
R 1 % = η m a x + 4.45 ( U 2 / 2 g )
where u is the water quality point velocity at the peak of the wave; the meaning of other letters is the same as above.
DE Kriebel and Martin, J A. [28,29] conducted extensive theoretical research on large-scale vertical circular piles based on second-order diffraction theory. The theoretical results were compared with 22 model test results, and it was found that the prediction accuracy of second-order diffraction theory was significantly improved compared to linear diffraction theory; Hallermeier, R. J. and Vos, L.D. [30,31] also extended the linear diffraction theory to a second-order form using different methods, but it is still not ideal for calculating run-up altitude.
Kazeminezhad [32] explored a data mining method based on the M5 model tree algorithm and nonlinear regression techniques, which predicts wave rise by controlling dimensionless parameters (input parameters). The prediction formula for the wave run-up on vertical piles in a regular wave environment is as follows:
R 1 % H 1 % = 0.76 ( H 1 % d ) 0.15 ( H 0 L 0 ) 0.055 ,             H 1 % d 0.41
R 1 % H 1 % = 0.65 ( H 0 L 0 ) 0.055 + 3.2 × 10 3 ( H 1 % d 0.41 ) 0.15 ( H 0 L 0 ) 1.5 ,                 H 1 % d > 0 .
where H 1 % is the wave height with a cumulative frequency of 1%; H 0 is the wave height in deep water; L 0 is the deepwater cycle; and d is the water depth.
Based on the previous research results on wave forces and run-up of wind turbine foundations, it is found that the main focus is on cylindrical circular structures and the conditions in a single marine environment. Due to the fact that this wind turbine project is built on a breakwater, the foundation adopts a combination structure of high piles and pier caps. At this time, it is necessary to bear the direct action of waves, as well as consider the reflection and run-up effect of the breakwater on waves, as well as the changes in local water flow and wave shape. How to determine the wave force and wave run-up on the foundation, the determination of coefficients in the above calculation formula, and the accuracy of the calculation face challenges. Therefore, this article takes the Tianjin Port north breakwater wind turbine project in China as an example to conduct model experiments using different wave direction angles, hydrodynamic changes before and after project implementation, and evaluation of the impact on the stability of the existing breakwater to solve practical problems in the project and meet the purpose of experimental research.

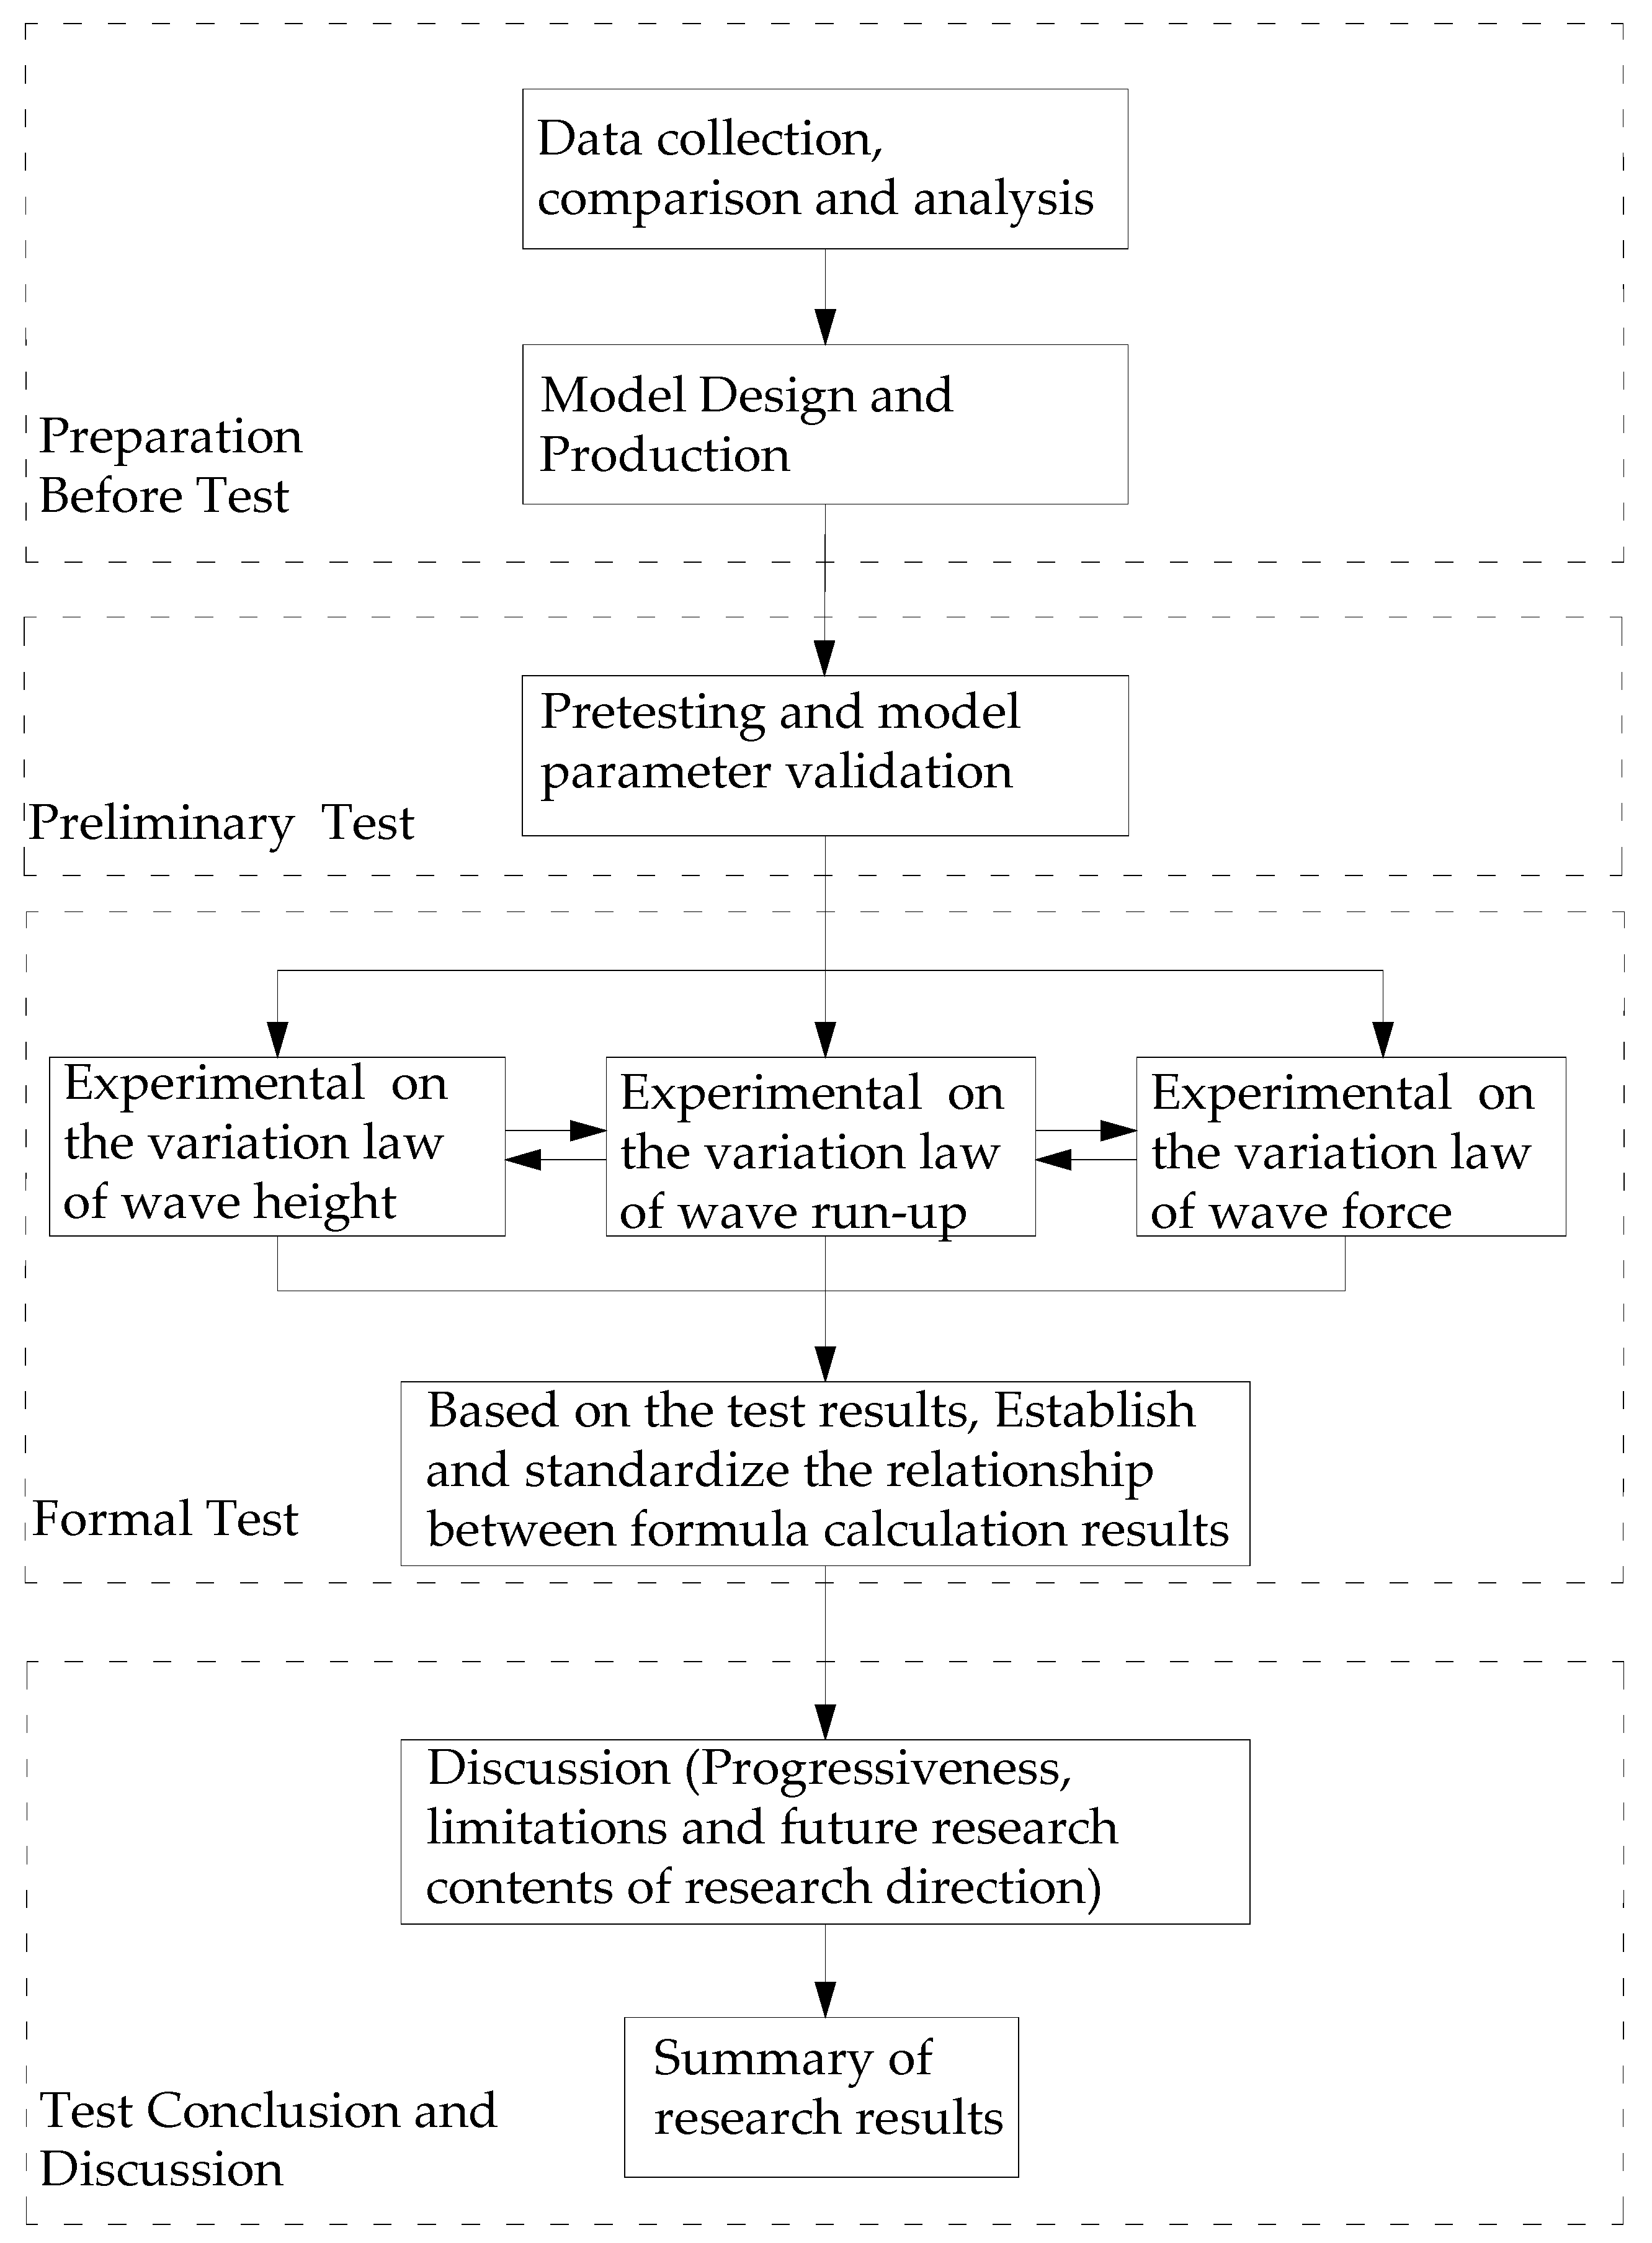
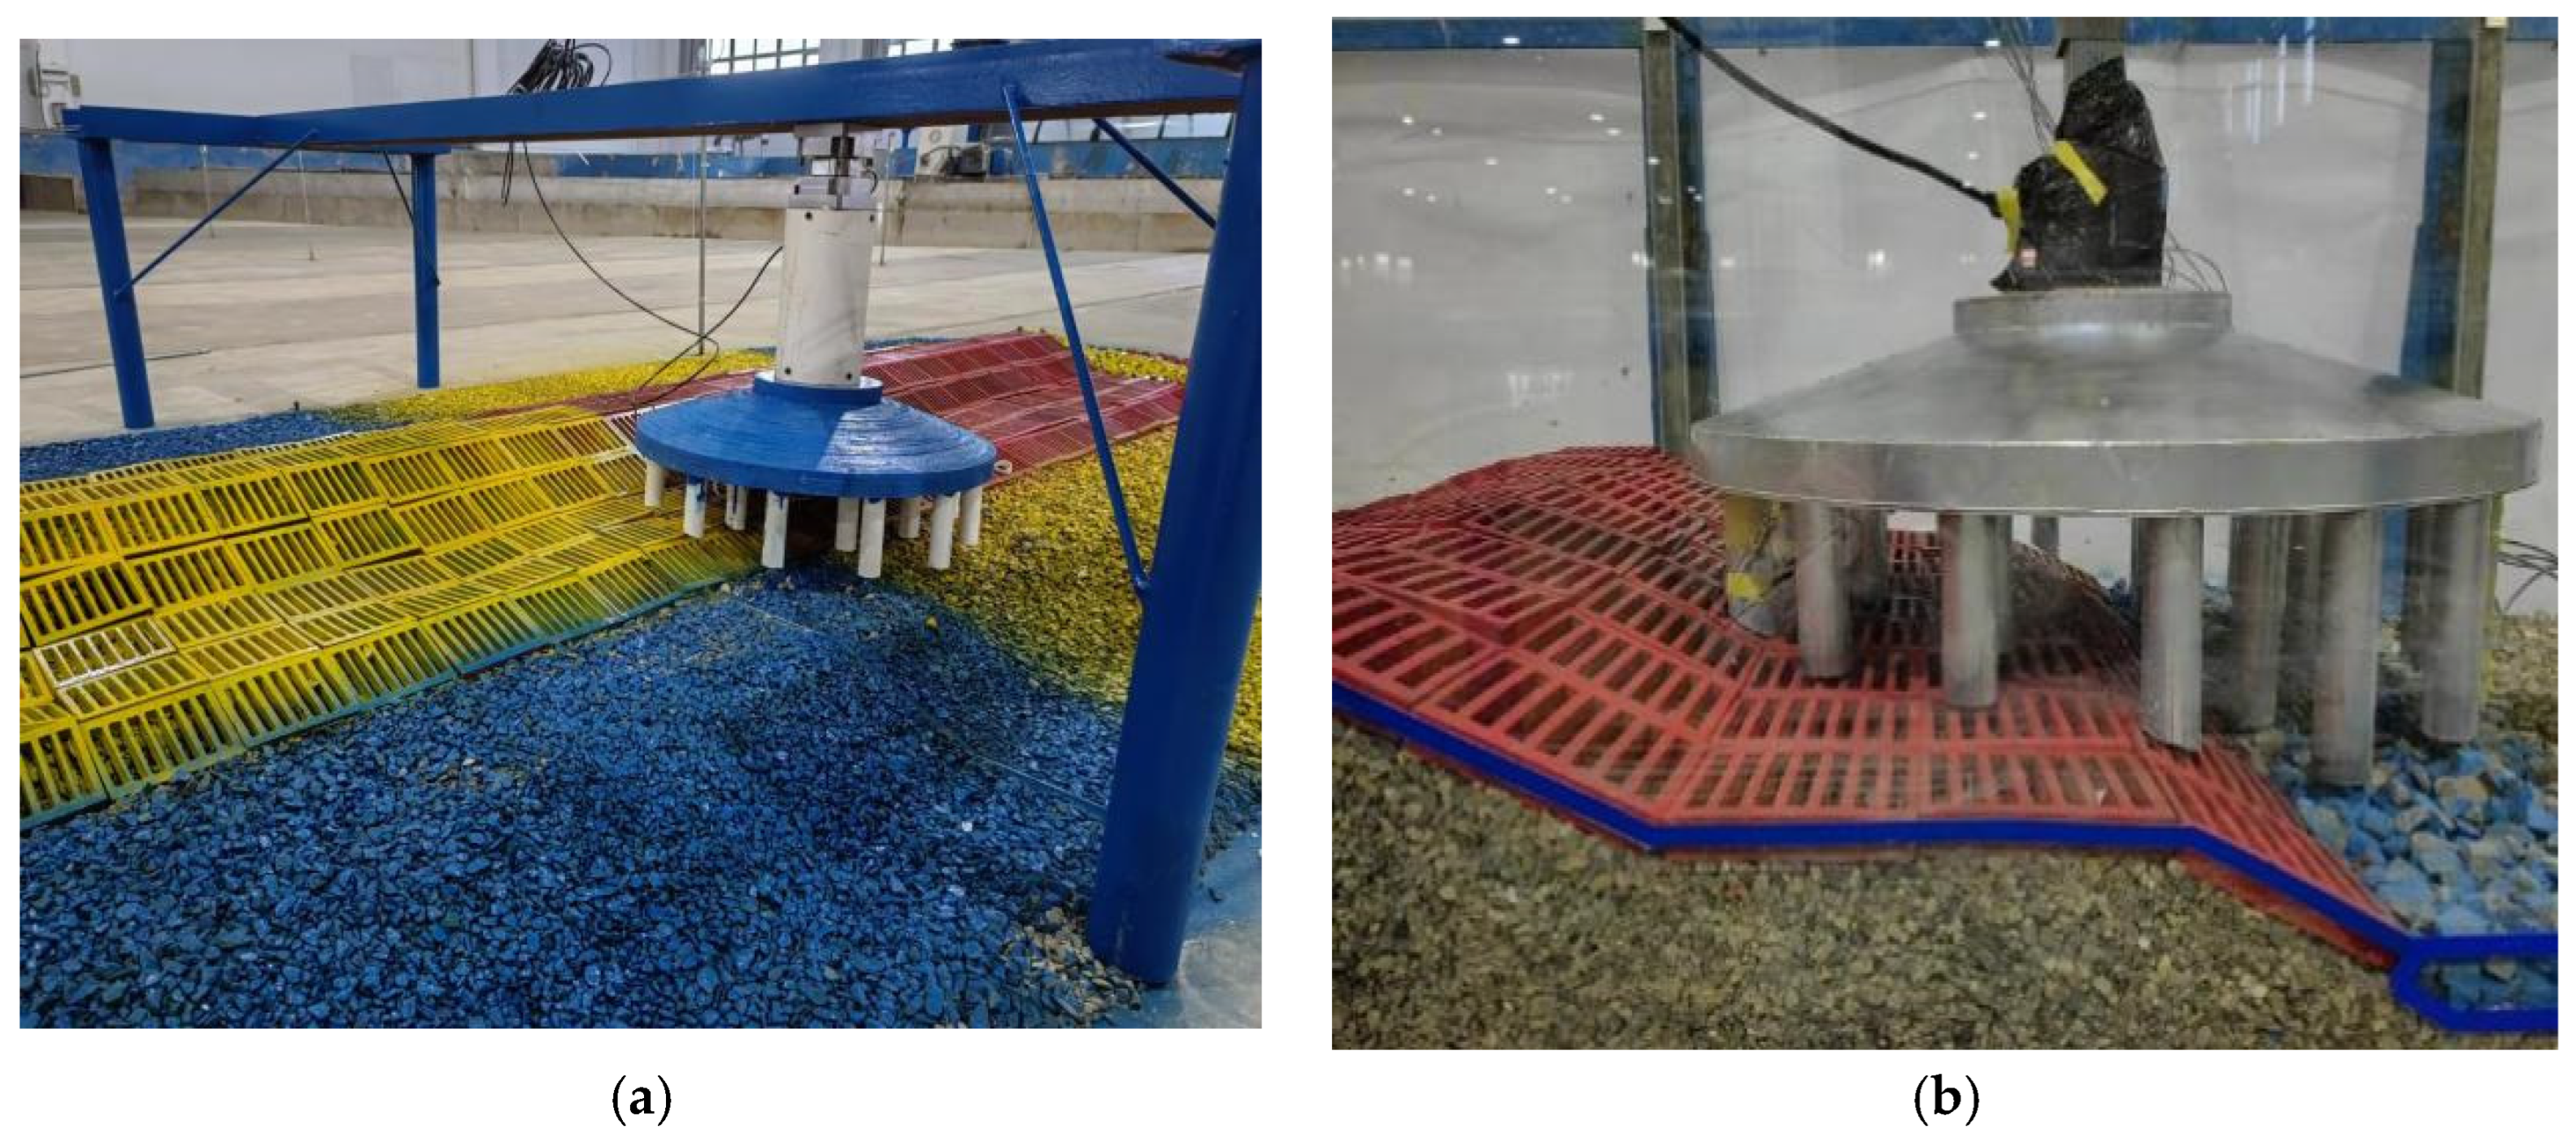
2. Model Experiments

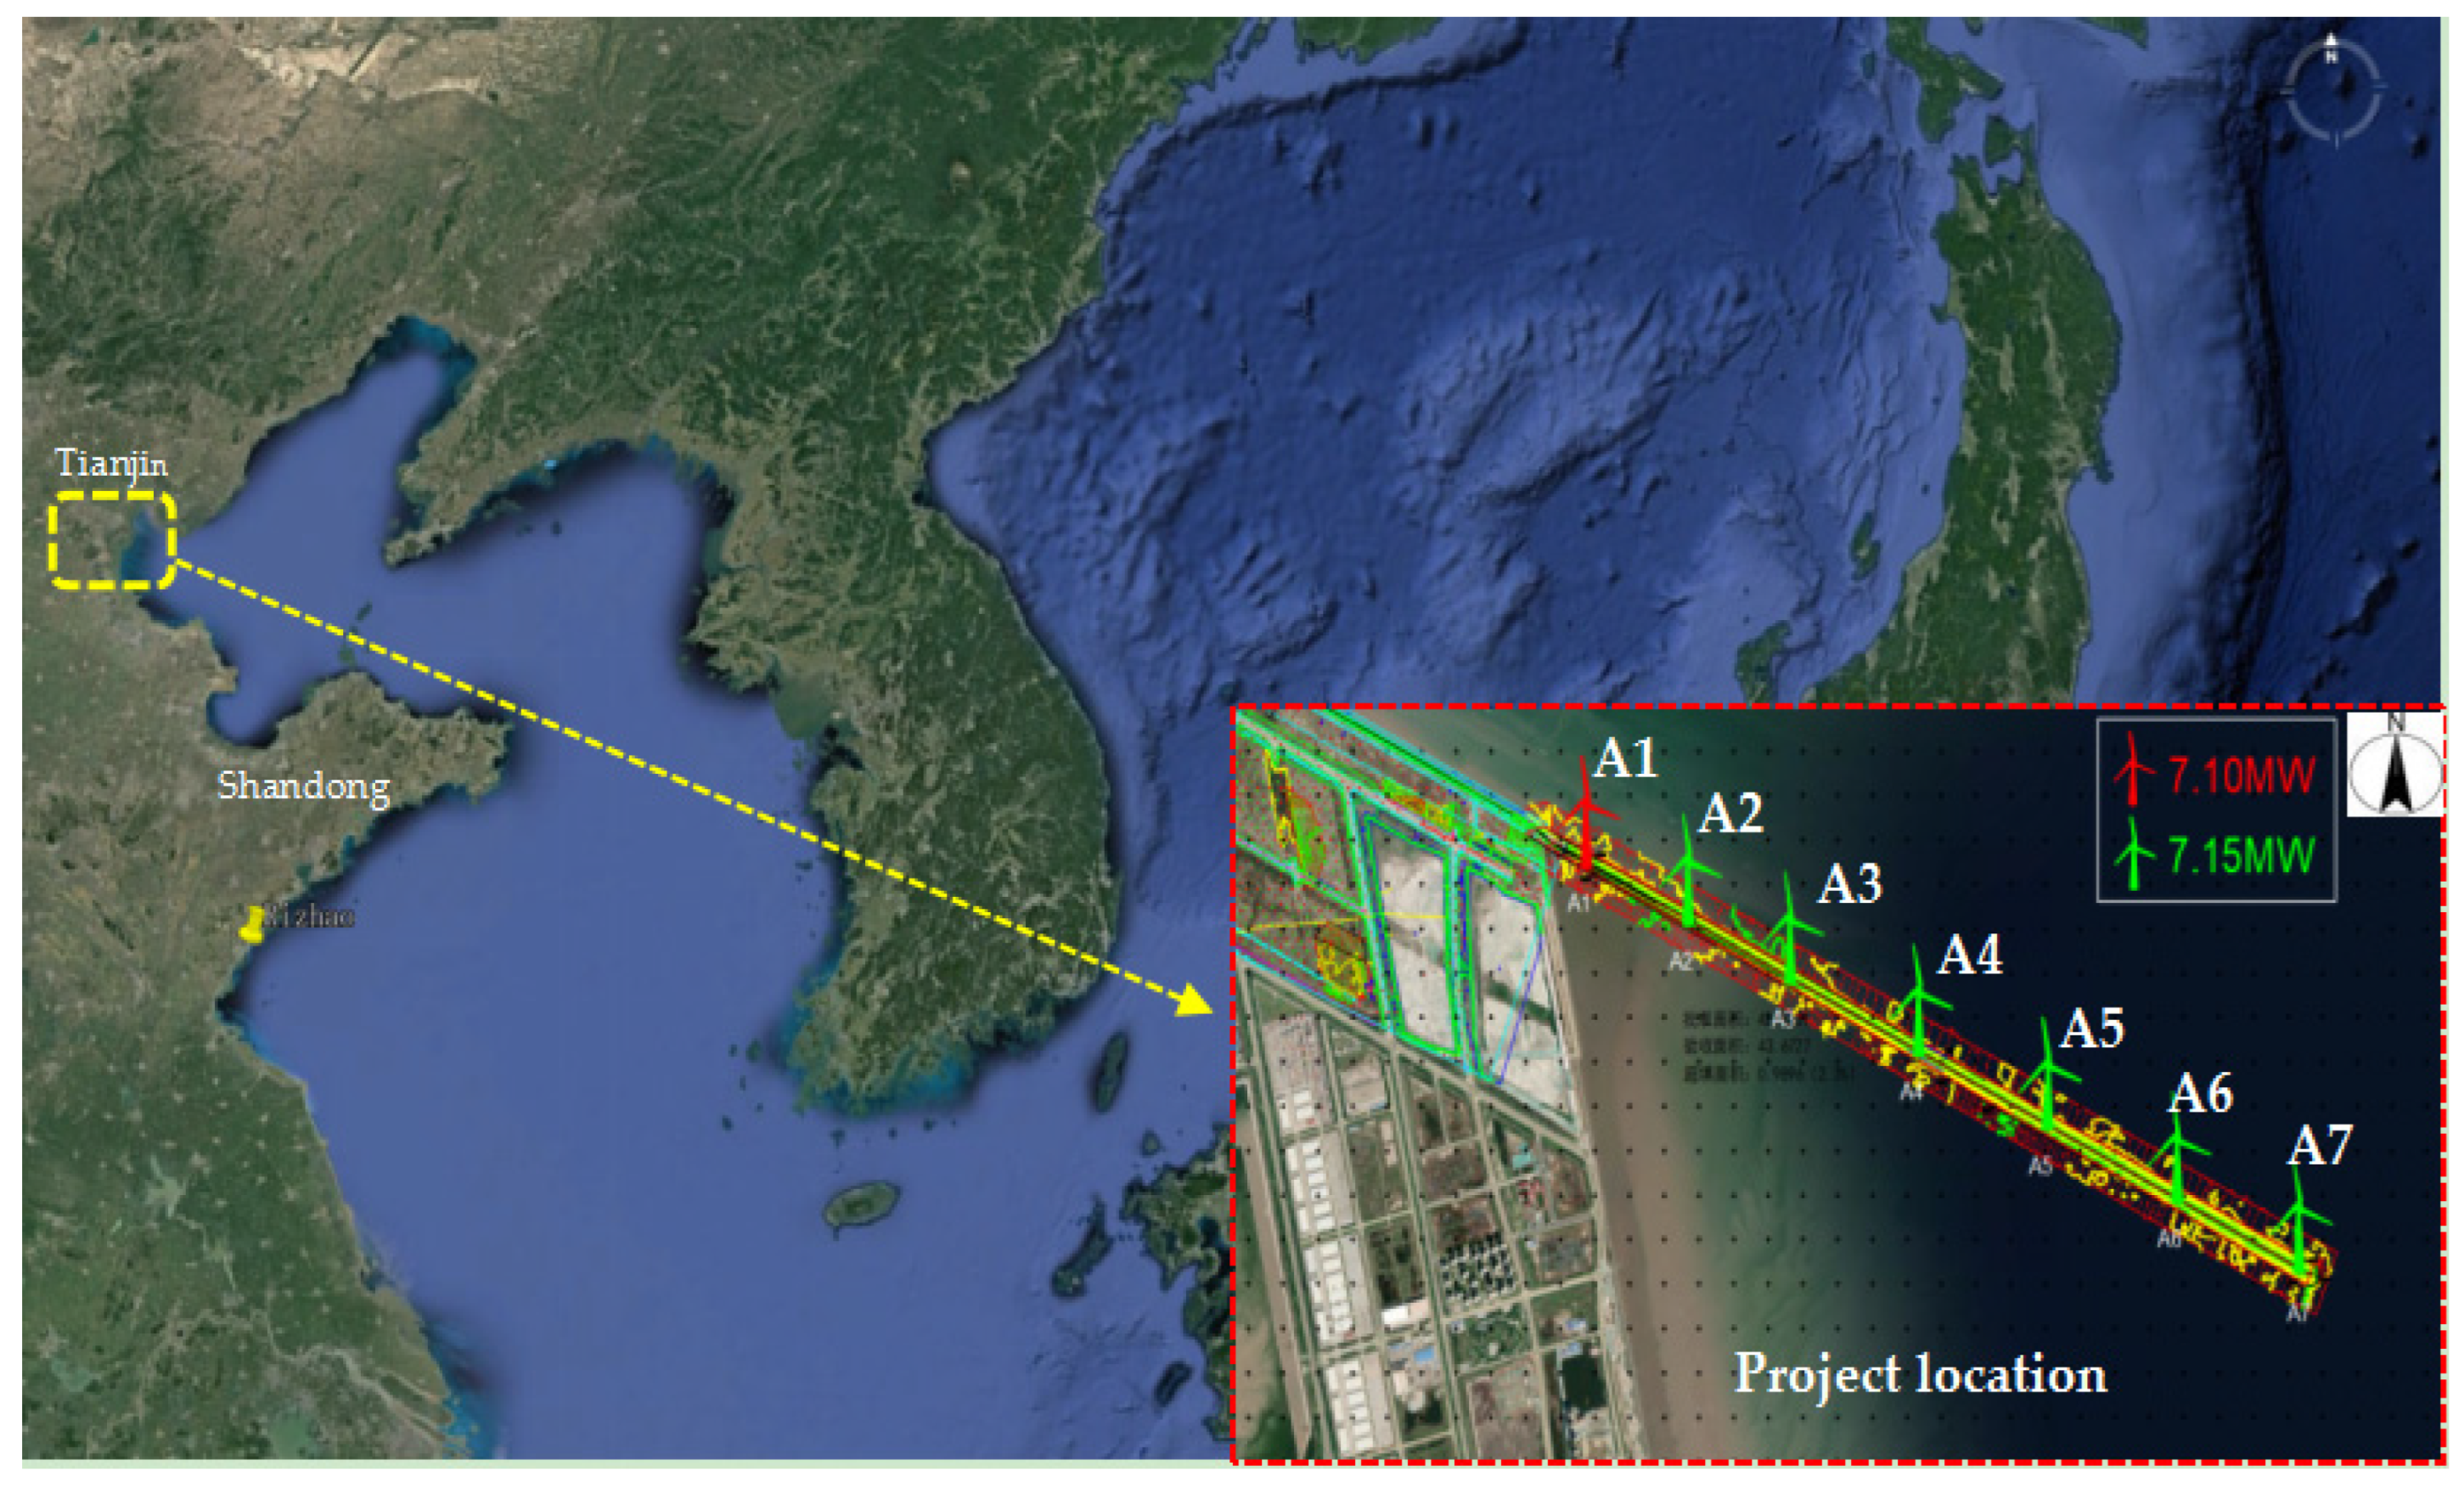
2.1. Engineering Background

The project is located on the north breakwater of Dongjiang Port in Tianjin, with a total length of about 5.0 km and a water depth ranging from −6.0 m to 0.0 m. Seven wind turbines, numbered A1 to A7, will be constructed on the southwest side of the breakwater axis, with a distance of approximately 770 m between each two turbines. The position relationship between the wind turbines and the breakwater is shown in Figure 1. A1 is located in the root section of the embankment, A2–A5 are located in the body section of the embankment, and A6–A7 are located in the head section of the embankment.
According to the analysis of wave characteristics in the engineering sea area, it is found that the waves in this sea area exhibit significant seasonal variations. Affected by the NE monsoon in winter and the SE monsoon in summer, the main wave directions affecting this sea area are NE~E~SE. Considering the positional relationship of A1~A7 wind turbines on the breakwater, combined with the size and test accuracy of the laboratory harbor, and in accordance with the Technical Specification for Simulation Testing of Water Transport Engineering (JTJ/T231-2021) [33], the A6–A7 section of the breakwater head area, including the breakwater and two wind turbines, was selected for model testing. The model range is shown in Figure 1.

2.2. Experimental Design

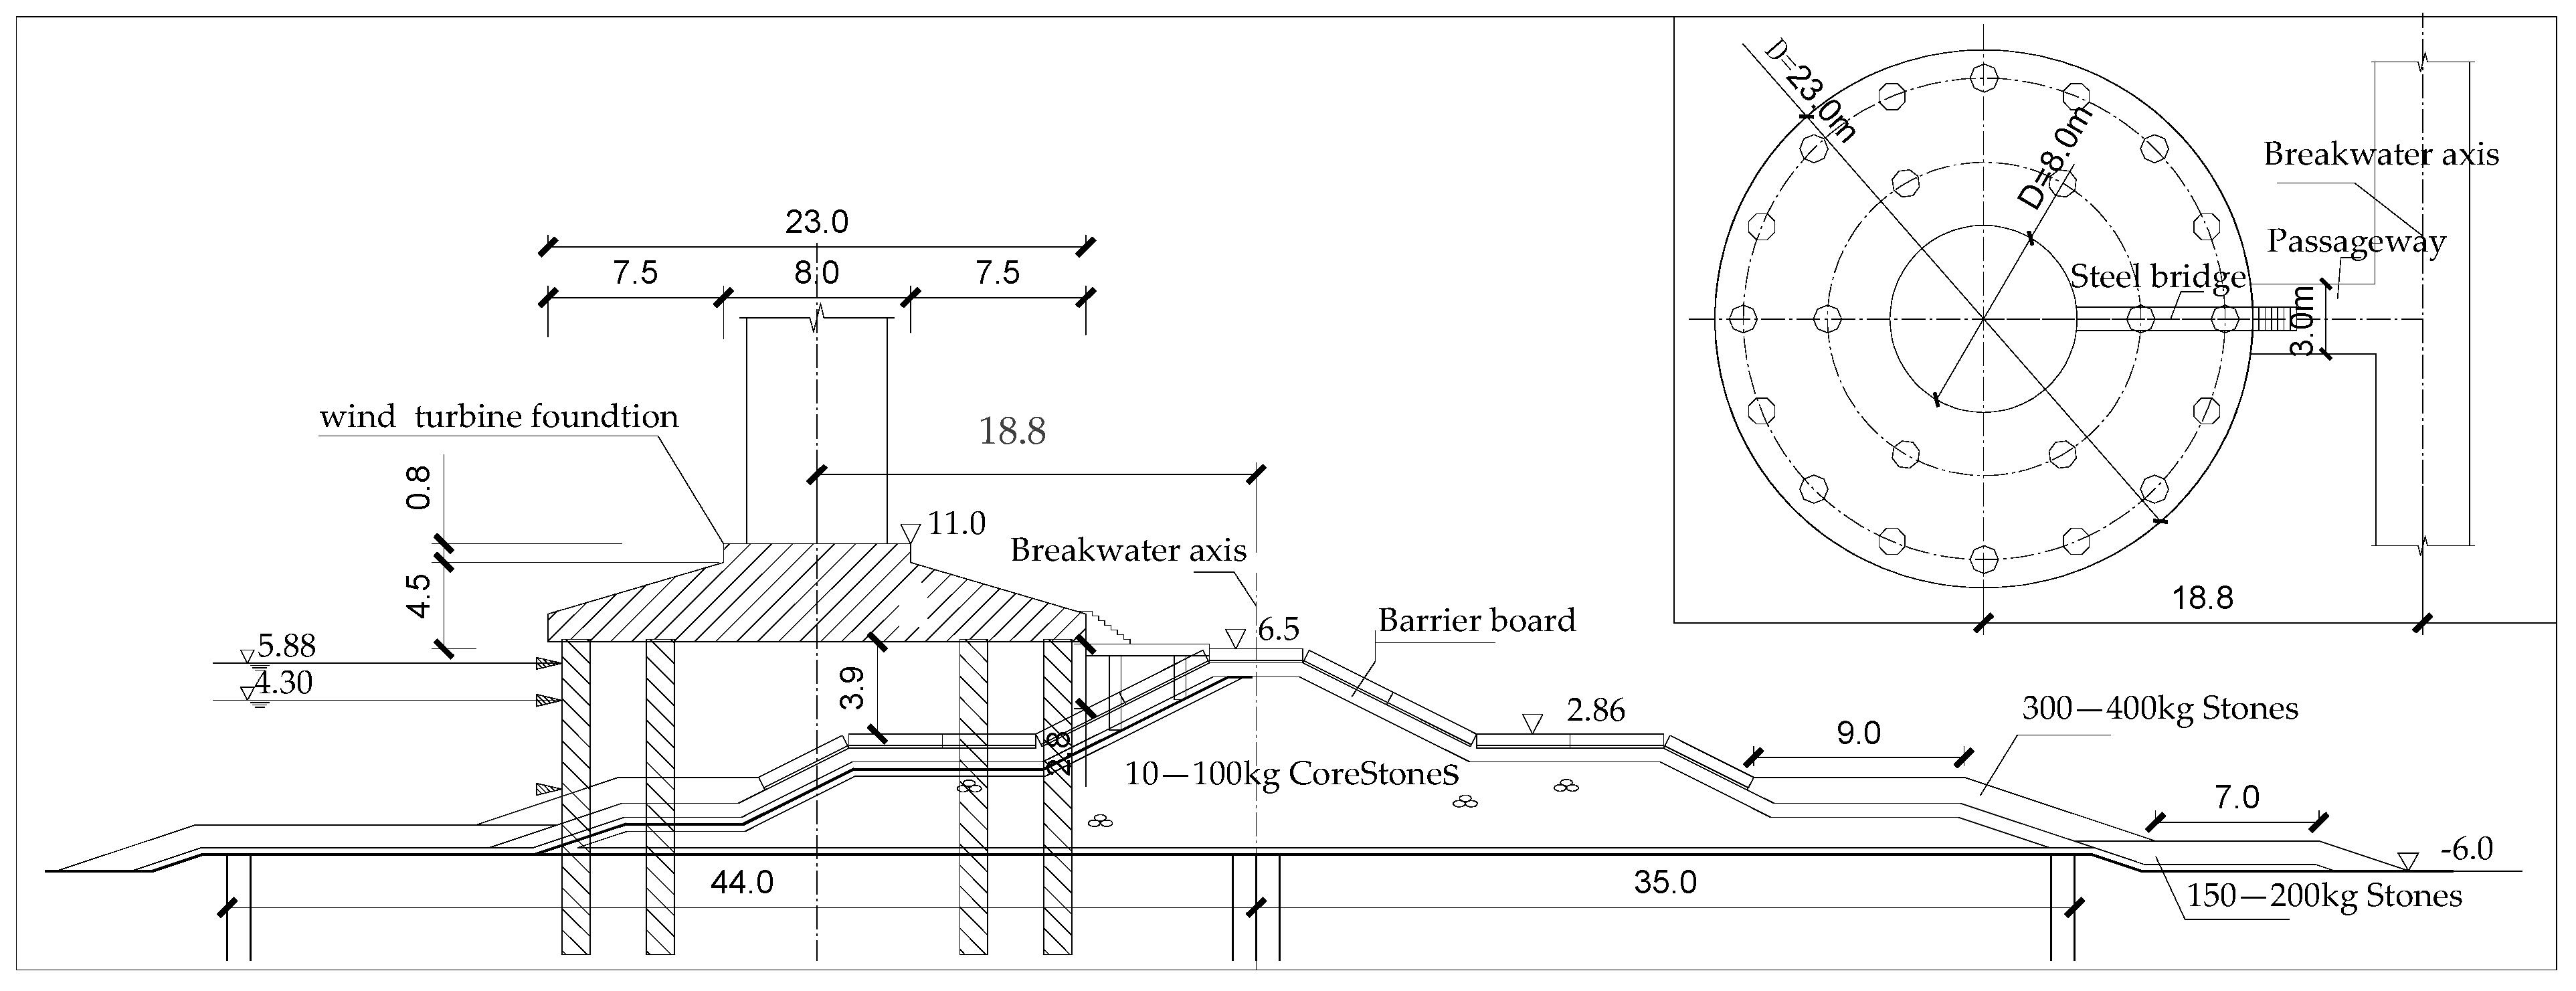
2.2.1. Infrastructure Scheme

The wind turbine foundation adopts a high pile structure consisting of an upper bearing platform and a lower multi-pile combination. The total number of piles divided into inner and outer circles is 22, with a diameter of 1.2 m. The upper pier is in the shape of a platform, with top and bottom elevations of 11.0 m and 6.8 m, respectively, which is 0.3 m higher than the existing breakwater top elevation (6.5 m). The relationship between the foundation and the breakwater is as follows: the lower pile spans over the slope of the breakwater, and the closest distance between the top platform of the pier and the breakwater is 2.8 m. The top of the breakwater can be accessed through a 3.0 m wide steel approach bridge to the top platform of the pier. The cross-section of the foundation and breakwater, as well as their positional relationship, are shown in Figure 2.

2.2.2. Working Condition Design and Boundary Simulation

  • Experimental condition design
Determination of test water level: Based on the bottom elevation of the pier and the need to address the wave rise of the pier, two high tide levels, namely 4.30 m and 5.88 m, were selected in the engineering sea area.
Experimental wave determination: In order to consider the shielding effect of the breakwater, as well as the diffraction and reflection effects of the breakwater head, and the positional relationship between the wind turbine and the breakwater, four wave directions with angles of 0°, 45°, 90°, and 135° to the breakwater axis were selected. The experimental wave elements are shown in Table 1.
2.
Model Design and Production
According to the Technical Specification for Simulation Testing of Water Transport Engineering (JTJ/T231-2021), the test adopts a normal model and is designed according to the Froude number similarity law. The simulation of various physical quantities is as follows: geometric scale is L r = 1:40; time scale is T r = L r 1 / 2 ; weight scale is M r = L r 3 ; wave force scale is F r = L r 3 ; and wave height ratio scale is H r = L r .
The experiment was conducted in a 40 m wide and 40 m long harbor basin equipped with 40 1.0 m wide lightweight flat push wave generator units. The wave-making capability is as follows: maximum wave-making depth of 0.5 m, wave height of 0–0.3 m, period of 0.5–3.0 s, and each unit can be freely spliced to achieve multi-directional wave-making. To reduce wave boundary reflection, wave absorbers are installed around the harbor basin. The experimental simulation scope includes two parts, namely a 1210 m long breakwater and two wind turbines, A6 and A7. The terrain within the simulation range is replicated using the pile point method, arranged at 1.0 × 1.0 m2, and the elevation is controlled using a level. The production of the breakwater is controlled by setting up broken panels, and the shape is reduced according to geometric scales. Wind turbines are made of wood and plastic panels. All errors meet the standard requirements, and the completed model is shown in Figure 3.
3.
Environmental simulation and methods
Wave simulation: Irregular waves were used in the experiment, and based on the wave characteristics in the sea area of this project, the wave spectrum regulations in the “Hydrological Code for Ports and Navigational Channels” (JTS145-2015) [34] were used for demonstration. After that, the final spectrum was determined to be the JONSWAP spectrum (γ = 3.3). Simulate irregular waves with more than 120 waves each time, and repeat 3 times, with wave height and period errors controlled within ±2% of the allowable specifications.
Stability assessment criteria for protective blocks: After continuous wave action, measure the deformation size of the breakwater protective block to determine if it is less than the thickness of a single block and assess its stability.

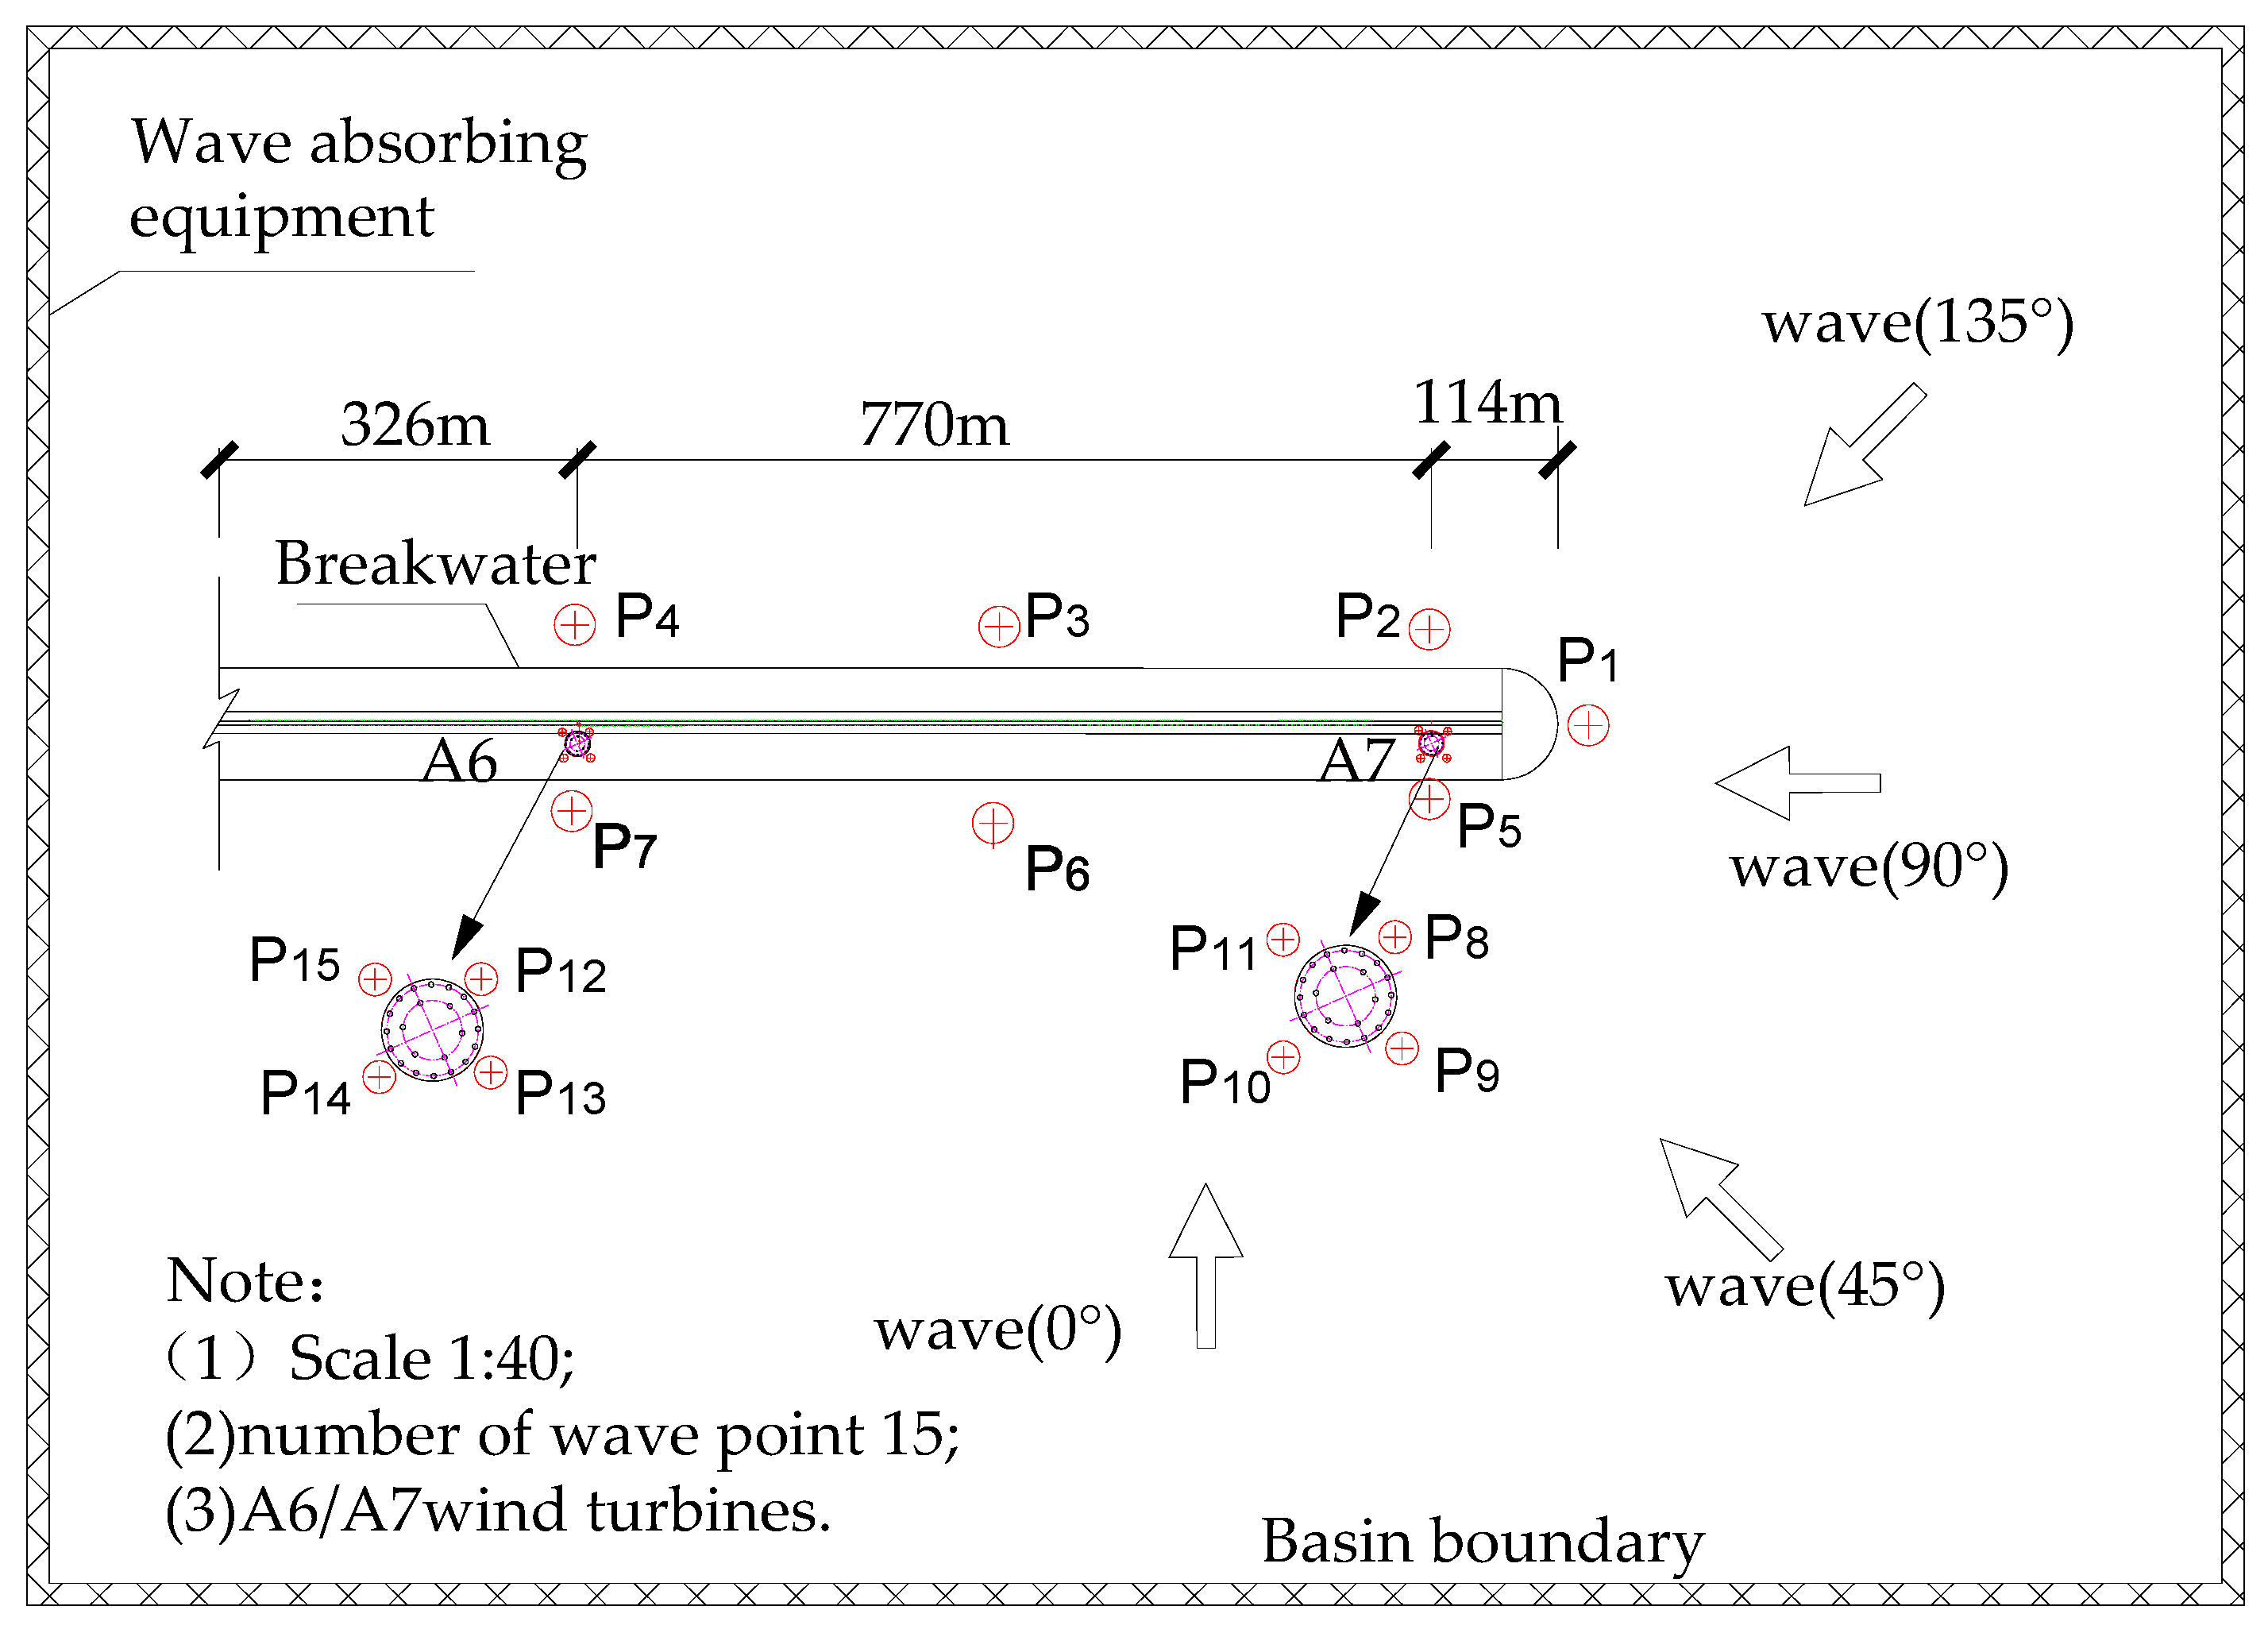
2.2.3. Layout and Methods of Measuring Points

Wave height measurement points: A total of 15 measurement points are arranged around the wind turbine foundation and along the breakwater, as shown in Figure 4. The experimental data were collected and analyzed using the TK2008 wave height acquisition system.
Wave force measurement point: Using a TK-1-type total force sensor, it is fixedly connected to the top of the wind turbine foundation as a whole during measurement, and the lower structure is not in contact with the breakwater, ensuring the reliability of the total force sensor measurement results. Based on strain gauges, the principle of resistance strain gauges is applied to achieve total force measurement. Experimental accuracy control: Utilizing pre-test calibration and calibration, data control during the test process, and data correction to eliminate external interference effects.
Wave run-up was measured through the PI-1 video monitoring system and the scale on the platform. The measurement of the model is shown in Figure 5.
The experimental steps and objectives are shown in Figure 6.

3. Results

3.1. Variation Law of Wave Height at the Junction of Breakwater and Foundation

Under the action of different wave angles, the wave height distribution results at different positions are shown in Table 2, which includes the comprehensive influence of the breakwater shield, the reflection of the breakwater body, the diffraction of the breakwater head, and the overtopping of the 5.88 m high water level breakwater top. It can be seen from the table the following:
(1)
Comparing the four wave angles of 0°, 45°, 90°, and 135°, the wave height is highest at 0°, the maximum height of the breakwater is Hs = 3.43 m on the upstream side of the wave, and the maximum height of the wind turbine foundation is Hs = 3.82 m at position A7. The minimum wave direction angle is 135°;
(2)
Comparing the wave heights of 5.88 m and 4.30 m, the former is greater than the latter. Comparing the wave height results around the foundations of A6 and A7 wind turbines, the closer they are to the embankment, the greater the wave action they are subjected to;
(3)
For all measurement points, the area affected by the dual structure of the wind turbine foundation and breakwater has the highest wave height results. Comparing the wave height results of the four measuring points around the wind turbine foundation, it is found that far away from the breakwater, the maximum wave height is P9, which is greater than P8. However, when subjected to 135° wave action, the pattern is exactly the opposite, with P8 being greater than P9;
(4)
Comparing the wave height of the breakwater with and without the wind turbine foundation, it was found that the wave height increased by about 10% due to the influence of the foundation, indicating that the high pile wind turbine foundation had little impact.

3.2. Wave Run-Up Results on the Foundation of the Bearing Platform

According to the standard requirements of wind turbine foundation design, if the wave run-up reaches the top elevation of 11.0 m, the design scheme is considered not allowed, and elevation optimization adjustment is required.
The wave run-up results of A6 and A7 wind turbine foundations under four wave angles of 0°, 45°, 90°, and 135° are shown in Table 3. According to the results in the table, under the action of a high water level of 5.88 m, except for the 135° wave action, there is water filling at the top of 11.0 m, especially the 0° angle wave action. The maximum thickness of water filling in A6 and A7 is 0.80 m and 1.33 m, respectively. For the wave action at a water level of 4.30 m, the wave run-up is lower than the design elevation of 11.0 m, which meets the requirements.
Based on the above conditions where the basic wave height does not meet the requirements, an optimization test was conducted on the wind turbine foundation elevation. Specifically, the A6 and A7 wind turbine foundation elevations were raised to 12.0 m and 12.5 m, respectively, and the 5.88 m high water level wave action was continued. The results showed that the wave height at this time was lower than the adjusted elevation, meeting the design requirements. The phenomenon of wave run-up on wind turbine foundations under wave action is shown in Figure 7.

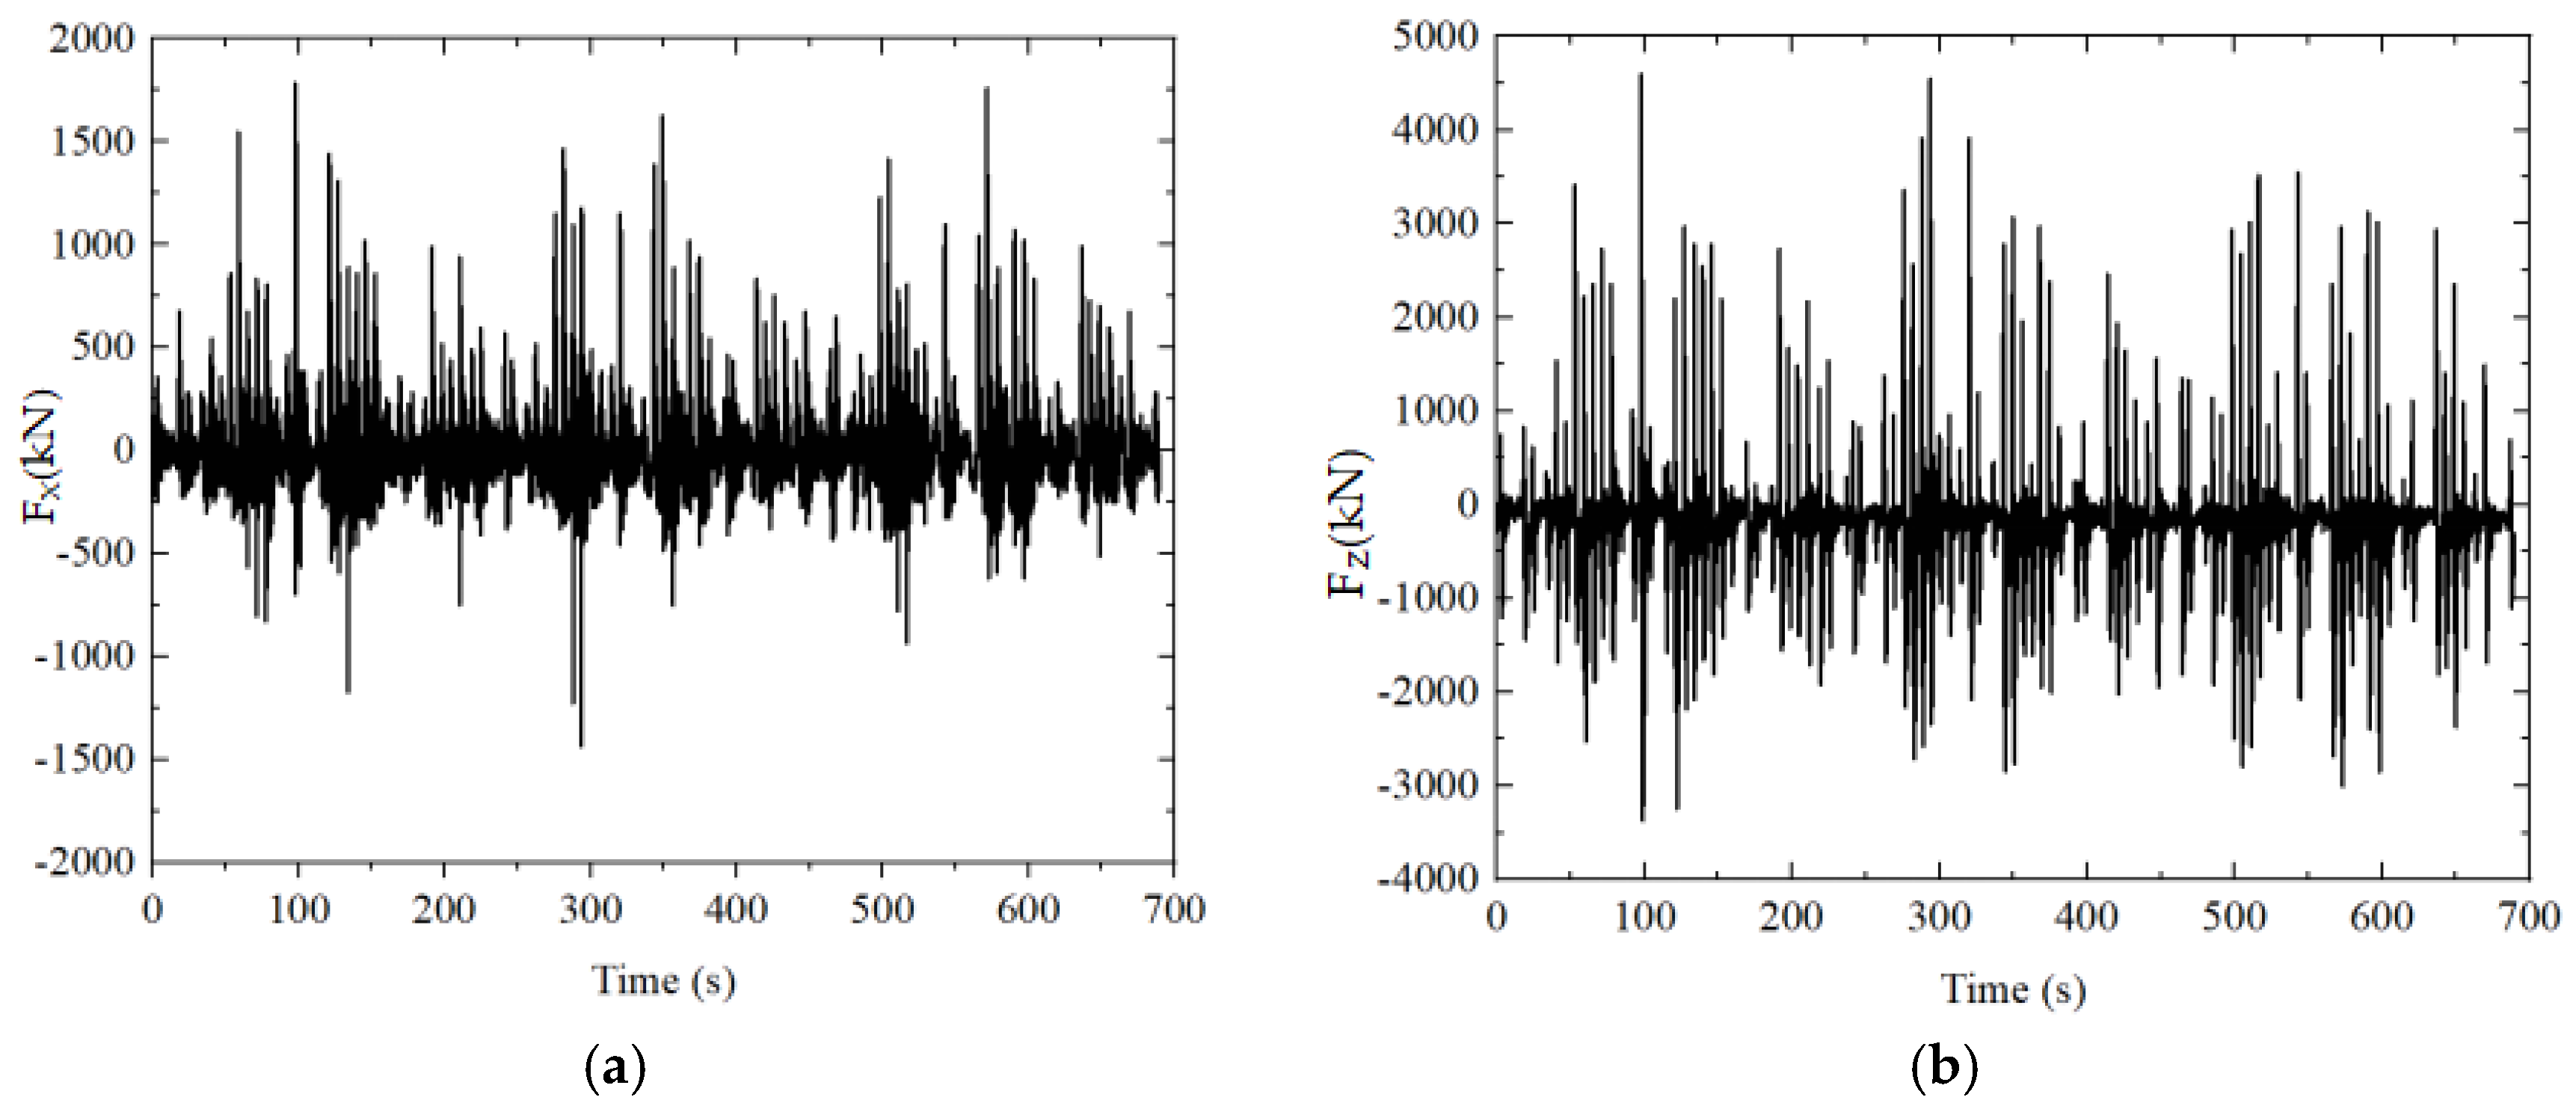
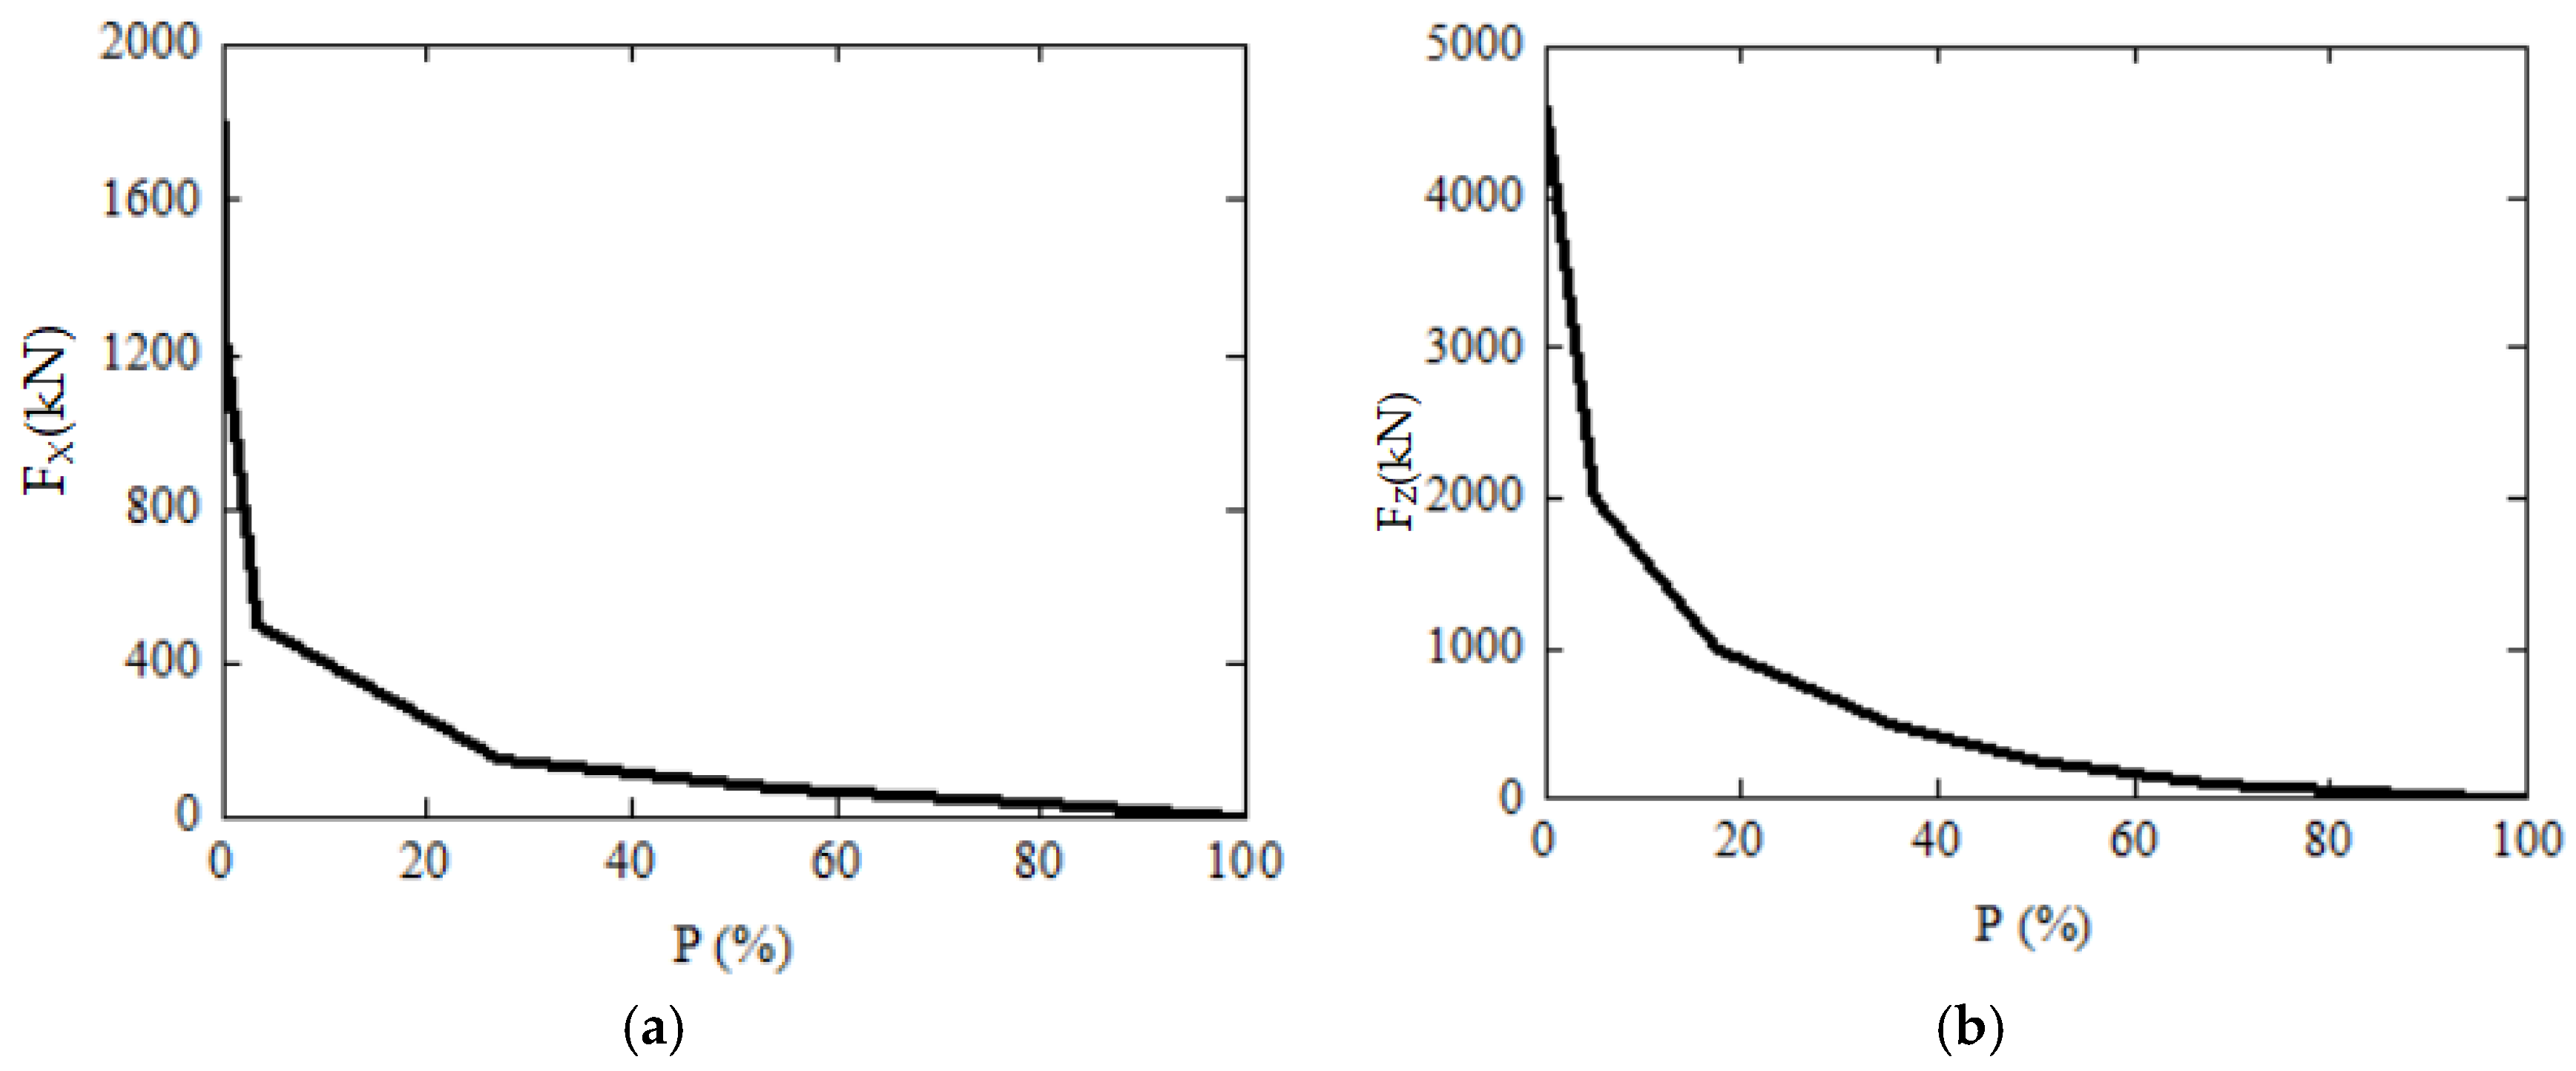
3.3. Results of Wave Force on the Foundation

Similar to the content of wave height distribution and wave run-up tests, two water level tests were conducted at different wave direction angles, as well as the design elevation and adjusted elevation conditions of the bearing platform. The results of the foundation’s wave force were obtained, and the horizontal and vertical forces were separately calculated, as shown in Table 4. From the table, the following can be seen:
(1)
Comparing the four wave angles of 0°, 45°, 90°, and 135°, the maximum wave force occurs at 0°, and there is a vertical force greater than the horizontal force. A6 and A7 have a maximum force of 1213.5 kN and 4869.4 kN, respectively. The foundation force of A7 is approximately four times that of A6, so differentiated design should be considered when designing wind turbine foundation structures at different positions along the axis of the breakwater;
(2)
Comparing the wave heights of 5.88 m and 4.30 m, the former is greater than the latter;
(3)
Comparing the force results of the foundation at two different elevations after design and adjustment, it was found that as the elevation increases, the force decreases significantly. For A7, when the elevation increases by 1.5 m, the wave force can be reduced by 50%.
The statistics of force variation over time and cumulative frequency are shown in Figure 8 and Figure 9.

3.4. Impact of Foundation on the Stability of the Existing Breakwater Armor Structure

To further verify the impact of the foundation on the stability assessment of the existing breakwater armor structure, multiple stability tests were conducted in the harbor and wave flume tests, as shown in Figure 10. The same conclusion was obtained; that is, after continuous wave action, the existing barrier board armor blocks and bottom armor blocks remained stable. Furthermore, it can be inferred from the increase in wave height at the location of the foundation (within 10%) that the construction of the foundation has little impact on the stability of the breakwater.

3.5. Comparative Analysis of Calculation Results with Standard Formulas

To further demonstrate the results of the model experiment, compare them with the calculation results of the standard formula. Therefore, the A7 wind turbine foundation, which is most unfavorable to wave action, was selected for verification.
  • Comparative analysis of wave forces
Using the current “Hydrological Code for Ports and Navigational Channels” (JTS145-2015) (2022 edition) formula, due to the fact that the bottom elevation of the wind turbine foundation structure is higher than the static water surface, the calculation formula for the horizontal force of the wind turbine foundation adopts Equation (7). Different angle wave conditions are substituted into the calculation, and the results are shown in Table 5.
F X = ρ g H 1 % D 2 4 C M sin ( θ )
where F X is the horizontal force; ρ is the density of the water; g is the acceleration of gravity; H 1 % is the wave height with a cumulative frequency of 1%; C M is the inertia force coefficient, taken as 2.0 for circular cross-sections; D is the diameter of the abutment, and this project is a platform structure, so the average value of the upper and lower platforms is taken; and θ is the phase angle, which reaches its maximum value when taken π / 2 .
The calculation formula for the vertical force of the foundation is shown in Equations (8)–(11). Similarly, different angle wave conditions are substituted into the calculation, and the results are shown in Table 5.
F Z X γ H 1 % = K 1 ( 1 Δ d η ) 0.75 exp [ K 2 ( Δ d H 1 % 0.16 ) 2.86 ]
X = L 4 ( 1.3 Δ d H 1 % ) 2
K 1 = 0.93 K 2 exp [ 155 K 2 ( H 1 % L 0.042 ) 2 ]
K 2 = 4.0 tan h ( B 2.2 H 1 % ) 3 / 2 tan h ( 2 π d L )
where F Z is the maximum impact force of the dock panel; X represents the width of the impact in the direction of wave propagation. When the calculated value of X is greater than the diameter of the pier circle, the diameter of the bottom circle of the pier is directly used; B is the width of the bottom of the structure, taken as the circular diameter of the bottom of the bearing platform; K 1 is the wave impact coefficient; K 2 is the influence coefficient of the diameter of the pedestal circle and water depth; and Δ d is the water level rise, generally taken as 0.3~0.5. The meanings of other letters are the same as above.
According to the comparison results in Table 5, it can be seen that the experimental values are all greater than the calculated results of the standard formula. Introducing the relationship between the two into the coefficient KF to represent it, the coefficient KF = 1.2–1.5, with an average of 1.35. At 0°, the minimum difference between the two is about 1.2. And as the angle increases, the coefficient KF becomes larger. At the same time, the vertical force KF value is generally greater than the horizontal force law. The deviation between the experimental values and the calculation results of the standard formula is mainly due to the composite structure composed of the wind turbine foundation pier and multiple piles, which breaks after wave impact and has strong non-linearity, making the standard formula unsuitable. In addition, the angle of wave incidence is also one of the main influencing factors.
2.
Comparative analysis of wave forces
The A7 wind power foundation was also chosen. Using the current “Port and Waterway Hydrological Code” (JTS145-2015) (2022 Edition), the calculation formulas are shown in Equations (12)–(15), and the results are shown in Table 6. According to Table 6, the experimental values are also greater than the calculated results of the standard formula. Similarly, the relationship coefficient KM = 1.2~1.4 is introduced, with an average of 1.25. As the angle increases, KM becomes larger. The main reasons for the analysis are that the formula is not applicable, as well as the combined effects of complex structures and wave incidence angles.
R 1 % = 0.9 { [ 1.24 tan h ( M ) ] + [ ( R 1 ) m 1.029 ] R ( M ) } H 1 %
M = { 0.423 1 m ( L H 1 % ) 0.5 [ tan h ( 2 π d L ) ] 0.5 }
( R 1 ) m = 2.49 [ tan h ( 2 π d L ) ] ( 1 + 4 π d L sin h 4 π d L )
R ( M ) = 1.09 M 3.32 exp ( 1.25 M )
where R 1 % is the run-up with a cumulative frequency of 1%; M is a function related to slope m; m is the slope gradient of the slope; L is the wavelength; d is the water depth in front of the building; and other letters are the same as above.
According to the comparison results between the standard formula calculation and experimental, it can be seen that for the complex structure of wind turbine foundation on the breakwater, in order to ensure its structural stability and the rationality of the top elevation, a certain safety factor needs to be amplified when using standard calculation to carry out similar engineering design, which is about 1.2–1.5. If conditions permit, conduct physical model experiments for verification.

4. Discussion

(1)
The significance of model testing. The research on wind turbine foundation in this model experiment is different from previous deepwater projects in the ocean, manifested as nearshore engineering. At the same time, the project is built on an existing breakwater, so the structure not only needs to withstand the direct action of waves but also consider the changes in local current and wave shape caused by the existing structure. Based on this complex hydrodynamic environment, the calculation values for structural safety design are greatly challenged, especially the determination of coefficients in previous calculation formulas and the accuracy of calculations. Especially for the determination of the foundation design elevation that directly affects the safety of power supply equipment, the results of this experiment also prove that there is a deviation of 20–50% between the two. Therefore, for major projects, it is necessary to use model experiments for verification;
(2)
Future research work. Although the project belongs to nearshore engineering, the impact of wind and current loads on wind turbine foundations is much smaller than that of open sea areas. However, for offshore wind turbine engineering, a large number of scholars have studied wind loads [35,36] and current loads [37,38], and the results show that these two loads are also important factors affecting foundation safety design. Currently, the experimental results only provide results under wave loads. Therefore, further improvement will be made on the degree of influence of wind and current loads on the wind turbine foundation of breakwaters to further ensure structural safety;
(3)
The trend of constructing wind turbine projects on breakwaters. For the wind turbine foundation of the breakwater, research has shown that the implementation of wind turbine engineering only increases the wave height of the breakwater by 10% and has little impact on stability. In addition, compared to other seabed wind turbine foundations, which are protected by breakwaters, there is no need to pay attention to erosion protection and foundation treatment at this time. At the same time, due to the shallow water depth near the shore, it is also convenient for foundation construction, further saving engineering investment. These conditions will be conducive to the promotion and application of wind power projects built on breakwaters. Therefore, in the future development and construction of offshore wind turbine projects, building wind turbine projects on breakwaters will be the main trend for nearshore wind turbine projects in the face of complex ocean environments.

5. Conclusions

With the development and utilization of offshore wind turbine projects in the field of existing breakwaters, in order to ensure the safety of wind turbine foundation structures and evaluate the impact on existing breakwaters after project implementation, A6 and A7 wind turbine foundations on the outermost side of the breakwater were selected. A 1:40 scale model test was conducted to obtain the following results before and after project implementation:
(1)
Comparing the wave heights at four wave angles of 0°, 45°, 90°, and 135°, the maximum wave height at 0° wave direction was Hs = 3.82 m, and at position A7. After the construction, the wave height at the breakwater location increased by 10%. Based on the stability results, it is believed that the overall impact is not significant;
(2)
Wave run-up under the action of waves at a high water level of 5.88 m, except for 135° wave direction, does not meet the requirements. When the elevations of A6 and A7 are adjusted to 12.0 m and 12.5 m, it is feasible;
(3)
At 0° wave direction, the foundation is subjected to the maximum wave force due to wave action, and the vertical force is greater than the horizontal force. The maximum wave forces of A6 and A7 are 1213.5 kN and 4869.4 kN, respectively, with a difference of about 4 times. After raising the elevation, the force decreases by 50%. The design needs to consider differentiated design according to different location types;
(4)
The comparison between the test results and the calculation results of the standard formula is basically 1.2–1.5 times, which can enrich the current standard calculation basis. This study not only solves practical problems in engineering but also provides valuable experimental data and reference for the construction of wind power projects on breakwaters in the future.

Author Contributions

J.C.: model design and testing, paper preparation, data processing, and analysis of variation law of wave height; L.G.: model made and testing, paper writing, data processing, and analysis of wave run-up; Y.X.: data collection, data processing, analysis of wave force, and funding support; S.C.: series group model testing, test instrument debugging, test terrain processing, and data verification. All authors have read and agreed to the published version of the manuscript.

Funding

This study was financially supported by the National Key R&D Program of China (2022RDC2012300) and the National Natural Science Foundation of China (42307597); special fund for central scientific research institutes (TKS20240502, TKS20230205, TKS20230505, and TKS20230515).

Data Availability Statement

Data sharing is applicable to this article, as new data were created or analyzed in this study.

Acknowledgments

This physical model test was conducted in the experimental harbor basin of the Tianjin Research Institute for Water Transport Engineering.

Conflicts of Interest

The authors declare no competing interests. The corresponding author is responsible for submitting a competing interest statement on behalf of all authors of the paper.

References

  1. Chi, C.G. Current status of basic research on offshore wind power. Shanxi Archit. 2018, 44, 47–48. [Google Scholar] [CrossRef]
  2. Yu, T.; Zhao, Z.; Shi, Z. Experimental Investigation of Wave Load and Run-up on the Composite Bucket Foundation Influenced by Regular Waves. J. Ocean. Univ. China 2021, 20, 271–284. [Google Scholar] [CrossRef]
  3. Huang, W.P.; Shang, J.H.; Wang, J.F. Current Status of Offshore Wind Turbine Foundation Structures Abroad. In Proceedings of the Inaugural Meeting and First Academic Symposium of the Ocean Energy Professional Committee of the China Renewable Energy Society, Hangzhou, China, 27–28 March 2008; Volume 6, pp. 51–58. [Google Scholar]
  4. Zhang, Q.; Tang, G.; Lu, L. Scour protections of collar around a monopile foundation in steady current. Appl. Ocean. Res. 2021, 112, 102718. [Google Scholar] [CrossRef]
  5. Jia, X.L.; Sun, Z.Z.; Deng, Z.C. Analysis of bearing capacity and structural strength of multi pile underwater foundation. China Ocean. Platf. 2020, 35, 74–79. [Google Scholar]
  6. Shuiitu, A.A.; Mehmanparast, A.; Hart, P. Comparative study between S-N and fracture mechanics approach on reliability assessment of offshore wind turbine jacket foundations. Reliab. Eng. Syst. Saf. 2015, 215, 107838. [Google Scholar] [CrossRef]
  7. Yu, T.S. Research on the Dynamic Response and Flushing Characteristics of Composite Cylinder-Type Foundation; Tianjin University: Tianjin, China, 2014. [Google Scholar]
  8. Li, X.; Zhang, M.M.; Yang, H.L. Research on the Intelligent Control of Fatigue Loads for Tension-leg Floating Wind Motor Units. J. Sol. Energy 2020, 41, 278–286. [Google Scholar]
  9. Chen, W.Y.; Gao, Y.Y.; Wang, B. Numerical simulation study on wave climbing of offshore wind power foundation based on mass source term wave generation. In Proceedings of the 19th China Ocean (Shore) Engineering Academic Symposium (Part 1), Zhoushan, China, 1 September 2019; Volume 8, pp. 266–272. [Google Scholar]
  10. Shan, T.B. Exploration of the Mechanism of Wave Climbing and Key Characteristics of Air Gap Response in Semi submersible Platforms; Shanghai Jiao Tong University: Shanghai, China, 2013. [Google Scholar]
  11. Ramirez, J.; Frigaard, P.; Andersen, T.L. Large scale model test investigation on wave run-up in irregular waves at slender piles. Coast. Eng. 2013, 72, 69–79. [Google Scholar] [CrossRef]
  12. Chen, L.L.; Jiang, J.N.; Liu, C.G. Effect of wave load on vibration response of offshore wind turbine-type infrastructure. Renew. Energy Resour. 2024, 42, 774–780. [Google Scholar] [CrossRef]
  13. Wang, T.; Zhang, Q.; Ye, G.L. The influence law of wave loads and soil characteristics on the horizontal deformation of wind power single pile foundations. Mar. Eng. 2022, 40, 93–103. [Google Scholar] [CrossRef]
  14. Liu, R.; Sun, G.D.; Yuan, Y. Research on the cumulative inclination of offshore wind and torch type foundation under asymmetric wind-wave loads. J. Tianjin Univ. 2023, 56, 613–622. [Google Scholar] [CrossRef]
  15. Kong, D.S.; Zhang, J.; Gong, Y. Analysis of factors influencing stress deformation characteristics of offshore wind power single pile foundation under wave loads. Mar. Sci. Bull. 2020, 39, 632–640. [Google Scholar] [CrossRef]
  16. Jiang, T.; He, T.L.; Wang, X.A. Research on the hysteresis effect and horizontal bearing capacity change characteristics of offshore wind turbine pile foundation under wave loads. J. Sol. Energy 2024, 45, 546–553. [Google Scholar] [CrossRef]
  17. Yan, B.W.; Zhu, H.L.; Huang, X. Study on the Influence of Typhoon Non stationarity on the Dynamic Response of Steel Grid Floating Foundation Offshore Wind Turbine. Eng. Mech. 2022, 39, 237–246. [Google Scholar] [CrossRef]
  18. Luo, L.B.; Wang, Y.A.; Huang, J.Q. Research on the influence of ocean cyclic load on the basic horizontal bearing capacity of suction barrels. J. Sol. Energy 2021, 42, 142–147. [Google Scholar] [CrossRef]
  19. He, B.; Song, M.X.; Wei, M.X. Research on Wave Load Characteristics of Large Diameter Single Pile Foundations for Offshore Wind Power. J. Sol. Energy 2024, 45, 324–330. [Google Scholar] [CrossRef]
  20. Qin, T.Q.; Yuan, C.F.; Yuan, M.H. Basic dynamic load bearing characteristics of offshore wind power suction barrels based on the East China Sea wind and wave statistics from 2010 to 2020. Mar. Eng. 2023, 41, 169–178. [Google Scholar] [CrossRef]
  21. Qin, M.F. Research on the Response of Large Offshore Wind Power Infrastructure During the Typhoon; Dalian University of Technology: Dalian, China, 2023. [Google Scholar]
  22. Liu, H.Y. Research on the Coupling Bearing Characteristics of Large-Diameter Steel Pipe Pile Foundations of Offshore Fan Under Combined Loads; Jiangsu University of Science and Technology: Jiangsu, China, 2023. [Google Scholar]
  23. Bredmose, H.; Skourup, J.; Hansen, E.A. Numerical reproduction of extreme wave loads on a gravity wind turbine foundation. In Proceedings of the 25th International Conference on Offshore Mechanics and Arctic Engineering, Hamburg, Germany, 4–9 June 2006; American Society of Mechanical Engineers: Santa Clara, CA, USA, 2006; Volume 8, pp. 279–287. [Google Scholar]
  24. Marcus, D.; Hojjat, M.; Wuchner, R. A numerical wave channel for the design of offshore structures with consideration of wave—Current interaction. In Proceedings of the Paper presented at the The Twenty-second International Offshore and Polar Engineering Conference, Rhodes, Greece, Vladivostok, Russia, 17–22 June 2012; Volume 1, pp. 695–702. [Google Scholar]
  25. Guan, N. Study on Wave Load of Offshore Wind Turbine Foundation Structure; Tianjin University: Tianjin, China, 2013. [Google Scholar]
  26. Mccamy, Y.; Fuchs, R. Wave Forces on Piles: Diffraction Theory; Corps of Engineers Washington DC Beach Erosion Board: Washington, DC, USA, 1954. [Google Scholar]
  27. Kriebel, D.L. Nonlinear wave interaction with a vertical circular cylinder. Part I: Diffraction theory. Ocean. Eng. 1990, 17, 345–377. [Google Scholar]
  28. Kriebel, D.L. Nonlinear wave interaction with a vertical circular cylinder. Part II: Wave run-up. Ocean. Eng. 1992, 19, 75–99. [Google Scholar] [CrossRef]
  29. Martin, J.A.; Easson, W.J.; Bruce, T. Run-up on columns in steep, deep water regular waves. J. Waterw. Port Coast. Ocean. Eng. 2001, 127, 26–32. [Google Scholar] [CrossRef]
  30. Hallermeier, R.J. Nonlinear flow of wave crests past a thin pile. J. Waterw. Port. Coast. Ocean. Eng. 1976, 102, 365–377. [Google Scholar]
  31. Vos, L.D.D.; Frigaard, P.; Rouck, M.D. Wave run-up on cylindrical and cone shaped foundations for offshore wind turbines. Coast. Eng. 2007, 54, 17–29. [Google Scholar] [CrossRef]
  32. Kazeminezhad, M.H.; Etemad-Shahidi, A.A. New method for the prediction of wave run-up on vertical piles. Coast. Eng. 2015, 98, 55–64. [Google Scholar] [CrossRef]
  33. JTJ/T231-2021; Technical Specification for Simulation Test of Water Transport Engineering. People’s Communications Press: Beijing, China, 2021.
  34. JTS 145-2015; Code of Hydrology for Harbor and Waterway. People’s Communications Publishing House Co., Ltd.: Beijing, China, 2015.
  35. Lu, Z.Y.; Ma, H.W.; Li, Y.H. Experimental Study on the Influence of Typhoons on the Cumulative Deformation of Monopile Foundations for Offshore Wind Turbines. J. Mar. Technol. 2019, 38, 75–82. [Google Scholar] [CrossRef]
  36. Li, Y.Z. Research on the Dynamic Bearing Characteristics of Offshore Wind Power Single Pile Foundation Under Wind-Wave-Gravity Load; Shandong University of Science and Technology: Qingdao, China, 2020. [Google Scholar]
  37. Yu, H.K. Research on the Dynamic Response of Offshore Fan-Plunger Wing Pile Foundation Under Wave Current Load; Hebei University: Beijing, China, 2023. [Google Scholar]
  38. Li, T.; Wang, S.Y.; Li, B. Experimental study on local scour of large-diameter wing single pile foundation for offshore wind turbines under wave and current effects. Ocean. Eng. 2024, 42, 60–70. [Google Scholar] [CrossRef]
Figure 1. Geographical location map of the project.
Energies 18 01676 g001
Figure 2. Wind turbine foundation and breakwater section (unit: m).
Energies 18 01676 g002
Figure 3. The effect after the completion of module production.
Energies 18 01676 g003
Figure 4. Layout of wave height measurement points in the port.
Energies 18 01676 g004
Figure 5. Measurement methods for wave height, wave force, and wave run-up on the model. (a) Wave height and total force sensor; (b) video monitoring.
Energies 18 01676 g005
Figure 6. Experimental steps and objectives.
Energies 18 01676 g006
Figure 7. Wave run-up phenomenon on wind turbine foundation at different elevations. (a) A7 wind turbine foundation 11.0 m design elevation wave run-up; (b) A6 wind turbine foundation 11.0 m design elevation wave run-up; (c) A7 wind turbine foundation optimized to 12.5 m elevation for wave run-up; (d) A6 wind turbine foundation optimized to 12.0 m elevation for wave run-up. The red arrow indicates the moment when the wave climbs high.
Energies 18 01676 g007
Figure 8. Force variation process of wind turbine foundation under the action of 0 ° wave direction angle at 5.88 m water level. (a) The process of horizontal force changing over time; (b) the process of vertical force changing over time.
Energies 18 01676 g008
Figure 9. Statistical results of cumulative frequency of wave force on the foundation. (a) Statistics of cumulative frequency of horizontal force; (b) statistics of cumulative frequency of vertical force.
Energies 18 01676 g009
Figure 10. Verification of the stability of the breakwater structure through port basin and wave flume tests. (a) Three-dimensional stability test in harbor basin; (b) two-dimensional stability test in wave flume.
Energies 18 01676 g010
Table 1. Test conditions.
Wave
Directions
Water LevelWave Condition
H1% (m)Hs (m)Tp (s)
0°/45°5.88 m4.303.157.0
4.30 m3.962.947.0
90°5.88 m5.143.869.2
4.30 m4.453.419.2
135°5.88 m4.493.309.8
4.30 m4.073.039.8
Table 2. Variation law of wave height (Hs) under different wave direction angles (unit: m).
Location Point5.88 m4.30 m
45°90°135°45°90°135°
Along the breakwaterP12.98 3.20 3.44 2.79 2.60 2.79 3.14 2.25
P21.46 2.21 3.65 1.99 1.08 1.82 3.26 1.70
P30.23 1.38 3.03 2.21 0.15 1.04 2.52 1.79
P40.12 1.23 2.66 1.80 0.10 0.78 2.26 1.38
P53.24 2.68 2.38 0.73 2.76 2.28 1.75 0.62
P63.43 2.74 1.29 0.81 2.79 2.23 1.32 0.48
P73.06 2.49 1.69 0.70 2.80 2.28 1.55 0.35
A7 wind turbine foundationP83.54 2.88 2.76 1.24 2.89 2.18 1.95 0.79
P93.75 3.10 2.91 0.97 3.01 2.64 1.77 0.69
P103.82 1.61 1.63 0.71 2.94 2.42 1.29 0.48
P113.61 1.77 2.09 1.21 2.78 1.82 1.54 0.62
A6 wind turbine foundationP123.32 2.43 1.72 1.15 2.65 1.93 1.56 0.44
P133.64 2.62 1.81 0.79 2.98 2.50 1.58 0.40
P143.58 2.12 1.23 0.86 2.91 2.34 1.02 0.36
P153.28 1.33 1.51 0.99 2.59 0.84 1.26 0.25
Table 3. Run-up results on the foundation of the pier under wave action.
Water LevelDirectionA7 Wind Turbine FoundationA6 Wind Turbine Foundation
5.88 m12.33 11.80
45°11.72 11.06
90°11.19 9.61
135°8.07 7.16
4.30 m8.06 8.03
45°7.60 7.43
90°7.48 7.14
135°5.18 5.05
Table 4. Test results of wave force on pier foundation under different wave direction angles.
Water LevelDirectionA7 (kN)A6 (kN)
11.0 m Elevation12.5 m Elevation 11.0 m Elevation12.0 m Elevation
FxmaxFzmaxFxmaxFzmaxFxmaxFzmaxFxmaxFzmax
5.88 m1745.2 4869.4 825.1 1925.6 425.6 1213.5 106.2 356.8
45°1360.0 3328.0 524.1 1612.5 162.0 388.0 52.0 143.0
90°376.0 1095.0 236.4 654.2 116.0 274.0 //
135°118.0 251.0 //94.0 245.0 //
4.30 m715.2 2089.6 //245.6 621.3 //
45°234.0 715.0 //122.0 260.0 //
90°127.0 247.0 //52.0 143.0 //
135°21.0 38.0 //////
Table 5. Comparison results of standard formula and experimental under wave force.
Water LevelDirectionA7 (kN)
StandardTestKF (Test/Standard)
FxFZFxFZFxFZ
5.88 m1466.63958.91745.24869.41.191.23
45°1079.42579.81360.03328.01.261.29
90°293.8835.9376.01095.01.281.31
135°89.4185.9118.0251.01.321.35
4.30 m572.21503.3715.22089.61.251.39
45°172.1507.1234.0715.01.361.41
90°92.7169.2127.0247.01.371.46
135°14.925.021.038.01.411.52
Table 6. Comparison results of standard formula calculation and experimental wave run-up.
Water LevelDirectionA7 (m)
TestStandardKR (Test/Standard)
5.88 m12.3310.631.16
45°11.729.851.19
90°11.199.171.22
135°8.076.211.30
4.30 m8.066.661.21
45°7.605.941.28
90°7.485.661.32
135°5.183.671.41
Disclaimer/Publisher’s Note: The statements, opinions and data contained in all publications are solely those of the individual author(s) and contributor(s) and not of MDPI and/or the editor(s). MDPI and/or the editor(s) disclaim responsibility for any injury to people or property resulting from any ideas, methods, instructions or products referred to in the content.

