Article

Harmonic Current Effect on Vibration Characteristics of Oil-Immersed Transformers and Their Experimental Verification

1
Electric Power Research Institute of Yunnan Power Grid Co., Ltd., Kunming 650217, China
2
State Key Laboratory of Power Transmission Equipment Technology, School of Electrical Engineering, Chongqing University, Chongqing 400044, China
*
Author to whom correspondence should be addressed.
Energies 2025, 18(7), 1673; https://doi.org/10.3390/en18071673
Submission received: 2 March 2025 / Revised: 18 March 2025 / Accepted: 21 March 2025 / Published: 27 March 2025

Abstract

:
Harmonic currents can intensify transformer vibrations, seriously threatening their mechanical stability and safe operation. Drawing upon this foundation, the present paper undertakes a thorough simulation and experimental investigation into the vibration characteristics of transformers under diverse harmonic current scenarios. Initially, a multi-field coupling model incorporating both “electromagnetic and structural forces” was developed to simulate and analyze how the vibration acceleration of a transformer is distributed under varying harmonic currents. Subsequently, a specialized transformer harmonic loading and vibration measurement platform was constructed to validate the multi-physical-field vibration simulation. Finally, through a rigorous experimental analysis of transformer vibrations under harmonic currents, this research elucidates the variation patterns of characteristic vibration parameters of transformers under different harmonic currents. The results demonstrate that as the proportion of harmonic current grows, the mean winding vibration acceleration escalates following a power-function law. With increasing harmonic current frequency, the vibration acceleration augmentation in high-voltage (HV) windings exceeds that which is observed in low-voltage (LV) windings. Empirical validation confirms that the discrepancy between the measured and simulated acceleration increases remains within 5%, indicating the effectiveness and reliability of the simulation method. Experimental findings reveal that as the harmonic current content increases, six vibration characteristic parameters—including root mean square value, absolute average value, peak-to-peak value, and mean frequency—exhibit a pronounced upward trend. Furthermore, harmonic currents significantly increase the spectral dispersion and high-frequency components of the vibration signal. These research findings provide valuable references for transformer operation, maintenance, and anti-vibration design strategies.

1. Introduction

In modern power systems, the widespread proliferation of power electronic devices has significantly exacerbated harmonic pollution issues. This occurrence not only diminishes the quality of power but also has significant adverse effects on the crucial equipment throughout the entire power system [1,2,3]. As the core equipment of the power system, the transformers’ secure and stable operation is essential to the overall reliability of the power grid. Under the action of complex harmonic currents, internal components of converter transformers experience varying degrees of vibration, leading to elevated noise and posing serious threats to the mechanical stability of the internal components [4,5,6,7,8,9,10]. Therefore, an in-depth exploration of the harmonic currents’ impact on the vibration features of transformers holds profound significance for enhancing transformer reliability and extending operational lifespan.
Recent years have witnessed extensive scholarly research on transformer vibration characteristics across multiple dimensions. Regarding theoretical modeling, a multiphysics analytical framework was established in theoretical research by Jin Mingkai’s team at Xi’an Jiaotong University [11], employing coupled electromechanical-field interactions through concurrent circuit-magnetic-structural integration to quantify short-circuit-induced alterations in stray flux profiles, Lorentz force generation, and mechanical displacement responses. Their findings revealed that during winding vibration, various fields interact dynamically. The short-circuit current is less affected by the change in reactance, while the distortion in the leakage magnetic flux intensifies the short-circuit force and the vibration intensity. Xu Jing et al. from Chongqing University [12] constructed an elaborate multi-physical field 2D simulation model to analyze winding stress distribution characteristics while accounting for harmonic current effects. The results demonstrated an exponential increase corresponding to harmonic current frequency elevation; furthermore, the relationship between maximum winding stress variations under different frequency harmonic currents and harmonic content follows a power function correlation. Xiong Jun et al. from Southwest Jiaotong University [13] established an electromagnetic–mechanical multi-physical-field model to examine internal transformer electromagnetic force distribution and its excitation effects on structural vibration. Their research indicated that increased load current amplifies vibration, with frequency components concentrated at the power supply frequency and its harmonics. As load rates escalate, vibration amplitudes across various frequencies intensify proportionally.
In experimental research, Jiang Peiyu et al. from Xi’an Jiaotong University [14] established a numerical simulation model to analyze harmonic-induced vibrations in transformer windings and cores. Through vibration testing experiments, they systematically examined the time-frequency domain vibration response characteristics corresponding to various valve-side windings configurations. Their findings revealed that harmonics amplify tank vibration amplitude and main frequency while broadening the frequency spectrum. Under harmonic currents conditions, the contribution of winding vibration to overall vibration exceeds that of the core, while windings connection methodology alters the primary vibration frequency distribution. Amir Esmaeili Nezhad et al. from the University of Tehran [15] employed the finite element method (FEM) and experimental modal analysis methods to investigate power transformer vibration. They classified vibration modes into three categories: core-related modes, winding-related modes, and coupling modes. Their investigation determined that transformers exhibit behavioral similarities to cylindrical structures with constrained ends under modal analysis, with winding vibration resembling cylindrical shell behavior—combining axial and radial vibrations. Excessive vibration can induce winding deformation, and most of the low-frequency modes are related to the core and coupling modes. Anthony John Moses et al. from Cardiff University [16] constructed an experimental system incorporating magnetization, vibration measurement, and noise measurement to evaluate single-phase and three-phase cores under different conditions. Their investigation revealed complex relationships between core surface vibration and noise generation, with out-of-plane vibration typically exceeding in-plane vibration. Additionally, the middle limb exhibits relatively high vibration, harmonics play crucial roles in noise and vibration generation, and joints constitute primary vibration sources. Although the existing research has explored transformer vibration characteristics extensively through theoretical modeling and experimental investigations across multiple dimensions, theoretical models predominantly focus on isolated factors, and experimental verification regarding harmonic current influence remains particularly scarce. There exists a significant research gap concerning transformer vibration characteristics under the combined influence of multiple characteristic harmonics.
Based on this, this paper focuses on the S20-M-100/10-0.4kV oil-immersed transformer as the subject of research and employs a methodology that integrates simulation analysis and experimental validation to examine the impact of varying harmonic currents. In Section 2, a multi-physical field simulation model of the electromagnetic–mechanical coupling of the transformer is constructed. Subsequently, in Section 3, the vibration acceleration response characteristics of the transformer under different harmonic currents are simulated and analyzed. In Section 4, a test platform for measuring the harmonic loading and vibration of the transformer is established. This platform serves to validate the accuracy of the simulation model and investigate the variation laws of the vibration characteristic quantities of the transformer under various harmonic currents. This research elucidates the intricate interaction mechanism between harmonic currents and the vibration characteristics of transformers, which is conducive to the development of more efficient operation and maintenance techniques. The research findings not only offer a solid theoretical foundation for the operation status monitoring and fault diagnosis of transformers in power systems, enabling the anticipation of potential fault risks in advance and ensuring the stability and reliability of power supply, but also play a pivotal role in the optimized design of transformers.

2. Theory and Modeling Method for Multi-Physical Field Simulation

2.1. Theory of Electromagnetic-Structural Force Field Coupling

Harmonic currents in the transformer windings generate a time-varying electromagnetic field, the dynamics of which are articulated by Maxwell’s equations, as illustrated in Equation (1). This system of equations is constructed based on assumptions such as the homogeneity and isotropy of the medium, and the continuous and smooth variation in the electromagnetic field. The structure and electromagnetic properties of the winding influence the current density within them and the leakage magnetic field. This article integrates boundary conditions with the material properties to resolve Maxwell’s equations and thereby determine the leakage magnetic field. Here, E represents the electric field strength; D signifies the electric displacement vector; H represents the magnetic field strength; B indicates the magnetic induction intensity; and J refers to the eddy current density. Meanwhile, the Maxwell stress tensor is an important physical quantity that describes the stress distribution in an electromagnetic field, and its expression is shown in Equation (2). This equation is used to describe the stress distribution of the electromagnetic field and relies on the assumptions of linear electromagnetic media and an inertial system. Here, c0 is the permittivity of free space, m0 is the permeability of free space, Ei and Bi are the components of the electric field strength and magnetic induction intensity in the i-direction, respectively, and dij is the Kronecker delta. Under the assumptions of a closed surface and the continuity of the tensor, the electromagnetic force on the winding is obtained through integral calculation [17], as shown in Equation (3). Here, F is the electromagnetic force vector, S is the surface of the winding, and dS is the surface element vector.
D = ρ B = 0 × E = B t × H = J + D t
T ¯ ¯ = T x x T x y T x z T y x T y y T y z T z x T z y T z z T i j = c 0 ( E i E j 1 2 δ i j E 2 ) + 1 μ 0 ( B i B j 1 2 δ i j B 2 )
F = S T ¯ ¯ d S
The transformer windings are stimulated by electromagnetic forces due to harmonic currents, resulting in vibrations. Therefore, it is essential to establish a winding vibration displacement response model utilizing the elastodynamic equation and the mode superposition technique. In the Cartesian coordinate system, the elastodynamic equation can be expressed by Equation (4). The elastodynamic equation is premised on the continuum medium assumption, treating the transformer windings as continuous and homogeneous bodies, enabling their physical properties to be described by continuous functions. This paper presents the mode superposition method. Assume that the displacement response of the structure can be articulated as a linear combination of each mode order, as delineated in Equation (5). Incorporate this assumption into the elastodynamic equation, and utilizing the orthogonality of the modes, a set of decoupled equations about qn(t) can be obtained. Solving this set of decoupled equations allows for the determination of the vibration displacement response of the structure. In this context, r represents the material density, ui denotes the displacement component in the i-direction, sij refers to the stress tensor component, fi signifies the volume force component in the i-direction, fn(x) represents the n-th order mode shape function that characterizes the deformation of the structure in the n-th order mode, and qn(t) indicates the n-th order mode coordinate, reflecting the temporal variation in the n-th order mode. In addition, the ferromagnetic materials in the transformer core undergo magnetostriction under the action of a magnetic field, which has a nonnegligible impact on the vibration characteristics of the transformer [18]. The magnetostrictive strain can be expressed by Equation (6). Where l is the magnetostrictive strain, lS is the saturation magnetostriction coefficient, B is the magnetic induction intensity, and BS is the saturation magnetic induction intensity.
ρ 2 u i t 2 = j = 1 3 σ i j x j + f i ,   i = 1 , 2 , 3
u ( x , t ) = n = 1 ϕ n ( x ) q n ( t )
λ = λ S 3 2 ( B B S ) 2 1 2 λ S

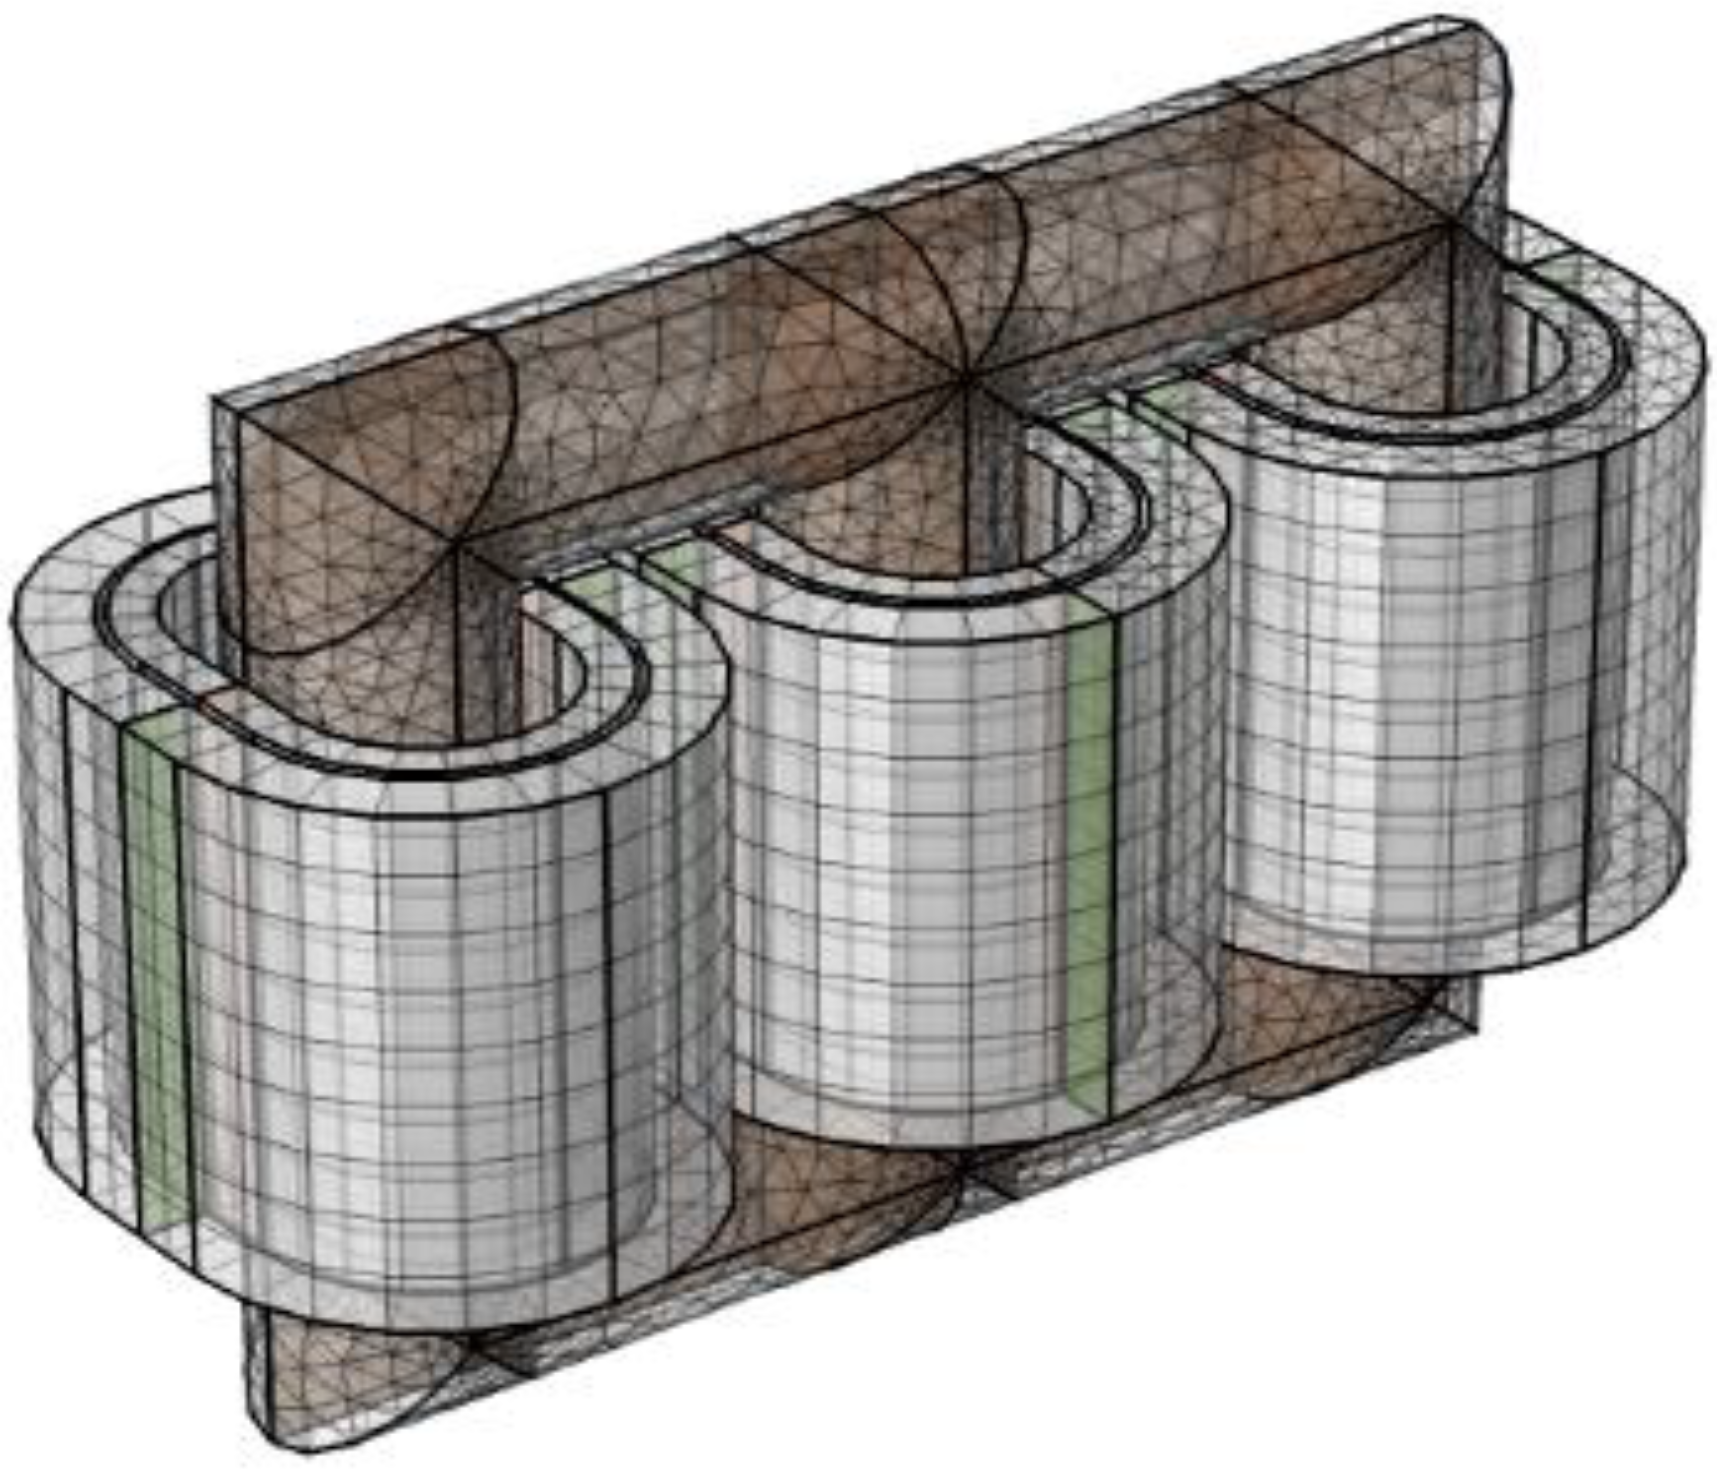
2.2. Development of the Three-Dimensional Model of the Oil-Immersed Transformer

This study primarily focuses on the S20-M-100/10-0.4kV oil-immersed transformer as the subject of investigation. Based on this, a 3D transformer model is established, as illustrated in Figure 1, with its key parameters detailed in Table 1. The transformer employs a three-phase three-limb core design, where both LV windings and HV coils of each phase are concentrically arranged on identical core limbs. The key simulation parameters for the electromagnetic–solid mechanics fields of this transformer are shown in Table 2.
This paper simplifies the geometric model of the transformer to lower the computational demands of the simulation, considering the transformer’s intricate construction, with simplification from the following aspect:
(1)
The air gap between the laminated silicon steel sheets of the transformer core is minimal, and core vibration primarily arises from the magnetostrictive action. Consequently, the core is seen as a singular entity, and the interdependence among the silicon steel sheets is disregarded. Simultaneously, to more effectively simulate and analyze the comprehensive dynamic response of the transformer under harmonic stimulation, the HV and LV windings are each represented as a singular entity. The size of the core and the winding correspond accurately to the actual measurements of the transformer.
(2)
Structures including clamping pieces, cushion blocks, and cooling devices are excluded. Fixed constraints are applied to the iron core and windings to simulate the fixing effects of the clamping pieces and buffer components on the iron core and windings.
During the simulation process, in view of the complex electromagnetic and structural characteristics of the transformer, we placed significant emphasis on optimizing the mesh generation. In the winding regions and at the core-winding interfaces where the electromagnetic fields and stresses vary drastically, triangular meshes with a minimum element size of 0.01 m were employed. This approach was adopted to ensure the accuracy of the simulation results and enhance the reliability of the simulation. This paper simulates and analyzes the distribution laws of the vibration characteristics of the transformer, utilizing a 3D simulation model. The analysis focuses on harmonic currents with frequencies of 250Hz, 350Hz, and 550Hz, with content levels ranging from 0% to 50%.

3. Simulation Analysis of Transformer Vibration Characteristics Under Harmonic Currents

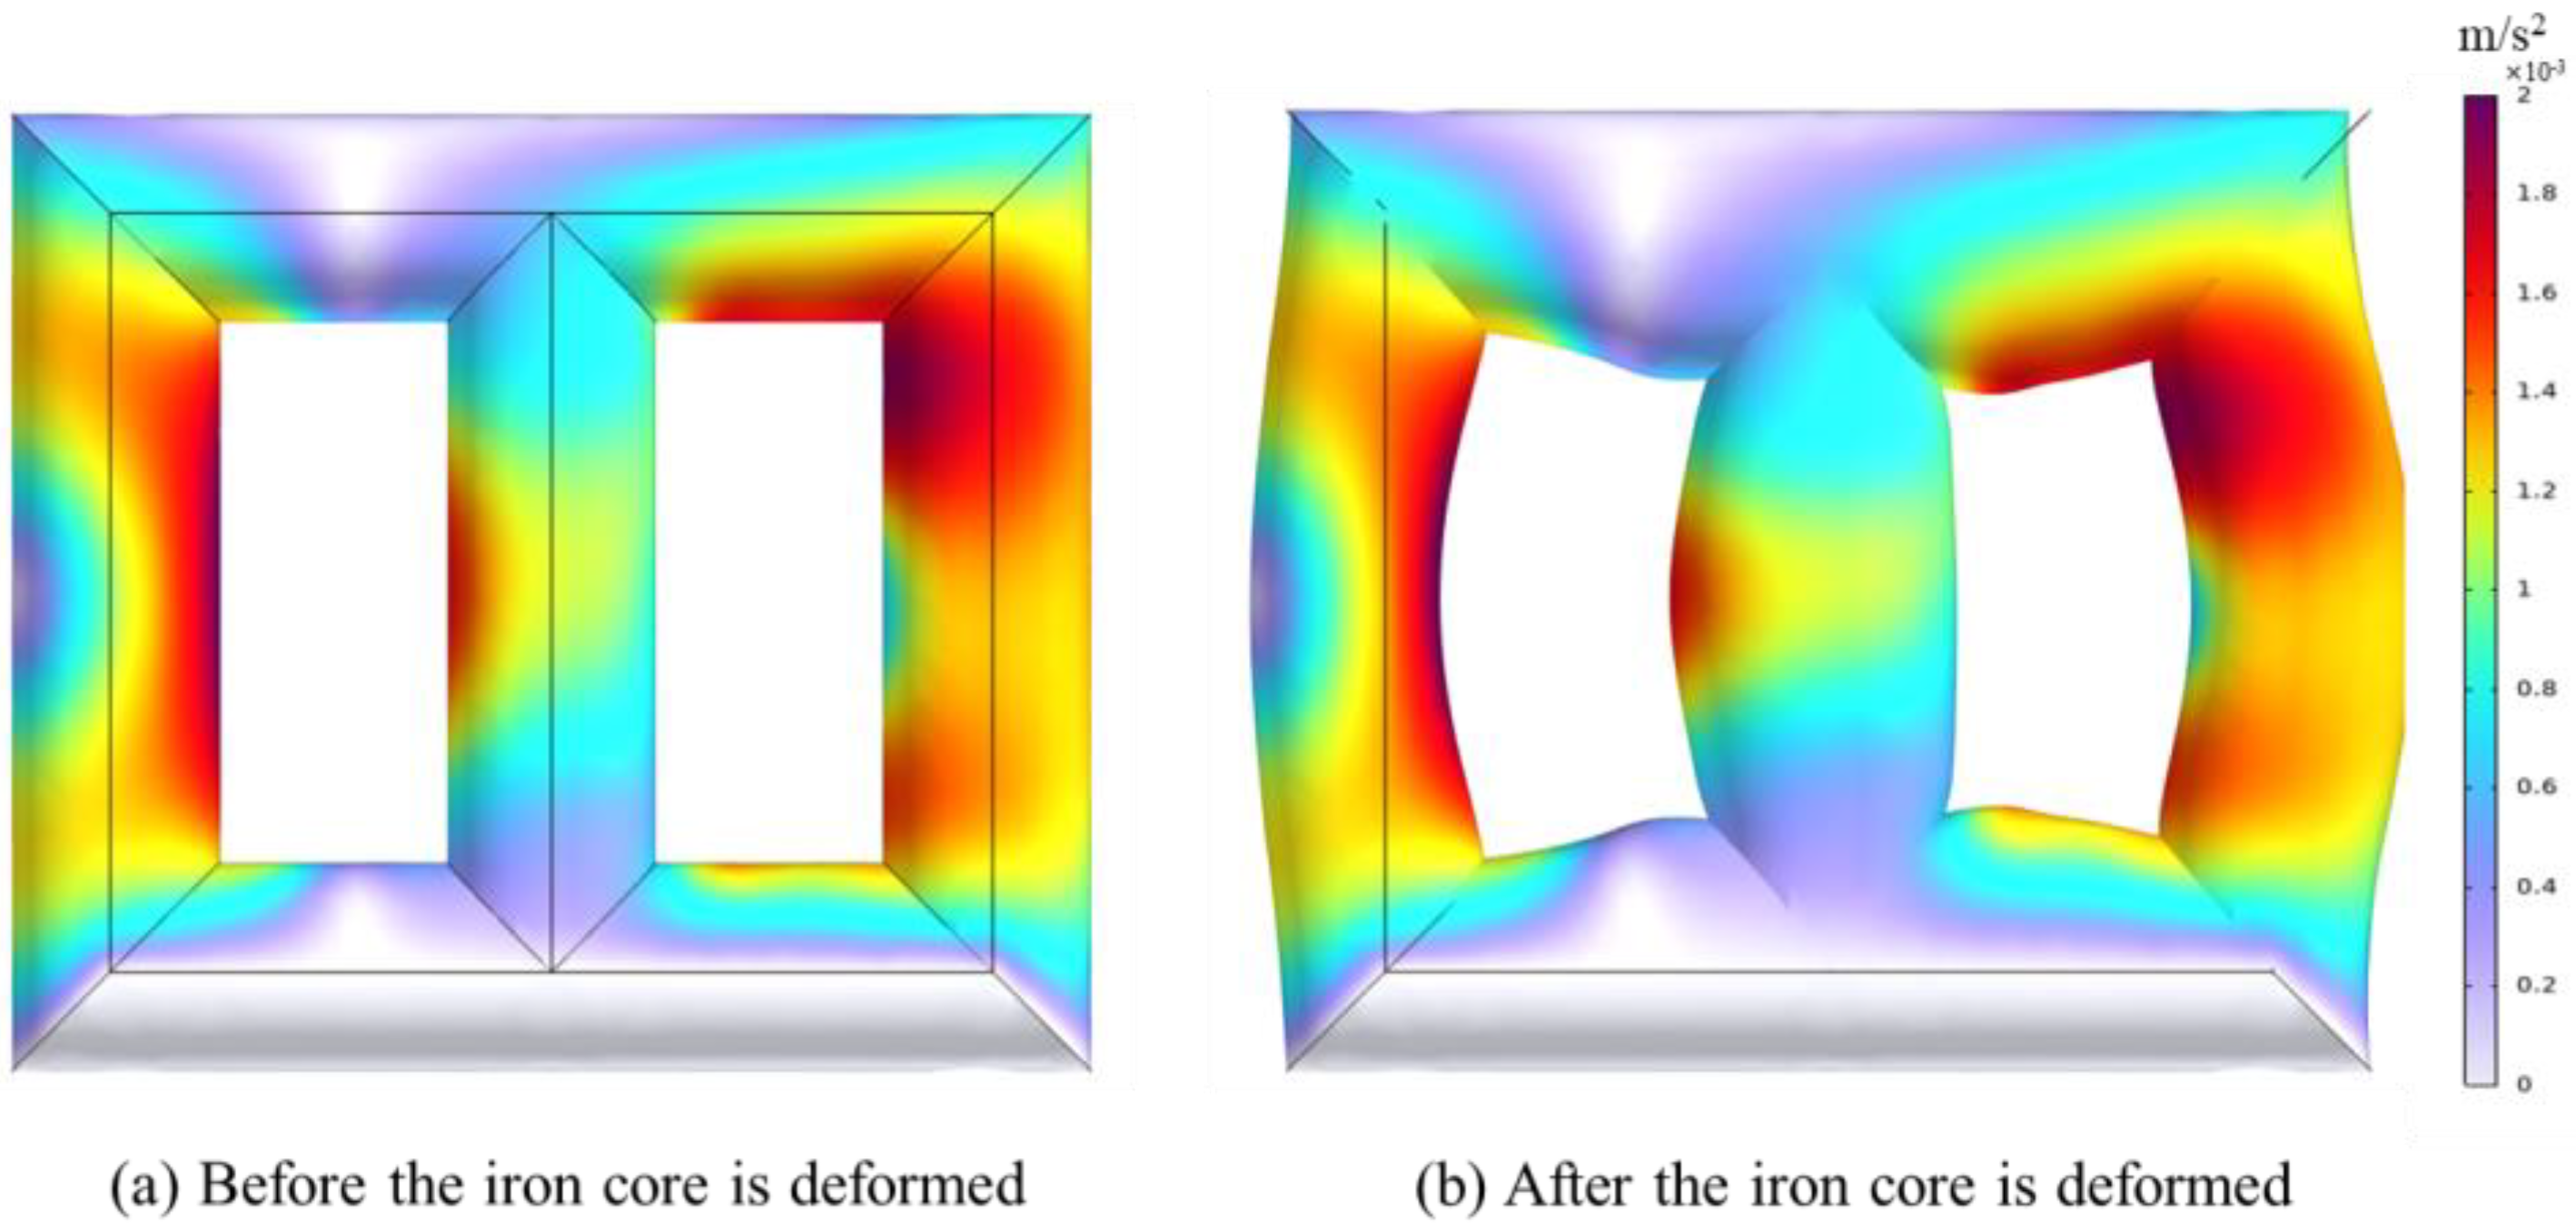
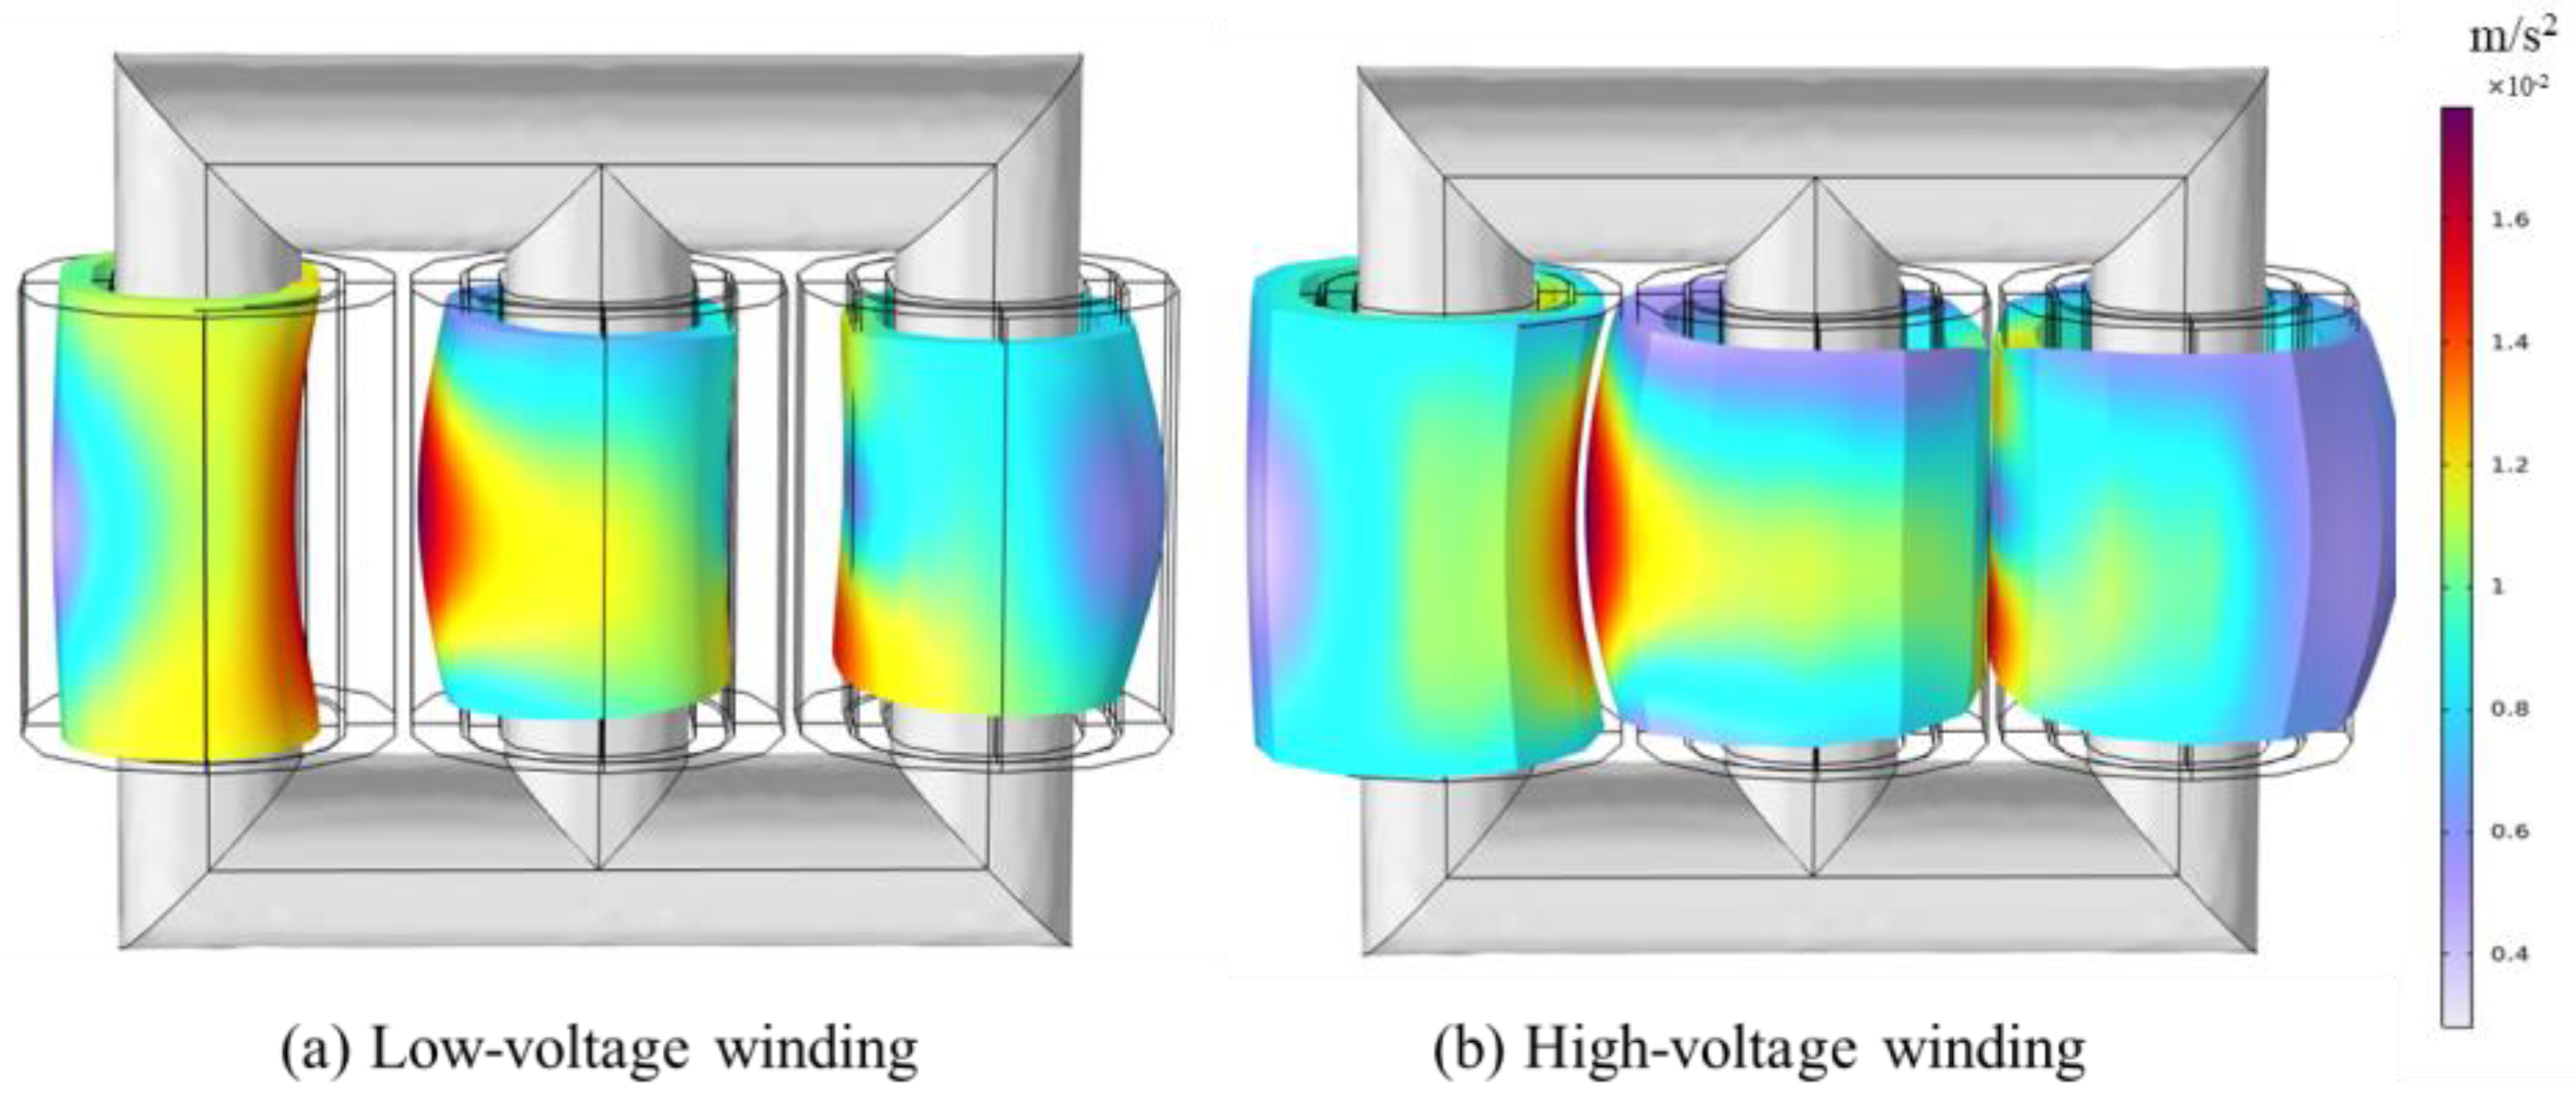
3.1. Analysis of Transformer Vibration Characteristics Under Power Frequency Current

Under the influence of pure power-frequency sinusoidal current, the vibration acceleration of the transformer core attains its peak value at t = 0.012 s. Figure 2 illustrates the core deformation and vibration acceleration distribution. The core deformation distribution indicates that regions with significant core vibration are mostly located in the central core limb and at the interface of the yoke and core limb, with the average acceleration of the entire transformer core reaching 0.002 m/s2.
The vibration distribution nephogram of the transformer’s LV winding is illustrated in Figure 3a. The vibration of the LV winding of this transformer is concentrated at the center of the B-phase winding, with the vibration amplitude diminishing towards both ends. The vibration of the A-phase winding is predominantly localized at the end of the winding, whereas the vibration amplitude of the C-phase winding is comparatively minimal. The time-domain stress values at the inner and outer radii as well as different heights of the winding are solved through the finite element method. After collecting the acceleration data at each point, the data are aggregated and averaged to calculate that the overall average acceleration value of the low-voltage winding is 0.0175 m/s2. The vibration distribution nephogram of the transformer’s HV winding is depicted in Figure 3b.
The vibration of the high-voltage winding in this transformer model is mostly centered at the terminal of the A-phase winding, whereas the vibrations of the B-phase and C-phase winding are predominantly located in the central region of the winding. The average acceleration of the entire HV winding is 0.0125 m/s2. Comprehensive analysis reveals that the vibration of the transformer is mostly attributed to the windings, with its acceleration amplitude being an order of magnitude more than that of the core. This paper focuses on the transformer windings as the primary subject of investigation to thoroughly examine their vibrational properties under varying operational conditions.

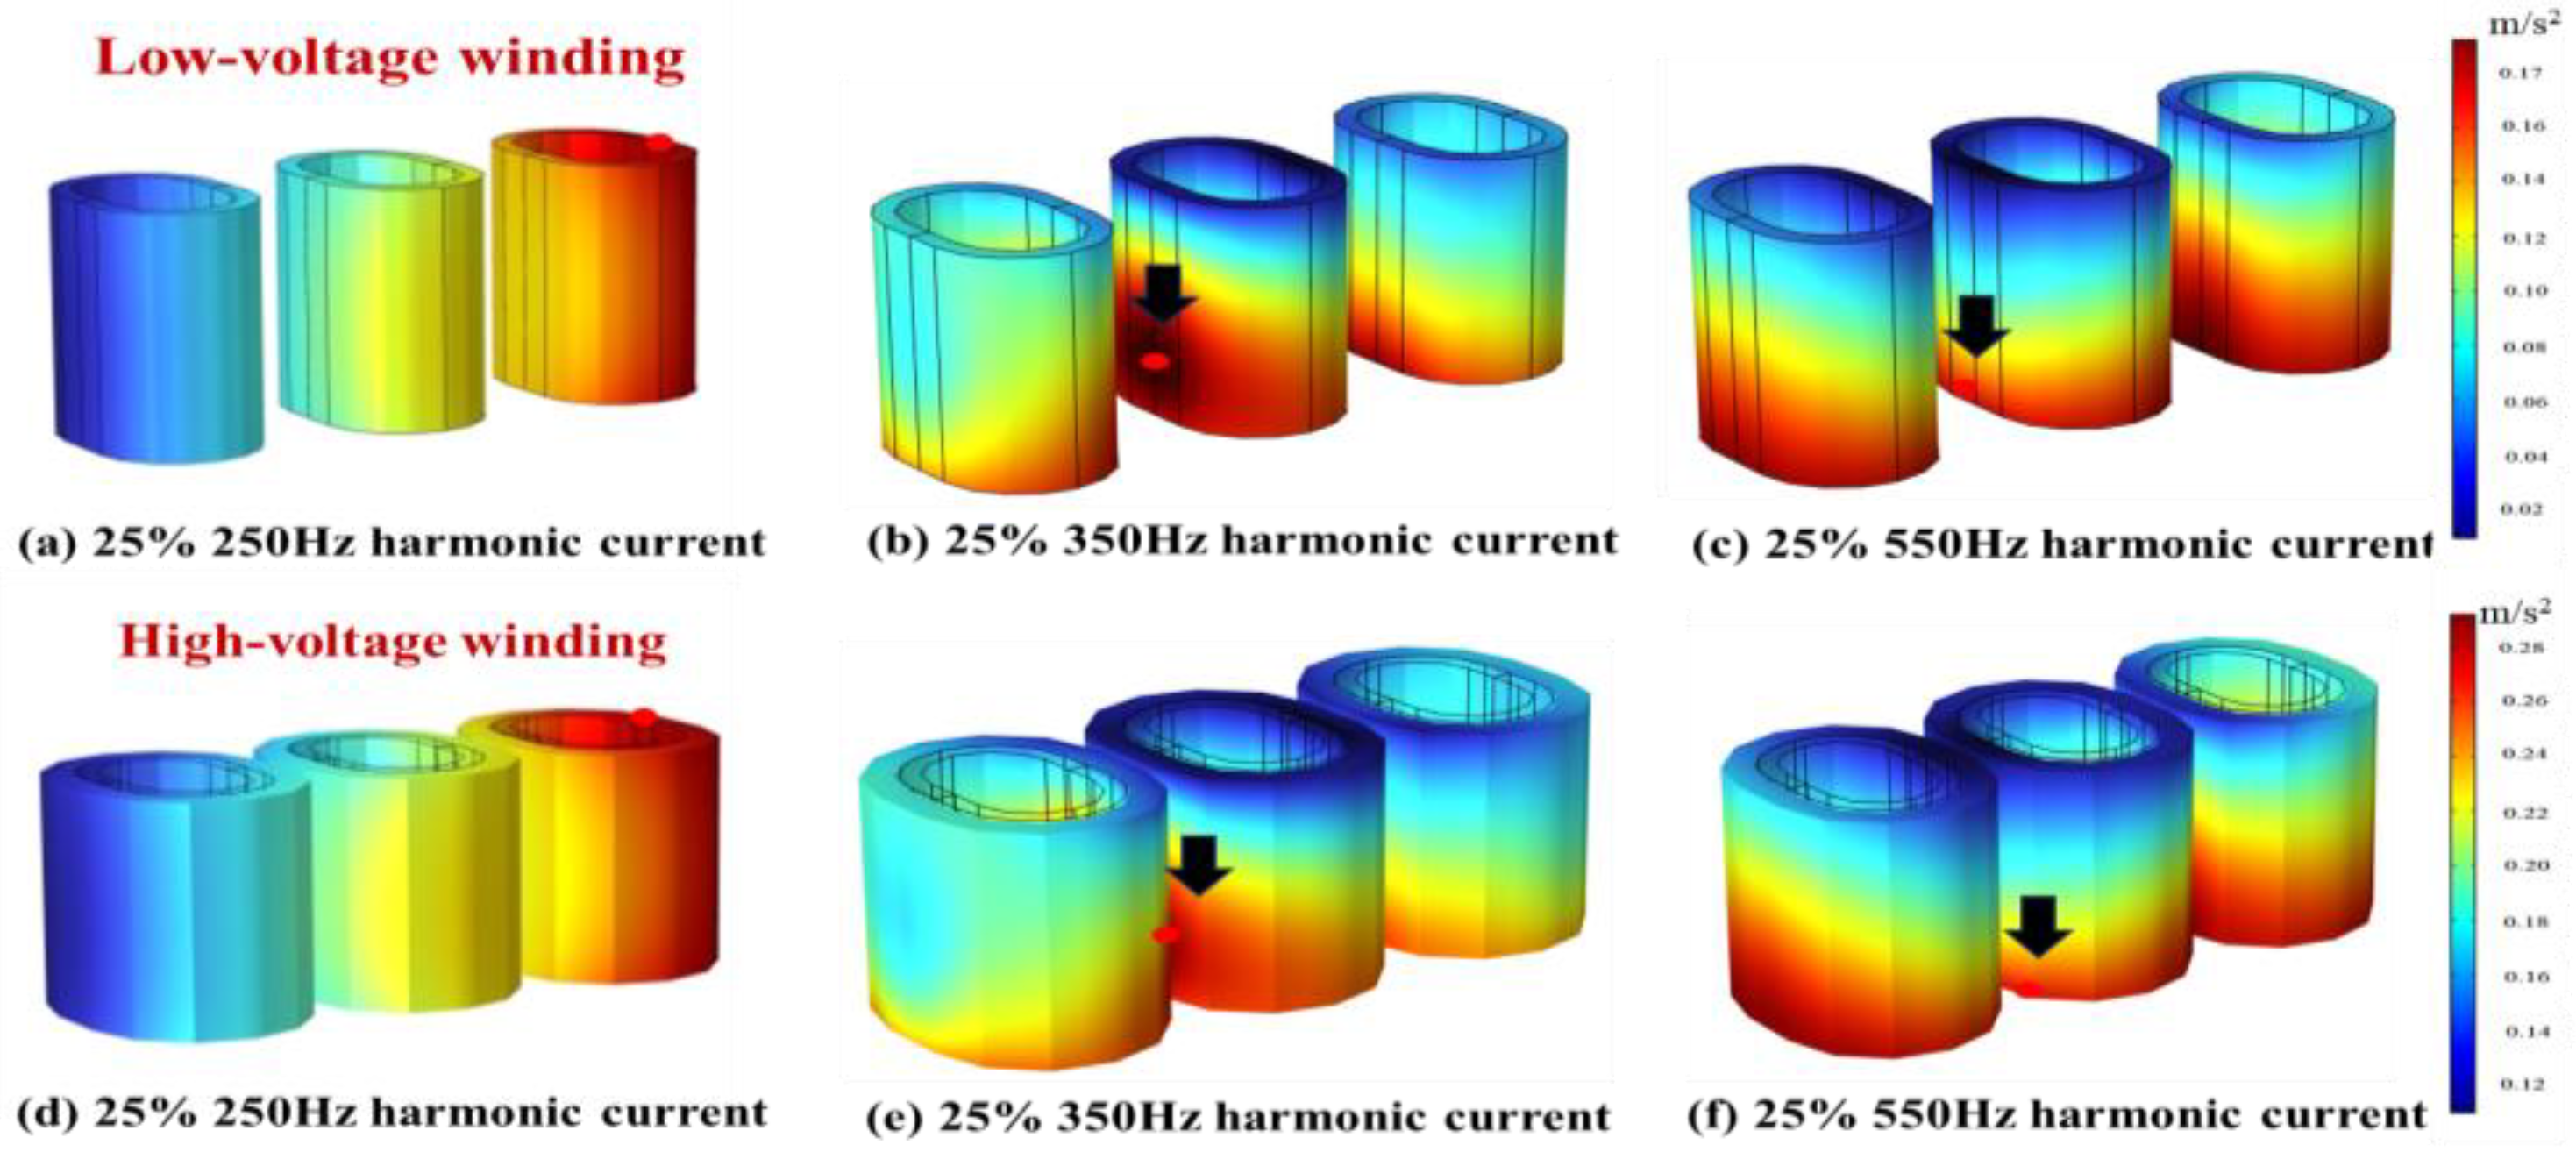
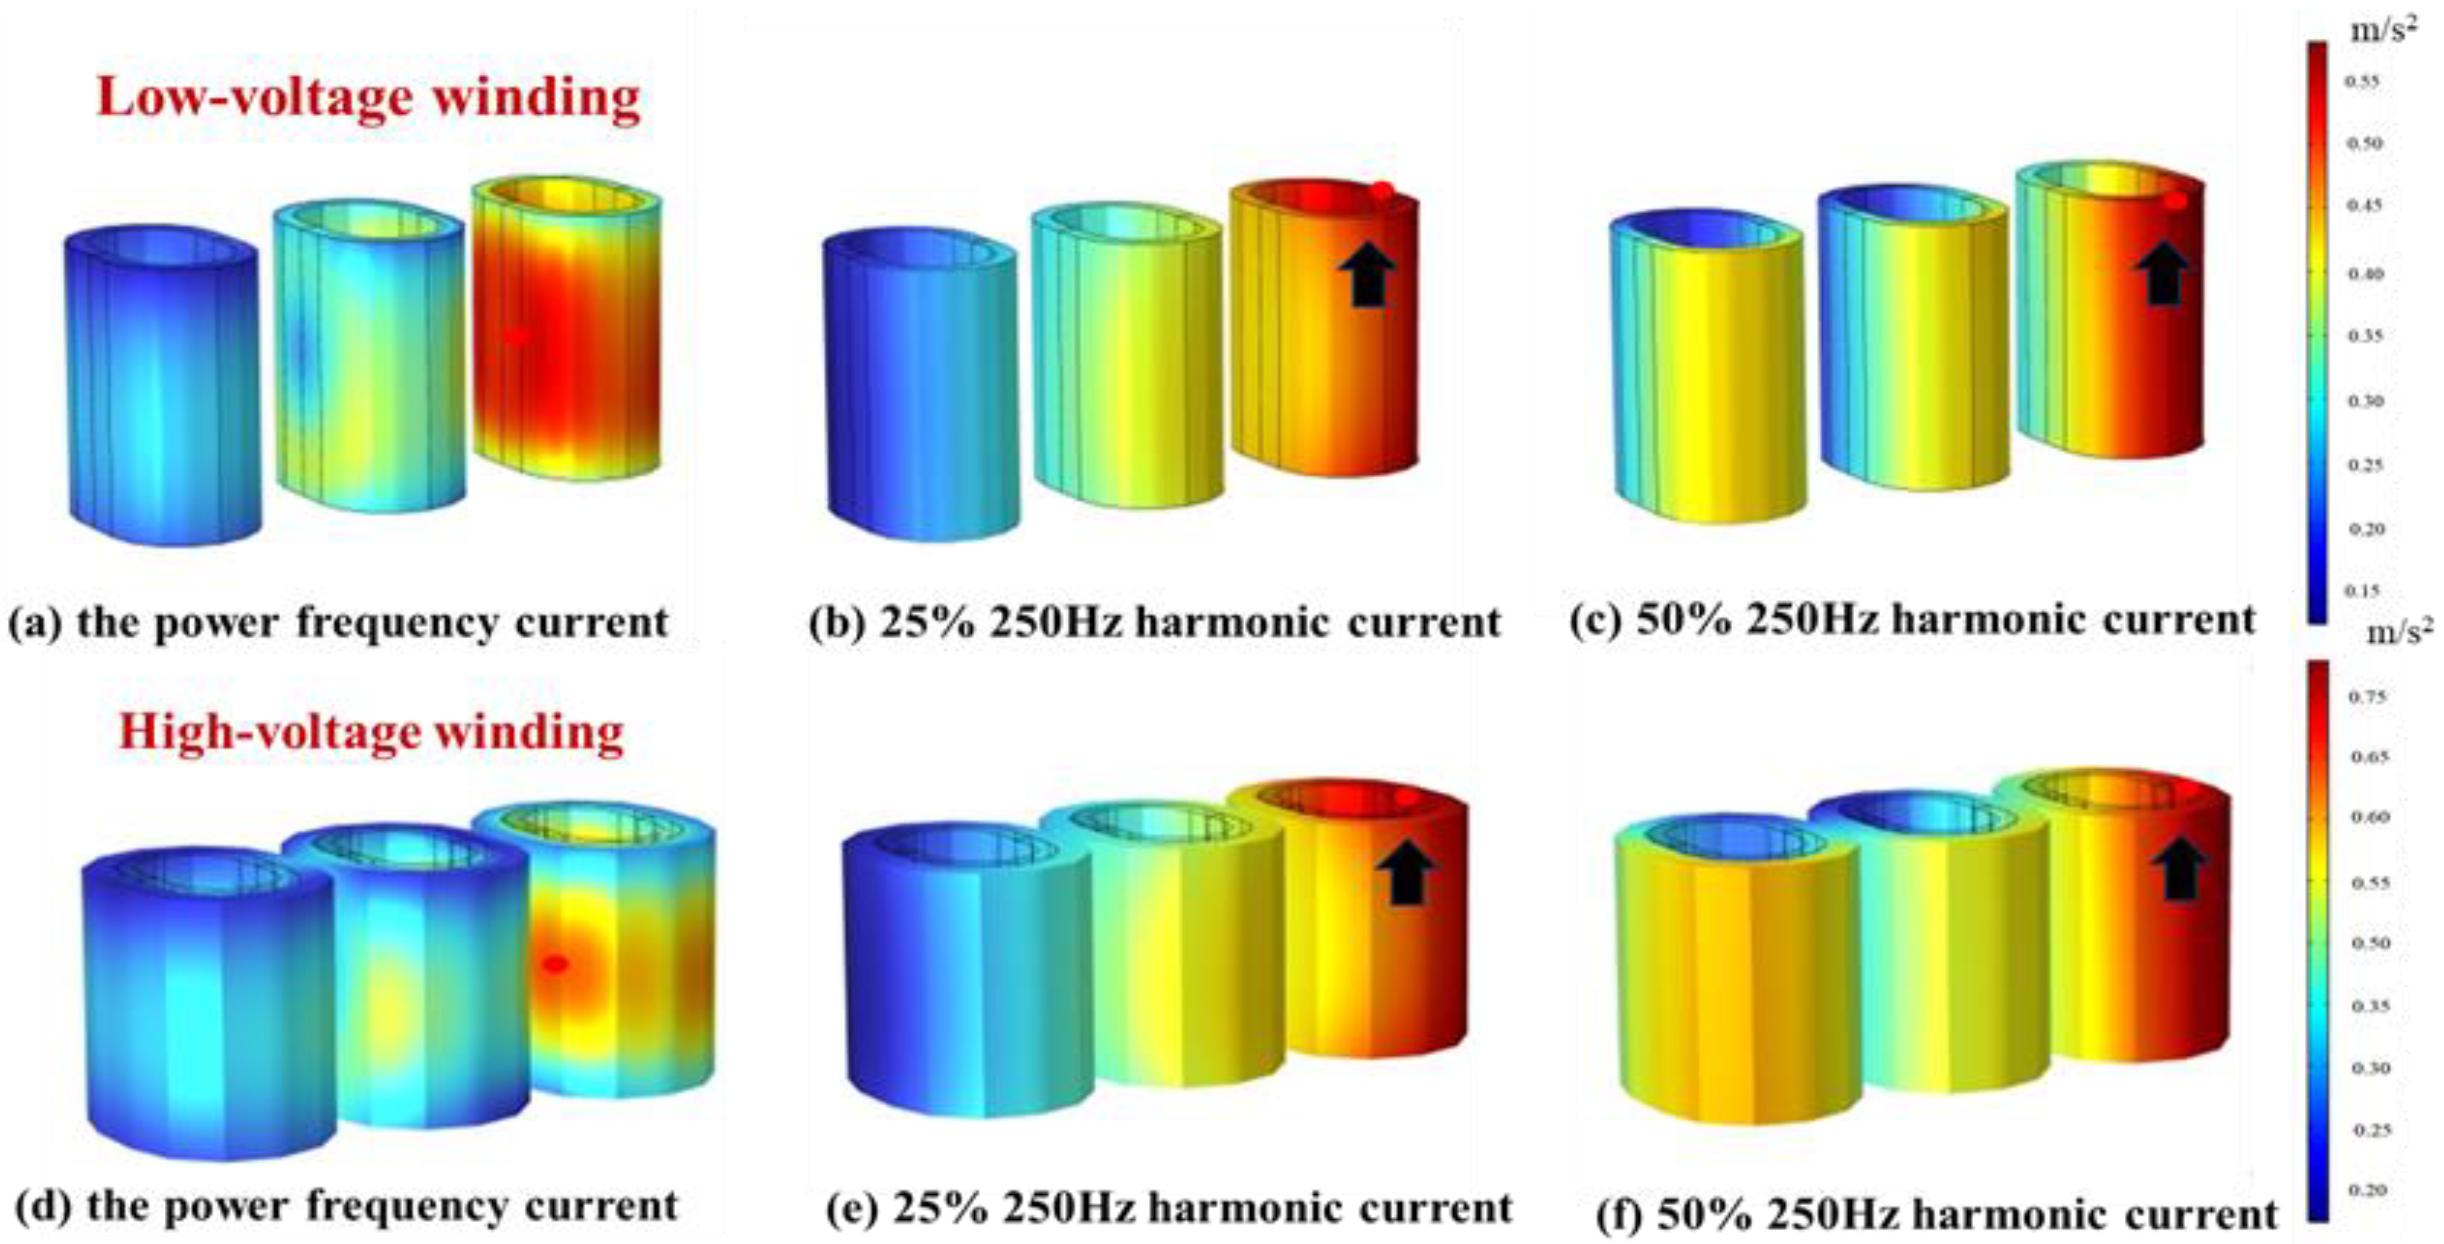
3.2. Analysis of Transformer Vibration Characteristics Under Different Harmonic Currents

Using the harmonic current with a composition of 25% as an illustration, as the harmonic current frequency escalates from 250 Hz to 550 Hz, the vibration distribution nephograms of the transformer windings are depicted in Figure 4. The acceleration distribution nephograms of the HV and LV windings reveal that as the harmonic current frequency increases, significant distribution disparities in acceleration manifest between the two windings, with the area of acceleration concentration migrating from the center to the ends of the windings. The trend of change is as indicated by the black arrow, and a stress peak appears at the end part, with the position of the peak shown as the red dot in the figure.
The variations in the average values of the overall vibration accelerations for both windings at different harmonic current frequencies are presented in Figure 5. When the harmonic current frequency goes up in frequency from 220 Hz to 550 Hz, the average value of the acceleration of the LV winding rises from 0.157 m/s² to 0.179 m/s², reflecting an increase of 14.01%; the average acceleration of the HV winding ascends from 0.213 m/s² to 0.286 m/s2, indicating a growth of 34.27%. Furthermore, Figure 5 illustrates that the augmentation of the vibration acceleration in the HV winding is more significant than that in the LV winding.
Taking the harmonic current with a frequency of 250 Hz as an example, when the harmonic current content rises gradually from 0% to 50%, the vibration nephew-grams of the transformer windings are illustrated in Figure 6. The acceleration distribution nephograms of the HV and LV windings indicate that under pure power frequency conditions, the acceleration of the windings is predominantly concentrated in their central regions. The introduction of harmonic current excitation causes the region of concentrated acceleration to migrate from the middle part of the winding to the ends. The migration trend is depicted by the black arrow. Moreover, a stress peak emerges at the winding ends, with the peak location denoted by the red dot in the figure. Simultaneously, the average vibration acceleration increases in proportion to the growth of harmonic content.
Figure 7 illustrates the variation curves of the overall average vibration values for both the HV and LV windings under varying harmonic current levels. When the quantity of harmonic current rises from 0% to 50%, the average acceleration of the LV winding ascends from 0.0205 m/s2 to 0.543 m/s2, and the average value of the acceleration of the HV winding surges from 0.0213 m/s2 to 0.754 m/s2. This study derived Equation (7) by fitting the average vibration acceleration values of the high-voltage (HV) and low-voltage (LV) windings presented in Figure 7. Specifically, the fitting formula for the HV winding is indicated by the yellow arrow, while that for the LV winding is denoted by the blue arrow. Based on the fitting results, as the harmonic current content increases, the average values of the vibration accelerations of the HV and LV windings rise corresponding with a power function law.
a l = 0.0205 + 2.09 α 2 a h = 0.0205 + 2.934 α 2

4. Experimental Design and Validation

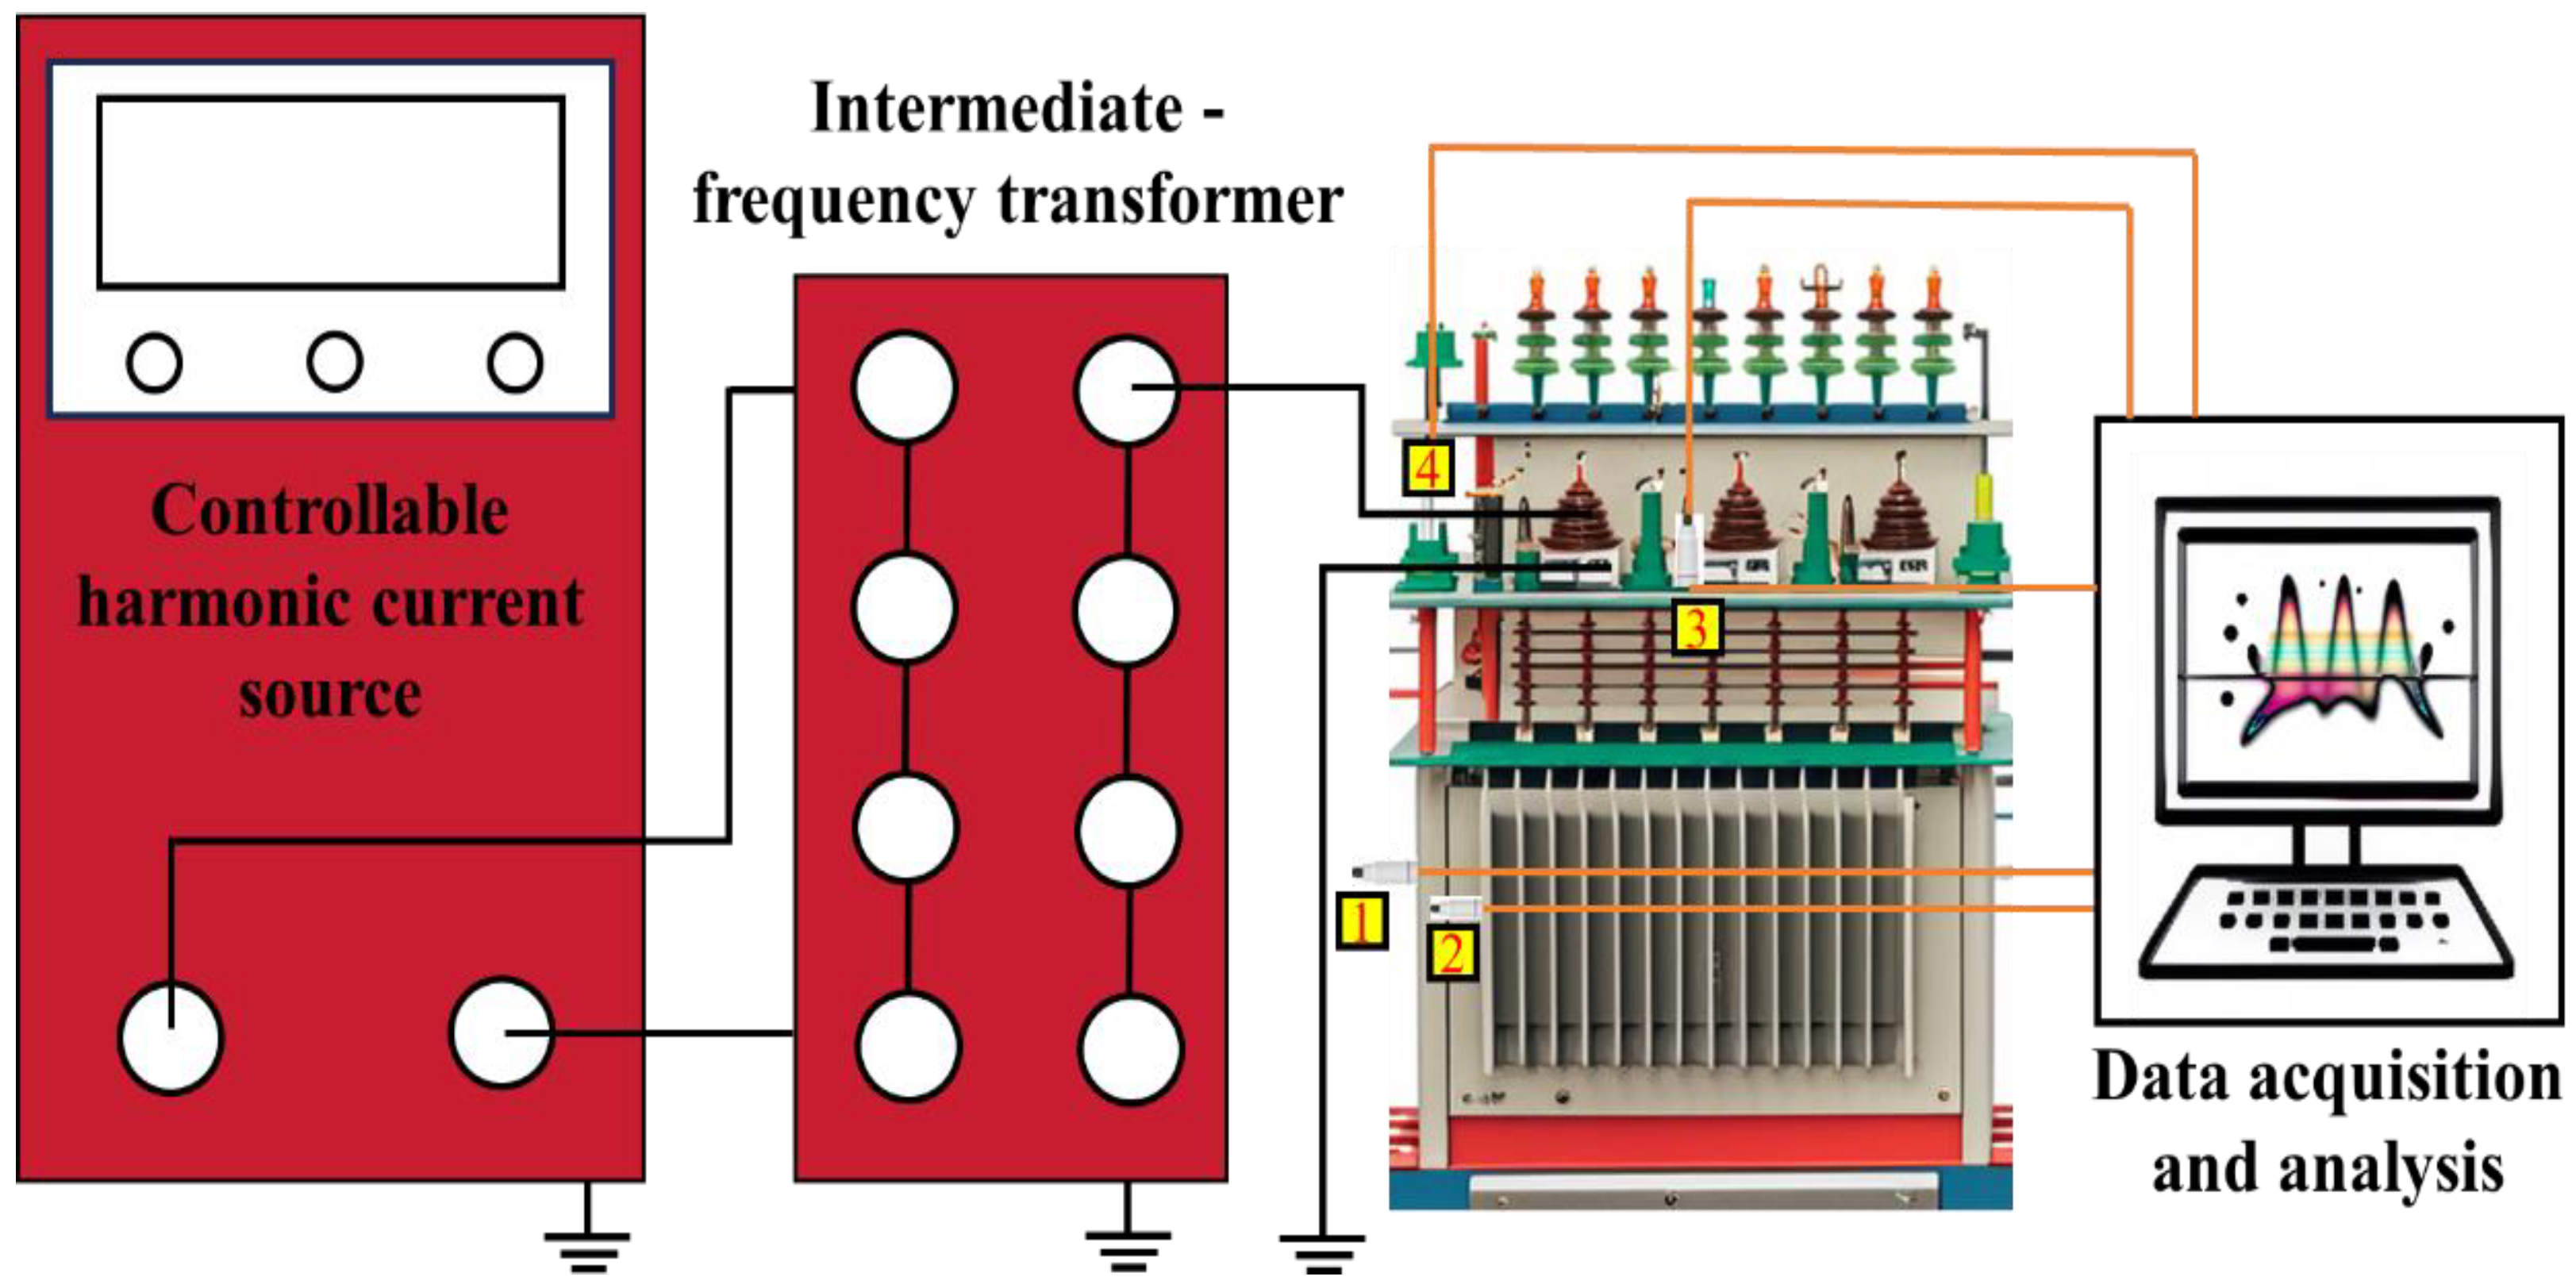
4.1. Vibration Testing Platform for the Oil-Immersed Transformer

This study presents the construction of a transformer harmonic loading and vibration monitoring platform based on the S20-M-100/10-0.4kV transformer. Figure 8 illustrates this test platform. The platform is composed of an adjustable harmonic power supply, an intermediate frequency transformer, a test transformer, sensors, and a vibration test platform. The adjustable harmonic power supply has a capacity of 180 kVA and can produce harmonic currents at up to 10 distinct frequencies, including the fundamental power frequency. The amplitude and phase of each frequency component are continually adjustable and thereafter are transmitted to the tested transformer via the intermediate frequency transformer. The specifications of the intermediate frequency transformer are presented in Table 3. Based on this, this paper conducts the winding vibration tests under the conditions that the frequencies of the harmonic currents are 250 Hz, 350 Hz, and 550 Hz, and the harmonic content ranges from 0 to 50%. This project conducts a vibration test on the winding of phase A of the transformer under no-load conditions. Considering that the winding vibration contains axial and radial components, four A25G01 piezoelectric acceleration sensors are strategically positioned around the phase A winding for vibration measurement. The positions of the four measuring points are indicated by the four colored numbers in Figure 8. Measuring point 1 is located in the middle of the oil tank on the side of the phase A winding of the transformer, measuring point 2 is situated in the middle of the phase A winding on the front of the transformer oil tank, measuring point 3 is positioned externally on the outside of the tank above the phase A winding of the transformer, and measuring point 4 is installed on the rear of the transformer oil tank and is symmetrically positioned relative to measuring point 2. The signal is ultimately gathered using the automated vibration signal collecting method. First, white noise was collected, and, subsequently, the white noise component was removed from the measured noise to effectively control the impact of background noise on the experimental results. The indoor temperature was maintained at 25 °C ± 1 °C to minimize the influence of temperature-induced changes in material properties. The relative humidity was controlled within the range of RH = 40 ± 5% to minimize the impact of humidity-related changes in material properties. Finally, the experimental setup was placed in a magnetic-shielding chamber, and all electrical circuits and components were shielded and grounded to strictly control the environmental conditions.

4.2. Comparative Analysis Between Simulation and Experimentation

This article conducts verification of multi-physical field simulations based on the vibration characteristic testing platform of the transformer. The field test is undertaken just in phase A. Given that measuring point 3 is positioned directly above the phase A winding, the test data from measuring point 3 are utilized in this paper for the verification and interpretation of the test and simulation data. Firstly, through simulation calculation, the location of maximum vibration intensity at the terminal of the phase A winding is precisely identified, and to investigate the changes in the vibration acceleration of this point under the influence of harmonic current, a point probe is placed at this location. Figure 9a displays the change curve of the point probe’s vibration acceleration when power frequency current is applied. The data obtained from the point probe are compared with the acceleration recorded at measuring point 3 under the action of pure power frequency current, as illustrated in Figure 9. The trends in vibration change are generally consistent, with the acceleration peaks occurring simultaneously at t = 0.175 s, as shown by the red dot in Figure 9. The highest vibration value of the point probe is 0.00398 m/s2, while the peak value of the measured vibration signal at measuring point 3 is 0.00149 m/s2. These two values are of the same order of magnitude. There exists a time lag between the simulated and tested vibration peaks, and meanwhile, the vibration amplitude decreases. This can be attributed to the complex vibration transmission path involving the transformer oil. The viscosity of the oil impedes the propagation of vibration energy, not only causing a time lag in the occurrence of the vibration peaks but also dissipating energy, thus reducing the vibration amplitude. In addition, since the viscosity of the oil varies with temperature, changes in the oil temperature during the test will affect the transmission and dissipation rates of vibration. This further exacerbates the time lag of the vibration peaks and the decrease in the vibration amplitude, ultimately leading to the differences between the simulation and the measurement.
Therefore, in this study, the effectiveness verification was carried out by comparing the peak amplitude increases of the vibration acceleration at measuring point 3 and that of the point probe under different harmonic content compositions. Given that the vibration amplitude of the winding under power frequency current is relatively small, a combination of 75% power frequency current and 25% 350 Hz harmonic current was selected as the benchmark for comparison. The comparison of the amplitude increases between the simulated and measured values is presented in Table 4. Through comparative analysis, the error between the vibration acceleration amplitude increase at measuring point 3 and that of the point probe on the winding was found to be within 5%. This indicates the effectiveness and reliability of the proposed multi-physical-field vibration simulation method.

5. Analysis of the Characteristic Parameters of Transformer Vibration Under Harmonic Currents

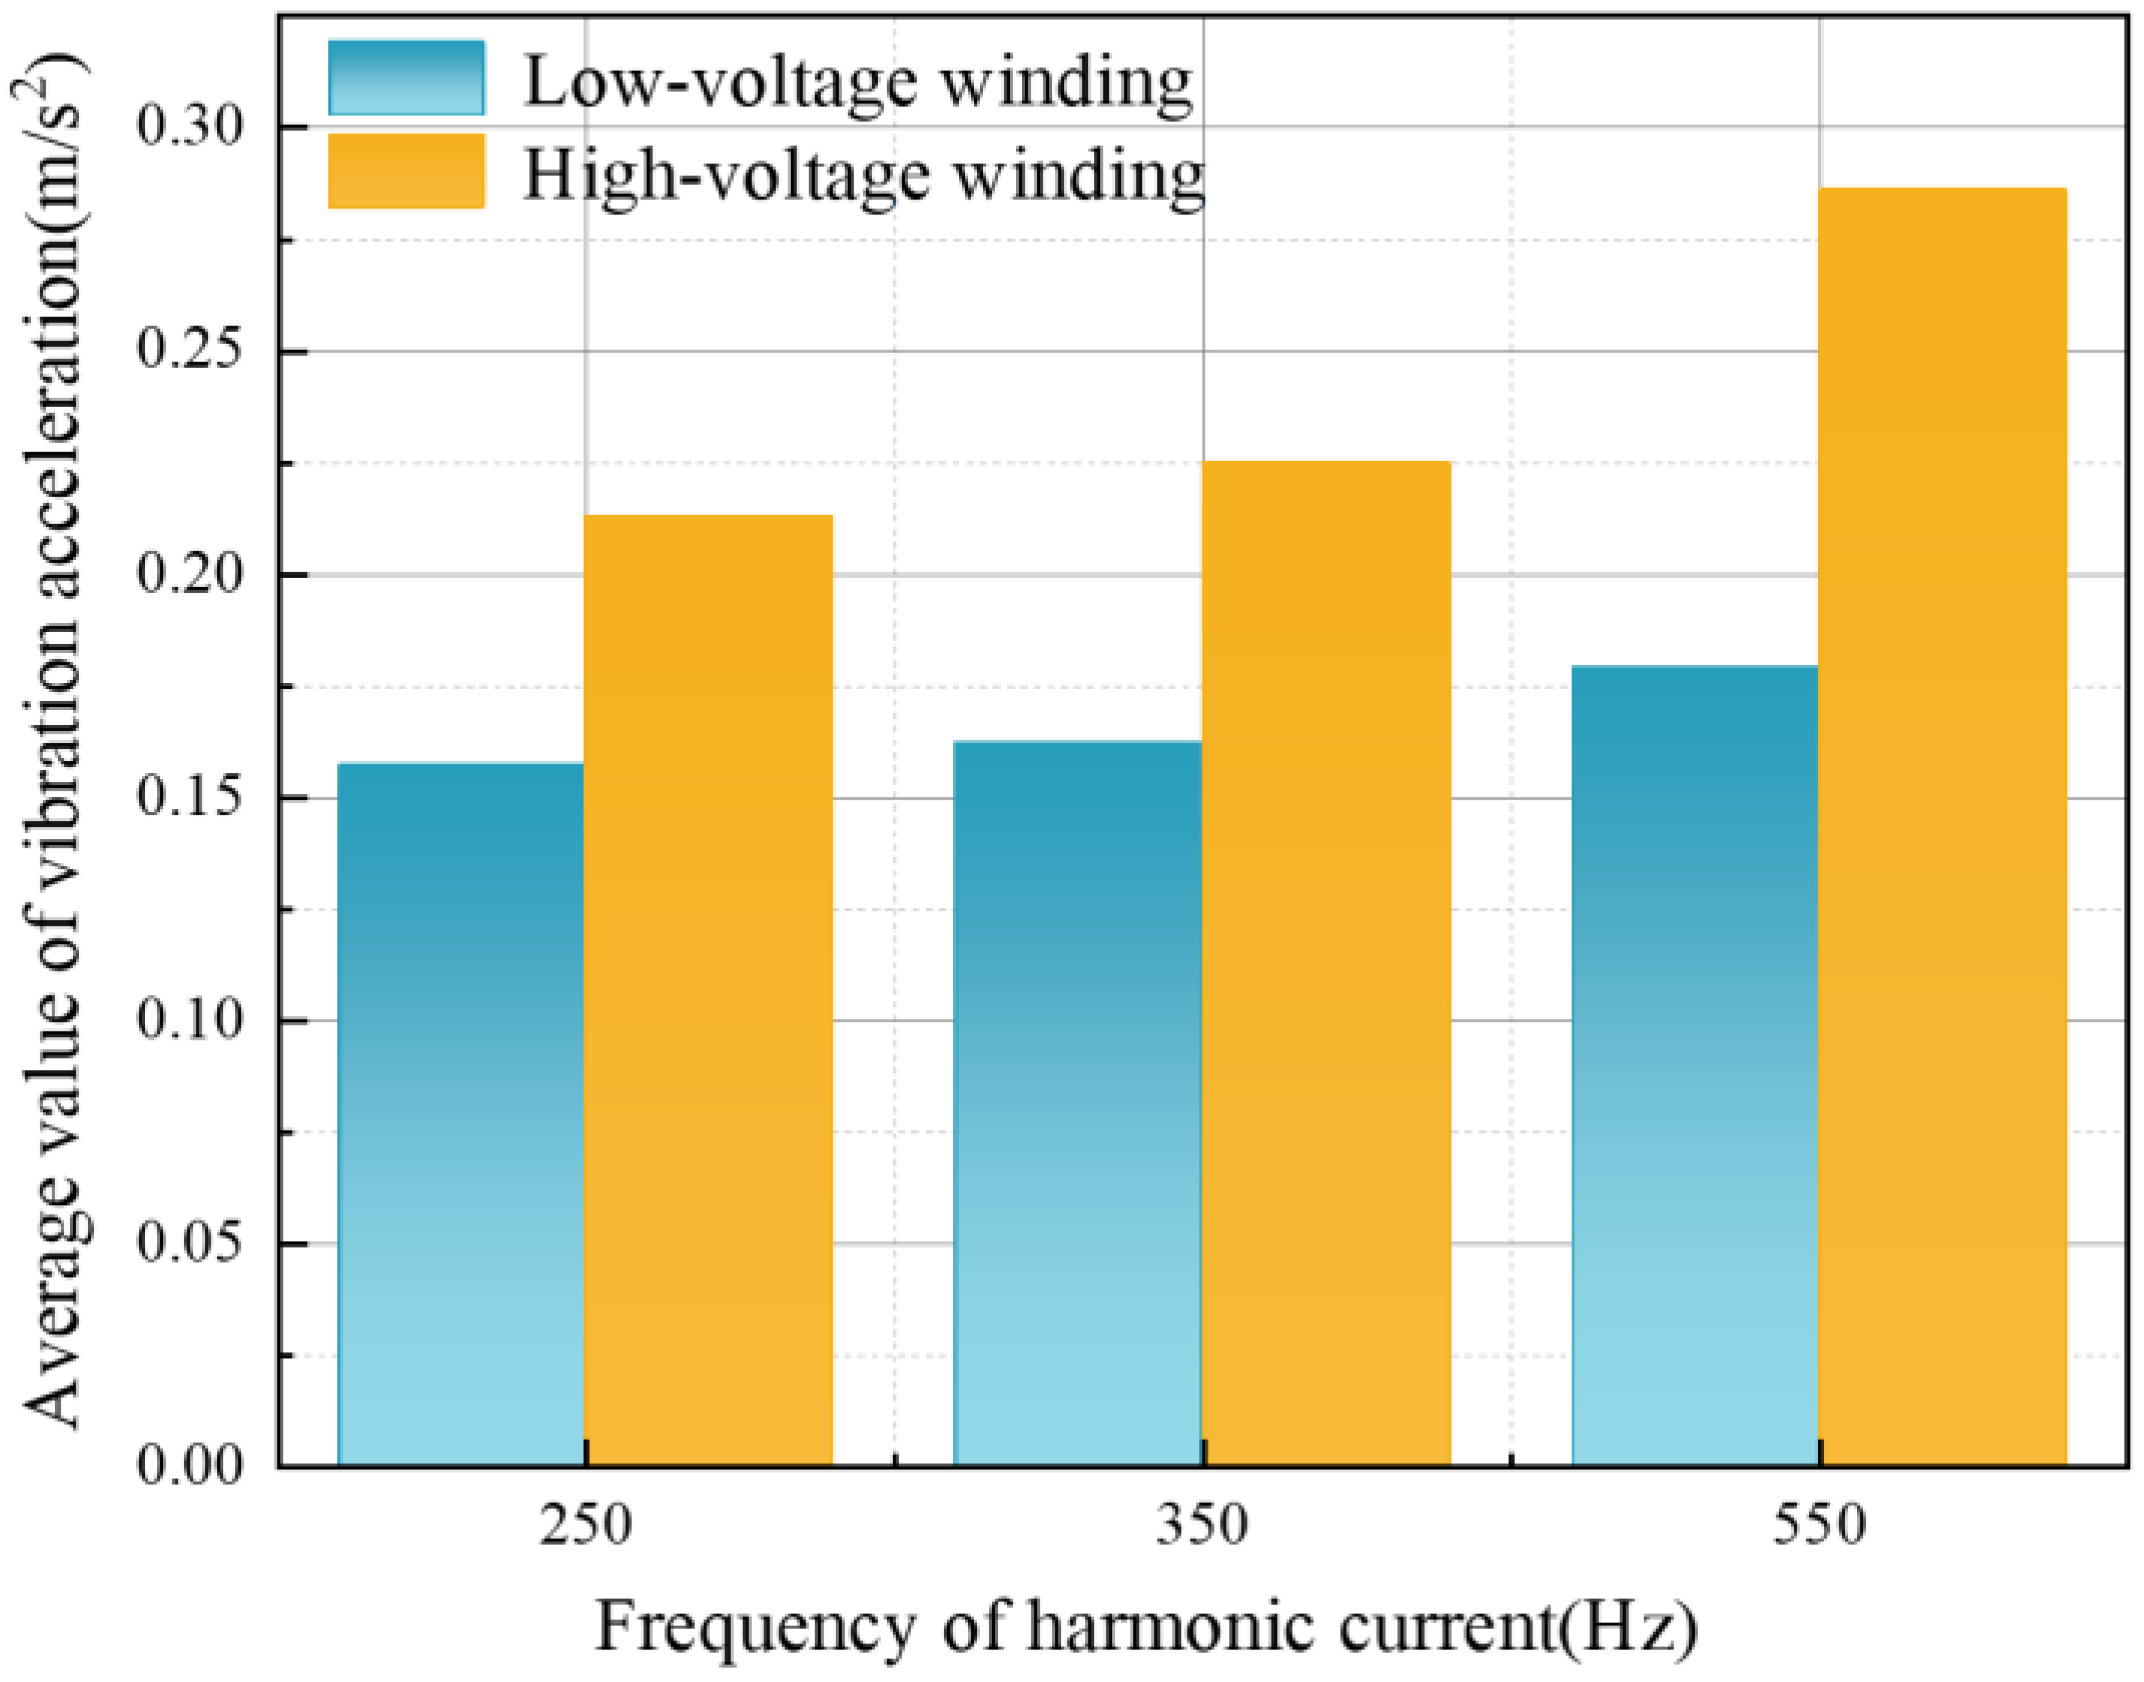
5.1. Analysis of Transformer Vibration Properties at Various Harmonic Current Frequencies

This paper comprehensively analyzes the vibration characteristics of the transformer, grounded on the principle of maintaining a constant total effective value of the current, under various combinations of harmonic current contents and frequencies. Figure 10 illustrates the vibration acceleration distributions of the transformer when the harmonic currents with frequencies of 250 Hz, 350 Hz, and 550 Hz, with harmonic current contents of 25%, 30%, and 40%, are superimposed on the power frequency current. Figure 10 illustrates that as the contents of the superimposed multiple harmonic currents increase, the peak of the transformer vibration acceleration also rises. When the content of the multiple harmonic currents is increased from 25% to 40%, the peak vibration acceleration at measuring point 3 escalates from 0.183 m/s2 to 0.325 m/s2, reflecting an increase rate of 77.6%. This clearly indicates that the overall vibration intensity of the transformer has been significantly enhanced.
This study analyzes the statistical properties of different harmonic frequencies in both the time and frequency domains and defines six key characteristics for quantitative analysis. In the time domain, the root mean square value reflects the vibration energy, the absolute average value shows the degree to which the signal deviates from zero, and the peak—to—peak value represents the maximum vibration range within one period. In the frequency domain, the mean frequency determines the average distribution position of energy, the random coefficient quantifies the randomness of the signal, and the centroid frequency describes the energy—related frequency characteristics. Their calculation formulas are shown in Table 5. In the equations: xi represents the time-series vibration signal, whereas N means the total sample points. The frequency-domain signal subsequent to the FFT (Fast Fourier Transform) is defined as Xi, and the frequency value corresponding to the i-th frequency-domain point is defined as fi.
Table 6 illustrates the modification of the transformer’s vibration characteristic values in response to harmonics of differing frequencies. When the harmonic frequency increases from 250 Hz to 350 Hz and subsequently to 550 Hz, both the quadratic mean value and the absolute average value exhibit a progressively increasing trend. Among them, the properties affected by the 550 Hz harmonic stand out the most. The influence of the 250 Hz harmonic is the next most significant, while the influence of the 350 Hz harmonic is relatively small. The peak-to-peak value indicates that the 250 Hz harmonic exhibits the smallest action, while the 550 Hz harmonic is the largest. The random coefficient characteristics under the 350 Hz and 550 Hz harmonics are nearly identical, but the random coefficient value under the 250 Hz harmonic is relatively large, indicating a heightened dispersion of the signal spectrum at this frequency. The centroid frequency first rises and then decreases, with the maximum centroid frequency occurring under the influence of the 350 Hz harmonic, during which the high-frequency components in the spectrum are relatively large at this time.

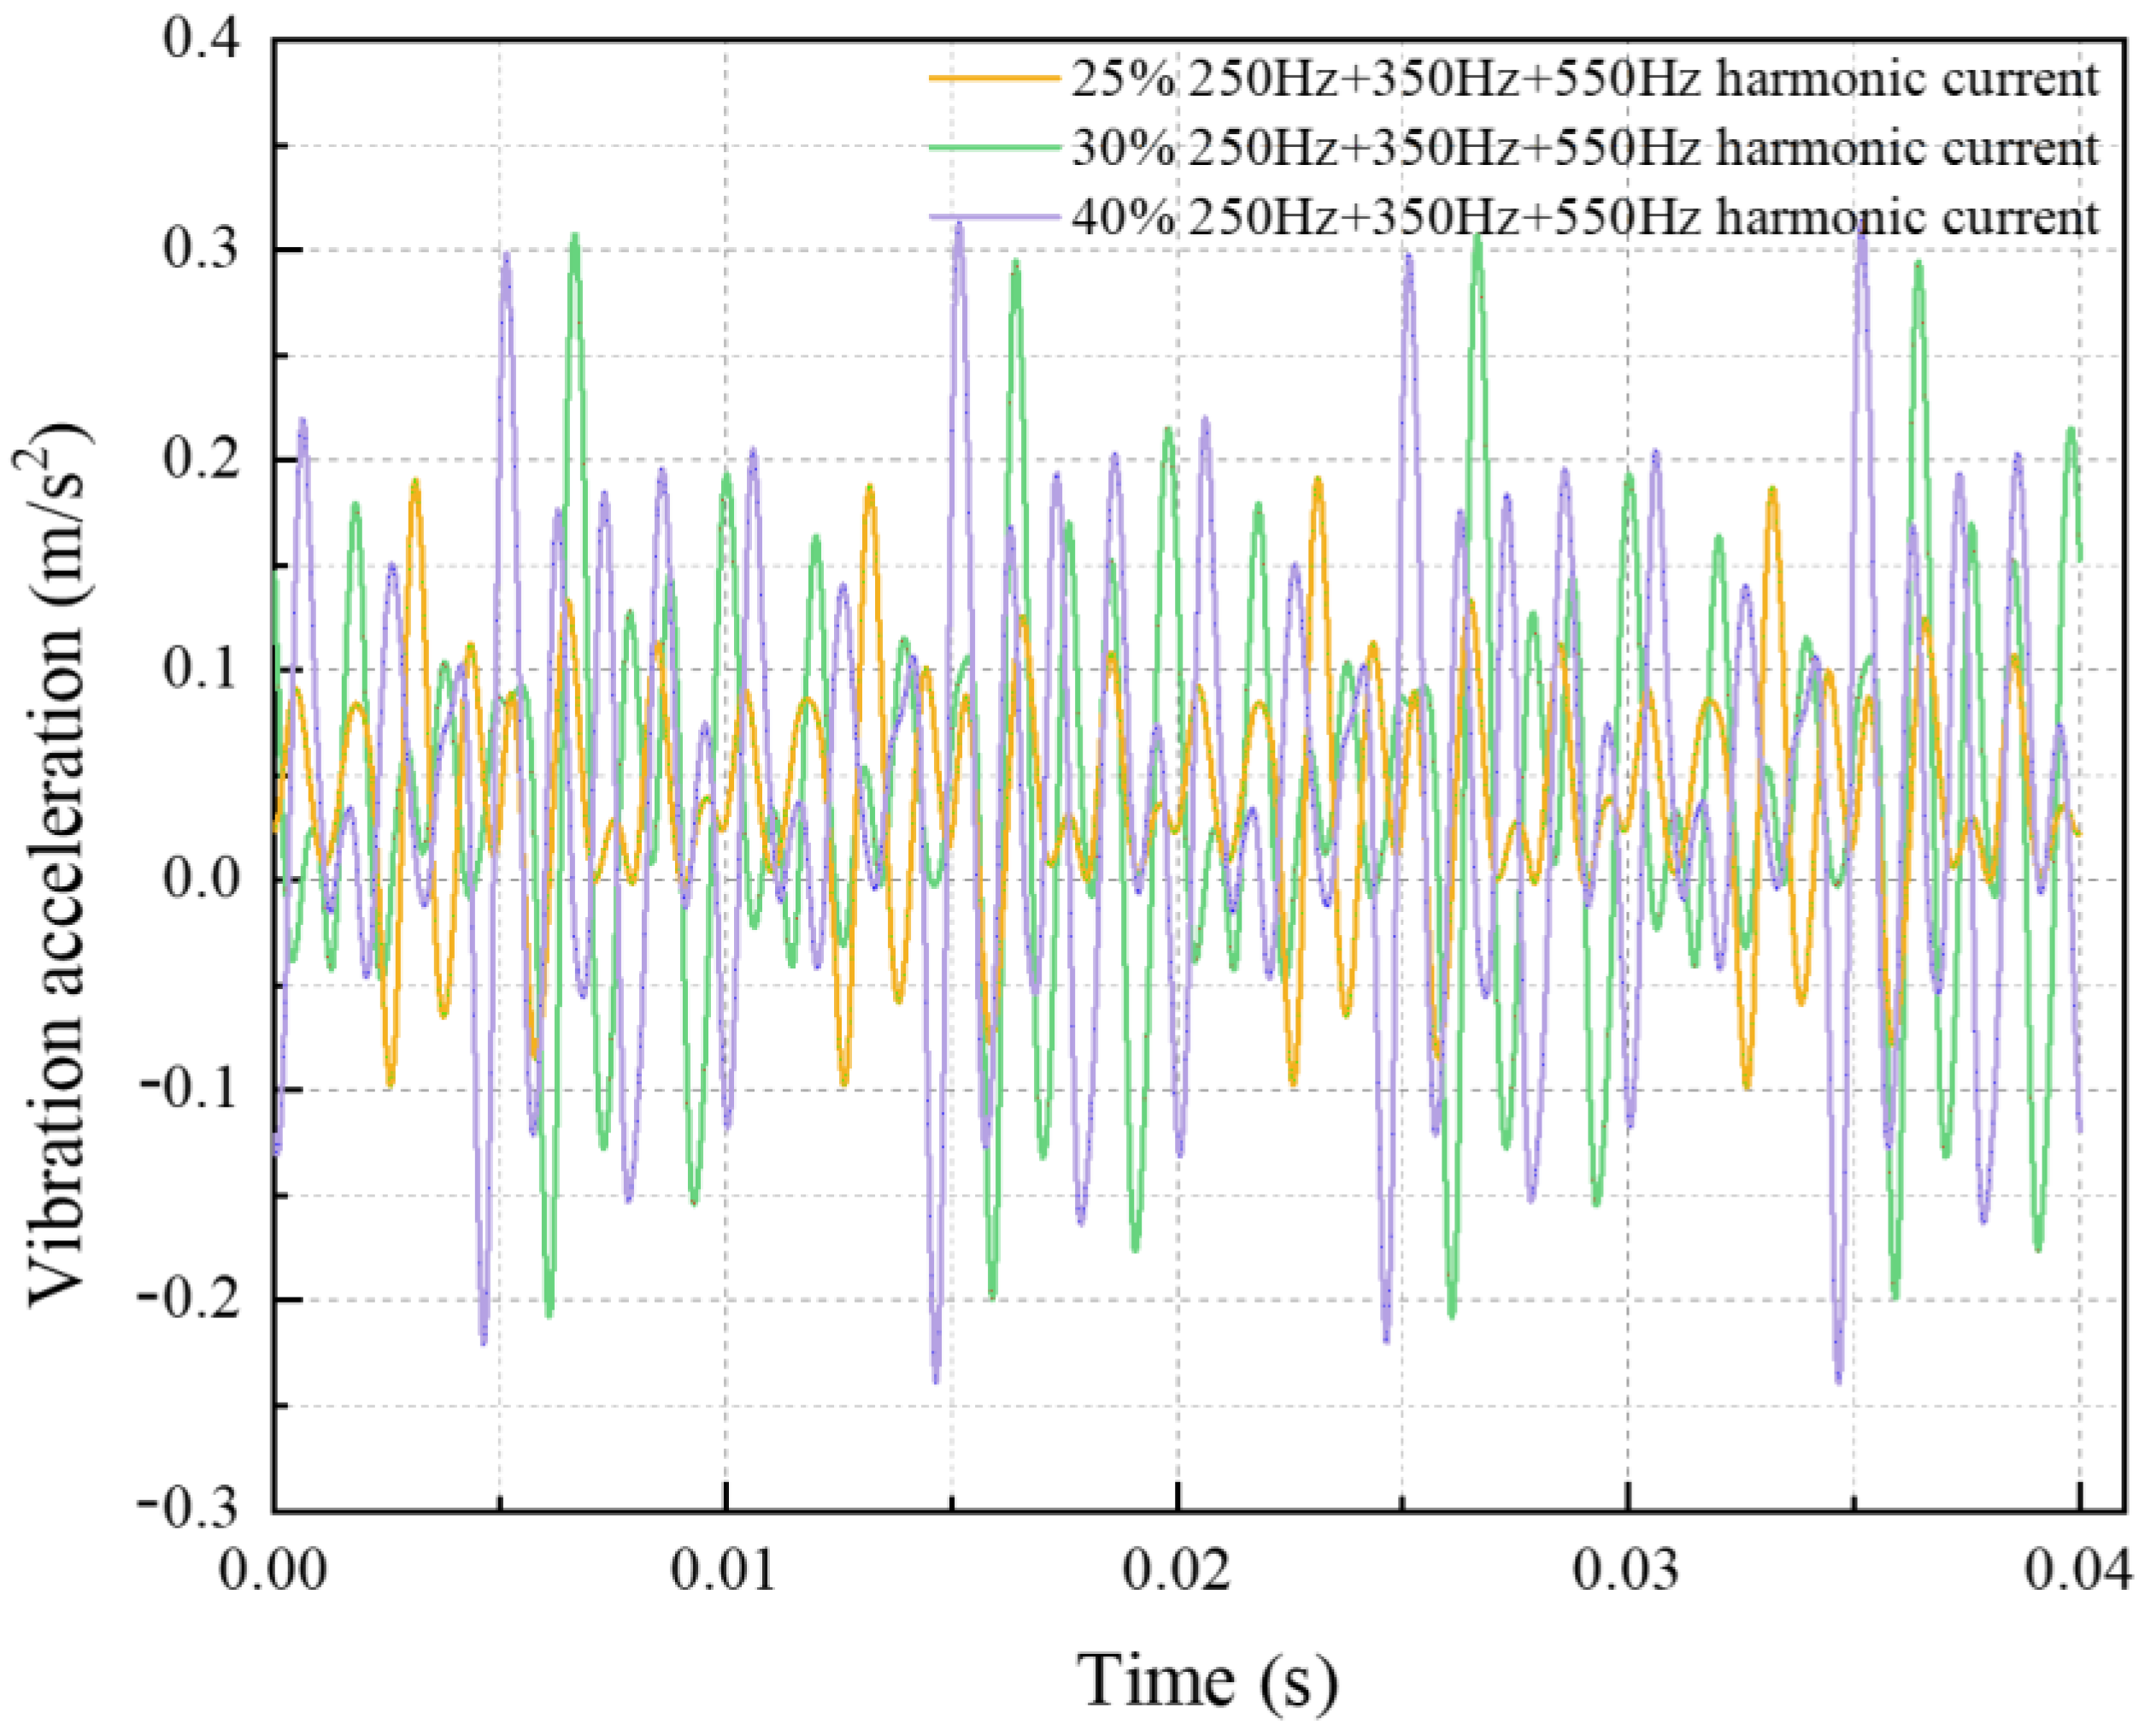
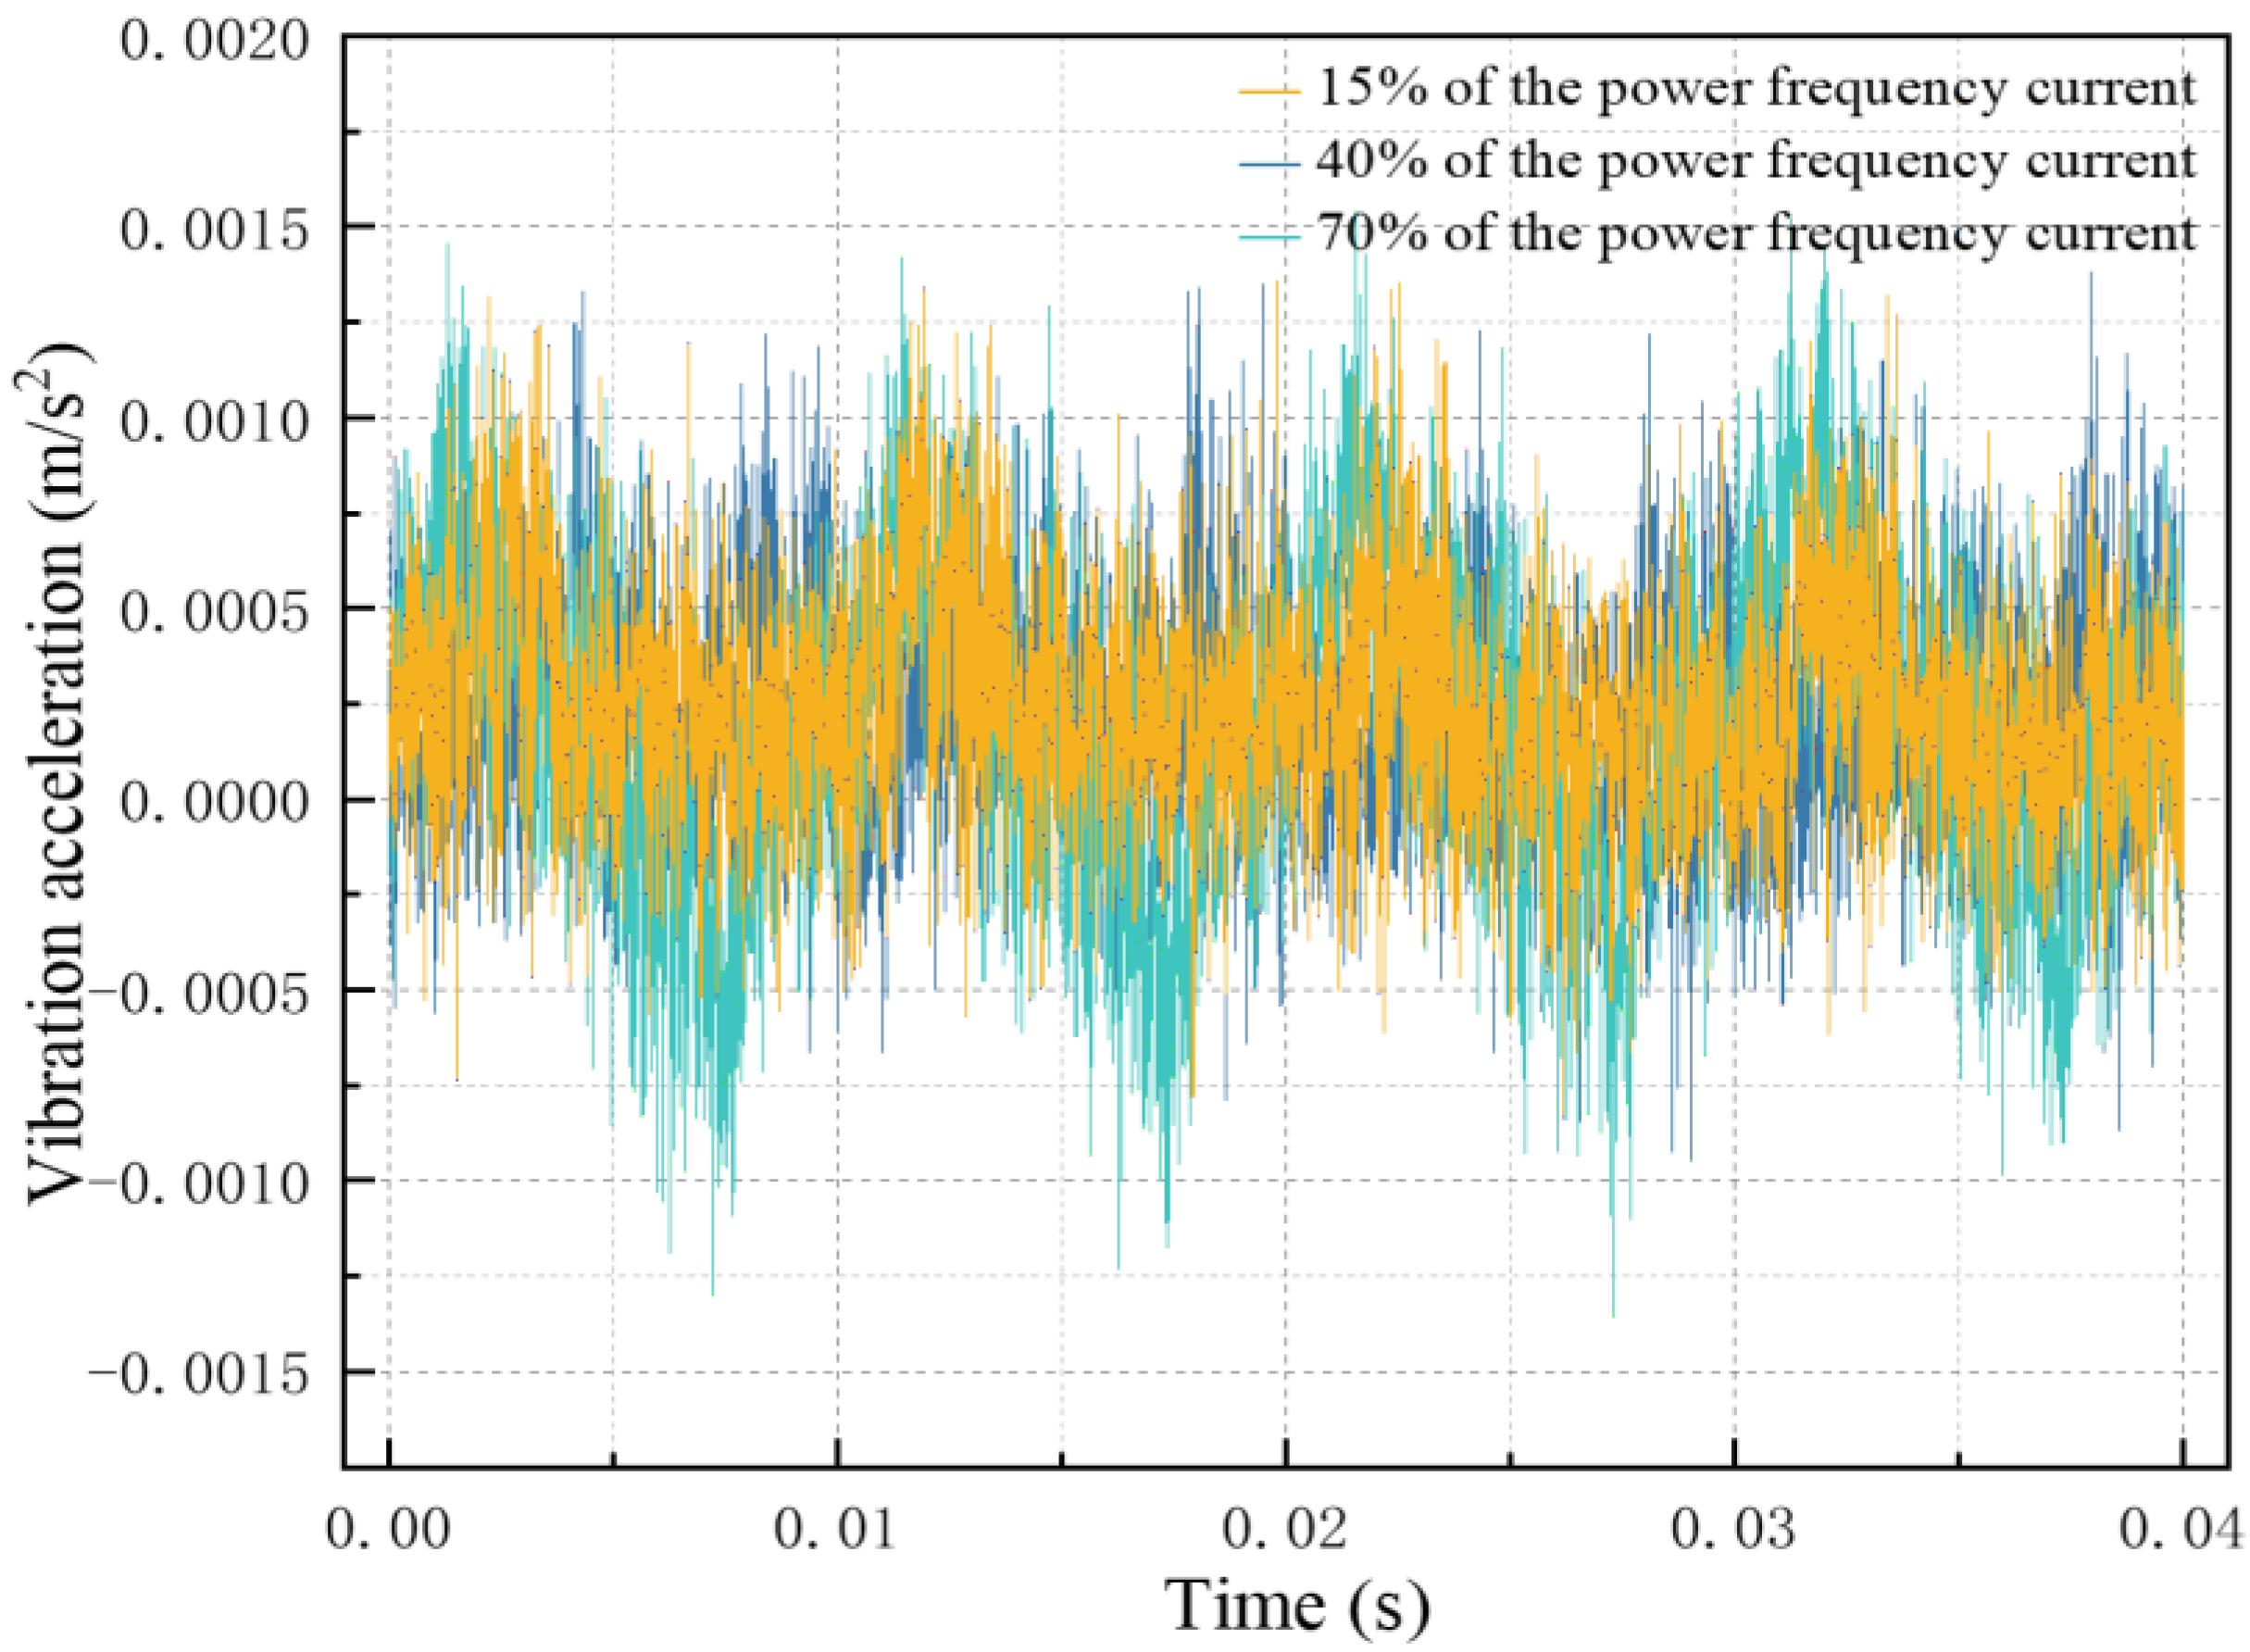
5.2. Analysis of Transformer Vibration Characteristics Under Different Harmonic Current Contents

This research examines the variance in the oscillatory behaviors of the transformer under power frequency currents with varying compositions. The experiment quantifies the variations in vibration acceleration at measuring point 3 under power frequency currents with contents of 15%, 45%, and 70%, respectively, as seen in Figure 11. Figure 11 illustrates that under power frequency current, the amplitude of its vibration acceleration minimal, with the order of magnitude at 10−3.
As the quantity of the fundamental—frequency current rises, the intensity of the vibration acceleration correspondingly strengthens. As the power frequency current increases from 15% to 70%, the peak of the acceleration at measuring point 3 increases from 0.00128 m/s2 to 0.00162 m/s2, reflecting an increase of 26.56%. However, the overall vibration under the pure power frequency current is minimal, and the noise at the test site is also rather low. This indicates that the influence of the unaltered, basic power—frequency current on the transformer’s vibration is relatively restricted, leading to both low vibration amplitude and decreased noise levels.
This work examines the vibration characteristics of the transformer by analyzing pure power frequency current superimposed with 250 Hz harmonic current as a research sample under varying harmonic current. As the proportion of the 250 Hz harmonic current increases from 25% to 40%, Figure 12 shows the pattern of vibration acceleration values at measurement point 3. Figure 12 illustrates that Figure 12 shows that the magnitude of the transformer’s vibration acceleration grows remarkably, attaining an order of magnitude of 10−1. Its amplitude exceeds the acceleration by two orders of magnitude when only fundamental—frequency current is present. Moreover, as the intensity of the combined harmonic current rises, the amplitude of the vibration acceleration correspondingly intensifies. The maximum vibration acceleration at measuring point 3 rises from 0.135 m/s2 to 0.334 m/s2, reflecting an increase of 147.41%. Upon superimposing the harmonic current, the overall oscillatory motion of the transformer is markedly more intense than that under the power frequency current.
Table 7 illustrates the variations in the transformer’s vibration characteristic values under the action of harmonics with different contents. As the harmonic content increases from 25% to 50%, all six vibration characteristic values exhibit an upward trend. The changes in four characteristics—root mean square value, absolute average value, peak-to-peak value, and mean frequency—are substantial as the harmonic content increases from 25% to 30%. When the harmonic content reaches 50%, the centroid frequency escalates from 2000 Hz to beyond 4000 Hz, indicating a significant alteration. The random coefficient nearly exhibits a linear increase with the rise in harmonic content, accompanied by a progressive intensification of dispersion and an incremental rise in high-frequency components.

6. Conclusions

This study focuses on the S20-M-100/10-0.4kV oil-immersed transformer, analyzing the effects of various harmonic currents on its vibration characteristics. By utilizing an “electromagnetic structural force” simulation of multi-field coupling, the transformer’s vibration acceleration distribution under various harmonic currents is derived. At power frequency, the winding vibration prevails, with its acceleration amplitude exceeding that of the iron core by one order of magnitude. As the harmonic current content increases, the average vibration accelerations of the windings vary according to a power function. With increasing frequency, the acceleration distributions of the two windings diverge markedly, with the concentrated area relocating from the center to the terminus of the winding, and the acceleration increase in the high-voltage winding becoming more pronounced. To validate the simulation, a platform for harmonic loading and vibration measurement is constructed. The discrepancy between the acceleration increments at the measured points and the simulation probe points is within 5%, demonstrating the effectiveness and dependability of the multi-physical field vibration simulation methodology.
The transformer vibration experiment conducted under harmonic currents reveals the variation laws of vibration characteristics at various harmonic current contents and frequencies. The vibration acceleration increases significantly as the harmonic current frequency rises from 250 Hz to 550 Hz, reaching a maximum of 0.298 m/s2 at 550 Hz. When the content increases from 25% to 40%, the peak value surges by 77.6%, and vibration characteristic values, such as the root mean square value, show a significant increase, indicating that the augmentation in harmonic content intensifies the vibration. Compared to the pure power frequency current, the amplitude of vibration acceleration increases by two orders of magnitude upon the superposition of harmonic currents, and the random coefficient exhibits a linear increase with the harmonic content, suggesting that harmonic currents substantially augment the spectrum dispersion and high-frequency components of the vibration signal.
Furthermore, transformer oil characteristics, environmental conditions, and aging significantly impact transformer vibration behavior. Oil viscosity affects winding-core damping, with high-viscosity oil-enhancing damping, reducing vibrations, and altering the transmission path. The dielectric constant influences the electric field, thus affecting electromagnetic forces and vibration. Environmentally, temperature changes winding and core material properties, and humidity can create extra vibration sources due to insulation degradation. Transformer aging, like winding insulation aging and core magnetic property changes, weakens the structure and modifies electromagnetic forces, affecting vibration. In future research, integrating these factors is crucial for better transformer condition monitoring, fault prediction, and power system reliability.

Author Contributions

Conceptualization, D.Z.; methodology, W.D. and J.H.; software, H.S.; validation, J.X.; formal analysis, G.Q.; investigation, J.H.; writing—original draft preparation, G.Q.; writing—review and editing, W.D.; supervision, H.S. All authors have read and agreed to the published version of the manuscript.

Funding

This research was funded by the Science and Technology Project of China Southern Power Grid Co., Ltd. (YNKJXM20210186). “Research on insulation life prediction of key components of equipment under the effect of harmonic coil in power system and the transformer trial scale test device production with typical defects” of the Electric Power Research Institute of Yunnan Power Grid Co, Ltd. We express our gratitude to Xi’an Jiaotong University for supplying the test platform for harmonic vibration research, which is crucial to the success of our work.

Data Availability Statement

Data are contained within the article.

Conflicts of Interest

Authors Dexu Zou, Weiju Dai, Guochao Qian and Haoruo Sun were employed by the company Electric Power Research Institute of Yunnan Power Grid Co., Ltd. The remaining authors declare that the research was conducted in the absence of any commercial or financial relationships that could be construed as a potential conflict of interest.

References

  1. Alawasa, K.M.; Al-Badi, A.H. Investigation and Analysis of the Power Quality in an Academic Institution’s Electrical Distribution System. Energies 2024, 17, 3998. [Google Scholar] [CrossRef]
  2. Arranz-Gimon, A.; Zorita-Lamadrid, A.; Morinigo-Sotelo, D.; Duque-Perez, O. A review of total harmonic distortion factors for the measurement of harmonic and interharmonic pollution in modern power systems. Energies 2021, 14, 6467. [Google Scholar] [CrossRef]
  3. Taghvaie, A.; Warnakulasuriya, T.; Kumar, D.; Zare, F.; Sharma, R.; Vilathgamuwa, D.M. A comprehensive review of harmonic issues and estimation techniques in power system networks based on traditional and artificial intelligence/machine learning. IEEE Access 2023, 11, 31417–31442. [Google Scholar] [CrossRef]
  4. Qian, M.; Yin, F.; Yuan, Y.; Jiang, P.; Wang, L.; Zhao, L. Vibration characteristics of ± 800 kV converter transformers part I: Under no-load conditions. Int. J. Electr. Power Energy Syst. 2024, 159, 110060. [Google Scholar] [CrossRef]
  5. Qian, M.; Yin, F.; Yuan, Y.; Jiang, P.; Wang, L.; Zhao, L. Vibration characteristics of ± 800 kV converter transformers part II: Under load conditions. Int. J. Electr. Power Energy Syst. 2024, 159, 110026. [Google Scholar] [CrossRef]
  6. Liu, C.; Hao, J.; Liao, R.; Yang, F.; Li, W.; Li, Z. High proportion and large value harmonic current influence on the magnetic field, loss and temperature distribution for ultrahigh voltage converter transformer. IET Electr. Power Appl. 2024, 18, 208–225. [Google Scholar] [CrossRef]
  7. Dao, T.; Phung, B.T. Effects of voltage harmonic on losses and temperature rise in distribution transformers. IET Gener. Transm. Distrib. 2018, 12, 347–354. [Google Scholar] [CrossRef]
  8. Yaghoobi, J.; Alduraibi, A.; Martin, D.; Zare, F.; Eghbal, D.; Memisevic, R. Impact of high-frequency harmonics (0–9 kHz) generated by grid-connected inverters on distribution transformers. Int. J. Electr. Power Energy Syst. 2020, 122, 106177. [Google Scholar] [CrossRef]
  9. Kumar, I.; Bakshi, A. Effects of axial sticks and proof stress of conductor material on the buckling strength of transformer inner winding. IEEE Trans. Power Deliv. 2022, 11, 5465–5468. [Google Scholar] [CrossRef]
  10. Hu, Z.; Han, Y.; Zalhaf, A.S.; Zhou, S.; Zhao, E.; Yang, P. Harmonic sources modeling and characterization in modern power systems: A comprehensive overview. Electr. Power Syst. Res. 2023, 218, 109234. [Google Scholar] [CrossRef]
  11. Jiang, M.; Sha, Z.; Zhao, Y.; Chen, W.; Zhang, Q.; Wen, T. Strongly Coupled Circuit-Magnetic-Structural Effect on Winding Vibration Process of Power Transformer. IEEJ Trans. Electr. Electron. Eng. 2024, 19, 1147–1155. [Google Scholar] [CrossRef]
  12. Xu, J.; Hao, J.; Zhang, N.; Liao, R.; Feng, Y.; Liao, W.; Cheng, H. Simulation study on converter transformer windings stress characteristics under harmonic current and temperature rise effect. Int. J. Electr. Power Energy Syst. 2025, 165, 110505. [Google Scholar] [CrossRef]
  13. Xiong, J.; Luo, Y.; Ren., S.; Lu, S.; Pei, X.; Zha, X.; Zhou, W. Simulation and Experimental Study on Vibration and Noise of Power Transformer Under Load. In Proceedings of the 2023 4th International Symposium on Insulation and Discharge Computation for Power Equipment (IDCOMPU 2023), Wuhan, China, 26–28 May 2023. [Google Scholar] [CrossRef]
  14. Jiang, P.; Zhang, Z.; Dong, Z.; Yang, Y.; Pan, Z.; Deng, J. Axial and radial electromagnetic-vibration characteristics of converter transformer windings under current harmonics. High Volt. 2023, 8, 477–491. [Google Scholar] [CrossRef]
  15. Amir Esmaeili, M.; Hamed Nezhad, S. Analysis of Power Transformer Vibration Modes. J. Power Eng. 2024, 10, 45–55. [Google Scholar]
  16. Anthony, J.; Philip, A.; Teeraphon, P. Localized Surface Vibration and Acoustic Noise Emitted from Laboratory-Scale Transformer Cores Assembled From Grain-Oriented Electrical Steel. IEEE Trans. Magn. 2016, 52, 1–15. [Google Scholar] [CrossRef]
  17. Jin, M.; Chen, W.; Zhao, Y.; Wen, T.; Wu, J.; Wu, X.; Zhang, Q. Coupled magnetic-structural modeling of power transformer for axial vibration analysis under short-circuit condition. IEEE Trans. Magn. 2022, 58, 1–9. [Google Scholar] [CrossRef]
  18. Sun, C.; Zhu, L.; Qian, G.; Dai, W.; Hong, Z.; Wang, S.; Xu, J.; Wang, J. Study on the Effect of Harmonic Current on the Vibration Characteristics of Oil-Immersed Transformer. In Proceedings of the 2023 IEEE International Conference on Power Science and Technology (ICPST), Kunming, China, 5–7 May 2023. [Google Scholar] [CrossRef]
Figure 1. Three-dimensional simulation model of the S20-M-100/10-0.4kV transformer.
Energies 18 01673 g001
Figure 2. Nephogram depicting the acceleration of the transformer core under power frequency current.
Energies 18 01673 g002
Figure 3. Nephogram depicting the vibration acceleration of the transformer windings under power frequency current.
Energies 18 01673 g003
Figure 4. Distribution diagram of the vibration acceleration of the transformer windings under the harmonic current content of 25% at different frequencies of 250 Hz, 350 Hz, and 550 Hz.
Energies 18 01673 g004
Figure 5. Graph of the variation in the average vibration acceleration of the transformer windings under the action of harmonic currents with frequencies of 250 Hz, 350 Hz, and 550 Hz.
Energies 18 01673 g005
Figure 6. Diagrams of the vibration acceleration distribution of the LV winding and the HV winding under the harmonic current of 250 Hz with the contents of 25% and 50%. Note: The black arrow serves to demonstrate the migration trend of the acceleration concentration area, showing the direction from the middle part of the winding to the ends as the harmonic current excitation is applied. The red dot is used to pinpoint the location of the stress peak at the winding ends, which appears due to the change in acceleration distribution caused by the harmonic current. This makes it easier to visually identify the position with the highest stress value at the winding ends.
Energies 18 01673 g006
Figure 7. Variation curve of the average vibration acceleration of the transformer windings under the harmonic current content ranging from 0 to 50% at a frequency of 250 Hz.
Energies 18 01673 g007
Figure 8. Platform for measuring transformer harmonic loading and vibration.
Energies 18 01673 g008
Figure 9. Comparative diagram of simulation probe acceleration and measured acceleration at test measuring point 3 under power frequency current.
Energies 18 01673 g009
Figure 10. Variation in vibration acceleration under the action of harmonic currents at different frequencies.
Energies 18 01673 g010
Figure 11. Variations in the Transformer’s Vibration Acceleration under Power Frequency Currents with Different Contents.
Energies 18 01673 g011
Figure 12. Variations in the Transformer’s Vibration Acceleration under the Action of 250 Hz Currents.
Energies 18 01673 g012
Table 1. Main parameters of the S20-M-100/10-0.4kV transformer.
ParameterRated Voltage (V)Phase Current (A)Number of Coil Turns
LV Winding400144.3104
HV Winding100003.32364
Table 2. Key simulation parameters of the S20 - M - 100/10 - 0.4kV transformer.
ParameterMagnetic
Permeability (H/m)
Electrical Conductivity (S/m)Density (kg/m³)Elastic Modulus (Pa)Thermal Conductivity (W/(m·K))Poisson’s Ratio
Core50002 × 10675001.8 × 1011450.24
Winding/5.8 × 10789001.2 × 10113800.33
Table 3. Parameters of the intermediate frequency transformer.
Parameter NameValue
Rated Capacity (kVA)240
Rated Input Voltage (V)340
Rated Input Current (A)705.88
Rated Output Voltage (V)12 × 600
Rated Output Current (A)12 × 34
Operating Frequency (Hz)50–2500
Table 4. Comparison of amplitude increase for simulated and measured peak values of vibration acceleration across various harmonic compositions.
Current CompositionSimulated Value (m/s2)Increase Amplitude (%)Test Value (m/s²)Increase
Amplitude (%)
Error (%)
75% 50 Hz/25% 350 Hz0.589/0.218//
75% 50 Hz/25% 550 Hz0.65310.87%0.2399.63%1.24%
75% 50 Hz/25% 250 Hz0.66412.73%0.25612.8%0.07%
60% 50 Hz/40% 250 Hz0.80536.67%0.29836.7%0.03%
50% 50 Hz/50% 250 Hz0.90253.14%0.33453.2%0.06%
Table 5. Vibration Characteristics in Time Domain/Frequency Domain.
Feature NameCalculation Formula
Time Domain FeatureRoot Mean Square Value X R M S = 1 N i = 1 N x i 2
Absolute Average Value X a m = 1 N i = 1 N x i
Peak-to-Peak Value X p p = max ( x i ) min ( x i )
Frequency
Domain Feature
Mean Frequency M F = i = 1 N X i / N
Random Coefficient R C = i = 1 N ( X i M F ) 4 / i = 1 N X i × V F 2
Centroid Frequency F c = i = 1 N f i × X i / i = 1 N X i
Table 6. Vibration Characteristic Values under the Action of Harmonics of Different Frequencies.
250 Hz350 Hz550 Hz
RMS Value0.0850.0740.091
Absolute Average Value0.0720.0571584430.097
Peak-to-Peak Value0.3741760.3971190.498
Mean Frequency8.18 × 10−57.51 × 10−59.14 × 10−5
Random Coefficient1390.0101203.6851204.277
Centroid Frequency2422.3622569.9122382.367
Table 7. Vibration characteristic values under the action of harmonics of different contents.
25%30%35%40%50%
RMS Value0.0310.0740.0890.0910.107
Absolute Average Value0.0230.0560.0680.0700.082
Peak-to-Peak Value0.1670.4120.4940.4980.593
Mean Frequency3.81 × 10−72.18 × 10−63.16 × 10−63.31 × 10−64.6 × 10−6
Random Coefficient914.6281091.8721180.0661204.2771244.019
Centroid Frequency2152.3682382.3672391.1572586.2884571.565
Disclaimer/Publisher’s Note: The statements, opinions and data contained in all publications are solely those of the individual author(s) and contributor(s) and not of MDPI and/or the editor(s). MDPI and/or the editor(s) disclaim responsibility for any injury to people or property resulting from any ideas, methods, instructions or products referred to in the content.

