Article

A Cost-Driven Analysis of Thermal Performance in Power Modules †

by
Ciro Scognamillo
1,*,
Antonio Pio Catalano
1,
Lorenzo Codecasa
2,
Alberto Castellazzi
3 and
Vincenzo d’Alessandro
1,*
1
Department of Electrical Engineering and Information Technology, University Federico II, 80125 Naples, Italy
2
Department of Electronics, Information and Bioengineering, Politecnico di Milano, 20133 Milan, Italy
3
Solid-State Power Processing (SP2) Lab Faculty of Engineering, Kyoto University of Advanced Science, Kyoto 615-8577, Japan
*
Authors to whom correspondence should be addressed.
This paper extends the following contribution: Scognamillo, C.; Catalano, A.P.; Codecasa, L.; Castellazzi, A.; d’Alessandro, V. Numerical Investigation on the Thermal Resistance and Assembly Cost in SSC and DSC Power Modules. In Proceedings of the 2024 30th International Workshop on Thermal Investigations of ICs and Systems (THERMINIC), Toulouse, France, 25–27 September 2024; pp. 1–4.
Energies 2025, 18(7), 1665; https://doi.org/10.3390/en18071665
Submission received: 19 February 2025 / Revised: 20 March 2025 / Accepted: 26 March 2025 / Published: 27 March 2025
(This article belongs to the Special Issue Advances in Thermal Management and Reliability of Electronic Systems)

Abstract

:
This paper offers an in-depth overview of the trade-off between thermal performance and assembly cost in state-of-the-art power modules (PMs). Since the development of the PM technological process is still in its infancy, PMs are typically designed and prototyped in order to evaluate their electrical/thermal characteristics. The numerical investigation conducted here aims to analyze the impact of design choices (e.g., assembly materials and dimensions, cooling system efficiency) on the thermal resistance (RTH, [K/W]), thermal time constant (τ, [s]), and overall cost (PMcost, [$]) of semiconductor devices integrated in both single- and double-sided cooled PMs, without any need for prototyping stages. The influence of the thicknesses of the copper and ceramic layers is explored, since they play a relevant role in defining the thermal ratings, as well as the electrical and mechanical characteristics, of the assemblies. The benefits deriving from thicker layers are then weighed against the cost of materials, and figures of merit are defined to evaluate the trade-offs between cost and thermal behavior. The impact of two cooling solutions—passive heatsink and forced liquid—is also taken into account.

1. Introduction

Power modules (PMs) have recently begun to replace power circuits, being a favorable choice for integration into printed circuit boards for energy management/conversion applications by virtue of their compactness, lower operating temperature, and reduced parasitics [1]. The interest of industries and research institutions lies in studying, developing, and manufacturing inexpensive yet highly performing PMs from electrical, thermal, and mechanical points of view [2]. However, the design process for PMs is still in its early stages, and it is based on costly and time-consuming trial-and-error prototyping procedures [3].
Over the last decade, two main technologies have populated the market: single-sided cooled (SSC) and double-sided cooled (DSC) PMs. The key differences between these technologies reside in (i) the cooling systems they can be equipped with—since DSC PMs benefit from two cooling surfaces—and (ii) the electrical connections; more specifically, long, thin, and highly inductive wirebonds are adopted in the SSC technology [4], whereas the DSC variant relies on spherical/cylindrical interconnections (bumps) [5].
Since PMs embed circuits based on power semiconductor devices, they need to keep up with advancements in the voltage capabilities of IGBTs and power MOSFETs. The market is currently filled with up-to-3.3 kV transistors; therefore, thicker (and, thus, more expensive) insulating layers must be taken into consideration in the PM design. On the other hand, such layers could negatively affect the thermal behavior of PMs [6].
In this work, both PM technologies are investigated by means of extremely accurate 3D finite-element method (FEM) simulations in the COMSOL Multiphysics [7] environment. Numerical simulations have been already used in the literature to study PMs: ref. [8] reports an electromagnetic and electrothermal analysis approach based on 3D FEM simulations and analytical models for PMs embedding IGBTs; in [9], IGBT-based PMs are investigated by means of the FEM approach, and thermal models are extracted; ref. [10] makes use of experiments and FEM simulations to optimize the choice of cooling systems and mechanical features in three commercial PMs; in [11], an extensive review of PM characterization is provided, and FEM analyses are reported as a tool able to predict PM thermal metrics; and refs. [12,13,14,15] represent additional examples of FEM-based numerical approaches applied to the study of heat propagation in PMs.
In addition to investigating state-of-the-art PMs, the extensive simulation campaign proposed here includes, for the first time, economic considerations regarding the PM manufacturing process. More specifically, this contribution explores the trade-offs between the cost of the PM (PMcost, [$]) and the junction-to-ambient thermal resistance (RTH, [K/W]) and thermal time constant (τ, [s], defined in [16]) of semiconductor devices embedded in such assemblies. Parametric analyses are conducted to evaluate the effect of several design parameters (e.g., the thicknesses of layers composing the assembly, the PM technology, the cooling system efficiency) on these figures of merit. The investigation aims to propose cost-conscious guidelines for designers, who seek to improve the electrical and thermal characteristics of PMs without significantly impacting overall costs. The use of (i) passive heatsink and (ii) forced liquid is emulated in order to ensure that these guidelines are as generic as possible in terms of the cooling system.
This paper extends the contribution of previous authors [17] in a three-fold way: (i) a deeper insight into the PM technology under analysis is provided; (ii) dynamic thermal simulations are carried out in lieu of the steady-state ones presented in [17], to include the transient thermal behavior; (iii) each geometrical variant of the assemblies is characterized by three figures of merit, taking into consideration both material cost and performance.
The remainder of the paper is outlined as follows. In Section 2, SSC and DSC PM technologies are described. Section 3 probes into the methodology adopted for the numerical 3D modeling of the assemblies in COMSOL Multiphysics (5.3A), highlighting the in-house routine adopted for thermal simulations. Simulation times, convergence capability, and suitability based on parametric analyses are also discussed. In Section 4, the simulation results are shown and debated. Three figures of merit are presented and their trends are discussed: they summarize both the static and dynamic thermal performances of assemblies, by weighing (i) the thermal resistance and (ii) the thermal time constants over PMcost. Conclusions are then drawn in Section 5.

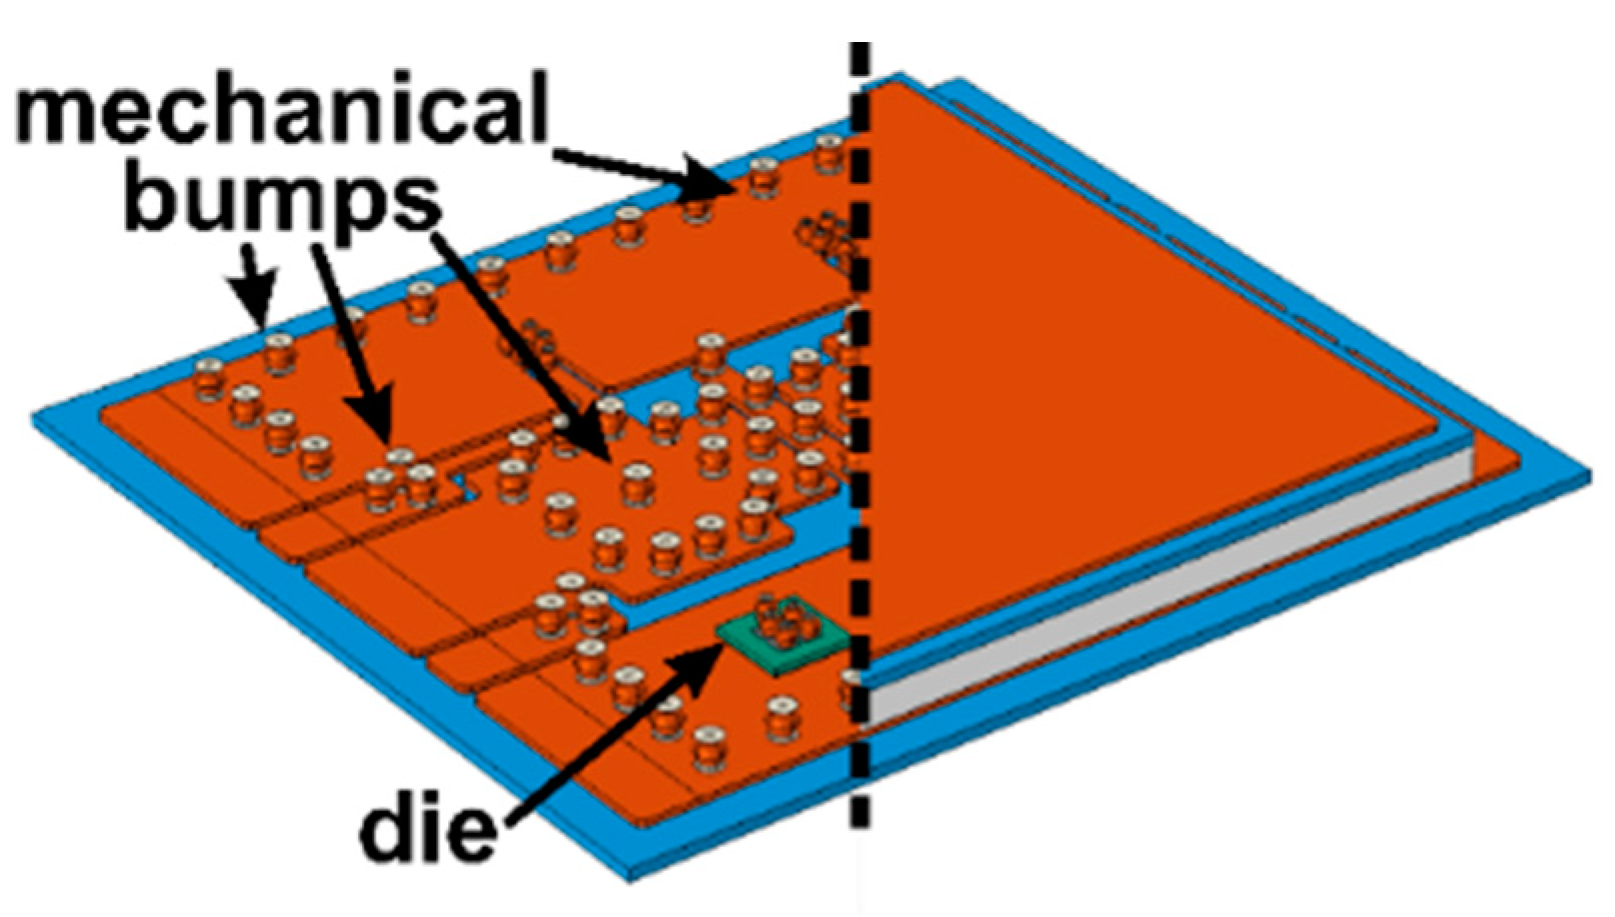
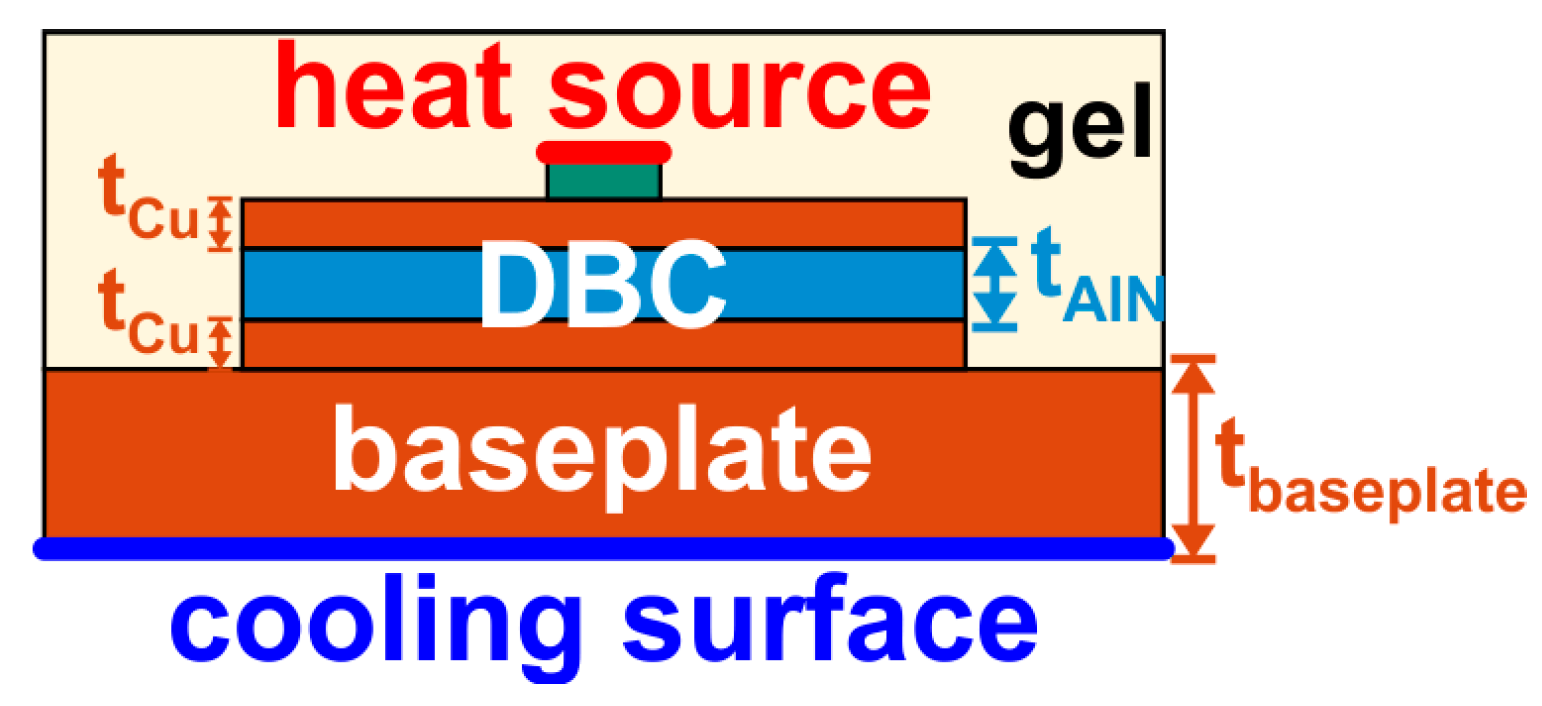
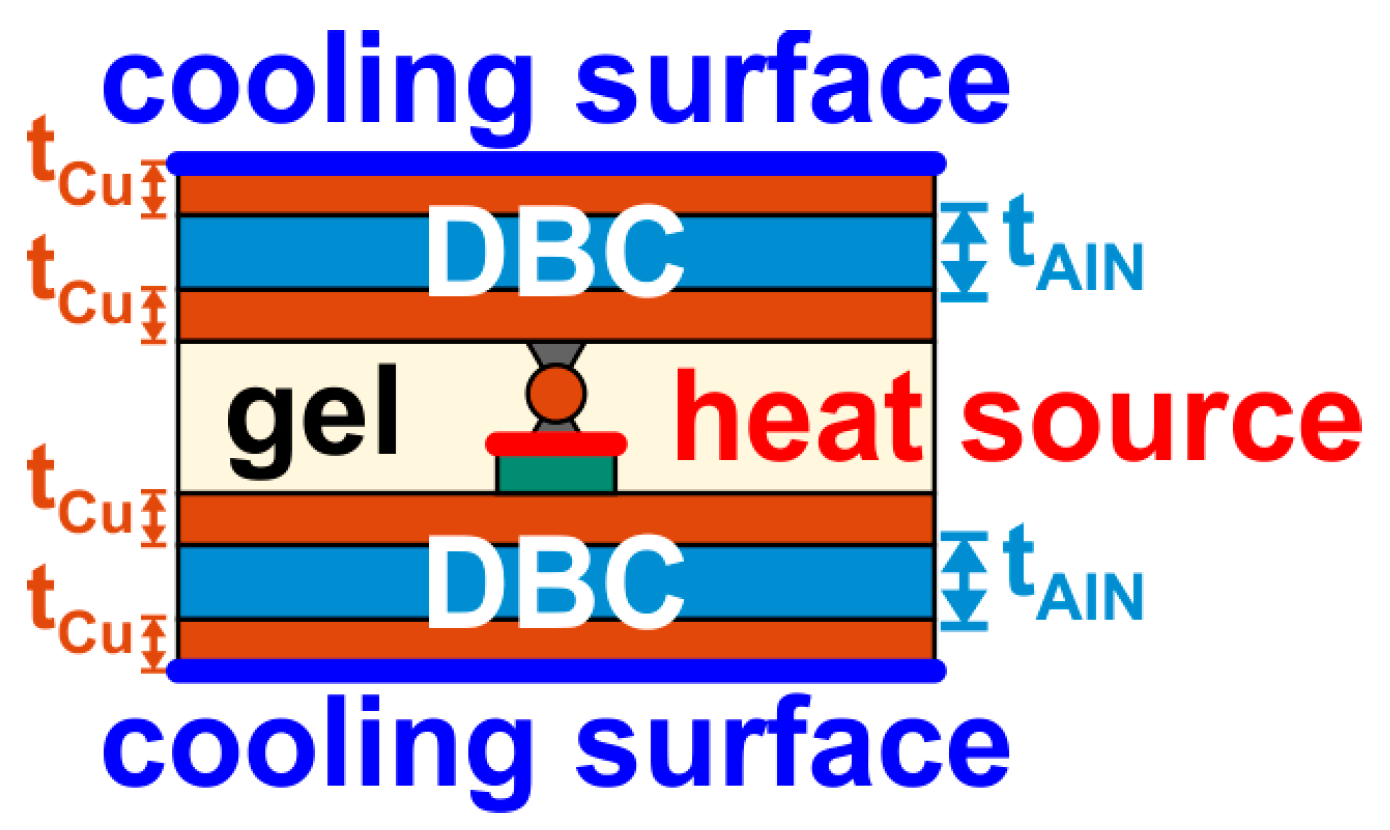
2. Power Modules Under Investigation

Figure 1 shows the standard SSC PM assembly: it makes use of a direct bonded copper (DBC) substrate over a thick copper (Cu) baseplate, providing mechanical support and enhancing heat spreading. A ceramic layer (for this work, aluminum nitride, AlN, but many others can be adopted too) is embedded within the DBC, enclosed in between two Cu sheets, and devices are soldered on the top Cu layer.
In Figure 2, the DSC variant assembled using two interfacing DBCs is depicted. The electrical interconnections are vertical (DBC-to-DBC or device PADS-to-DBC), and are ensured by Cu bumps; in this work, spherical bumps are considered. Since wirebonds are replaced by vertical interconnections, parasitics are reduced, especially in terms of inductive and resistive contributions; in addition, mechanical robustness is granted by mechanical bumps, that is, the Cu spheres that have no electrical use, but help to maintain the fixed distance between the two sandwiched DBCs. Such robustness makes the thick Cu baseplate—needed in the case of SSC PMs—unnecessary in this case. In both the SSC and DSC technology, the PMs are equipped with 3.3 kV SiC power MOSFETs in their bare die form.
Regardless of the technology, the thickness of the layers composing the assemblies plays a significant role in defining the PM’s electrical, mechanical, and thermal ratings [18]; ref. [19] thoroughly describes the link between material thickness and thermal resistance, also subdividing the latter into its convective and conductive contributions. It is also worth noting that thicker Cu layers (for both the baseplate and DBC) are beneficial to the mechanical ruggedness; in addition, undesired effects, such as partial discharge [20] and dielectric breakdown, are pushed to higher operating voltages with thicker ceramic sheets [6].

3. Methodology

3.1. Methods

To quantify PMcost, RTH, and τ, highly detailed 3D FEM thermal-only simulations were run in COMSOL Multiphysics on exact replicas of the PMs described above. The thermal problem was set by placing the heat source (HS) on the top surface of one of the dies, as this corresponds to the channel region of SiC MOSFETs where most of the power is dissipated. The sensing surface coincided with the HS. The 3D models were built by means of an in-house routine, relying on the livelink between MATLAB (9.14) and COMSOL. It is explained as follows:
(i)
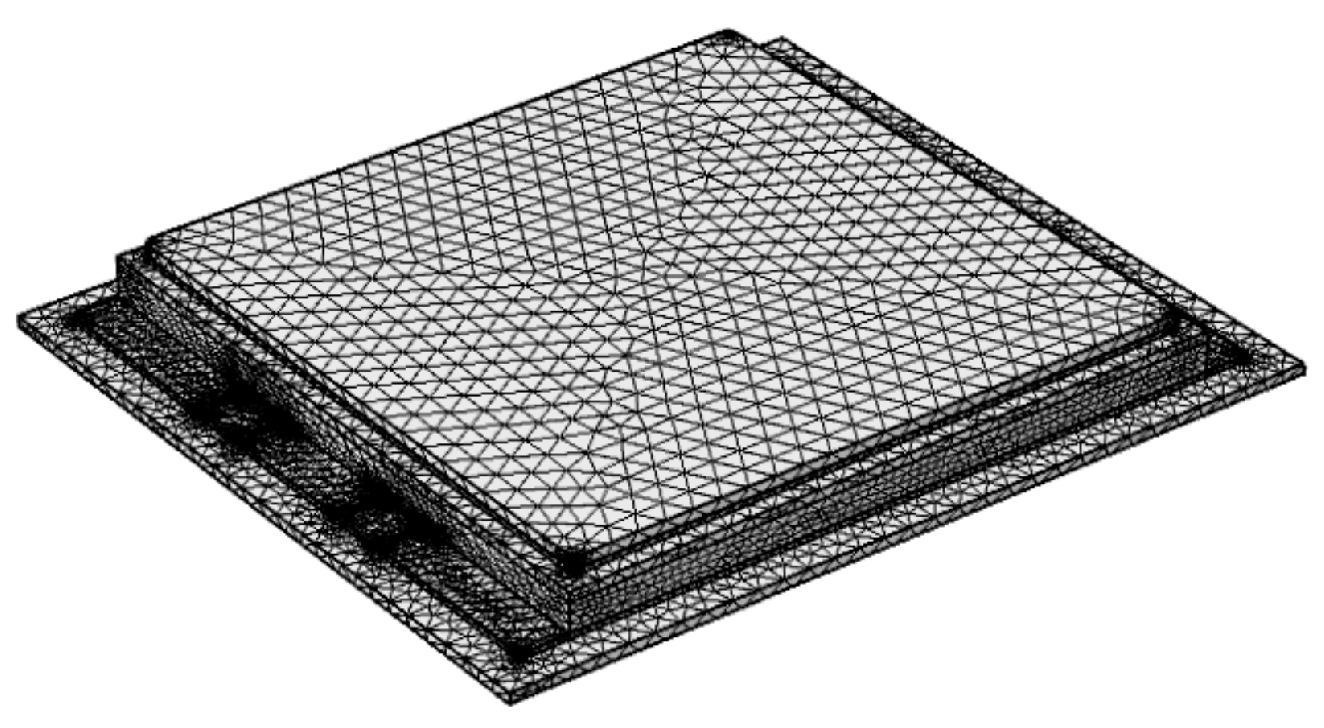
A 2D footprint of each layer composing the assemblies was imported into COMSOL and extruded into the 3rd dimension;
(ii)
Material properties were assigned to each domain, also considering the temperature dependence of thermal conductivities [21,22];
(iii)
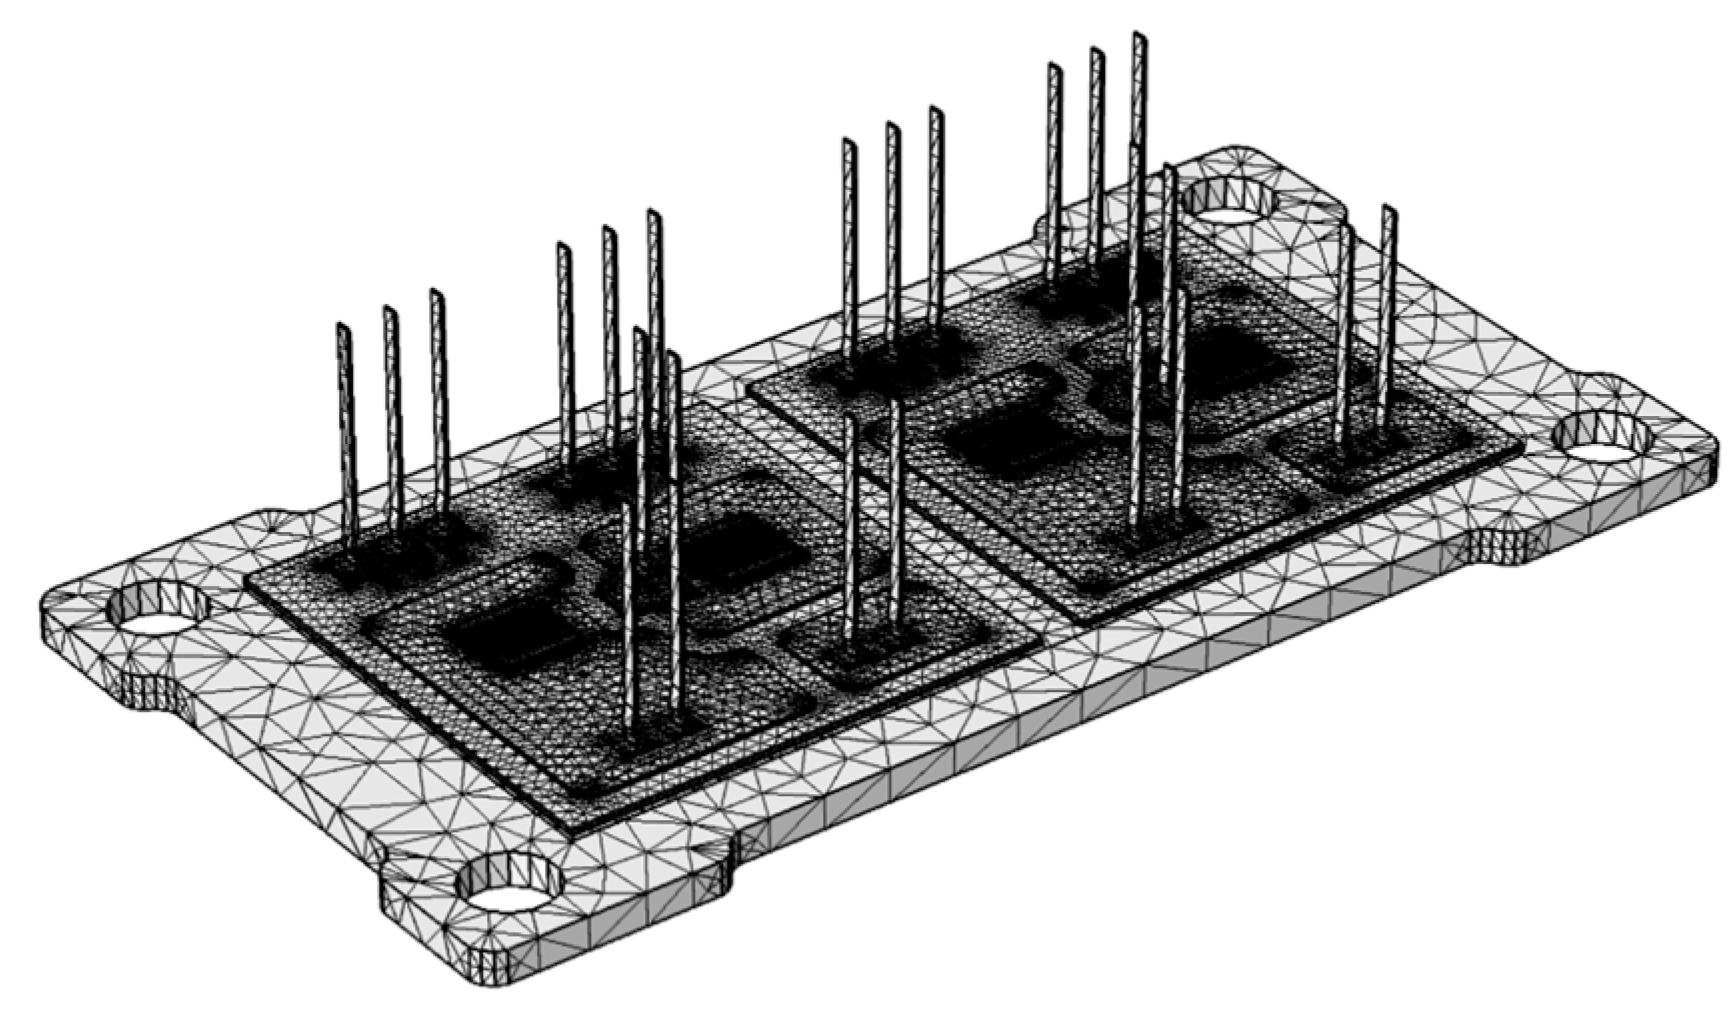
The domains were discretized into a tetrahedral mesh;
(iv)
Boundary conditions (BCs) were assigned to the bottom surface, and to the top and bottom surfaces, in SSC and DSC PMs, respectively;
(v)
A dissipated power step was set on the HS, and the initial temperature of the domains was set to the ambient temperature, Tamb [K];
(vi)
A thermal-only dynamic simulation was conducted.
As far as the BCs are concerned, the cooling surfaces (CSs) were modeled with a heat transfer coefficient h [W/m2K], the value of which was set at 104 and 106 W/m2K to emulate a passive heatsink and a forced liquid system, respectively. Such values were chosen as they fall within a range of practical interest [19], but they were not intended to exactly model the two cooling scenarios, which would require computational fluido-dynamics simulations; nonetheless, they were useful in evaluating relevant figures of merit in the two cases. The remaining external surfaces were set as adiabatic, and Tamb was set to the reference temperature, T0 = 300 K. In the COMSOL Multiphysics environment, the following equation is solved for both the space and time variables:
ρ c p T t + k T = Q
where k, cp, and ρ are the material thermal properties, T is the temperature distribution, and Q is the dissipated power density. Convective BCs were applied to CSs in the numerical environment, that is, the following condition was imposed:
q 0 = h T a m b T
where h, Tamb, and T have their customary meaning, and q0 is the magnitude of the outgoing flux, defined as follows:
q 0 = n q
with n and q being the unit vectors normal to the surface and to the total flux [W/m2], respectively. Finally, adiabatic BCs—applied on all remaining external surfaces—made use of the following condition:
q 0 = 0
More than 200 thermal-only dynamic simulations were automatically carried out to by varying geometrical, technological, and cooling features; more specifically, the thicknesses of the baseplate (tbaseplate, [m]) and DBC layers (tCu, [m], and tAlN, [m]) spanned the ranges of practical interest specified in Section 4. Figure 3 and Figure 4 schematically depict the cross-sections of PMs, highlighting (i) the BCs on the CSs and (ii) the thicknesses involved in the parametric investigation.

3.2. Mesh- and Grid-Independence Analysis

A smart meshing strategy was conceived in order to optimize the trade-off between simulation accuracy and computational efforts. More specifically, finer (coarser) grids were used near to (far from) the active areas, as shown in Figure 5 and Figure 6. The number of tetrahedra was chosen after a mesh-independence analysis conducted on both structures, reported in Figure 7. On average, the number of tetrahedra was ~475 k (~700 k) for the SSC (DSC) structure. Dynamic simulations were run on a PC equipped with an Intel Core i9-10900 CPU and a 16 GB RAM, and the average CPU time for a single simulation turned out to be ~20 min.

3.3. Materials

The thermal conductivity at T = T0, k, heat capacity, cp, density, ρ, and nonlinear coefficients for the materials used in this work are listed in Table 1.
In the numerical environment, the temperature dependence of thermal conductivities was taken into consideration with the following power and linear laws:
k T = k T 0 T T 0 α
k T = k T 0 β T T 0
The total cost of the PM was identified as the cost of the materials needed to assemble the DBC (Cu and ceramic AlN) and the baseplate in the SSC variant (Cu), since they typically represent most of the PMcost [23]. The AlN and Cu prices per unit volume [$/cm3] were identified through a survey on specialized ceramic vendors’ websites [24,25,26,27] and stock market quotations for Cu [28]. It must be noted that, concerning the price of AlN, sheets’ prices increase with their thickness; for this study, an average price of 15 $/cm3 was evaluated and adopted for AlN, whereas a market quotation of 0.09 $/cm3 was assessed for Cu.

4. Results

The results from the parametric analyses are reported in this Section. In order to define appropriate figures of merit to compare RTH and τ in all investigated cases, it is worth stating their definitions. Figure 8 reports a simple representation of the thermal impedance ZTH(t) [K/W], as can be extracted with numerical tools or by experiments according to the following formula:
Z T H t = T ( t ) T a m b P D
where T(t) is the temperature waveform, spatially averaged over the sensing region, and PD is the magnitude of the power step applied to the heat source. The thermal resistance RTH is represented by the steady-state value of ZTH(t). The thermal time constant τ (a parameter that is widely used in academia [16] and industry [29,30]) is defined as the time instant at which ZTH(τ) = (1 − ⅟e)·RTH; τ provides an indication of how quickly the assembly heats up to a significant percentage (~63%) of its steady-state temperature.

4.1. Parametric Analysis for SSC Baseplate

To study the impact of baseplate thickness on the thermal metrics, 18 dynamic thermal simulations were carried out, according to the above methodology, on the SSC replica in the FEM environment. Figure 9 reports the SSC thermal impedances ZTH vs. time, while Figure 10 shows RTH and τ vs. PMcost by varying tbaseplate in the range of 2–4 mm.
The following observations can be made:
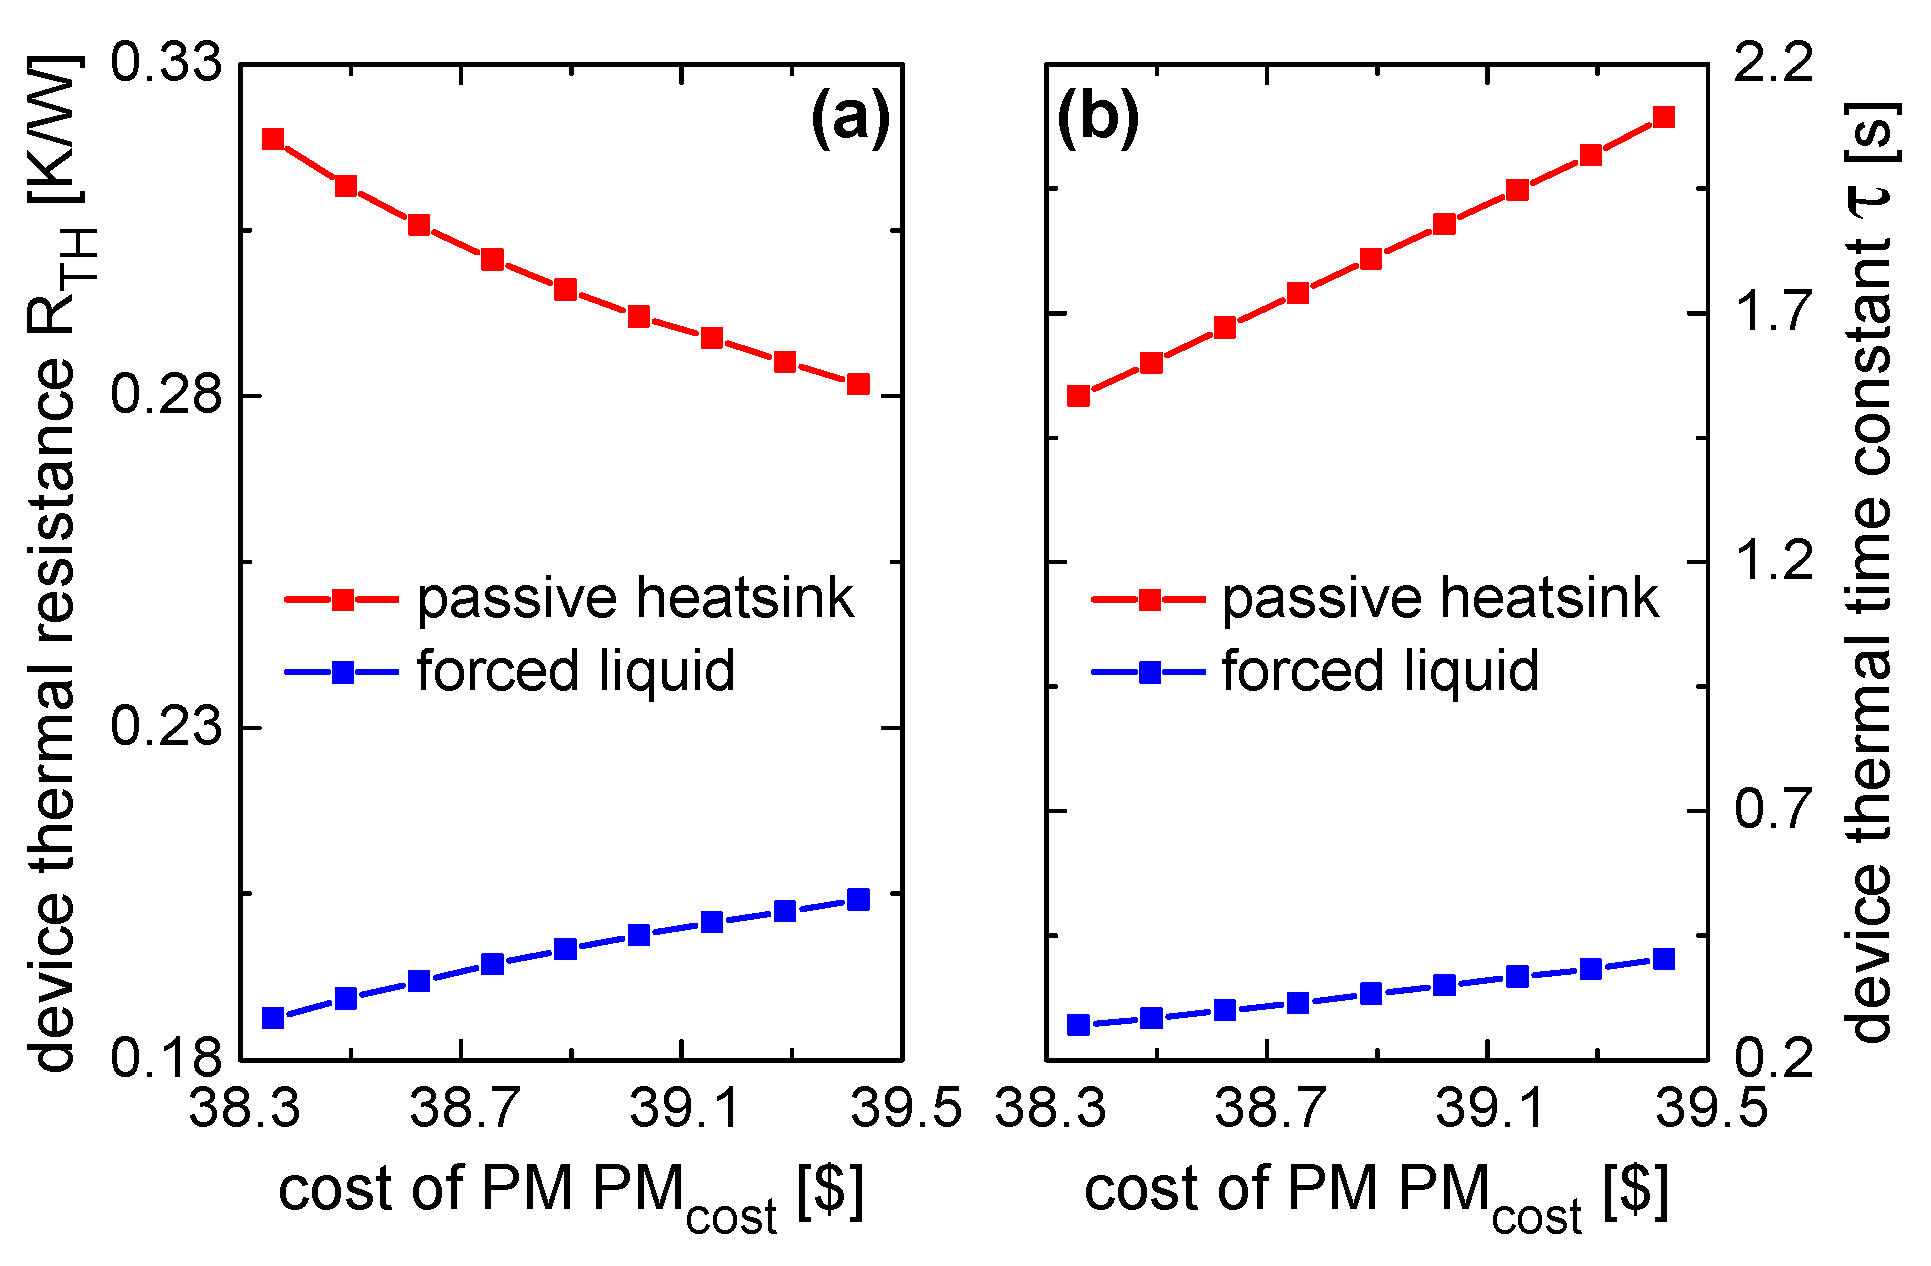
  • In the case of passive heatsink, increasing the baseplate thickness has a beneficial influence on the device’s static thermal behavior. Thicker baseplates promote heat spreading, which takes place to reduce the conductive (by virtue of the larger average cross-section of the heat flux) and the convective (thanks to the wider effective area of heat exchange on the baseplate’s bottom surface) contributions to RTH. As a result, an RTH decrease of ~11.5% was quantified.
  • Conversely, with the more efficient forced liquid cooling, the RTH increases with tbaseplate by approximately 9.6%, leading to opposite behaviors to those seen with passive heatsink cooling. This can be explained as follows: if high-performing cooling systems are employed, the CSs become more and more efficient in terms of heat exchange. This means that the heat is not encouraged to spread as much as in the case of passive heatsinks (the heat spreading becomes less necessary). Therefore, in this case, a thinner baseplate is preferred, as it minimizes the distance between the HS and the CS.
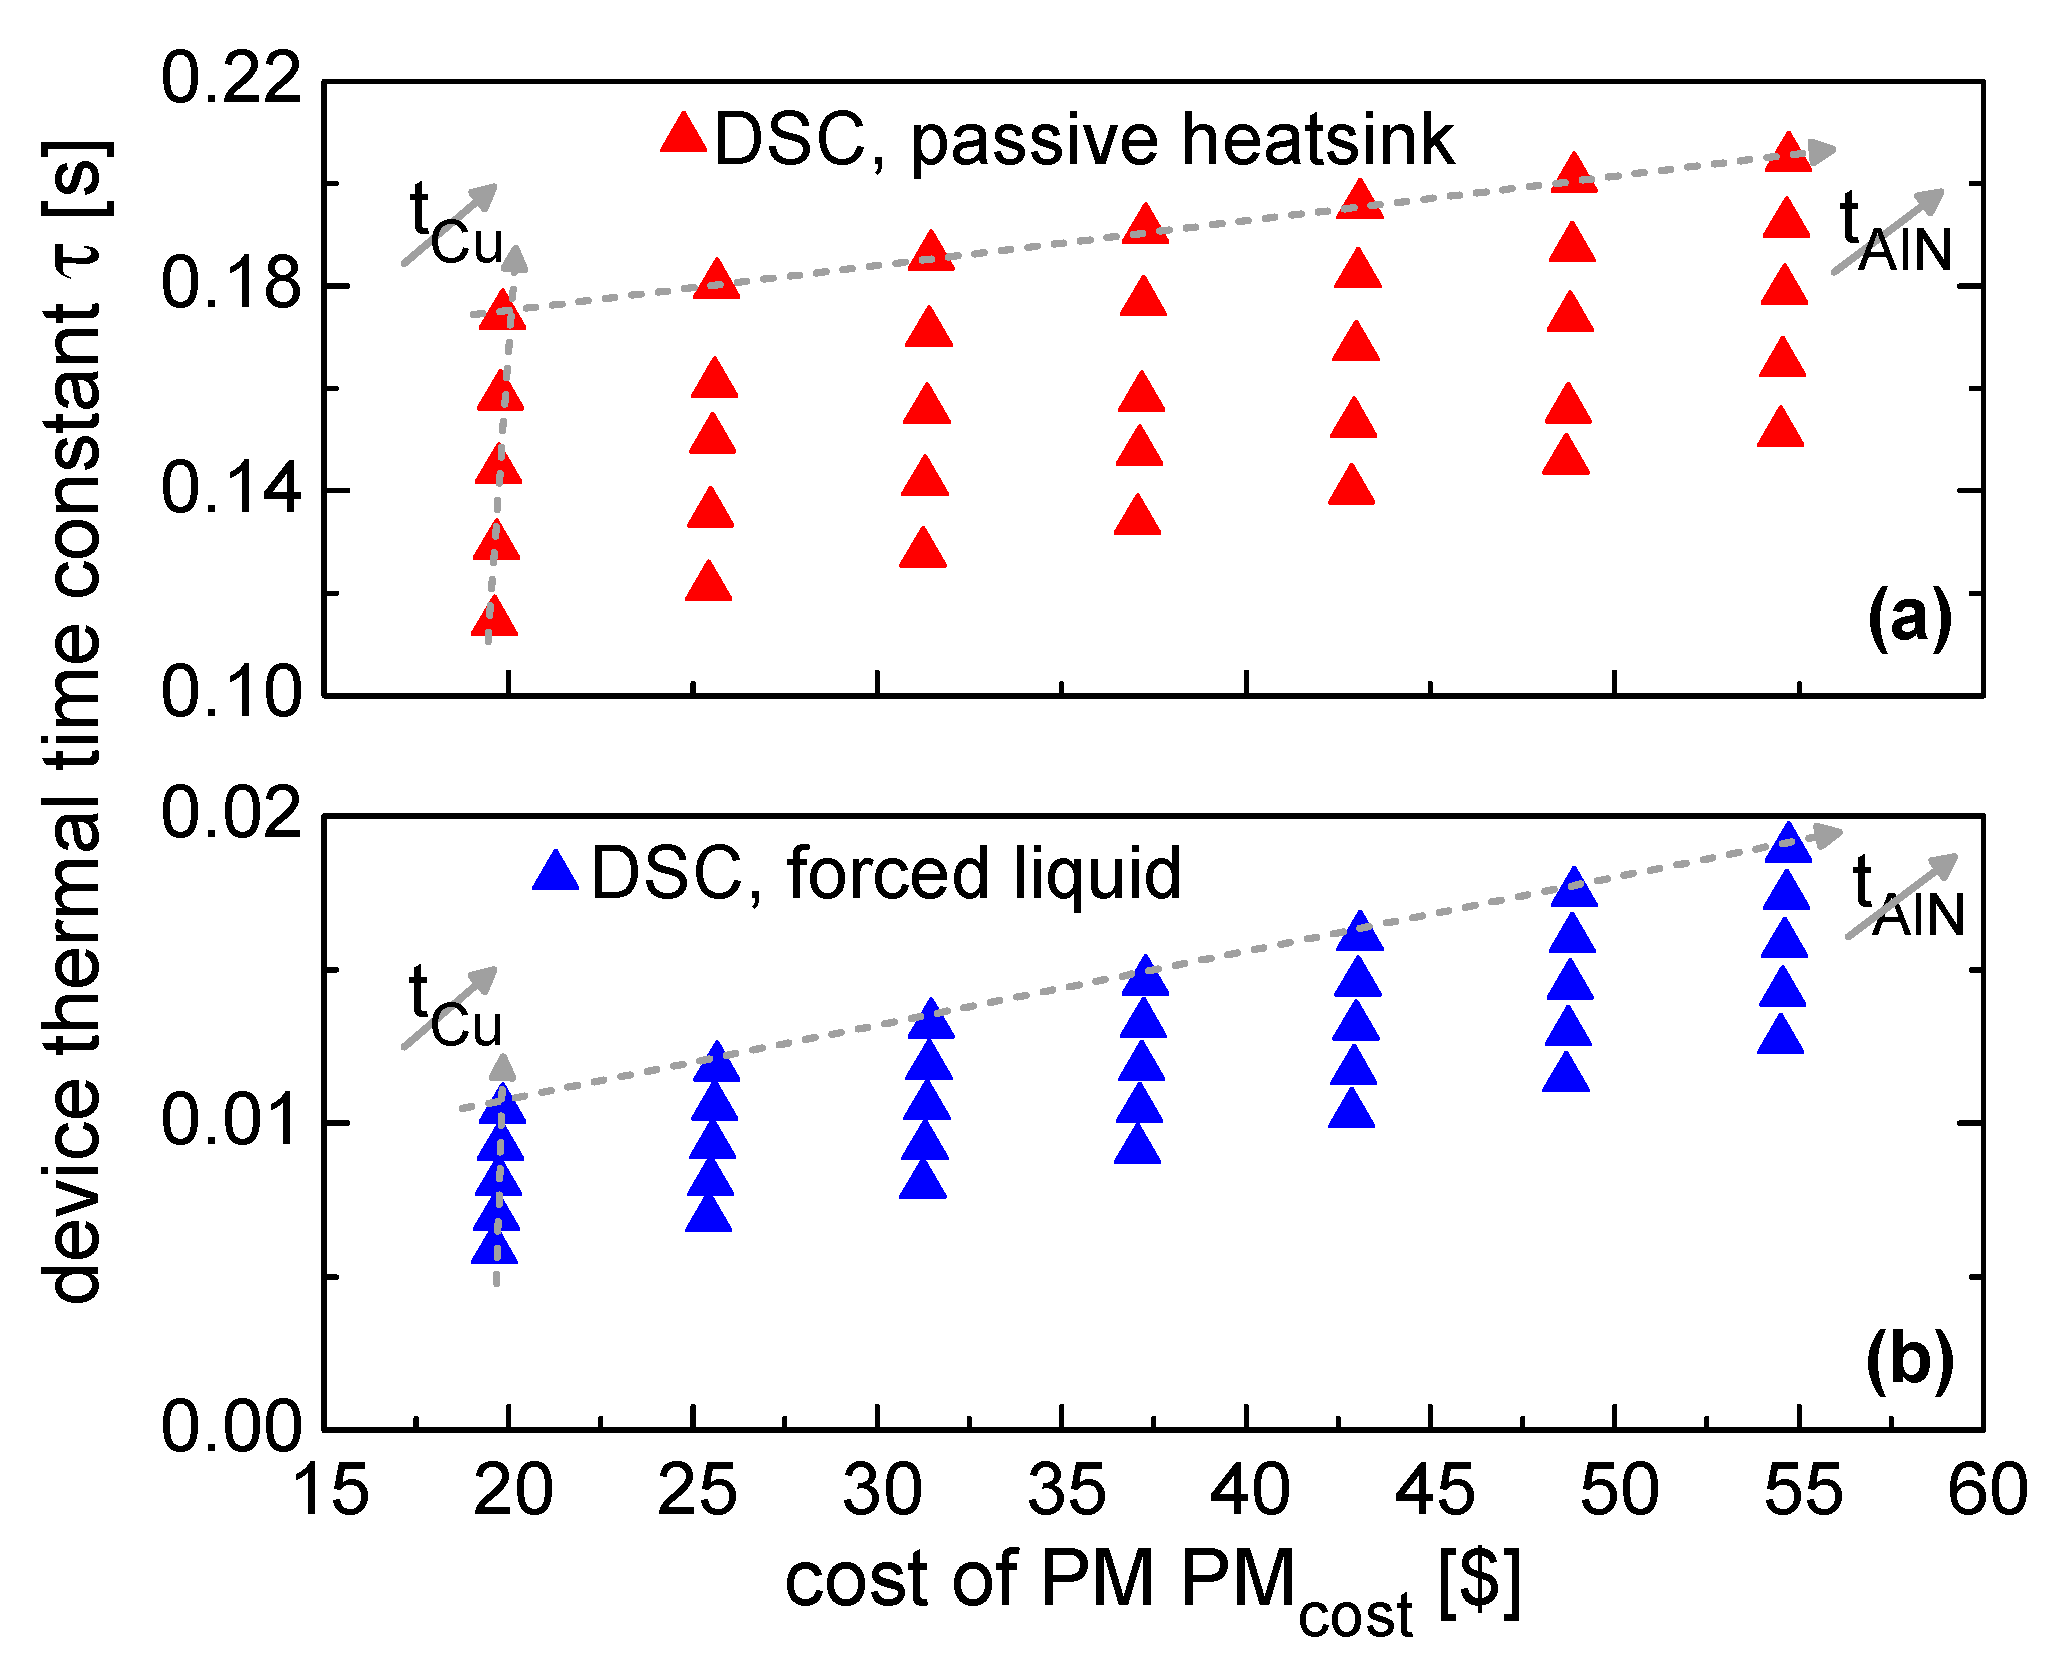
  • Moving from a passive heatsink to liquid cooling has a significant impact on τ values, that is, they decrease by a higher order of magnitude; in addition, the τ vs. PMcost slope is much higher in the passive heatsink case, where heat spreading mechanisms are incentivized by thicker baseplates and, hence, the equivalent thermal capacity associated with the assembly increases.
It is also worth noting that RTH, in both cases, shows saturation at higher tbaseplate values, whereas thermal time constants have a linear behavior in the investigated tbaseplate range, with no saturation.

4.2. Parametric Analysis for DBC Substrate in SSC and DSC PMs

A second set of simulations was devoted to evaluating the influence of DBC substrates on thermal metrics. Figure 11 reports RTH vs. PMcost in SSC PMs with passive heatsink (Figure 11a) and forced liquid cooling (Figure 11b), employing DBC substrates with tCu and tAlN spanning the ranges 0.15–0.55 mm and 0.336–0.936 mm, respectively.
The following observations can be made:
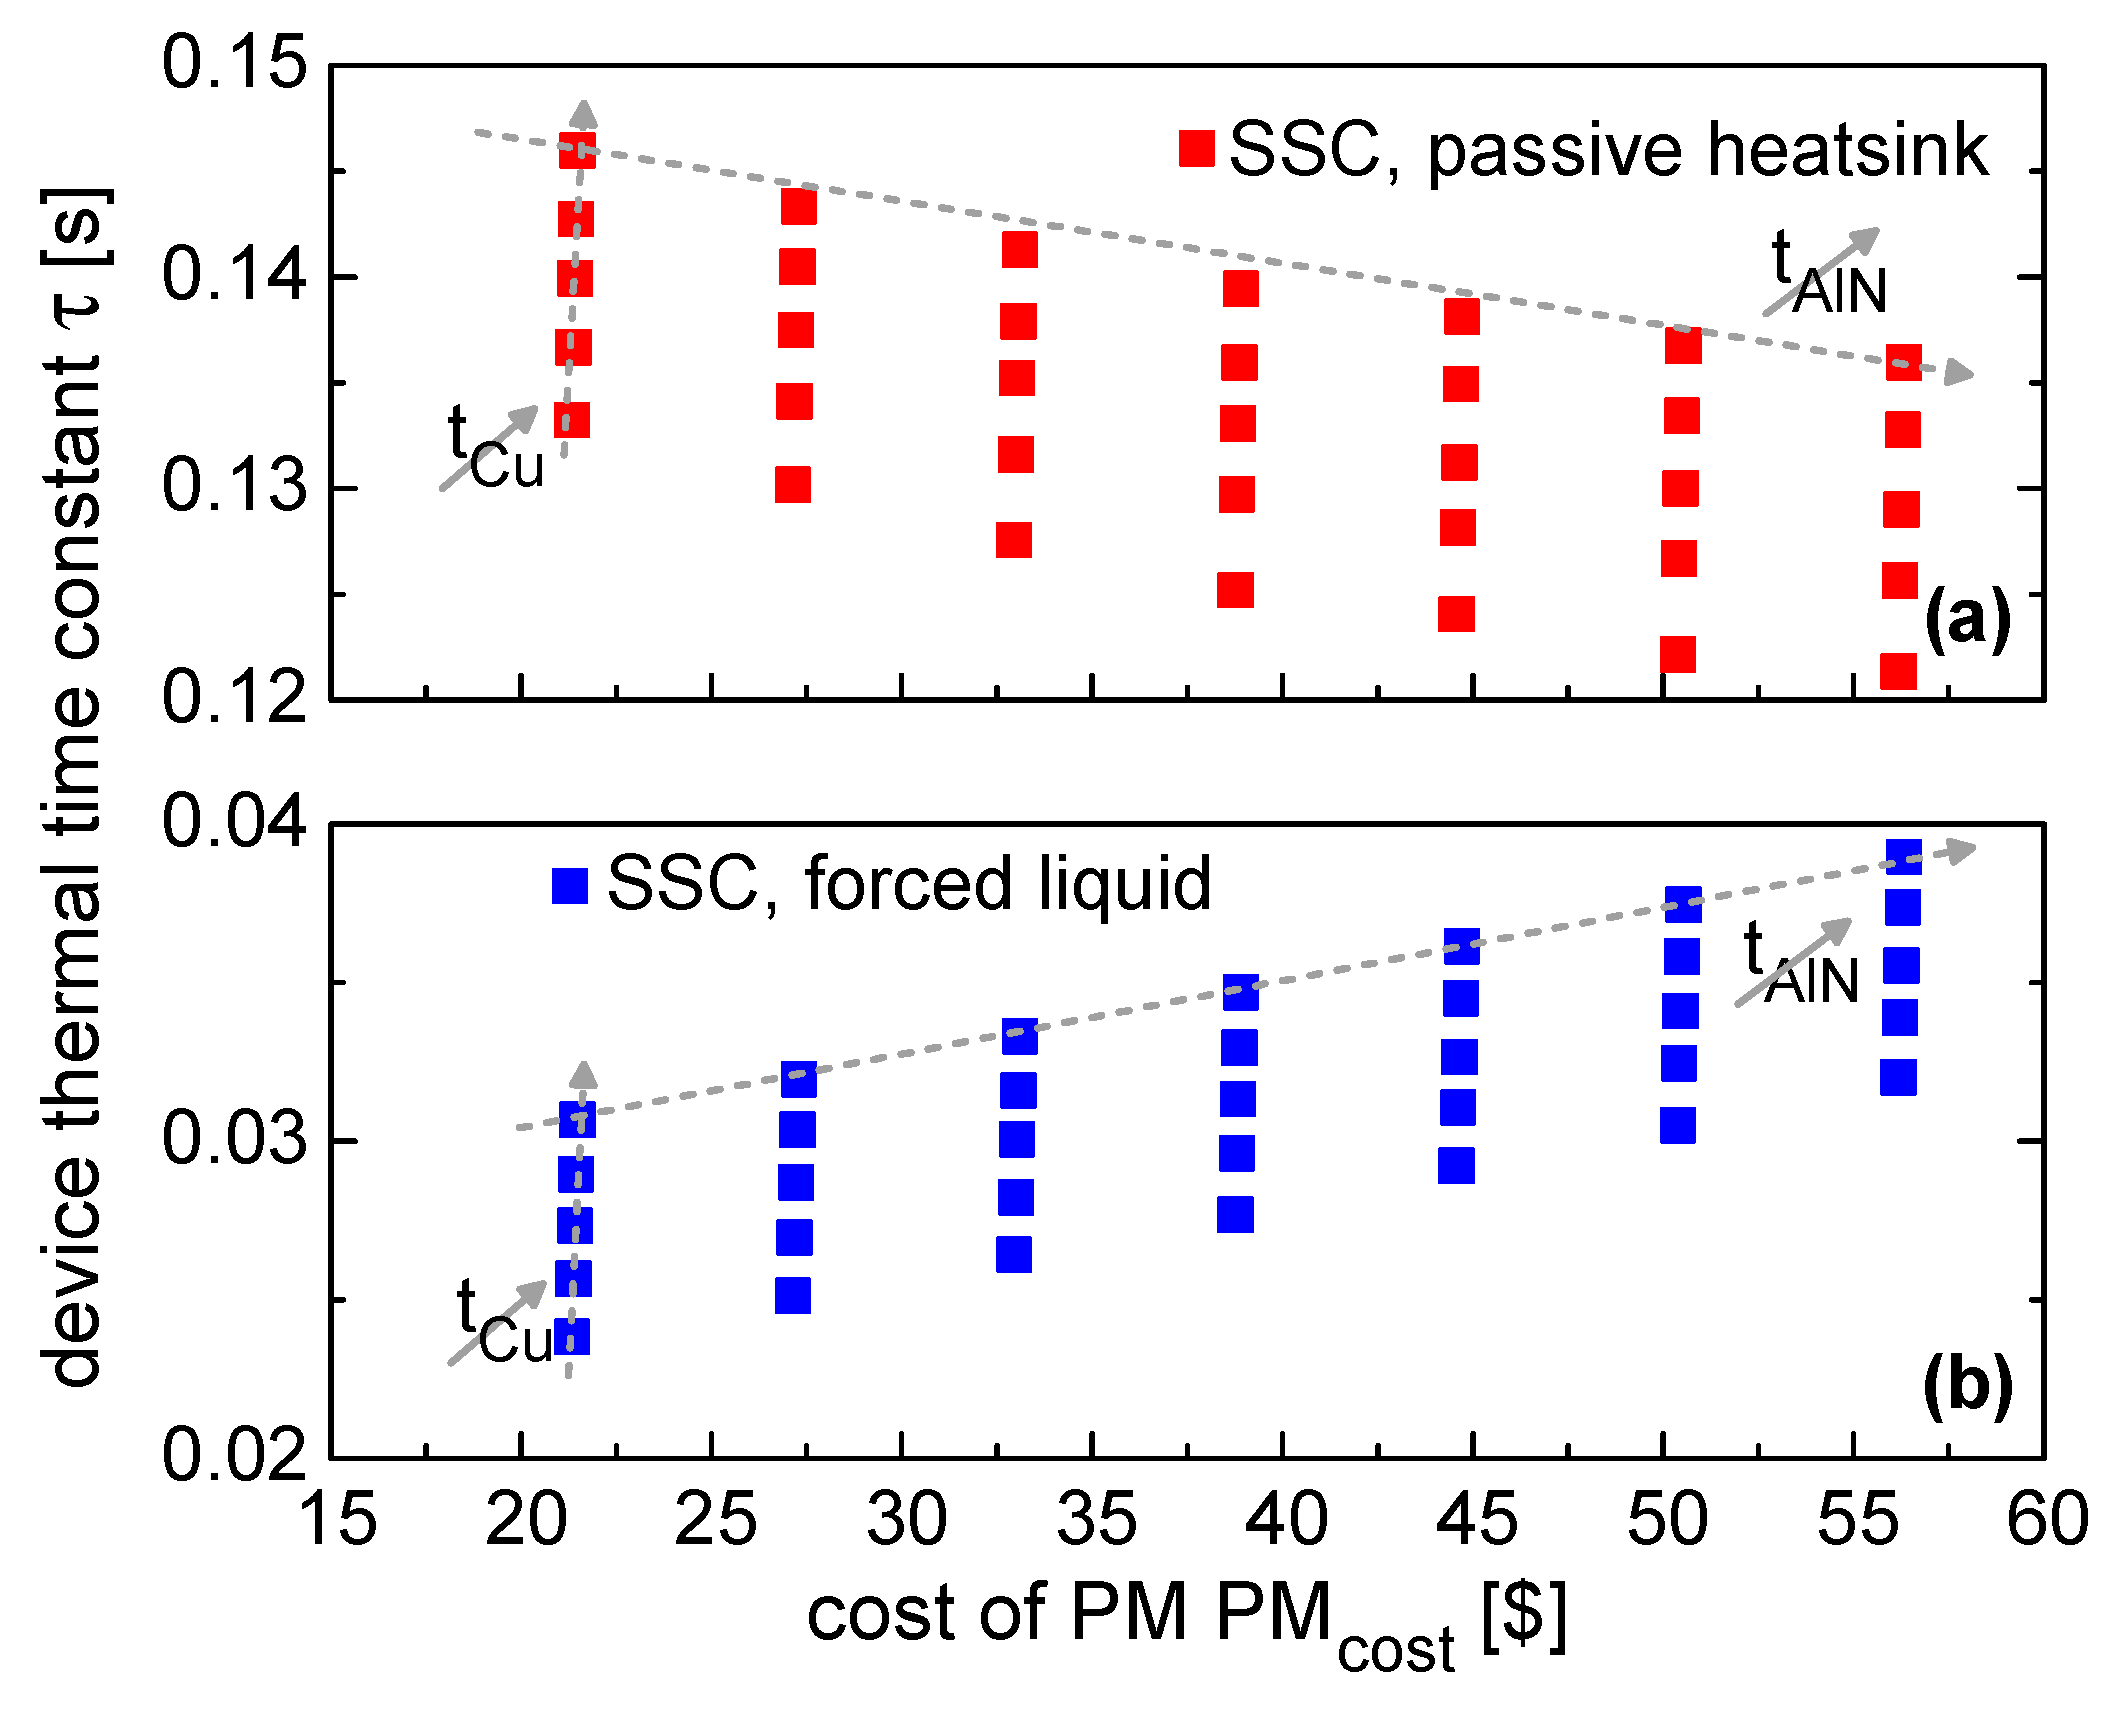
  • PMcost increases with both tCu and tAlN; however, due to the high cost of ceramic, it is always less expensive to employ thicker Cu layers rather than AlN ones.
  • The beneficial effect of using forced liquid cooling was quantified, resulting in an average decrease of ~33% in the RTH of devices embedded in SSC PMs; such a decrease is mainly due to the convective contribution of the junction-to-ambient RTH, which steeply decreases at high h values.
Regardless of the BC, thicker Cu layers are more convenient from a thermal point of view, whereas thicker AlN sheets are detrimental to RTH. This opposite behavior can be explained as follows: as shown in Table 1, both materials can be considered heat conductors, even if Cu has a higher k than AlN. Hence, between the two layers, heat spreading mechanisms are incentivized in the more conductive Cu baseplate, and thicker ceramic sheets only increase the conductive portion of the total RTH [19]. Figure 12 reports τ vs. PMcost in SSC PMs with passive heatsink (Figure 12a) and forced liquid cooling (Figure 12b), with embedded DBC substrates with tCu and tAlN spanning the ranges 0.15–0.55 mm and 0.336–0.936 mm. It can be inferred that τ increases with thicker layers (that is, with more volume invested by the heat flux) in the case of forced liquid cooling, while it decreases if passive heatsinks are employed. The latter counterintuitive phenomenon happens in SSC PMs for the following reason. Poor cooling efficiency, as already pointed out above, encourages heat spreading mechanisms. If thin AlN layers are embedded in the PM, such heat spreading happens in the thick Cu baseplate, where ρ∙cp ≈ 3.5∙106 J/K∙m3; on the other hand, by increasing tAlN, the heat spreading mechanisms migrate to the ceramic layer, where ρ∙cp ≈ 2.5∙106 J/K∙m3. Since τ is proportional to such a product, having thicker AlN sheets affects this parameter (as well as the overall thermal capacity).
With regard to the DSC PM, RTH vs. PMcost is reported in Figure 13. More specifically, the results obtained with passive heatsink and forced liquid cooling are shown in Figure 13a and b, respectively. The same ranges of tCu and tAlN used above were analyzed. The following observations can be made:
  • Differently from SSC PMs, DBC substrates are responsible for the heat spreading action in DSC assemblies, since there is no thick baseplate serving this specific purpose. This is evident when considering the large spread in RTH values obtained in the case of passive heatsink cooling, where heat spreading mechanisms are incentivized. Here, increasing tCu and tAlN has a significant and beneficial impact on the overall RTH.
  • On the contrary, when forced liquid cooling is employed, RTH is dominated by its conductive contribution [31], and thicker layers have a detrimental effect. As a general rule, as long as the BCs are not restricting the outgoing heat flux (that is, at high h values), the conductive contribution given by thermally resistive layers becomes the limiting factor in reducing the overall RTH.
Figure 14 reports τ vs. PMcost, showing all combinations of tCu, tAlN, passive heatsink, and forced liquid cooling conditions. In this case, the dynamic response of the assembly becomes slower as the AlN and Cu layer thicknesses increase. It is also worth noting that the τ values in the SSC and DSC PMs with h = 104 W/m2K are comparable, while the SSC PM has a higher thermal inertia than the DSC counterpart when forced liquid cooling conditions are applied.

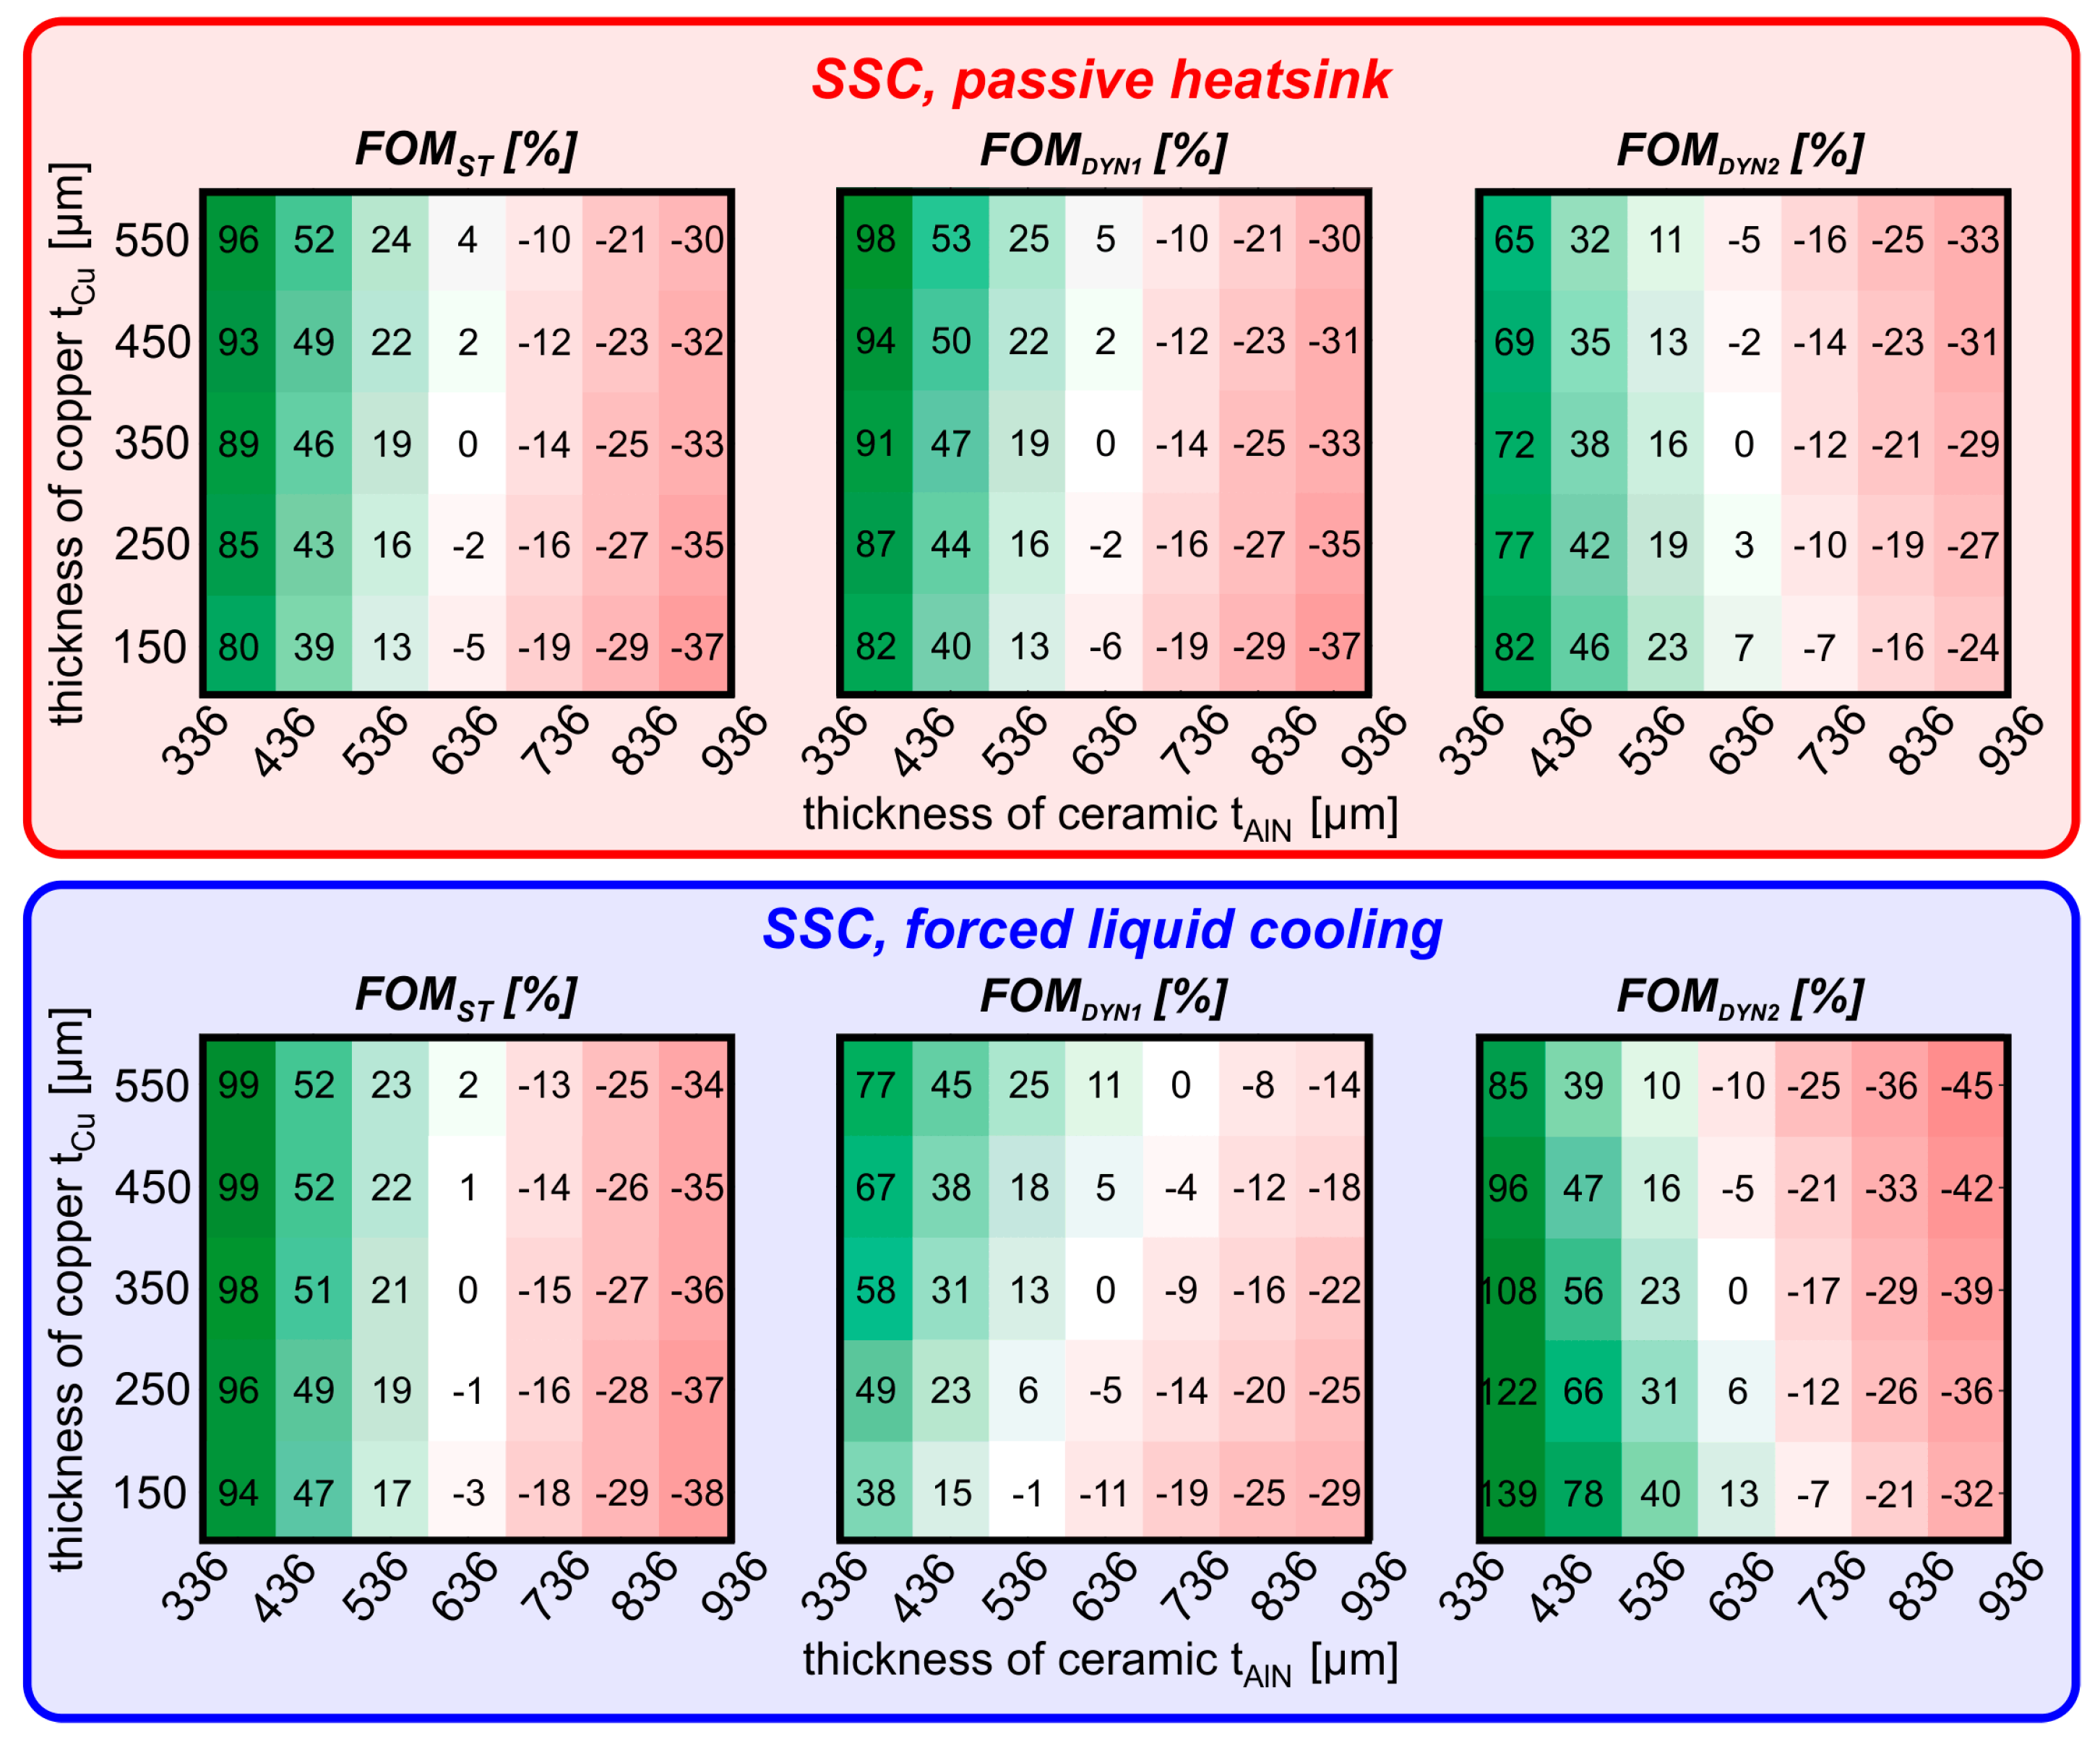
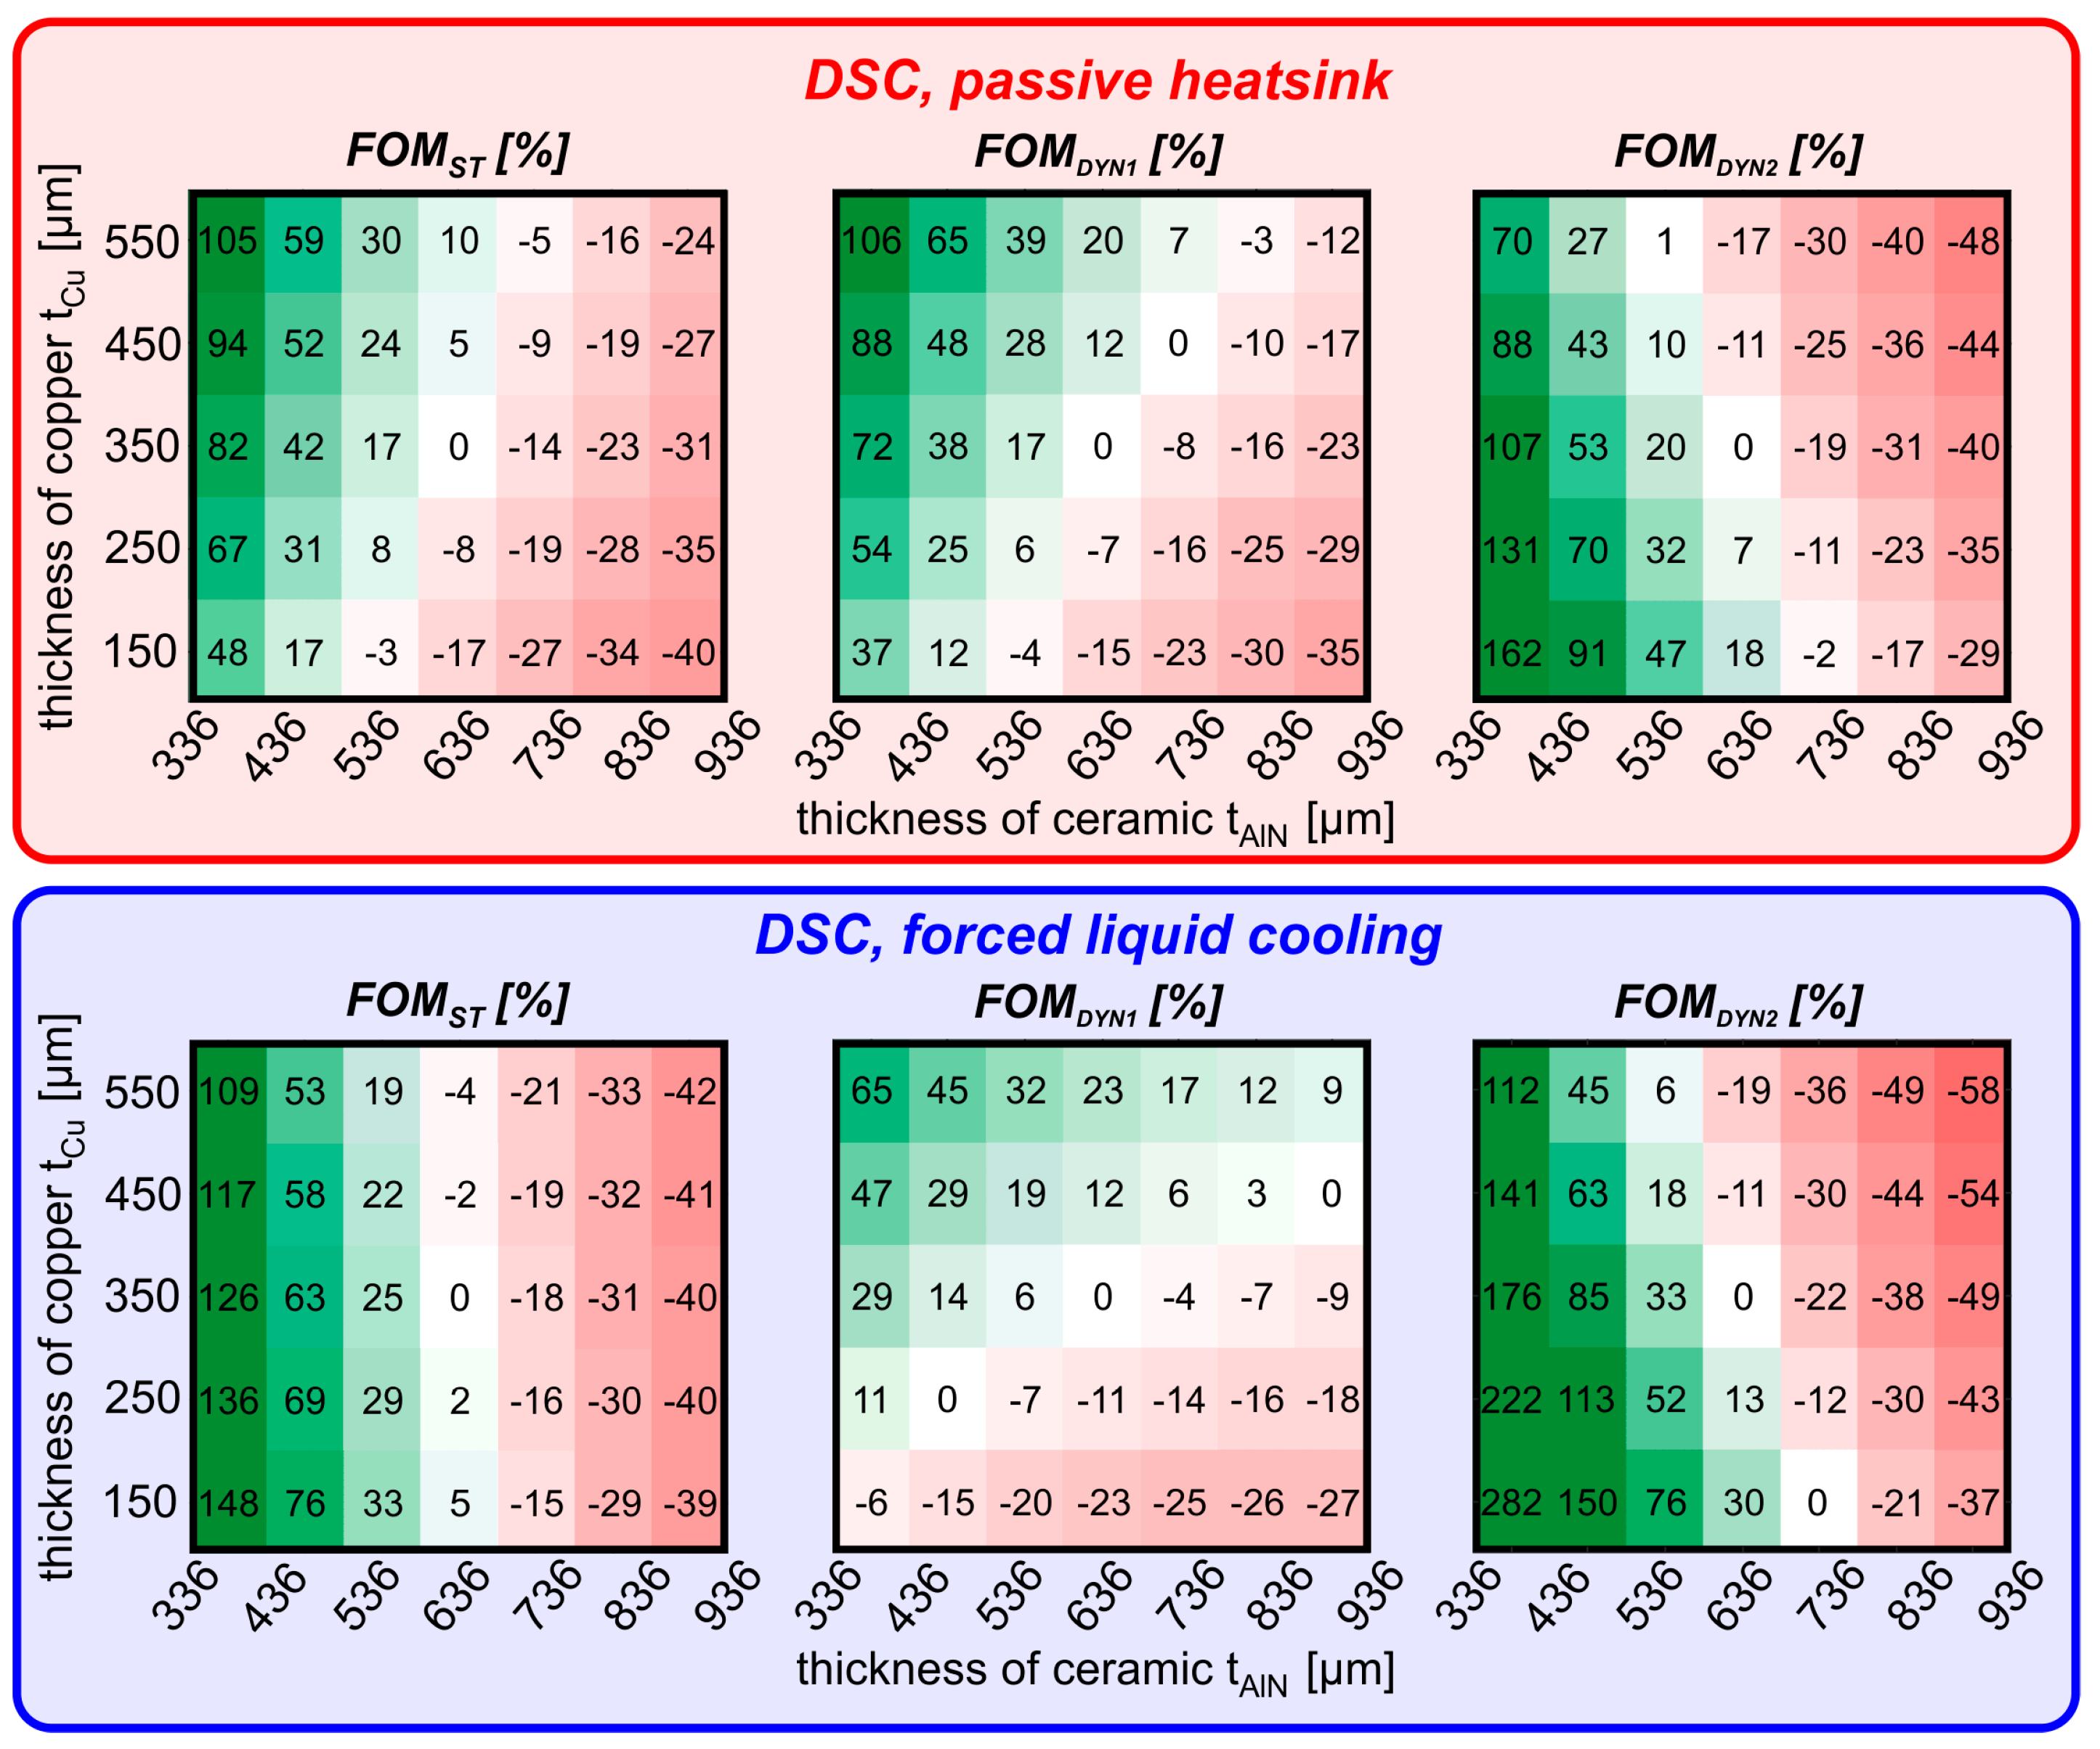
4.3. Static and Dynamic Cost-Impacted Thermal FOMs

In the following subsection, three FOMs are defined and quantified in the tCu, tAlN, and h ranges used in the above investigation:
  • FOMST [W/K$] is defined as
F O M S T = 1 R T H P M cost
where RTH and PMcost are a function of tCu and tAlN. This formula weighs the improvements in RTH against the cost of the assembly: for both parameters, the lower the value, the better.
  • FOMDYN1 [s/$] and FOMDYN2 [1/s$] are defined to assess and quantify the thermal behavior of devices in terms of dynamic performance and cost:
    F O M D Y N 1 = τ P M cost
    F O M D Y N 2 = 1 τ P M cost
    where τ and PMcost are a function of tCu and tAlN. The choice between FOMDYN1 and FOMDYN2 largely depends on the designer’s goal and on the application environment of the specific assembly. FOMDYN1 promotes high τ values, which is the ideal choice if designers are aiming to improve device ruggedness against failure events such as short-circuit, clamped, and unclamped inductive switching events [32,33]. Under these circumstances, devices undertake a large amount of dissipated power, and they fail due to their temperature rapidly rising: the higher the τ value, the slower the rate at which the device approaches its failure. On the other hand, designers should rely on FOMDYN2 if the reliability of the application is not their main concern. Since the design of power circuits is typically aimed at optimizing the electrothermal periodic steady state (or limit cycle), reaching this regime sooner is preferable, meaning that lower τ values are favored.
A reference tCu and tAlN combination was set (tCu = 0.35 mm, tAlN = 0.636 mm), and the percentage variations of FOMST, FOMDYN1, and FOMDYN2—with respect to the reference case—were evaluated, and are shown in Figure 15 and Figure 16. The following can be noted:
  • It is always convenient to design PMs in the low-tAlN corner, since AlN is the most expensive material, and it negatively (and significantly) impacts on all three FOMsT; indeed, the worst design choice is represented by PMs with thick AlN sheets, regardless of tCu. It must be noted that the ceramic thickness must ensure compliance with electrical ruggedness specifications, where a thicker ceramic layer is generally preferable [34]. Therefore, designers should choose the minimum thickness within the range that meets this requirement.
  • Focusing on the FOMST, designs with tAlN = 0.336 mm can still be improved with appropriate tCu choices. More specifically, the low Cu cost makes thicker Cu sheets almost always convenient, except for in the case of forced liquid cooled DSC PMs. In this latter case, there is no need for heat spreading, and the thinner the assembly, the better.
  • Regarding dynamic FOMs, it is confirmed that designs with the lowest tAlN value perform better. However, two different corners are preferred, depending on the FOM: a design based on FOMDYN1 (FOMDYN2) should make use of thicker (thinner) Cu layers, that is, the PM should belong to the upper-left (bottom-left) corner of the colormaps shown in Figure 15 and Figure 16.

5. Conclusions

In this work, state-of-the-art power modules have been studied using 3D thermal FEM simulations in COMSOL Multiphysics. Specifically, the trade-off between key static and dynamic thermal metrics—such as the thermal resistance and thermal time constant—of devices within these assemblies has been thoroughly investigated, along with the overall power module cost. The evaluation of the cost was focused on the most expensive layers of the assembly, namely, the copper and ceramic sheets adopted in the baseplate and DBC substrates. Numerical simulations have been performed by varying the thicknesses of their layers in a practical range, quantifying their impact on thermal resistance (RTH), the thermal time constant (τ), and module cost (PMcost) under two distinct cooling conditions: passive heatsink and forced liquid. To assist designers in quantifying the impact of their design choices on thermal performance, three figures of merit (FOMs) were developed and evaluated across different design variants. These figures of merit integrate both static and dynamic thermal performance with cost considerations; they provide practical, intuitive guidelines for optimizing thermal management in power modules.
The results clearly demonstrate that increasing the thickness of the copper layer consistently improves thermal performance, with a lower cost compared to thicker ceramic sheets. Furthermore, the effects of varying copper and ceramic thicknesses are more pronounced under less efficient cooling conditions, highlighting the critical role of material selection in thermal management. These findings have been supported by a physical explanation based on heat-spreading mechanisms. Overall, the use of FOMs has been proven to be an invaluable tool for power module designers, offering clear and actionable insights that facilitate the development of more efficient and cost-effective thermal designs. This work provides a solid foundation for further optimization in power module design, ensuring both high performance and cost-efficiency in the PM technologies under investigation.

Author Contributions

Conceptualization, C.S. and A.P.C.; Methodology, C.S. and A.P.C.; Software, C.S. and A.P.C.; Validation, C.S. and A.P.C.; Formal analysis, C.S. and A.P.C.; Investigation, C.S. and A.P.C.; Resources, C.S. and A.P.C.; Data curation, C.S. and A.P.C.; Writing—original draft, C.S. and A.P.C.; Writing—review & editing, C.S., A.P.C. and V.d.; Visualization, C.S., A.P.C., L.C., A.C. and V.d.; Supervision, L.C., A.C. and V.d.; Project administration, V.d.; Funding acquisition, V.d. All authors have read and agreed to the published version of the manuscript.

Funding

This research received no external funding.

Data Availability Statement

Dataset available on request from the authors. The raw data supporting the conclusions of this article will be made available by the authors on request.

Acknowledgments

This study was carried out within the NEST—Network 4 Energy Sustainable Transition (D.D. 1243 02/08/2022, PE00000021), and received funding under the National Recovery and Resilience Plan (NRRP), Mission 4 Component 2 Investment 1.3, funded by the European Union—NextGenerationEU.

Conflicts of Interest

The authors declare no conflict of interest.

References

  1. Chen, Z.; Huang, A.Q. High Performance SiC Power Module Based on Repackaging of Discrete SiC Devices. IEEE Trans. Power Electron. 2023, 38, 9306–9310. [Google Scholar] [CrossRef]
  2. Lee, H.; Smet, V.; Tummala, R. A Review of SiC Power Module Packaging Technologies: Challenges, Advances, and Emerging Issues. IEEE J. Emerg. Sel. Top. Power Electron. 2020, 8, 239–255. [Google Scholar] [CrossRef]
  3. Yang, Y.; Dorn-Gomba, L.; Rodriguez, R.; Mak, C.; Emadi, A. Automotive Power Module Packaging: Current Status and Future Trends. IEEE Access 2020, 8, 160126–160144. [Google Scholar] [CrossRef]
  4. Popok, V.N.; Pedersen, K.B.; Kristensen, P.K.; Pedersen, K. Comprehensive Physical Analysis of Bond Wire Interfaces in Power Modules. Microelectron. Reliab. 2016, 58, 58–64. [Google Scholar] [CrossRef]
  5. Tsai, C.-C.; Liao, L.-L.; Su, Y.-F.; Hung, T.-Y.; Chiang, K.-N. Reliability Analysis of Copper Bump Interconnection in Double-Sided Power Module. In Proceedings of the 2015 16th International Conference on Thermal, Mechanical and Multi-Physics Simulation and Experiments in Microelectronics and Microsystems, Budapest, Hungary, 19–22 April 2015; pp. 1–4. [Google Scholar]
  6. Scognamillo, C.; Catalano, A.P.; Castellazzi, A.; d’Alessandro, V. Numerical Analysis of the Thermal Impact of Ceramic Materials in Double-Sided Cooled Power Modules. In Proceedings of the 2020 26th International Workshop on Thermal Investigations of ICs and Systems (THERMINIC), Berlin, Germany, 14 September–9 October 2020; pp. 1–5. [Google Scholar]
  7. COMSOL AB. COMSOL Multiphysics User’s Guide, Release 5.3A; COMSOL AB: Stockholm, Sweden, 2018. [Google Scholar]
  8. Li, X.; Li, D.; Qi, F.; Packwood, M.; Luo, H.; Wang, Y.; Dai, X.; Luo, H.; Liu, G. EM-Electrothermal Analysis of Semiconductor Power Modules. IEEE Trans. Compon. Packag. Manuf. Technol. 2019, 9, 1495–1503. [Google Scholar] [CrossRef]
  9. Yun, C.-S.; Malberti, P.; Ciappa, M.; Fichtner, W. Thermal Component Model for Electrothermal Analysis of IGBT Module Systems. IEEE Trans. Adv. Packag. 2001, 24, 401–406. [Google Scholar] [CrossRef]
  10. Ning, P.; Liang, Z.; Wang, F. Power Module and Cooling System Thermal Performance Evaluation for HEV Application. IEEE J. Emerg. Sel. Top. Power Electron. 2014, 2, 487–495. [Google Scholar] [CrossRef]
  11. Calabretta, M.; Sitta, A.; Oliveri, S.M.; Sequenzia, G. Silicon Carbide Multi-Chip Power Module for Traction Inverter Applications: Thermal Characterization and Modeling. IEEE Access 2021, 9, 76307–76314. [Google Scholar] [CrossRef]
  12. Wang, L.; Malcolm, D.; Liu, W.; Liu, Y.-F. Thermal Analysis of a Magnetic Packaged Power Module. In Proceedings of the 2016 IEEE Applied Power Electronics Conference and Exposition (APEC), Long Beach, CA, USA, 20–24 March 2016; pp. 2095–2101. [Google Scholar]
  13. Tang, G.; Wai, L.C.; Boon Lim, S.; Lau, B.L.; Kazunori, Y.; Zhang, X.W. Thermal Analysis, Characterization and and Material Selection for SiC Device Based Intelligent Power Module (IPM). In Proceedings of the 2020 IEEE 70th Electronic Components and Technology Conference (ECTC), Orlando, FL, USA, 3–30 June 2020; pp. 2078–2085. [Google Scholar]
  14. Khatir, Z.; Lefebvre, S. Thermal Analysis of High Power IGBT Modules. In Proceedings of the 12th International Symposium on Power Semiconductor Devices & ICs. Proceedings (Cat. No.00CH37094), Toulouse, France, 22–25 May 2000; pp. 271–274. [Google Scholar]
  15. Shahjalal, M.; Shams, T.; Hossain, S.B.; Rishad Ahmed, M.; Ahsan, M.; Haider, J.; Goswami, R.; Alam, S.B.; Iqbal, A. Thermal Analysis of Si-IGBT Based Power Electronic Modules in 50kW Traction Inverter Application. e-Prime Adv. Electr. Eng. Electron. Energy 2023, 3, 100112. [Google Scholar] [CrossRef]
  16. Ozalas, M.T. The Impact of Electro-Thermal Coupling on HBT Power Amplifiers. In Proceedings of the 2014 IEEE Compound Semiconductor Integrated Circuit Symposium (CSICS), La Jolla, CA, USA, 19–22 October 2014; pp. 1–4. [Google Scholar]
  17. Scognamillo, C.; Catalano, A.P.; Codecasa, L.; Castellazzi, A.; d’Alessandro, V. Numerical Investigation on the Thermal Resistance and Assembly Cost in SSC and DSC Power Modules. In Proceedings of the 2024 30th International Workshop on Thermal Investigations of ICs and Systems (THERMINIC), Toulouse, France, 25–27 September 2024; pp. 1–4. [Google Scholar]
  18. Shammas, N.Y.A. Present Problems of Power Module Packaging Technology. Microelectron. Reliab. 2003, 43, 519–527. [Google Scholar] [CrossRef]
  19. Catalano, A.P.; Scognamillo, C.; d’Alessandro, V.; Castellazzi, A. Numerical Simulation and Analytical Modeling of the Thermal Behavior of Single- and Double-Sided Cooled Power Modules. IEEE Trans. Compon. Packag. Manuf. Technol. 2020, 10, 1446–1453. [Google Scholar] [CrossRef]
  20. Lebey, T.; Malec, D.; Dinculescu, S.; Costan, V.; Breit, F.; Dutarde, E. Partial Discharges Phenomenon in High Voltage Power Modules. IEEE Trans. Dielectr. Electr. Insul. 2006, 13, 810–819. [Google Scholar] [CrossRef]
  21. Palankovski, V.; Quay, R. Analysis and Simulation of Heterostructure Devices; Computational Microelectronics; Springer: Vienna, Austria, 2004; ISBN 978-3-7091-7193-6. [Google Scholar]
  22. Lienhard, J.H., IV; Lienhard, J.H., V. A Heat Transfer Textbook, 3rd ed.; Phlogiston Press: Cambridge, MA, USA, 2008. [Google Scholar]
  23. Yole Intelligence. Status of the Power Module Packaging Industry 2023 Report; Yole Intelligence: Lyon, France, 2023. [Google Scholar]
  24. Good-Fellow AlN Manufacturer Website. Available online: https://www.goodfellow.com/eu/aluminium-nitride-sheet-group (accessed on 1 February 2025).
  25. Sigma-Aldritch AlN Manufacturer Website. Available online: https://www.sigmaaldrich.com/US/en/product/aldrich/gf43729803 (accessed on 1 February 2025).
  26. Ortech-Ceramics AlN Manufacturer Website. Available online: https://www.ortechceramics.com/products/uncategorized/aluminum-nitride-substrate/ (accessed on 1 February 2025).
  27. McMaster AlN Manufacturer Website. Available online: https://www.mcmaster.com/products/aluminum-nitride (accessed on 1 February 2025).
  28. Stock Quotation of Cu. Available online: https://www.marketindex.com.au/copper (accessed on 1 February 2025).
  29. Ketchen, M.B.; Xiu, K.; Bhushan, M. Measurement of Thermal Time Constant in 65-Nm PD-SOI Technology with Sub-Ns Resolution. In Proceedings of the 2007 IEEE International SOI Conference, Indian Wells, CA, USA, 1–4 October 2007; pp. 53–54. [Google Scholar]
  30. Mukhopadhyay, S.; Kundu, A.; Lee, Y.W.; Hsieh, H.D.; Huang, D.S.; Horng, J.J.; Chen, T.H.; Lee, J.H.; Tsai, Y.S.; Lin, C.K.; et al. An Unique Methodology to Estimate The Thermal Time Constant and Dynamic Self Heating Impact for Accurate Reliability Evaluation in Advanced FinFET Technologies. In Proceedings of the 2018 IEEE International Electron Devices Meeting (IEDM), San Francisco, CA, USA, 1–5 December 2018; pp. 17.4.1–17.4.4. [Google Scholar]
  31. Catalano, A.P.; Scognamillo, C.; Castellazzi, A.; Codecasa, L.; d’Alessandro, V. Study of the Thermal Behavior of Double-Sided Cooled Power Modules. In Proceedings of the 2021 27th International Workshop on Thermal Investigations of ICs and Systems (THERMINIC), Berlin, Germany, 23 September 2021; pp. 1–5. [Google Scholar]
  32. Yao, K.; Yano, H.; Tadano, H.; Iwamuro, N. Investigations of SiC MOSFET Short-Circuit Failure Mechanisms Using Electrical, Thermal, and Mechanical Stress Analyses. IEEE Trans. Electron Devices 2020, 67, 4328–4334. [Google Scholar] [CrossRef]
  33. Ren, N.; Wang, K.L.; Wu, J.; Xu, H.; Sheng, K. Failure Mechanism Analysis of SiC MOSFETs in Unclamped Inductive Switching Conditions. In Proceedings of the 2019 31st International Symposium on Power Semiconductor Devices and ICs (ISPSD), Shanghai, China, 19–23 May 2019; pp. 183–186. [Google Scholar]
  34. Scognamillo, C.; Catalano, A.P.; Lasserre, P.; Duchesne, C.; d’Alessandro, V.; Castellazzi, A. Combined Experimental-FEM Investigation of Electrical Ruggedness in Double-Sided Cooled Power Modules. Microelectron. Reliab. 2020, 114, 113742. [Google Scholar] [CrossRef]
Figure 1. Three-dimensional representation of SSC PM built in COMSOL Multiphysics (draw mode); Cu (dark orange) and AlN (blue) layers are highlighted. Electronic devices (SiC MOSFETs) are drawn in green, while aluminum source/gate PADs and vertical connectors are represented in dark gray.
Energies 18 01665 g001
Figure 2. Three-dimensional representation of DSC PM built in COMSOL Multiphysics (draw mode). To left of dashed black line, top substrate is hidden from view. Cu (dark orange) and AlN (blue) layers are highlighted. Electronic devices (SiC MOSFETs) are drawn in green. Picture is not to scale with one in Figure 1, as SSC PMs are typically bigger than DSCs.
Energies 18 01665 g002
Figure 3. Schematic cross-section of SSC PM under investigation: heat source and cooling surfaces are highlighted by red and blue lines, respectively; thicknesses of baseplate and DBC layers are also evidenced.
Energies 18 01665 g003
Figure 4. Schematic cross-section of DSC PM under investigation: heat source and cooling surfaces are highlighted by red and blue lines, respectively; thicknesses of baseplate and DBC layers are also evidenced.
Energies 18 01665 g004
Figure 5. Three-dimensional representation of tetrahedral grid in SSC PM built in COMSOL Multiphysics (mesh mode).
Energies 18 01665 g005
Figure 6. Three-dimensional representation of tetrahedral grid in DSC PM built in COMSOL Multiphysics (mesh mode).
Energies 18 01665 g006
Figure 7. Grid independence analysis conducted on SSC and DSC PMs; average values of tCu, tAlN, and tbaseplate were considered. Dashed lines highlight number of tetrahedra chosen for investigation.
Energies 18 01665 g007
Figure 8. Schematic depiction of thermal impedance ZTH(t) vs. time waveform, with thermal time constant τ, ZTH(t = τ), and steady-state RTH = ZTH(t→∞) values highlighted.
Energies 18 01665 g008
Figure 9. Results of parametric analysis conducted on SSC PM in COMSOL Multiphysics by varying tbaseplate in range of 2–4 mm: thermal impedance ZTH vs. time with h = 104 W/m2 (red lines) and h = 106 W/m2 (blue lines), representing passive heatsink and forced liquid cooling, respectively.
Energies 18 01665 g009
Figure 10. Results of parametric analysis conducted on SSC PM in COMSOL Multiphysics by varying tbaseplate in range of 2–4 mm: (a) thermal resistance RTH and (b) thermal time constant τ vs. PMcost with h = 104 W/m2 (red squares) and h = 106 W/m2 (blue squares).
Energies 18 01665 g010
Figure 11. Simulation results of parametric analysis involving tCu and tAlN spanning ranges 0.15–0.55 mm and 0.336–0.936 mm, respectively: device thermal resistance RTH vs. PMcost in SSC PMs employing (a) passive heatsink and (b) forced liquid cooling.
Energies 18 01665 g011
Figure 12. Simulation results of parametric analysis involving tCu and tAlN spanning ranges 0.15–0.55 mm and 0.336–0.936 mm, respectively: device thermal time constant τ vs. PMcost in SSC PMs employing (a) passive heatsink and (b) forced liquid cooling.
Energies 18 01665 g012
Figure 13. Simulation results of parametric analysis involving tCu and tAlN spanning ranges 0.15–0.55 mm and 0.336–0.936 mm, respectively: device thermal resistance RTH vs. PMcost in DSC PMs employing (a) passive heatsink and (b) forced liquid cooling.
Energies 18 01665 g013
Figure 14. Simulation results of parametric analysis involving tCu and tAlN spanning ranges 0.15–0.55 mm and 0.336–0.936 mm, respectively: device thermal time constant τ vs. PMcost in DSC PMs employing (a) passive heatsink and (b) forced liquid cooling.
Energies 18 01665 g014
Figure 15. SSC PM under passive heatsink (top) and forced liquid (bottom) cooling conditions: percentage variations in FOMST, FOMDYN1, and FOMDYN2 with respect to same FOMs evaluated in reference case (tCu = 0.35 mm, tAlN = 0.636 mm).
Energies 18 01665 g015
Figure 16. DSC PM under passive heatsink (top) and forced liquid (bottom) cooling conditions: percentage variations in FOMST, FOMDYN1, and FOMDYN2 with respect to same FOMs evaluated in reference case (tCu = 0.35 mm, tAlN = 0.636 mm).
Energies 18 01665 g016
Table 1. Parameter values for PM materials used in this work.
Materialk(T0) [W/m∙K]cp [J/kg∙K]ρ [kg/m3]αβ [W/m∙K2]
SiC37069032111.29-
AlN15074832301.84-
Al2009052707-2.1∙10−2
Cu3983848954-5.2∙10−2
SnAg (solder)572207500-2.0∙10−2
insulator0.2916241024constant k
Disclaimer/Publisher’s Note: The statements, opinions and data contained in all publications are solely those of the individual author(s) and contributor(s) and not of MDPI and/or the editor(s). MDPI and/or the editor(s) disclaim responsibility for any injury to people or property resulting from any ideas, methods, instructions or products referred to in the content.

