Article

Maximum Fluidized Bed Boiler Temperature Determination for Coal–Biomass Combustion Condition Through Ash Area Reduction Technique

by
Fernando H. B. Santos
1,
João V. R. Moreira
1,
Gabriel C. P. Soares
1,
Alan N. Carneiro
1,
Danielle R. S. Guerra
1,
Manoel F. M. Nogueira
1,* and
Luís A. C. Tarelho
2
1
Mechanical Engineering Graduate School, Federal University of Pará, Campus Universitário do Guamá, Belém 66075-110, PA, Brazil
2
Department of Environment and Planning, Centre for Environmental and Marine Studies (CESAM), University of Aveiro, Campus Universitario de Santiago, 3810-193 Aveiro, Portugal
*
Author to whom correspondence should be addressed.
Energies 2025, 18(7), 1662; https://doi.org/10.3390/en18071662
Submission received: 31 December 2024 / Revised: 3 March 2025 / Accepted: 12 March 2025 / Published: 26 March 2025
(This article belongs to the Special Issue Bio-Energy and Its Sustainable Utilization)

Abstract

:
The residue of the so-called fibrous seed from the açai fruit represents 70% of the mass of the fruit and has potential for useful energy generation. Evaluating and treating the residue as a renewable fuel offers both economic and environmental benefits, whereas today, it is disposed of as organic waste. The co-firing of the fibrous seed and coal in fluidized bed boilers is an attractive option due to the high efficiency of the combustion process and the low bed temperature. However, one of the issues for this application is the low seed ash sintering temperature, which promotes the agglomeration of the bed material. This work aims to present a new procedure for evaluating the sintering temperature of açai seed and coal ash, making it simpler and consistent with traditional techniques. The proposed procedure for determining the starting ash sintering temperature is based on two simple and dynamic methodologies: simultaneous thermal analysis (STA) and sintering by an area reduction in ash samples. The data obtained allow us to determine that the coal ash begins to sinter at around 1000 °C, while the açai seed ash starts at around 700–850 °C, exhibiting a significant area reduction.

1. Introduction

Among the many ways to reduce greenhouse gas emissions, the use of biomass residues in co-combustion with coal in fluidized bed boilers is turning into a regular application [1,2]. Fluidized bed boilers (FBBs) burn fuel in a gas–solid contact mode due to the phenomenon known as fluidization [3]. This equipment has a higher energy efficiency and adaptability for burning various solid fuels in moderate temperatures, at 700–900 °C, which makes it advantageous for biomass applications [4]. In addition, the fluidized bed phenomenon allows us to understand biomass combustion and its impact on the energy processes, which is crucial for optimizing energy generation [5].
The Brazilian Amazon region provides us with the açai fruit (Euterpe oleracea), which is available in large quantities in the state of Para; alone, approximately 1.6 million tons were generated in 2022 [6]. The açai residue, or fibrous seed, represents about 70% of the fruit’s mass production, which is usually disposed of irregularly, causing environmental problems [7]. This residue has a high heating value and a low amount of ash for agricultural biomass [8,9]. Those properties qualify the açai seed as a biomass to be used in the co-combustion process with coal.
Despite its advantages, fluidized bed boilers face issues associated with biomass ash: bed material agglomeration, defluidization, fouling, and slagging [10]. Agglomeration is the most common problem, which is when ash forms sticky layers on the surface of the bed particle material, eventually leading it to grow and bind to other solid particles, harming the fluidization phenomenon [11].
The main phenomenon related to these problems is the sintering process, which transforms the loose powder material into a compact solid due to the rearrangement of its molecular structure [12]. When ash has a low melting temperature, it promotes adhesion between the ash and bed material [13,14]. The combustion temperature usually exceeds the ash sintering and melting temperature of biomass due to the higher concentrations of alkali and alkali earth elements [15,16].
The presence of potassium (K) with silicon (Si) is known to form K-silicates with a low melting temperature that causes the partial melting of ash [17,18]. Potassium is normally present in ashes in the form of chloride (KCl), sulfide (K2SO4), or carbonate (K2CO3), and tends to melt and volatilize between 700 and 1000 °C [19]. Mineral phases such as K2O4SiO2, whose melting temperature is around 764 °C, are usually formed in the fluidized bed that operates with sand that has a high concentration of quartz (SiO2) in its composition [20].
A higher concentration of CaO in relation to K2O tends to form phases with a high melting temperature, such as K2CaSiO4, at around 1600 °C; however, slight variations in its concentrations cause it to form phases with a low melting point, such as K2Ca(CO3)2, at around 815 °C [21]. Based on the available information, a high concentration of CaO can neutralize phases with a low melting temperature, caused mainly by potassium and sodium. Therefore, the use of limestone is recommended, as it has a diluting effect on the sintering and melting processes and can reduce bed material agglomeration [21,22,23].
Over the years, these problems related to ash have been studied in order to understand their physical–chemical behavior, including the sintering and melting processes, chemical composition, reactivity, morphology, and index to predict deposition and agglomeration [24,25,26,27,28]. The main property for understanding ash agglomeration problems is fusibility [29], obtained by Ash Fusion Temperature (AFT) analysis. This method aims to observe the change in the geometry of ash samples and estimates four characteristic temperatures: initial deformation temperature—IDT, softening temperature—ST, hemispherical temperature—HT, and fusion temperature—FT [26].
Although widely used in the literature [14,24,25,26,27,30,31,32], AFT analysis has some limiting factors. The composition and morphology of ashes produced in a laboratory do not in fact represent ashes from industrial processes [33]. The analysis is not able to reflect the entire melting behavior and has a low accuracy of ±40 °C [26]. The initial melting temperatures for biomass ashes are below the IDT [25], and their determination is conducted through subjective and empirical observation with low reproducibility [31].
An alternative to AFT analysis is Thermomechanical Analysis (TMA), a technique that allows the evaluation of the thermal behavior of a material through graphs that represent the expansion or reduction levels of the sample dimensions. This set of data can be used to evaluate the sintering and melting process [34]. This analysis shows an accuracy of ±10% compared to the AFT method, which has an accuracy of ±40%, and associates the fusion temperatures with reduction levels of 25% (T25), 50% (T50), 75% (T75), and 90% (T90) [35,36]. Several studies [26,27,31,37] have used TMA to obtain correlations between the four characteristics temperatures obtained by AFT in order to understand the sintering and melting processes.
Kim et al. [31] found that temperatures obtained by AFT for bituminous coal ashes showed very small variations to the point where IDT and FT were indistinguishable. However, the data obtained by TMA allow for identifying the temperatures more clearly and below to the standard temperatures. IDT was found to be similar to T90 and exceeded 1200 °C, while T25 was identified below 1200 °C.
Ma et al. [27] used TMA to identify temperatures to characterize the start of the sintering and melting process for biomass residues. The sintering (Ts) and melting (Tm) temperatures obtained by TMA are lower than the IDT and ST obtained by standard analysis of AFT, respectively. Therefore, the AFT cannot accurately indicate the beginning of the biomass ash sintering and melting process when compared to TMA. In addition, the author concluded that the sintering process starts before melting.
Yan et al. [26] evaluated the TMA graph and the morphology of synthetic coal ashes and identified three stages of the sintering and melting process. The first stage was related to the sintering process of the liquid phase formed. The second stage was related to the spreading of the formed liquid phase and was designated as the primary fusion. The third stage was dominated by the liquid phase.
Zhang et al. [37] evaluated the morphology of anthracite coal ash and found that no obvious area reduction occurs below 1160 °C; only above this temperature do both an agglomeration and a reduction in the sample area occur, which represent the sintering process.
In the context of the energy transition, the açai fibrous seed, when properly treated, can be introduced into the Amazon region’s production chain as a renewable fuel in steam generation systems. However, for the correct management of these residues, it is necessary to obtain data about their physical–chemical properties and an understanding of the sintering process of its ashes. This work aims to evaluate the sintering process of bituminous coal and açai fibrous seed ashes by adapting Ash Fusion Temperature analysis, in order to obtain qualitative and quantitative data, applying sintering analysis through ash area reduction; this is also an alternative to standard analysis due to its technical difficulty in carrying out in the laboratory.

2. Materials and Methods

2.1. Fuel Samples

Three solid fuels were used for ash production in the laboratory. Figure 1 shows Colombian bituminous coal (GCA) from the Glencore company (Cerrejon, Colombia), and two types of açai seed, one with fiber (ASA1) and the other fiber-free (ASA2), collected from companies specialized in residue management in the region of Igarapé-Miri, PA, Brazil. The açai samples represent the biomass residue before and after a pre-treatment to clean and remove the fibers and other impurities.

2.2. Experimental Methods

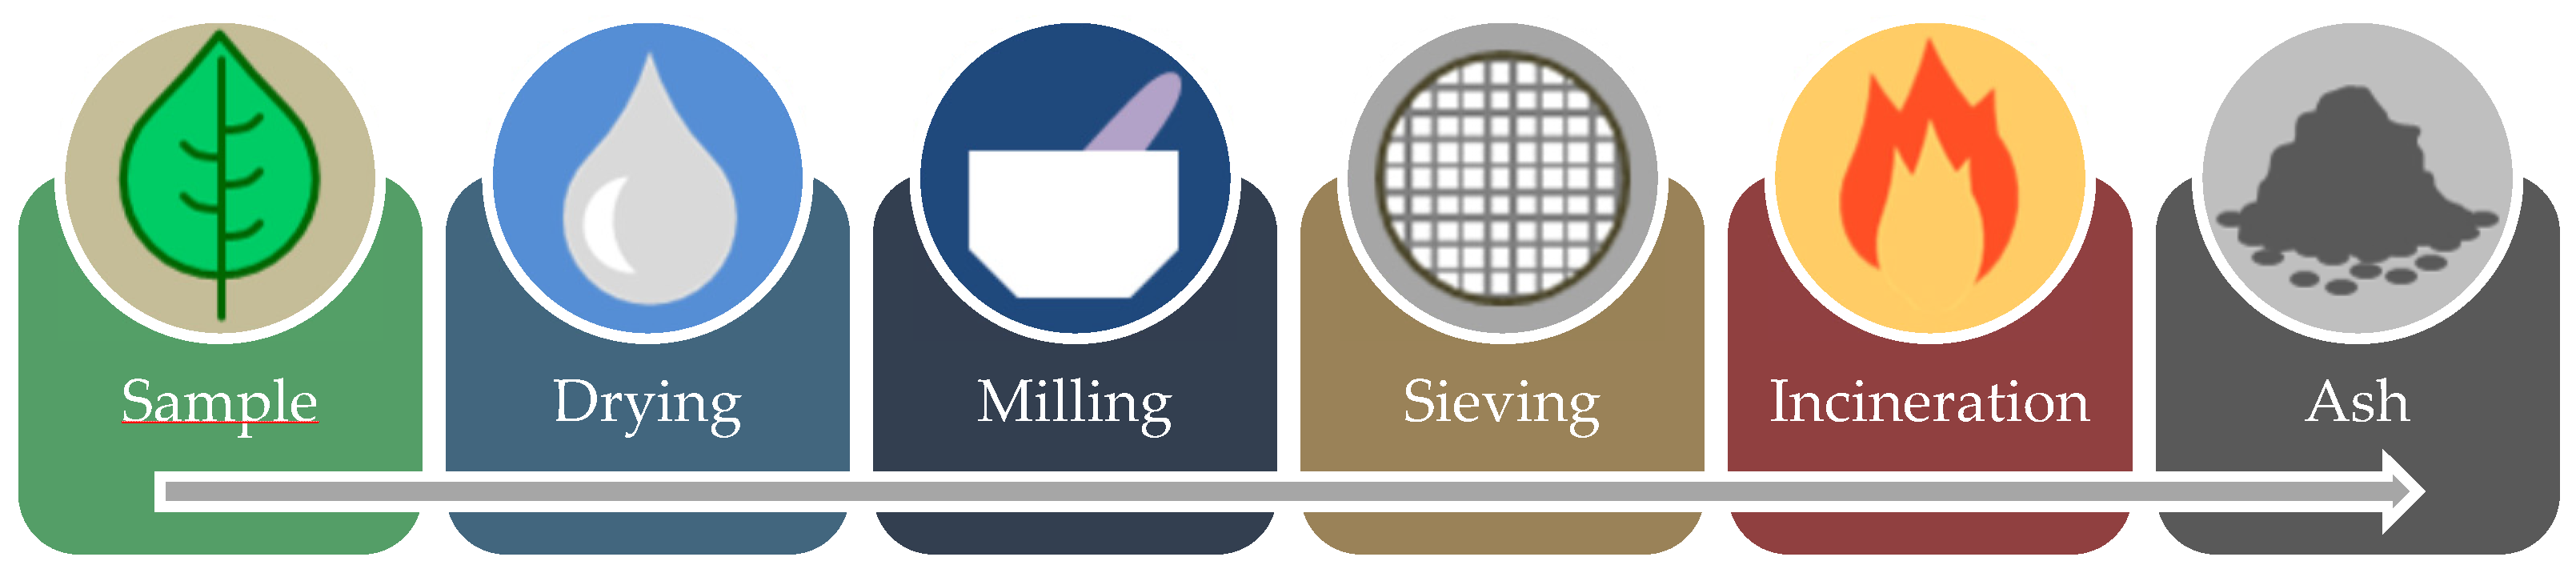
2.2.1. Standardization and Characterization Analysis

The fuel samples were subject to an ash production process composed of drying, milling, sieving, and combustion, as shown in Figure 2.
The drying process was carried out in a stove, EL 1.4-Odontobrás, Ribeirão Preto-SP Brazil, according to the NBR 16508: 2017 [38] and CEN/TS 14774: 2004 [39] standards for coal and biomass, respectively. The size standardization was performed in a basic analytical mill A11-Ika, Campinas-SP Brazil, and sieves Bertel, Caieiras-SP Brazil, between 0.25 and 0.5 mm (35 – 60 mesh). After size standardization, the fuel was submitted to an incineration process according to the standards for each material, NBR 16586 [40], for coal and CEN/TS 14775:2004 [41] for the açai seed. Table 1 shows the sample identification codes, their proximate analysis data, and high heating values [8].
The ash samples were characterized by X-ray fluorescence (XRF) spectrometry analysis to identify their elemental composition (expressed as oxides) in mass percentage and dry basis. The equipment used was a sequential WDS spectrometer, Axios Minerals-PANalytical, Malvern Panalytical, Malvern, UK.

2.2.2. Simultaneous Thermal Analysis (STA)

Simultaneous thermal analysis, consisting of thermogravimetry analysis (TGA) and differential thermal analysis (DTA), was carried out using a vacuum-sealed thermo-microbalance TG 209 F1 Libra-NETZSCH, Wittelsbacherstrabe, Germany. The equipment temperature sensor was calibrated once a year by fusion temperature determination of In, Zn, Al, Au, and Ag NETZSCH standard samples. This methodology had already been applied to the equipment before all analysis of this paper, according to the procedure set out in equipment manual.
The samples were subjected to a heating schedule in three stages: the first stage was from 25 °C to 400 °C at a heating rate of 10 °C/min. The second stage was an isotherm for five minutes at 400 °C, and the third stage was from 400 °C to 1000 °C at a heating rate of 10 °C/min. The first and second stages aim to ensure uniform heating of the sample and ensure thermal balance before starting the third heating stage in order to observe the thermal behavior at high temperatures. For all samples, about 20 mg of ash was used and heated in an O2 atmosphere with a flow rate of 40 mL/min.
Thermogravimetry (TGA) is normally used in research to understand the thermal behavior of ash in terms of mass loss. It is important to note that biomass ash has components that volatilize at the usual temperatures of the combustion process, such as HCl, KCl and K2SO4 [24,42,43]. CO2 could be released due to the thermal decomposition of CaCO3 [24,25,44] and SO2 associated with the breakdown of complex mineral components at elevated temperatures [25]. Differential Thermal Analysis (DTA) evaluates the ash behavior in terms of exothermic or endothermic reactions, such as the melting process, thermal decomposition, polymorphic transitions, and crystallization [25,28,45,46].

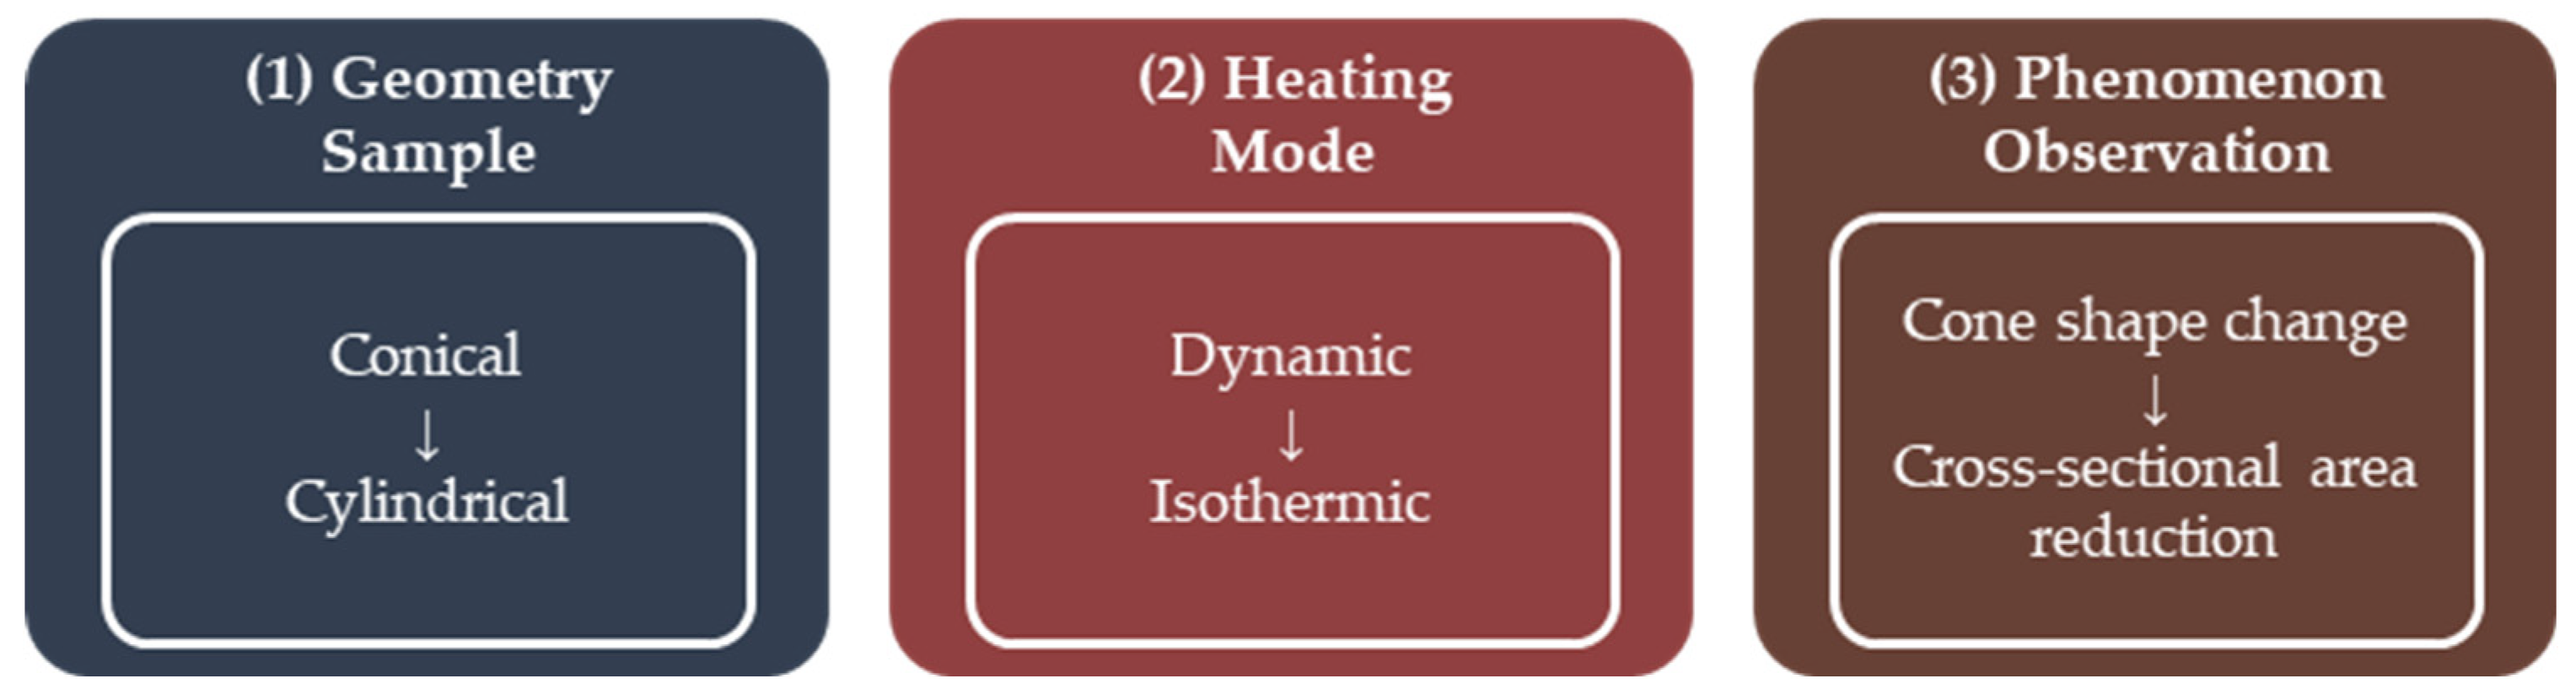
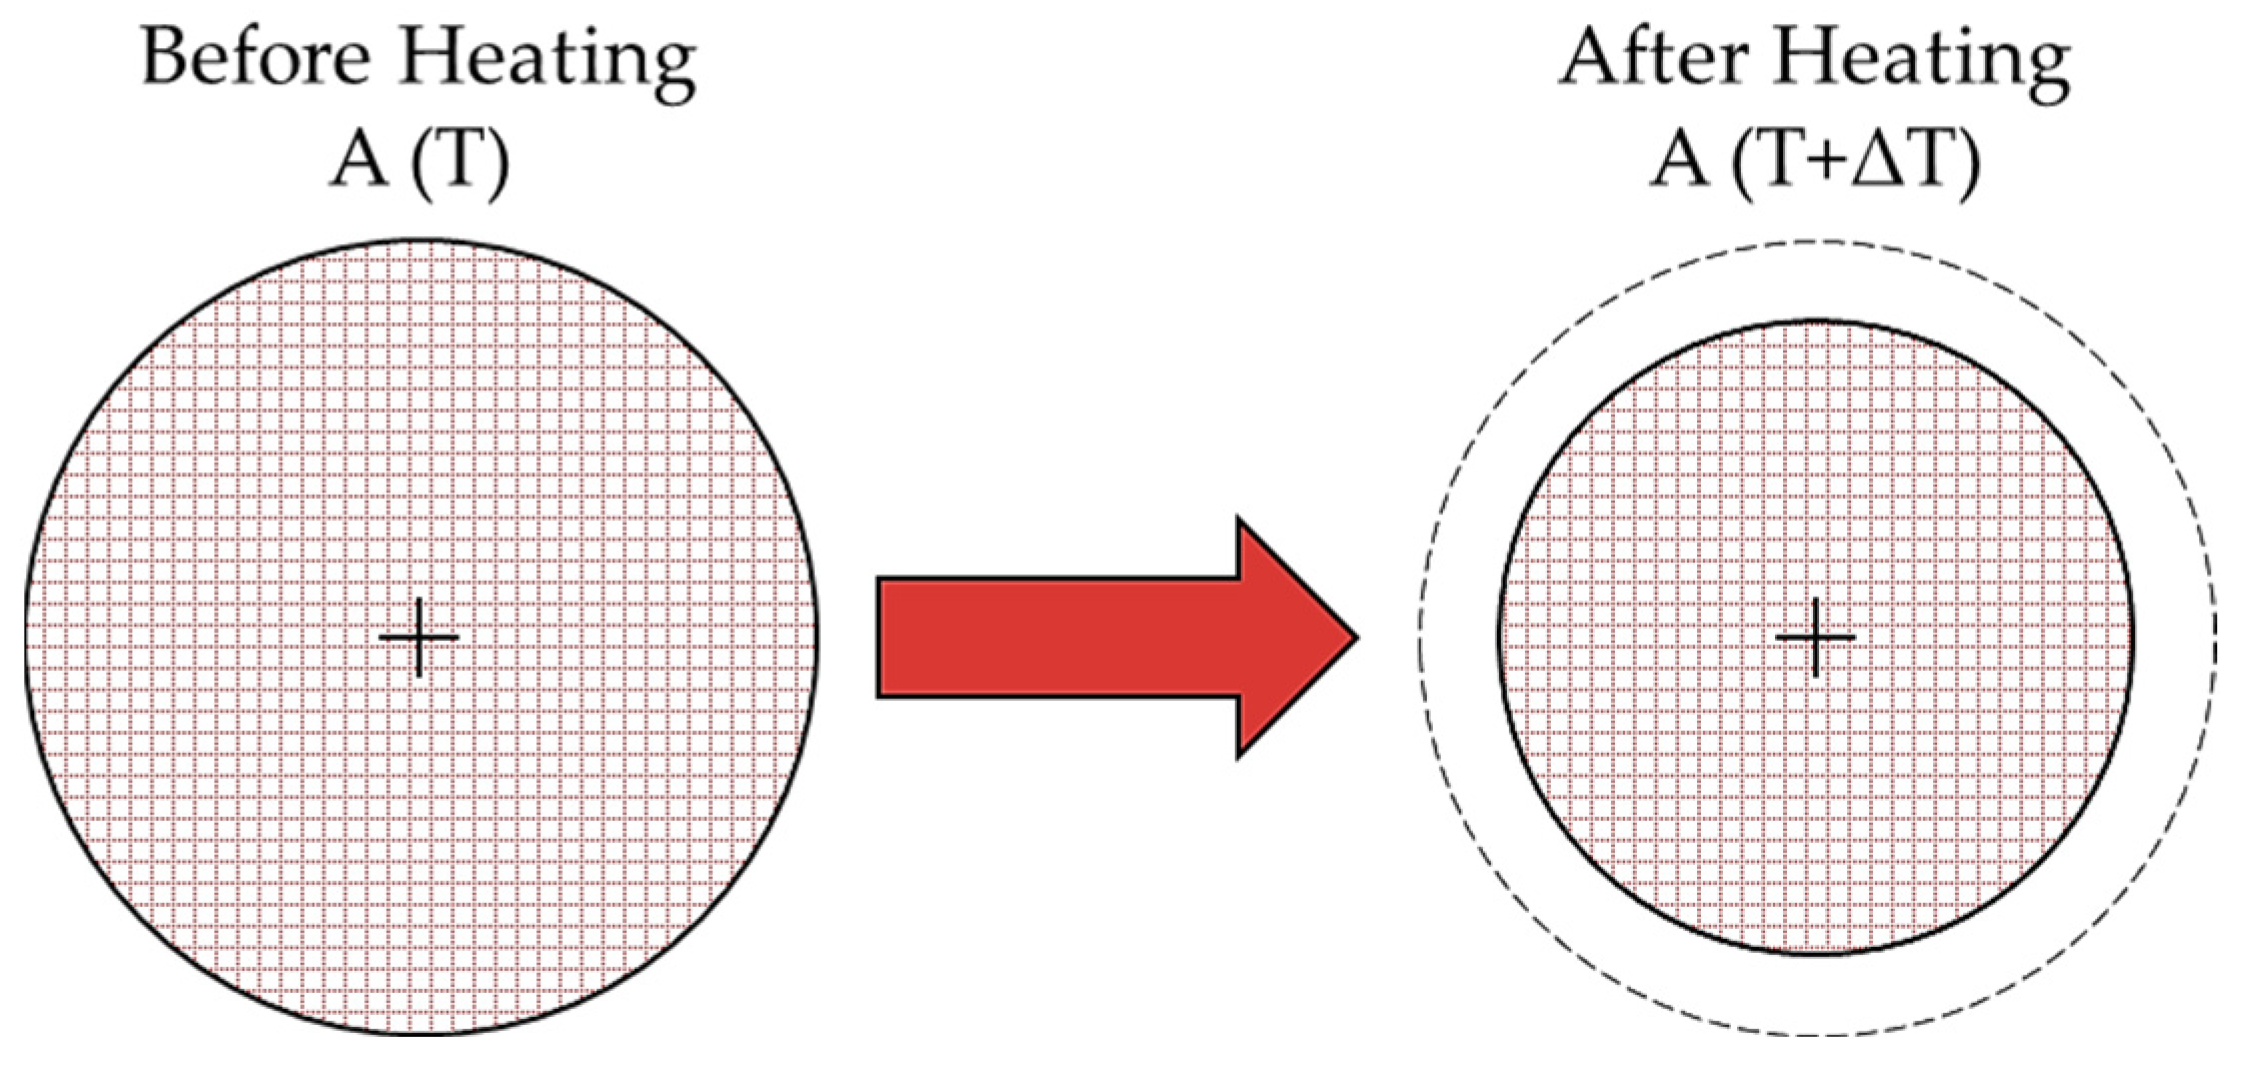
2.2.3. Sintering Analysis by Area Reduction Technique

The proposed methodology was based on two analyses: Ash Fusion Temperature (AFT), by ASTM D1857/D1857M-24 [47], and Thermomechanical Analysis (TMA). ASTM [47] exhibits some difficulties when applying this method, such as ensuring means for observation of the phenomenon, avoiding any heating interference, and operator safety. Some changes to the standard methodology were suggested in order to obtain qualitative and quantitative data and an empirical observation of the phenomenon of ash samples, as shown in Figure 3.
The first change was the ash sample geometry: instead of a conical shape, the samples were compressed in an alumina cylindrical crucible (9 × 7 mm) in order to ensure a flat surface and an easier way of producing samples for the analysis.
The second change was the heating mode: instead of dynamic heating at a constant rate, the samples were subjected to isothermal heating in order to observe changes in the samples without interference of the heating process, before and after the isothermal.
The third change was the observation of the phenomenon: instead of changes occurring in a conical shape [47], changes in the cross-sectional area of the cylindrical samples were observed, both before and after isothermal heating, as shown in Figure 4. The purpose was to identify signs of sample area reduction, which would be indicative of the beginning of the sintering process that occurs before the melting process [26,27,31].
Thermomechanical Analysis (TMA) was used as a reference due to its physical principle, which allows the evaluation of the thermal behavior of a material through graphs that represent the expansion of or reduction in the sample dimensions [34].
The proposed methodology was carried out in a muffle furnace Jung LF00910, Blumenau, SC Brazil, with a maximum working temperature of 1100 °C under an oxidized atmosphere. About 50 mg of each ash sample was used and placed in a cylindrical crucible of alumina (9 × 7 mm). Initially, without a sample, the muffle was heated up to 700 °C at a rate of 100 °C/min. Once this temperature was achieved, the sample was introduced into the muffle and kept at an isotherm condition for five minutes. The sample was removed, cooled, and a photo of the cross-section area was taken. The samples were positioned on paper with a known scale in millimeters, and a camera was placed in a fixed position to take photos with the same reference point. Following this, the muffle temperature was increased to 750 °C and kept at a constant temperature. Again, the sample was introduced, kept at isothermal conditions for five minutes, and removed for cross-area measurement. This procedure was repeated until a temperature of 1000 °C was achieved, in steps of 50 °C. Three samples of each ash fuel, as shown in Table 1, were used for the analysis; nine ash samples were produced in total. Figure 5 presents the analysis process where the photo was taken for the initial sample and each isothermal.
The millimeter scale paper used has a minimal measurement of 1 mm. ImageJ (version 1.53 K), a public-domain image processing software, aims to measure and convert pixels to a standardized scale used for measuring the area of the sample. A line of 10 mm on the paper reference was measured and the software converted it into pixels/mm. This procedure was repeated for each ash sample photo and the areas were obtained in mm2 based on the photo conversion estimated by ImageJ (version 1.53 K).
The cross-sectional area of each sample photo was measured three times, and the average value was calculated. AR represents the percentage of area reduction (%) and is obtained through Equation (1). Ao is the sample’s initial area (mm2), and AT is the area (mm2) at the specific isothermal condition. Uncertainty, deviation, and a 95% confidence interval for the area (mm2) and area reduction (%) were obtained through the measurement data.
AR = 100 × (AO − AT)/AO

3. Results

3.1. Ashes Chemical Composition

The chemical composition of the ashes is shown in Table 2. The main mass fractions (sum near 70%wt) of the chemical elements in coal ash (GCA) are SiO2 (57.1%) and Al2O3 (24.4%). The fiber seed ash (ASA1) had a main mass fraction of SiO2 (41%), K2O (21.3%), and P2O5 (10.1%), while the fiber-free seed ash (ASA2) showed a main mass fraction of K2O (27.1%), Fe2O3 (16.3%), SiO2 (16%), and P2O5 (11%). The main difference between ASA2 and ASA1 is fiber removal. Table 2 shows a strong reduction in silicium content for ASA2 in comparison with ASA1, indicating that fiber is rich in silicium.
The CaO concentration in both seed ashes is 7.6% (ASA1) and 9.5% (ASA2), while for coal ash (GCA) it was 1.7%. The presence of SO3 is also relevant, with mass fraction of 2.3% (GCA), 4.5% (ASA1), and 5.7% (ASA2). Coal ash (GCA) showed mass fraction of 1.4% for Na2O and 2.9% for K2O (2.9), which are relevant components due to their effects on reducing melting temperature in the presence of SiO2.

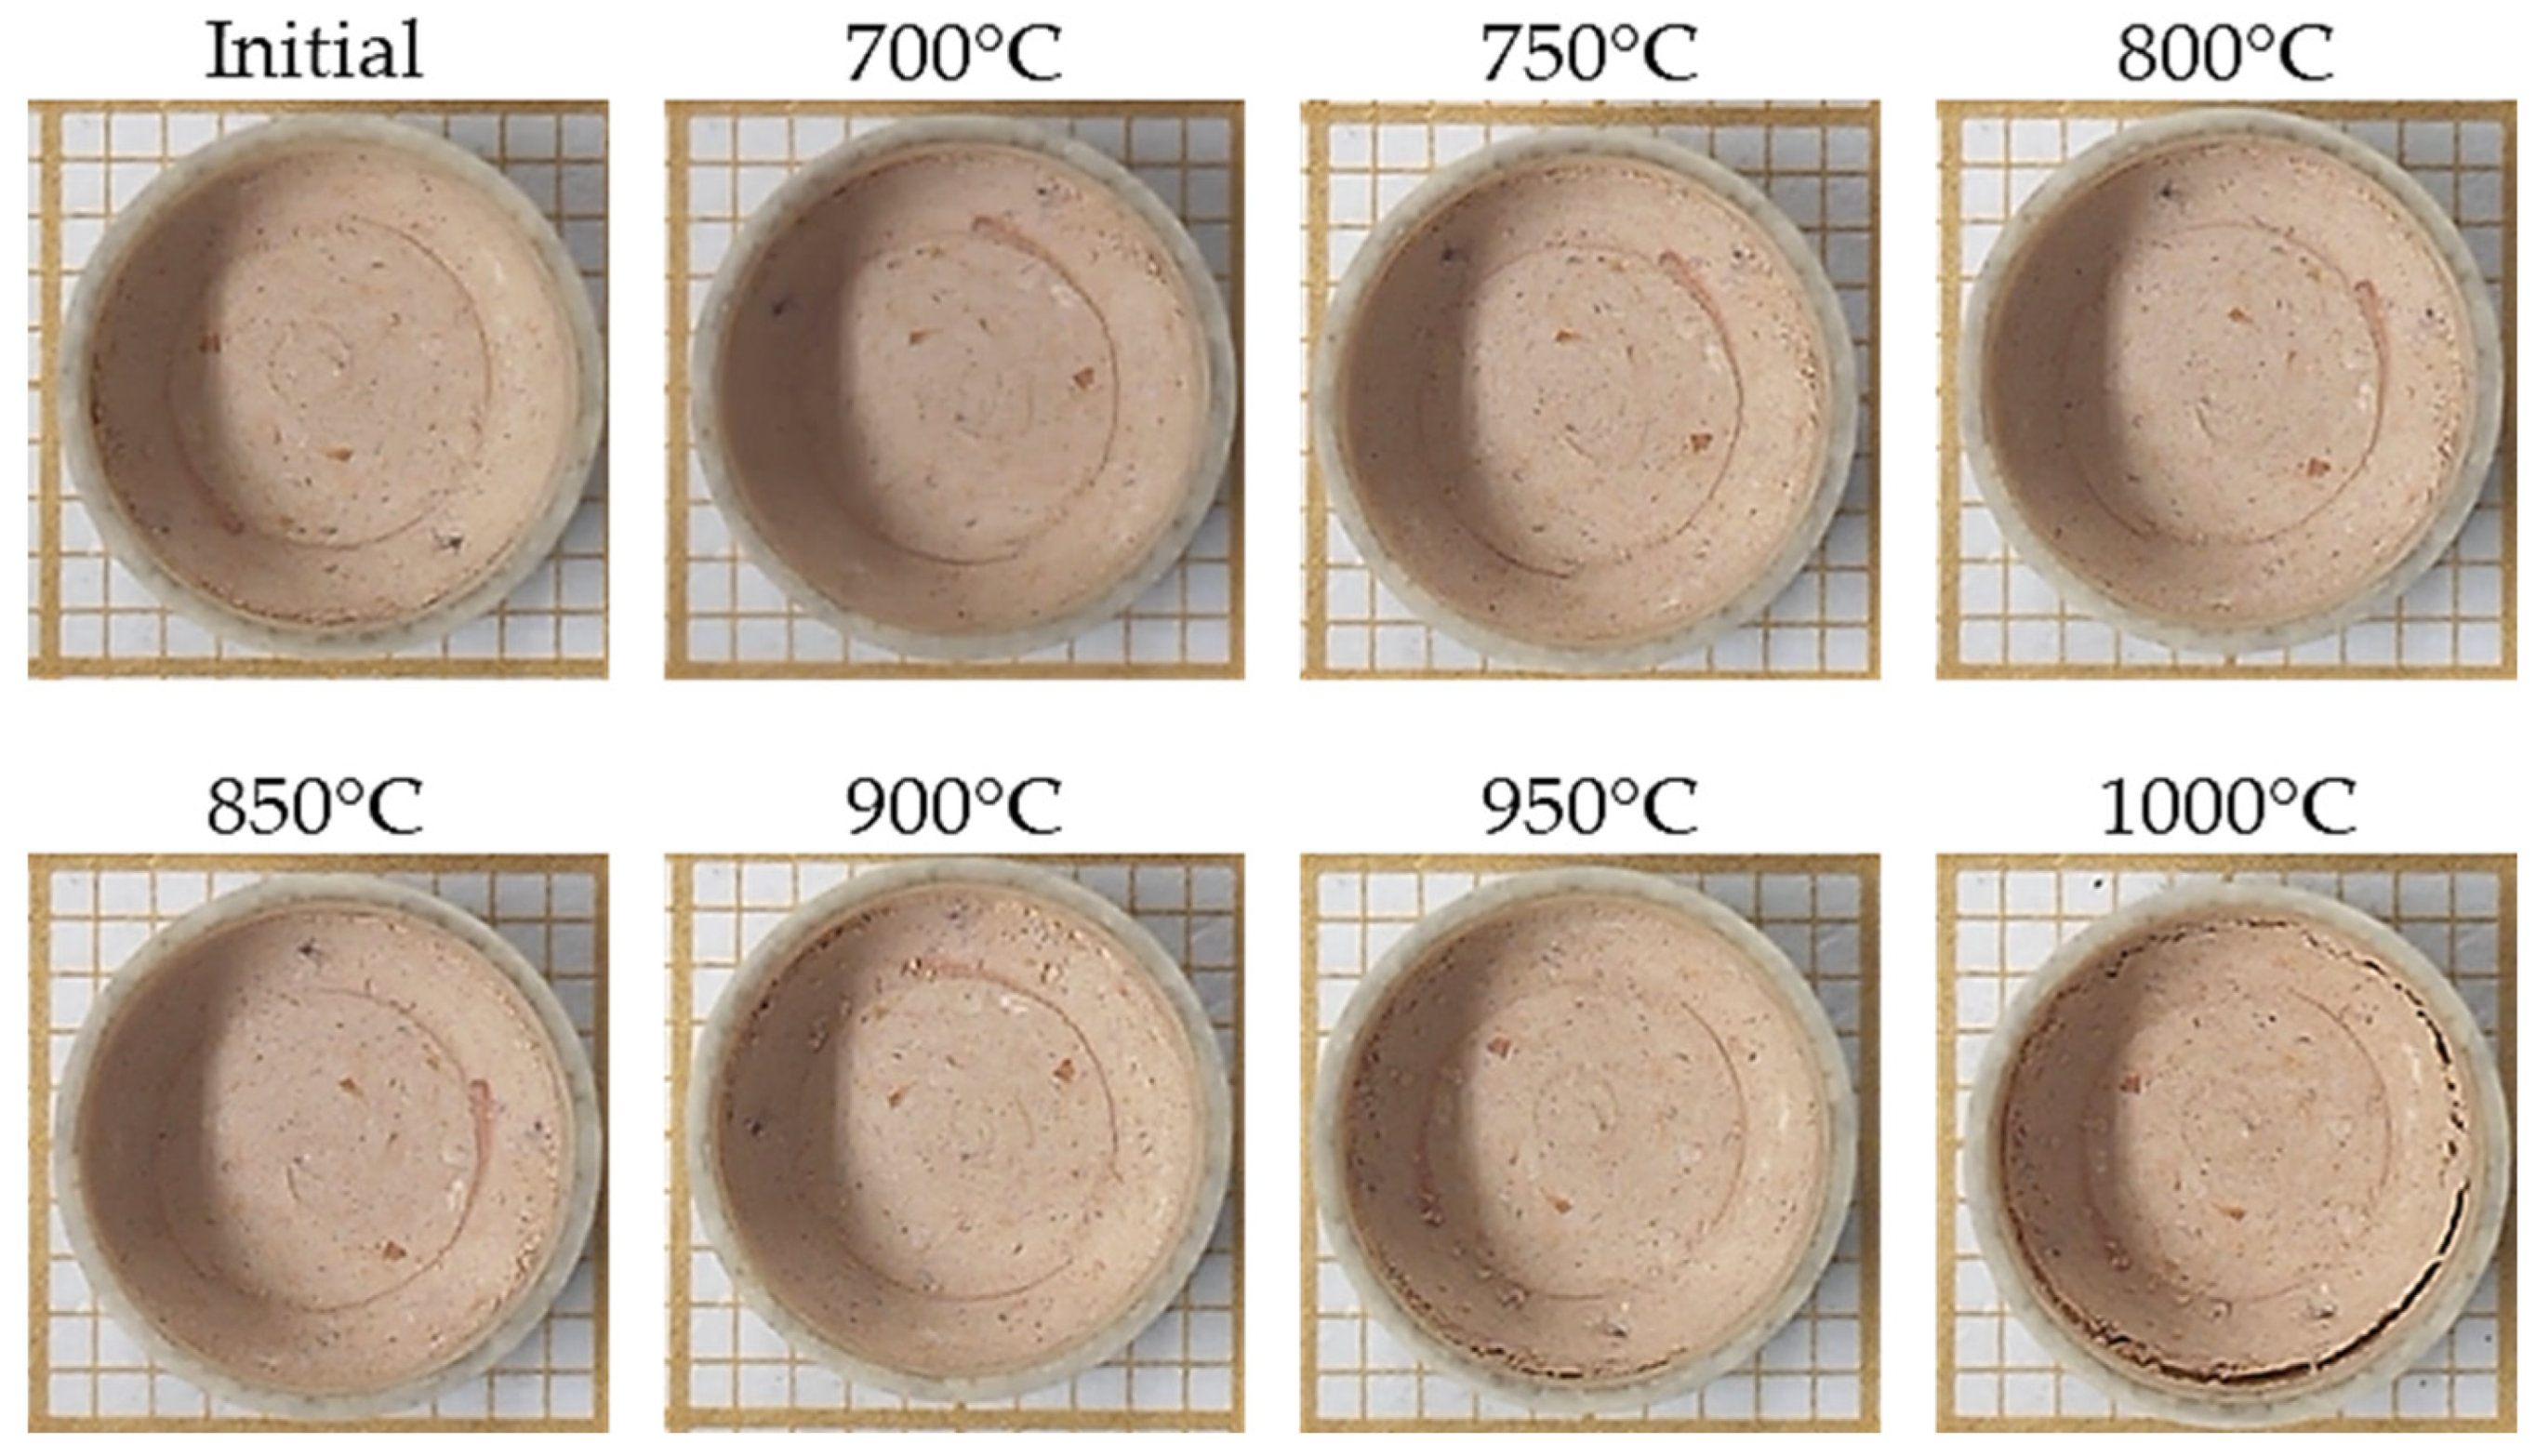
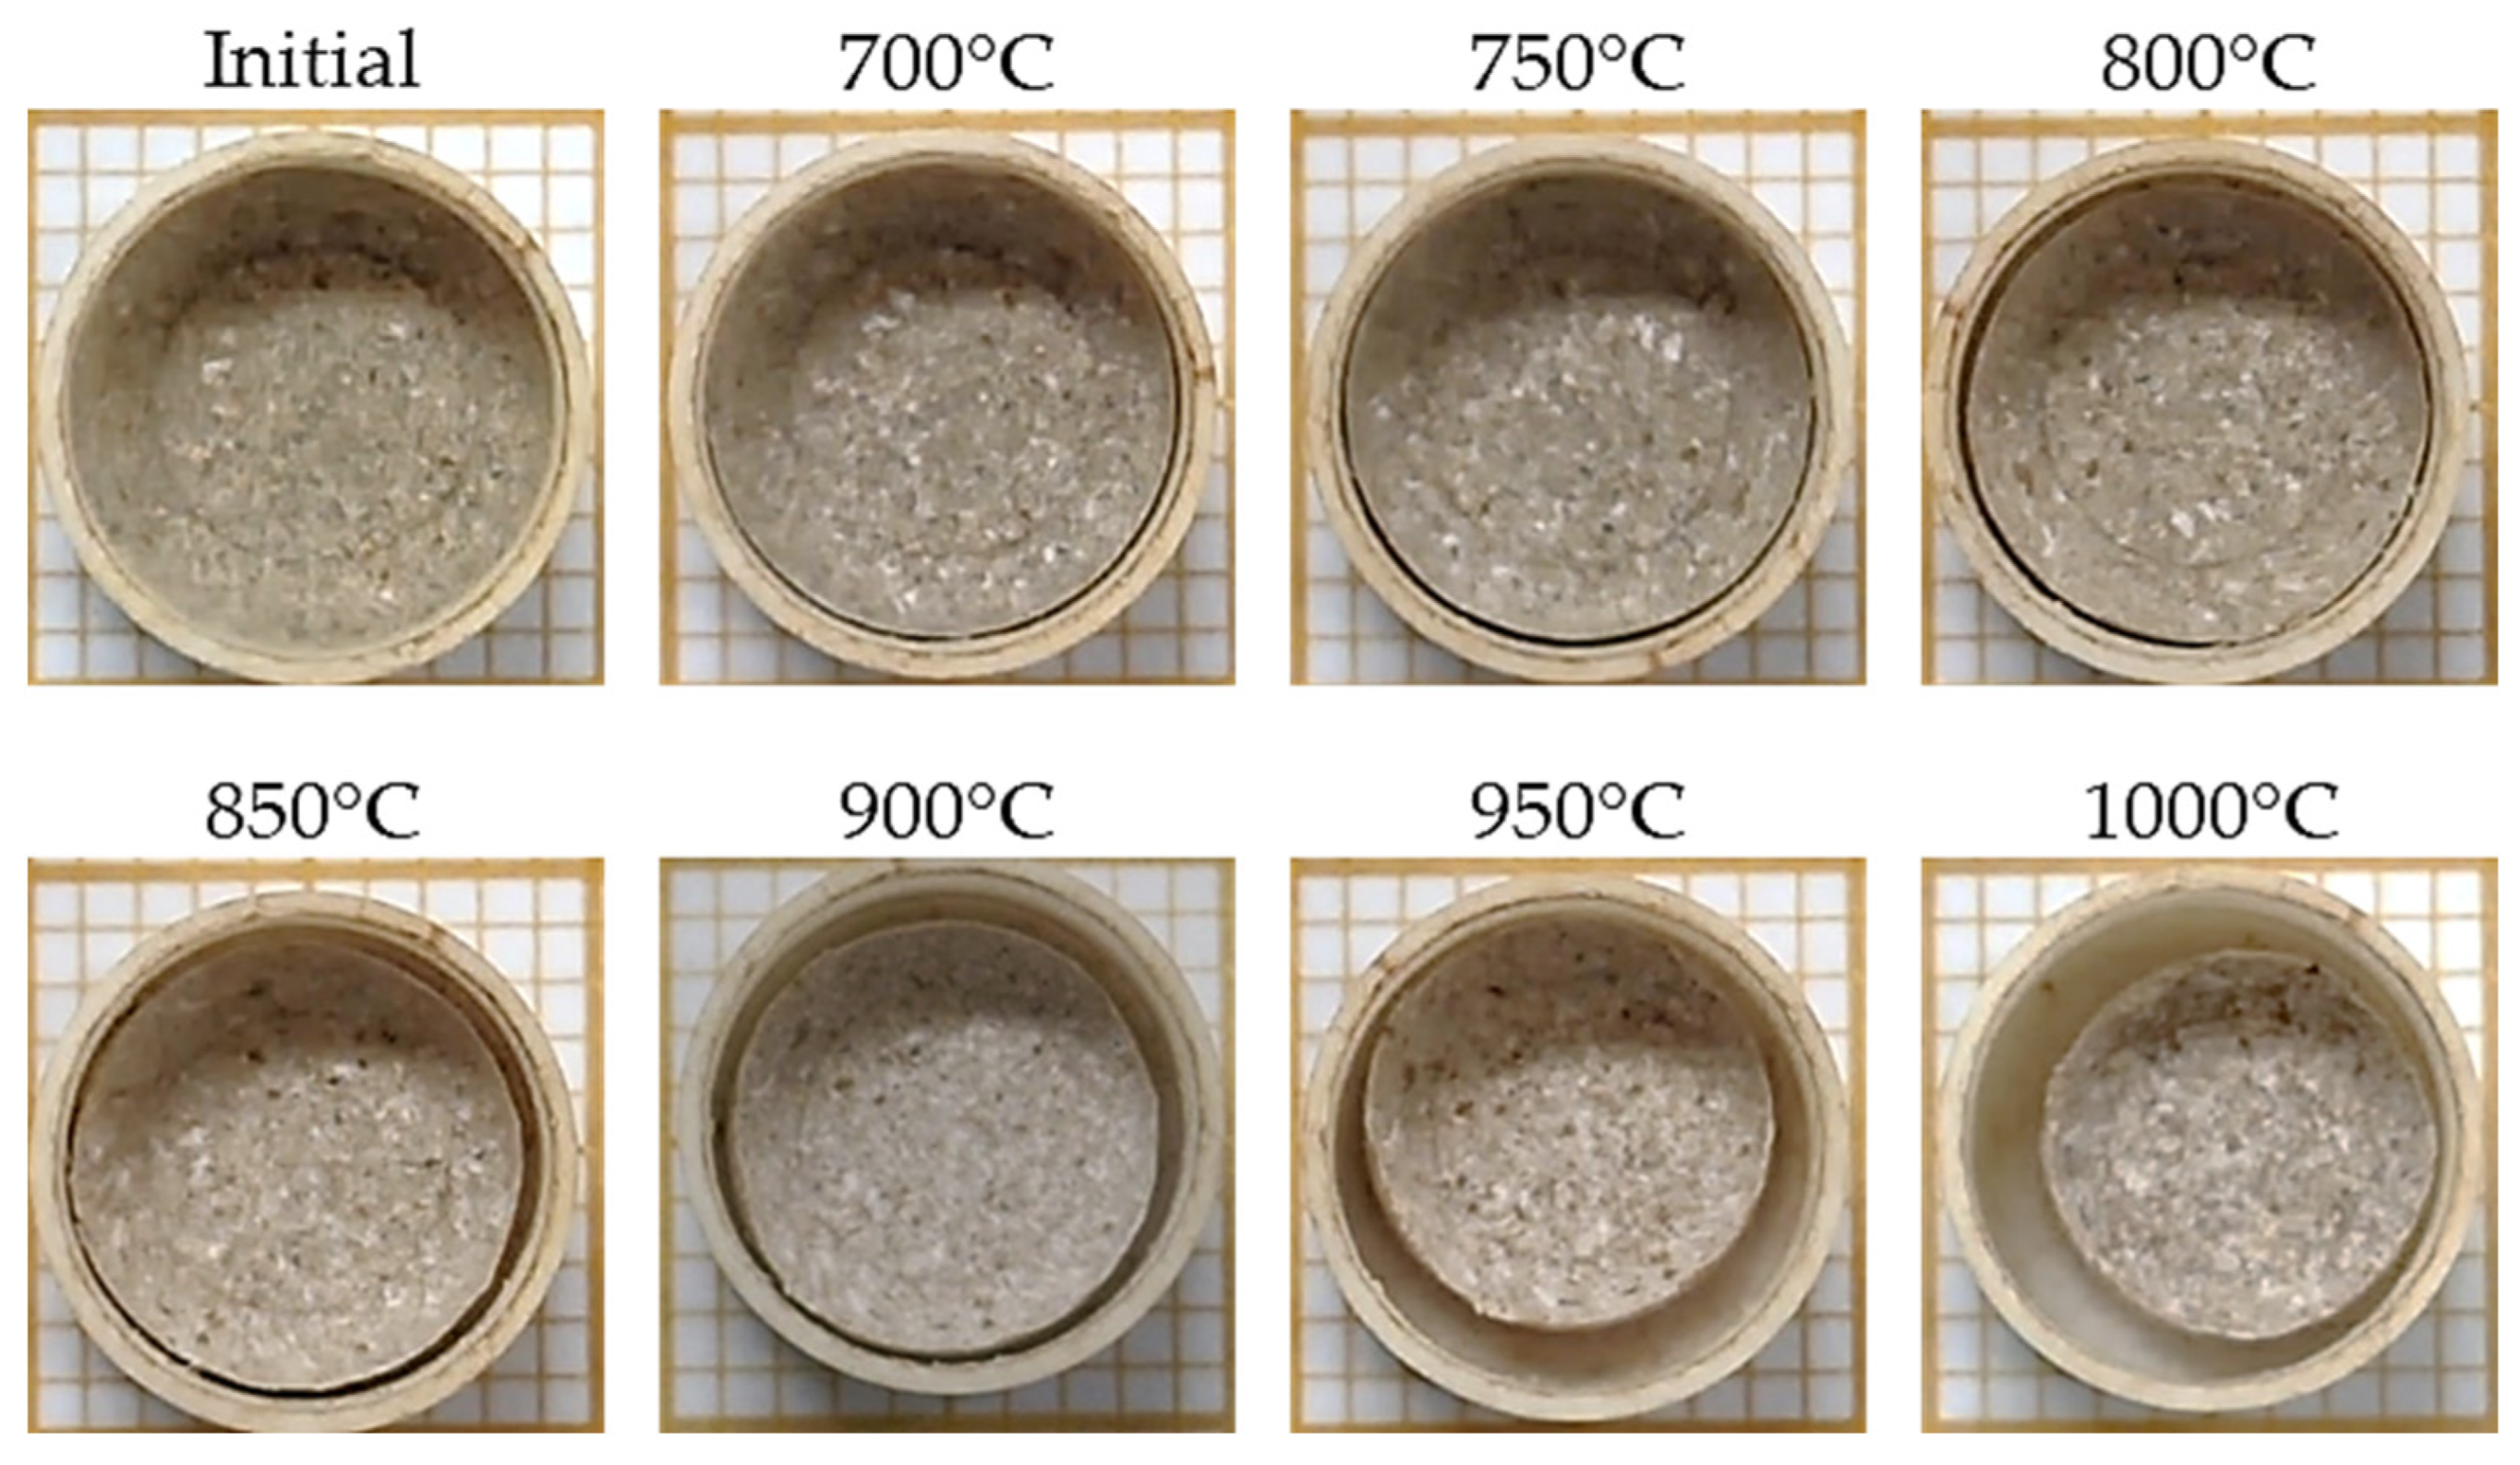
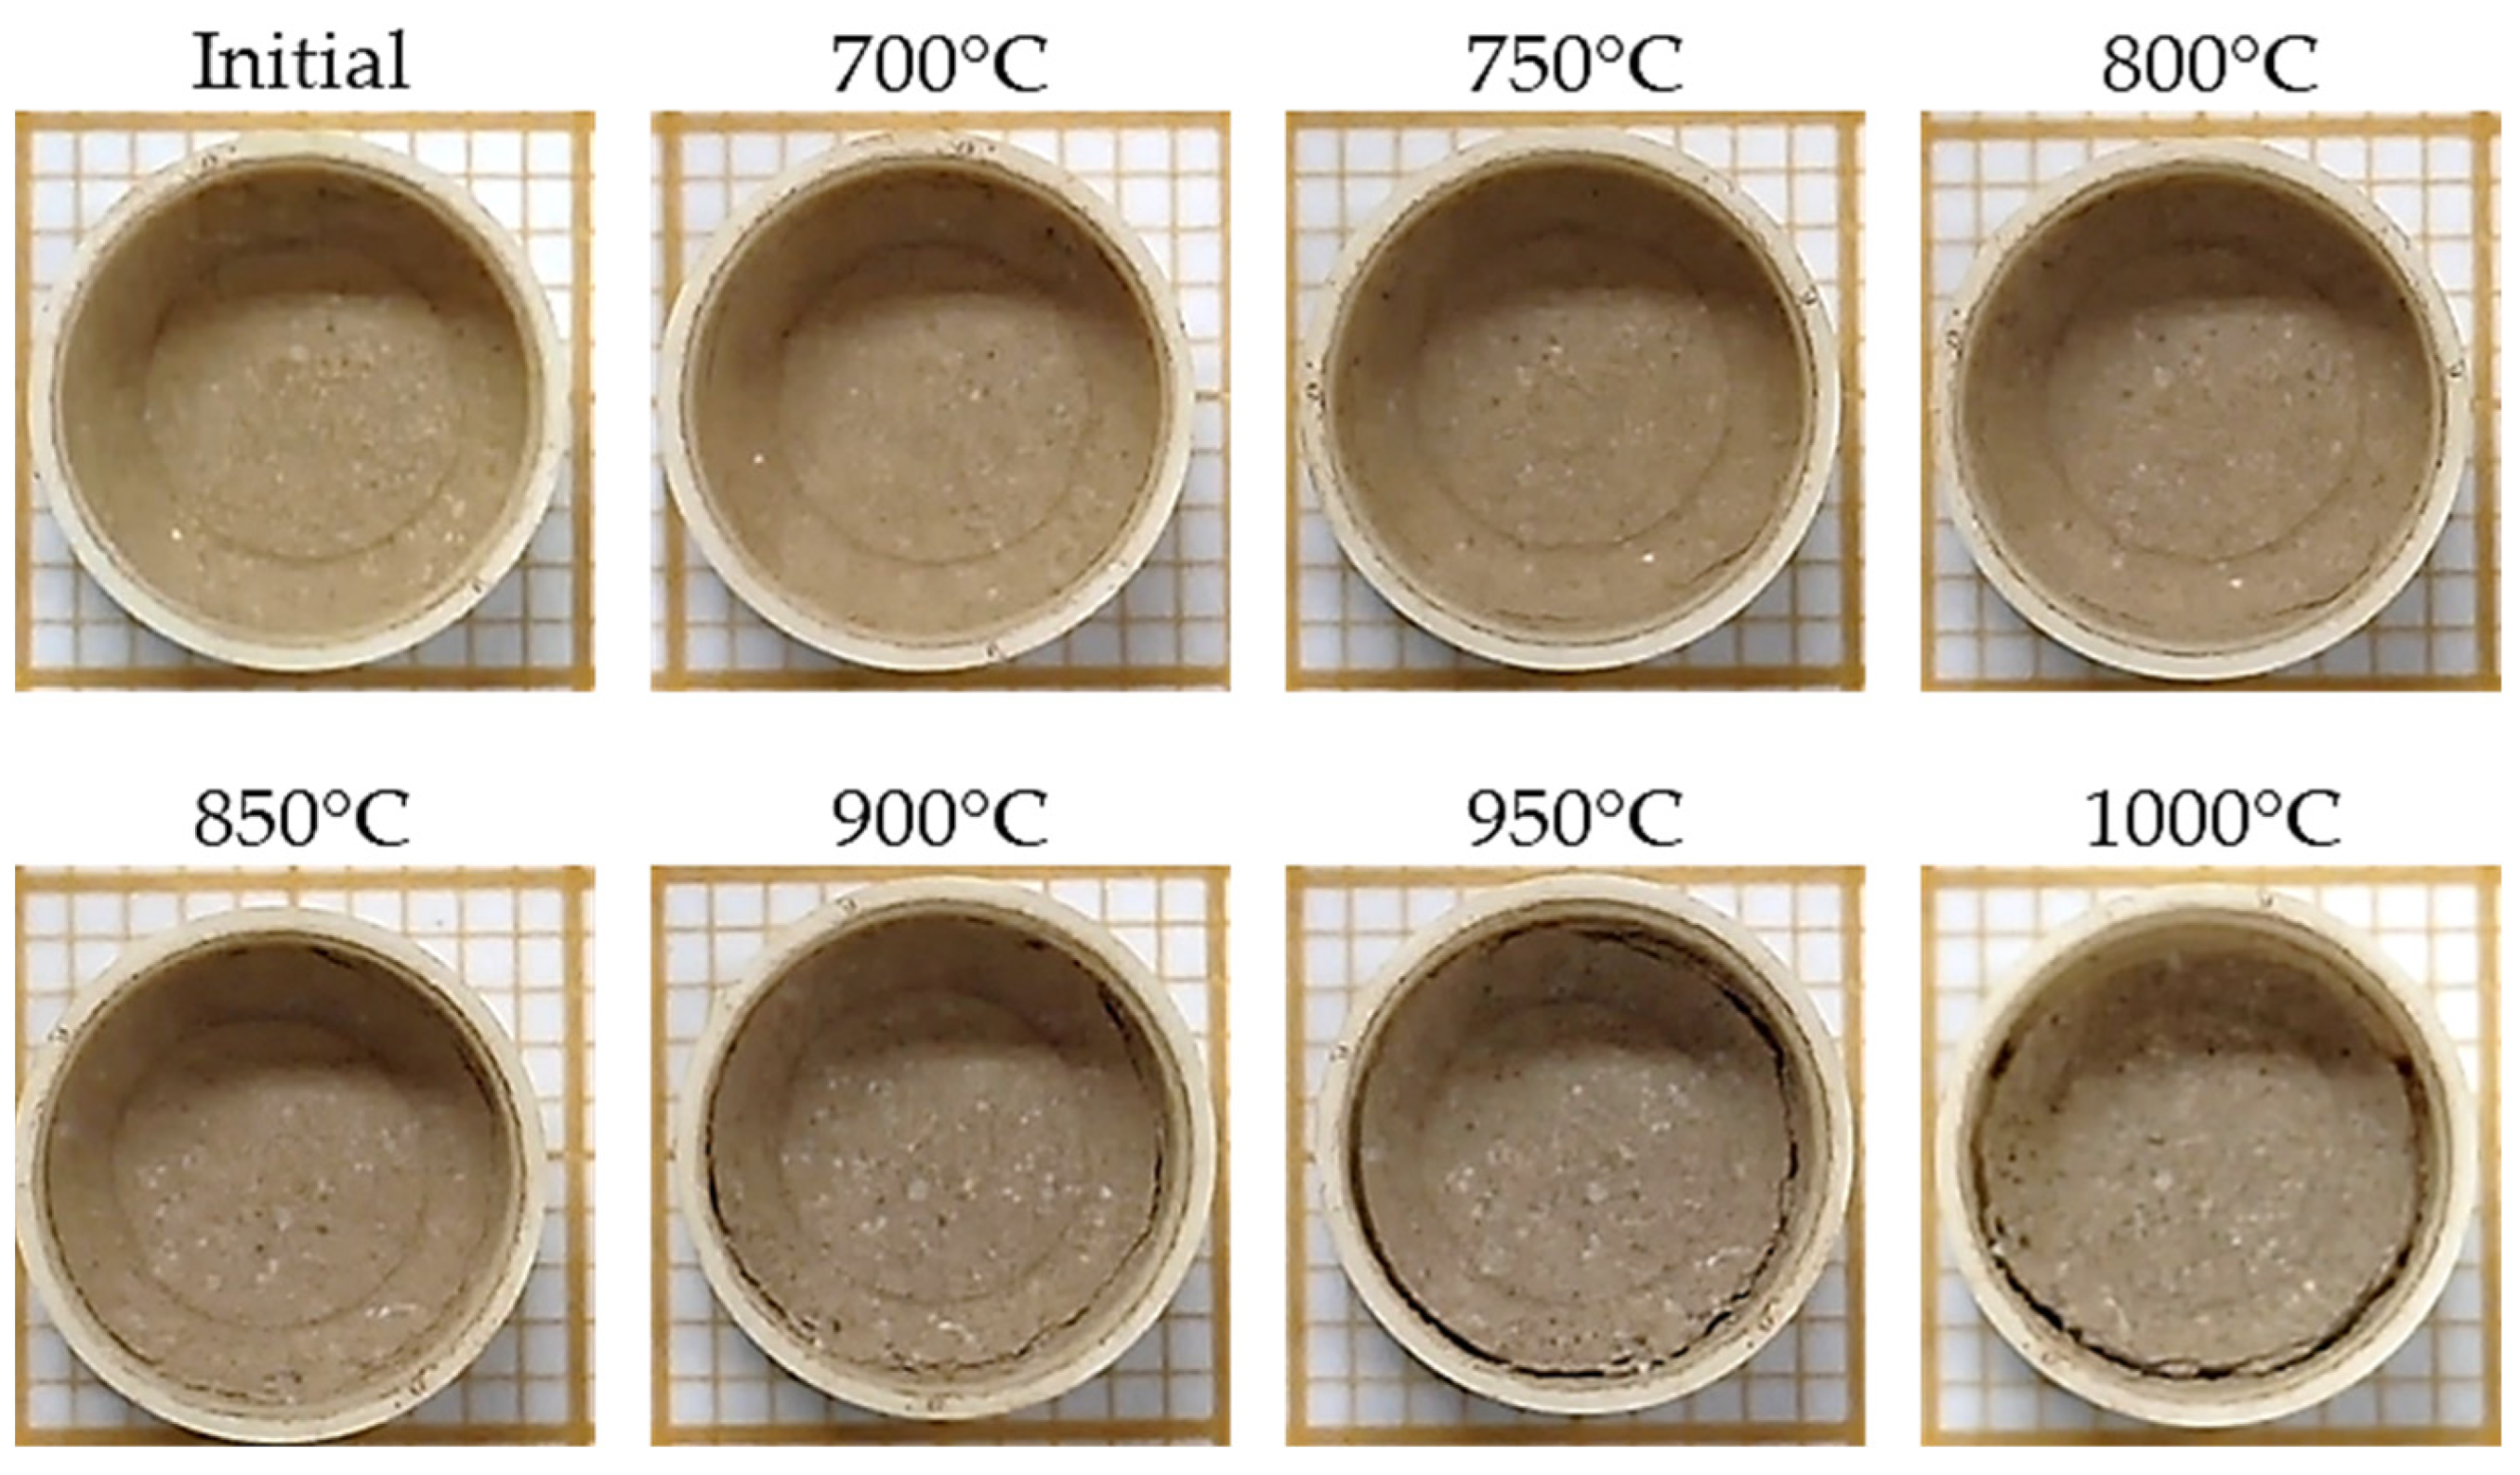
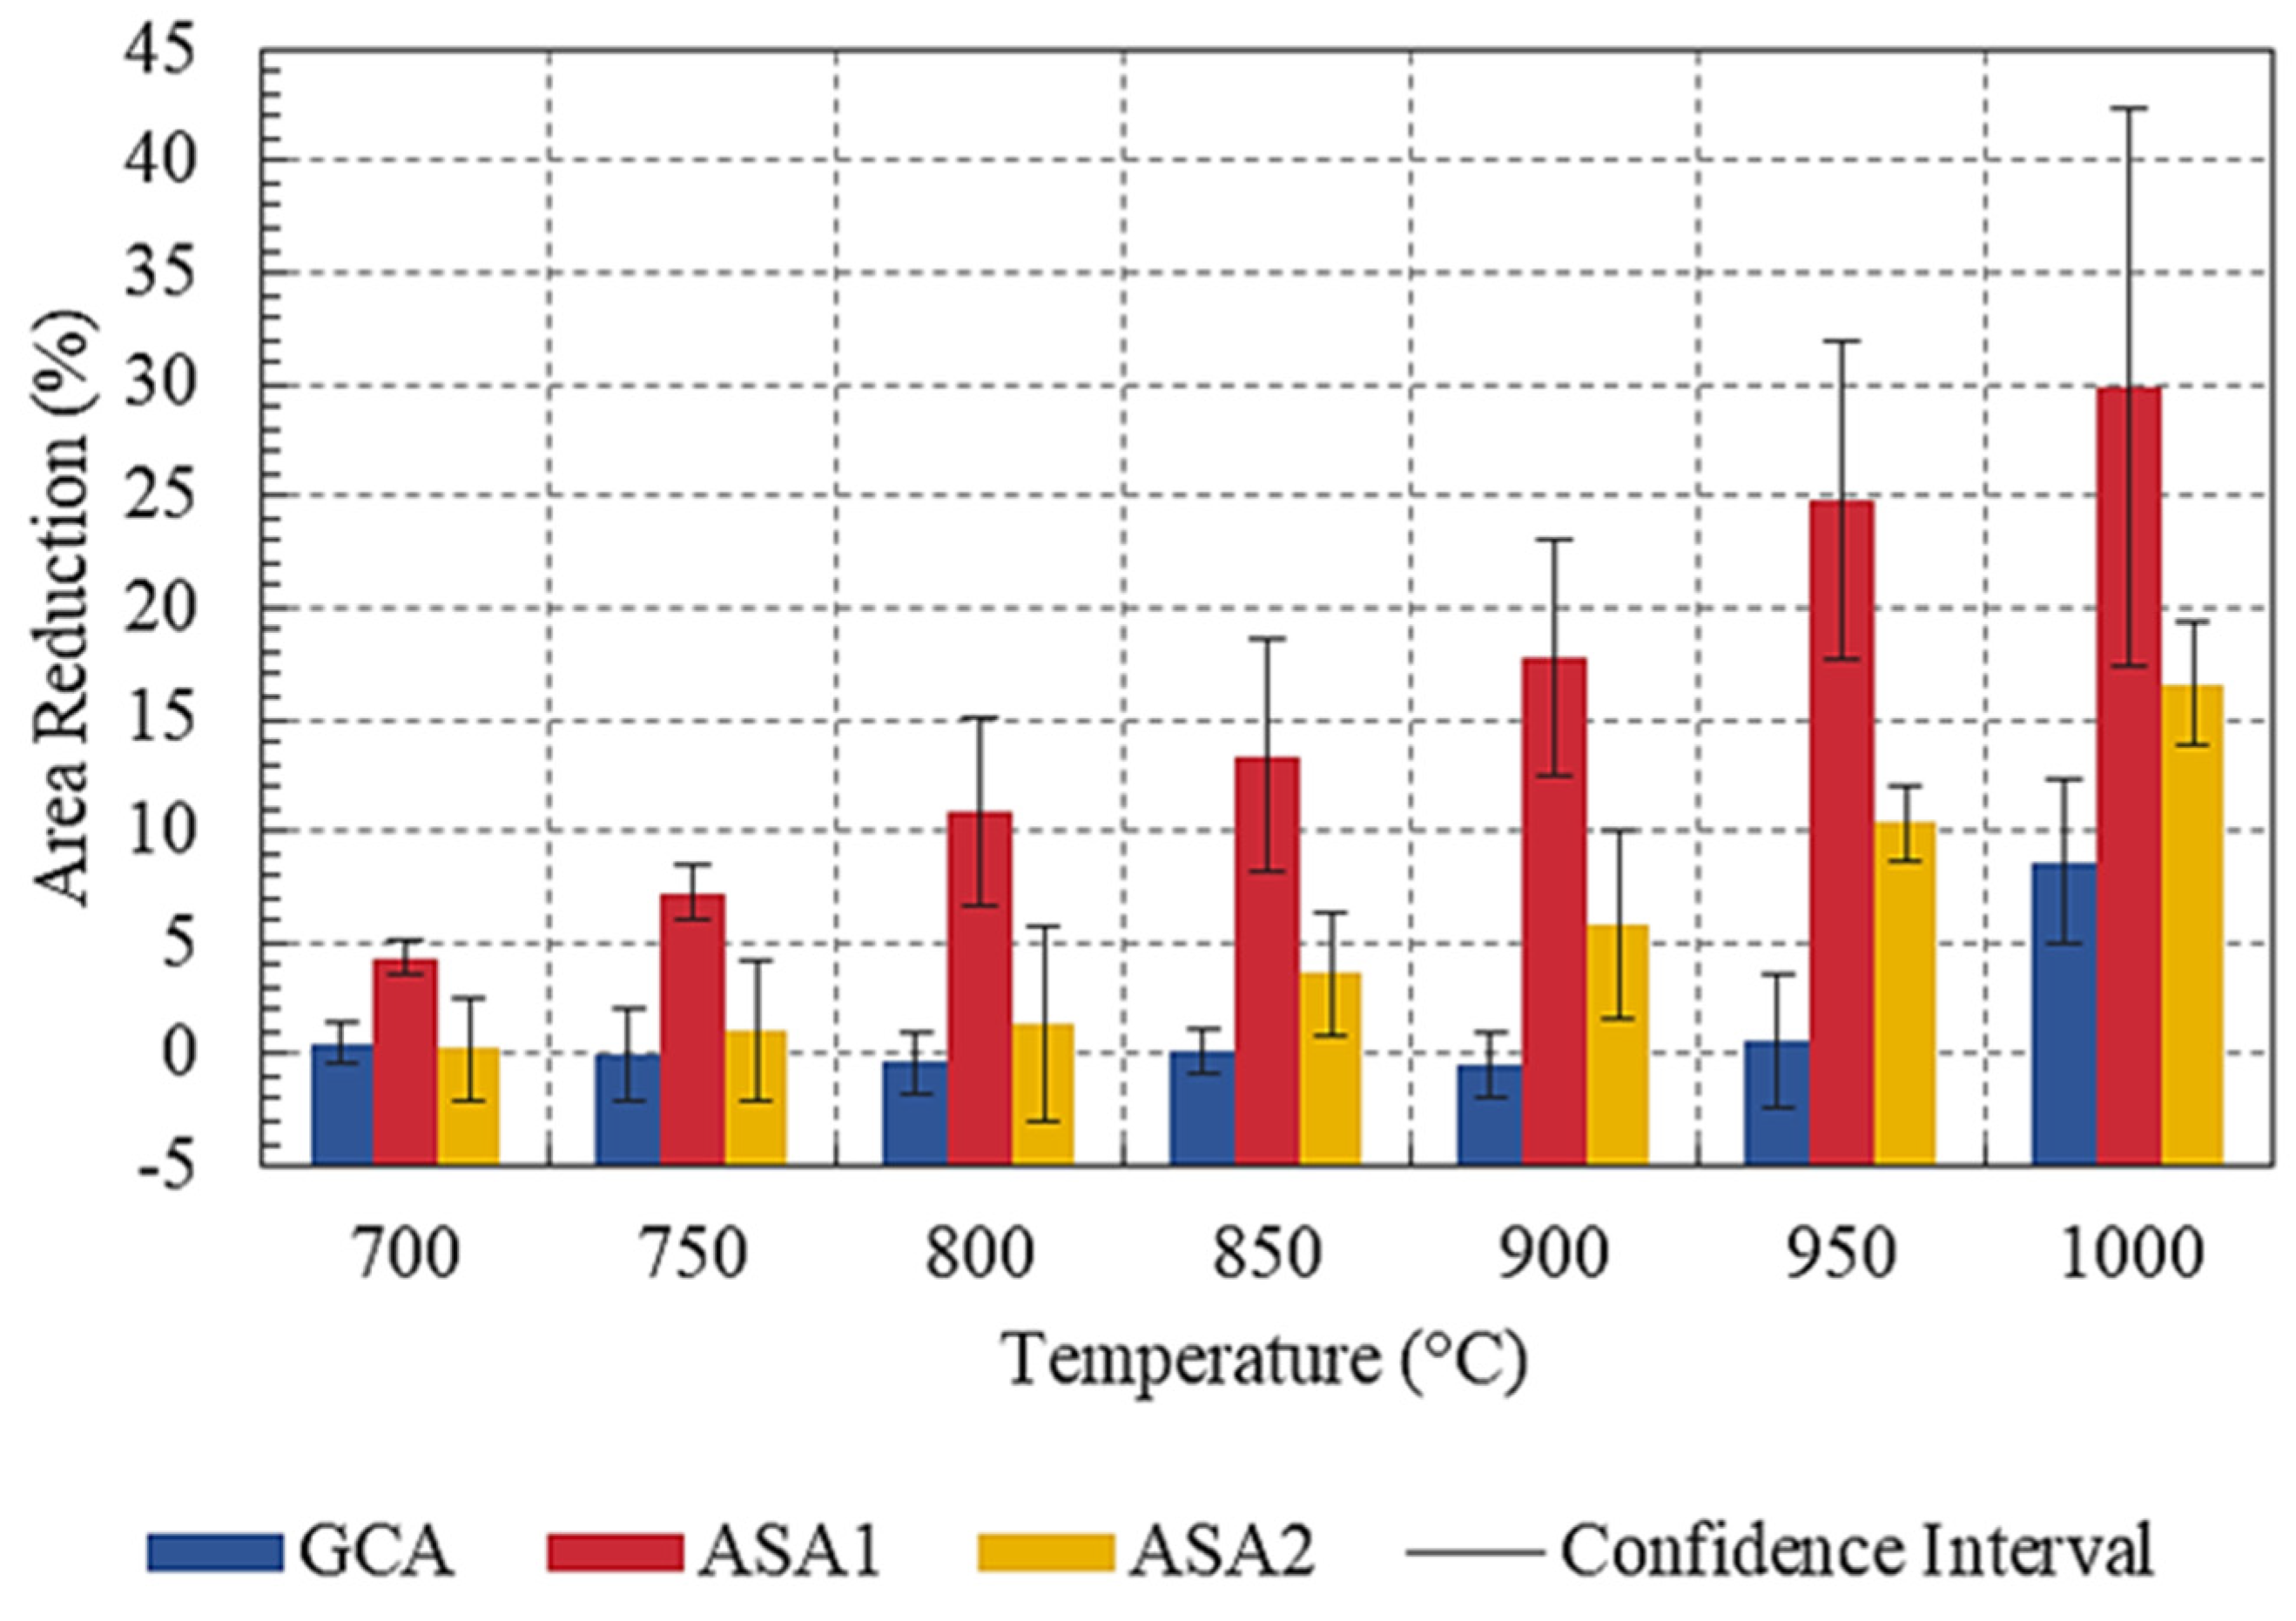
3.2. Sintering Analysis by Area Reduction

Figure 6, Figure 7 and Figure 8 illustrate the ash area reduction for all fuels as a function of temperature. Glencore coal ash (GCA), Figure 6, showed no signs of cracking or detachment from the crucible wall between 700 °C and 900 °C. At 950 °C, slight signs of reduction were detected; however, only at 1000 °C was a detachment of the crucible wall observed, with a significant average area reduction of 8.6 ± 3.6%.
The fiber seed ash (ASA1), shown in Figure 7, exhibits detachment from the crucible wall at 700 °C, with an average reduction of 4.3 ± 0.8%. A severe reduction was observed at 800 °C with 10.9 ± 4.2%. At 1000 °C, the reduction became more intense, reaching a value of 29.9 ± 12.5%.
The fiber-free seed ash (ASA2), shown in Figure 8, has slight signs of reduction only at 850 °C with an area reduction of 3.6 ± 2.9%. At 950 °C, the signs became more intense with a reduction of 10.3 ± 1.6% and reaching 16.6 ± 2.5% at 1000 °C. The samples show an irregular reduction compared to ASA1.
Figure 9 shows the ash area reduction graph for all fuels with a 95% confidence interval, and Table 3 presents the average values of area reduction for all ash samples along their respective confidence intervals. The sintering temperature is identified where an area reduction occurs significantly. As observed, coal ash (GCA) has the lowest area reduction values compared to the açai seed ashes. A significant reduction of 8.6 ± 3.6% was observed only at 1000 °C, while at the temperatures below 1000 °C, the variations were close to zero.
Fiber seed ash (ASA1) showed the highest reduction values, starting at 700 °C with 4.3 ± 0.8%. Despite great variation within the interval after 700 °C, the results allowed for observation of the sample’s behavior with a severe sintering process. The fiber-free seed ash (ASA2) showed a significant reduction only at 850 °C, with 3.6 ± 2.8%, but less intense than that of fiber seed ash (ASA1).
Table 4 shows the range of values for deviation, confidence interval, and the uncertainty for the measured area data set obtained from captured images of each sample. The standard deviation and the confidence interval show lower values, which allows us to understand that the measured area is homogenous with very close results for all samples. However, the uncertainty was higher, which may be related to systematic errors in the tools used for measurement: millimeter paper, photo quality, and the ImageJ software (version 1.53 K). These errors tend to propagate during the calculation of area reduction.

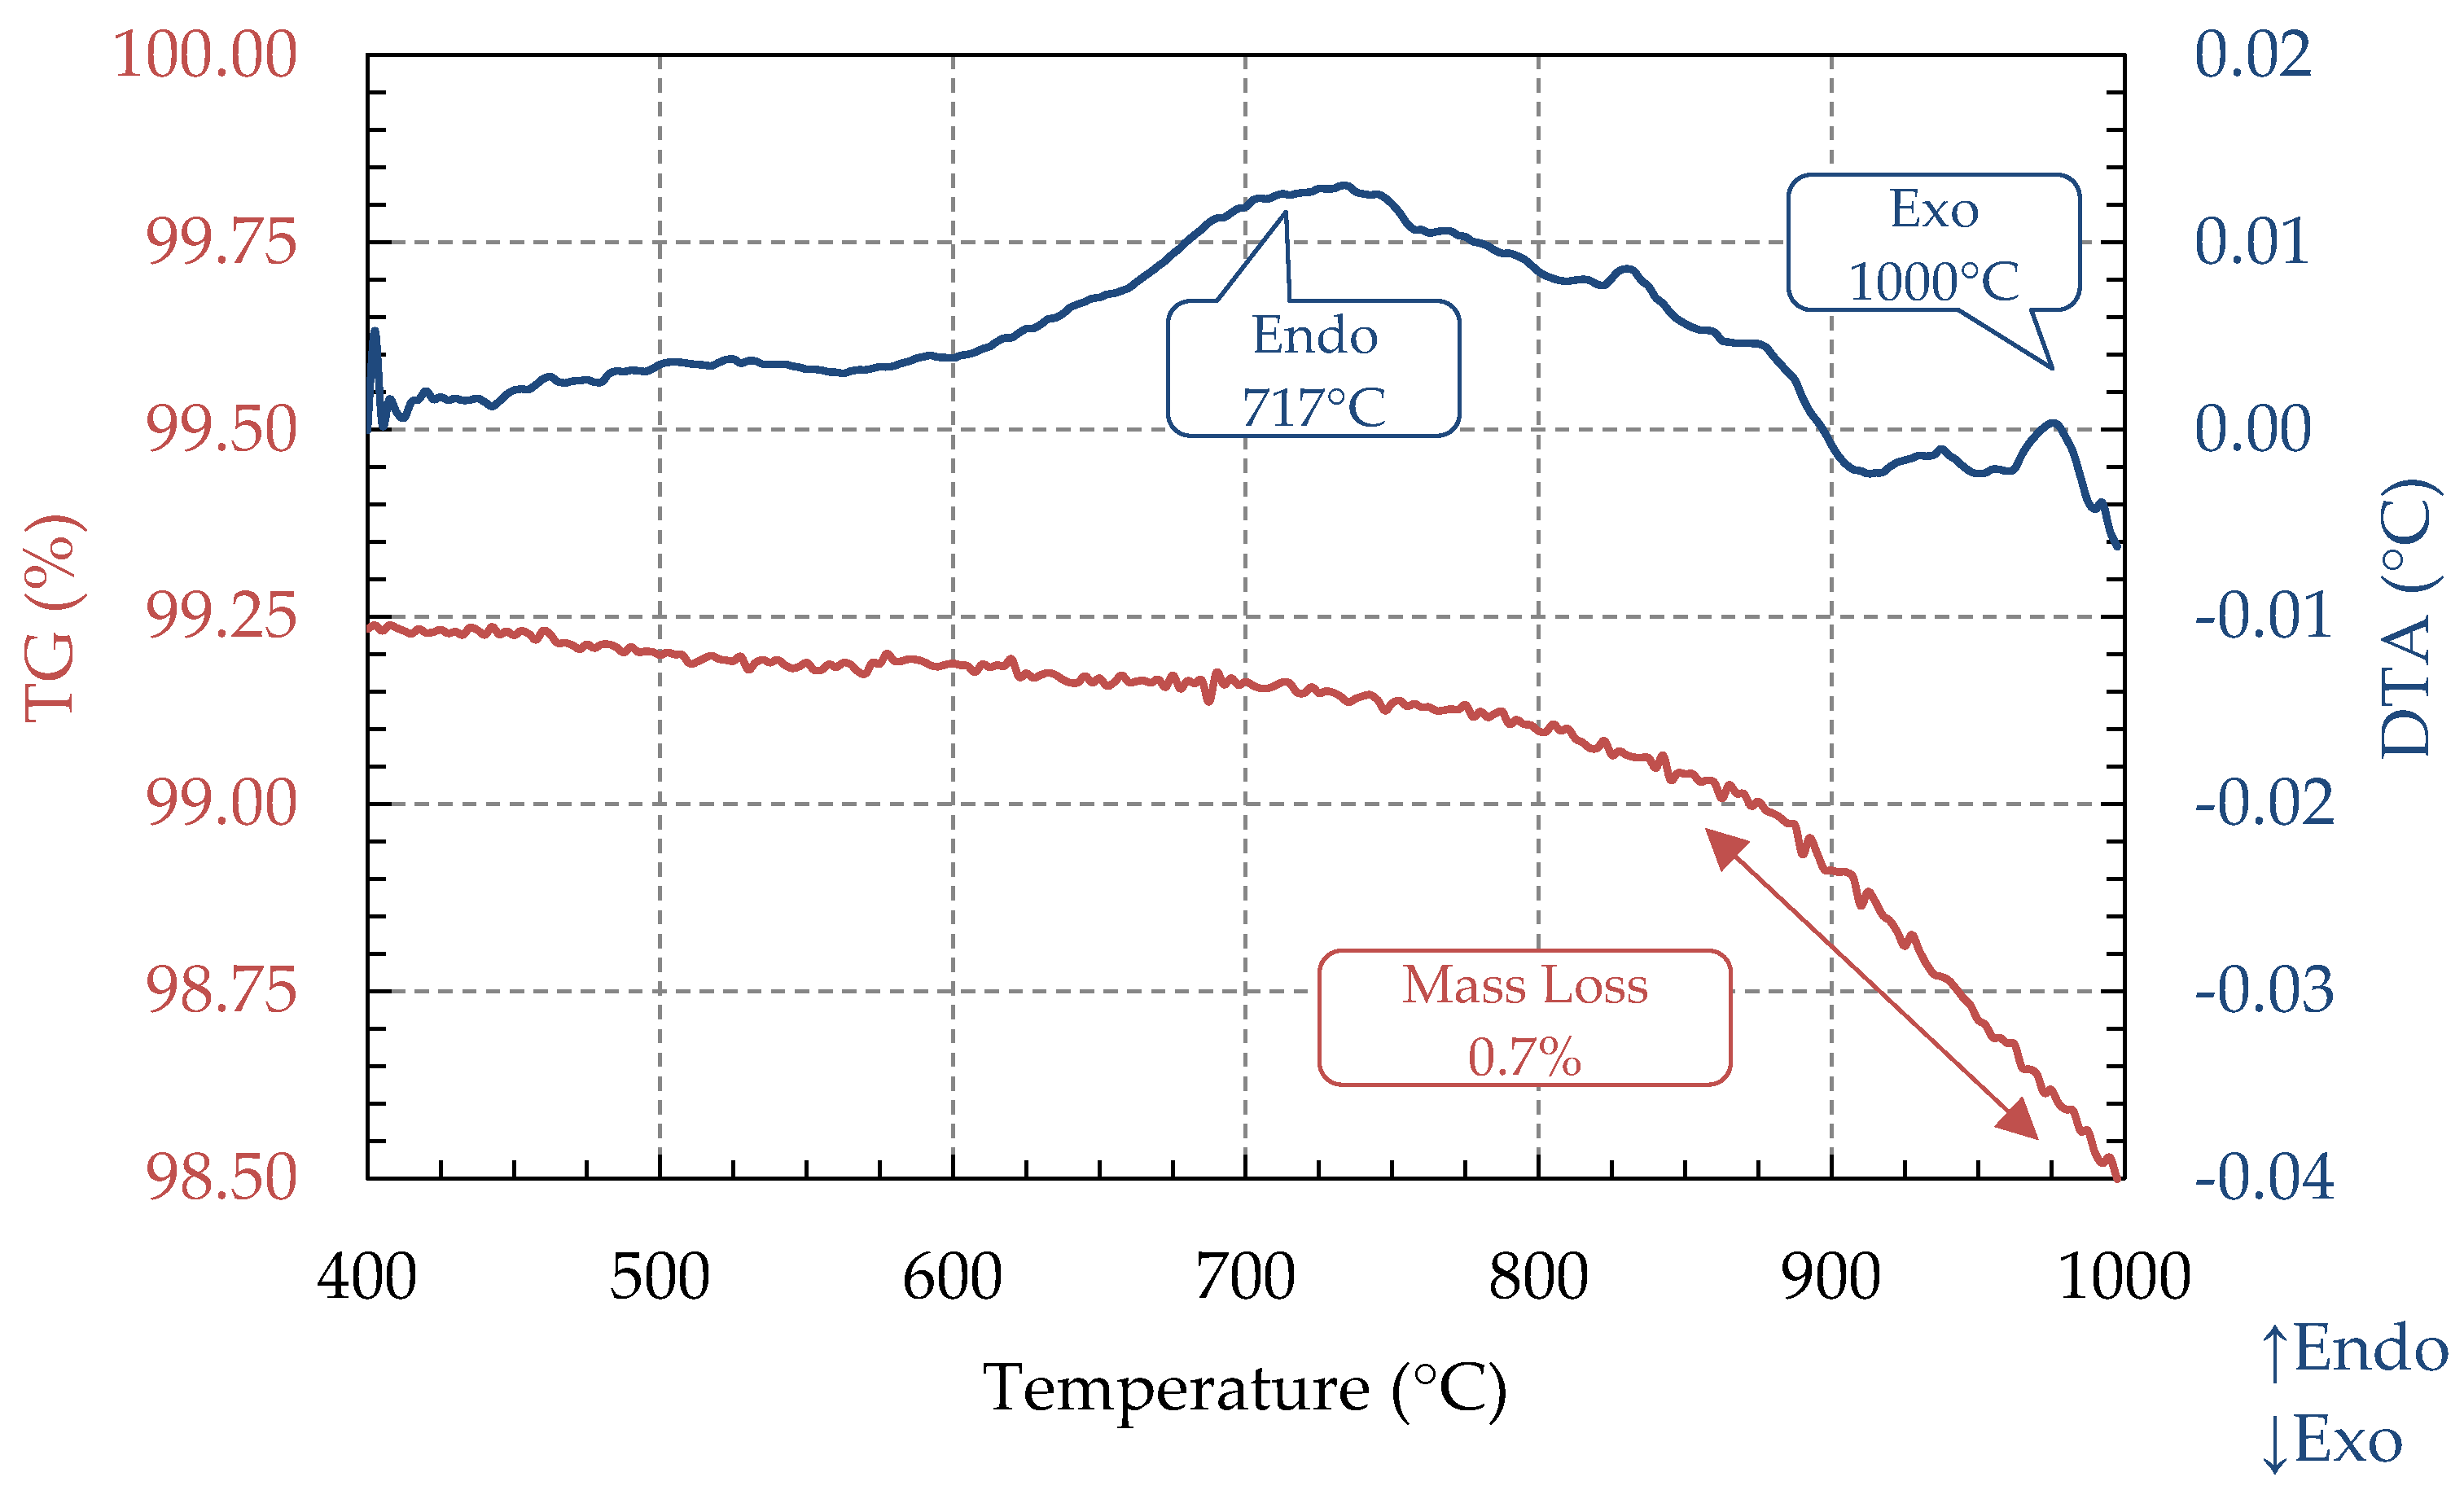
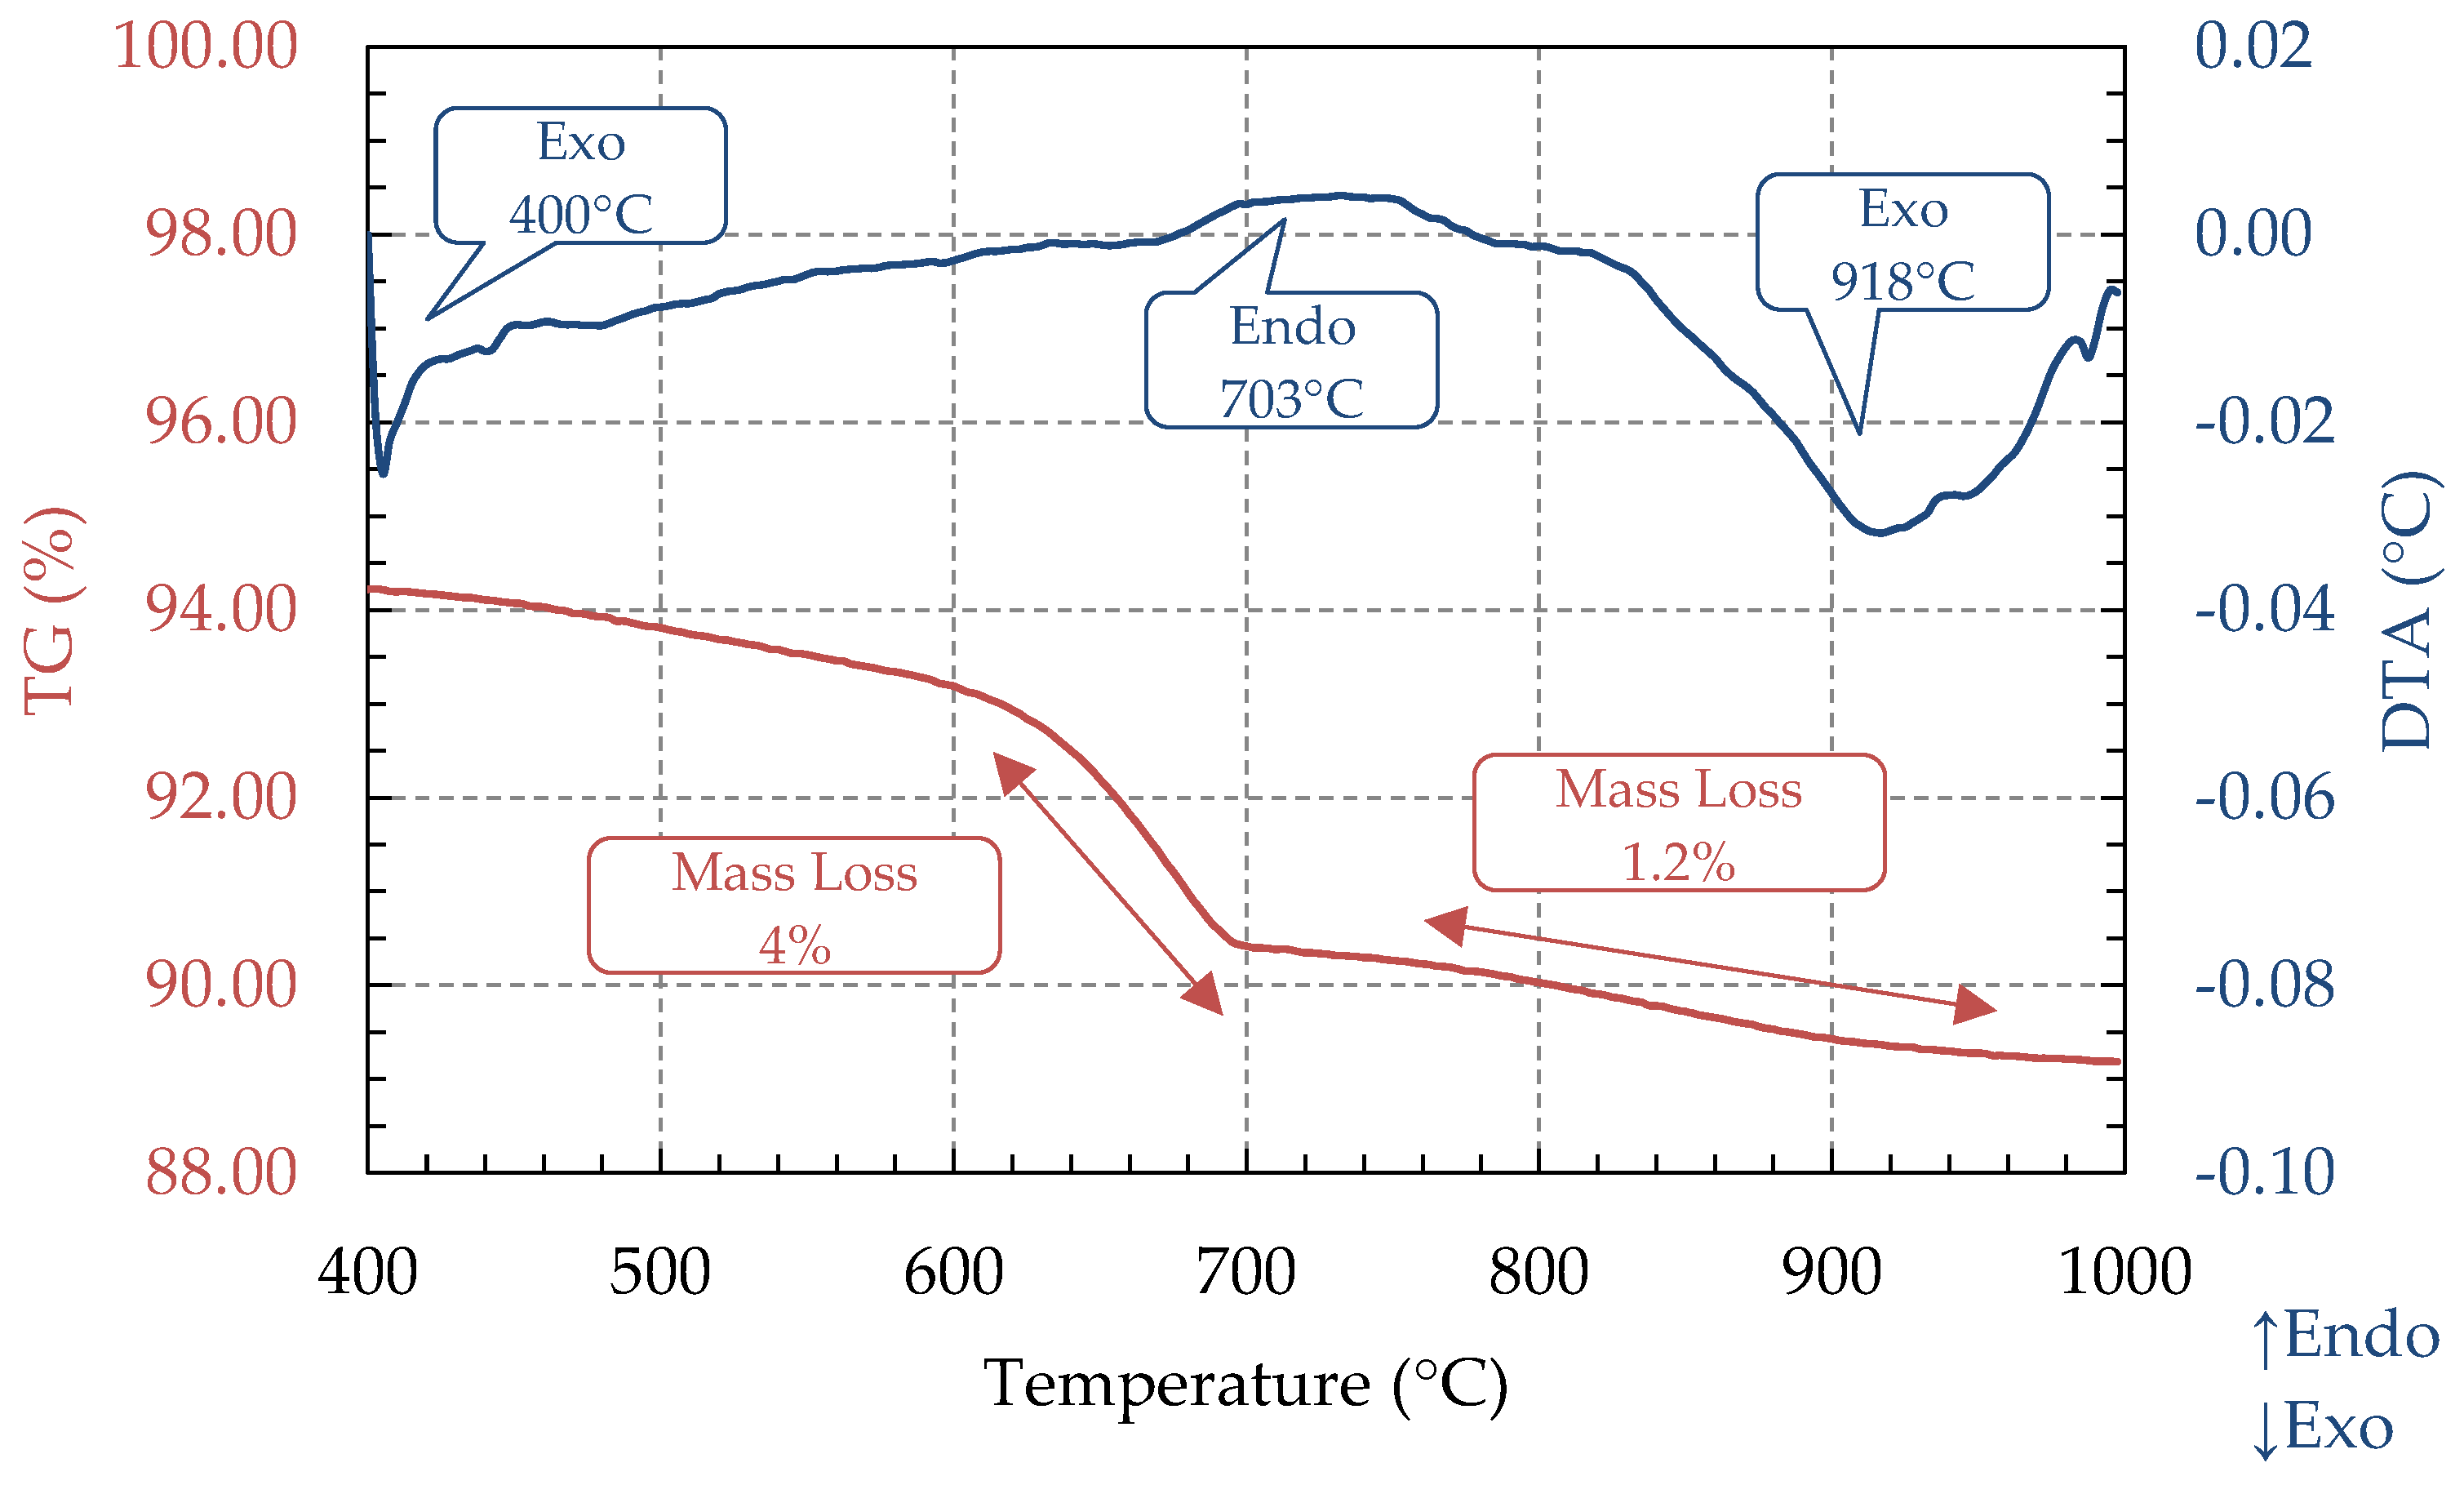
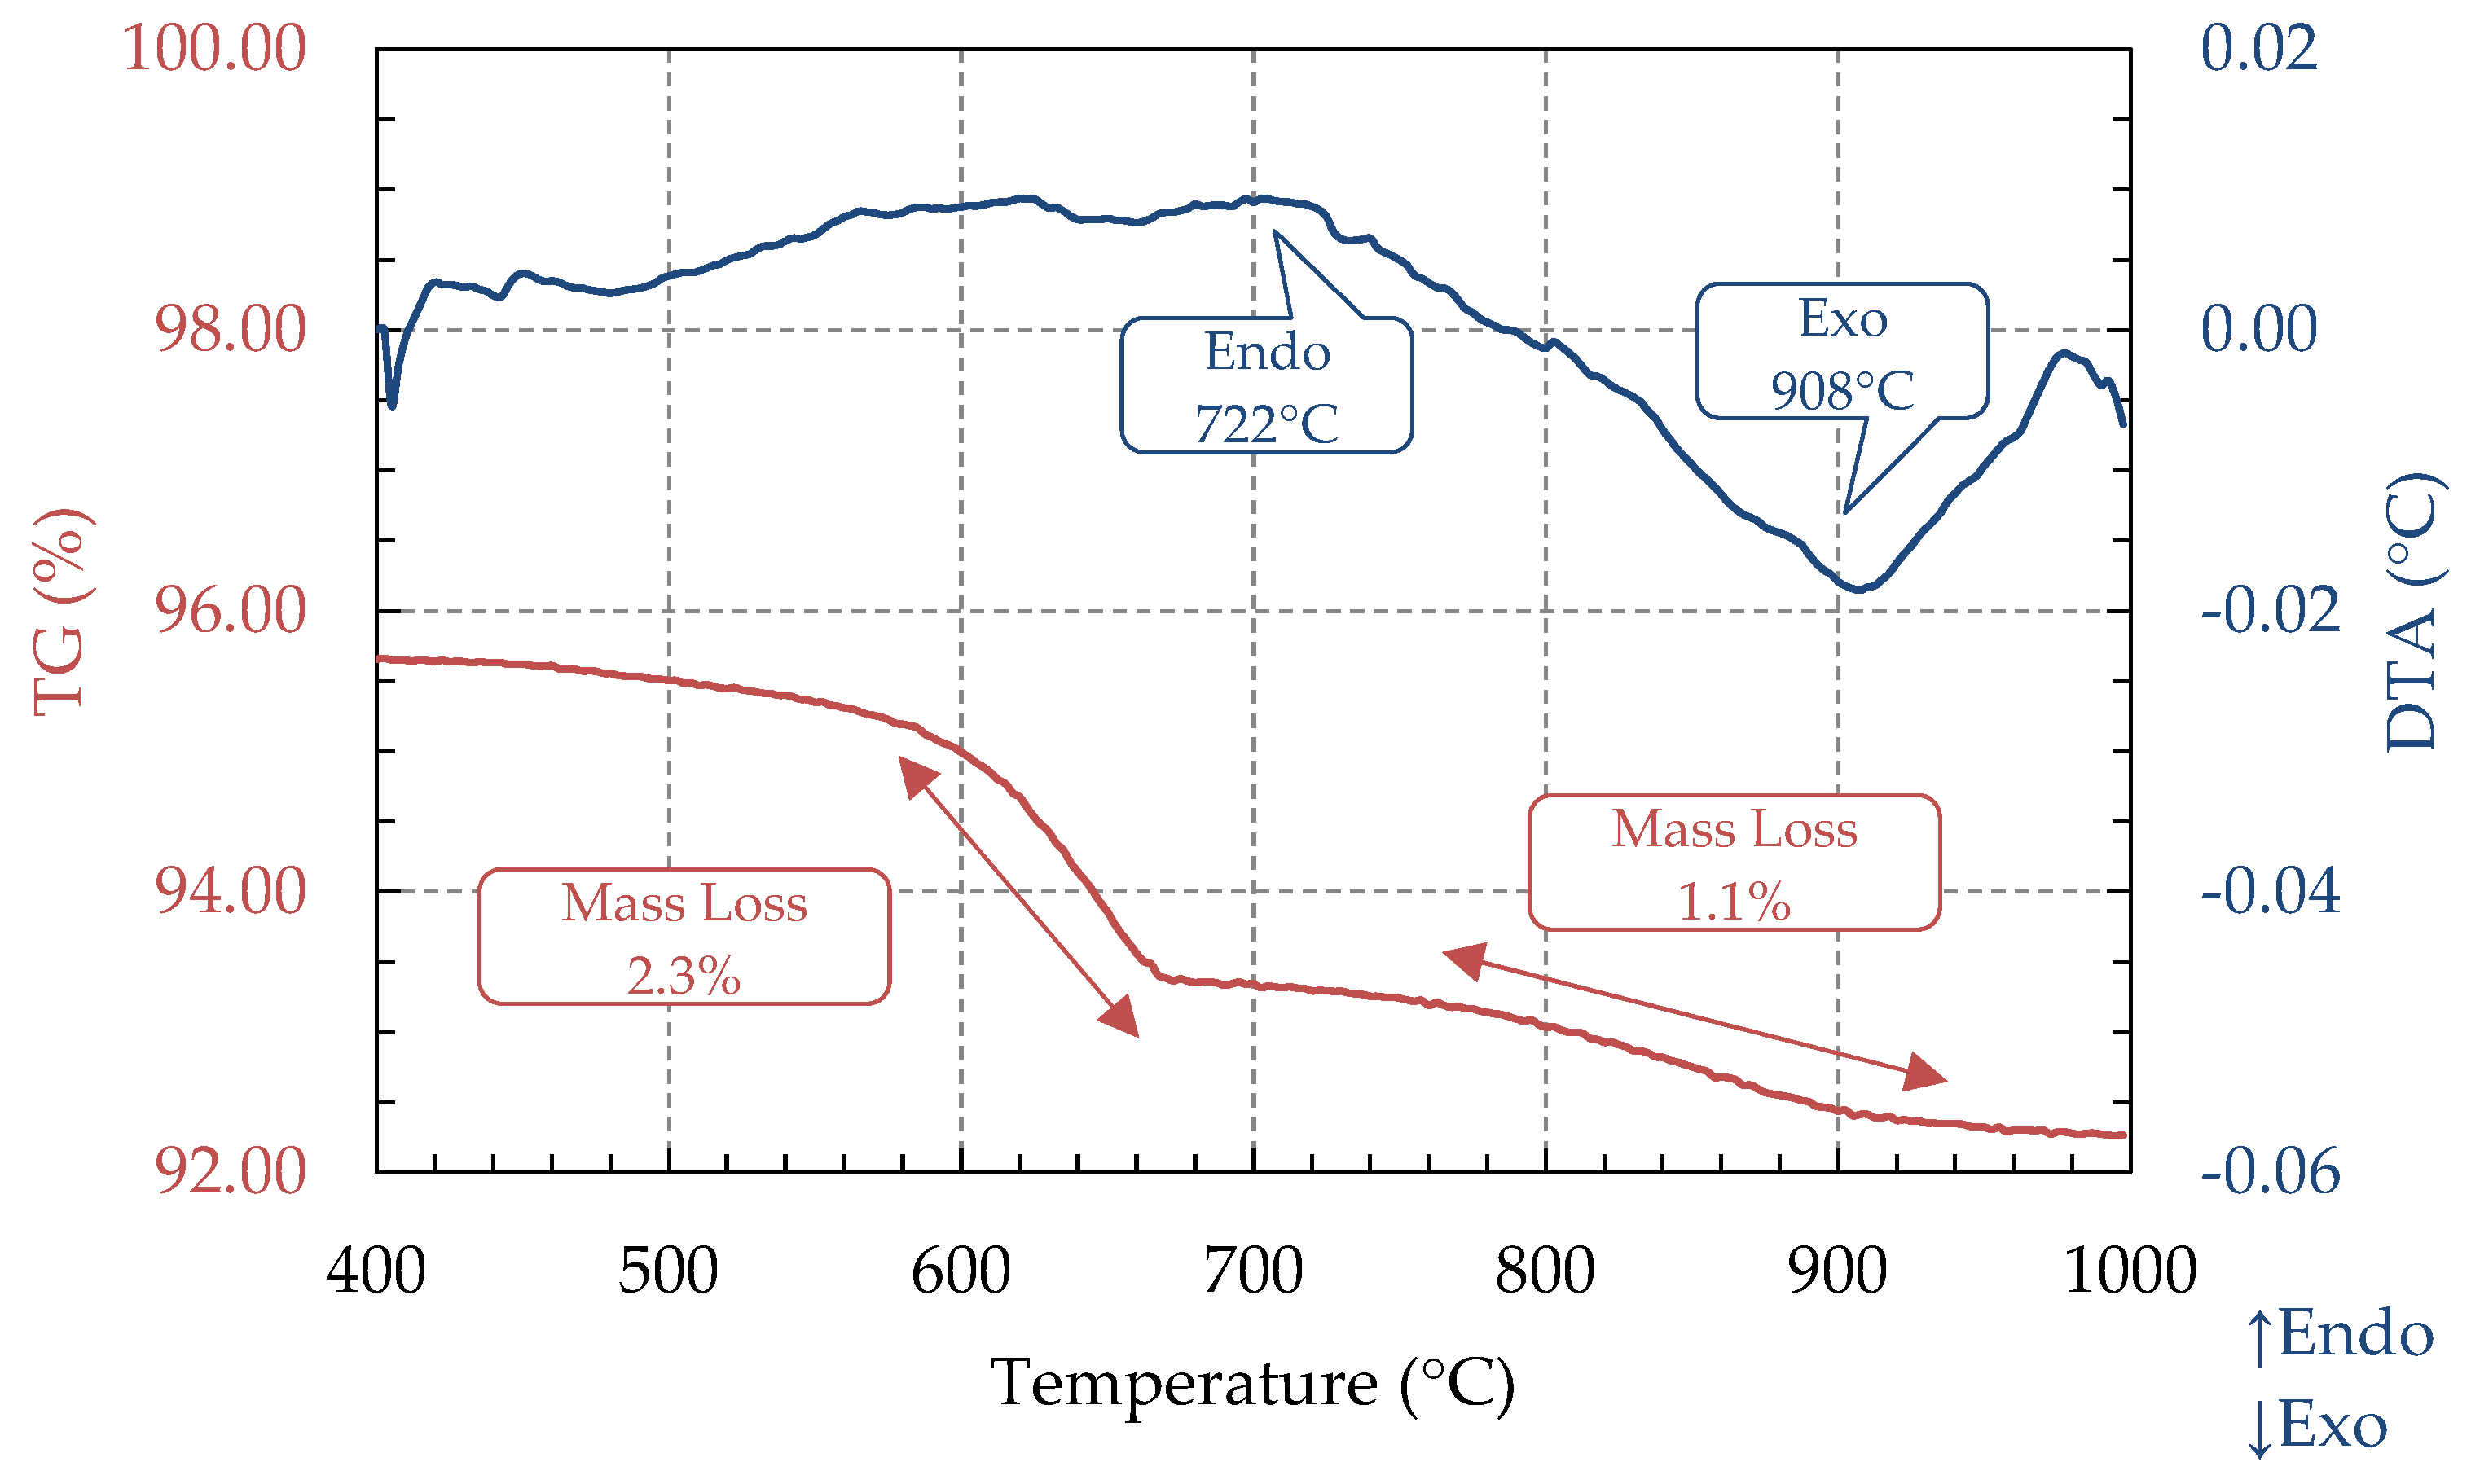
3.3. TG and DTA Analysis (STA)

The TG and DTA graphs have identified the temperatures at which mass loss, and endothermic and exothermic reactions exist. The TG for coal ash (GCA), shown in Figure 10, displayed a mass loss of 0.7% in the range of 862 °C to 1000 °C. DTA showed an endothermic peak around 717 °C. The exothermic peak may happen above 1000 °C; however, due to the equipment temperature limit, it was not possible to proceed with the analysis above this temperature.
The TG graph for açai seed ashes identified two regions of mass loss. For the fiber seed ash (ASA1), shown in Figure 11, the first mass loss occurred in the range of 627 °C to 693 °C with a mass loss of 4%. The second mass loss occurred in the range of 773 °C to 920 °C with a mass loss of 1.2%. The DTA graph indicated two exothermic peaks and one endothermic peak. The first exothermic occurred at around 400 °C, and the second occurred at around 918 °C. The endothermic peak occurs at around 703 °C.
For fiber-free seed ash, shown in Figure 12, the first mass loss occurred in the range of 599 °C to 666 °C with a mass loss of 2.3%. The second mass loss occurred in the range of 785 °C to 912 °C with a mass loss of 1.1%. The DTA graph indicated one endothermic peak at 722 °C and one exothermic peak at 908 °C. No exothermic peak was detected around 400 °C for ASA2, which was the main difference between the two açai seed ashes. Both seed ashes showed a similar behavior, especially for mass loss reaction.

4. Discussion

The coal ash sample (GCA) showed a typical composition for this kind of material, with low concentrations of species that reduce the melting temperature, such as K2O and Na2O, and a high content of species that raise the melting temperature, SiO2, and Al2O3. The sintering analysis revealed an area reduction of 8.6 ± 3.6% at 1000 °C. The exothermic peak in Figure 10 identified around 1000 °C could be related to mineral phase changes present in coal ashes, such as the crystallization of amorphous silicon [28]. This indicates that the sintering process starts around 1000 °C.
Bituminous coal ashes have a higher melting temperature with IDT above 1200 °C [14,31,32,48]. The sintering analysis results obtained in this work agree with those from Kim et al. [31], who found that for Glencore coal ash, T25, through TMA, was approximately 1000 °C. The TG graph for GCA indicates a slight mass loss of 0.7% above 862 °C. This mass loss matches with the endothermic peak around 700 °C and may be related to the decomposition of anhydrite (CaSO4), a phase normally present in this type of material whose decomposition occurs next to 1000 °C, resulting in the release of SO2 and SO3 [37,44,49,50].
The TG for açai seed ashes shows two regions with mass loss, as seen in Figure 11 and Figure 12. The first region, between 600 °C and 700 °C, can be associated with the combustion of residual carbon [28]. The endothermic peak near 700 °C may indicate the melting process of potassium compounds around this temperature [22,25]. This highlights the hypothesis that fiber seed ash (ASA1) started the sintering process after 700 °C, as confirmed by sintering analysis, with an area reduction of 4.3 ± 0.8%. Sintering analysis for the fiber-free seed ash (ASA2) suggested that the sintering process began at 850 °C with an area reduction of 3.6 ± 2.8%, following the endothermic peak around 722 °C.
The açai seed ashes contained a high concentration of K2O and SiO2, which is recognized as having the potential to react to form potassium silicates with a low melting temperature [22,51]. The main difference between the seed ashes was the SiO2 content, which is 41% for ASA1 and 16% for ASA2. Öhman et al. [52] commented that high silicon concentrations can increase the tendency to form phases with a low melting temperature, thus increasing the formation of slag and the start of the sintering process. These results corroborate the hypothesis that fiber seed ash has lower sintering and melting temperatures compared to fiber-free seed ash, as ASA1 has a higher concentration of SiO2 than ASA2.
The sintering behavior observed in Figure 9 supports the understanding that ASA1 has a significant area reduction when compared with ASA2. Studies [26,27,31,37] that evaluate the sintering process for coal and biomass ashes conclude that the beginning of sintering occurs at temperatures below the standard method of AFT. Agriculture biomass residues with similar contents of SiO2 and K2O from açai fiber seed, contain the following TS (Sintering Temperature) values: corn straw (650 °C) and rice straw (651 °C) [26]. The fiber seed ash starts the sintering process at around 700 °C, while the ASA2 starts at around 850 °C.
Table 4 demonstrates our understanding of how the area measurement was significant for the sintering analysis. The deviation and the confidence interval for area measurement were very low, indicating that the area values were homogeneous. However, the uncertainty was very high, carrying systematic errors due to the tools used in this paper: millimeter paper, photo quality, and the ImageJ software (version 1.53 K). Besides the error carrying in the analysis, the area measurement provides good data for the estimation of the sintering behavior of the ash samples.

5. Conclusions

The first law of thermodynamics defines the melting process as an endothermic event. In the case of ashes, preceding the melting process, a solid crystalline reorganization must occur to produce species that melt at local temperature. This crystalline reorganization follows the first mass loss peak, producing different species with varying specific heat capacities and with different sintering temperatures. STA provides information about the lower limit where the sintering process begins, and the sintering methodology identifies the temperature value where it happens.
Only at high temperatures does bituminous coal ash (GCA) show significant reactivity in terms of sintering and mass loss. The sintering analysis data indicated that the start of the process occurs at around 1000 °C, similar to that presented in other research on the same material and for other studies on coal ashes.
Açai seed ashes show significant reactivity at low temperatures. The fiber seed ash (ASA1) showed an indication of sintering at 700 °C, just after the first mass loss, and near the endothermic peak. The fiber-free seed ash (ASA2) began sintering at 850 °C, after the first mass loss and the endothermic peak, but the signs of mass loss and endothermic reaction were identified at around 700 °C. The hypothesis to justify the large distance between sintering temperature and endothermic temperature for ASA2 compared to ASA1 is the high content of SiO2 for the fiber seed ash, in which the presence of high contents of K2O can lead to the formation of potassium silicates with a low melting temperature. However, further studies are needed for the fiber-free seed ash to better understand its chemical behavior in terms of the sintering and melting process.
In the context of fluidized bed boilers, the typical range for bed temperature is 700–900 °C; therefore, caution must be taken for the application of açai seeds once the start of their sintering process is in the same range: 700 °C for ASA1 and 850 °C for ASA2. The intense mass loss observed in the TG graphs (Figure 10, Figure 11 and Figure 12) corroborates the occurrence of problems associated with the presence of potassium, especially in the presence of silica. A plausible alternative widespread in research to mitigate the sintering and melting of açai seed ashes is the use of limestone (CaCO3). In addition to the benefit of reducing sulfur dioxide emissions, limestone can help minimize sintering, contributing to a more efficient application of biomass fuels in co-combustion with coal.
The data obtained in this paper by sintering analysis and simultaneous thermal analysis allow us to better understand the sintering and melting behavior of açai seed and coal ashes. The high uncertainty in the area reduction measurement highlights a necessity to improve the tools for area estimation; however, the methodology provided good data to understand the sintering behavior. The proposed sintering analysis methodology applied in this work provides the identification of the sintering process starts for fuel ashes in a practical and precise way in the absence of the use of more complex and sophisticated methodologies.

Author Contributions

G.C.P.S., J.V.R.M., F.H.B.S. and A.N.C. performed laboratory analysis, namely, ultimate, proximate, calorimetric, thermogravimetric, density and size analysis. Conceptualization and methodology: D.R.S.G. and M.F.M.N.; formal analysis, investigation, resources and data curation: G.C.P.S., J.V.R.M., F.H.B.S., D.R.S.G., M.F.M.N. and L.A.C.T.; writing—original draft preparation, writing—review and editing, visualization: G.C.P.S., J.V.R.M., F.H.B.S., D.R.S.G., M.F.M.N. and L.A.C.T.; supervision: M.F.M.N. and D.R.S.G.; project administration: M.F.M.N. All authors have read and agreed to the published version of the manuscript.

Funding

This work received funding support from Norsky Hydro, Brazil, within the scope of the project “Estudo logístico e energético para combustão de caroço de açai” (UFPA 036046/2021—HYDRO TAC-01 4600009900). Fundação Amazônia de Amparo a Estudos e Pesquisa—FAPESPA sponsored scholarships for G.C.P.S., and F.H.B.S. through UFPA/PPGEM. Coordenação de Aperfeiçoamento de Pessoal de Nível Superior—Brazil (CAPES) sponsored scholarships for J.V.R.M. through UFPA/PPGEM. Thanks are due to Portuguese Foundation for Science and Technology (FCT), Portugal, for the financial support to UID Centro de Estudos do Ambiente e Mar (CESAM) + LA/P/0094/2020, through national funds.

Data Availability Statement

Data available on request because of project policies.

Acknowledgments

Thanks to the Graduate Program in Mechanical Engineering-PPGEM at UFPA.

Conflicts of Interest

The authors declare no conflicts of interest.

References

  1. Sharma, V.; Sharma, R.K. Fluidized Bed Combustion: Technology for Efficient Utilization of Biomass Residues. Asian J. Eng. Appl. Technol. 2018, 7, 73–79. [Google Scholar] [CrossRef]
  2. Iannello, S.; Morrin, S.; Materazzi, M. Fluidized bed reactors for the thermochemical conversion of biomass and waste. KONA Powder Part. J. 2020, 37, 114–131. [Google Scholar] [CrossRef]
  3. Basu, P. Combustion and Gasification in Fluidized Bed, 1st ed.; CRC Press: Boca Raton, FL, USA; Taylor & Francis Group: Boca Raton, FL, USA, 2006; 466p. [Google Scholar]
  4. Liu, Q.; Zhong, W.; Yu, A.; Wang, C.H. Co-firing of coal and biomass under pressurized oxy-fuel combustion mode in a 10 kW fluidized bed: Nitrogen and sulfur pollutants. Chem. Eng. J. 2022, 450, 138401. [Google Scholar] [CrossRef]
  5. Bannon, D.; Deza, M.; Masoumi, M.; Estejab, B. Assessment of Irregular Biomass Particles Fluidization in Bubbling Fluidized Beds. Energies 2023, 16, 2051. [Google Scholar] [CrossRef]
  6. IBGE Brazilian Institute of Geography and Statistics (IBGE). Agricultural Production: Brazil and Federation Units. 2022. Available online: https://www.ibge.gov.br/explica/producao-agropecuaria/açaí-cultivo/br (accessed on 27 July 2024).
  7. Brasil. Centro de Tecnologia da Indústria Química e Têxtil do SENAI. Valorização de Resíduos da Indústria do Açaí: Oportunidades e Desafios; Centro de Tecnologia da Indústria Química e Têxtil do SENAI: Rio de Janeiro, Brazil, 2021; 14p. [Google Scholar]
  8. Soares, G.C.P.; Moreira, J.V.R.; Santos, F.H.B.; Guerra, D.R.S.; Nogueira, M.F.M. Combustion Process of Coal–Açai Seed Mixtures in a Circulating Fluidized Bed Boiler. Energies 2024, 17, 4635. [Google Scholar] [CrossRef]
  9. Moreira, J.; Carneiro, A.; Oliveira, D.; Santos, F.; Guerra, D.; Nogueira, M.; Rocha, H.; Charvet, F.; Tarelho, L. Thermochemical Properties for Valorization of Amazonian Biomass as Fuel. Energies 2022, 15, 7343. [Google Scholar] [CrossRef]
  10. Rosendahl, L. Biomass Combustion Science, Technology and Engineering; Woodhead Publishing: Sawston, UK, 2013; 315p. [Google Scholar]
  11. Furuvik, N.C.I.S.; Jaiswal, R.; Thapa, R.K.; Moldestad, B.M.E. CPFD model for prediction of flow behavior in an agglomerated fluidized bed gasifier. Int. J. Energy Prod. Manag. 2019, 4, 105–114. [Google Scholar] [CrossRef]
  12. Rojek, J.; Nosewicz, S.; Maździarz, M.; Kowalczyk, P.; Wawrzyk, K.; Lumelskyj, D. Modeling of a Sintering Process at Various Scales. Procedia Eng. 2017, 177, 263–270. [Google Scholar] [CrossRef]
  13. Wang, Y.; Shao, Y.; Matovic, M.D.; Whalen, J.K. Exploring switchgrass and hardwood combustion on excess air and ash fouling/slagging potential: Laboratory combustion test and thermogravimetric kinetic analysis. Energy Convers. Manag. 2015, 97, 409–419. [Google Scholar] [CrossRef]
  14. Teixeira, P.; Lopes, H.; Gulyurtlu, I.; Lapa, N.; Abelha, P. Evaluation of slagging and fouling tendency during biomass co-firing with coal in a fluidized bed. Biomass-Bioenergy 2012, 39, 192–203. [Google Scholar] [CrossRef]
  15. Loo, S.V. The Handbook of Biomass Combustion and Co-Firing; Earthscan: Oxford, UK, 2008; 465p. [Google Scholar]
  16. Ruiz, I.S. Chapter 4: Coal Combustion. In Applied Coal Petrology: The Role Petrology in Coal Utilization; Academic Press: Cambridge, MA, USA, 2008; pp. 85–117. [Google Scholar]
  17. Vega-Nieva, D.J. Slagging and Fouling Risks Derived from the Combustion of Solid Biofuels. WIT Trans. State-Art Sci. Eng. 2015, 85, 137–147. [Google Scholar] [CrossRef]
  18. Lu, D.Y.; Tan, Y.; Duchesne, M.A.; McCalden, D. Potassium capture by ilmenite ore as the bed material during fluidized bed conversion. Fuel 2023, 335, 127008. [Google Scholar] [CrossRef]
  19. Steenari, B.-M.; Lundberg, A.; Pettersson, H.; Wilewska-Bien, M.; Andersson, D. Investigation of ash sintering during combustion of agricultural residues and the effect of additives. Energy Fuels 2009, 23, 5655–5662. [Google Scholar] [CrossRef]
  20. Werther, J.; Saenger, M.; Hartge, E.-U.; Ogada, T.; Siagi, Z. Combustion of agricultural residues. Prog. Energy Combust. Sci. 2000, 26, 1–27. [Google Scholar] [CrossRef]
  21. Llorente, M.J.F.; Arocas, P.D.; Nebot, L.G.; García, J.E.C. The effect of the addition of chemical materials on the sintering of biomass ash. Fuel 2008, 87, 2651–2658. [Google Scholar] [CrossRef]
  22. Contreras-Trejo, J.C.; Vega-Nieva, D.J.; Heya, M.N.; Prieto-Ruíz, J.A.; Nava-Berúmen, C.A.; Carrillo-Parra, A. Sintering and Fusibility Risks of Pellet Ash from Different Sources at Different Combustion Temperatures. Energies 2022, 15, 5026. [Google Scholar] [CrossRef]
  23. Llorente, M.F.; Cuadrado, R.E.; Laplaza, J.M.; García, J.C. Combustion in bubbling fluidized bed with bed material of limestone to reduce the biomass ash agglomeration and sintering. Fuel 2006, 85, 2081–2092. [Google Scholar] [CrossRef]
  24. Du, S.; Yang, H.; Qian, K.; Wang, X.; Chen, H. Fusion and transformation properties of the inorganic components in biomass ash. Fuel 2014, 117, 1281–1287. [Google Scholar] [CrossRef]
  25. Rizvi, T.; Xing, P.; Pourkashanian, M.; Darvell, L.I.; Jones, J.M.; Nimmo, W. Prediction of biomass ash fusion behavior by the use of detailed characterization methods coupled with thermodynamic analysis. Fuel 2015, 141, 275–284. [Google Scholar] [CrossRef]
  26. Yan, T.; Kong, L.; Bai, J.; Bai, Z.; Li, W. Thermomechanical analysis of coal ash fusion behavior. Chem. Eng. Sci. 2016, 147, 74–82. [Google Scholar] [CrossRef]
  27. Ma, T.; Fan, C.; Hao, L.; Li, S.; Song, W.; Lin, W. Fusion characterization of biomass ash. Thermochim. Acta 2016, 638, 1–9. [Google Scholar] [CrossRef]
  28. Link, S.; Yrjas, P.; Lindberg, D.; Trikkel, A.; Mikli, V. Ash melting behavior of reed and woody fuels blends. Fuel 2022, 314, 123051. [Google Scholar] [CrossRef]
  29. Yongtie, C.; Wenming, Y.; Zhimin, Z.; Mingchen, X.; Boon, S.K.; Subbaiah, P. Modelling of ash deposition in biomass boilers: A review. Energy Procedia 2017, 143, 623–628. [Google Scholar] [CrossRef]
  30. Vassilev, S.V.; Baxter, D.; Vassileva, C.G. An overview of the behavior of biomass during combustion: Part II. Ash fusion and ash formation mechanisms of biomass types. Fuel 2014, 117, 152–183. [Google Scholar] [CrossRef]
  31. Kim, J.-H.; Kim, G.B.; Jeon, C.H. Prediction of correlation between ash fusion temperature of ASTM and Thermo-Mechanical Analysis. Appl. Therm. Eng. 2017, 125, 1291–1299. [Google Scholar] [CrossRef]
  32. Lv, Y.; Niu, Y.; Wang, G.; Xu, L.; Lei, Y.; Hui, S.; Wang, D. Experimental and kinetic studies on ash fusion behavior: A high-precision acquisition method for ash fusion temperatures. Asia-Pac. J. Chem. Eng. 2021, 16, e2644. [Google Scholar] [CrossRef]
  33. Cai, Y.; Tay, K.; Zheng, Z.; Yang, W.; Wang, H.; Zeng, G.; Li, Z.; Boon, S.K.; Subbaiah, P. Modeling of ash formation and deposition processes in coal and biomass fired boilers: A comprehensive review. Appl. Energy 2018, 230, 1447–1544. [Google Scholar] [CrossRef]
  34. Vyazovkin, S.; Koga, N.; Schick, C. Handbook of Thermal Analysis and Calorimetry: Recent Advances, Techniques and Applications; Elsevier: Amsterdam, The Netherlands, 2018; 860p. [Google Scholar]
  35. Wall, T.F.; Creelman, R.A.; Gupta, R.P.; Gupta, S.K.; Coin, C.; Lowe, A. Coal ash fusion temperatures-new characterization techniques, and implications for slagging and fouling. Prog. Energy Combust. Sci. 1998, 24, 345–353. [Google Scholar] [CrossRef]
  36. Gupta, S.K.; Gupta, R.P.; Bryant, G.W.; Juniper, L.; Wall, T.F. Thermomechanical Analysis and Alternative Ash Fusibility Temperatures; Springer: Berlin/Heidelberg, Germany, 1999. [Google Scholar]
  37. Zhang, L.; Wang, J.; Song, X.; Bai, Y.; Yao, M.; Yu, G. Influence of biomass ash additive on fusion characteristics of high-silicon-aluminum coal ash. Fuel 2020, 282, 118876. [Google Scholar] [CrossRef]
  38. ABNT NBR 16508; Matérias Primas para Fundição–Carvão Mineral–Método de Ensaio para Determinação do Teor de Umidade. Associação Brasileira de Normas Técnicas: Rio de Janeiro, Brasil, 2017.
  39. CEN/TS 14774-1; Methods for Determination of Moisture Content–Oven Dry Method–Part 1: Total Moisture–Reference Method. European Committee for Standardization: Brussels, Belgium, 2004.
  40. ABNT NBR 16586; Matérias Primas para Fundição–Carvão Mineral–Métodos para Determinação do Teor de Cinzas. Associação Brasileira de Normas Técnicas: Rio de Janeiro, Brasil, 2017.
  41. CEN/TS 14775; Methods for Determination of Ash Content. European Committee for Standardization: Brussels, Belgium, 2004.
  42. Arvelakis, S.; Jensen, P.A.; Dam-Johansen, K. Simultaneous Thermal Analysis (STA) on Ash from High-Alkali Biomass. Energy Fuels 2004, 18, 1066–1076. [Google Scholar] [CrossRef]
  43. Magdziarz, A.; Gajek, M.; Nowak-Woźny, D.; Wilk, M. Mineral phase transformation of biomass ashes—Experimental and thermochemical calculations. Renew. Energy 2018, 128, 446–459. [Google Scholar] [CrossRef]
  44. Kaniowski, W.; Taler, J.; Wang, X.; Kalemba-Rec, I.; Gajek, M.; Mlonka-Mędrala, A.; Nowak-Woźny, D.; Magdziarz, A. Investigation of biomass, RDF and coal ash-related problems: Impact on metallic heat exchanger surfaces of boilers. Fuel 2022, 326, 125122. [Google Scholar] [CrossRef]
  45. Li, R.; Wang, L.; Yang, T.; Raninger, B. Investigation of MSWI fly ash melting characteristic by DSC–DTA. Waste Manag. 2007, 27, 1383–1392. [Google Scholar] [CrossRef] [PubMed]
  46. Angel, J.D.M.; Vásquez, T.G.P.; Junkes, J.A.; Hotza, D. Caracterização de cinza obtida por combustão de casca de arroz em reator de leito fluidizado. Quimica Nova 2009, 32, 1110–1114. [Google Scholar] [CrossRef]
  47. ASTM D1857/D1857M–24; Standard Test Method for Fusibility of Coal and Coke Ash. ASTM International: West Conshohocken, PA, USA, 2024.
  48. Chai, Y.; Fan, Y.; Wu, J.; Zhang, Y.; Luo, G.; Wang, Y. Research on the Ash Melting Characteristics of Blended Coal Based on DFT Calculations. ACS Omega 2021, 6, 22039–22046. [Google Scholar] [CrossRef]
  49. Putra, H.P.; Kuswa, F.M.; Ghazidin, H.; Darmawan, A.; Prabowo; Hariana. Slagging-fouling evaluation of empty fruit bunch and palm oil frond mixture with bituminous ash coal as co-firing fuel. Bioresour. Technol. Rep. 2023, 22, 101489. [Google Scholar] [CrossRef]
  50. Li, F.; Yu, B.; Wang, G.; Fan, H.; Wang, T.; Guo, M.; Fang, Y. Investigation on improve ash fusion temperature (AFT) of low-AFT coal by biomass addition. Fuel Process. Technol. 2019, 191, 11–19. [Google Scholar] [CrossRef]
  51. Gilbe, C.; Öhman, M.; Lindström, E.; Boström, D.; Backman, R.; Samuelsson, R.; Burvall, J. Slagging characteristics during residential combustion of biomass pellets. Energy Fuels 2008, 22, 3536–3543. [Google Scholar] [CrossRef]
  52. Öhman, M.; Nordin, A.; Hedman, H.; Jirjis, R. Reasons for slagging during stemwood pellet combustion and some measures for prevention. Biomass-Bioenergy 2004, 27, 597–605. [Google Scholar] [CrossRef]
Figure 1. Fuel Samples: (A) bituminous coal, (B) seed with fiber, and (C) seed fiber-free.
Energies 18 01662 g001
Figure 2. Ash production process.
Energies 18 01662 g002
Figure 3. ASTM D1857 methodology changes.
Energies 18 01662 g003
Figure 4. Ash area reduction as a function of temperature.
Energies 18 01662 g004
Figure 5. Sintering analysis process.
Energies 18 01662 g005
Figure 6. Area reduction for Glencore coal ash (GCA).
Energies 18 01662 g006
Figure 7. Area reduction for açai seed ash with fiber (ASA1).
Energies 18 01662 g007
Figure 8. Area reduction for açai seed ash without fiber (ASA2).
Energies 18 01662 g008
Figure 9. Comparison of area reduction for coal ash (GCA), açai seed ash with fiber (ASA1), and açai seed fiber-free ash (ASA2), as a function of the process temperature.
Energies 18 01662 g009
Figure 10. TG and DTA graph for Glencore coal ash (GCA).
Energies 18 01662 g010
Figure 11. TG and DTA graph for açai fiber seed ash (ASA1).
Energies 18 01662 g011
Figure 12. TG and DTA graph for açai fiber-free seed ash (ASA2).
Energies 18 01662 g012
Table 1. Ash sample identification.
Ash SampleCodeProximate Analysis (%, d.b)HHV (MJ/kg)Reference
VolatileFixed CarbonAsh
Glencore coal ashGCA34.949.715.426.8[8]
Açai fiber seed ashASA177.621.60.819.5[8]
Açai fiber-free seed ashASA278.220.31.519.3This paper
d.b—dry basis.
Table 2. Ashes chemical composition (%wt).
Composition (%wt)GCAASA1ASA2
Al2O324.45.66.9
CaO1.77.69.5
Fe2O36.73.016.3
K2O2.921.327.1
MgO2.04.44.4
MnO-1.82.1
Na2O1.4--
P2O50.210.111.0
SiO257.141.016.0
SO32.64.55.7
TiO21.00.70.5
ZnO--0.5
“-” not detected. Below the detection limit of the method (0.1%wt).
Table 3. Area reduction (%) for ash samples.
Temperature (°C)7007508008509009501000
GCA0.5 ± 1.0−0.1 ± 2.1−0.4 ± 1.40.2 ± 1.0−0.5 ± 1.50.6 ± 3.08.6 ± 3.6
ASA14.3 ± 0.87.3 ± 1.210.9 ± 4.213.4 ± 5.217.8 ± 5.324.8 ± 7.129.9 ± 12.5
ASA20.3 ± 2.31.1 ± 3.21.3 ± 4.43.6 ± 2.85.8 ± 4.310.3 ± 1.716.6 ± 2.7
Average values with 95% of confidence intervals.
Table 4. Range values for deviation, confidence interval, and uncertainty in area measurement for the sintering analysis.
Ash SampleCGAASA1ASA2
Deviation (mm2)0.2–0.50.1–0.30.1–0.4
Confidence Interval (mm2)0.3–0.70.1–0.50.2–0.6
Uncertain (mm2)5.4–5.94.7–6.25.2–6.2
Disclaimer/Publisher’s Note: The statements, opinions and data contained in all publications are solely those of the individual author(s) and contributor(s) and not of MDPI and/or the editor(s). MDPI and/or the editor(s) disclaim responsibility for any injury to people or property resulting from any ideas, methods, instructions or products referred to in the content.

