Article

Enhancing Biomethane Yield and Metabolic Pathways in Kitchen Waste Anaerobic Digestion Through Microbial Electrolysis Cell Integration

1
Beijing Center for Environmental Pollution Control and Resources Recovery, Beijing University of Chemical Technology, Beijing 100029, China
2
State Key Laboratory of Chemical Resource Engineering, Department of Environmental Science and Engineering, Beijing University of Chemical Technology, Beijing 100029, China
3
COFCO Joycome Foods Limited, Beijing 100020, China
4
Cucde Environmental Technology Co., Ltd., No. 36, Deshengmenwai Street, Xicheng District, Beijing 100120, China
*
Author to whom correspondence should be addressed.
Energies 2025, 18(7), 1629; https://doi.org/10.3390/en18071629
Submission received: 6 March 2025 / Revised: 19 March 2025 / Accepted: 21 March 2025 / Published: 24 March 2025
(This article belongs to the Section B: Energy and Environment)

Abstract

:
This study developed a system (MEC-AD) by integrating a single-chamber microbial electrolysis cell (MEC) with anaerobic digestion (AD), aiming to enhance the conversion efficiency of kitchen waste (KW) into biomethane and optimize metabolic pathways. The performance and microbial metabolic mechanisms of MEC-AD were investigated and compared with those of conventional AD, through inoculation with original inoculum (UAD) and electrically domesticated inoculum (EAD), respectively. The results show that the MEC-AD system achieved a CH4 yield of 223.12 mL/g VS, which was 31.27% and 25.24% higher than that of conventional UAD and EAD, respectively. The system also obtained total solid (TS) and volatile solid (VS) conversion rates of 82.32% and 83.39%, respectively. Furthermore, the MEC-AD system enhanced the degradation of soluble chemical oxygen demand (SCOD) and mitigated biogas production stagnation by reducing the accumulation of volatile fatty acids (VFAs) as intermediate products. Microbial metagenomics analysis revealed that the MEC-AD system enhanced microbial diversity and enriched functional genera abundance, facilitating substrate degradation and syntrophic relationships. At the molecular level, the system upregulated the expression of key enzyme-encoding genes, thereby simultaneously strengthening both direct interspecies electron transfer (DIET) and mediated interspecies electron transfer (MIET) pathways for methanogenesis. These findings demonstrate that MEC-AD significantly improves methane production through multi-pathway synergies, representing an innovative solution for efficient KW-to-biomethane conversion.

1. Introduction

Global kitchen waste (KW) production is estimated to reach 200 million tons [1], with its high organic matter and nutrient content presenting substantial opportunities for resource recovery [2]. Nevertheless, the improper treatment of KW can result in environmental issues, such as air and groundwater pollution, alongside the spread of pests like mosquitoes and flies [3]. Anaerobic digestion (AD) technology can convert KW into biomethane, presenting a promising resource utilization pathway [4]. However, traditional AD faces challenges such as the slow rate of digestion, acidification inhibition, and unstable biogas production, limiting its practical application [5,6]. Therefore, it is crucial to develop efficient technologies to optimize AD processes and overcome these bottlenecks, thereby enhancing overall performance.
Recently, the integration of microbial electrolysis cells (MECs) with AD, known as MEC-AD, has demonstrated significant advantages in addressing the limitations of conventional AD techniques [7]. Driven by an external power supply, electroactive bacteria (EB) can be enriched on the surface of the MEC-AD anode, facilitating the oxidation of anaerobic digestion intermediates into electrons, protons, and CO2 [8]. Subsequently, electrons are transferred through an external circuit to the cathode, where they participate in reduction reactions to produce methane [9]. Compared to traditional AD, MEC-AD utilizes electrodes to regulate the redox conditions within the reactor, significantly enriching electroactive microorganisms. This enhances the direct transfer of electrons between syntrophic microorganisms in their native state and accelerates the anaerobic digestion and methane production processes [10,11].
Current studies have demonstrated that the MEC-AD significantly enhances the anaerobic digestion performance of organic waste. For instance, Wang et al. [12] and Zhang et al. [13] found that the MEC-AD system, by applying an external voltage of 0.6–0.7 V, increased methane production from sludge degradation by 20–23.7% compared to traditional AD systems. Additionally, in the MEC-AD system treating cellulose wastewater, the chemical oxygen demand (COD) removal rate improved by 43.8–52.8% [14]. Further research by Baek et al. [15] revealed that electroactive bacteria (e.g., Geobacter) enriched on the anode of a glucose-fed MEC-AD system could efficiently oxidize intermediates such as volatile fatty acids (VFAs), thereby accelerating organic matter decomposition. However, existing studies have primarily focused on single substrates or simple organic waste. For KW, which is characterized by complex composition, high moisture content, and high organic matter content, the anaerobic digestion process is prone to acidification inhibition and intermediate accumulation [16]. Studies on the anaerobic digestion performance of MEC-AD tailored to such substrate characteristics remain limited. Therefore, further research is needed to explore whether MEC-AD can optimize the anaerobic digestion performance of KW.
Microbial communities and metabolic pathways are critical factors for the degradation of organic waste and the achievement of high biomethane production in MEC-AD systems. Previous studies have shown that in a co-digestion MEC-AD system treating food waste and mushroom residues, the enrichment of electroactive bacteria (e.g., Pseudomonas and Syntrophomonas) and the enhancement of hydrogenotrophic methanogens significantly increased methane yield [17]. Additionally, in a MEC-AD system inoculated with anaerobic granular sludge and iron oxide composites, the anode was notably enriched with electrogenic bacteria such as Geobacter, which established a direct interspecies electron transfer (DIET) pathway with methanogens like Methanothrix, further promoting methane production [18]. Another study found that applying an external voltage significantly enhanced the expression of the mcrA gene in methanogens within the cathode biofilm, thereby facilitating methane generation from high-ammonia substrates [19]. These findings indicate that the microbial community characteristics and metabolic mechanisms of MEC-AD systems vary significantly depending on the type of organic waste being treated. Although existing research has demonstrated that an external electric field can effectively mitigate acidification inhibition during the anaerobic digestion of KW, studies remain limited on whether MEC-AD systems can significantly improve the methane production efficiency of KW degradation and the associated microbial metabolic mechanisms. Therefore, systematic research is needed to determine whether MEC-AD can enhance the anaerobic digestion performance of KW and to elucidate the succession patterns of microbial communities and the regulatory mechanisms of metabolic pathways.
In this study, a single-chamber MEC was integrated with a conventional AD to construct a MEC-AD system. This system utilizes electrically domesticated KW digestate as inoculum, aiming to achieve efficient biomethane conversion from KW. The objectives are the following: (1) Compare the MEC-AD system with traditional AD systems (UAD and EAD) to evaluate their performance in the anaerobic digestion of KW, with a focus on biomethane production, substance conversion rates, and system stability. (2) Combine 16S rRNA gene sequencing and metagenomic analysis to investigate the distribution differences in functional microorganisms and the regulatory roles of key functional genes in different systems. This will reveal the metabolic mechanisms underlying KW degradation and methane generation in the MEC-AD system, providing a theoretical foundation for optimizing system performance.

2. Materials and Methods

2.1. Kitchen Waste and Inoculum

KW was collected from a canteen in the campus of Beijing University of Chemical Technology, Beijing, China. After removing non-biodegradable components, such as plastics, bones, and eggshells, the KW was smashed into particles with an average size of 1 mm with a pulverizer (Yucan, RT-350, Beijing, China). The original inoculum was obtained from the digestate of a sequencing batch reactor that had been operating long-term with KW as the substrate. The electrically domesticated inoculum was derived from the effluent of a long-term experiment with KW digestate and sodium acetate-fed MEC-AD. Both the KW and inoculum were stored under anaerobic conditions at 2–4 °C before use. The characteristics of the KW and inoculum were measured, and the results are presented in Table 1.

2.2. Experimental Set Up and Design

The batch of AD was performedin single-chamber MEC-AD reactors and serum bottles. A single-chamber borosilicate glass MEC-AD (φ5.6 cm × 12 cm × 9 cm, Wenoote, Co., Ltd., Chuzhou, China) was equipped with a butyl rubber sealed sampling port at the top for substrate inlet and biogas outlet. The anode was a graphite brush, and its size was 30 mm in diameter and 30 mm in length. Primary anode biofilms were enriched prior to the start of the formal experiments in the MEC-AD reactor according to the method described by Wang et al. [20]. The inoculum and substrate for this process were KW digestate and sodium acetate, respectively. The cathode material of MEC-AD was carbon cloth (W1S11011, CeTech Co., Ltd., Taichung, Taiwan, China), with a surface area of 7.07 cm2 and a Pt catalyst layer (0.5 mg·cm−2) on one side. The anode and the cathode were on opposite sides. A DC power supply (UTP33313TFL-II, Uni-trend Technology Co., Ltd., Dongguan, China) provided a constant voltage (0.8 V) to the MEC-AD reactors. The electron transfer amount in the reactor circuit was obtained by collecting and recording the current of 10 Ω resistance in the series of MEC-AD reactors using a multimeter (2700; Keithley instrument, Tektronix Inc., Shanghai, China). Serum bottles inoculated with electrically domesticated inoculum were set up as EAD reactors, and the inoculum for MEC-AD was aligned with EAD. Serum bottles inoculated with the original inoculum were set up as UAD reactors. The total volume of each reactor was 236 mL, with a working volume of 180 mL. The organic loading of KW and inoculum for the reactors was set at 17.5 g VS·L−1. Subsequently, the reactors were immediately sealed using rubber septa and were incubated at 35 ± 1 °C. All the experiments were run in triplicate.

2.3. Analytical Methods

The daily biogas production was measured using the water displacement method. The biogas components, including H2, CH4, and CO2, were evaluated using a gas chromatograph (SP-2100, Zhongkehuijie Corporation, Beijing, China) with a TDX-01 column and a thermal conductivity detector. Daily biogas production was calculated based on the volatile solid content (VS) after converting to standard conditions. The total solid (TS) and vs. contents were analyzed according to the APHA standard methods [21]. The TS content was determined by drying the sample at 105 °C until a constant weight was achieved, with the TS content calculated as the ratio of the weight difference before and after drying to the initial sample weight. Similarly, the vs. content was measured by igniting the TS-determined sample at 600 °C until a constant weight was attained, and the vs. content was calculated as the ratio of the weight difference before and after ignition to the TS weight. The liquid digestate was periodically collected, centrifuged at 10,000 rpm for 10 min, filtered through a 0.2 µm filter, and subsequently analyzed for key liquid parameters, including VFAs, SCOD, and pH. The concentration of VFA was analyzed using a gas chromatograph (GC-2014, Shimadzu, Kyoto, Japan) equipped with a flame ionization detector. SCOD was determined using the test method described in previous study [22]. The pH value was measured using a pH meter (Thermo Electron, Waltham, MA, USA). The cellulose, hemicellulose, and lignin contents were measured using a fiber analyzer (f2000, Hanon Advanced Technology Group Co., Ltd., Dezhou, China). The cellulose content was determined with the Acid Detergent Fiber (ADF) method, where the sample was treated with an acidic detergent to remove hemicellulose and lignin, leaving cellulose as the residue. The hemicellulose content was calculated as the difference between the Neutral Detergent Fiber (NDF) and ADF methods. The lignin content was determined using the Acid Detergent Lignin (ADL) method, in which the ADF sample was treated with 72% sulfuric acid to remove cellulose, leaving lignin as the residue.
The experimental data of the cumulative CH4 yield were fitted with the modified Gompertz equation (Equation (1)):
H ( t ) = p × exp { exp [ λ × e × ( a t ) / p + 1 ] }
where H(t) = cumulative CH4 yield mL/g VS, t = fermentative time d, p = CH4 production potential mL/g VS, λ = maximum CH4 yield rate mL/(g VS·d), and a = lag phase time d. The nonlinear fitting of the models in this study was performed using Origin 2021.

2.4. Microbial Community and Metagenomic Sequencing Analysis

At the end of the experiment, samples were collected from the MEC-AD anode, and suspended in liquid, EAD, and UAD for amplicon sequencing and metagenomic analysis. Microbial DNA was extracted according to the manufacturer’s instructions and then subjected to PCR amplification. Primers for real-time PCR assays included 338F (5′-ACTCCTACGGGAGGCAGCAG-3′) and 806R (5′-GGACTACHVGGGTWTCTAAT-3′) for bacteria and 524F10ext (5′-TGYCAGCCGCCGCGGTAA-3′) and Arch958Rmod (5′-YCCGGCGTTGAVTCCAATT-3′) for archaea. After total genomic DNA extraction using an E.Z.N.A.® Soil DNA Kit (Omega Bio-tek, Norcross, GA, USA) according to the manufacturer’s instructions, paired-end sequencing was performed on Illumina NovaSeq™ X Plus (Illumina Inc., San Diego, CA, USA) at Majorbio Bio-Pharm Technology Co., Ltd. (Shanghai, China) using a NovaSeq X Series 25B Reagent Kit according to the manufacturer’s instructions (www.illumina.com (accessed on 13 December 2024)). Raw sequencing reads were trimmed of adapters, and low-quality reads (length < 50 bp or average quality < 20) were filtered using fastp (version 0.20.0). The quality-filtered data were assembled using MEGAHIT (version 1.1.2). A non-redundant gene catalog was constructed using CD-HIT (version 4.7) with 90% identity and 90% coverage. Taxonomy annotation was performed by aligning non-redundant genes against the NCBI NR database using DIAMOND (version 2.0.13, e-value ≤ 1 × 10⁻⁵). Functional annotation (KEGG, eggNOG) was also obtained. All these analyses were performed using the online Majorbio Cloud Platform (www.majorbio.com (accessed on 11 January 2025)).

2.5. Statistical Analysis

Standard deviations and statistical differences were analyzed using Microsoft Excel 2019. Methane yield was fitted with the modified Gompertz model, and figures in this study were plotted using Origin 2021. For microbial community analysis, data were processed using R (4.4.0) and visualized accordingly.

3. Results and Discussion

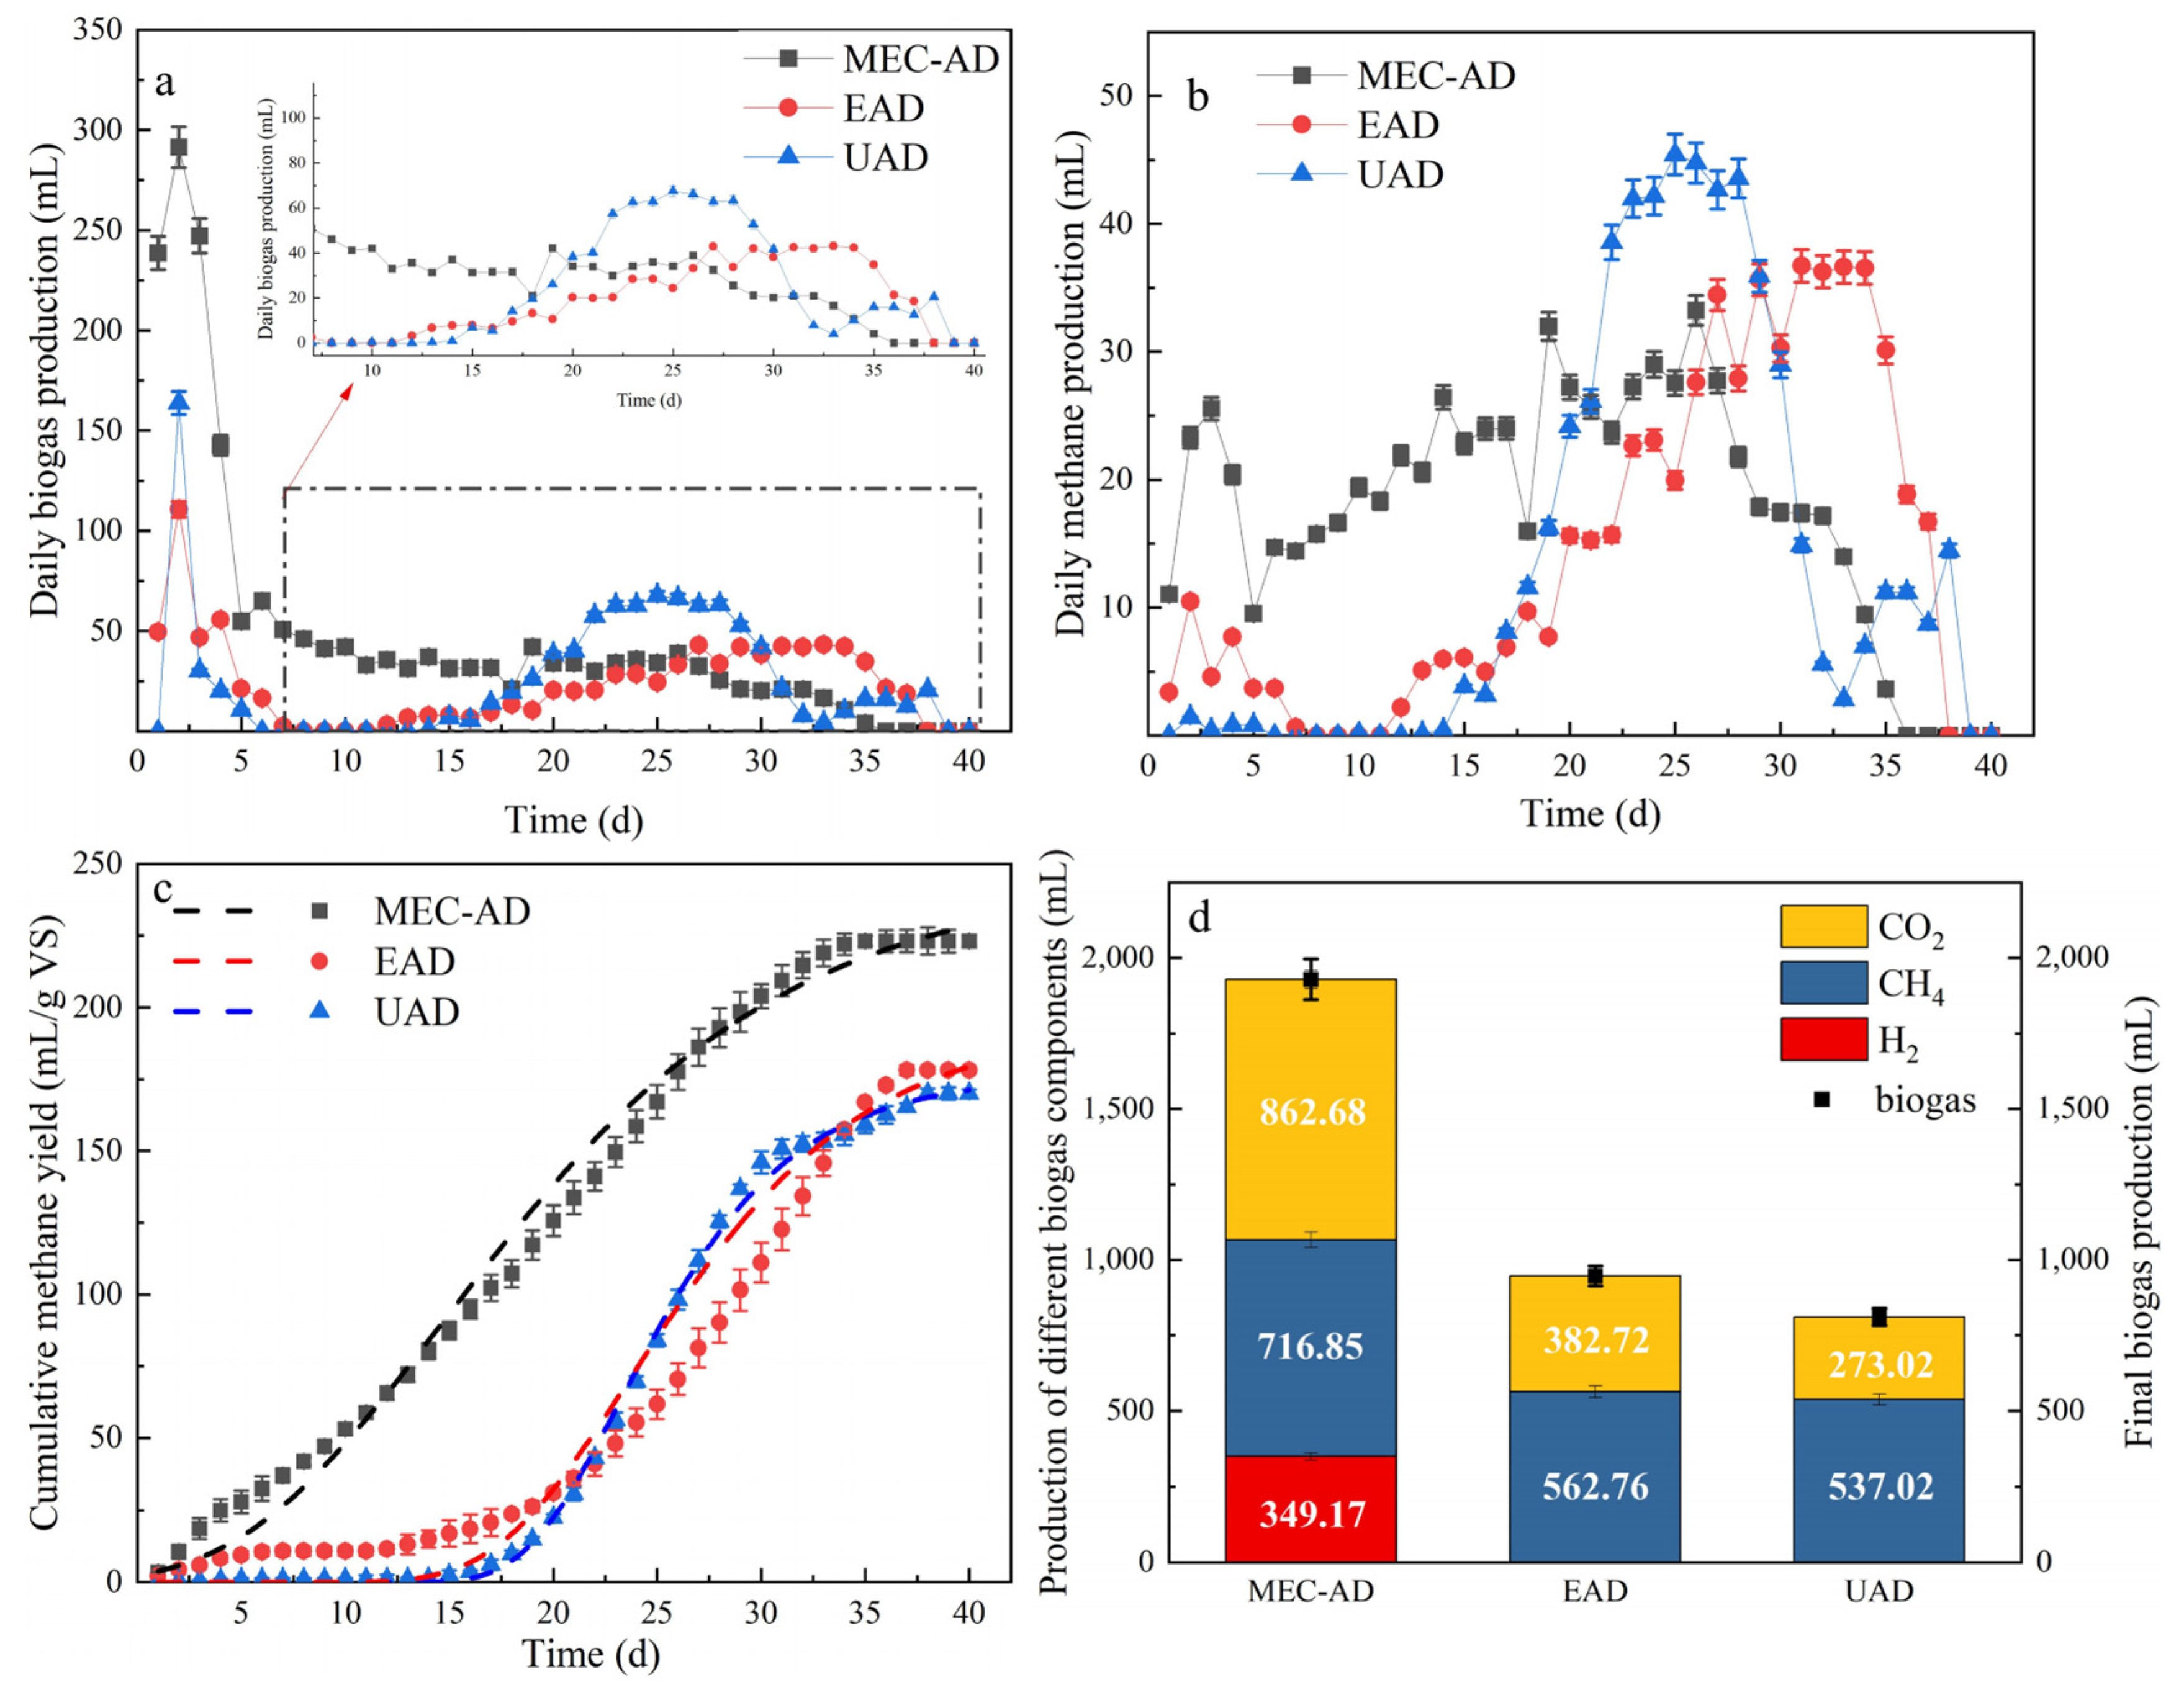
3.1. Biogas and Biomethane Production

3.1.1. Daily Biogas Production

Figure 1a presents the dynamic changes in daily biogas production during the degradation of KW in different AD systems. All systems achieved their initial biogas production peak on day 2, with the MEC-AD system generating 291.48 mL, representing 2.63 and 2.24 times higher production than the EAD (110.68 mL) and UAD (130.04 mL) systems, respectively. Following this initial peak, all systems experienced a rapid decline in biogas production. From day 5 onward, the MEC-AD system maintained stable biogas production until the experiment’s conclusion. In contrast, the conventional AD systems (EAD and UAD) underwent biogas production stagnation periods lasting 6 and 9 days, respectively, before gradually recovering. These systems reached secondary production peaks on days 27 and 25, with a production of 43.00 mL and 67.56 mL, respectively. These observations confirm that the MEC-AD system successfully overcame the common issue of biogas production stagnation observed in traditional AD systems, which is consistent with the findings reported by Jiang et al. [23]. While the MEC-AD system did not demonstrate significant production peaks during the mid-to-late reaction phases, its consistent biogas production pattern not only improved process efficiency but also exhibited remarkable operational stability.
Figure 1b displays the daily methane production patterns from different AD systems during KW treatment. The MEC-AD system showed fluctuating methane production between days 5 and 32, maintaining stable output within 15.00–33.00 mL. Two production peaks occurred on days 19 and 26, reaching 31.99 mL and 33.23 mL, respectively. Methane production gradually decreased from day 33 until process termination on day 36. In contrast, both EAD and UAD systems exhibited different production patterns. During the initial 17 days, daily methane production remained below 10.00 mL, followed by a slow increase. The EAD and UAD systems achieved maximum production on days 31 and 25, reaching 36.71 mL and 45.72 mL, respectively. While the UAD system reached peak production earlier with slightly higher values, the EAD system initiated methane production recovery on day 11, four days earlier than the UAD system. This observation suggests that AD systems inoculated with electrolytically domesticated inoculum can effectively shorten the recovery period for methane production from KW. The MEC-AD system maintained consistent methane production without significant stagnation throughout the process, demonstrating enhanced operational stability compared to conventional anaerobic digestion systems.

3.1.2. Accumulative Biogas Yield

Figure 1c and Table 2 display the cumulative methane yield (CMY) and kinetic analysis results from different AD systems (MEC-AD, EAD, and UAD) during KW degradation. The MEC-AD system demonstrated superior performance with a CMY of 223.12 mL CH4/g VS, representing 31.27% and 25.24% increases compared to the UAD system (169.97 mL CH4/g VS) and EAD system (178.16 mL CH4/g VS), respectively. In comparison, the EAD system shows only a marginal 4.82% improvement in CMY over the UAD system. These findings clearly indicate that the MEC-AD system achieves substantially higher cumulative methane production when processing KW compared to conventional AD systems.
The lag phase (a), calculated using the modified Gompertz equation, provides further evidence of performance variations among the different systems. Table 2 reveals that the MEC-AD system exhibited a substantially shorter lag phase, with a reduction of 12.16 to 13.63 days compared to both the EAD and UAD systems. In a similar study using corn straw as the substrate, it was found that the lag phase of MEC-AD was shortened by 9 days compared to UAD, but only by 1.41 days compared to EAD [24]. This finding demonstrates that the MEC-AD system can more effectively mitigate the prolonged methane production stagnation issue in kitchen waste (KW) anaerobic digestion, thereby extending the operational stability of the system. This advantage is likely attributed to the introduction of the microbial electrolysis cell, which enhances microbial community diversity and synergies, ultimately optimizing the overall system performance [13,25].
Figure 1d illustrates the final biogas production and composition distribution across different AD systems. The MEC-AD system demonstrated superior performance with total biogas production reaching 1928.69 mL, representing 1.38-fold and 1.04-fold increases compared to the UAD system (810.65 mL) and EAD system (945.90 mL), respectively. Particularly noteworthy is the significantly higher methane production achieved by the MEC-AD system relative to conventional AD systems. Furthermore, the MEC-AD system produced substantial hydrogen quantities (349.17 mL), mainly generated through proton-electron combination reactions at the cathode surface [26]. This hydrogen production supports the establishment of hydrogenotrophic methanogenesis pathways within the system [27]. These findings indicate that the MEC-AD system achieves enhanced degradation and biogas production efficiency for KW, potentially enabling methane generation through multiple metabolic pathways.
In conclusion, the MEC-AD system successfully resolves the challenge of methane production inhibition resulting from system over-acidification in conventional anaerobic digestion systems, maintaining consistent methane output while demonstrating enhanced and more reliable anaerobic methane production characteristics.

3.2. Substance Conversion

The TS and vs. conversion rates are critical indicators for evaluating the efficiency of organic matter conversion in anaerobic digestion systems. As shown in Figure 2a, the MEC-AD system demonstrated optimal conversion efficiency, achieving TS and vs. conversion rates of 82.32% and 83.39%, respectively. The EAD system showed slightly lower performance, with corresponding conversion rates of 68.83% and 80.08%. When compared to the UAD system, the MEC-AD and EAD systems exhibited improvements in TS and vs. conversion rates ranging from 13.19% to 26.68% and 9.72% to 13.04%, respectively. These findings indicate that the electrically domesticated KW inoculum significantly enhanced the biodegradation capacity of the anaerobic system. Moreover, the high TS and vs. conversion rates observed in the MEC-AD system correlate well with its enhanced gas production performance, providing further evidence that this integrated approach enables more efficient degradation and conversion of KW into biogas and methane.
Lignocellulose is the primary component of the cell walls in plant-based KW such as vegetable leaves and fruit peels, with its cellulose and hemicellulose serving as the main sources for biogas production during KW degradation. Figure 2b demonstrates that in following treatment in the MEC-AD, EAD, and UAD systems, the cellulose and hemicellulose conversion rates reached 86.34–92.55% and 87.47–93.41%, respectively. The MEC-AD system achieved slightly higher conversion rates for cellulose (92.55%) and hemicellulose (93.41%) compared to traditional AD systems, which aligns with the previously mentioned TS and vs. conversion results. These findings suggest that the integration of microbial electrolysis technology potentially enhances microbial community structure and functional interactions within anaerobic digestion systems, leading to improved overall degradation efficiency.
As shown in Figure 2c, the concentration of SCOD at different fermentation times points reflects the variation in residual soluble organic matter within the AD system. The MEC-AD system demonstrated a distinct SCOD degradation pattern characterized by an initial slow decline followed by accelerated reduction, suggesting enhanced conversion efficiency during the mid-to-late reaction phases. Notably, the SCOD conversion rate in MEC-AD consistently surpassed the release rate from solid particle dissolution throughout the process. In contrast, both EAD and UAD systems exhibited continuous SCOD accumulation during the initial 7 days, peaking at 22,681.09 mg/L and 25,681.09 mg/L, respectively, consistent with previous observations by Jiang et al. [28]. This observation suggests that during the early stage of KW degradation, the dissolution rate of solid particles substantially surpassed the capacity of these systems to convert SCOD [29]. After this accumulation period, a gradual decrease in SCOD concentrations was observed, with the EAD system demonstrating faster reduction rates than the UAD system. The improved performance observed in the EAD system may result from modifications to the microbial community structure induced by electrical domestication, leading to enhanced SCOD conversion efficiency in anaerobic digestion systems.
Furthermore, the analysis of accumulated SCOD concentrations revealed substantial variations among the different systems throughout the reaction process. The MEC-AD system maintained SCOD concentrations below 20,000 mg/L, with levels decreasing to under 15,000 mg/L and 10,000 mg/L by days 15 and 30, respectively. In contrast, both the EAD and UAD systems showed consistently higher SCOD concentrations during the early and middle fermentation phases, only reaching levels below 15,000 mg/L by days 25 and 30, respectively. This represents a 10–15-day delay compared to the MEC-AD system. These findings clearly indicate that the MEC-AD system achieves markedly better SCOD conversion efficiency during KW anaerobic digestion when compared to conventional AD systems.
VFAs, as critical intermediates in anaerobic digestion, displayed distinct concentration dynamics across different AD systems during fermentation (Figure 2d). All systems showed rapid VFA accumulation, exceeding 8207.11 mg/L within the initial three days. The MEC-AD system demonstrated superior VFA reduction, with concentrations declining gradually from day 4 and showing significant decreases between days 10 and 15. In contrast, both the EAD and UAD systems maintained elevated VFA levels (>10,056.90 mg/L) throughout the first 15 days, potentially inducing pH fluctuations that impaired methanogen activity and resulted in biogas production stagnation [30]. VFA concentrations in these systems only began to decrease around day 20, coinciding with improved biogas production as acid inhibition diminished. These findings clearly demonstrate that the MEC-AD system exhibits enhanced capability to mitigate VFA-induced biogas inhibition compared to conventional systems, which aligns with findings from Jiang and colleagues regarding the effectiveness of electric field applications in reducing KW over-acidification [23].
Comprehensive analysis of VFA composition demonstrated that acetate and propionate predominated as the major accumulated components across all AD systems during fermentation. While the MEC-AD and EAD systems exhibited detectable levels of n-butyrate, iso-butyrate, n-valerate, and iso-valerate, peaking at 573.90 mg/L and 483.08 mg/L, respectively, these components were effectively metabolized between days 20 and 25. In stark contrast, the UAD system accumulated significantly higher concentrations of these VFAs, reaching 936.61 mg/L (1.63–1.94 times greater than MEC-AD and EAD), with complete metabolism delayed until day 33. These substantial differences in VFA profiles and degradation kinetics likely stem from microbial community restructuring induced by prolonged electrolytic acclimation, ultimately influencing VFA composition and metabolic pathways in distinct AD configurations.

3.3. Microbiological Community Characteristics

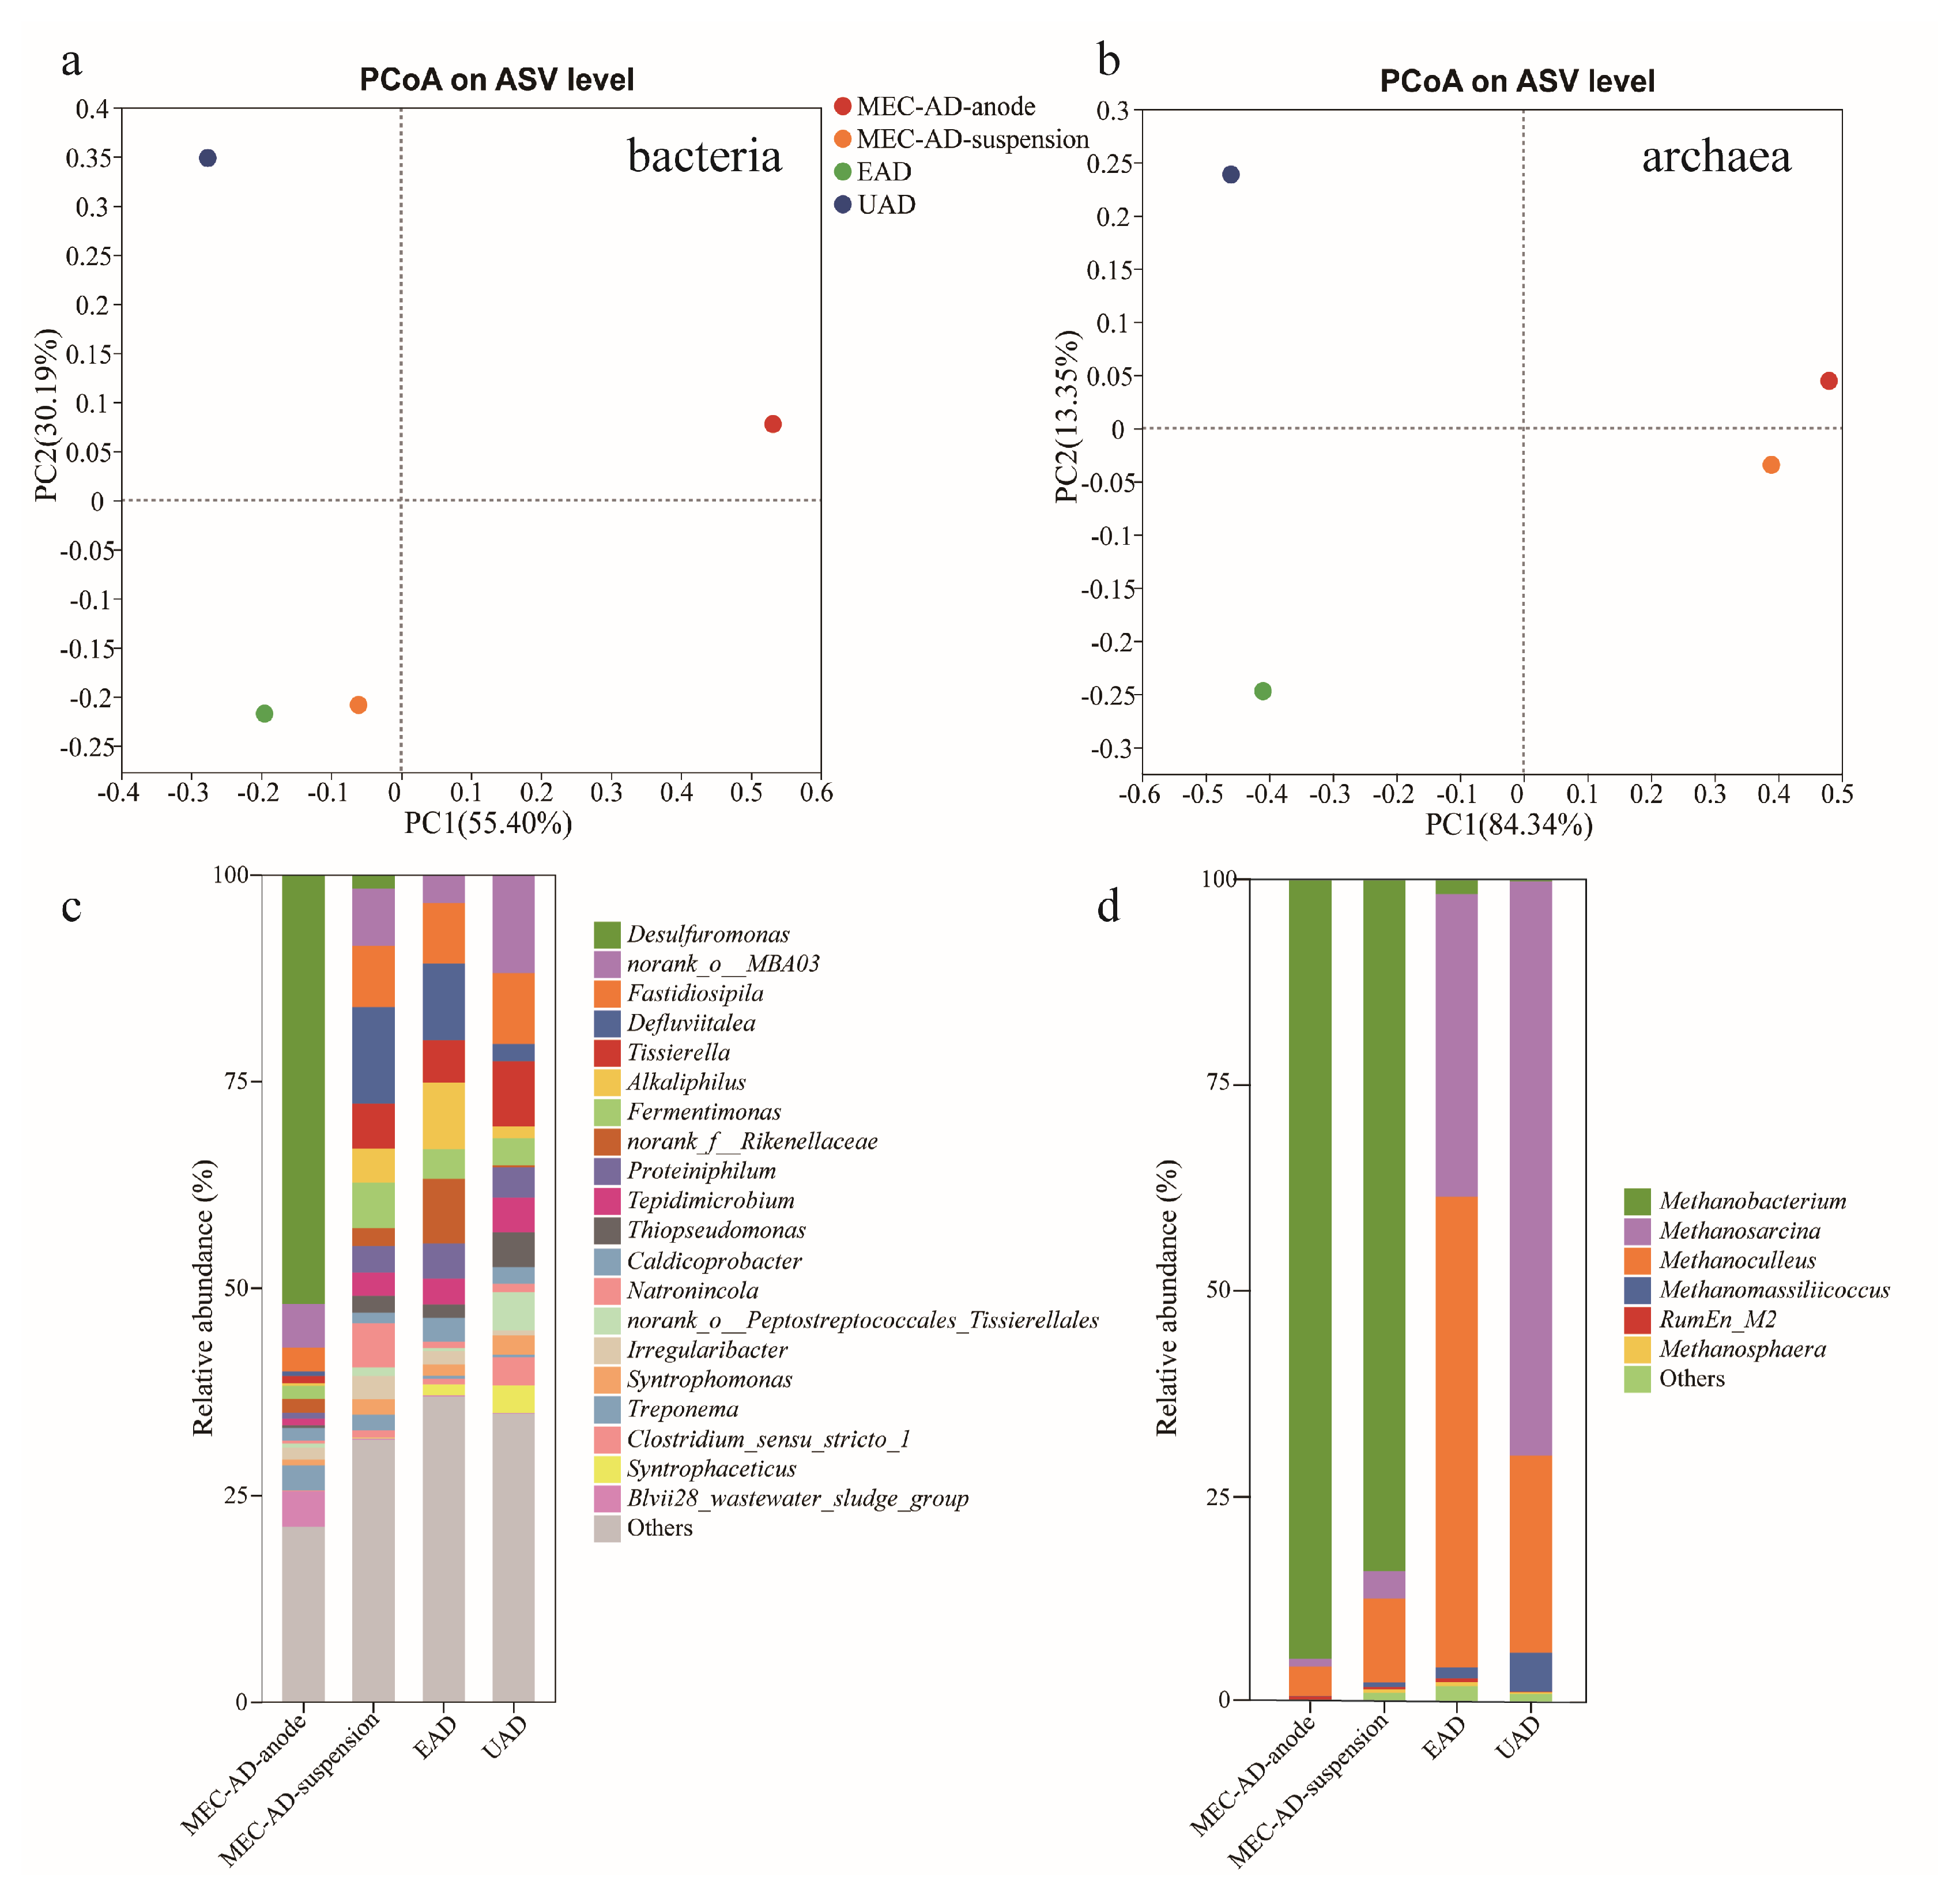
3.3.1. Microbial Community Diversity

Table 3 displays the microbial diversity analysis results for the three systems. The sequencing coverage for all post-digestion KW samples exceeded 0.999, confirming adequate sequencing depth to accurately represent bacterial community composition. Alpha diversity assessment employed three indices: the Chao index for species richness and the Shannon and Simpson indices for species diversity evaluation. A higher microbial community alpha diversity corresponds to lower Simpson index values combined with higher Chao and Shannon indices. Comparative analysis demonstrated that microbial samples from the MEC-AD anode biofilm showed substantially lower Chao and Shannon indices relative to other samples. This pattern indicates that microbial electrolysis promotes the development of a more specialized and selective microbial community structure within the MEC-AD anode biofilm. These observations align with previous studies reporting highly specific microbial selection patterns in MEC-AD anode biofilms [31].
Principal coordinate analysis (PCoA) based on the Bray–Curtis distance was used to illustrate the differences in microbial community structures among samples from three AD systems. Figure 3a reveals bacterial community distribution patterns. The MEC-AD suspension and EAD samples are clustered together, suggesting high bacterial community similarity, likely resulting from shared inoculation with MEC-AD-electrically domesticated KW digestate. Conversely, the MEC-AD anode and UAD samples occupy distinct regions. This separation arises from two primary factors: (1) The microbial electro-acclimation process in MEC-AD systems optimized the bacterial community structure in the original KW digestate, leading to significant differences between UAD and both MEC-AD suspension and EAD. (2) Continuous external electric field stimulation promoted the directional acclimation of the MEC-AD anode biofilm, establishing distinct characteristics compared to other samples. Figure 3b illustrates the archaeal community distribution. The MEC-AD anode and suspension samples formed a single cluster without significant differences, yet showed pronounced variation compared to the EAD and UAD archaeal communities. These findings reveal that archaeal community structures can be significantly modified through either the microbial electro-acclimation of inoculum or MEC-enhanced anaerobic digestion processes.

3.3.2. Microbial Community Structure

The performance of AD systems shows strong correlation with functional microorganism diversity and abundance. This investigation examined microbial community composition at the genus level to identify functional microorganisms across different systems. Figure 3c presents the functional microorganism distribution in bacterial communities from various systems. The MEC-AD anode bacterial community displayed distinct characteristics, with Desulfuromonas representing the predominant genus at 51.89% relative abundance. Previous studies have identified Desulfuromonas as a strictly anaerobic sulfur-reducing bacterium and characteristic electroactive microorganism [32,33], demonstrating efficient electron transfer to electrodes [34]. This genus frequently occurs in anode biofilms of microbial electrochemical systems [35]. The system also contained additional functional microorganisms, including syntrophic organic acid-oxidizing bacteria (SOBs: norank_o__MBA03, Alkaliphilus, Fermentimonas) and fermentative acid-producing bacteria (FABs: Blvii28_wastewater-sludge_group, Treponema, Fastidiosipila, norank_f__Rikenellaceae, Caldicoprobacter, Irregularibacter). These functional groups exhibited relative abundances of 7.87% and 19.02%, respectively, on the anode surface.
FABs and SOBs represented the predominant functional genera in the MEC-AD suspension, EAD, and UAD systems, showing relative abundances of 48.10% and 18.43%, 45.25% and 17.85%, and 42.96% and 22.19%, respectively. The MEC-AD suspension exhibited a significantly higher FAB abundance compared to the EAD and UAD systems, suggesting enhanced hydrolytic acidification capacity for substrate degradation.
Although functional bacterium relative abundance in MEC-AD suspension, EAD, and UAD systems shows similarity, significant differences exist in dominant genus composition. Both MEC-AD suspension and EAD systems contain SOBs primarily composed of norank_o__MBA03, Alkaliphilus, and Fermentimonas. The MEC-AD suspension demonstrates relative abundances of 6.88%, 4.12%, and 5.47% for these genera, respectively, slightly exceeding those in EAD (8.10%, 3.61%, and 3.44%). In contrast, the dominant SOB genus in UAD is norank_o__MBA03 (11.86%), followed by Fermentimonas (3.29%) and Syntrophaceticus (3.28%). This analysis indicates that the MEC-AD and EAD systems, inoculated with electrically domesticated KW digestate, incorporate an additional alkaliphilic bacterium, Alkaliphilus [36], into their SOB communities relative to UAD. Moreover, MEC-AD and EAD exhibit a more balanced relative abundance distribution among SOB genera, potentially improving synergistic interactions and enhancing anaerobic system stability. Notably, while Syntrophomonas maintains relatively low abundance (1.40–2.32%) across all systems, previous research has confirmed its synergistic function with Methanosarcina in syntrophic acetate oxidation to methane through direct interspecies electron transfer (DIET) [37].
FABs generating volatile fatty acids (VFAs) as metabolic end-products also exhibit distinct variations across different systems [38,39,40]. In the MEC-AD suspension, dominant N-FAB genera include Defluviitalea (11.70%), Fastidiosipila (7.40%), Tissierella (5.43%), and Natronincola (5.33%). The EAD system contains Fastidiosipila (7.31%), Defluviitalea (9.23%), norank_f__Rikenellaceae (7.80%), and Tissierella (5.13%) as primary FAB genera. In contrast, UAD demonstrates a distinct FAB profile dominated by Fastidiosipila (8.58%), Tissierella (7.90%), norank_o__Peptostreptococcales_Tissierellales (4.60%), and Thiopseudomonas (4.26%). These results indicate substantial differences in FAB composition between the MEC-AD suspension and UAD, highlighting the significant influence of MEC integration on hydrolytic and fermentative bacterial community structure in AD systems.
Figure 3d displays archaeal community composition at the genus level in samples from different systems. In the MEC-AD system, archaea mainly consist of Methanobacterium, Methanosarcina, and Methanoculleus, all capable of utilizing hydrogen or formate as electron donors for carbon dioxide reduction to methane [27]. Methanobacterium represents the dominant archaeal genus, showing relative abundances of 94.72% and 84.05% in anode and suspension samples, respectively. Previous studies have identified Methanobacterium as an archaeon with direct electron transfer capability [41], and its high abundance may concurrently enhance both hydrogenotrophic and electrotrophic methanogenesis pathways.
In comparison, the archaeal composition in traditional AD systems differs significantly from that of MEC-AD. The EAD system contains archaea dominated by Methanosarcina and Methanoculleus, with relative abundances of 36.81% and 57.14%, respectively. The UAD system demonstrates archaeal communities primarily consisting of Methanosarcina (69.71%), Methanoculleus (23.99%), and Methanomassiliicoccus (4.70%). Among these, Methanomassiliicoccus represents a characteristic methylotrophic methanogen that requires hydrogen for methanol and other substrate reduction in methane production, operating at hydrogen partial pressures below 0.1 Pa [42]. While the EAD system remains dominated by hydrogenotrophic methanogens, the primary archaeal genus in UAD, Methanosarcina, exhibits versatile methanogenic capability through the utilization of multiple substrates, including hydrogen/carbon dioxide, acetate, methanol, and methylamines [43]. Furthermore, the presence of methylotrophic methanogen Methanomassiliicoccus in UAD indicates that anaerobic process byproducts provide diverse substrates for methanogenesis.

3.4. Crucial Metabolic Pathways and Macrogenomic Analysis

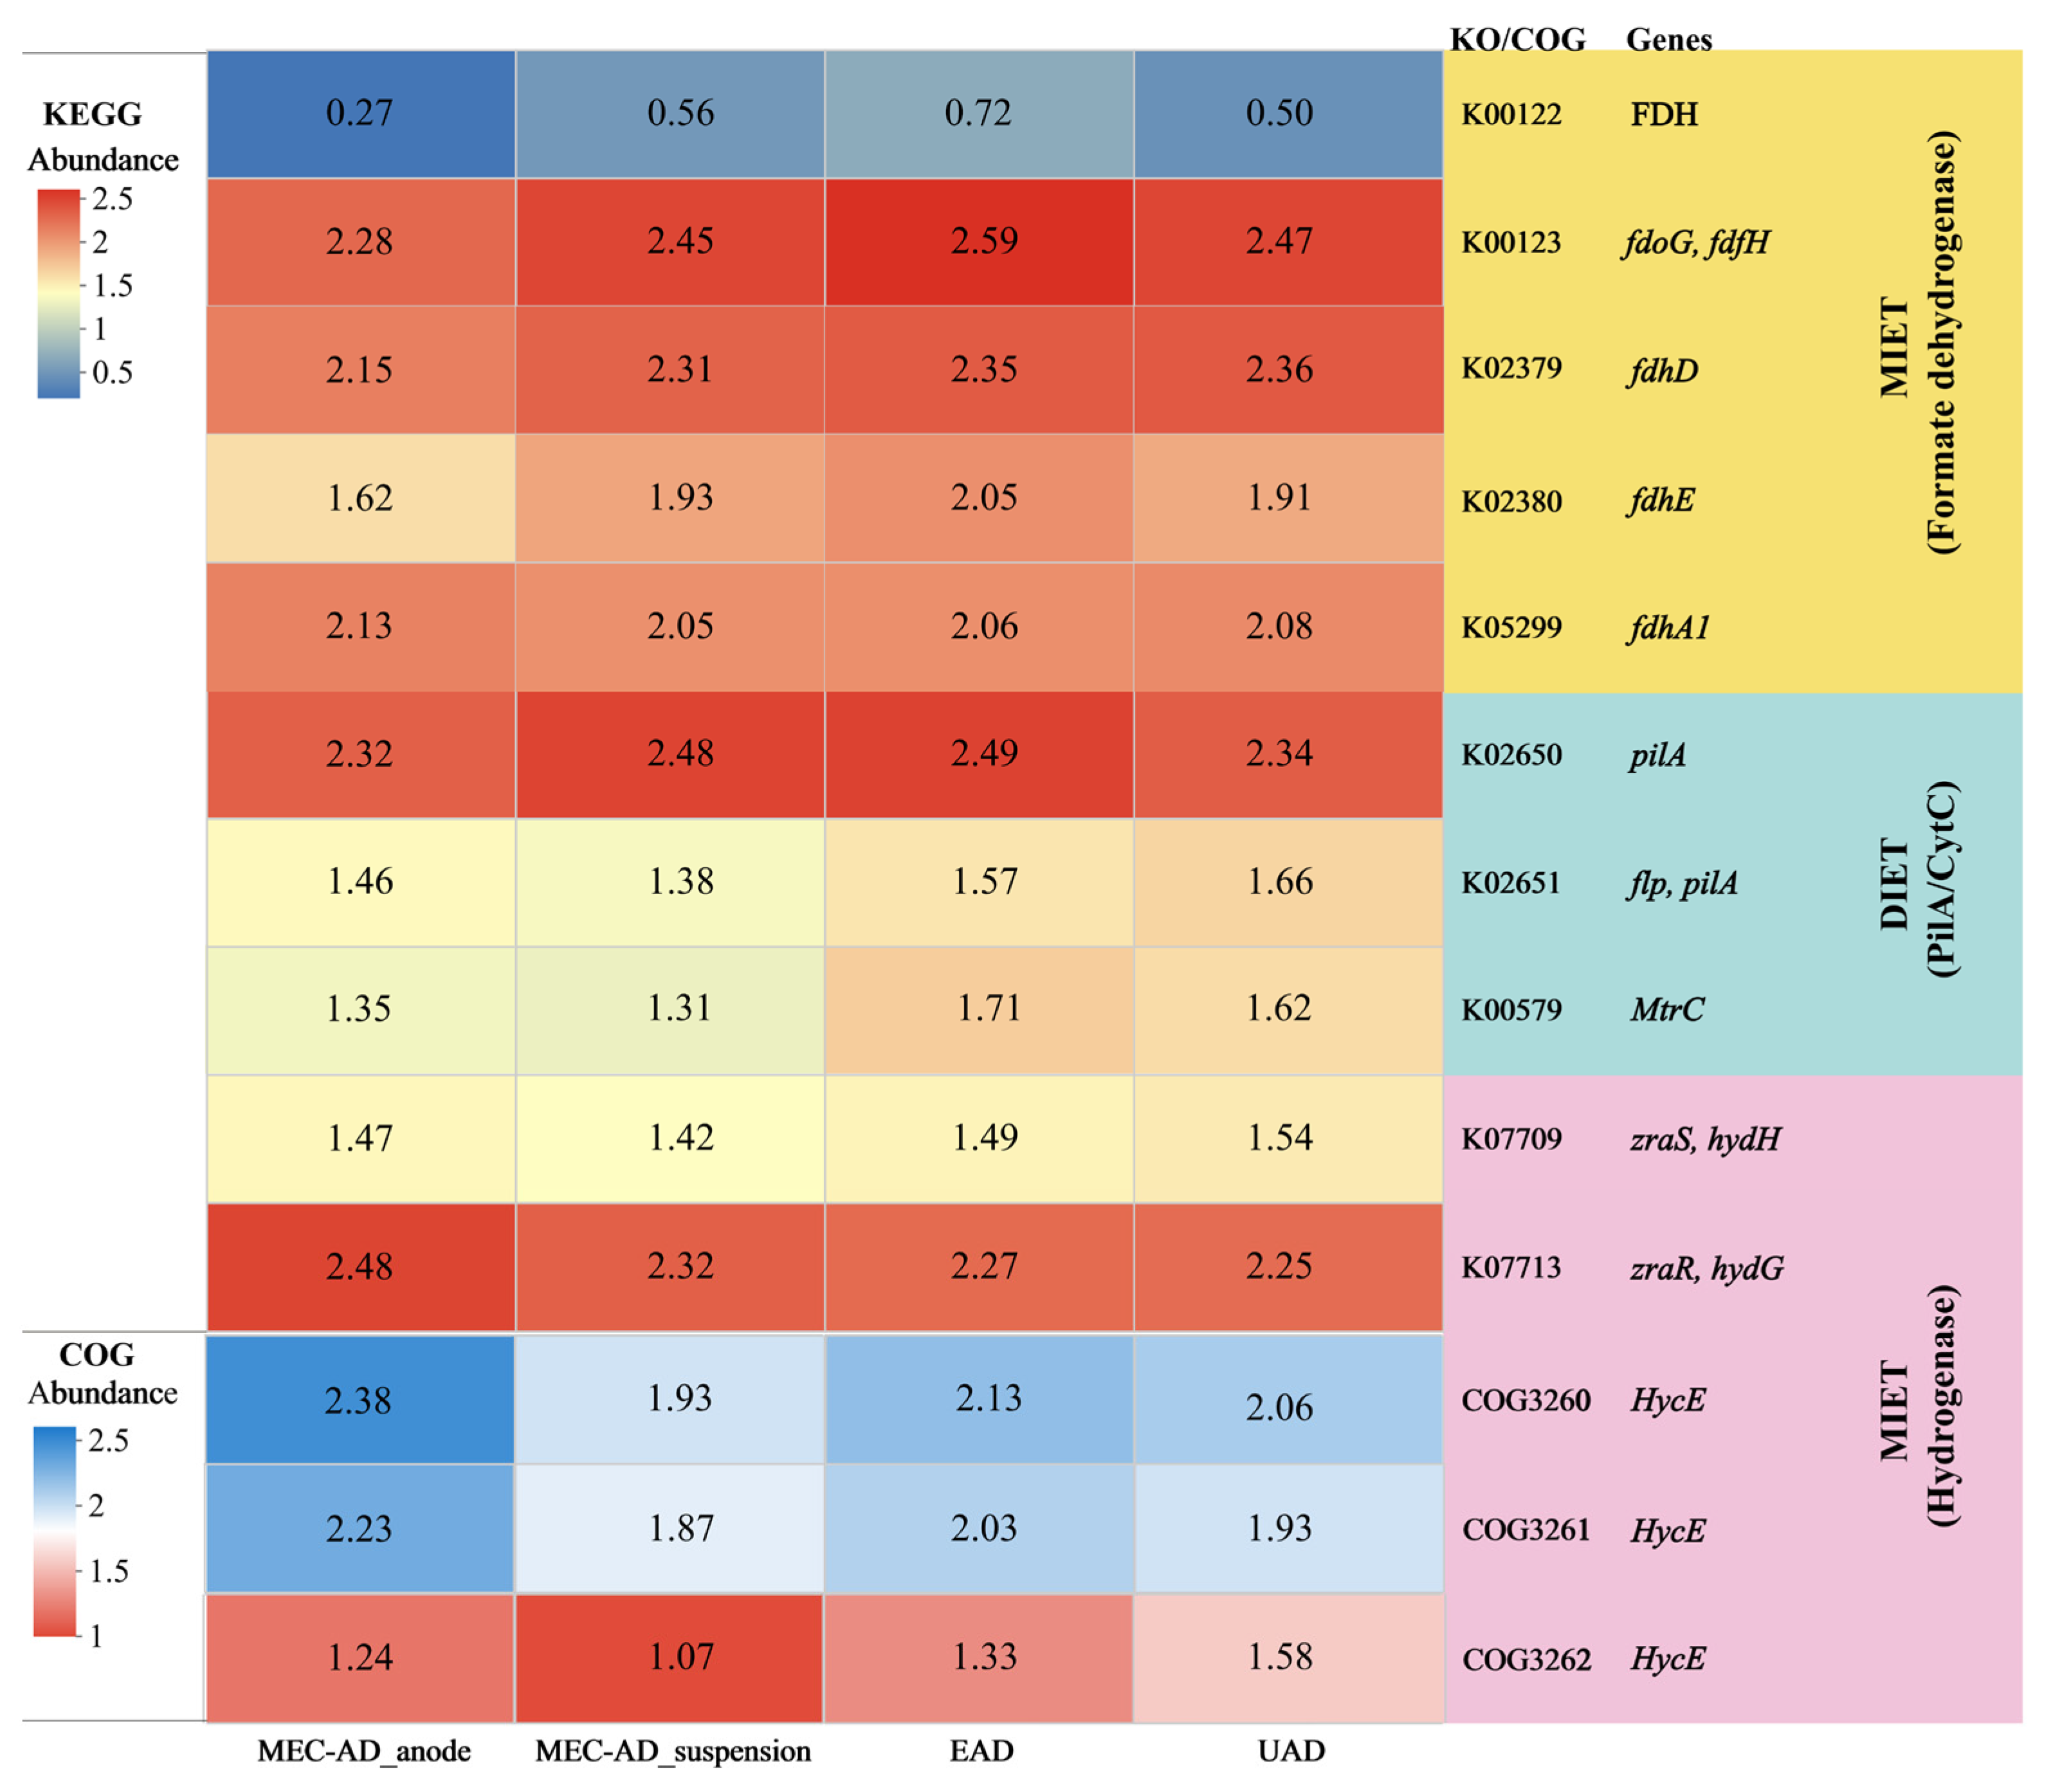
3.4.1. Interspecies Electron Transfer Syntrophic Metabolic Pathways

Interspecies electron transfer (IET) is a core mechanism in syntrophic methanogenesis within microbial communities [44]. Depending on whether electron carriers are involved, microbial IET can be categorized into two types: mediated interspecies electron transfer (MIET) and DIET. MIET utilizes electron shuttles including hydrogen or formate to facilitate electron transfer from bacteria to methanogenic archaea, whereas DIET enables direct cell-to-cell electron transfer through conductive pili, cytochrome c, and other proteins without requiring external redox carriers [45]. Using COG and KEGG database information along with the existing literature [46], this study identified genes potentially involved in extracellular electron transfer during syntrophic metabolism (Table S1). Figure 4 displays the abundance distribution of key genes associated with IET-driven syntrophic metabolism across different anaerobic digestion systems.
Analysis results demonstrate that regulatory genes zraR, hydG, HycE, and fdhA1 in the MEC-AD anode show significant upregulation compared to other samples. These genes include zraR, hydG, and HycE, which enhance hydrogen-mediated MIET pathways (K07713, COG3260, and COG3261), along with fdhA1, which promotes formate-mediated MIET pathways (K05299). Both MEC-AD suspension and EAD samples exhibit significant upregulation of pilA, a gene involved in DIET pathway construction (K02650). Furthermore, the expression levels of zraR and hydG, associated with hydrogen-mediated MIET pathways (K07713), appear notably higher in MEC-AD suspension relative to conventional anaerobic digestion samples. In comparison, EAD shows significant regulation of fdoG and fdfH genes related to formate-mediated MIET pathways (K00123). The UAD system primarily regulates fdoG, fdfH, and fdhD genes, all contributing to formate-mediated MIET pathways (K00123 and K02379), when compared to the former two systems. These findings reveal that genes in the MEC-AD system demonstrate substantial advantages in establishing both DIET and MIET pathways. While EAD shows significant upregulation of the DIET pathway (K02650) and formate-mediated MIET pathway (K00123), UAD primarily regulates genes associated with formate-mediated MIET pathways (K00123 and K02379).

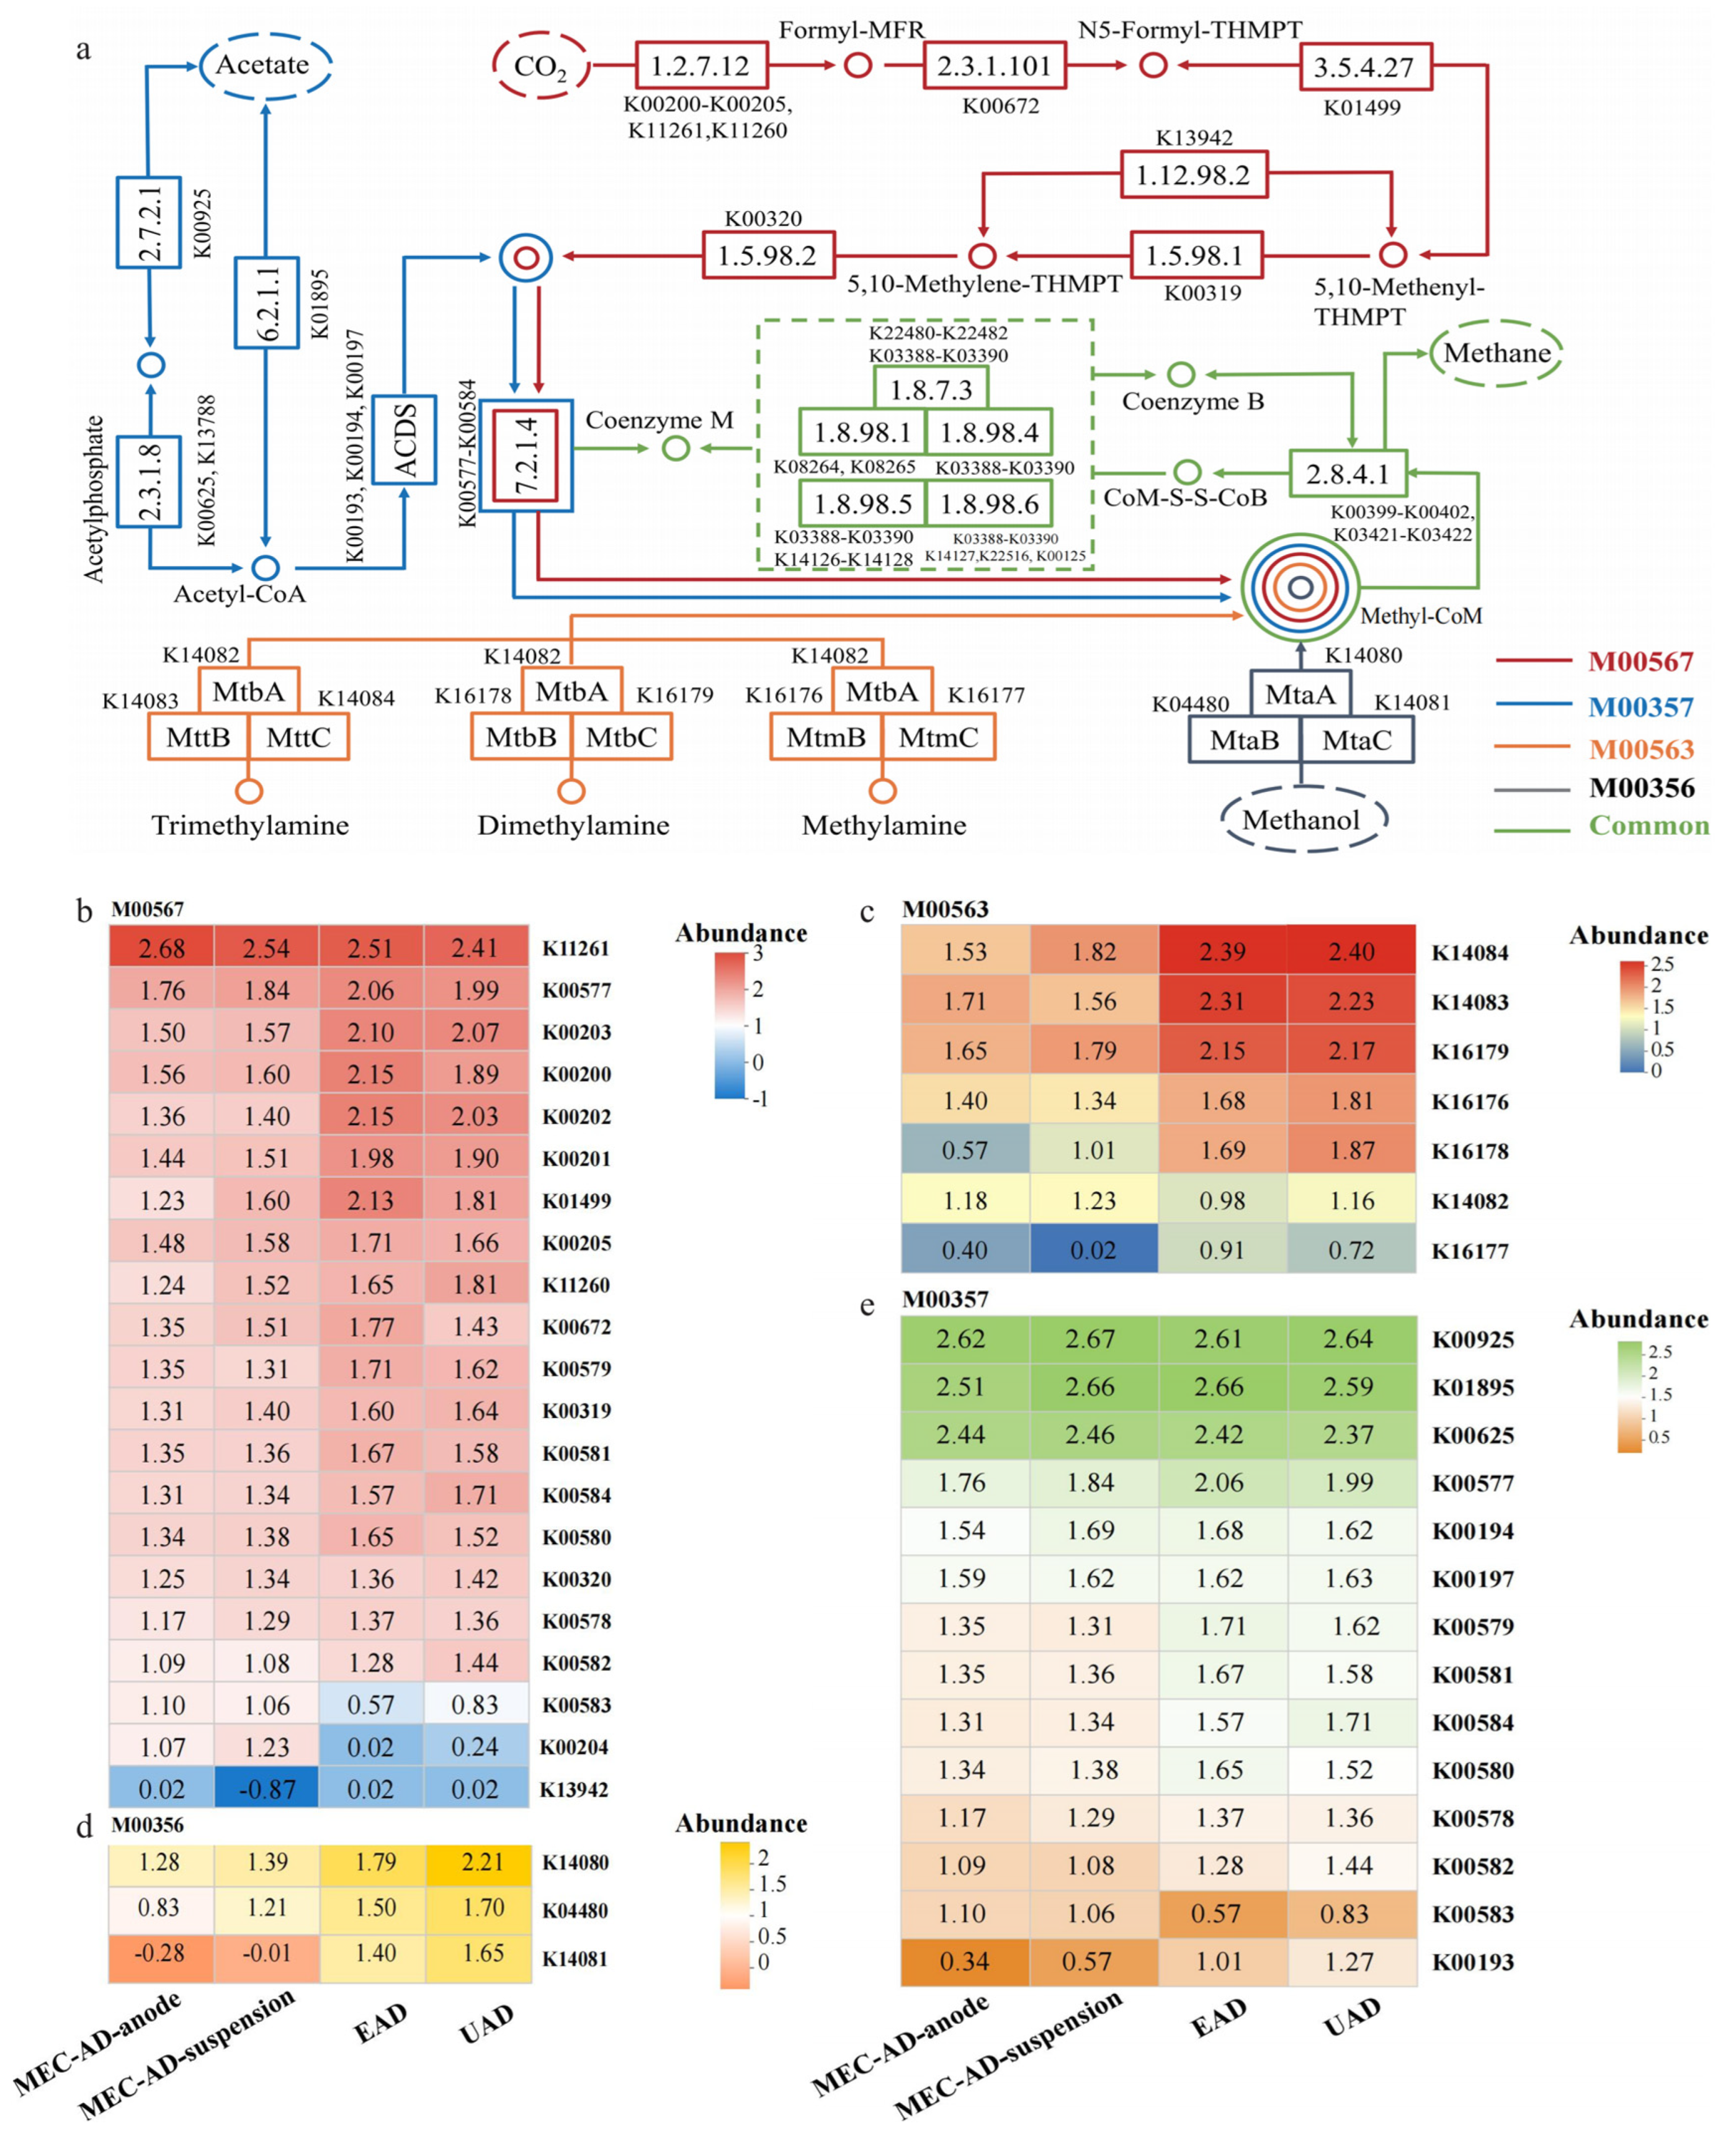
3.4.2. Methanogenic Metabolism Pathways

To investigate methanogenic metabolic mechanisms in different anaerobic digestion systems, this study performed a comprehensive analysis of enzyme-encoding genes associated with methane metabolism. The results indicate that methane production mainly occurs through four pathways (Figure 5a), encoded in four modules: carbon dioxide reduction [M00567], acetate decarboxylation [M00357], methanol methanogenesis [M00356], and methylamine/dimethylamine/trimethylamine methanogenesis [M00563]. Figure 5b displays relative abundance distribution of functional genes in methanogenic metabolic modules across various AD systems.
Within the acetate decarboxylation methanogenesis module [M00357], primary KO pathways (K00925, K01895, and K00625) demonstrated no significant variation across samples. The MEC-AD system exhibited significant upregulation of encoding genes K11261, K00204, and K00583 in the carbon dioxide reduction [M00567] methanogenesis module, with corresponding key enzymes [EC:1.2.7.12] and [EC:7.2.1.4]. In comparison, the EAD system showed significant regulation of encoding genes K00200, K00202, and K01499, associated with key enzymes [EC:1.2.7.12] and [EC:3.5.4.27], which play essential roles in carbon dioxide reduction pathways (Figure 5a). Relative to the former two systems, the UAD system displayed significant regulation of encoding genes K14080, K04480, and K14081 in the methanol methanogenesis [M00356] module, along with K14084 and K14083 in the methylamine/dimethylamine/trimethylamine methanogenesis [M00563] module. This pattern suggests that the UAD system primarily depends on methylotrophic pathways for methane production, closely linked to the enrichment of methylotrophic methanogens including Methanomassiliicoccus. These findings highlight substantial differences in methane production pathways among various AD systems, offering valuable insights for methanogenic performance optimization.
The analysis of IET and syntrophic metabolism in Section 3.4.1 demonstrates that all systems can produce methane through acetate decarboxylation pathways and formate- MIET pathways in syntrophic cooperation with methanogens. Both MEC-AD and EAD systems show significant upregulation of DIET pathway encoding genes, enhancing carbon dioxide reduction methanogenesis processes, with electromethanogenesis representing the primary pathway. This phenomenon likely results from the enrichment of methanogenic archaea such as Methanobacterium and Methanosarcina, capable of direct electron transfer during the electrical acclimation of KW digestate [41,47]. Furthermore, the MEC-AD system also regulates hydrogen-MIET pathway encoding genes, indicating the coexistence of hydrogenotrophic methanogenesis pathways.
In comparison, the UAD system significantly enriches encoding genes associated with methylamine/dimethylamine/trimethylamine and methanol methanogenesis pathways, primarily depending on methylotrophic methanogenesis pathways. This characteristic closely relates to the enrichment of methylotrophic methanogens, including Methanomassiliicoccus in this system. These findings highlight substantial differences in methane production pathways across different systems, with the MEC-AD system achieving higher methane yield and metabolic efficiency through the synergistic effects of multiple pathways.

4. Conclusions

The MEC-AD system achieved the highest CH4 yield of 223.12 mL CH4·g−1 VS, which was 31.27% and 25.24% higher than those of conventional UAD and EAD, respectively. MEC-AD also obtained higher substance conversion rates, reaching 82.32% for TS and 83.39% for VS. Additionally, it accelerated the degradation of SCOD, effectively alleviating biogas production stagnation caused by the accumulation of VFAs as intermediate products. The MEC-AD system enriched the diversity and abundance of microbial genera, creating favorable conditions for efficient substrate degradation and the establishment of diverse syntrophic relationships. Additionally, by upregulating the encoding genes of key enzymes, the system enhanced the methanogenic mechanisms of both DIET and MIET within the system. Therefore, the MEC-AD system is an effective technological approach for achieving high-efficiency biomethane production from KW.

Supplementary Materials

The following supporting information can be downloaded at https://www.mdpi.com/article/10.3390/en18071629/s1: Table S1: Functional orthologues of genes putatively involved in electron transfer for syntrophic metabolism.

Author Contributions

Q.Z.: investigation, data curation, formal analysis, and writing—original draft. H.W.: validation and visualization. R.L.: visualization, supervision, and resources. H.Y.: writing—review and editing, project administration, resources, and supervision. X.L.: methodology, conceptualization, project administration, and funding acquisition. All authors have read and agreed to the published version of the manuscript.

Funding

This research was funded by National Key Research and Development Program of China grant number [No. 2024YFC3909101].

Data Availability Statement

The original contributions presented in this study are included in the article/Supplementary Material. Further inquiries can be directed to the corresponding author.

Conflicts of Interest

Author Heran Wang was employed by the company COFCO Joycome Foods Limited, Beijing 100020, China. Author Rufei Liu was employed by the company Cucde Environmental Technology Co., Ltd., No. 36, Deshengmenwai Street, Xicheng District, Beijing 100120, China. The remaining authors declare that the research was conducted in the absence of any commercial or financial relationships that could be construed as a potential conflict of interest.

References

  1. Hu, F.; Fu, N.; Wei, Q.; Liu, S.; Hu, Y.; Zhang, S.; Wang, X.; Peng, X.; Dai, H.; Wei, Y. Effect of Alkali Pretreatment Time on Kitchen Waste Anaerobic Digestion Performance Enhanced by Alkali Pretreatment Combined with Bentonite: Performance Enhancement, Microbial Community Structure, and Functional Gene Analysis. Environ. Sci. Pollut. Res. 2024, 31, 7167–7178. [Google Scholar] [CrossRef]
  2. Zhang, H.; Zhao, J.; Fu, Z.; Wang, Y.; Guan, D.; Xie, J.; Zhang, Q.; Liu, Q.; Wang, D.; Sun, Y. Metagenomic Approach Reveals the Mechanism of Calcium Oxide Improving Kitchen Waste Dry Anaerobic Digestion. Bioresour. Technol. 2023, 387, 129647. [Google Scholar] [CrossRef]
  3. Hu, F.; Fu, N.; Wei, Q.; Wang, X.; Pan, Z.; Hu, Y. The Potential Role of Iron-Carbon Micro-Electrolysis Materials in Curtailing Lag-Phase Stimulates Kitchen Waste Anaerobic Digestion at Different Solid Contents: Performance, Synergistic Effect and Microbial Response. J. Environ. Manag. 2024, 370, 122733. [Google Scholar] [CrossRef]
  4. Dahiya, S.; Kumar, A.N.; Shanthi Sravan, J.; Chatterjee, S.; Sarkar, O.; Mohan, S.V. Food Waste Biorefinery: Sustainable Strategy for Circular Bioeconomy. Bioresour. Technol. 2018, 248, 2–12. [Google Scholar] [CrossRef] [PubMed]
  5. Li, M.; Zhang, Q.; Liu, Y.; Zhu, J.; Sun, F.; Cui, M.-H.; Liu, H.; Zhang, T.C.; Chen, C. Enhancing Degradation of Organic Matter in Microbial Electrolytic Cells Coupled with Anaerobic Digestion (MEC-AD) Systems by Carbon-Based Materials. Sci. Total Environ. 2023, 900, 165805. [Google Scholar] [CrossRef]
  6. Zou, L.; Wang, C.; Zhao, X.; Wu, K.; Liang, C.; Yin, F.; Yang, B.; Liu, J.; Yang, H.; Zhang, W. Enhanced Anaerobic Digestion of Swine Manure via a Coupled Microbial Electrolysis Cell. Bioresour. Technol. 2021, 340, 125619. [Google Scholar] [CrossRef]
  7. Tripathi, A.; Kumar, S.; Jadhav, G.S.; Jadhav, D.A.; Ghangrekar, M.M.; Surampalli, R.Y. Electromethanogenic Reactor for Biogas Production Using Agricultural and Livestock Waste and Its Comparative Analysis with Biogas Plant: A Mini-Review. Biomass Bioenergy 2024, 185, 107246. [Google Scholar] [CrossRef]
  8. Cheng, S.; Logan, B.E. Sustainable and Efficient Biohydrogen Production via Electrohydrogenesis. Proc. Natl. Acad. Sci. USA 2007, 104, 18871–18873. [Google Scholar] [CrossRef]
  9. Kanellos, G.; Tremouli, A.; Arvanitakis, G.; Lyberatos, G. Boosting Methane Production and Raw Waste Activated Sludge Treatment in a Microbial Electrolysis Cell-Anaerobic Digestion (MEC-AD) System: The Effect of Organic Loading Rate. Bioelectrochemistry 2024, 155, 108555. [Google Scholar] [CrossRef]
  10. Choi, J.-M.; Lee, C.-Y. Bioelectrochemical Enhancement of Methane Production in Anaerobic Digestion of Food Waste. Int. J. Hydrogen Energy 2019, 44, 2081–2090. [Google Scholar] [CrossRef]
  11. Ao, T.-J.; Zhao, X.-Q.; Mehmood, M.A.; Wang, N.; Zhu, H.; Liu, C.-G.; Bai, F.-W. A Double-Chamber Microbial Electrolysis Cell Improved the Anaerobic Digestion Efficiency and Elucidated the Underlying Bio-Electrochemical Mechanism. Chem. Eng. J. 2023, 471, 144228. [Google Scholar] [CrossRef]
  12. Wang, L.; Yu, Q.; Sun, C.; Zhu, Y.; Wang, Z.; Zhang, Y. Intermittent Voltage Induced Sludge Polarization to Enhance Anaerobic Digestion. Water Res. 2022, 224, 119071. [Google Scholar] [CrossRef]
  13. Zhang, Q.; Peng, C.; Pu, J.; Feng, Y.; Zhu, H.; Yang, M.; Xu, Z.; Zhang, Y.; Yang, L.; Luo, D.; et al. Intermittent Energization Improves Anaerobic Digestion of Microbial Electrolysis Cell-Assisted Nitrogen-Rich Sludge under Mesophilic and Thermophilic Conditions. J. Environ. Chem. Eng. 2024, 12, 111630. [Google Scholar] [CrossRef]
  14. Li, Y.; Ma, Y.; Zhan, J.; Zhang, Y.; Zhao, Z.; Zhao, Z. Combining Metal-Microbe and Microbe-Microbe Dual Direct Electron Transfer on Fe(0)-Cathode of Bio-Electrochemical System to Enhance Anaerobic Digestion of Cellulose Wastewater. Chin. Chem. Lett. 2022, 33, 3106–3112. [Google Scholar] [CrossRef]
  15. Baek, G.; Saikaly, P.E.; Logan, B.E. Addition of a Carbon Fiber Brush Improves Anaerobic Digestion Compared to External Voltage Application. Water Res. 2021, 188, 116575. [Google Scholar] [CrossRef] [PubMed]
  16. Zhang, R.; Zhang, M.; Mou, H.; An, Z.; Fu, H.; Su, X.; Chen, C.; Chen, J.; Lin, H.; Sun, F. Comparation of Mesophilic and Thermophilic Anaerobic Co-Digestion of Food Waste and Waste Activated Sludge Driven by Biochar Derived from Kitchen Waste. J. Clean. Prod. 2023, 408, 137123. [Google Scholar] [CrossRef]
  17. Zhang, S.; Guan, W.; Sun, H.; Zhao, P.; Wang, W.; Gao, M.; Sun, X.; Wang, Q. Intermittent Energization Improves Microbial Electrolysis Cell-Assisted Thermophilic Anaerobic Co-Digestion of Food Waste and Spent Mushroom Substance. Bioresour. Technol. 2023, 370, 128577. [Google Scholar] [CrossRef]
  18. Wei, Y.; Chen, W.; Hou, J.; Qi, X.; Ye, M.; Jiang, N.; Meng, F.; Xi, B.; Li, M. Biogas Upgrading Performance and Underlying Mechanism in Microbial Electrolysis Cell and Anaerobic Digestion Integrated System. Bioresour. Technol. 2024, 400, 130683. [Google Scholar] [CrossRef]
  19. Chen, Y.; Dai, X.; Wang, H.; Liu, X.; Gu, L. Insights into the Mitigative Effects of Microbial Electrolysis Cell on Anaerobic Digestion under High Ammonia Condition. Chem. Eng. J. 2023, 474, 145760. [Google Scholar] [CrossRef]
  20. Wang, A.; Liu, W.; Cheng, S.; Xing, D.; Zhou, J.; Logan, B.E. Source of Methane and Methods to Control Its Formation in Single Chamber Microbial Electrolysis Cells. Int. J. Hydrogen Energy 2009, 34, 3653–3658. [Google Scholar] [CrossRef]
  21. Xu, Z.; Yuan, H.; Li, X. Anaerobic Bioconversion Efficiency of Rice Straw in Continuously Stirred Tank Reactor Systems Applying Longer Hydraulic Retention Time and Higher Load: One-Stage vs. Two-Stage. Bioresour. Technol. 2021, 321, 124206. [Google Scholar] [CrossRef] [PubMed]
  22. Wang, C.; Ye, X.; Liu, Y.; Jia, Z.; Cao, C.; Xiao, Q.; Du, J.; Kong, X.; Wu, X.; Chen, Z.; et al. Enhanced Anaerobic Digestion for Degradation of Swine Wastewater through a Fe/Ni-MOF Modified Microbial Electrolysis Cell. J. Clean. Prod. 2022, 380, 134773. [Google Scholar] [CrossRef]
  23. Jiang, Z.; Yu, Q.; Sun, C.; Wang, Z.; Jin, Z.; Zhu, Y.; Zhao, Z.; Zhang, Y. Additional Electric Field Alleviates Acidity Suppression in Anaerobic Digestion of Kitchen Wastes via Enriching Electro-Active Methanogens in Cathodic Biofilms. Water Res. 2022, 212, 118118. [Google Scholar] [CrossRef] [PubMed]
  24. Zhao, Q.; Yuan, H.; Wang, H.; Li, X. Enhancing Biomethane Production from Corn Stover via Anaerobic Digestion Incorporated with Microbial Electrolysis Cell. Chin. J. Chem. Eng. 2025; in press. [Google Scholar] [CrossRef]
  25. Peng, C.; Wang, T.; Feng, Y.; Fan, X.; Niu, J.; Wang, J.; Gao, W.; Zhou, Y.; Hu, W.; Zhang, Q. Enhanced Hydrolysis and Methane Yield of Temperature-Phased Dewatered Sludge Anaerobic Digestion by Microbial Electrolysis Cell. Bioresour. Technol. 2024, 400, 130682. [Google Scholar] [CrossRef]
  26. Yu, Z.; Leng, X.; Zhao, S.; Ji, J.; Zhou, T.; Khan, A.; Kakde, A.; Liu, P.; Li, X. A Review on the Applications of Microbial Electrolysis Cells in Anaerobic Digestion. Bioresour. Technol. 2018, 255, 340–348. [Google Scholar] [CrossRef] [PubMed]
  27. Dong, H.; Cheng, J.; Li, H.; Yue, L.; Xia, R.; Zhou, J. Electron Transfer from Geobacter Sulfurreducens to Mixed Methanogens Improved Methane Production with Feedstock Gases of H2 and CO2. Bioresour. Technol. 2022, 347, 126680. [Google Scholar] [CrossRef]
  28. Jiang, J.; Zhang, Y.; Li, K.; Wang, Q.; Gong, C.; Li, M. Volatile Fatty Acids Production from Food Waste: Effects of pH, Temperature, and Organic Loading Rate. Bioresour. Technol. 2013, 143, 525–530. [Google Scholar] [CrossRef]
  29. Yasser Farouk, R.; Li, L.; Wang, Y.; Li, Y.; Melak, S. Influence of Pretreatment and pH on the Enhancement of Hydrogen and Volatile Fatty Acids Production from Food Waste in the Semi-Continuously Running Reactor. Int. J. Hydrogen Energy 2020, 45, 3729–3738. [Google Scholar] [CrossRef]
  30. Neshat, S.A.; Mohammadi, M.; Najafpour, G.D.; Lahijani, P. Anaerobic Co-Digestion of Animal Manures and Lignocellulosic Residues as a Potent Approach for Sustainable Biogas Production. Renew. Sustain. Energy Rev. 2017, 79, 308–322. [Google Scholar] [CrossRef]
  31. Pierra, M.; Carmona-Martínez, A.A.; Trably, E.; Godon, J.-J.; Bernet, N. Specific and Efficient Electrochemical Selection of Geoalkalibacter subterraneus and Desulfuromonas acetoxidans in High Current-Producing Biofilms. Bioelectrochemistry 2015, 106, 221–225. [Google Scholar] [CrossRef]
  32. Vikromvarasiri, N.; Koyama, M.; Kurniawan, W.; Pisutpaisal, N.; Nakasaki, K. Enhancing Methane Recovery by Intermittent Substrate Feeding and Microbial Community Response in Anaerobic Digestion of Glycerol. Renew. Energy 2023, 204, 106–113. [Google Scholar] [CrossRef]
  33. Sapireddy, V.; Katuri, K.P.; Muhammad, A.; Saikaly, P.E. Competition of Two Highly Specialized and Efficient Acetoclastic Electroactive Bacteria for Acetate in Biofilm Anode of Microbial Electrolysis Cell. Npj Biofilms Microbiomes 2021, 7, 47. [Google Scholar] [CrossRef]
  34. Bond, D.R.; Holmes, D.E.; Tender, L.M.; Lovley, D.R. Electrode-Reducing Microorganisms That Harvest Energy from Marine Sediments. Science 2002, 295, 483–485. [Google Scholar] [CrossRef] [PubMed]
  35. Rimboud, M.; Etcheverry, L.; Barakat, M.; Achouak, W.; Bergel, A.; Délia, M.-L. Hypersaline Microbial Fuel Cell Equipped with an Oxygen-Reducing Microbial Cathode. Bioresour. Technol. 2021, 337, 125448. [Google Scholar] [CrossRef]
  36. Han, G.; Shin, S.G.; Cho, K.; Lee, J.; Kim, W.; Hwang, S. Temporal Variation in Bacterial and Methanogenic Communities of Three Full-Scale Anaerobic Digesters Treating Swine Wastewater. Environ. Sci. Pollut. Res. 2019, 26, 1217–1226. [Google Scholar] [CrossRef]
  37. Li, X.; Chu, S.; Wang, P.; Li, K.; Su, Y.; Wu, D.; Xie, B. Potential of Biogas Residue Biochar Modified by Ferric Chloride for the Enhancement of Anaerobic Digestion of Food Waste. Bioresour. Technol. 2022, 360, 127530. [Google Scholar] [CrossRef]
  38. Xing, T.; Wang, Z.; Zhen, F.; Liu, H.; Wo, D.; Li, L.; Guo, Y.; Kong, X.; Sun, Y. Initial pH-Driven Production of Volatile Fatty Acid from Hybrid Pennisetum. Bioresour. Technol. 2022, 347, 126426. [Google Scholar] [CrossRef]
  39. Ao, T.; Chen, L.; Chen, Y.; Liu, X.; Wan, L.; Li, D. The Screening of Early Warning Indicators and Microbial Community of Chicken Manure Thermophilic Digestion at High Organic Loading Rate. Energy 2021, 224, 120201. [Google Scholar] [CrossRef]
  40. Kim, E.; Lee, J.; Han, G.; Hwang, S. Comprehensive Analysis of Microbial Communities in Full-Scale Mesophilic and Thermophilic Anaerobic Digesters Treating Food Waste-Recycling Wastewater. Bioresour. Technol. 2018, 259, 442–450. [Google Scholar] [CrossRef]
  41. Huang, S.; Shen, M.; Ren, Z.J.; Wu, H.; Yang, H.; Si, B.; Lin, J.; Liu, Z. Long-Term in Situ Bioelectrochemical Monitoring of Biohythane Process: Metabolic Interactions and Microbial Evolution. Bioresour. Technol. 2021, 332, 125119. [Google Scholar] [CrossRef]
  42. Feldewert, C.; Lang, K.; Brune, A. The Hydrogen Threshold of Obligately Methyl-Reducing Methanogens. FEMS Microbiol. Lett. 2020, 367, fnaa137. [Google Scholar] [CrossRef] [PubMed]
  43. Conway de Macario, E.; Macario, A.J.L. Methanogenic Archaea in Health and Disease: A Novel Paradigm of Microbial Pathogenesis. Int. J. Med. Microbiol. 2009, 299, 99–108. [Google Scholar] [CrossRef] [PubMed]
  44. Jie, Z.; Ya-Hai, L.U. A Review of Interspecies Electron Transfer in Syntrophic-Methanogenic Associations. Microbiol. China 2015, 42, 920–927. [Google Scholar]
  45. Zhang, H.; Zhou, J.; Zhang, C.; Li, M. Interspecies Electron Transfer during Microbial Syntrophic Methanogenesis. Acta Microbiol. Sin. 2023, 63, 2047–2065. [Google Scholar] [CrossRef]
  46. Cai, C.; Li, L.; Hua, Y.; Liu, H.; Dai, X. Ferroferric Oxide Promotes Metabolism in Anaerolineae Other than Microbial Syntrophy in Anaerobic Methanogenesis of Antibiotic Fermentation Residue. Sci. Total Environ. 2021, 758, 143601. [Google Scholar] [CrossRef]
  47. Li, Y.; Liu, M.; Che, X.; Li, C.; Liang, D.; Zhou, H.; Liu, L.; Zhao, Z.; Zhang, Y. Biochar Stimulates Growth of Novel Species Capable of Direct Interspecies Electron Transfer in Anaerobic Digestion via Ethanol-Type Fermentation. Environ. Res. 2020, 189, 109983. [Google Scholar] [CrossRef]
Figure 1. Daily biogas/methane production (a,b), cumulative methane yield (c), and biogas component final production (d) in different AD systems ((c): solid dots indicate experimental data of CMY; dashed lines indicate fitted curves of CMY).
Energies 18 01629 g001
Figure 2. Final substrate conversion in different AD systems: (a) TS and VS, (b) cellulose and hemicellulose, and trends in metabolites with fermentation time of (c) SCOD and (d) VFAs (Group M: MEC-AD; E: EAD; U: UAD).
Energies 18 01629 g002
Figure 3. Principal coordinate analysis (PCoA) of bacteria (a) and archaea (b) based on Bray–Curtis. Relative abundance of predominant bacteria (c) and archaea (d) communities in anode biofilm, suspension, and digestates from AD systems at the genus levels.
Energies 18 01629 g003
Figure 4. Heatmap based on relative abundance of functional genes for interspecies electron transfer syntrophic metabolism in different AD systems.
Energies 18 01629 g004
Figure 5. Key pathways and enzymes for methanogenesis during AD (a) and heatmap based on relative abundance of functional genes in methanogenic metabolic modules of different AD systems ((b) M00567, (c) M00563, (d) M00356, and (e) M00357).
Energies 18 01629 g005
Table 1. Characteristics of kitchen waste (KW) and inoculum a.
Kitchen WasteOriginal InoculumElectrically Domesticated Inoculum
TS (%) b67.64 ± 0.1512.56 ± 0.106.00 ± 0.13
VS (%) b59.64 ± 0.355.04 ± 0.133.10 ± 0.23
Cellulose (%) c20.83 ± 2.041.87 ± 0.120.64 ± 0.05
Hemicellulose (%) c16.54 ± 0.923.57 ± 0.741.31 ± 0.16
Lignin (%) c11.01 ± 1.782.44 ± 0.161.11 ± 0.11
pH/7.82 ± 0.037.73 ± 0.05
a Values are the mean ± standard deviation (SD) (n = 3). b Content of fresh matter. c Content of dry matter.
Table 2. Kinetic analysis of methane yield for different AD systems.
Modified Gompertz Model
ReactorsH (mL CH4/g VS)p (mL CH4/g VS)a (d)λ (mL CH4/(g VS·d))R2
MEC-AD223.12 ± 2.14245.45 ± 4.275.07 ± 0.159.40 ± 0.160.996
EAD178.16 ± 1.72194.34 ± 5.1217.33 ± 0.4711.11 ± 0.740.996
UAD169.97 ± 0.98176.08 ± 2.1718.70 ± 0.1413.92 ± 0.410.998
H: cumulative CH4 yield (mL/g VS); p: CH4 production potential (mL/g VS); a: lag phase time; λ: maximum CH4 yield rate (mL/(g VS⋅d).
Table 3. Diversity indices of microbial communities in each system.
SampleBacteriaArchaea
ChaoShannonSimpsonCoverageChaoShannonSimpsonCoverage
MEC-AD_A1061.393.360.250.99936.000.800.601.000
MEC-AD_S1119.035.150.020.99945.001.370.381.000
EAD1196.215.020.021.00076.001.950.231.000
UAD1293.735.240.020.99844.001.210.481.000
MEC-AD_A represents microbial samples from the anode biofilm, and MEC-AD_S represents microbial samples from the suspension.
Disclaimer/Publisher’s Note: The statements, opinions and data contained in all publications are solely those of the individual author(s) and contributor(s) and not of MDPI and/or the editor(s). MDPI and/or the editor(s) disclaim responsibility for any injury to people or property resulting from any ideas, methods, instructions or products referred to in the content.

