Abstract
The prolonged operation of thermal power plants inevitably leads to component aging and a gradual decline in performance. This deterioration increases the gross heat rate and reduces electrical output, resulting in higher fuel consumption and lower electricity production. Consequently, these issues can cause significant financial losses and threaten the plant’s competitiveness. This paper presents a comprehensive methodology for improving the performance of existing plants. The methodology consists of two crucial elements: steam turbine testing and numerical simulation of the process. The tests should be comprehensive to ensure accurate measurements and reliable conclusions. The developed method for process simulation enables the calculation of overall performance, like specific heat rate and thermal efficiency, as well as the performance of individual components under various operational conditions. Comparing numerical results with experimental data can effectively identify operational problems. Based on these findings, targeted overhauls and other corrective measures can substantially improve the plant’s thermal efficiency and financial performance. The system was demonstrated through a case study of a 120 MW coal-fired steam turbine. The test revealed that it consumes more than 10% additional heat compared to its original design specifications. The analysis identified operational issues and recommended improvement measures, focusing exclusively on the steam turbine set while excluding the boiler.
1. Introduction
Despite the growing use of renewable energy sources, fossil fuel-fired power plants continue to generate the majority of electricity in many countries. According to the International Energy Agency (IEA) [1], fossil fuels accounted for 61% of global electricity generation in 2023. While IEA forecasts predict a gradual decline in the share of fossil fuels in the energy mix, significant production from fossil fuel-based power plants is expected to continue in several regions over the next two decades.
This demand will necessitate the modernization and upgrading of existing steam turbine power plants. Many power plants in the 100–600 MW range worldwide have been operating for 20–40 years. While some of these units have reached the end of their theoretical lifespan, many remain in relatively good condition, with no immediate need for closure or replacement. However, significant pressure and strict legal obligations require the modernization of these plants. The primary goals are to drastically reduce pollution and CO2 emissions while improving efficiency. Achieving these objectives will allow existing plants to comply with legal requirements and remain competitive in the energy market for the next 10–20 years [2].
When considering improvements to an older unit, detailed knowledge of the actual performance of the entire system and its components is essential [3,4]. This knowledge enables planning engineers to identify the most effective technical and commercial solutions for the required upgrades. Accurate calculation of performance improvements is crucial for determining the return on investment [5]. However, testing units using existing plant instrumentation often results in significant uncertainty, increasing the risk of incorrect improvement decisions [6]. Therefore, sophisticated measuring equipment, appropriate calculation tools, and substantial experience are necessary for reliable testing.
The gross heat rate and overall thermal efficiency are critical performance parameters for the economical operation of a steam power plant. As such, these parameters are key focal points in plant tests and the planning of overhauls.
During daily power plant operations, deviations in thermodynamic parameters, such as live steam temperature and condenser pressure, are common. Additionally, the gradual aging of plant components and the deterioration of their performance occur over time [6,7]. These deviations result in the steam turbine plant generating less electricity than predicted by the design heat balance diagram, despite using the same heat input from the boiler through the control boundary [8,9,10].
Thermal power plants (TPP) in operation today are equipped with a distributed control system (DCS) that collects data from hundreds of electronic measuring instruments throughout the plant. Based on our experience, in most TPPs, these signals are primarily used for controlling plant operations and lack analytical capabilities. As a result, detailed information on individual equipment performance and the impact of parameter deviations on overall plant efficiency is often unavailable. Typically, power plant staff attempt to achieve the design power output by increasing heat input, often compensating for power deficits by burning more fuel. This approach leads to higher specific fuel consumption and associated negative consequences, such as thermal overloading of the boiler, boiler tube ruptures, and unplanned outages.
To address these issues, periodic tests of the plant should be conducted to determine the current status of components and identify parameter deviations. A coal-fired power plant consists of two main systems: the boiler plant, where the chemical energy of the fuel is converted to heat, and the steam turbine set, where heat is converted to mechanical work and subsequently to electricity. Since these processes are different, it is common practice to test, optimize, and simulate these two parts of the power plant separately. This paper focuses on the improvement of the thermodynamic performance of the steam turbines through testing and simulation.
Tests on a steam turbine should be conducted using extensive instrumentation, ensuring that no deficiencies and adhering to applicable standards and the latest advancements in the field [11,12]. To draw valid conclusions, it is essential to perform parallel calculations of the heat balance diagram and evaluate the performance of individual components under both design and off-design conditions.
Numerous systems for monitoring and diagnosing thermal power plants have been developed. Comprehensive reviews of diagnostic methods for gas turbines and steam turbines are presented in [13,14], respectively.
Each diagnostic method is distinguished by its selected parameters and analytical approach. Broadly, performance monitoring techniques fall into three categories: model-based, data-driven, and hybrid methods. Model-based approaches rely on analytical simulations of power plant operations, while data-driven methods utilize machine learning techniques, such as neural networks, to derive insights from real-world operational data under both nominal and off-design conditions. Hybrid methods integrate aspects of both approaches, combining analytical models with data-driven learning. A notable example of a model-based diagnostic method for gas turbines is found in [15], whereas in steam turbine diagnostics, data-driven techniques are more prevalent [16].
The method for analysis of operation and improvement of the steam turbine performance presented in this paper is based on analytical models, which enable rapid calculations and precise predictions of component performance and overall thermal efficiency. This approach effectively handles both nominal and a wide range of part-load conditions, as well as various plant configurations. The developed methodology is demonstrated through a case study of a 120 MW coal-fired power plant.
2. Methodology
The procedure for improving the performance of an existing steam turbine plant consists of the following steps:
- Prepare input data: steam turbine internal efficiency and flow coefficient at nominal load, the geometry of condenser and heaters (number, dimension and material of pipes, design type), nominal pump characteristics, etc.
- Calculate the cycle and heat balance under design and off-design conditions to establish correlations between cycle parameters, component performances, and overall steam turbine plant performance (thermal efficiency and electrical power output).
- Conduct comprehensive tests of the steam turbine set and all its components at the nominal steam mass flow (nominal test case) and several part loads.
- Evaluate the test results and calculate the overall performance of the steam turbine set and the operating performance of individual components based on the test data.
- Calculate the cycle using the same heat input as in the nominal test case but applying the design cycle parameters and component performances (nominal design case).
- Compare the test results with the numerical results to identify the deficit in overall plant performance, including differences between the measured values of power output and overall thermal efficiency (test case) and the values achievable under design conditions with the same heat input (design case).
- Utilize the correlations developed in step 2 to assess the impact of each deviation on overall performance.
- Define a list of actions for performance improvement based on the previous results.
Mathematical models of the thermodynamic cycle and components must be individually prepared for each plant due to variations in plant configuration, heat balance diagrams, and the geometric and thermodynamic parameters of the components.
2.1. Method for Calculation of Steam Turbine Performance
The method follows a standard approach for calculating the heat balance diagram of a steam turbine, utilizing a modular principle. Each component—such as the turbine, condenser, feedwater system, main condenser heaters, and feedwater pump—is represented by a set of equations that adhere to fundamental conservation laws, including:
- mass conservation
- 2.
- energy conservation
To simulate energy conversion in a component, models for the determination of performance based on the geometry parameters and operation conditions are developed.
The equations governing each component collectively form a system of equations that represents the entire steam turbine plant, which is solved through an iterative process. Given specific boundary conditions—such as live steam and reheat steam parameters, cooling water temperature, and flow rate—the method determines the live steam mass flow rate, as well as the mass flow rates and thermodynamic properties of water and steam at each point in the heat balance diagram.
2.2. Steam Turbine Testing
For reliable conclusions, obtaining precise test results is of utmost importance. The Laboratory of Thermal Turbomachinery at the University of Belgrade (LTT/UB) is fully equipped with State-of-the-Art measuring instruments and a 200-channel data acquisition system, enabling steam turbine testing in compliance with industry standards, including IEC 953-0-3, ASME PTC 6, and ASME PTC 46.
3. Basic Data on the Morava Thermal Power Plant
The Morava Thermal Power Plant has an installed nominal output of 120 MW. Since its initial synchronization with the electrical grid in 1969, the plant has accumulated over 220,000 operating hours. Table 1 presents the main thermodynamic parameters of the plant according to the design specifications.

Table 1.
Design parameters of the Morava thermal power plant.
The power plant features one steam reheat, six steam extractions from the turbine for main condensate/feed water heating, two low-pressure (LP) heaters, and three high-pressure (HP) heaters. Despite utilizing water from the Morava River for condenser cooling, the design condenser pressure remains relatively high. The design condenser pressure of 0.071 bar is specified for a cooling water temperature of 24 °C, typical of summer periods.
The plant burns a mixture of lignite, brown coal, and hard coal as fuel. Although the plant’s design is outdated with low parameters and a high heat rate, it remains a crucial asset due to its reliable operation, capability to burn various types of coal from nearby mines, relatively quick start-up time, and convenient location. These factors make the plant essential for meeting high electrical energy demand and covering peak loads.
4. Test
Due to escalating fuel costs, the management of the power plant has explored options to modernize operations, aiming to enhance performance and comply with new regulatory standards. The Laboratory of Thermal Turbomachinery at the University of Belgrade (LTT/UB) was enlisted to conduct tests on the steam turbine set and assess the current condition of its components. Based on the findings, recommendations for ongoing operation were to be provided, alongside a detailed list of measures for future modernization of the steam turbine plant. Notably, the analysis excluded the boiler plant.
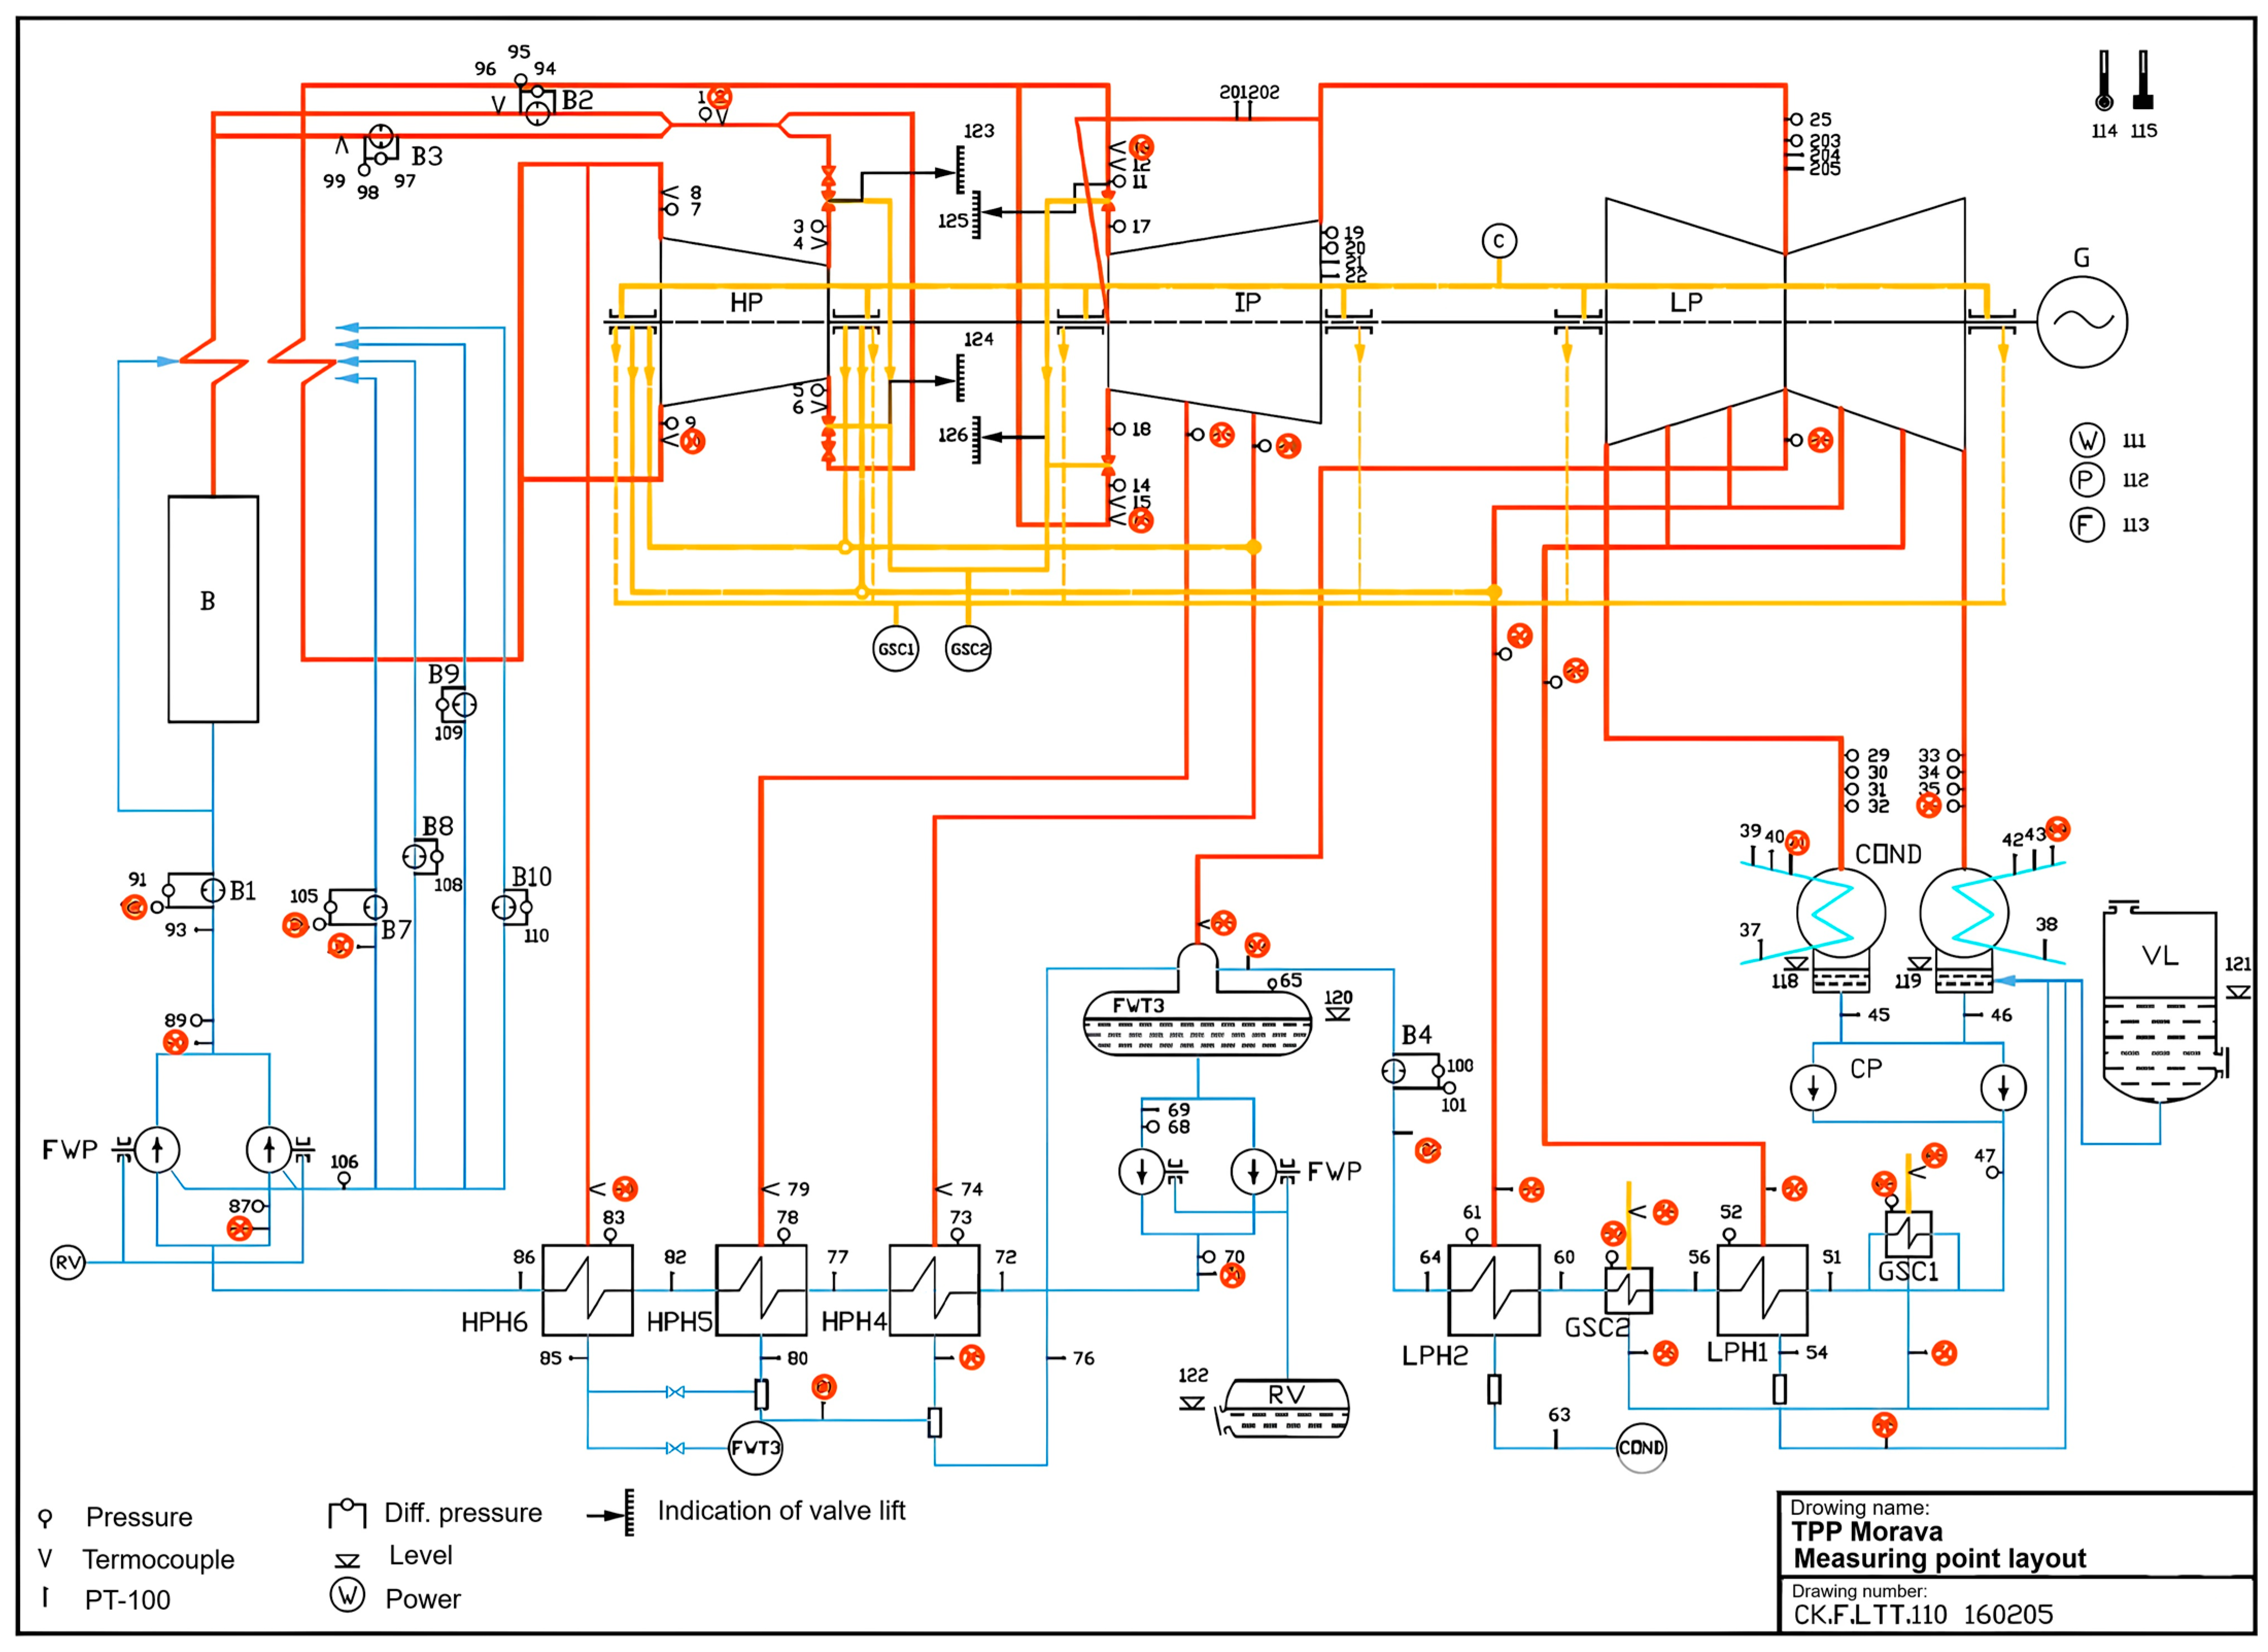
Figure 1 illustrates a diagram depicting the locations of measurement points for testing within the Morava TPP steam turbine. All pressure and differential pressure transmitters used were of an accuracy class ranging from 0.04% to 0.07%. Temperatures below 250 °C were monitored using Pt-100 precision resistance thermometers of class A, while temperatures exceeding 250 °C were measured with class 1 thermocouples. Electrical power measurements were conducted with a class 0.2% power meter. Mass flows were quantified using orifices, and cooling water flow was assessed using an ultrasonic flow meter. Data acquisition involved a 200-channel system based on a National Instruments PXI DAQ system. Before testing, all instruments and data acquisition systems underwent calibration. Orifices were dismantled, and inspected, and their dimensions verified to ensure accuracy, which exceeded standard requirements [11].

Figure 1.
Diagram of measurement points for steam turbine testing at Morava 120 MW TPP.
The tests were conducted at specific operating loads: 110 MW (test T110), 105 MW (T105), 90 MW (T90 and T90K), and 80 MW (T80).
Before the official steam turbine tests, additional tests were performed:
- condenser air in-leakage test,
- preliminary steam turbine tests.
All tests strictly adhered to standard IEC 953-2 [11]. Properties of water and steam were determined using methodologies outlined in [17]. A computer code designed for test execution, data acquisition, and processing was preconfigured to ensure precise test control and efficient data handling.
5. Main Test Results
Following completion of the test and data collection, the data underwent processing and evaluation, involving the following steps:
- Determination of mean values of measurement parameters over the selected interval during the measurement.
- Calculation of physical parameters using calibrated curves based on measured values from electrical instruments.
- Calculation of mass flow rate, enthalpy, and other properties of the working fluid.
- Evaluation of the primary test outcomes.
- Calculation of measurement uncertainties associated with the results.
- Adjustment of results to align with design conditions.
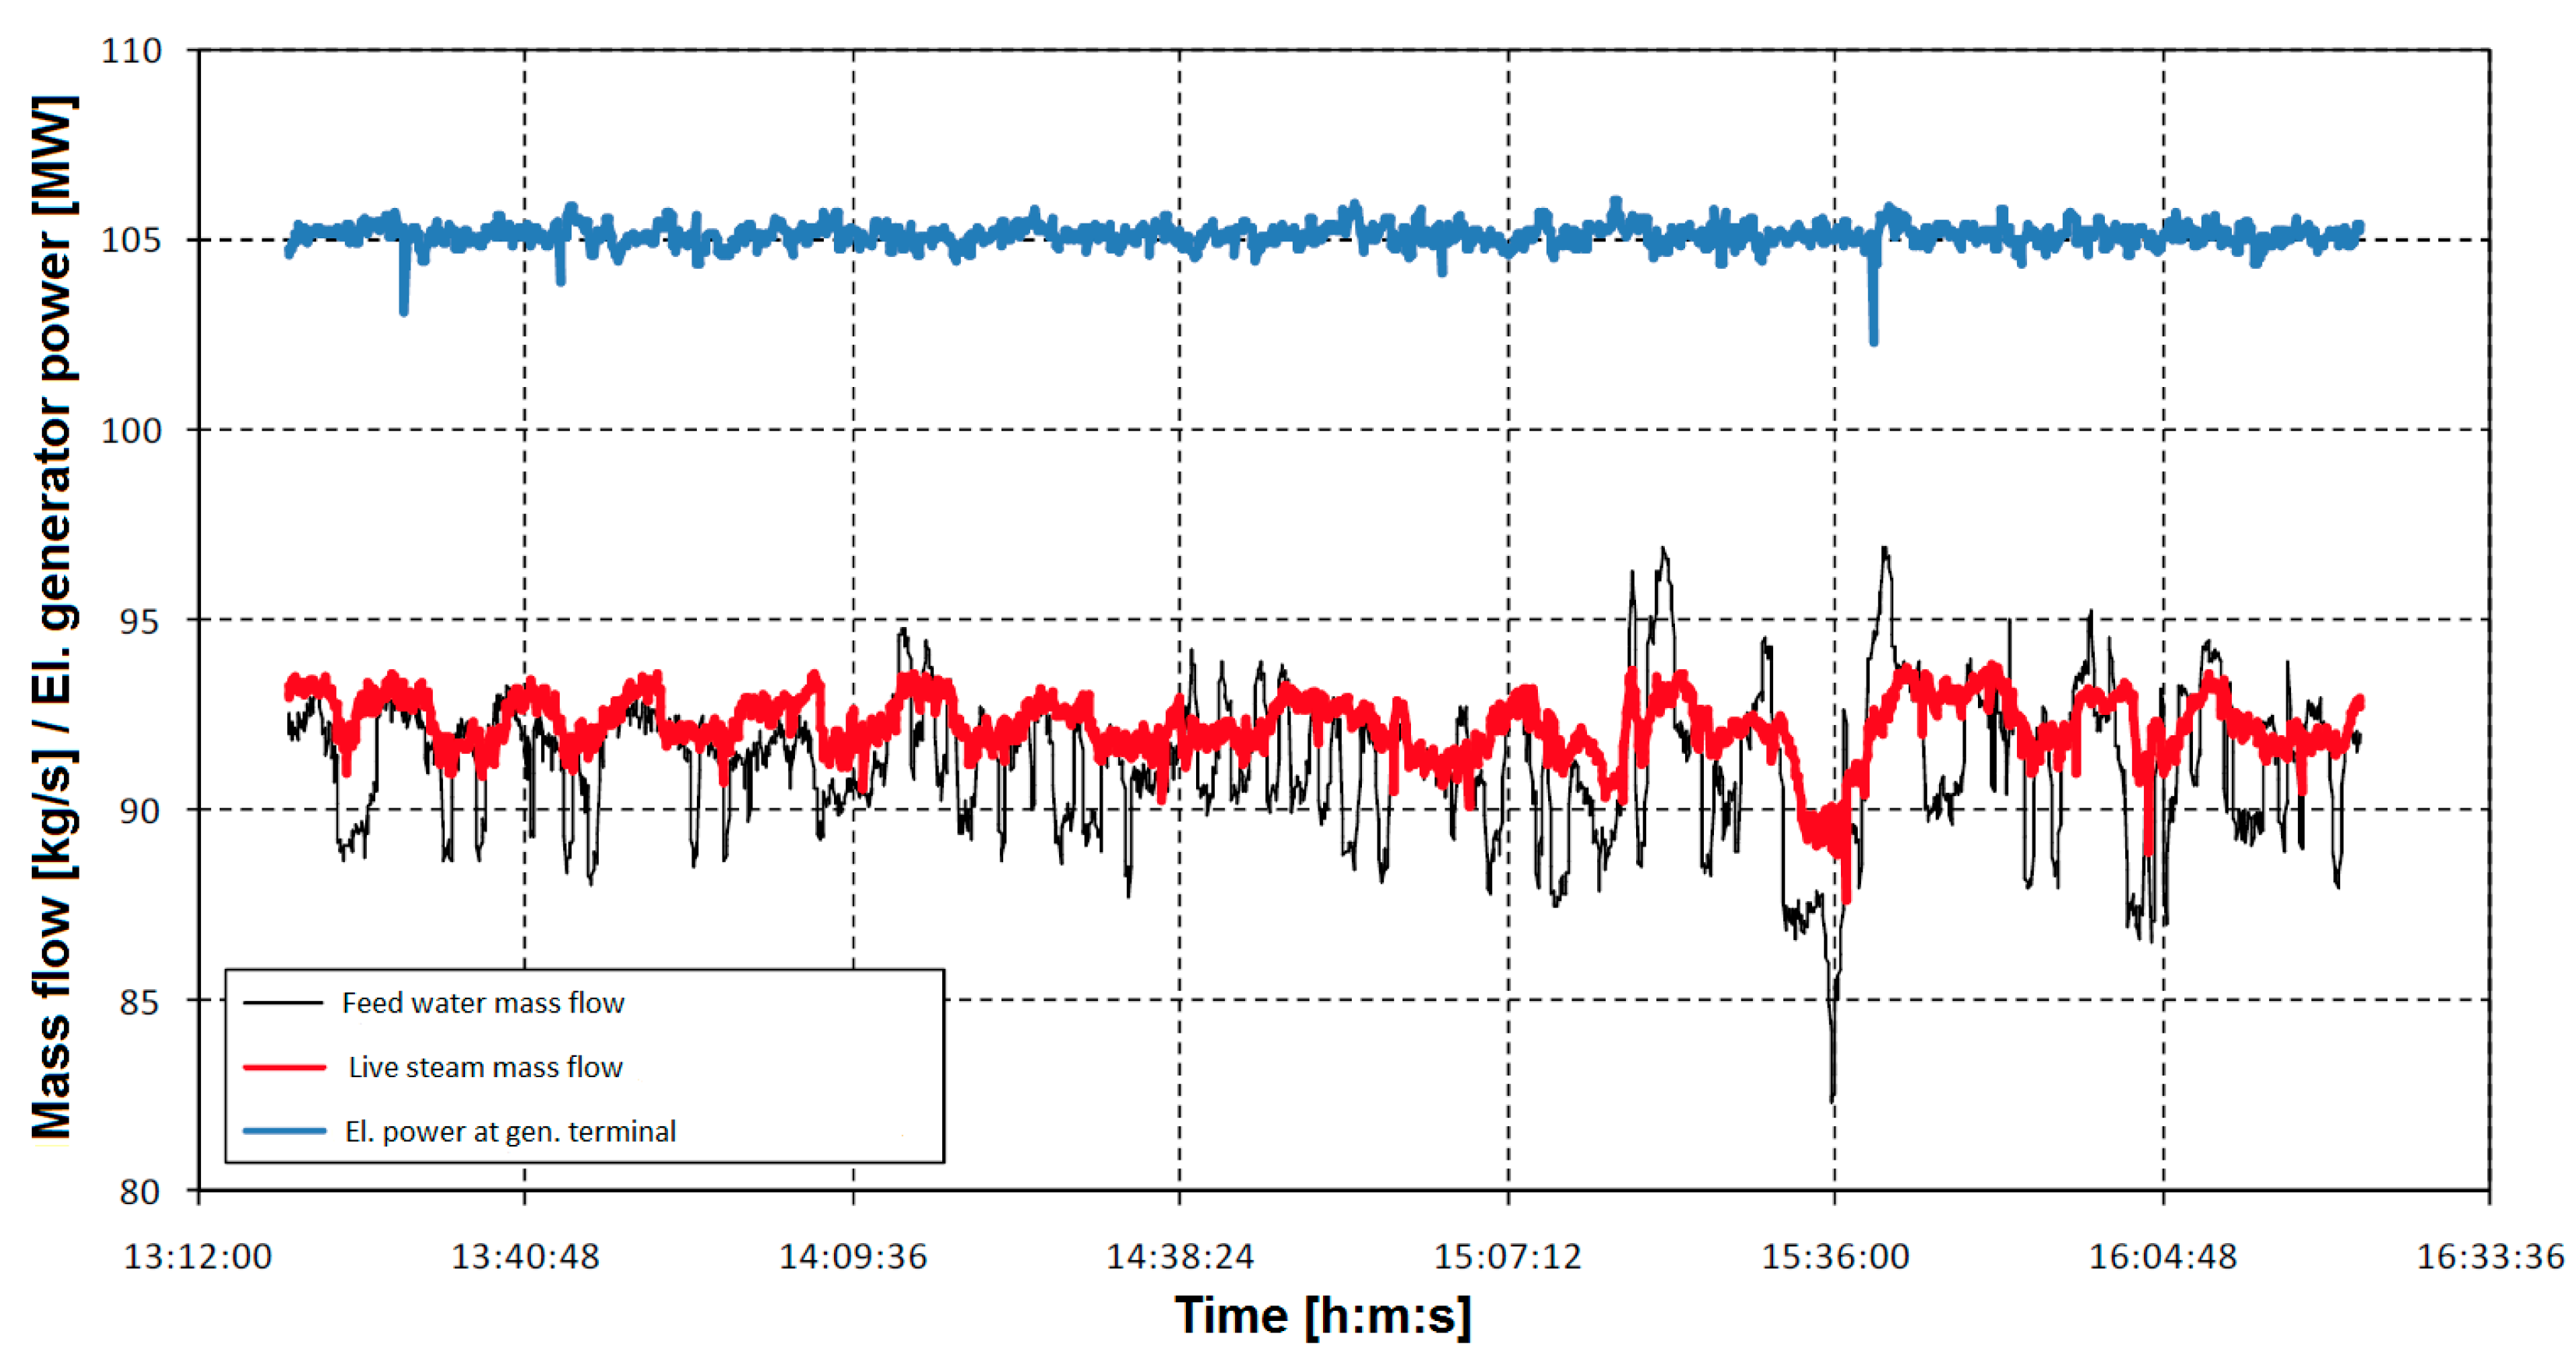
Due to the complexity of the mathematical model used for data processing, the primary focus of this paper will be on presenting the main outcomes. Figure 2 illustrates fluctuations in electrical power, live steam, and feed water mass flow rates observed during the test at 105 MW.

Figure 2.
Fluctuations in electrical power output and mass flow rates of live steam and feed water during test T105.
The values of the steam turbine thermal efficiency and gross heat rate for the Morava TPP are determined according to [11] as follows:
where is the electrical output at the generator terminals, is the heat added to the cycle from a boiler, and are the live steam mass flow and the enthalpy (before the main stop valves), respectively, is the final feed water enthalpy, and are the mass flow and the enthalpy of steam before the IP stop valve, respectively, is the enthalpy of steam at the HP turbine outlet and and are the mass flow and the enthalpy of sprays to the reheater, respectively.
The relative uncertainty of the gross heat rate of the steam turbine plant was calculated according to IEC 953-2 [11] and the results are given in Table 2. In this case, the measurement uncertainty of the heat input was 0.981% and that of the electrical power was 0.735%. The resulting overall uncertainty of the heat rate was 1.226%, fully compliant with the guidelines outlined in [11,12].
Table 2.
Measurement uncertainty of determining the gross heat rate and electrical power.
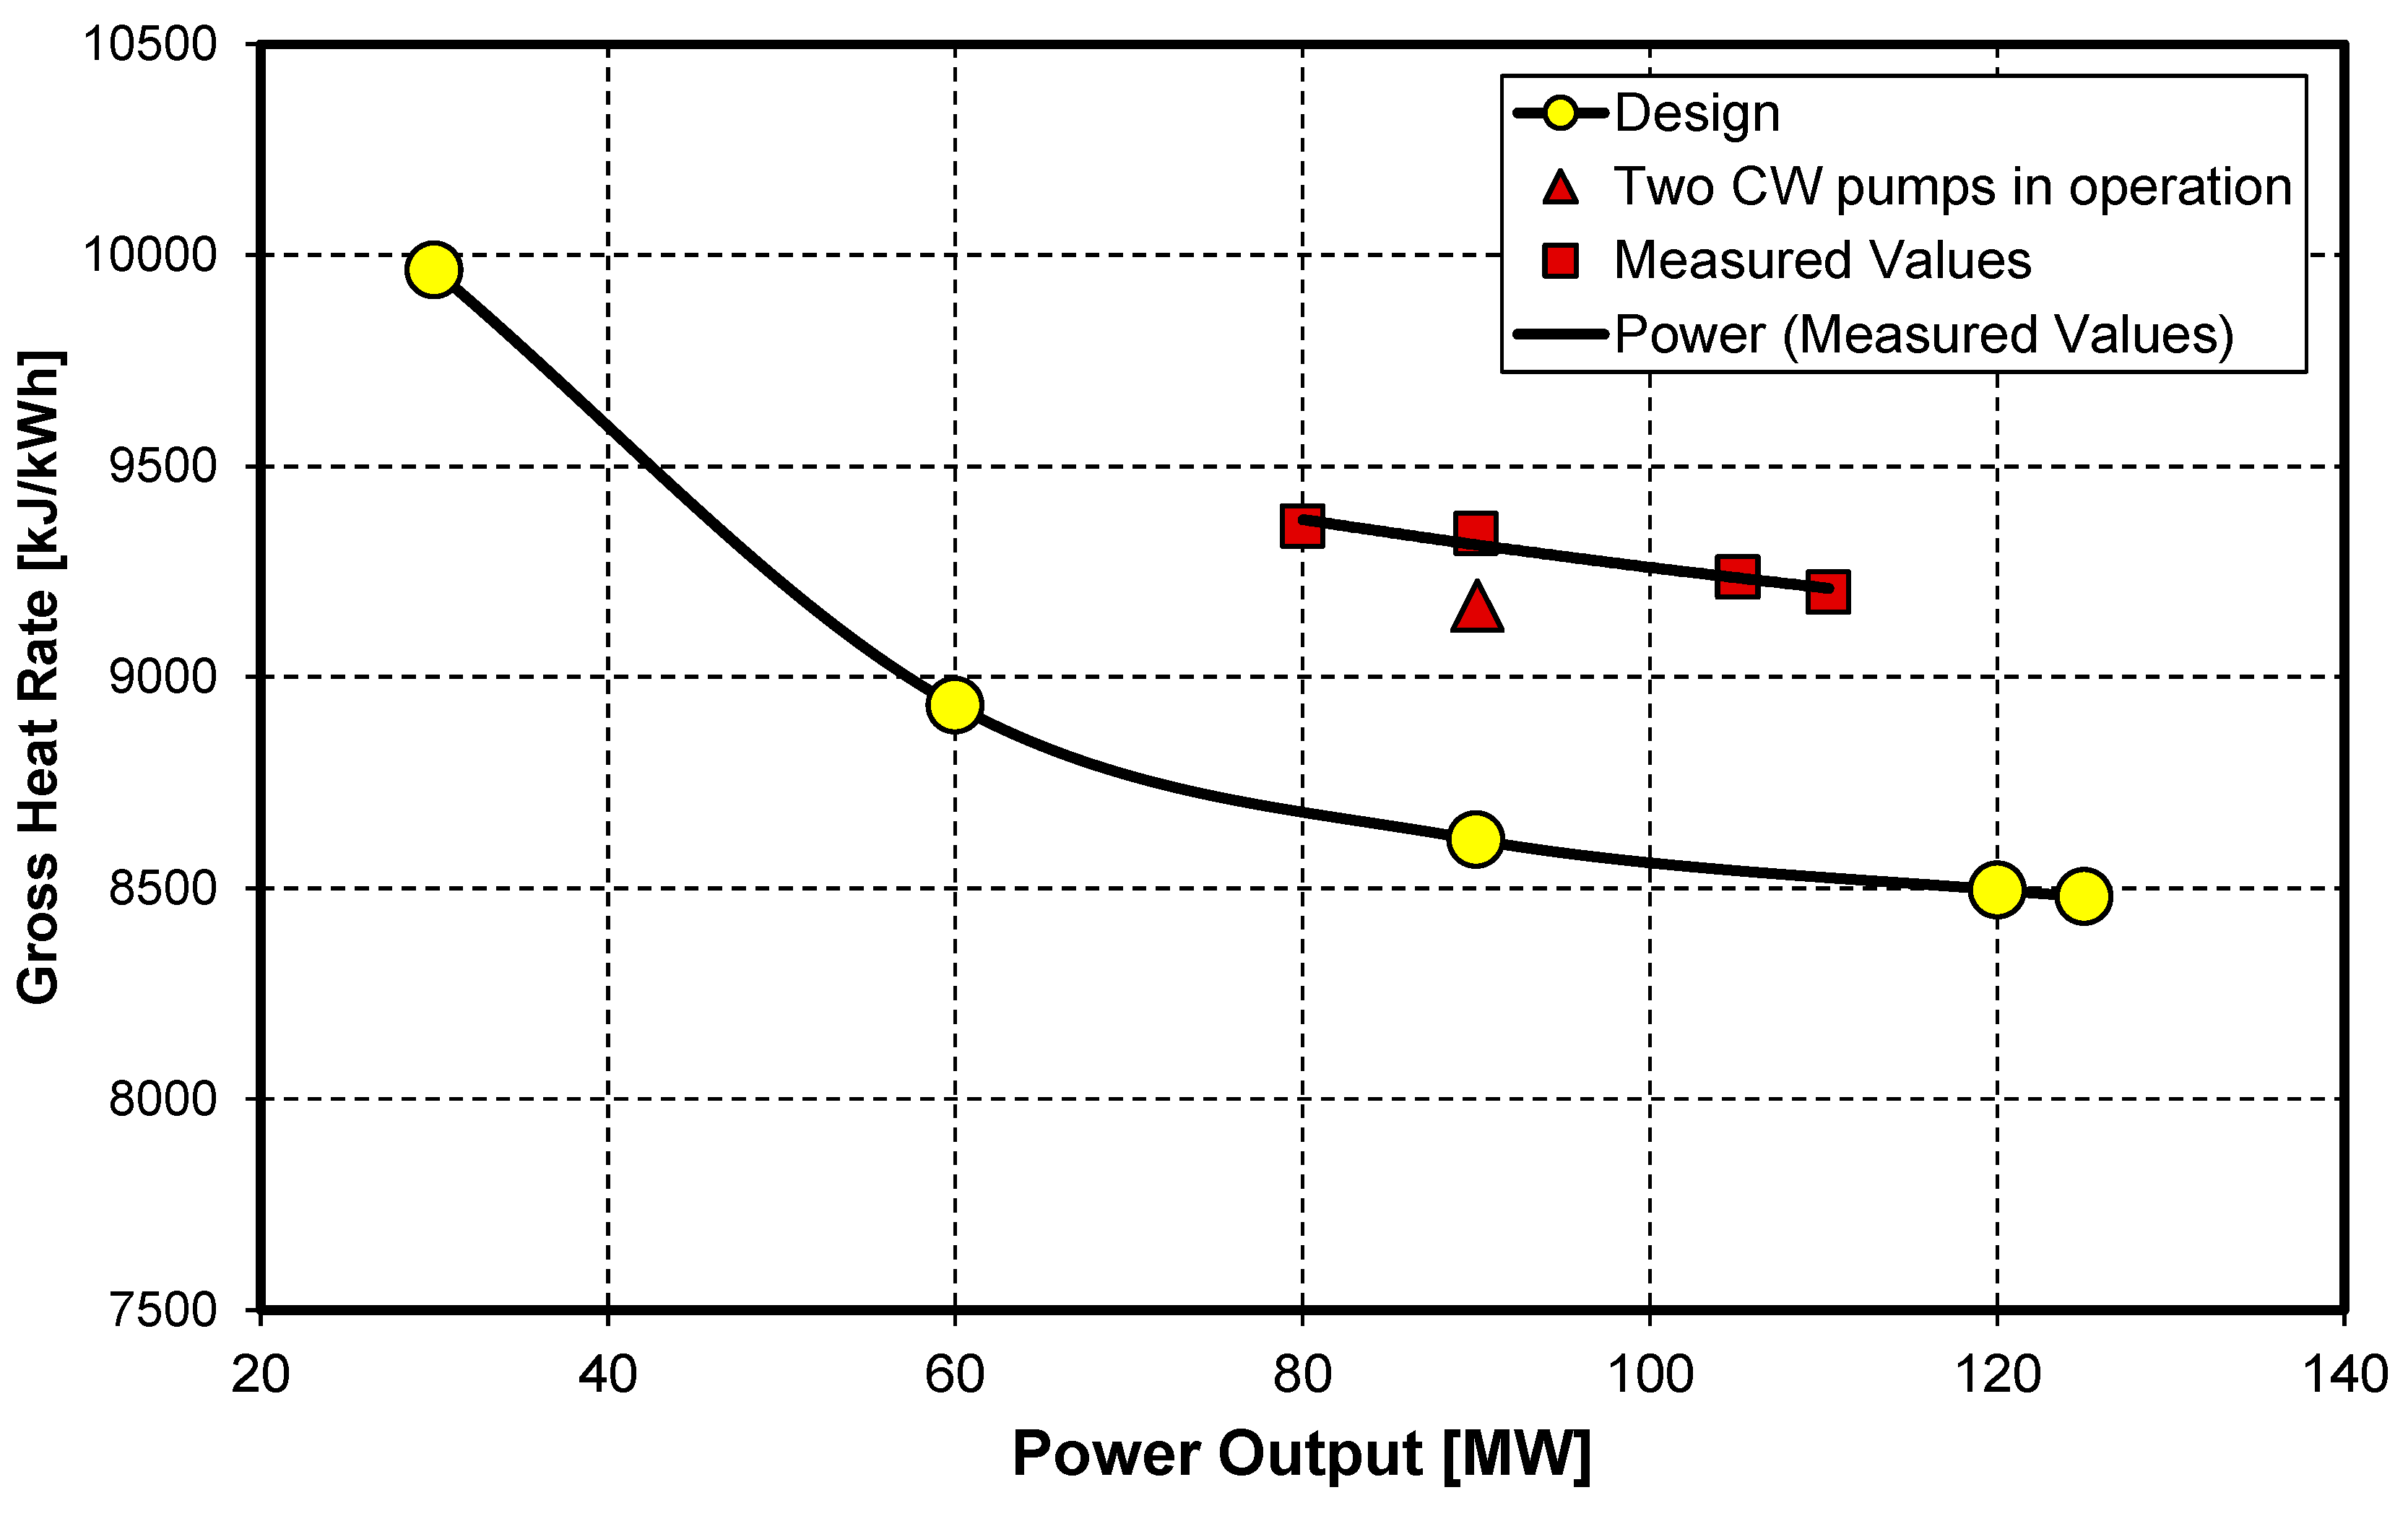
Table 3 presents the principal findings from the test. Figure 3 compares the measured values of the gross heat rate against the design values across various operating points. The observed increase in heat rate due to prolonged operation is notable, ranging from 8% to 10%.
Table 3.
Overview of the key results.

Figure 3.
Gross heat rate: comparison between the test results and the design data. In four tests, a single cooling water pump was in operation, while in one test, two cooling water pumps were running.
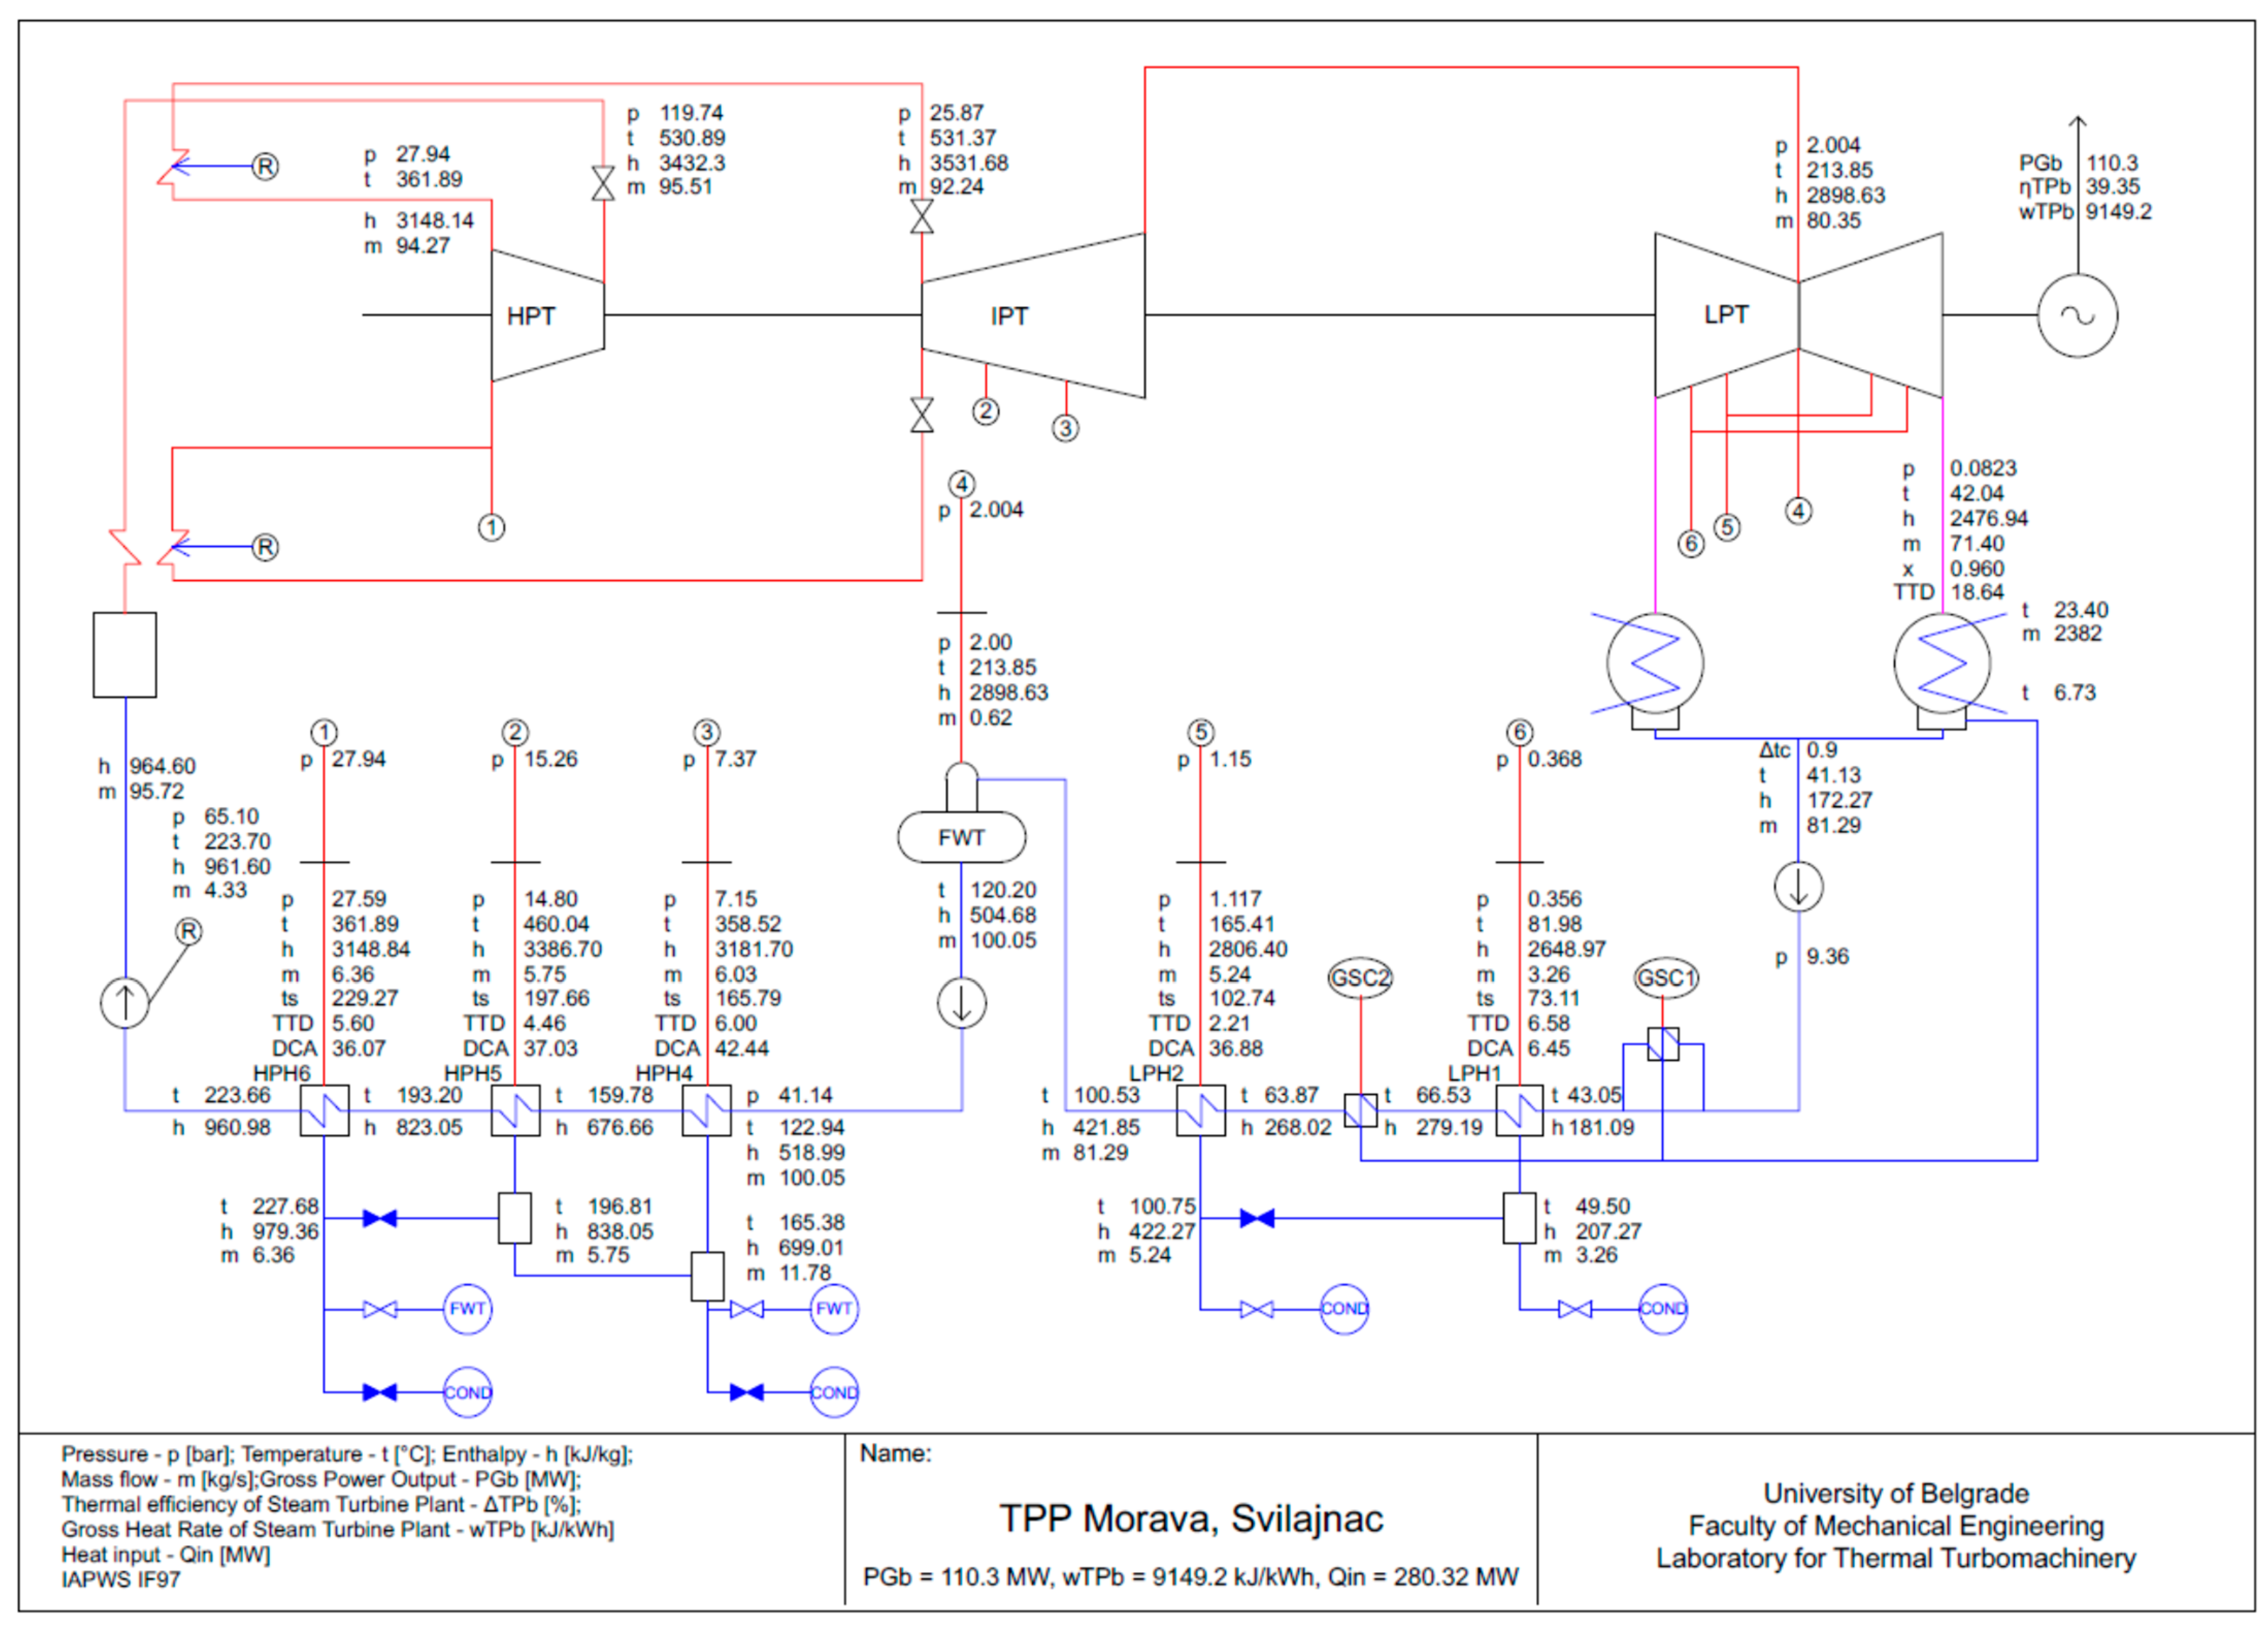
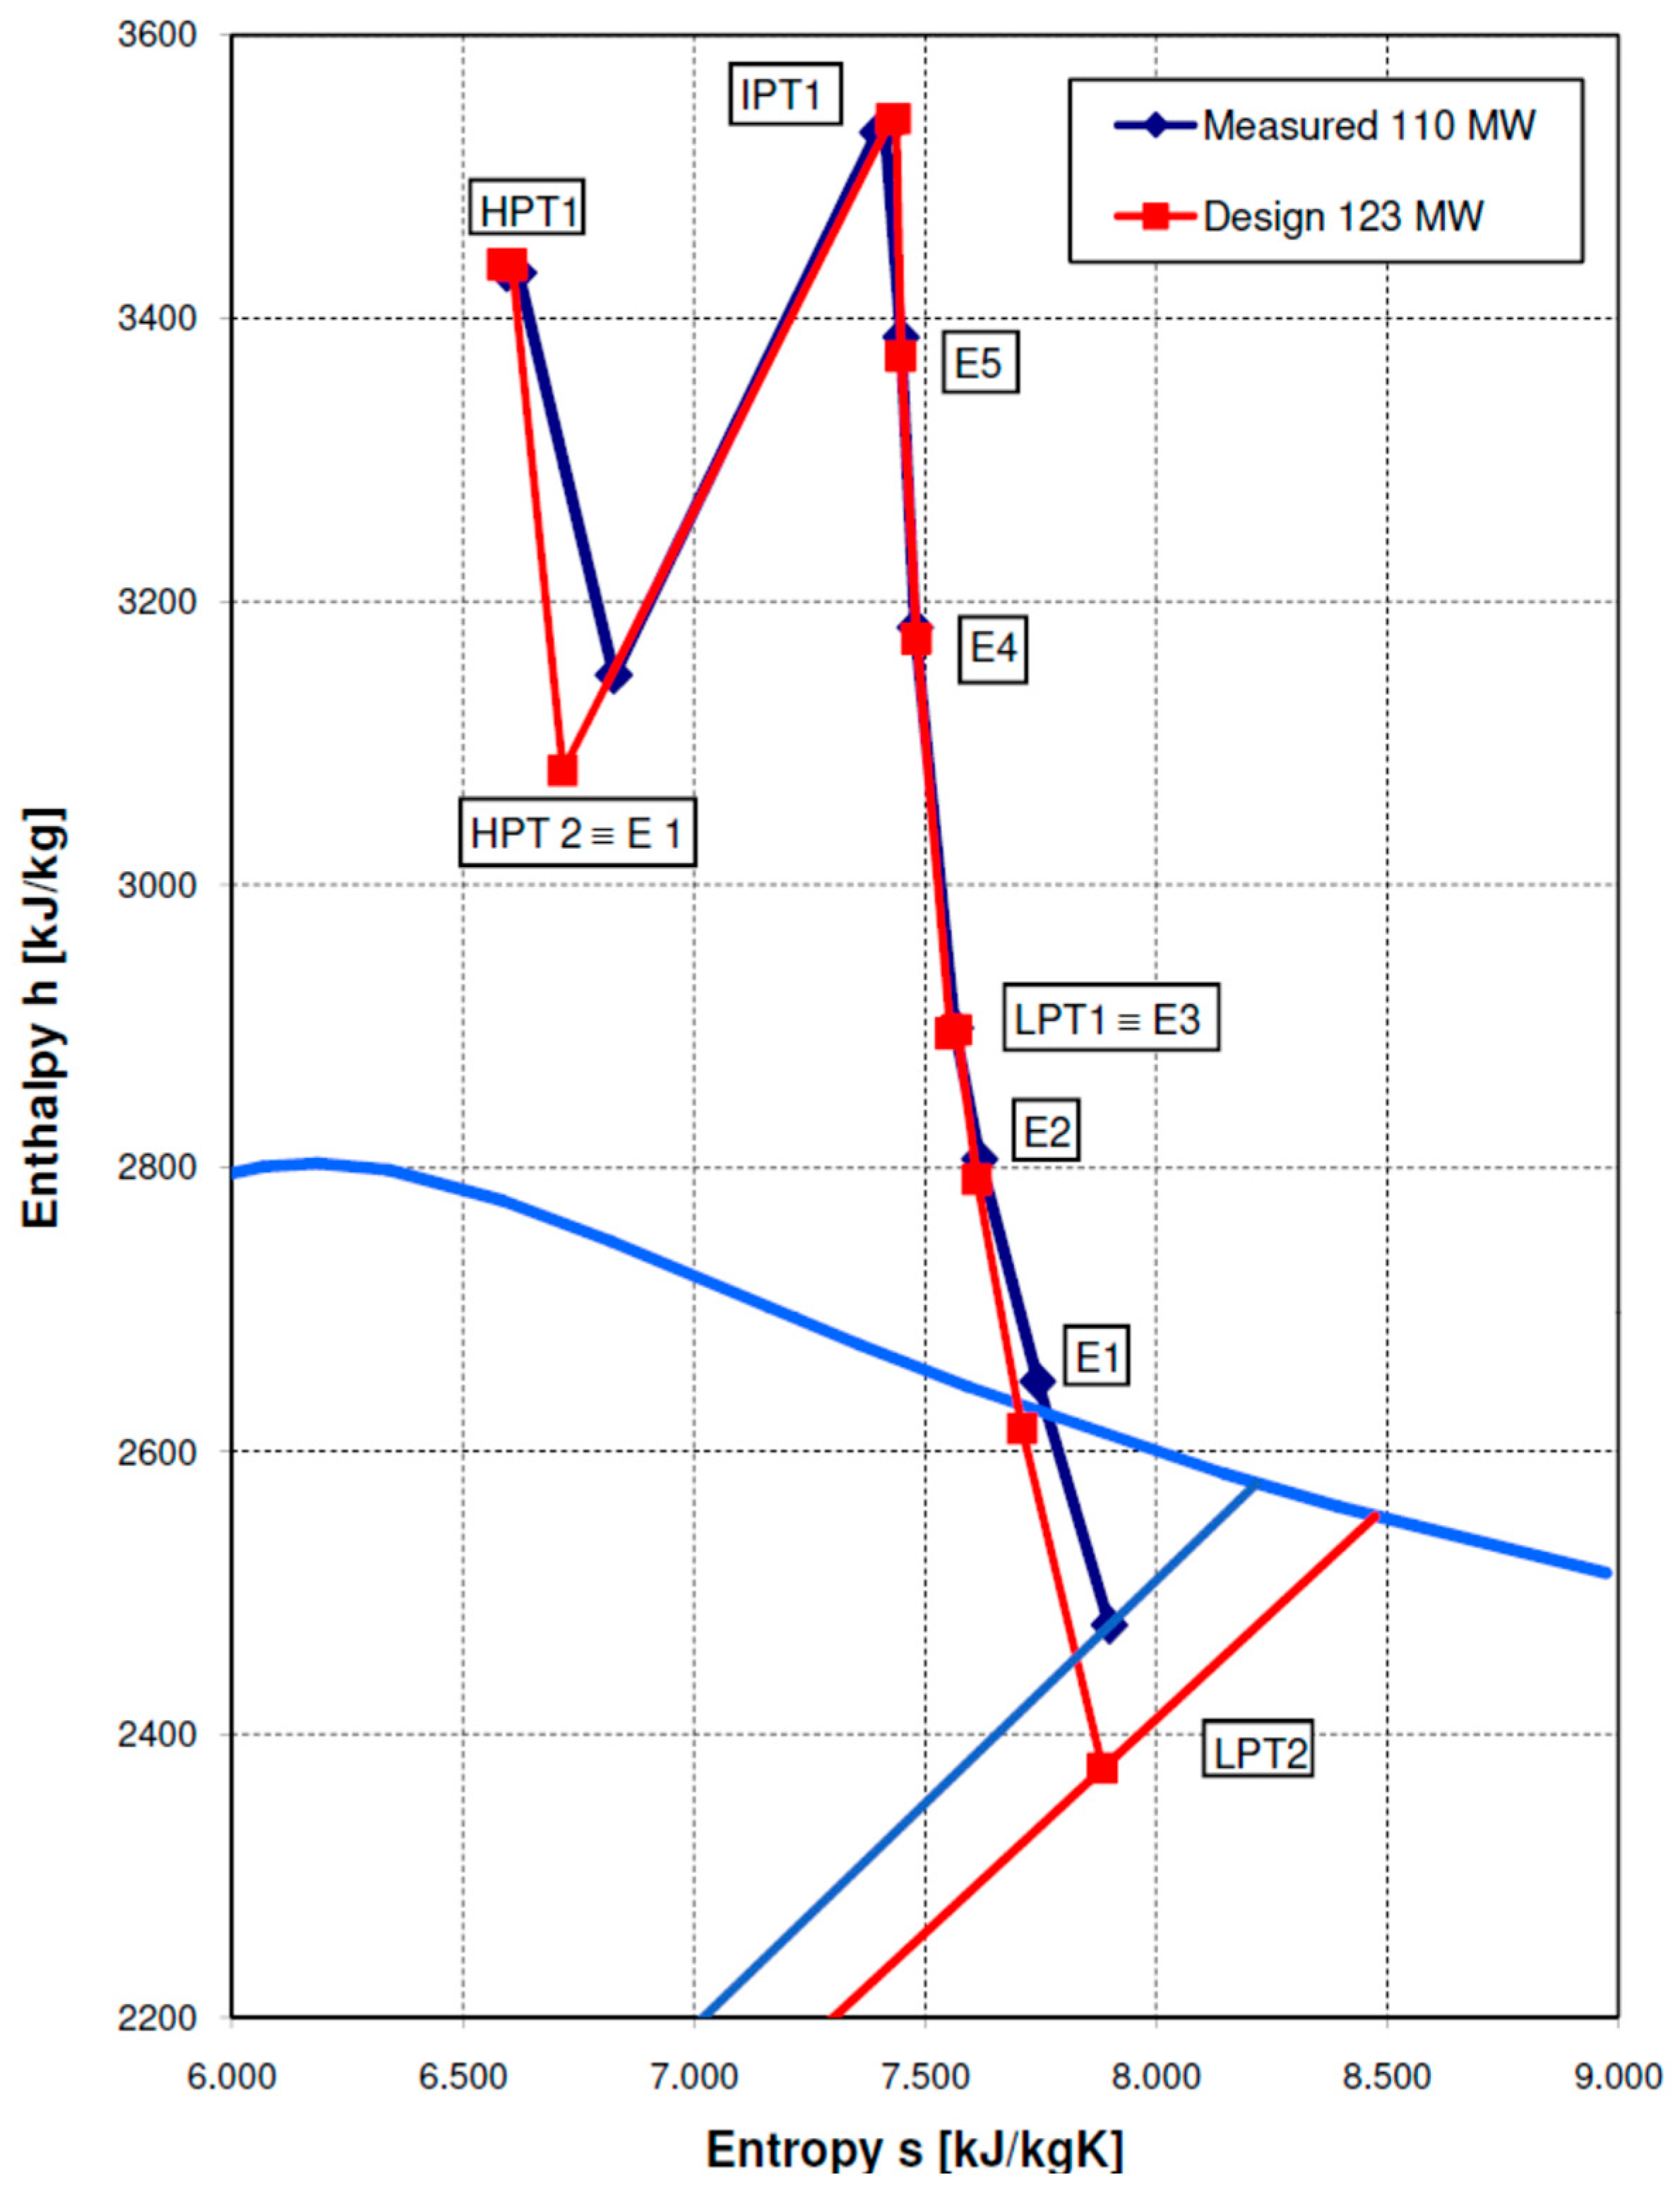
Figure 4 displays the outcomes of mass flow calculations and state properties at specific cycle points, while Figure 5 depicts the h,s diagram featuring the expansion line within the steam turbine at an operational point of 110.3 MW. Figure 5 reveals significantly lower internal efficiency in both the HP and LP turbines. Additionally, the increased pressure at the LP turbine exit suggests issues with condenser performance.

Figure 4.
Heat balance diagram: state properties and mass flow rates calculated from the test data at 110.3 MW (test T110).

Figure 5.
The expansion line in the steam turbine at 110.3 MW.
6. Analysis of Component Performances
Based on the test results, an additional investigation was carried out to determine not only the overall performance of the steam turbine plant but also the performance of each component.
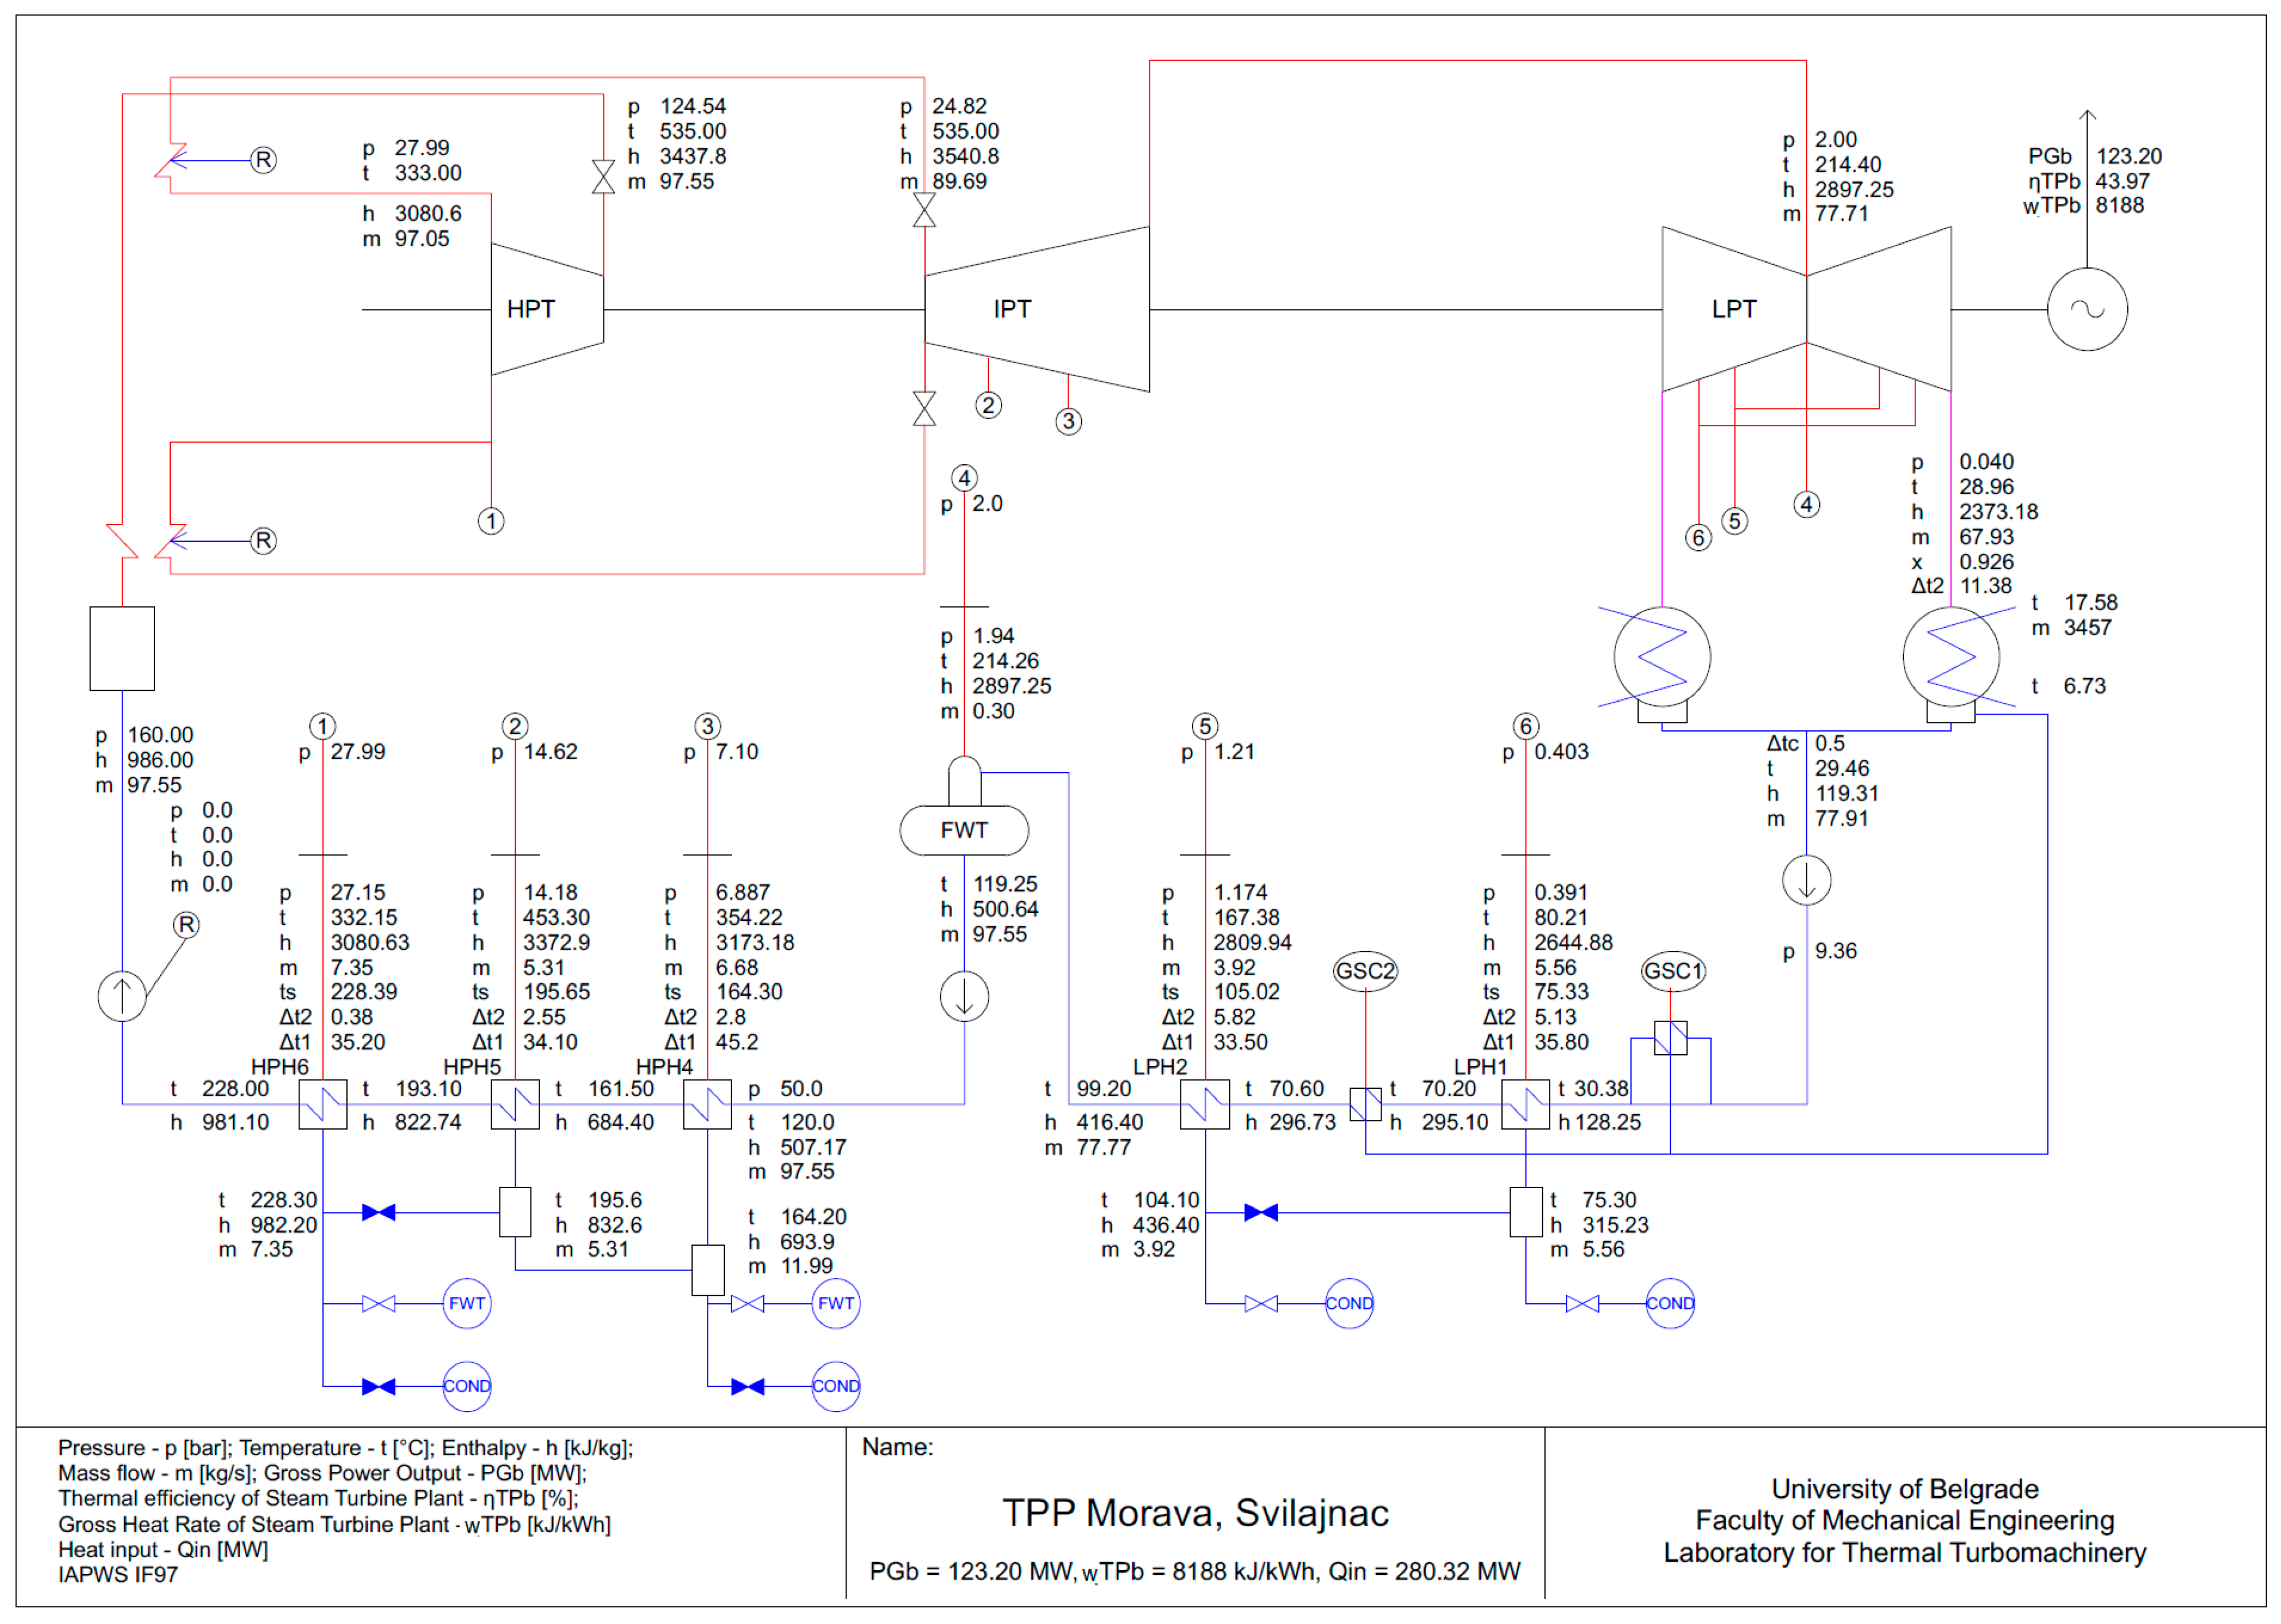
The impact of component deterioration on overall plant performance was examined for test T110. To generate an electrical output of 110.29 MW, a heat input of 280.32 MW was required for the steam turbine plant (Table 3). Using the in-house steam turbine cycle calculation code, STCycle [18,19], the heat balance diagram was determined by applying the design cycle parameters and the specified operating performance of components for a heat input of 280.32 MJ/s (as in test T110). The condenser pressure, calculated to be 0.040 bar, was determined using the actual cooling water temperature of 6.7 °C, the design cooling water mass flow rate, and the design condenser geometry (including material, dimensions, and number of pipes). The results (Figure 6) indicate that the electrical output would have been 123.20 MW if all components had operated according to their design specifications. Comparing this with the measured electrical output of 110.29 MW at the same heat input (280.32 MJ/s), it is evident that there was an electrical power deficit of approximately 13 MW in this case.

Figure 6.
Heat balance diagram: Calculated for a heat input of 280.32 MW (as in Test T110) with all cycle thermodynamic parameters and component performances based on design specifications.
Figure 5 demonstrates significant deviations in the performance of the high-pressure (HP) and low-pressure (LP) turbines, as well as the condenser [20]. These components exhibited the most substantial negative impact on the gross heat rate. In contrast, other components had a relatively minor influence on overall plant performance.
6.1. Steam Turbine
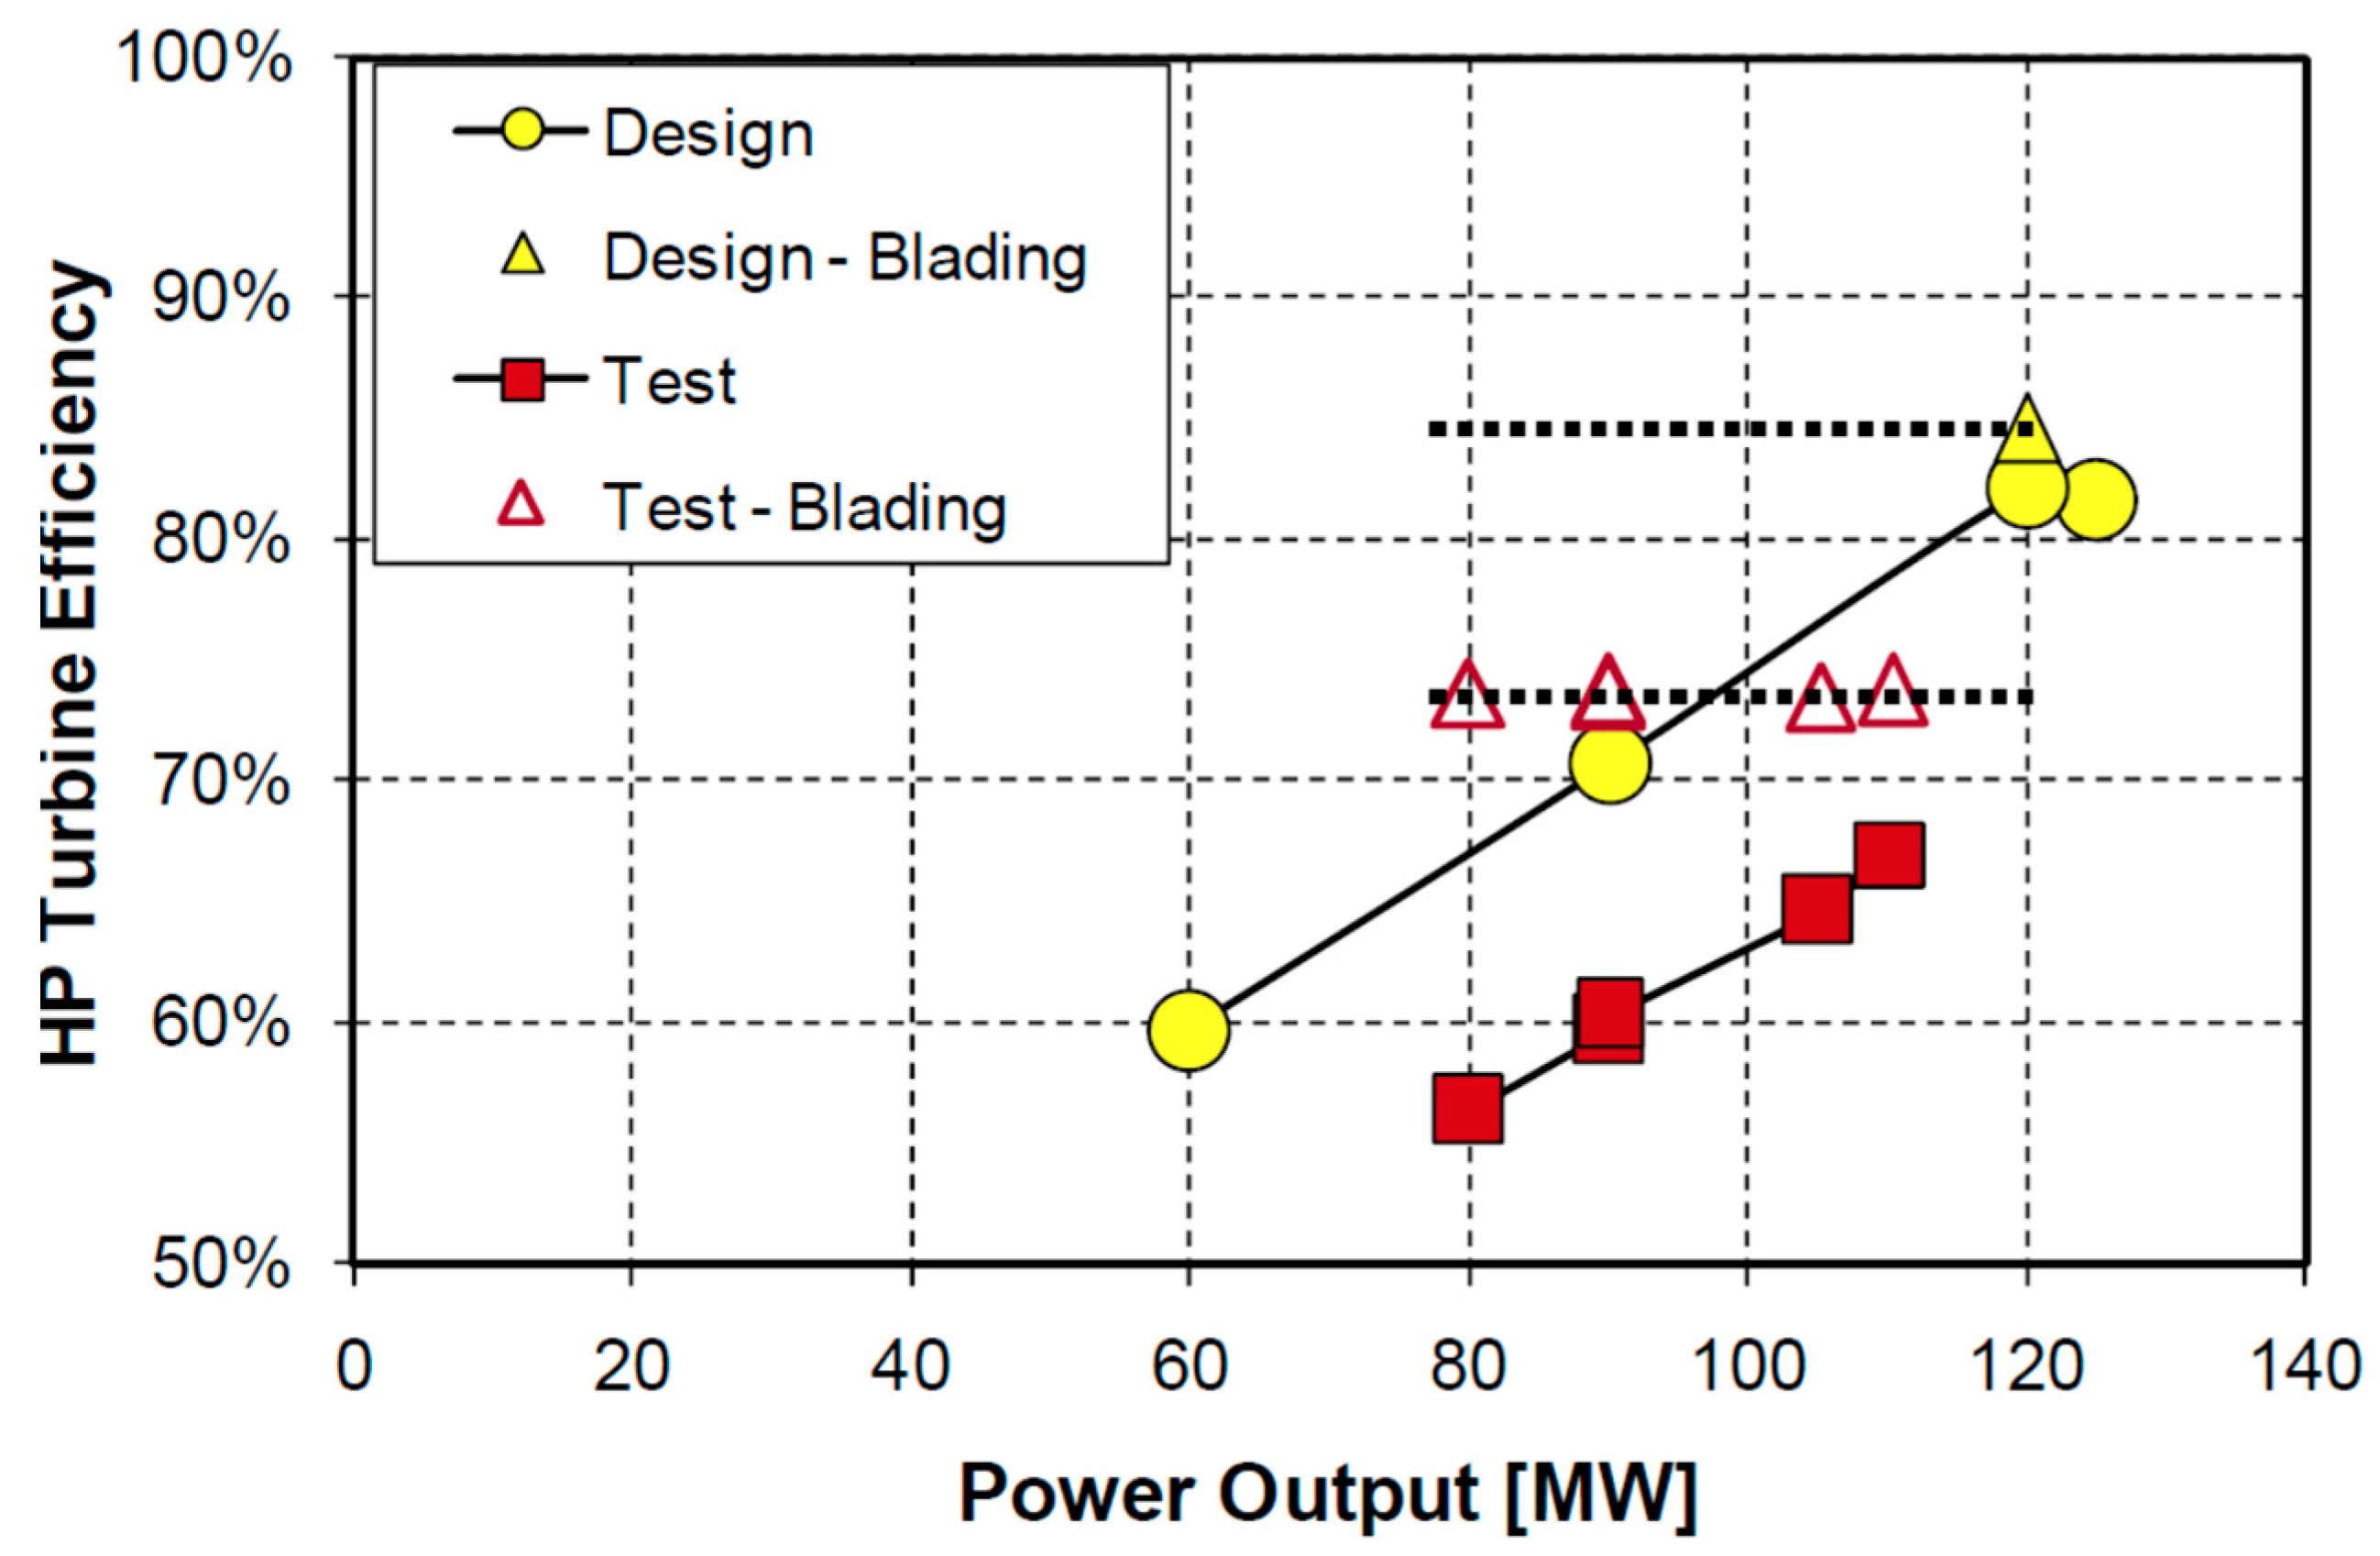
Figure 7 illustrates that the efficiency of the HP turbine was markedly lower than its design specification. Specifically, the efficiency of the HP turbine blading was reduced by 12 percentage points (72% vs. 84%). The overall efficiency of the HP turbine, including the main valve, was similarly below the design value. This indicates that the HP turbine at the Morava TPP was in a severely degraded condition, necessitating urgent overhaul or replacement.

Figure 7.
HP turbine efficiency: comparison of the design values and the test results (the dotted line with red triangles shows the value of the efficiency of HP turbine blading).
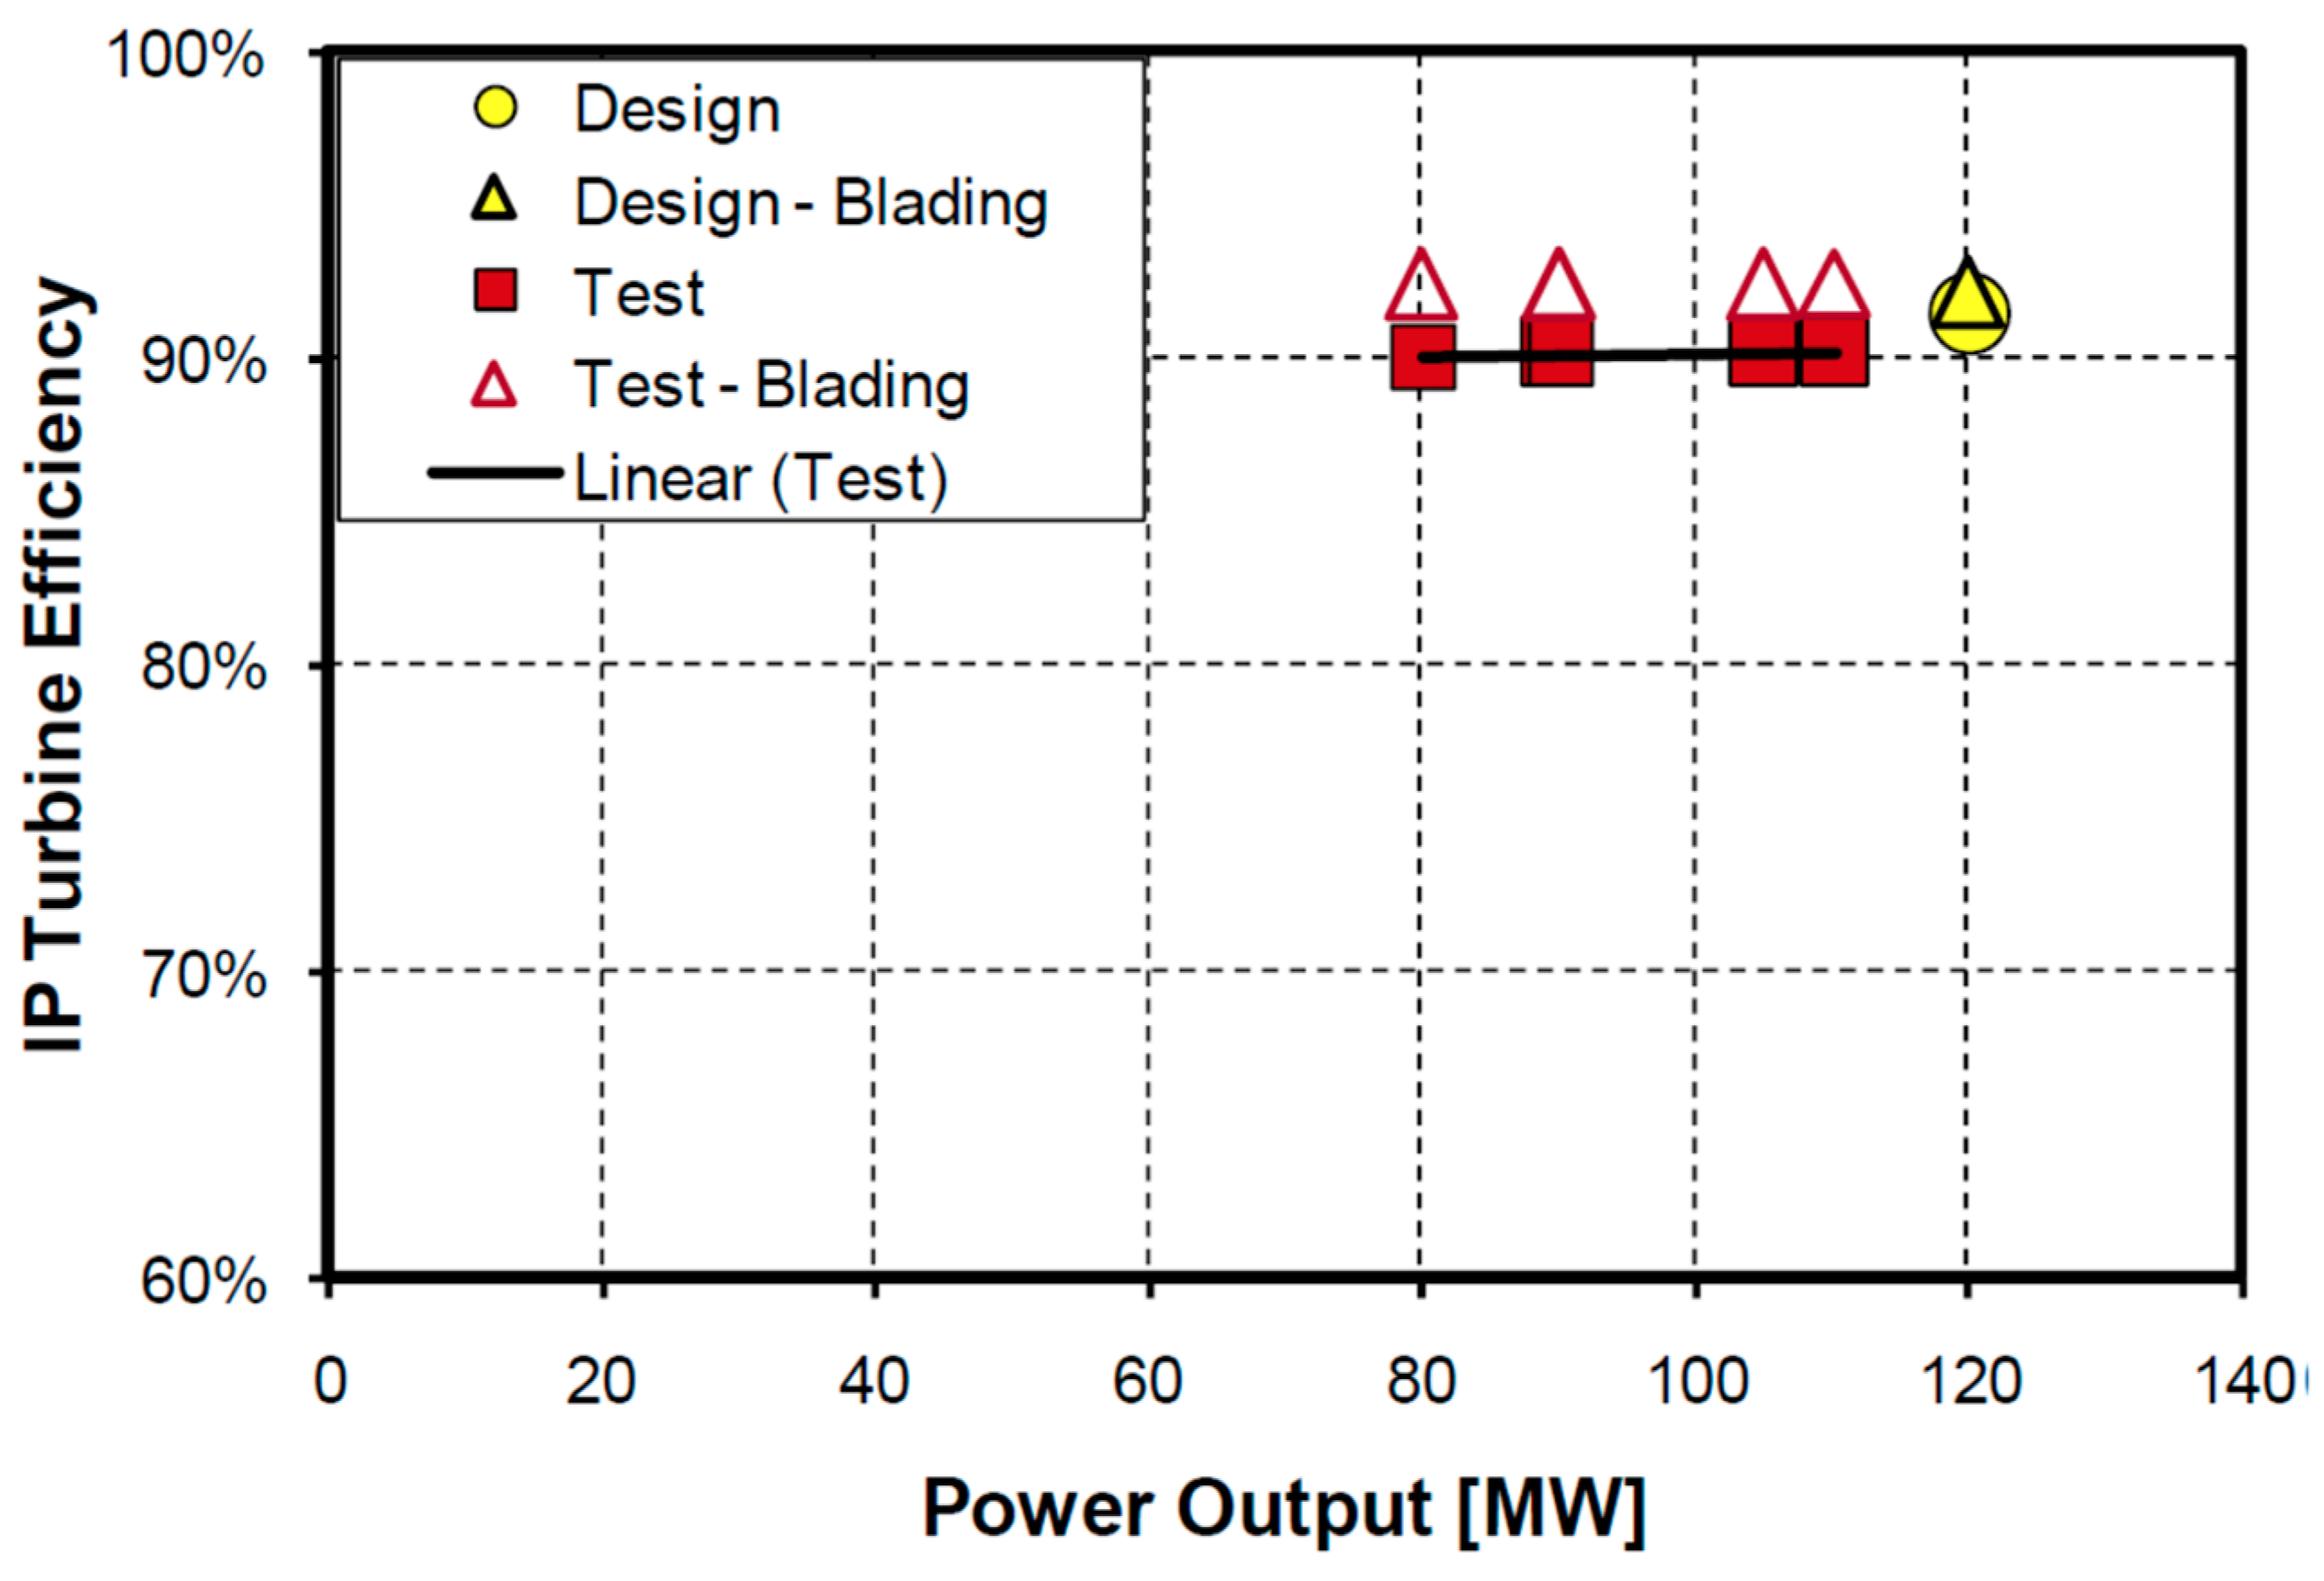
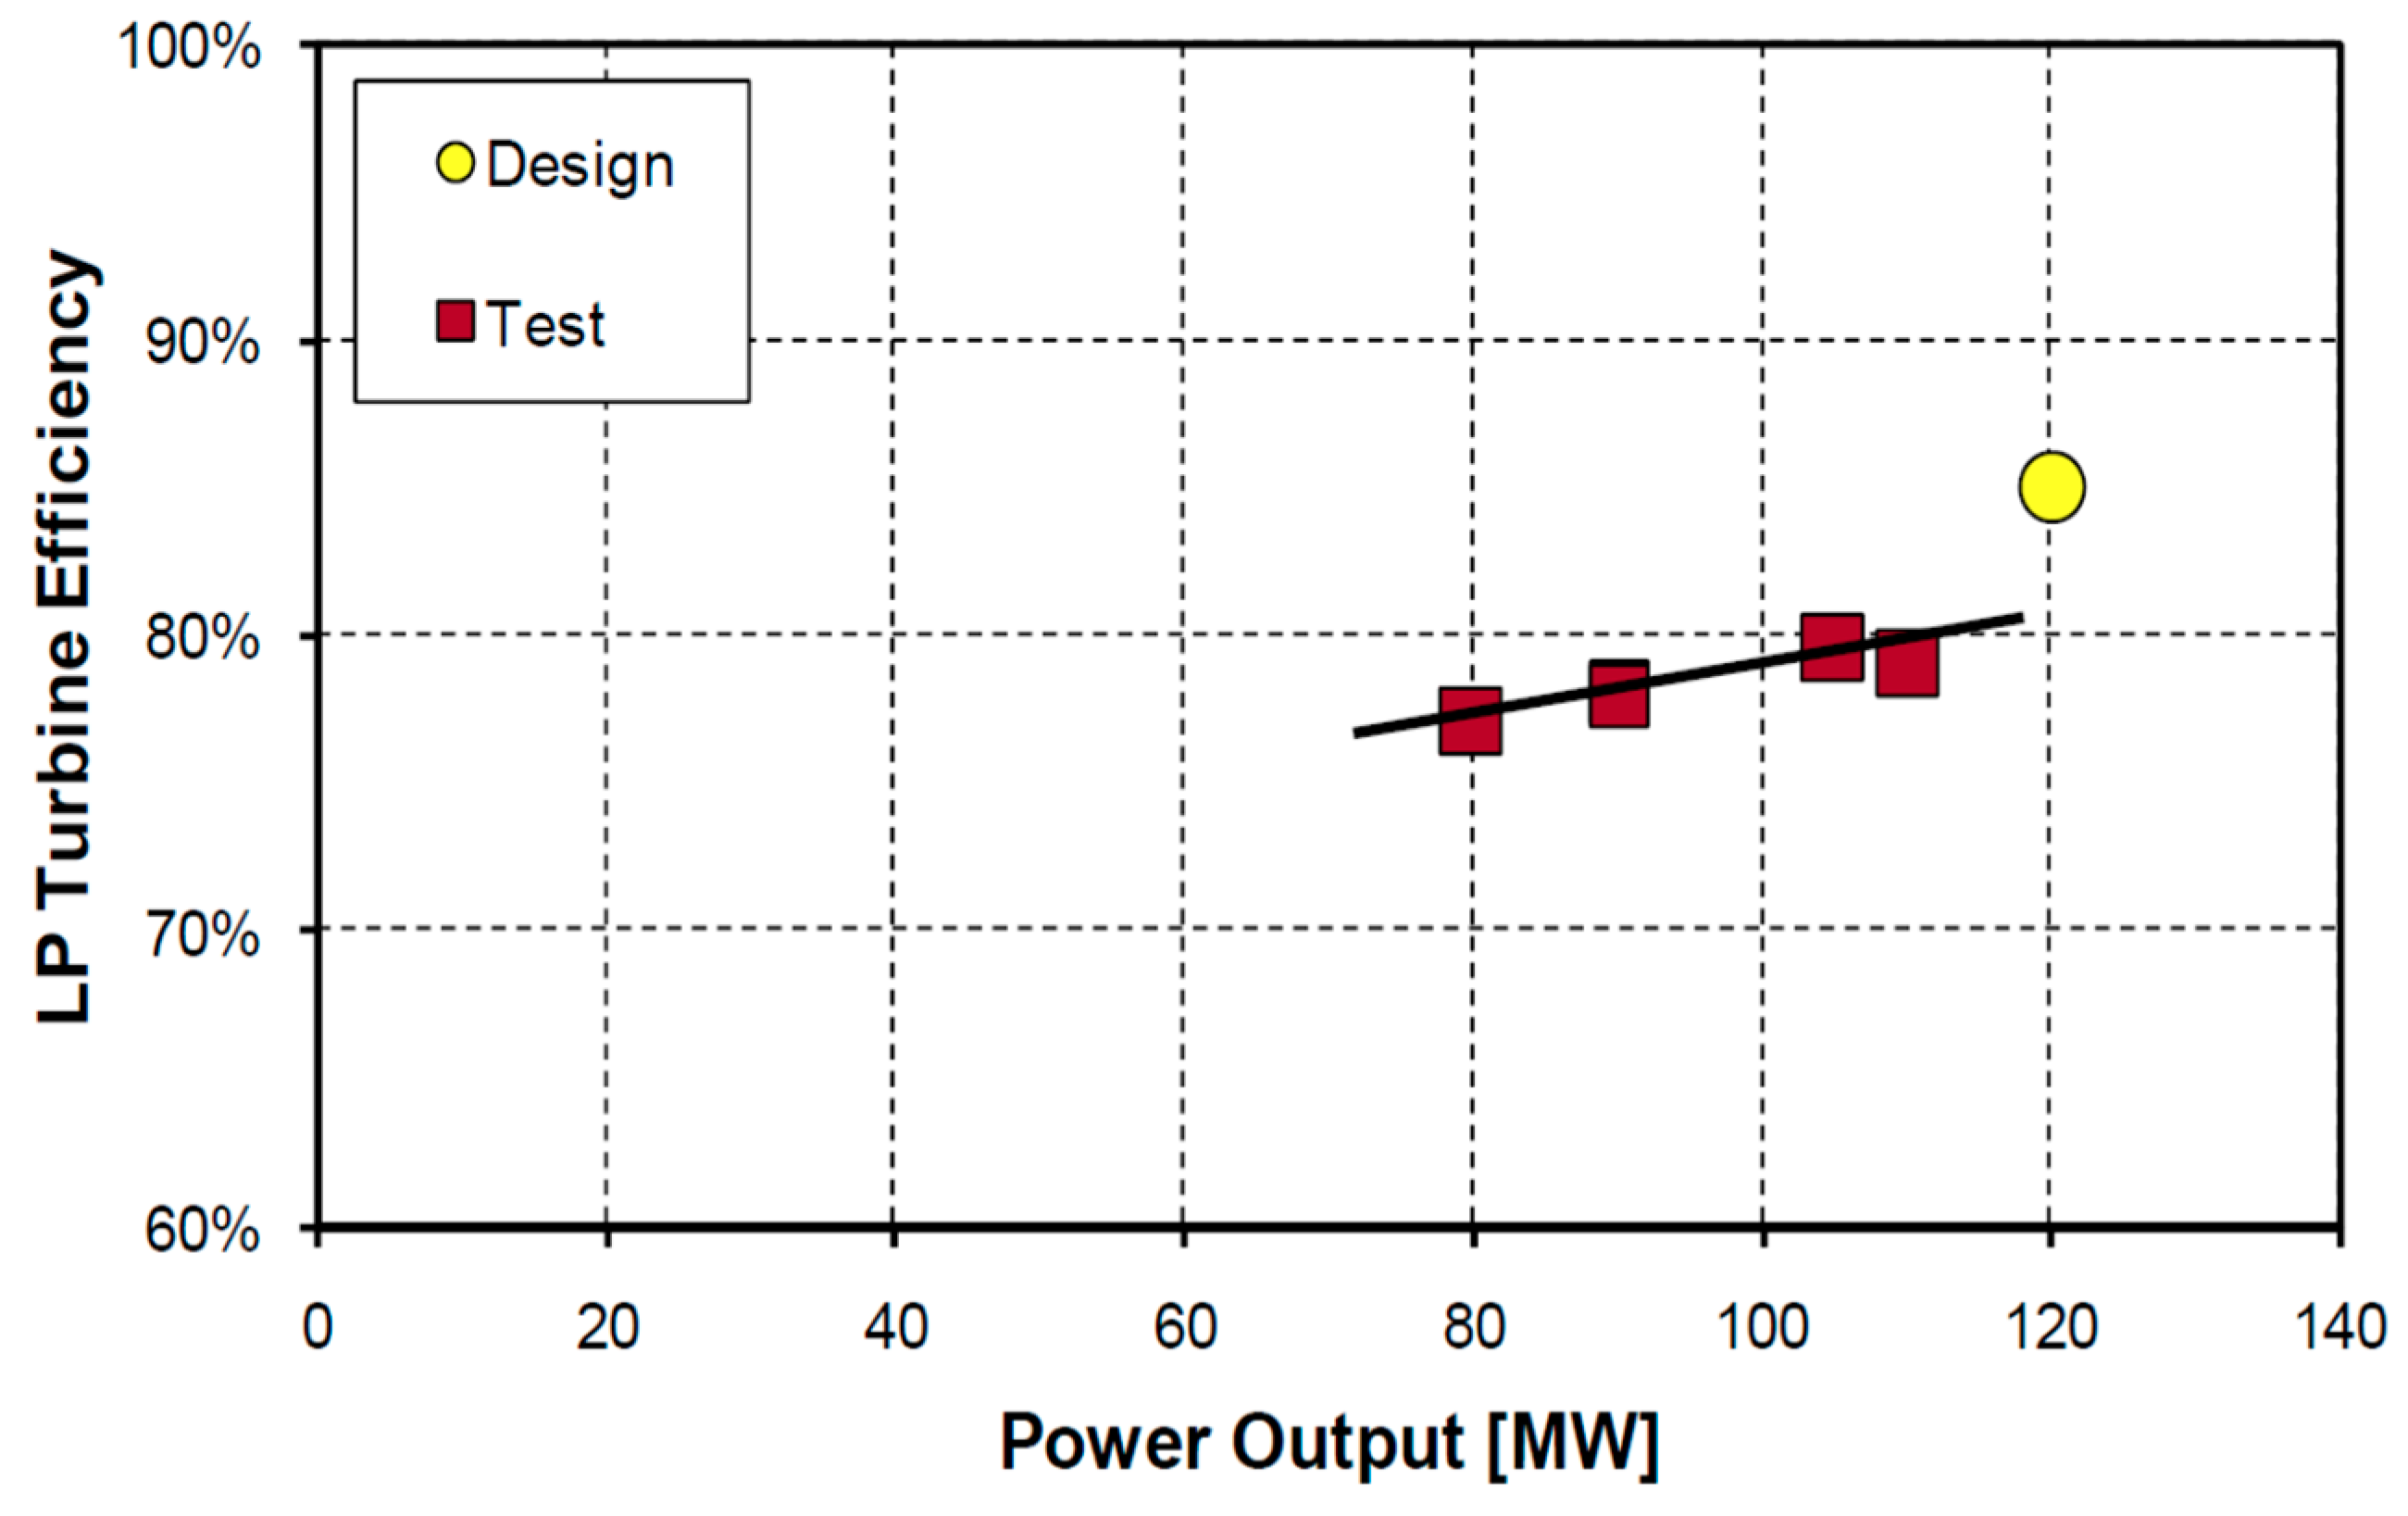
In contrast, no significant deterioration was observed in the intermediate-pressure (IP) turbine during the measurements. As shown in Figure 8, the efficiency of the IP turbine was only 1% lower than the design value of 91.5%. However, the efficiency of the LP turbine was considerably lower, by approximately 5 percentage points, compared to its design value, as depicted in Figure 9.

Figure 8.
IP turbine efficiency: comparison of the design values and the test results.

Figure 9.
LP turbine efficiency: comparison of the design values and the test results.
6.2. Condenser Performance
The steam condenser is a critical component in a power plant with a condensing steam turbine [21,22]. Numerous studies in the literature have investigated the impact of various parameters, such as cooling water temperature at the condenser inlet, cooling water mass flow rate, and steam pressure, on the performance of steam condensers and overall power plant efficiency [23,24,25,26].
Tests conducted at the Morava TPP revealed that the condenser operates at a significantly higher pressure than the design specification, with an increase in pressure ranging from 10 to 20 mbar. Detailed analysis of the condensers, based on measured data and simulation results [27], identified three primary causes for the elevated condenser pressure:
- Reduced cooling water flow;
- Leaks and significant air accumulation;
- Deterioration due to corrosion and fouling of tubes.
Other parameter deviations from the design values were relatively minor.
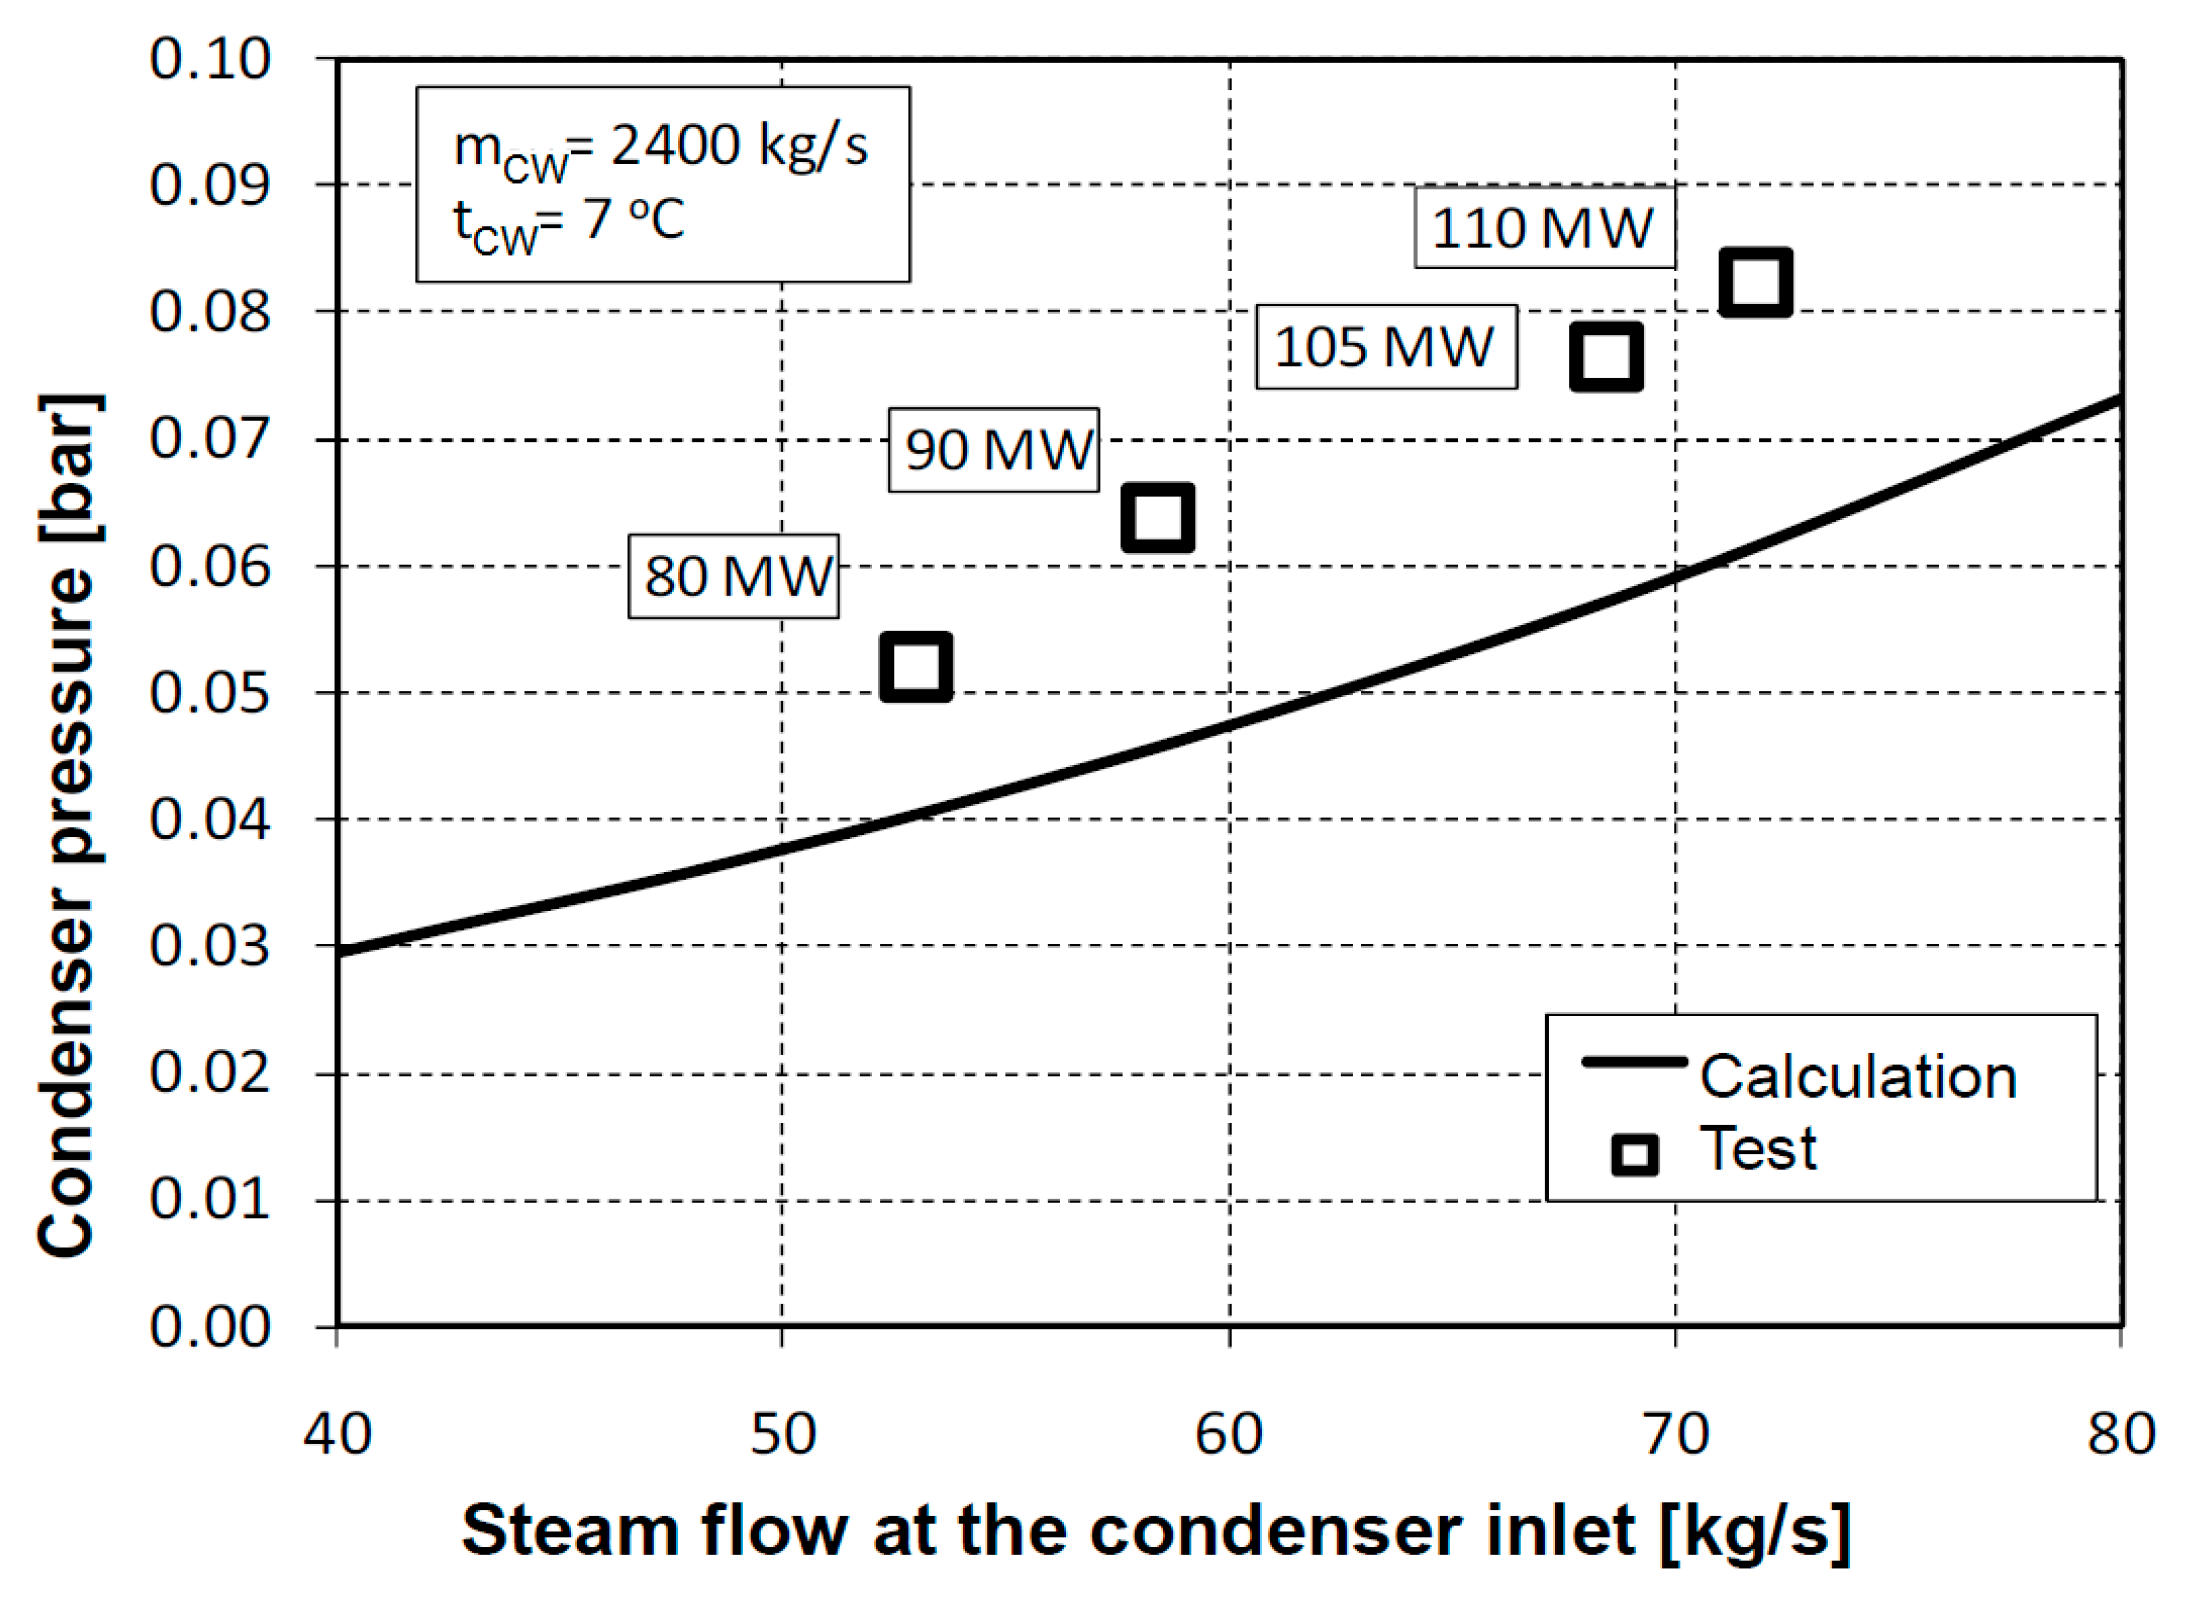
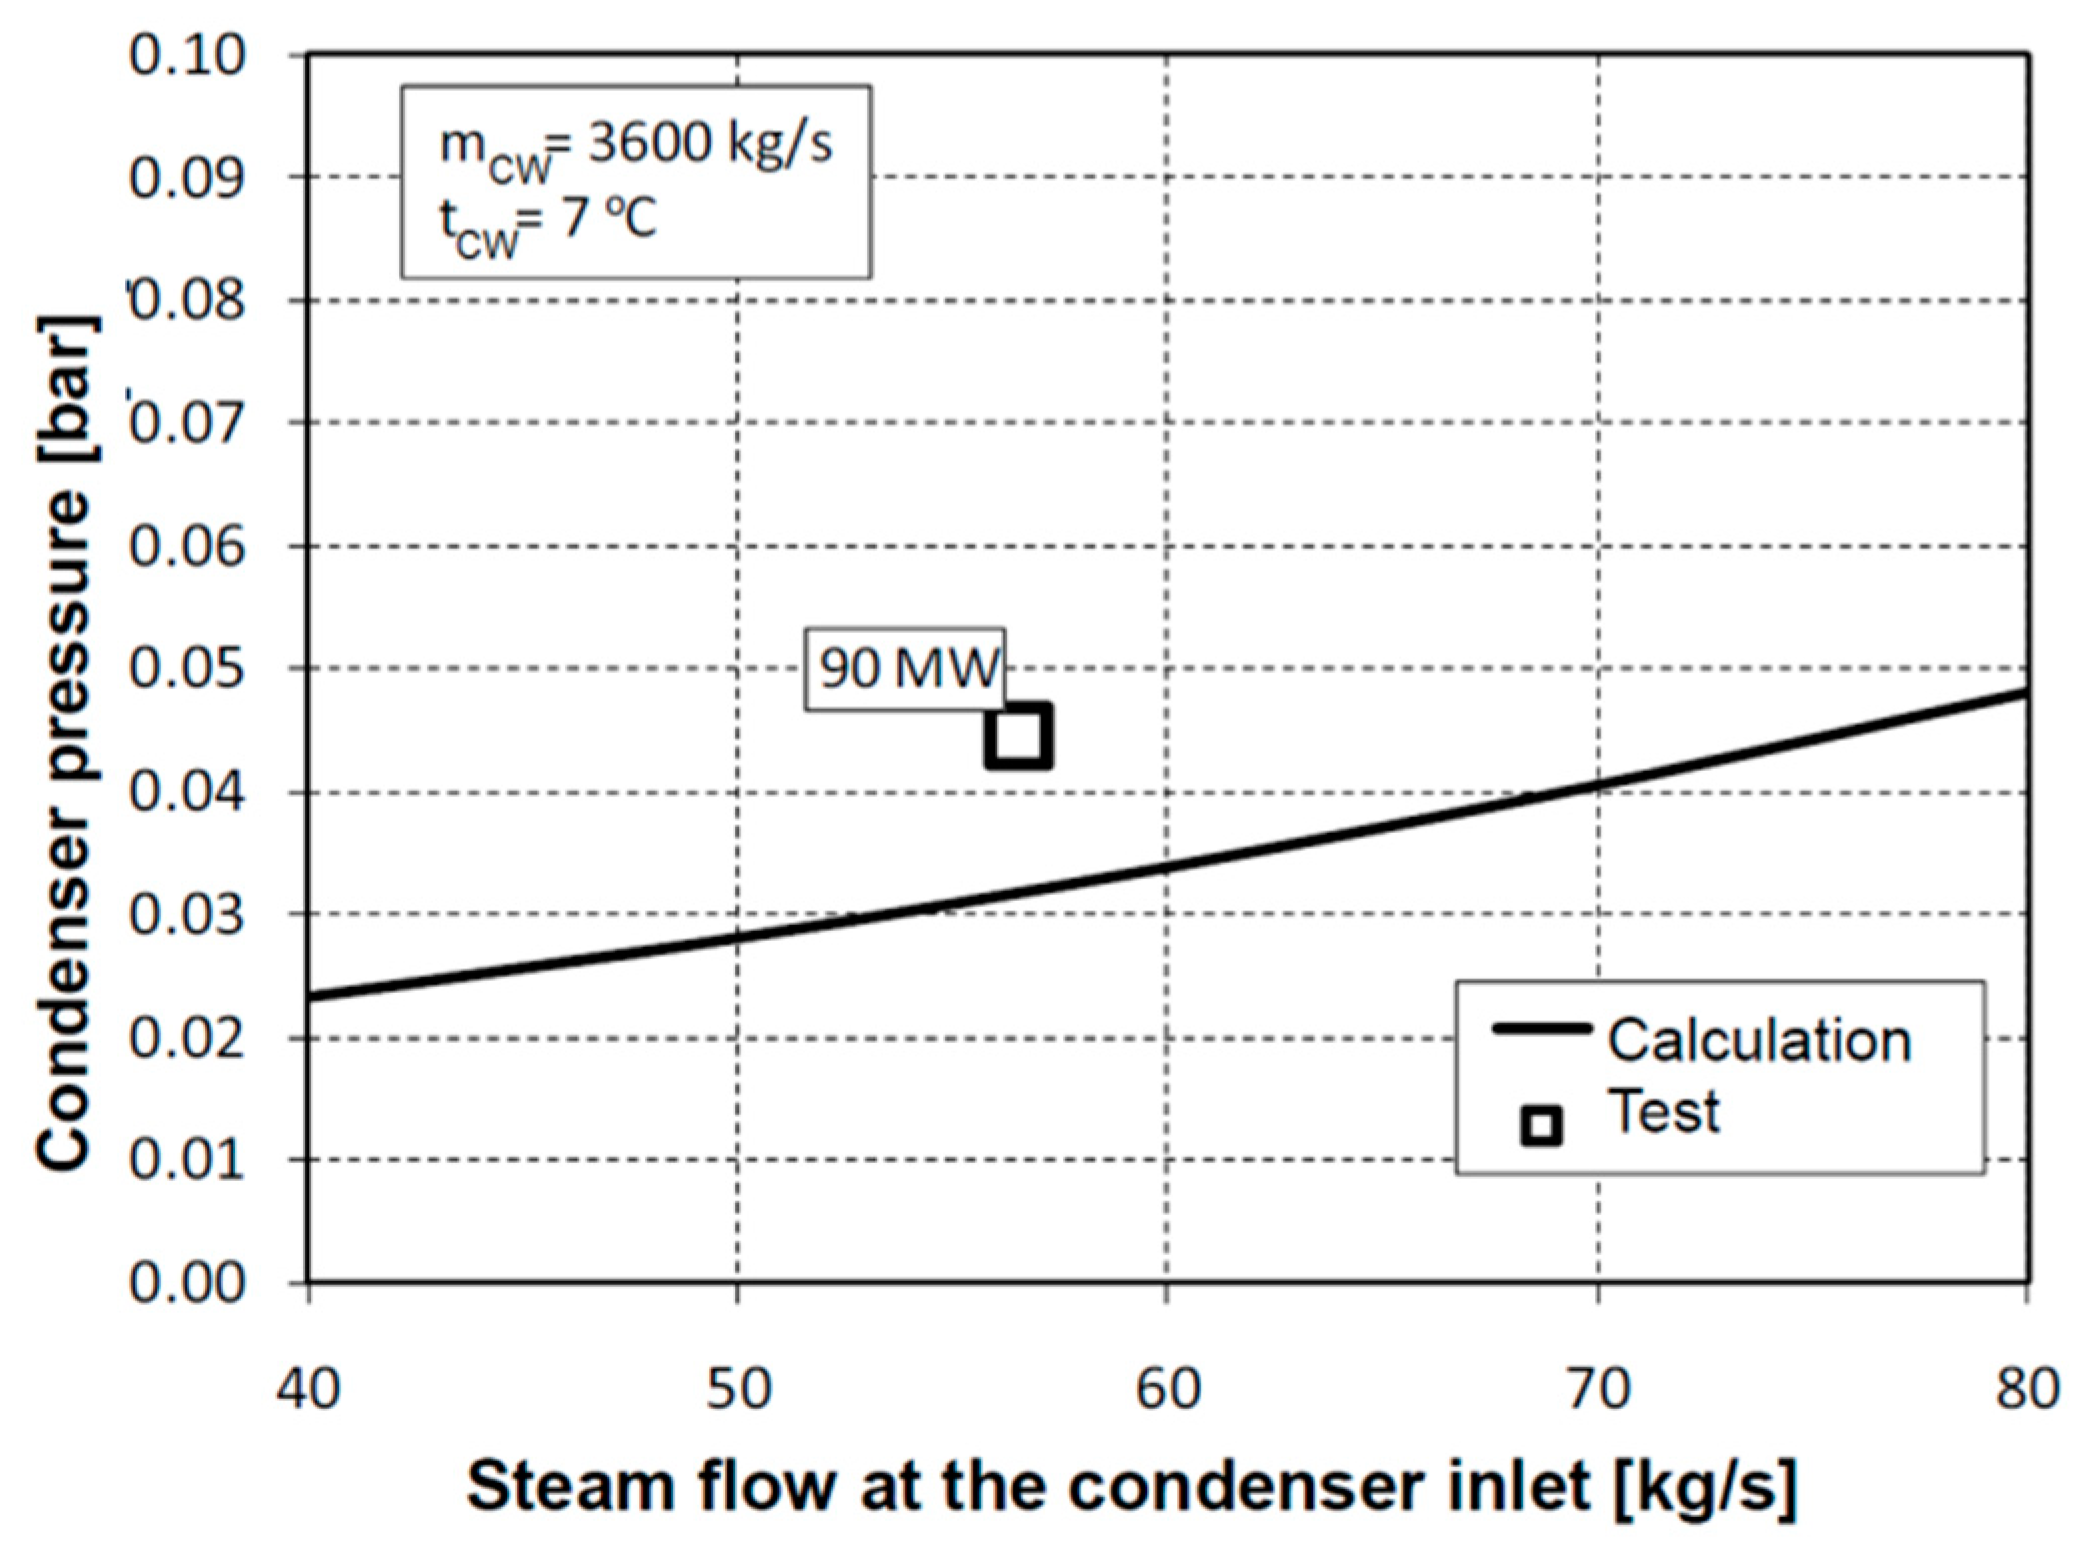
During the test, it was observed that only one cooling water (CW) pump was in operation, resulting in a cooling water mass flow of 2382 kg/s. In contrast, during test T90K, two CW pumps were utilized, achieving a cooling water mass flow of 3457 kg/s, as measured with an ultrasonic flow meter. The condenser pressure during test T90, with one CW pump operating, was 19.1 mbar higher than during test T90K. Figure 10 and Figure 11 illustrate a comparison of test data and calculation results, highlighting the influence of cooling water mass flow rate on condenser pressure.

Figure 10.
Condensation pressure at a cooling water flow rate of 2400 kg/s and a temperature of 7 °C. The calculated results correspond to the condenser’s design conditions.

Figure 11.
Condensation pressure at a cooling water flow rate of 3600 kg/s and a temperature of 7 °C. The calculated results correspond to the condenser’s design conditions.
The impact of increased condenser pressure due to reduced cooling water flow during test T90 on overall performance is depicted in Figure 3 and Table 3.
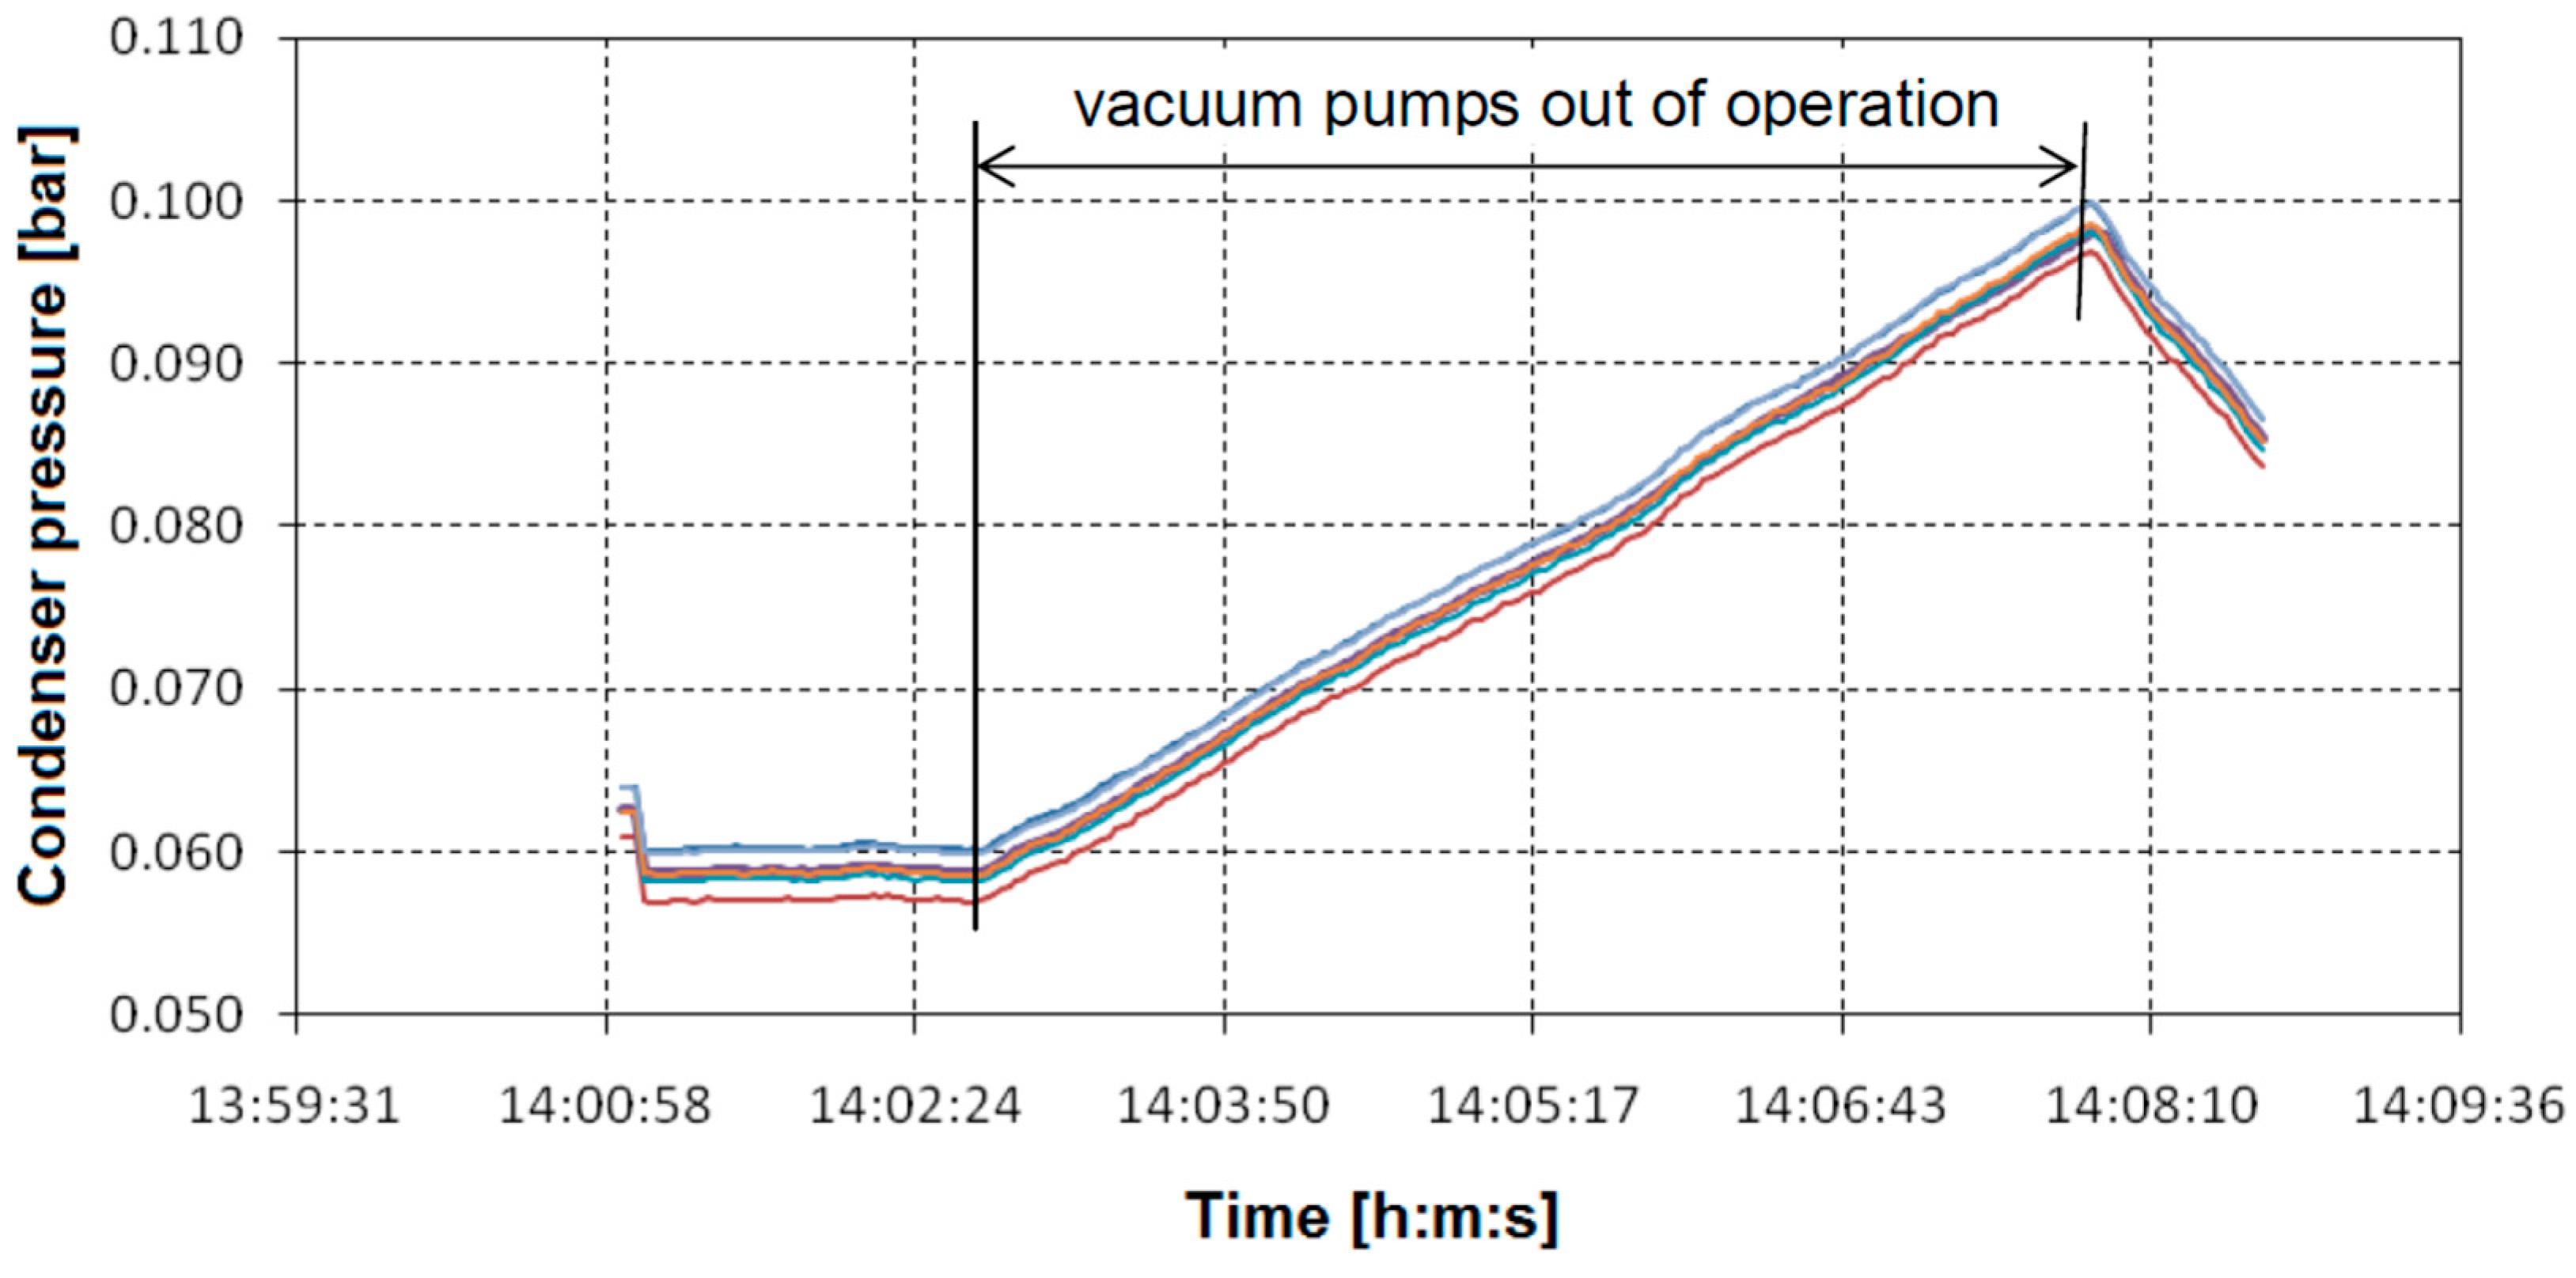
To identify the reasons for the increase in condenser pressure beyond the reduction in cooling water flow, a condenser leakage test was conducted. The vacuum pumps were deactivated, and the variation in condenser pressure over time was recorded (Figure 12). During the test, the condenser pressure increased by 7.45 mbar/min, significantly higher than the recommended value of 2.67 mbar/min. This result indicates substantial air in-leakage, which greatly affects the operating pressure.

Figure 12.
Condenser air leakage test: The condenser pressure increased by 7.45 mbar/min with the vacuum pumps off, exceeding the recommended value of 2.67 mbar/min. Various color lines indicate readings from different pressure transmitters.
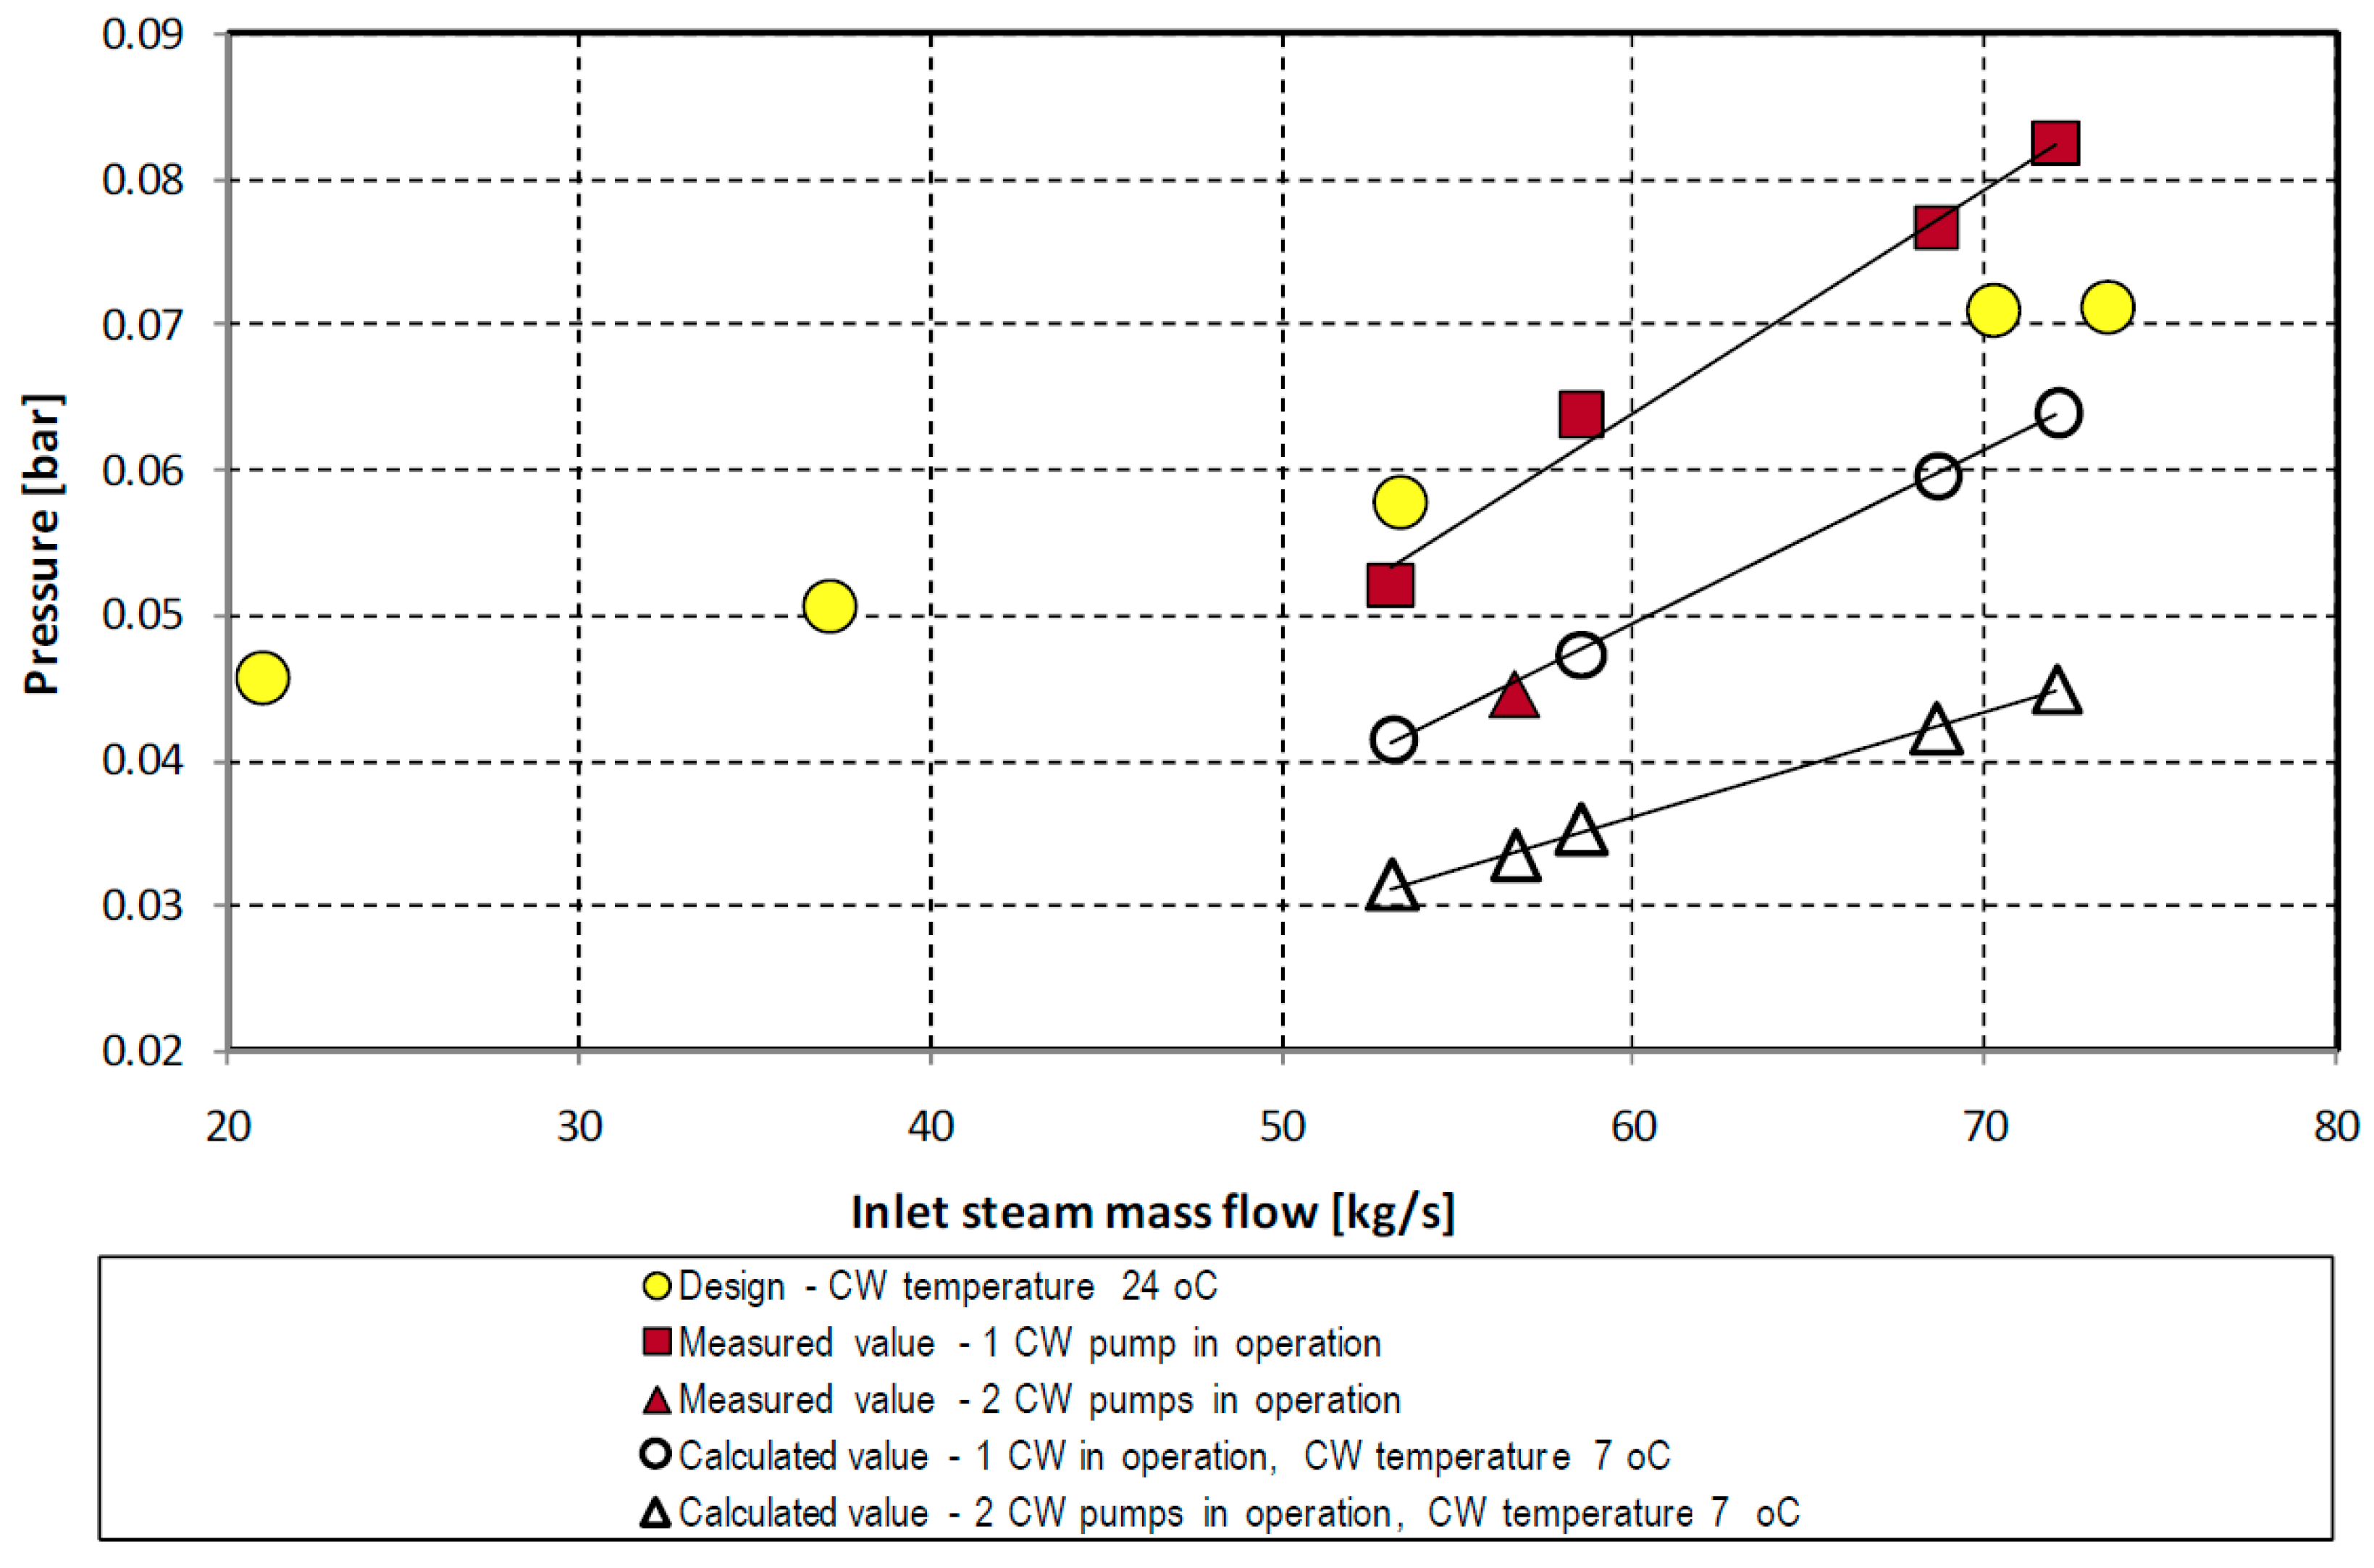
The power plant is equipped with a tube cleaning system that uses sponge rubber balls; however, this system has been non-operational for an extended period. Consequently, fouling and plugged tubes also contribute to the elevated condenser pressure. Figure 13 presents the measured and calculated condenser pressures.

Figure 13.
Condenser performance: variation in the condenser pressure according to the design, measured during the tests and calculated for the measured cooling water temperature (7 °C).
6.3. Operation of the Feed Water Heaters
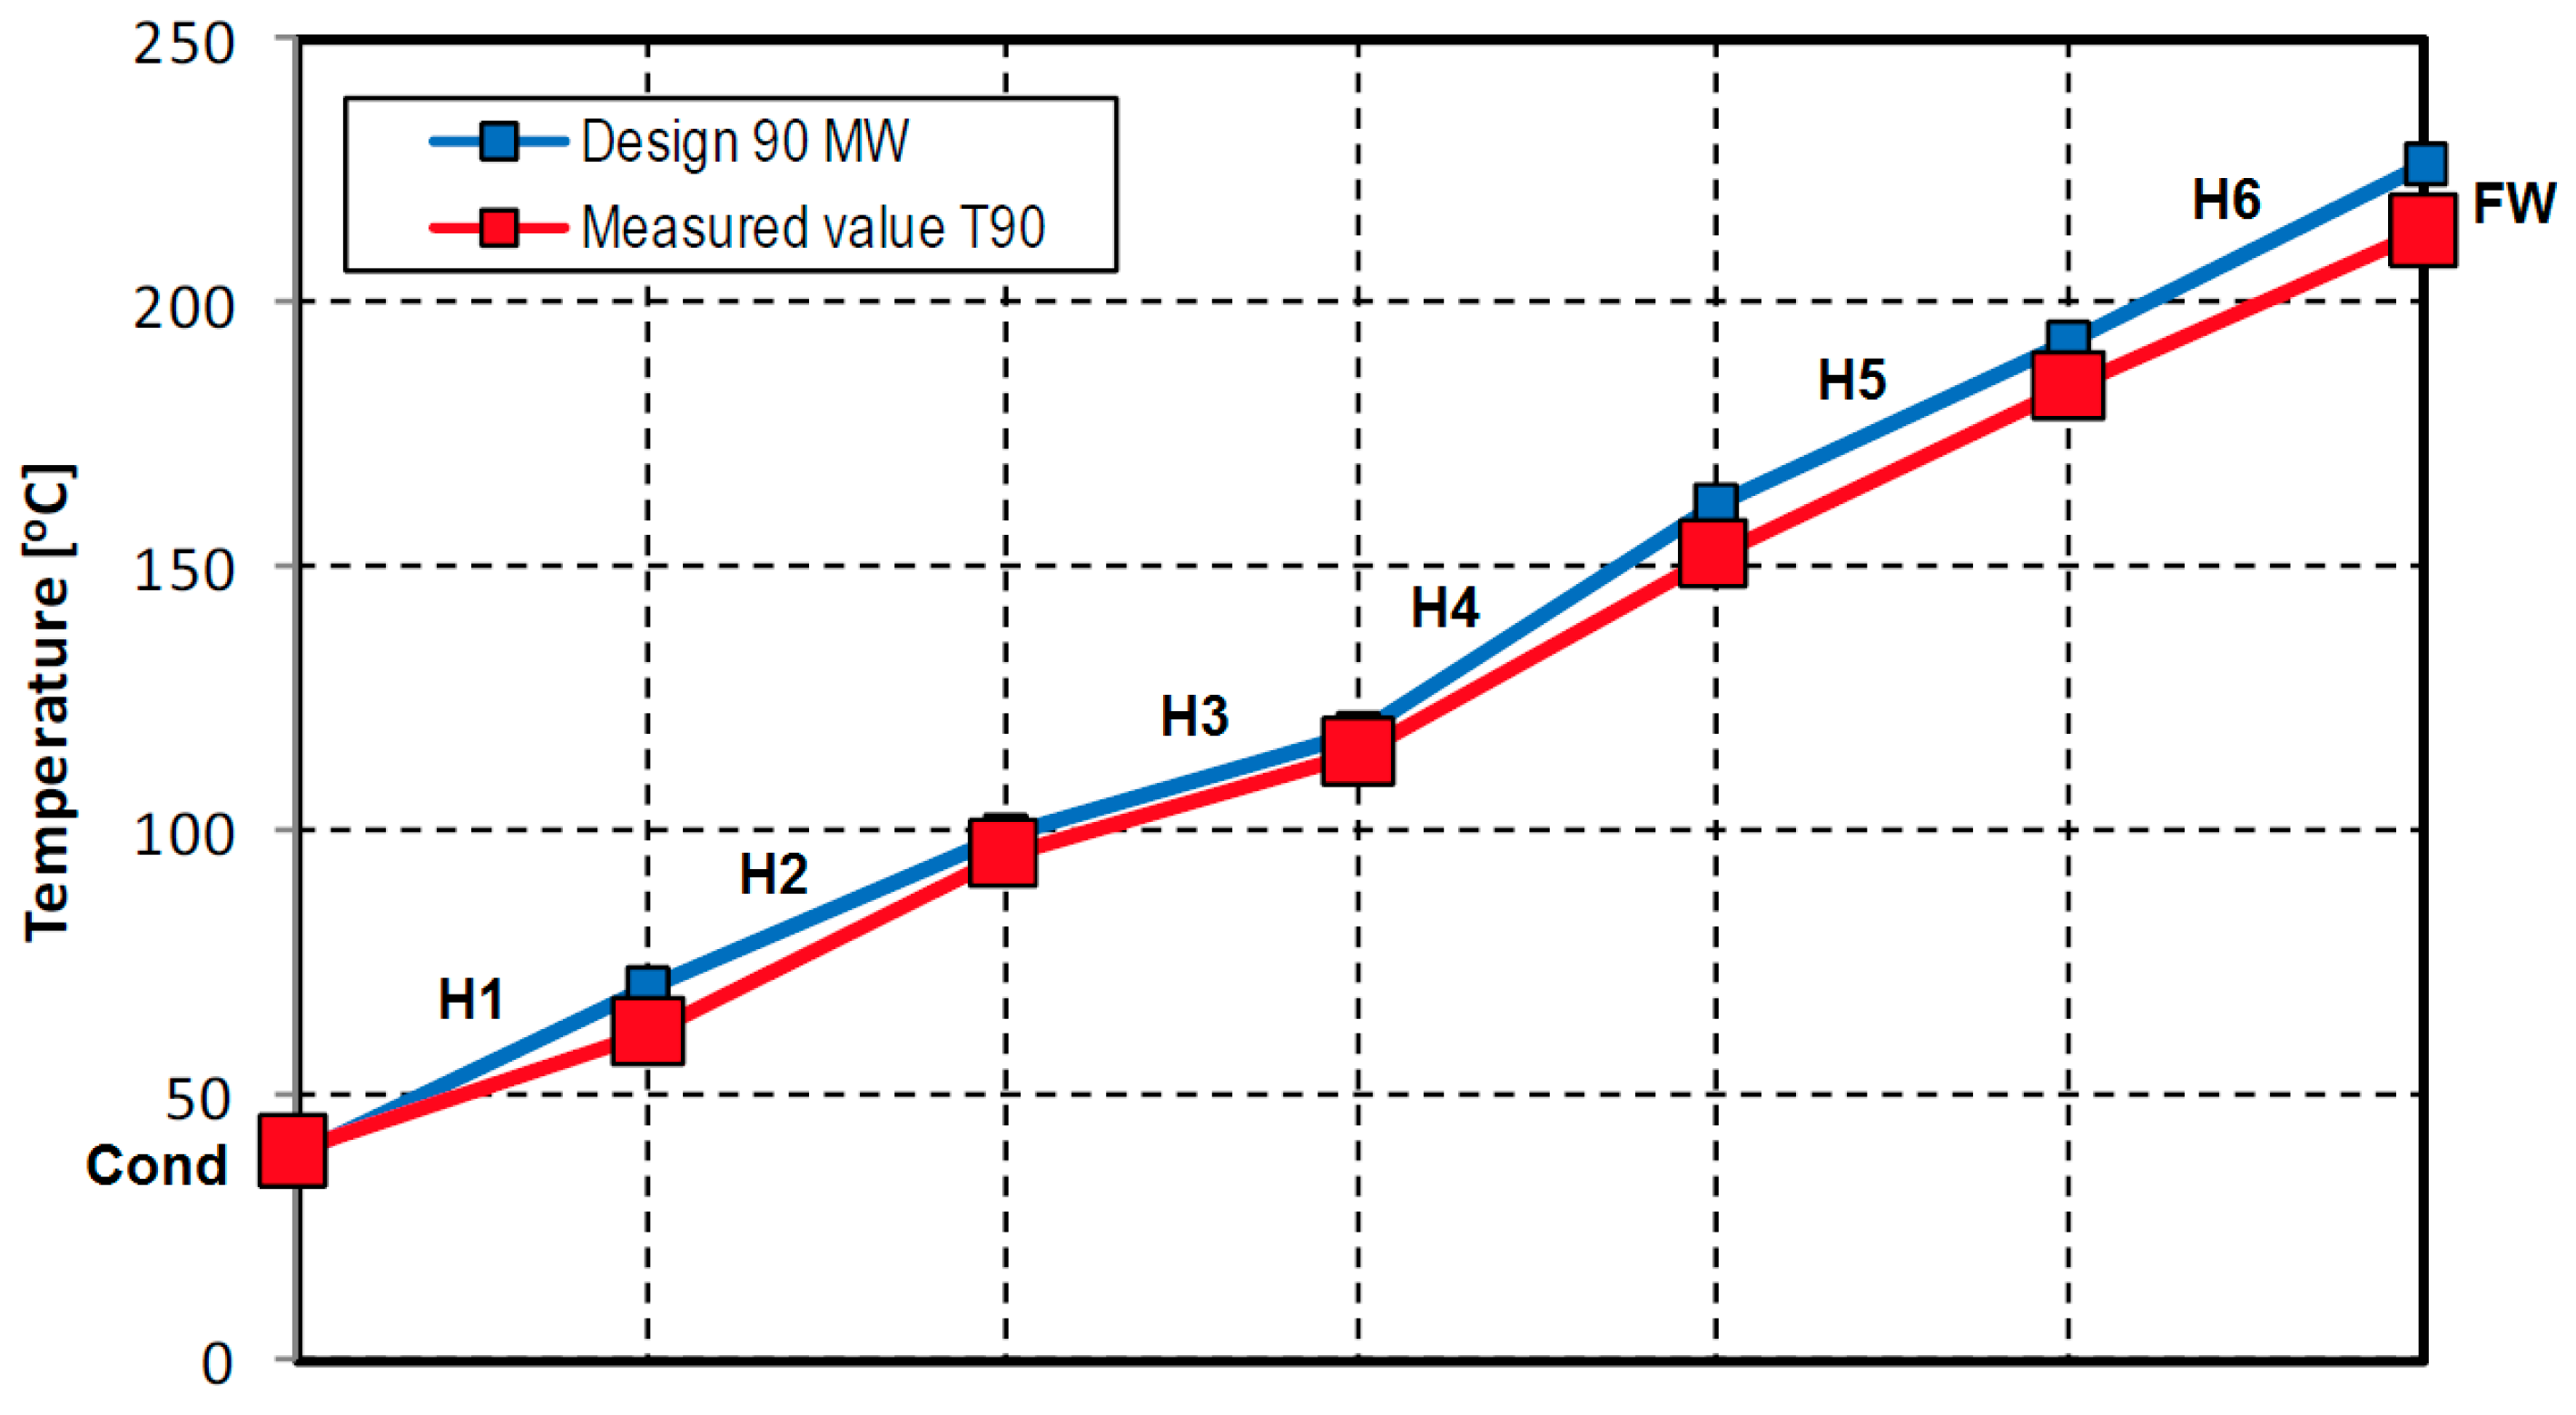
During the tests, some degradation in heater performance was observed, attributed to tube fouling and the plugging of certain tubes. This degradation led to an increase in the terminal temperature difference (TTD) of the heaters, a redistribution of the extraction mass flow rate, and a decrease in plant thermal efficiency. Figure 14 illustrates the temperature rise in the low-pressure (LP) and high-pressure (HP) heaters at a load of 90 MW. The increase in TTD in heater H1 was particularly significant. Additionally, the differences in feed water temperature in the high-pressure heaters (H4, H5, and H6) were due to lower steam extraction pressures [28,29,30].

Figure 14.
Feed water temperature rise in six FW heaters (H1–H6): comparison of the test results with the design data at a load of 90 MW.
7. Impact of Deterioration of the Performance of Individual Components on the Plant Efficiency and Electrical Output
Additional calculations were performed to assess the impact of deviations from design values of individual process parameters and component performance on the plant’s power output and heat rate. These calculations involved heat balance analysis using the in-house code STCycle, developed by the Laboratory of Thermal Turbomachinery. The results are summarized in Table 4.
Table 4.
Overview of the impact of deviations of the cycle parameters and performances of components on the power output and heat rate of the Morava steam turbine plant.
As previously mentioned, the overall deficit in electrical output was 12.9 MW. The most significant negative impacts on the reduction in electrical power output were due to deviations in the HP turbine (–4.1 MW), LP turbine (–1.32 MW), and condenser (–5.20 MW). Some of these discrepancies can be mitigated through improved plant operation and minor interventions. However, major issues, such as deviations in the HP turbine, LP turbine, and partially in the condenser, require substantial overhauls and investment to resolve.
It is important to note that replacing the existing HP turbine with a new, modern turbine would yield additional benefits, as it would have significantly higher efficiency than the design and value of the current turbine.
It should also be emphasized that, given the current condition of the Morava power plant, the nominal design power output of 120 MW cannot be achieved. With the design heat input, the electrical output will be approximately 13 MW lower. Attempting to achieve the nominal design power output by increasing fuel combustion and heat input beyond the design value would lead to boiler overloading, frequent outages, and unnecessary equipment stress.
The deterioration in plant performance, resulting in reduced electricity production, also has significant financial repercussions. Assuming the plant operates for 6500 h per year and the electricity price is 0.07 €/kWh, the financial deficit due to component performance degradation and parameter deviations is approximately €6 million annually. Using these findings, power plant management can readily assess the feasibility of measures to improve plant performance.
8. Conclusions
Tests of steam turbine plants are essential to provide reference data regarding the current state of the plant and identify operational deficiencies in both the overall system and individual components. These data can be utilized for subsequent analysis and optimization of the plant. The methodology for performance improvement presented in this paper is based on comparing test data against process simulations, allowing the identification of factors contributing to poor plant efficiency. From these conclusions, measures to address issues and enhance efficiency can be defined. The developed simulation method relies on analytical models for individual components, enabling fast calculations and seamless adaptation to different steam turbine configurations. Instead of using data from the plant’s SCADA system, specialized tests were conducted with highly accurate, calibrated instrumentation, similar to those used in steam turbine acceptance testing.
The methodology was demonstrated using a 120 MW power plant that has been operational for over 40 years. Comprehensive tests of the steam turbine plant were conducted, leading to plausible and reliable conclusions. The measured overall heat rate was significantly higher than the design value by approximately 10.5%, and a substantial deficit in electrical power output was detected. Under nominal heat input, the current condition of the steam turbine plant results in an electrical output about 13 MW lower than the design specification, causing an annual financial deficit of approximately €6 million. All sources of loss within the steam turbine plant were identified and analyzed, with the largest impacts on power reduction attributed to the deterioration of the HP turbine, LP turbine, and condenser. The primary recommendation is the urgent reconditioning of these components.
During the regular plant overhaul conducted a year after the tests, all tubes in the condenser were replaced, and measures to improve condenser tightness were implemented. As a result, the electrical power output increased by more than 5 MW at nominal heat input.
Author Contributions
Conceptualization, M.V.P.; methodology, M.V.P. and S.M.; software, M.V.P. and S.M.; validation, M.V.P., S.M., D.P., T.M. and N.M.M.; investigation, M.V.P., S.M., D.P., T.M. and N.M.M.; resources M.V.P.; data curation, S.M., D.P., T.M. and N.M.M.; writing—original draft preparation, M.V.P.; writing—review and editing, S.M., D.P., T.M. and N.M.M.; visualization, S.M.; project administration, S.M.; funding acquisition, M.V.P. All authors have read and agreed to the published version of the manuscript.
Funding
The work was supported by the Ministry of Science, Technological Development and Innovation of the Republic of Serbia: “Integrated Research in the Fields of Macro, Micro and Nano Mechanical Engineering—System for Optimization of Thermal Power Plants” and the authors would like to thank for the financial supports.
Data Availability Statement
No data were used for the research described in the article.
Conflicts of Interest
The authors declare no conflicts of interest.
Nomenclatures
| Symbols | |
| specific enthalpy (kJ/kg) | |
| pressure (bar) | |
| mass flow rate (kg/s) | |
| electrical output, power (MW) | |
| heat flow rate (MW) | |
| temperature (°C) | |
| overall heat rate (kJ/kWh) | |
| efficiency (%) | |
| Subscripts and abbreviations | |
| 1, 2 | inlet, outlet |
| b | overall, gross |
| CW | cooling water |
| DCA | drain cooler approach |
| E | steam extraction |
| FW | feed water |
| G | generator |
| H | heater |
| HP | high pressure |
| in | input |
| IP | inter-medium pressure |
| LP | low pressure |
| LS | live steam |
| MC | main condensate |
| RH | reheater, reheat |
| SCADA | Supervisory Control and Data Acquisition |
| spray | feed water injection into the reheater |
| T | turbine, tank |
| TPP | thermal power plant |
| TTD | heater terminal temperature difference |
References
- World Energy Outlook; OECD: Paris, France; IEA: Paris, France, 2016.
- Finkelman, R.B.; Wolfe, A.; Hendryx, M.S. The future environmental and health impacts of coal. Energy Geosci. 2021, 2, 99–112. [Google Scholar] [CrossRef]
- Kim, H.; Na, M.G.; Heo, G. Application of monitoring, diagnosis, and prognosis in thermal performance analysis for nuclear power plants. Nucl. Eng. Technol. 2014, 46, 737–752. [Google Scholar] [CrossRef]
- Zhou, L.; Xu, G.; Zhao, S.; Xu, C.; Yang, Y. Parametric analysis and process optimization of steam cycle in double reheat ultra-supercritical power plants. Appl. Therm. Eng. 2016, 99, 652–660. [Google Scholar] [CrossRef]
- Hnydiuk-Stefan, A.; Otawa, A.; Stefan, K.; Zmarzły, D. Technical and Economic Analysis of Low-Emissions Modernization of Existing Heating Plants in Poland. Energies 2021, 14, 7426. [Google Scholar] [CrossRef]
- Cornell, D.R. Steam turbine monitoring technology, validation, and verification tests for power plants. In Advances in Steam Turbines for Modern Power Plants; Tanuma, T., Ed.; Woodhead Publishing: Cambridge, MA, USA, 2017; pp. 241–260. [Google Scholar]
- Beebe, R. Steam turbine performance condition monitoring using plant instrumentation: Case study. J. Qual. Maint. Eng. 2003, 9, 102–112. [Google Scholar] [CrossRef]
- Kubiak, J.S.; García-Gutiérrez, A.; Urquiza, G.B. The diagnosis of turbine component degradation––Case histories. Appl. Therm. Eng. 2002, 22, 1955–1963. [Google Scholar] [CrossRef]
- Tian, Z.; Xu, L.; Yuan, J.; Zhang, X.; Wang, J. Online performance monitoring platform based on the whole process models of subcritical coal-fired power plants. Appl. Therm. Eng. 2017, 124, 1368–1381. [Google Scholar] [CrossRef]
- Cai, J.J.; Ma, X.Q.; Li, Q. On-line monitoring the performance of coal-fired power unit: A method based on support vector machine. Appl. Therm. Eng. 2009, 29, 2308–2319. [Google Scholar] [CrossRef]
- IEC 60953-0; Rules for Steam Turbine Thermal Acceptance Tests—Part 0: Wide Range of Accuracy for Various Types and Sizes of Turbines. IEC: Geneva, Switzerland, 2022.
- Kearney, P.J.; Hogg, S.I.; Brown, R.D. Performance guarantee and testing of steam turbine retrofits. In Proceedings of the ASME 2004 Power Conference, Baltimore, MD, USA, 30 March–1 April 2004; Paper No. POWER 2004-52116. pp. 315–324. [Google Scholar]
- Tahan, M.; Tsoutsanis, E.; Muhammad, M.; Karim, Z.A.A. Performance-based health monitoring, diagnostics and prognostics for condition-based maintenance of gas turbines: A review. Appl. Energy 2017, 198, 122–144. [Google Scholar] [CrossRef]
- Ziółkowski, P.; Drosińska-Komor, M.; Głuch, J.; Breńkacz, L. Review of Methods for Diagnosing the Degradation Process in Power Units Cooperating with Renewable Energy Sources Using Artificial Intelligence. Energies 2023, 16, 6107. [Google Scholar] [CrossRef]
- Tsoutsanis, E.; Meskin, N.; Benammar, M.; Khorasani, K. Dynamic performance simulation of an aeroderivative gas turbine using the matlab simulink environment. In Proceedings of the ASME 2013 International Mechanical Engineering Congress and Exposition, San Diego, CA, USA, 15–21 November 2013; American Society of Mechanical Engineers: New York, NY, USA, 2013; p. V04ATA050-V04AT04A. [Google Scholar]
- Drosińska-Komor, M.; Głuch, J.; Breńkacz, L.; Ziółkowska, N.; Piotrowicz, M.; Ziółkowski, P. Advanced genetic algorithm-based signal processing for multi-degradation detection in steam turbines. Mech. Syst. Signal Process. 2025, 224, 112166. [Google Scholar] [CrossRef]
- Wagner, W.; Kruse, A. Properties of Water and Steam, Industrial Standard IAPWS-97; Springer: Berlin, Germany, 1998. [Google Scholar]
- STCycle—A Code for Heat Balance Calculation and Optimization of Steam Turbine Plants; University of Belgrade, Faculty of Mechanical Engineering, Laboratory of Thermal Turbomachinery: Belgrade, Serbia, 2015.
- Cotton, K.C. Evaluating and Improving Steam Turbine Performance; Cotton Fact Inc.: Cary, NC, USA, 1993. [Google Scholar]
- Petrovic, M.V.; Riess, W. Off-design flow analysis of LP steam turbines. In Proceedings of the 1997 2nd European Conference on Turbomachinery—Fluid Dynamics and Thermodynamics, Antwerp, Belgium, 5–7 March 1997; pp. 37–44. [Google Scholar]
- Laskowski, R. Relations for steam power plant condenser performance in off-design conditions in the function of inlet parameters and those relevant in reference conditions. Appl. Therm. Eng. 2016, 103, 528–536. [Google Scholar] [CrossRef]
- Ganan, J.; Rahman Al-Kasir, A.; Gonzalez, J.F.; Macías, A.; Diaz, M.A. Influence of cooling circulation water on the efficiency of a thermonuclear plant. Appl. Therm. Eng. 2005, 25, 485–495. [Google Scholar] [CrossRef]
- Wang, W.; Zeng, D.; Liu, J.; Niu, Y.; Cui, C. Feasibility analysis of changing turbine load in power plants using continuous condenser pressure adjustment. Energy 2014, 64, 533–540. [Google Scholar] [CrossRef]
- O’Donovan, A.; Grimes, R. A theoretical and experimental investigation into the thermodynamic performance of a 50 MW power plant with a novel modular air-cooled condenser. Appl. Therm. Eng. 2014, 71, 119–129. [Google Scholar] [CrossRef]
- Saari, J.; Kaikko, J.; Vakkilainen, E.; Savolainen, S. Comparison of power plant steam condenser heat transfer models for on-line condition monitoring. Appl. Therm. Eng. 2014, 62, 37–47. [Google Scholar] [CrossRef]
- Harish, R.; Subhramanyan, E.E.; Madhavan, R.; Vidyanand, S. Theoretical model for evaluation of variable frequency drive for cooling water pumps in sea water based once through condenser cooling water systems. Appl. Therm. Eng. 2010, 30, 2051–2057. [Google Scholar] [CrossRef]
- Condpro—A Code for Design and Analysis of Condensers in Steam Turbine Power Plants; University of Belgrade, Faculty of Mechanical Engineering, Laboratory of Thermal Turbomachinery: Belgrade, Serbia, 2015.
- HEpro—A Code for Design and Analysis of Heat Exchangers in Steam Turbine Power Plants; University of Belgrade, Faculty of Mechanical Engineering, Laboratory of Thermal Turbomachinery: Belgrade, Serbia, 2015.
- Weber, G.E.; Worek, W.M. Development of a Method to Evaluate the Design Performance of a Feedwater Heater With a Short Drain Cooler. J. Eng. Gas Turbines Power 1994, 116, 434–441. [Google Scholar] [CrossRef]
- Weber, G.E.; Worek, W.M. The Application of a Method to Evaluate the Design Performance of a Feedwater Heater With a Short Drain Cooler. J. Eng. Gas Turbines Power 1995, 117, 384–388. [Google Scholar] [CrossRef]
Disclaimer/Publisher’s Note: The statements, opinions and data contained in all publications are solely those of the individual author(s) and contributor(s) and not of MDPI and/or the editor(s). MDPI and/or the editor(s) disclaim responsibility for any injury to people or property resulting from any ideas, methods, instructions or products referred to in the content. |
© 2025 by the authors. Licensee MDPI, Basel, Switzerland. This article is an open access article distributed under the terms and conditions of the Creative Commons Attribution (CC BY) license (https://creativecommons.org/licenses/by/4.0/).