Article

Optimization Scheduling of Hydrogen-Integrated Energy Systems Considering Multi-Timescale Carbon Trading Mechanisms

College of Electrical Engineering, Shanghai University of Electric Power, Shanghai 201399, China
*
Author to whom correspondence should be addressed.
Energies 2025, 18(7), 1612; https://doi.org/10.3390/en18071612
Submission received: 24 February 2025 / Revised: 10 March 2025 / Accepted: 14 March 2025 / Published: 24 March 2025
(This article belongs to the Section C: Energy Economics and Policy)

Abstract

:
Amidst the escalating global challenges presented by climate change, carbon trading mechanisms have become critical tools for driving reductions in carbon emissions and optimizing energy systems. However, existing carbon trading models, constrained by fixed settlement cycles, face difficulties in addressing the scheduling needs of energy systems that operate across multiple time scales. To address this challenge, this paper proposes an optimal scheduling methodology for hydrogen-encompassing integrated energy systems that incorporates a multi-time-scale carbon trading mechanism. The proposed approach dynamically optimizes the scheduling and conversion of hydrogen energy, electricity, thermal energy, and other energy forms by flexibly adjusting the carbon trading cycle. It accounts for fluctuations in energy demand and carbon emissions occurring both before and during the operational day. In the day-ahead scheduling phase, a tiered carbon transaction cost model is employed to optimize the initial scheduling framework. During the day scheduling phase, real-time data are utilized to dynamically adjust carbon quotas and emission ranges, further refining the system’s operational strategy. Through the analysis of typical case studies, this method demonstrates significant benefits in reducing carbon emission costs, enhancing energy efficiency, and improving system flexibility.

1. Introduction

The pursuit of “carbon peak and carbon neutrality” represents a comprehensive and transformative shift in both the economic and social structures. Reducing a high-carbon-emitting power generation framework, while simultaneously addressing the interrelated challenges of energy security, cost, and environmental impact, is crucial for fostering high-quality energy and power development and realizing the “dual carbon” objectives [1]. Integrated energy systems (IES), which combine various energy forms, offer the potential to coordinate and optimize energy generation, transmission, distribution, conversion, storage, and consumption. The deep integration of these distinct energy systems promotes the large-scale deployment of renewable energy, positioning IES as a key technological approach for achieving emission reduction targets [2,3,4,5].
Hydrogen energy, as a clean secondary energy source, offers several advantages, including high energy density, substantial energy storage capacity, and minimal environmental impact. The integration of hydrogen energy into energy systems enhances the coupling of various energy forms, thereby significantly improving system efficiency and increasing operational flexibility [6,7,8]. Therefore, this study focuses on hydrogen-integrated energy systems as the research subject. However, during operation, uncertainties can impact the system’s stability and economic performance, driving significant interest in the development of multi-timescale optimization scheduling methods [9]. The authors of [10] proposed a multi-timescale optimization scheduling strategy aimed at minimizing integrated energy costs, significantly reducing system operating expenses while addressing the uncertainties of photovoltaic generation within integrated energy systems (IES). The authors of [11] developed a multi-timescale framework to manage the uncertainties of wind, solar, and electro-hydrogen loads, thereby enhancing the risk mitigation capabilities of IES. The authors of [12] examined the multi-timescale coordinated operation problem of electro-hydrogen energy systems, achieving coordinated optimization across multiple timescales through the construction of a Nash bargaining model, which substantially improved the system’s economic performance. While these studies have advanced the efficient utilization of energy systems and reduced operational costs, they have not sufficiently addressed the critical issue of low-carbon emissions within the system. In this regard, the paper introduces a carbon trading mechanism aimed at reducing both the operational costs of the system and its carbon emissions.
Regarding carbon emissions, carbon trading has emerged as a key mechanism for emission reduction. The authors of [13,14] explored the capacity of IES to mitigate greenhouse gas emissions, establishing a carbon index system for energy conservation and emission reduction. The authors of [15,16] investigated scheduling strategies for IES under tiered carbon pricing, demonstrating the feasibility of integrating carbon trading mechanisms into IES. The authors of [17,18] incorporated tiered carbon emission costs and carbon sequestration benefit models into hydrogen-encompassing IES, where progressively increasing carbon costs effectively discouraged high-carbon emission behavior. However, much of the existing research focuses on calculating and optimizing carbon costs within fixed timescales, failing to fully capture the dynamic nature and complexity of carbon costs across various timescales. Consequently, there is a pressing need for the development of more flexible and adaptive carbon trading strategies to meet the evolving demands of contemporary energy systems. In response, this paper introduces a flexible approach for adjusting the carbon trading cycle and revising carbon quotas, effectively addressing the scheduling demands of energy systems across various time scales.
This study presents an optimization scheduling approach for hydrogen-integrated energy systems that incorporate multi-timescale carbon trading mechanisms, addressing the dynamic variability and complexity of carbon costs across different time horizons. In the day-ahead scheduling phase, a stepwise carbon trading cost model, incorporating penalty and reward factors, is utilized for optimization based on short-term forecast data. Building upon the day-ahead scheduling results and ultra-short-term forecasting data, the system further defines intra-day carbon quotas and emission bounds, which are dynamically adjusted using real-time measurement data. The main contributions of this paper are summarized as follows:
  • A multi-timescale carbon trading mechanism is introduced, designed to enhance both day-ahead and intra-day scheduling processes.
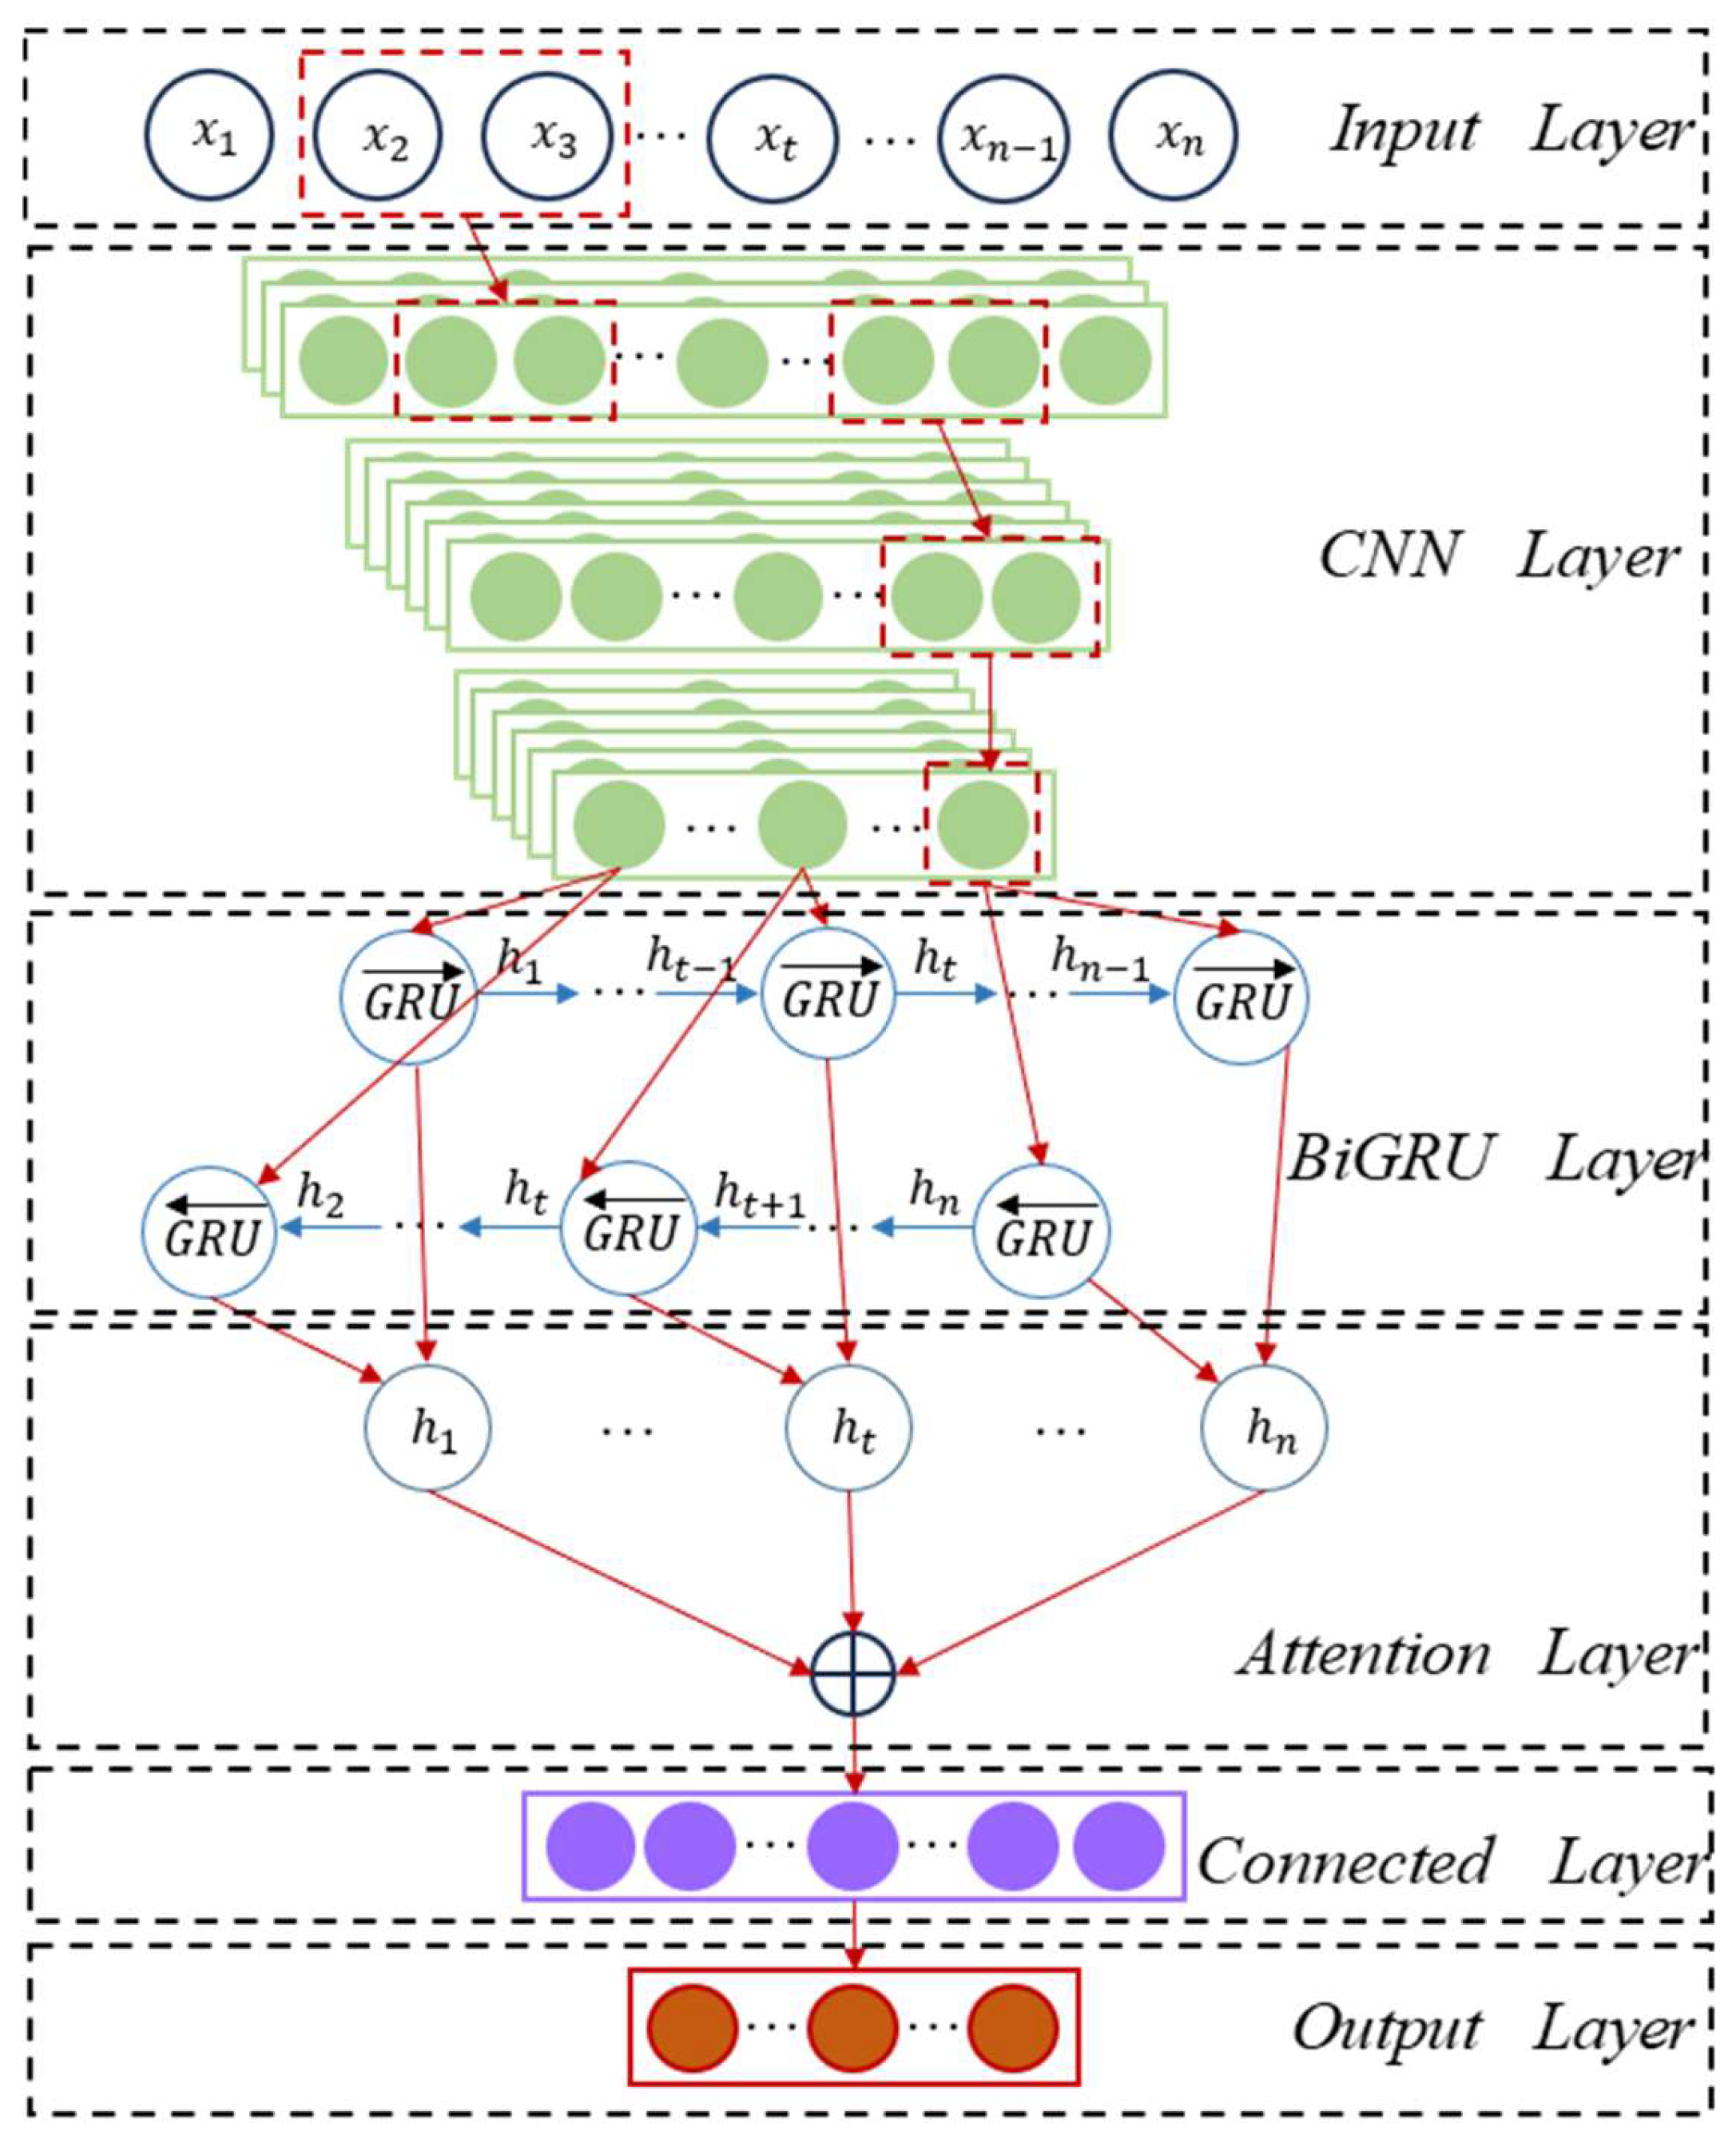
  • A novel forecasting approach based on the IVY-CNN-BiGRU-Attention model is proposed to improve load prediction accuracy.
The structure of this paper is as follows: Section 2 provides an overview of the IES system. Section 3 discusses the multi-timescale carbon trading mechanism. Section 4 elaborates on the IES scheduling model. Section 5 presents a comprehensive validation of the proposed methodology. Finally, Section 6 concludes with a summary of the key findings.

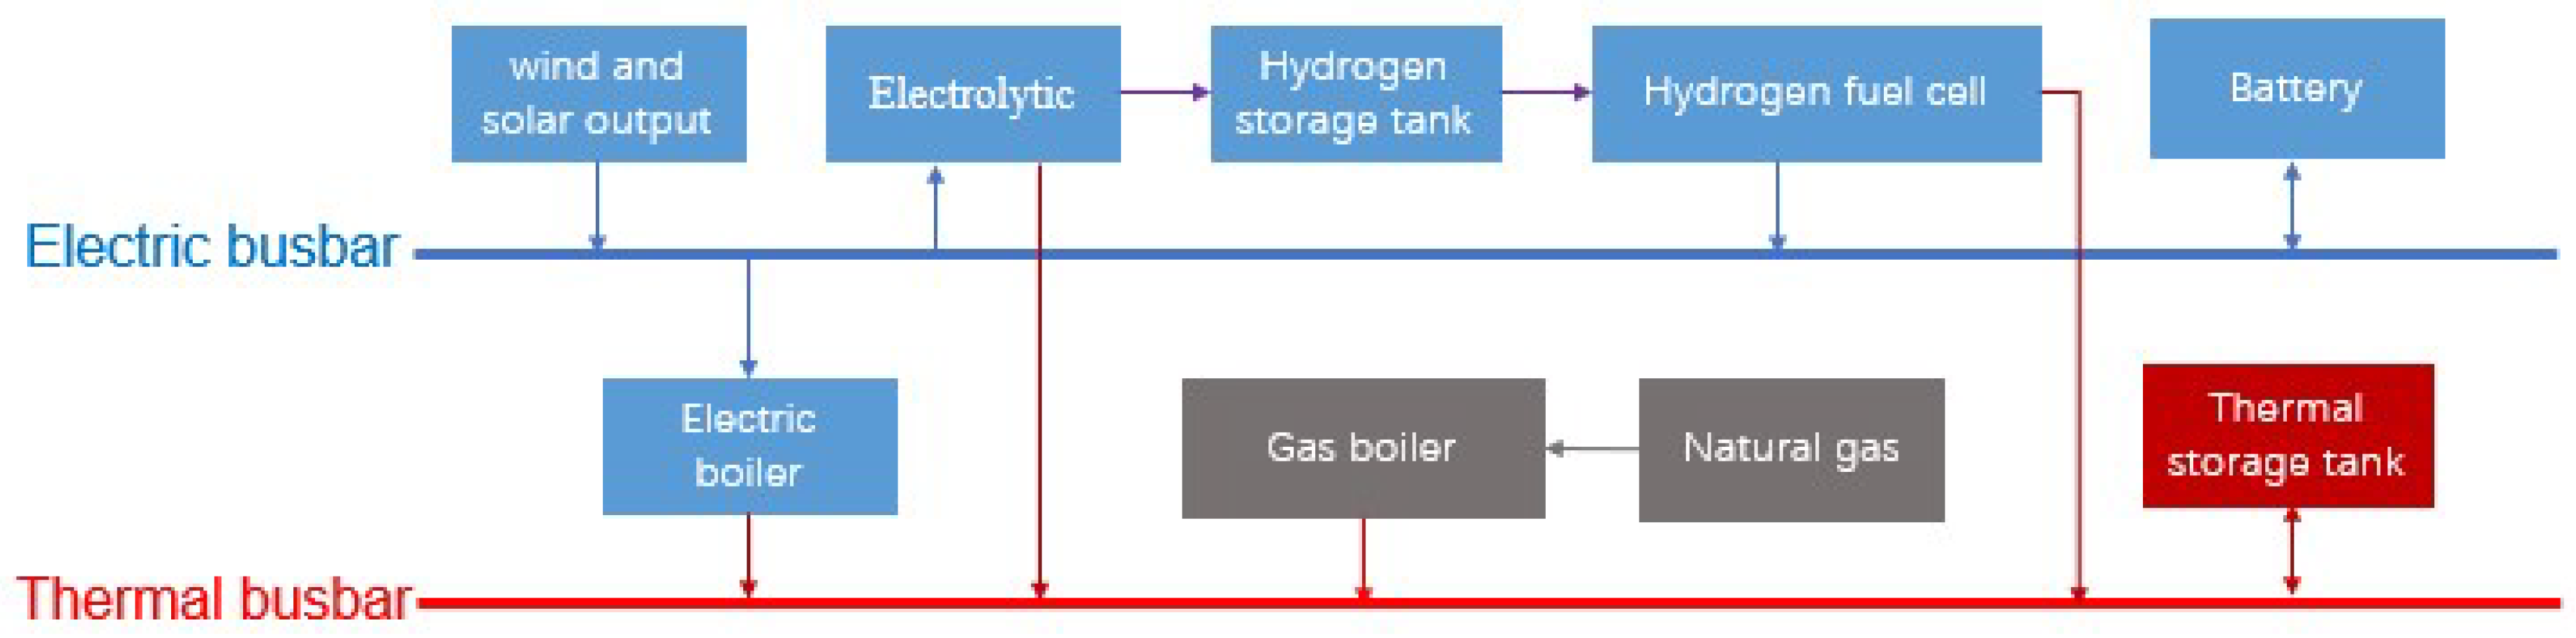
2. Integrated Energy System Structure

The structure of the integrated energy system (IES) studied in this paper is shown in Figure 1. The IES comprises various components, including renewable energy sources such as wind power and photovoltaics, electric boilers, combined heat and power units featuring gas boilers, electrolyzers, hydrogen fuel cell heat and power coupling units, hydrogen storage tanks, batteries, and thermal storage tanks for energy storage. These diverse elements enable the system to integrate multiple energy forms, facilitating efficient energy generation, conversion, storage, and utilization. There has been considerable research both domestically and internationally on the aforementioned modeling [19,20,21], which will not be further elaborated on in this paper.

3. Multi-Timescale Carbon Trading Mechanism

3.1. Tiered Carbon Trading Cost Model

To effectively manage carbon emissions, a tiered carbon trading cost calculation model incorporating a reward and penalty mechanism is proposed. This model defines the trading intervals for system participation in carbon trading, along with unit carbon trading prices corresponding to different trading periods. The structure of the tiered carbon trading cost is represented by the following equation:
F c = p ( 1 + 2 λ ) ( E l D a ) p ( 1 + λ ) E l , D a D q E l ; p ( 1 + λ ) ( D q D a ) , E l < D a D q 0 ; p ( D a D q ) , 0 < D a D q E l ; p E l + p ( 1 + λ ) ( D a D q E l ) , E l < D a D q 2 E l ; p E l + p ( 1 + λ ) E + p ( 1 + 2 λ ) ( D a D q 2 E l ) , D a D q > 2 E l
where p is the carbon trading price, E l is the initial carbon quota, D a is the actual carbon emissions, E l is the carbon emission range, and λ is the reward and penalty factor.

3.2. Multi-Timescale Carbon Quota Allocation

The carbon quota for the day-ahead scheduling period is determined based on the seasonal carbon quota, as outlined below:
Building upon the carbon quota established for the day-ahead scheduling period, the carbon quota for the intra-day scheduling period is subsequently calculated as follows:
D x s = α x s D x x = 1 4 α x = 1
where D x s is the carbon quotas for each season, α x s is the seasonal carbon quota ratio, and D x is the total annual carbon quota.
The carbon quota for the day-ahead scheduling period is calculated based on the carbon quota for that season, as shown below:
D a h e a d _ q = α x d D x s
where α x d is the day-ahead carbon quota ratio.
Building upon the carbon quota established for the day-ahead scheduling period, the carbon quota for the intra-day scheduling period is subsequently calculated as:
D int r a _ q T = D int r a _ e T τ = 1 τ = 24 D a h e a d _ e τ D a h e a d _ q
where D int r a _ q T is the carbon quota for the system’s intra-day scheduling period T , D int r a _ e T is the expected carbon emissions for the system during the intra-day scheduling period T , and D a h e a d _ e τ is the carbon emissions for the system during the day-ahead scheduling period τ .

3.3. Multi-Timescale Carbon Quota and Carbon Emission Interval Adjustment Mechanism

Using the carbon quota of the intra-day scheduling period, the duration of the carbon emission interval for that period can be determined as follows:
E int r a _ l T = E a d e a d _ l D a h e a d _ q D int r a _ q T
where E a d e a d _ l is the carbon emission range length for the system’s current participation.
The inherent uncertainty of wind and solar power generation, coupled with the volatility of load fluctuations, introduces inevitable uncertainties in carbon emission forecasting. To enhance the accuracy of these predictions, it is essential to refine the initial forecast results based on real operational data. This methodology not only effectively mitigates prediction errors but also provides a more precise reflection of the influence of actual operating conditions within complex systems.
D int r a _ r T = D int r a _ a T D int r a _ e T D int r a _ r e T 1 = D int r a _ e T 1 D int r a _ e T D int r a _ a T D int r a _ r t
where D int r a _ a T is the adjusted predicted carbon emissions for the system during the intra-day scheduling period T and D int r a _ e T 1 is the predicted carbon emissions for the system during the intra-day scheduling period T + 1 .

4. Multi-Timescale Optimization Scheduling Model

4.1. Day-Ahead Scheduling Model

The objective of the day-ahead optimization scheduling is to minimize the operating costs of the IES by strategically scheduling the energy supply and storage devices, thereby reducing overall system expenses. The operating costs of the IES encompass maintenance and operation costs, pollution control costs, and fuel costs. Consequently, the objective function is expressed as follows:
F 1 = min { F o p 1 + F c 1 } F o p 1 = F f u e l 1 + F m 1 + F c 1 F f u e l 1 = t = 1 24 F g a s P g b ( t ) L H F m 1 = F o p 1 = t = 1 24 i = 1 n c i P i ( t )
where F o p 1 is the day-ahead operational cost, F f u e l 1 is the day-ahead fuel cost, F m 1 is the day-ahead maintenance cost, F c 1 is the day-ahead carbon trading cost, F g a s is the price of natural gas, the price of natural gas, L H is the calorific value of natural gas, and c i is the operation and maintenance cost coefficient of the device.

4.2. Intra-Day Scheduling Model

The objective of intra-day scheduling is to mitigate the power fluctuations induced by day-ahead forecast errors, ensuring that intra-day power generation closely tracks the day-ahead plan while minimizing the economic losses associated with uncertainty. The optimization goal is expressed as follows:
F 2 = min { F o p 2 + F c 2 + F p 2 } F p 2 = k = 1 3 [ λ i ( P i 1 ( t ) P i 2 ( t ) ) 2 + γ i ( S i 1 ( t ) S i 2 ( t ) ) 2 ]
where F o p 2 is the intra-day operational cost; F c 2 is the intra-day carbon emission cost; F p 2 is the intra-day penalty cost; λ i and γ i are the penalty coefficients for power and state of charge, respectively; P i 1 ( t ) and P i 2 ( t ) are the day-ahead reference power and intra-day output power of the device; and S i 1 ( t ) and S i 2 ( t ) are the day-ahead reference state of charge and intra-day state of charge values for the energy storage device.

4.3. Constraint Conditions

  • Electric power balance constraint
P w t ( t ) + P p v ( t ) + P f c ( t ) + P e b ( t ) + P d i s ( t ) P c h a ( t ) P e l ( t ) = P l o a d ( t )
where P w t ( t ) , P p v ( t ) , P h c ( t ) , P e b ( t ) , P d i s ( t ) , P c h a ( t ) , P e l ( t ) and P l o a d ( t ) are the output electrical power of the wind turbine, photovoltaic, fuel cell, electric boiler, charging power, discharging power, and electrical power consumed by the electrolyzer and electrical load during period t .
b.
Thermal power balance constraint
H e b ( t ) + H g b ( t ) + H h c ( t ) + H d i s ( t ) H c h a ( t ) = H l o a d ( t )
where H e b ( t ) , H g b ( t ) , H h f c ( t ) , H d i s ( t ) , H c h a ( t ) , and H l o a d ( t ) are the output thermal power of the electric boiler, gas boiler, hydrogen energy battery, charging power, discharging power, and the thermal load during period t .
c.
Power upper and lower limit constraints of electric boilers and fuel boilers.
P e b , min P e b ( t ) P e b , max P g b , min P g b ( t ) P g b , max
where P e b , max and P e b , min , P g b , max , and P g b , min are the lower and upper power limits of the electric boiler and fuel boiler.
d.
Battery constraints
0 S o c ( t ) S o c max 0 P c h a ( t ) P c h a , max 0 P d i s ( t ) P d i s , max
where S o c ( t ) is the state of charge of the battery during period t , S o c max is the maximum available capacity of the battery, and P c h a , max and P d i s , max are the maximum charging and discharging power of the battery.
e.
Power constraints for electric boilers and gas boilers
0 H o c ( t ) H o c max 0 Q c h a ( t ) Q c h a , max 0 Q d i s ( t ) Q d i s , max
where H o c ( t ) is the thermal state of the thermal storage tank during period t , H o c max is the maximum available capacity of the thermal storage tank, Q c h a , max and Q c h a , max are the maximum charging and discharging power of the battery.
f.
Hydrogen storage tank constraints
0 S o h c ( t ) S o h c max P f c , min P f c ( t ) P f c , max P e t , min P e t ( t ) P e t , max P h e s ( t ) = a f c P f c ( t ) + a e l P e t ( t ) a f c + a e t 1
where S o h c ( t ) is the state of the hydrogen storage tank during period, S o h c max is the maximum available capacity of the hydrogen storage tank, P f c , min and P f c , max are the lower and upper power limits of the electrolyzer, and a f c and a e l are the operating states of the fuel cell and battery, where 1 indicates operation and 0 indicates non-operation.

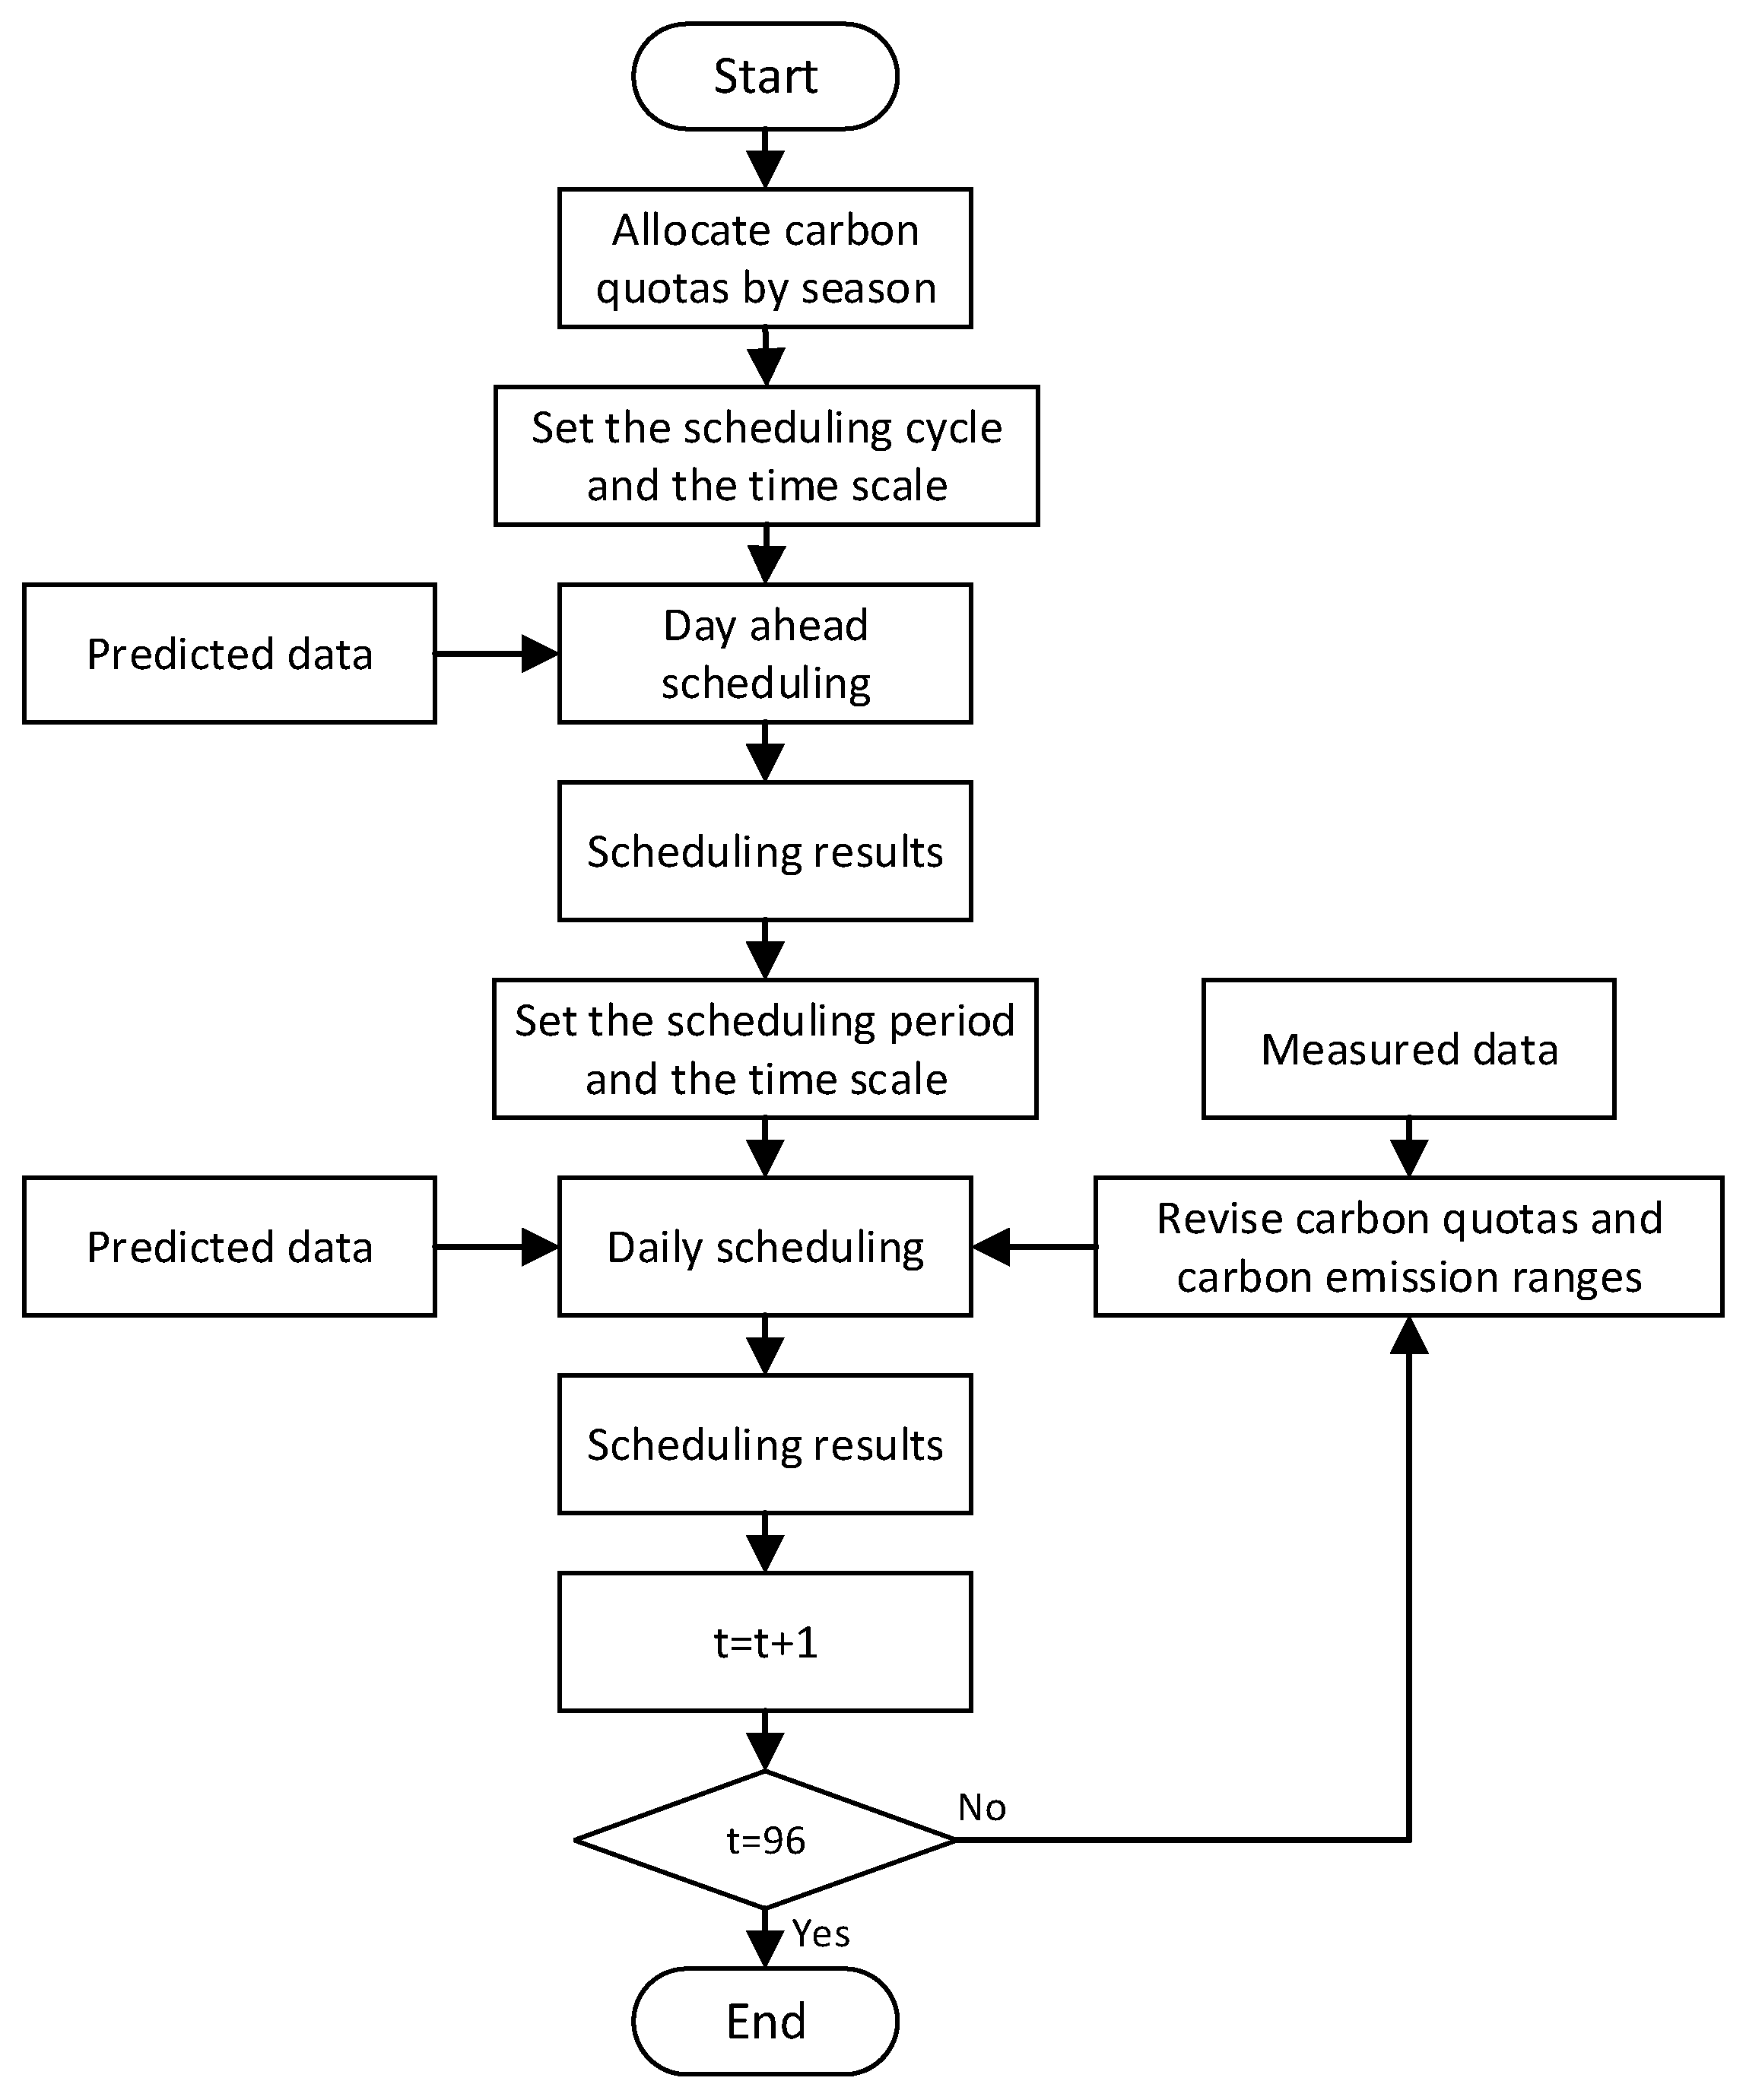
4.4. Multi-Time Scale Scheduling Solution Method

In the day-ahead phase, with a 24 h cycle and a time resolution of 1 h, the system’s operational cost is minimized as the objective function. A Branch and Bound method was employed for global optimization to obtain the day-ahead operational schedule. In the intra-day real-time phase, the cycle is set to 1 h, with a time resolution of 15 min, and intraday optimal dispatch is executedg. Figure 2 presents the multi-timescale rolling scheduling workflow established in this study.

4.5. Prediction Method Based on IVY-CNN-BiGRU-Attention

Wind and load forecasting are critical factors influencing grid scheduling and energy management. The inherent volatility and uncertainty in wind and photovoltaic power generation make the accurate forecasting of wind and solar output essential for the efficient operation and scheduling of power systems. While traditional single deep learning models have demonstrated strong performance in specific scenarios, they often encounter limitations when addressing data complexity and challenges such as insufficient model generalization. To enhance the ability to cope with uncertainties, it is crucial to integrate various optimization methods, capitalizing on their respective strengths [22].
In this study, we propose the IVY-CNN-BiGRU-Attention prediction model, which integrates several advanced machine learning techniques for improved forecasting accuracy. The model combines convolutional neural networks (CNNs), bidirectional gated recurrent units (BiGRUs), and an attention mechanism, each contributing to the model’s ability to handle complex, time-dependent data such as wind, solar, and load demand forecasts. The structure of the IVY-CNN-BiGRU-Attention prediction model developed in this study is illustrated in Figure 3.
CNNs are feedforward neural networks that are particularly effective for processing high-dimensional data [23,24]. The network consists of convolutional layers, pooling layers, and fully connected layers. These convolutional layers utilize shared kernel parameters, reducing dimensionality and minimizing computational time, while simplifying the overall model and enabling deeper network architectures.
BiGRU extends the traditional gated recurrent unit (GRU) by introducing bidirectional propagation, enabling the network to capture both past and future context [25,26]. This enhancement improves the model’s ability to represent complex temporal relationships and enhances prediction accuracy.
Inspired by the human visual attention system, the attention mechanism assigns different weights to various feature inputs, allowing the model to focus on the most relevant information [27,28]. This process significantly enhances the model’s capability to identify and prioritize critical features.
IVY optimizes the performance of each component within the model, ensuring that the overall predictive capability is maximized [29]. Its global optimization capability prevents the model from becoming trapped in local optima, leading to improved forecasting accuracy and stability for both renewable energy generation and load demand.

5. Results and Discussion

This study explores the IES, encompassing wind power, photovoltaic renewable energy, electric boilers, gas boiler thermal–electric coupling devices, electrolytic, hydrogen fuel cell thermal–electric–hydrogen energy coupling devices, hydrogen storage tanks, batteries, and thermal storage systems. In the context of green power trading, the roles of the various entities differ significantly. The primary objective of wind and solar power is to optimize the overall system performance by enhancing joint generation efficiency. Electrolytic utilize surplus renewable energy to produce hydrogen, while hydrogen fuel cells provide a clean source of energy for electricity generation. The energy storage systems, in turn, focus on coordinating with wind and solar generation to ensure that renewable energy meets key constraints—such as power stability—during the trading process, thus safeguarding the stable operation and trading efficiency of the power system. The devices and corresponding parameters within the HIES are detailed in Table 1.

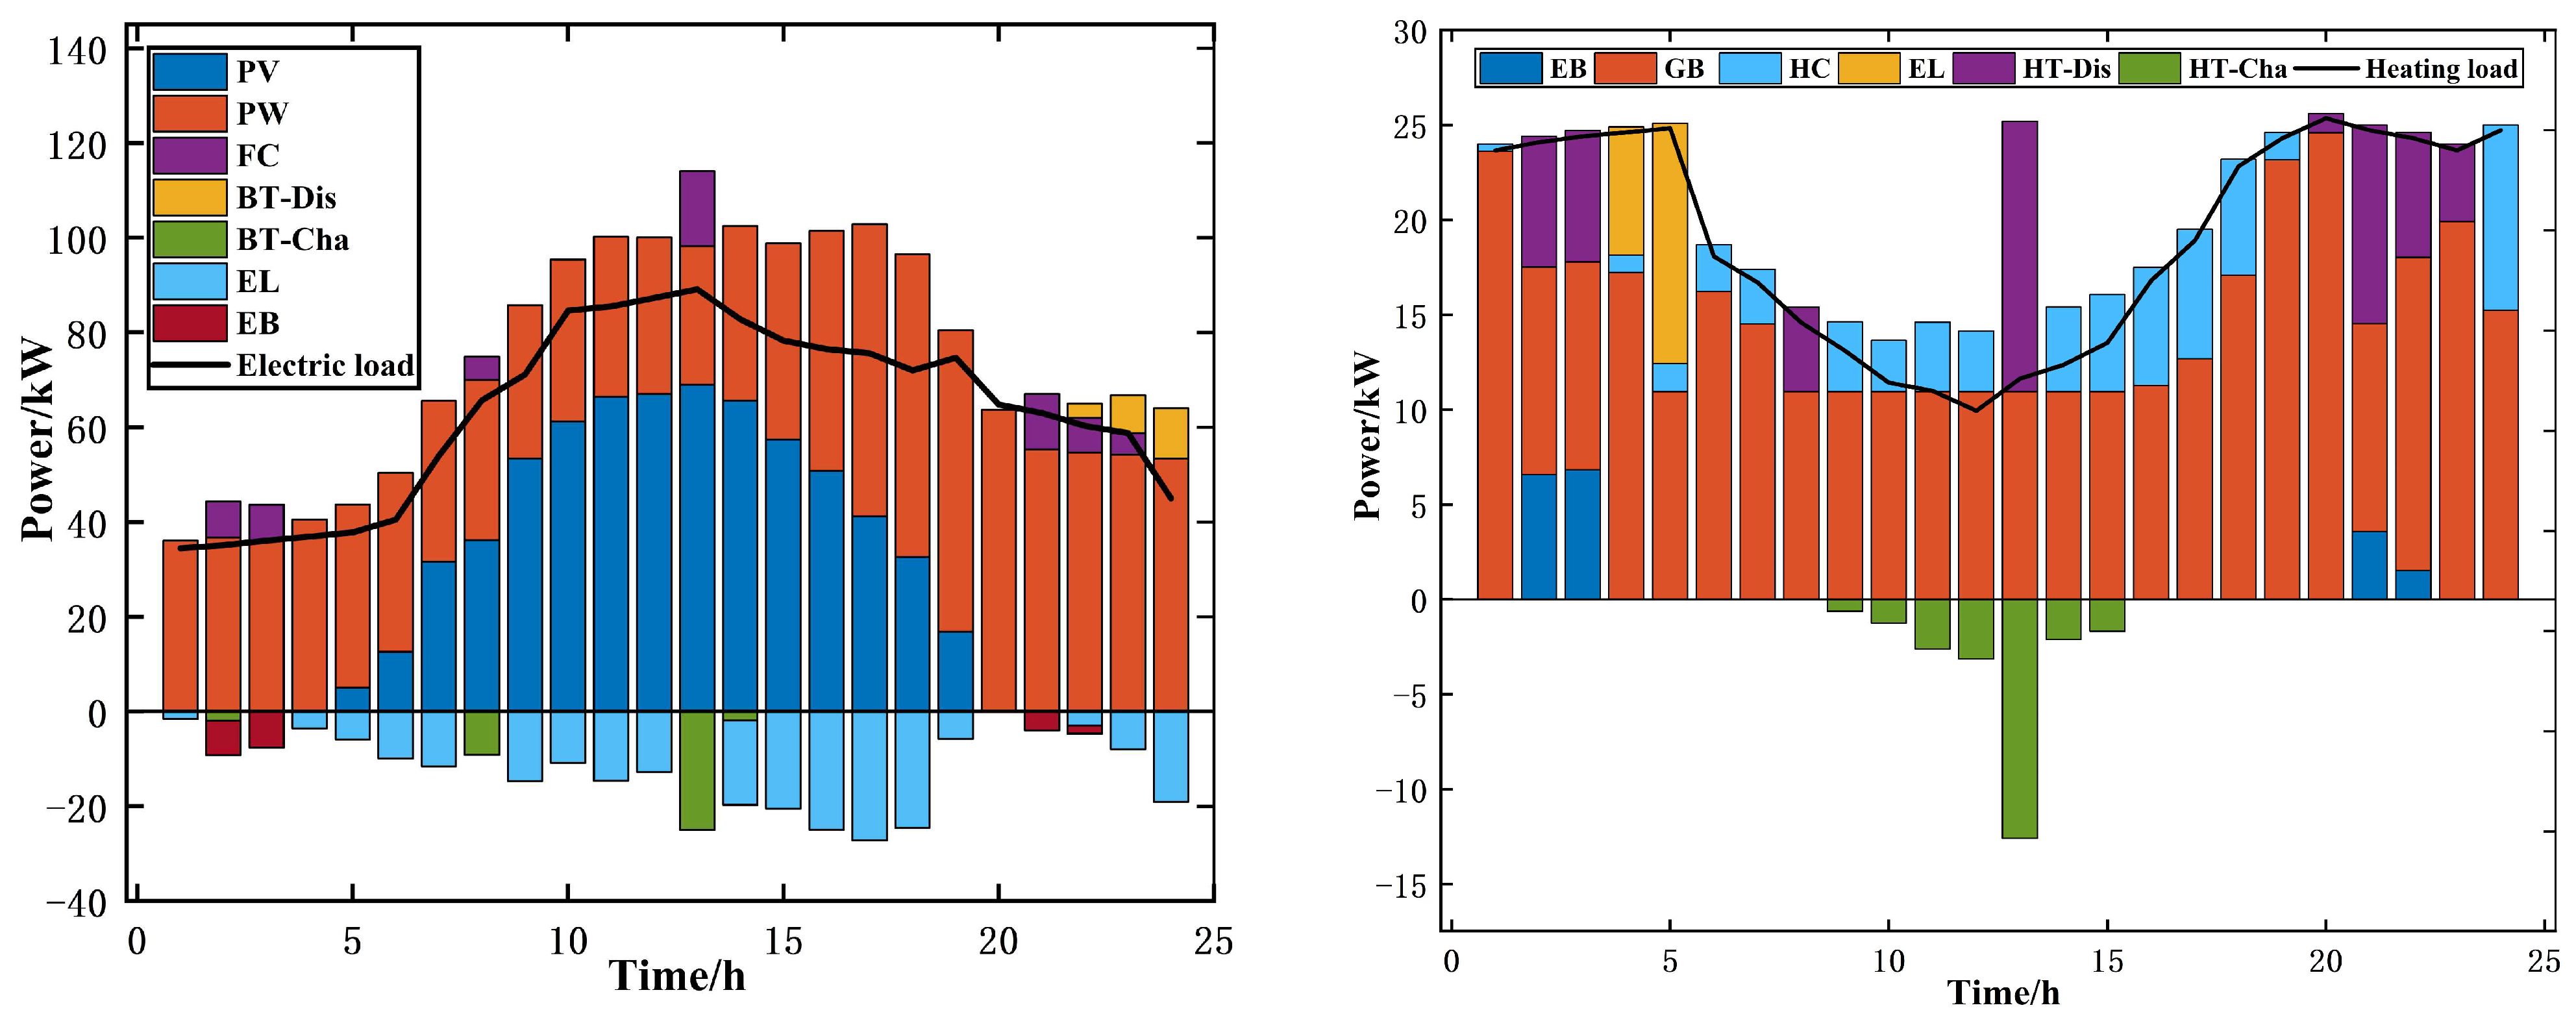
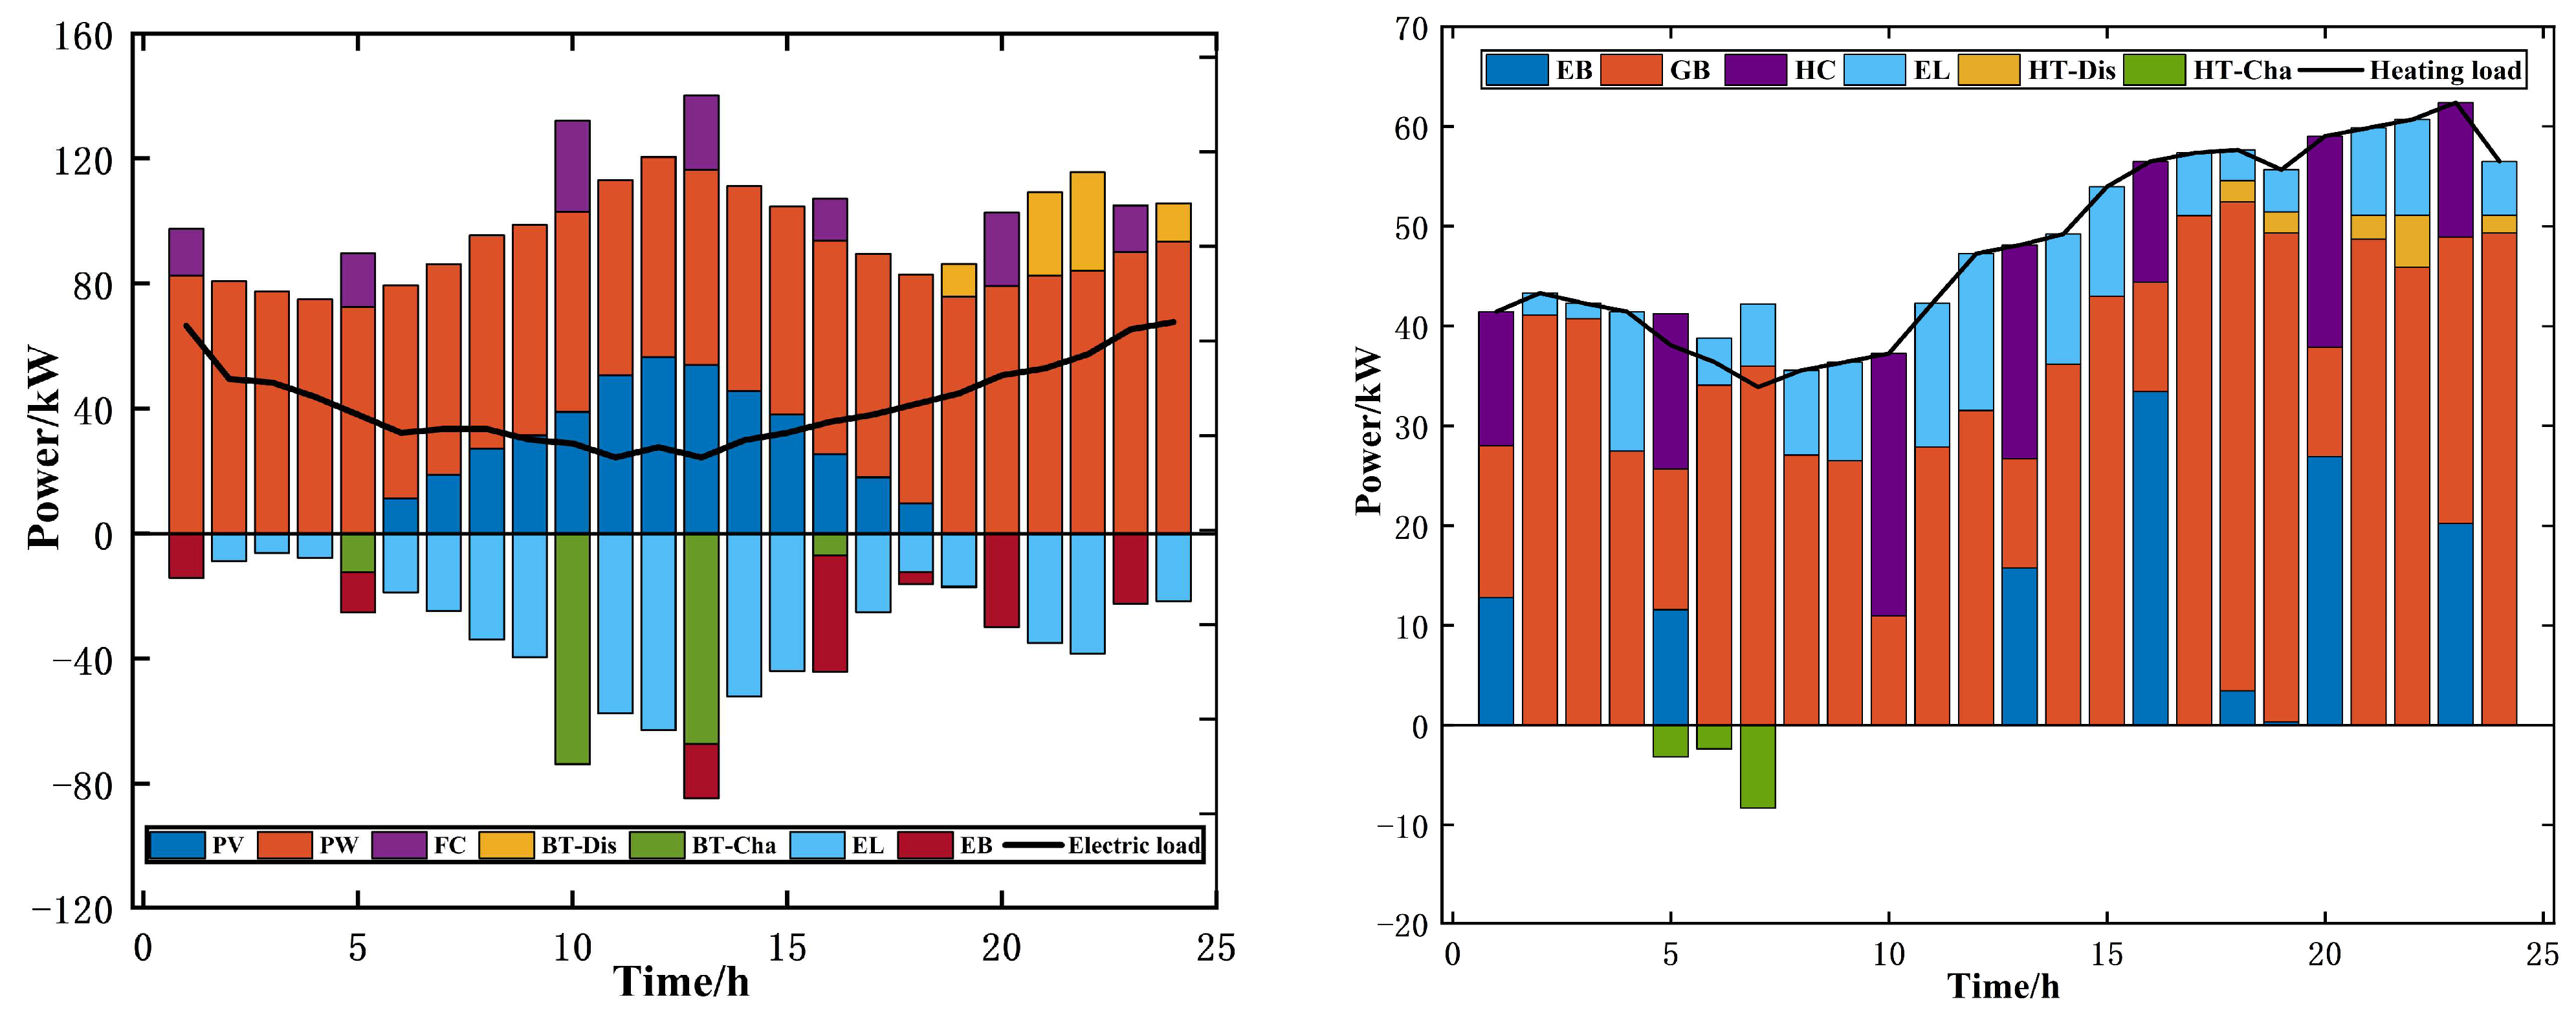
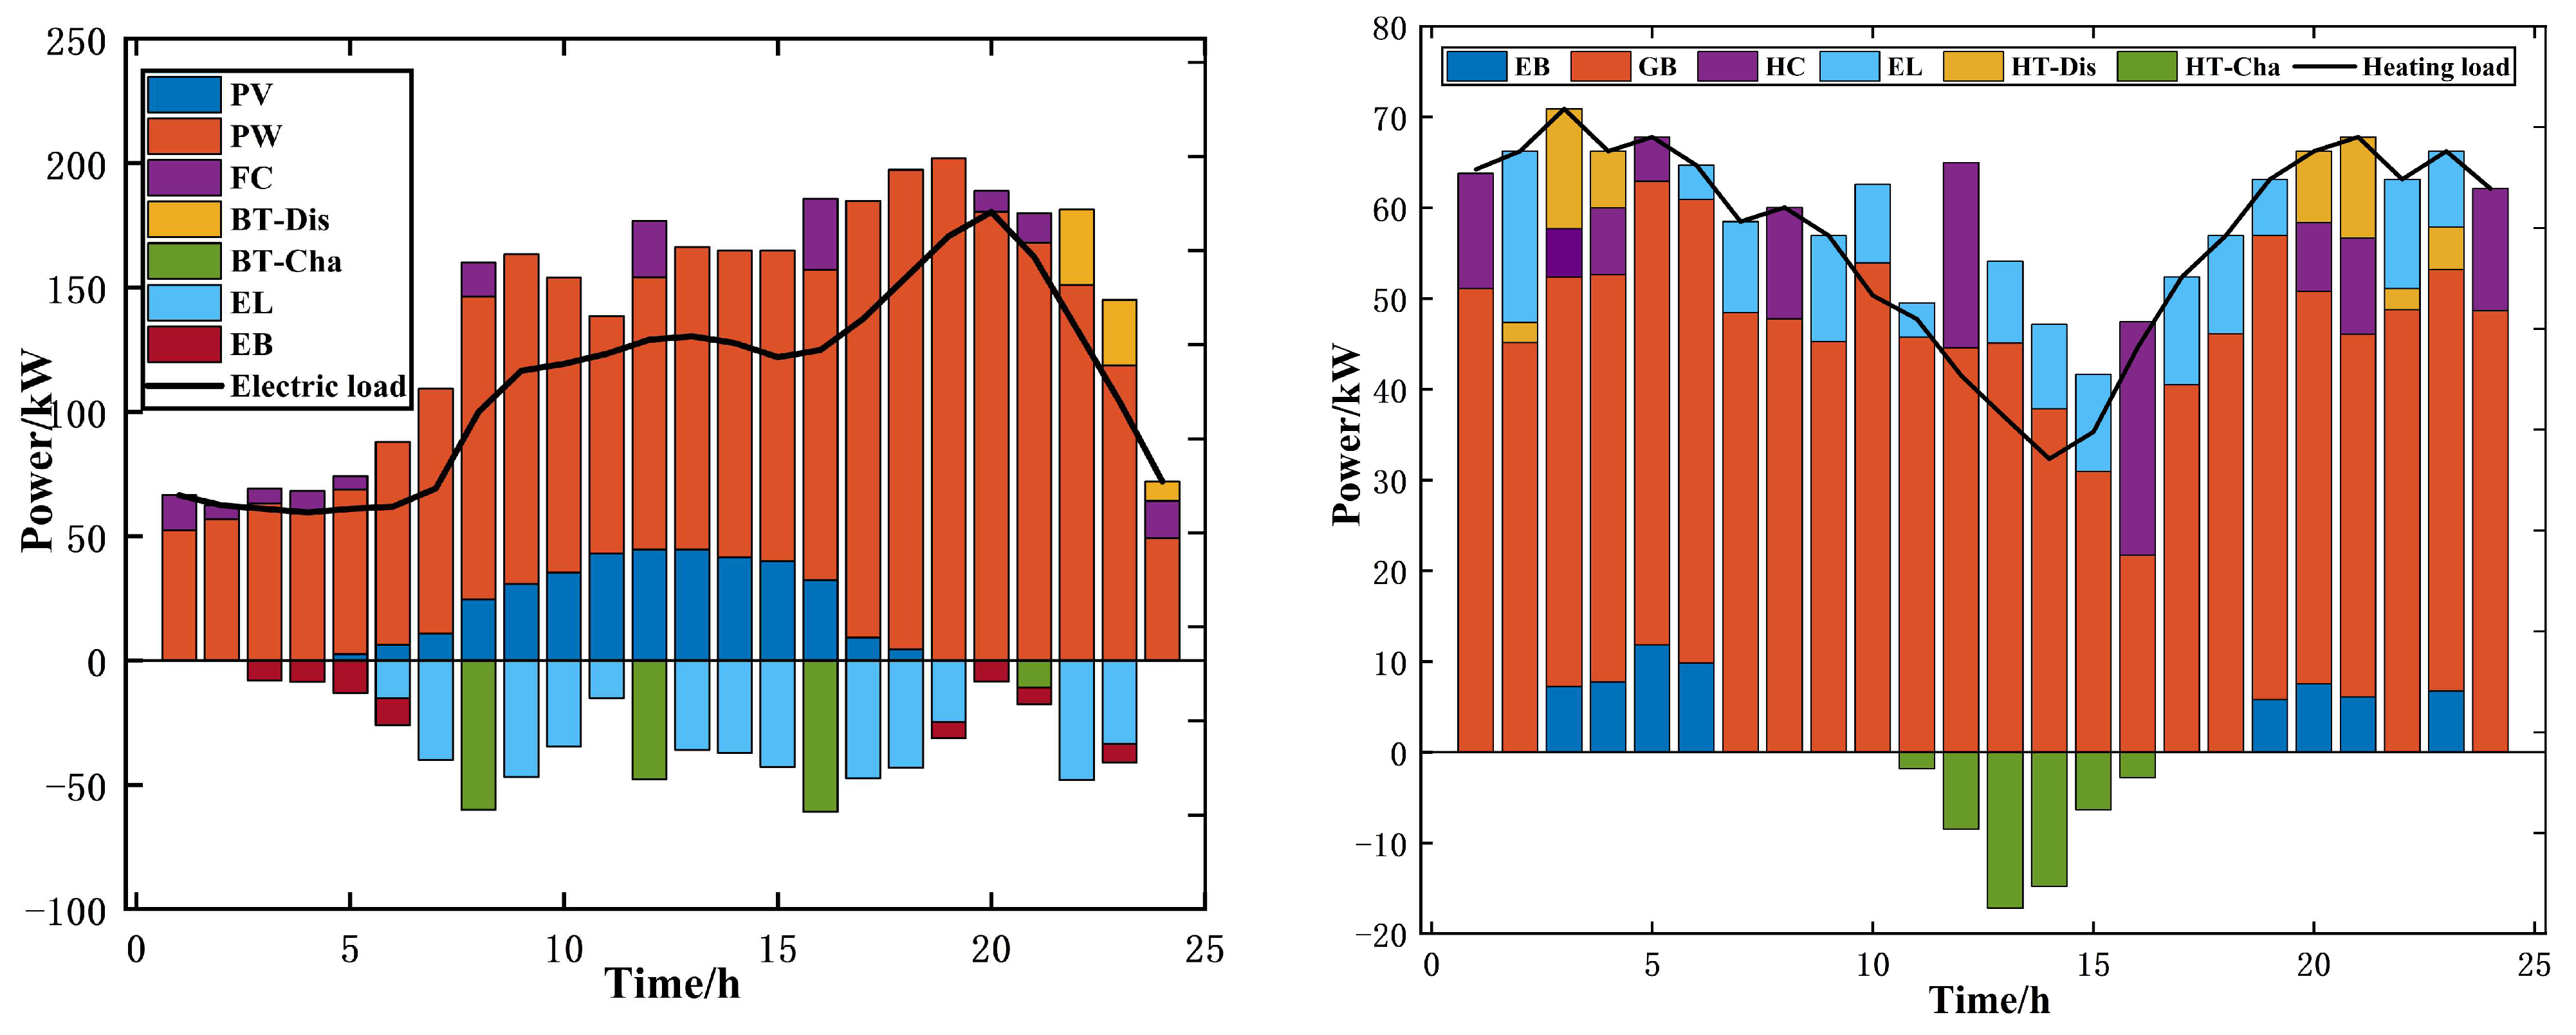
5.1. Model Intra-Day Scheduling Results Analysis

Figure 4, Figure 5 and Figure 6 display the power curves for a typical summer day, a typical transitional season day, and a typical winter day, respectively.
On a typical summer day, the system primarily relies on photovoltaic power generation due to the abundant availability of solar resources, while wind energy remains relatively scarce. Surplus electricity is efficiently utilized by the electrolytic cell, converting it into hydrogen for storage, thus preventing energy waste. Additionally, some excess electricity is stored in batteries, with energy retrieved during low-demand periods or at night, helping to balance supply and demand. The electric boiler uses this surplus energy for heating, reducing dependence on thermal storage tanks and optimizing energy management. Its operation is dynamically adjusted, with heat output calibrated to meet real-time heating demands, ensuring stability and reliability in heat load supply.
On a typical transitional season day, solar energy is moderately available, with wind energy serving as the predominant power source for the system. To manage fluctuations in supply and demand, the system utilizes energy storage to bridge the gap between surplus electricity and load requirements. Excess electricity is stored in batteries or directed to the electrolytic cell for hydrogen production, providing a backup power source. During periods of power scarcity, fuel cells play a critical role in supplying supplementary electricity to meet demand. In low-load periods, the electric boiler uses surplus electricity for heating, reducing reliance on alternative thermal sources. The coordinated operation of the electrolytic cell and fuel cells ensures a stable power supply and delivers additional thermal energy, stabilizing system operation during the transitional season.
On a typical winter day, the system faces a significant shortage of solar energy and primarily relies on wind energy to meet electricity demands. Wind power generation typically peaks during this period, with surplus electricity directed to the electrolytic cell for hydrogen production, serving as a power reserve. Excess electricity is stored in batteries for use during peak demand. As electricity loads peak, stored energy from both batteries and fuel cells is discharged to maintain a stable supply. For thermal energy, the gas boiler is the primary heat source, ensuring high heating demand is met during the winter peak. Simultaneously, the electric boiler utilizes surplus electricity for heating, reducing reliance on the gas boiler. The electrolytic cell continues to convert excess electricity into hydrogen, also providing thermal energy support. To ease the load on the gas boiler, the thermal storage tank discharges heat during high-demand periods, stabilizing system load fluctuations and enhancing thermal energy supply stability.
The scheduling diagrams for each scenario reveal that in the optimized model, the heat load is primarily met by gas and electric boilers, with supplementary support from the hydrogen–thermal coupling component and thermal storage system. Electricity demand is predominantly satisfied by wind and solar power, with batteries providing compensation for shortfall. When wind resources are abundant and electricity demand is low, the electric boiler converts surplus electricity into heat, operating in tandem with the gas boiler to meet thermal requirements. This approach not only reduces heating costs but also facilitates the integration of excess wind power. During periods of high electricity demand and low heat demand, surplus thermal energy is stored in the thermal storage tank for later use during peak heating periods, thereby minimizing waste and optimizing operational efficiency.

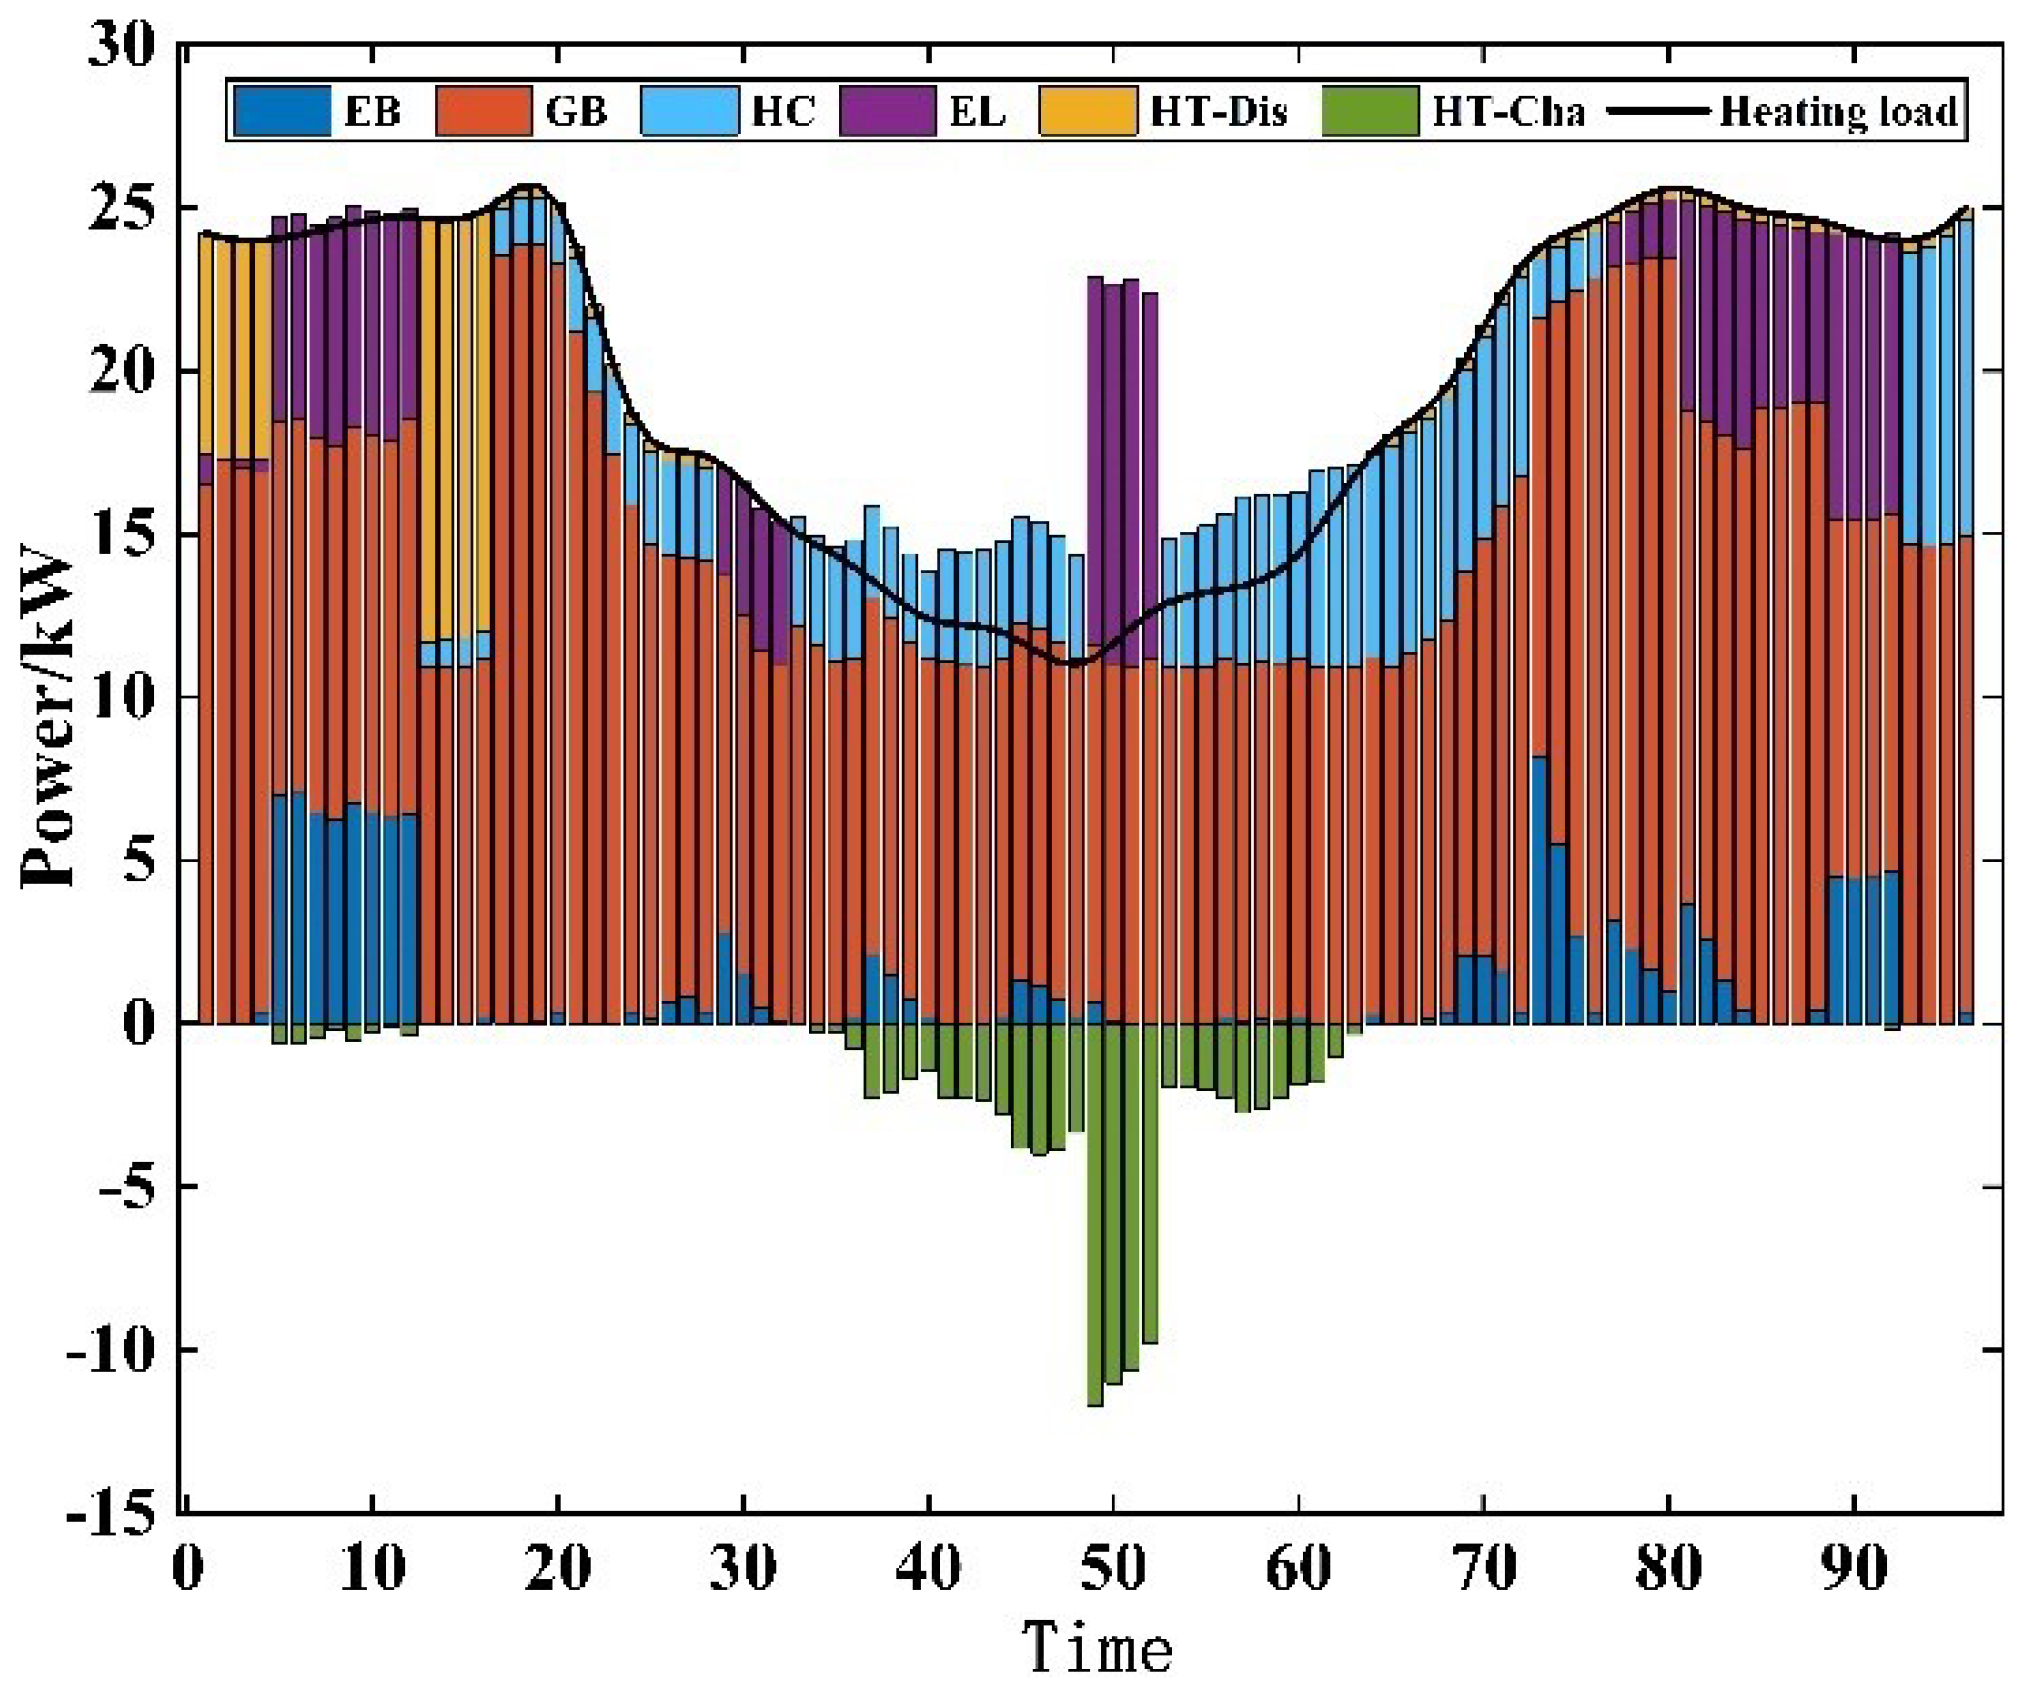
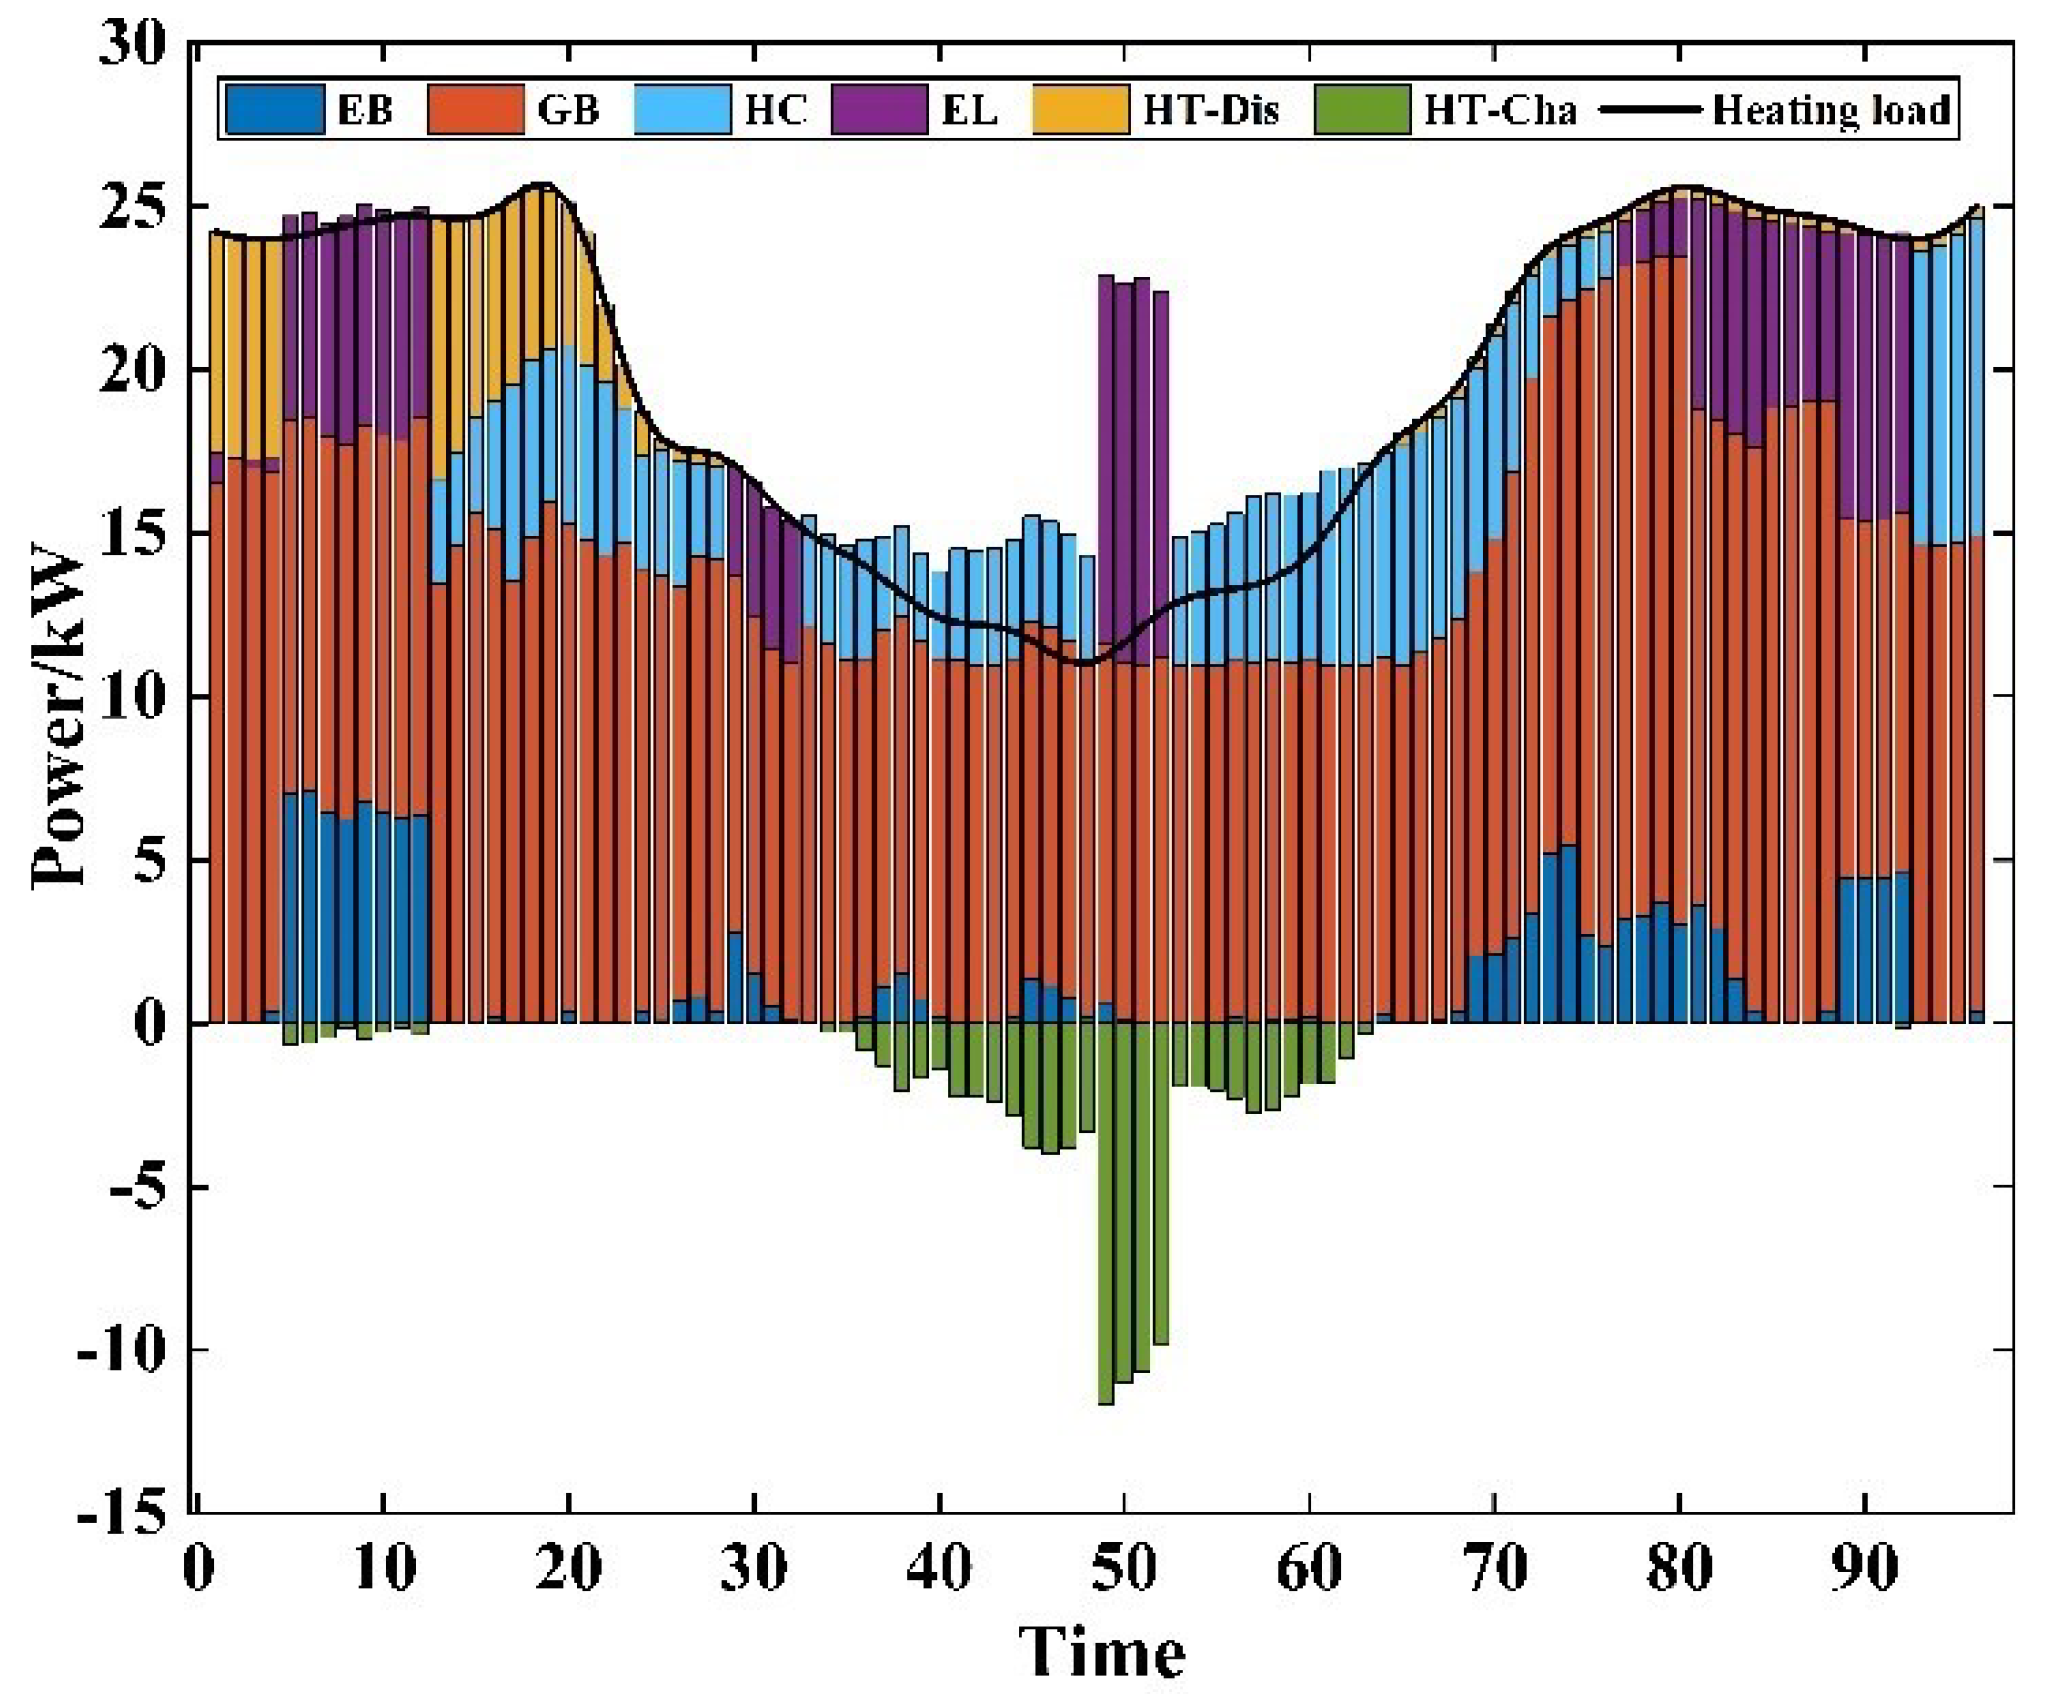
5.2. Feasibility Analysis of the Seasonal Carbon Quota Mechanism

To assess the feasibility of the multi-time-scale carbon trading mechanism proposed in this study, we compare the day-ahead scheduling results for a typical summer day with the intra-day scheduling outcomes under three distinct scenarios. This comparative analysis aims to evaluate the effectiveness of the proposed mechanism in optimizing carbon trading and scheduling decisions.
Scenario 1: Intra-day scheduling uses the carbon price from the day-ahead scheduling results.
Scenario 2: Intra-day scheduling considers the multi-timescale carbon trading mechanism, without considering the carbon quota and carbon emission interval adjustments.
Scenario 3: Scenario 2 with the consideration of carbon quota and carbon emission interval adjustments.
The scheduling costs for each scenario are shown in Table 2.
As shown in the table, in Scenario 1, the carbon price derived from the day-ahead scheduling, coupled with fixed carbon quotas and emission intervals, leads to an increase in energy consumption with higher associated energy costs to reduce carbon emissions during intra-day scheduling. This results in the highest operation and maintenance costs, fuel costs, and penalty costs.
Scenario 2 incorporates a multi-timescale carbon trading mechanism, allowing for flexible allocation of the carbon quota for each time period within intra-day scheduling. Consequently, the system’s operation and maintenance costs, fuel costs, and penalty costs are lower than in Scenario 1. However, this scenario experiences the highest carbon emission costs, as the energy distribution is better optimized to align with the carbon trading mechanism of each timescale.
Scenario 3 builds upon Scenario 2 by adjusting the energy output to align intra-day scheduling results more closely with the day-ahead scheduling outcomes, thereby reducing penalty costs to the lowest levels. The dynamic adjustments to the carbon quota and emission intervals throughout the day further lower carbon emission costs compared to Scenario 2. This scenario, utilizing a tiered carbon trading mechanism across multiple timescales, achieves the lowest total system cost. The proposed mechanism in this study effectively facilitates carbon reduction while maintaining economic efficiency within the system.
The carbon emissions of the system are predominantly attributed to the gas boiler. The thermal power curves for Scenarios 1 to 3 are depicted in Figure 7, Figure 8 and Figure 9.
As illustrated in Figure 1, Figure 2 and Figure 3, during the periods of 4:00–8:00 (time steps 60 to 112) and 18:00–22:00 (time steps 270 to 330), the system in Scenario 2 predominantly utilizes heating from the gas boiler. In contrast, Scenarios 3 and 4 exhibit a lower reliance on the gas boiler for heating during these time intervals. Notably, in Scenario 4, electrolyzers and hydrogen fuel cells generate a greater share of the power, effectively replacing the high-emission gas turbines, with the resulting power curve displaying greater smoothness. These findings highlight the efficacy of a multi-timescale carbon quota mechanism in driving the system to reduce the output of high-carbon-emission units, thereby achieving an optimal balance between system cost and carbon emissions reduction.

6. Conclusions

This paper presents an optimization scheduling model for hydrogen-integrated energy systems, incorporating a multi-timescale carbon trading mechanism. The model aims to achieve a balance between economic efficiency and low carbon emissions. The key findings of this study are:
  • A novel prediction model based on IVY-CNN-BiGRU-Attention is introduced, effectively capturing temporal dependencies and patterns in multivariate time series data. By combining the strengths of convolutional neural networks (CNNs), bidirectional gated recurrent units (BiGRUs), and attention mechanisms, this model significantly enhances the accuracy and reliability of predictions, which improves operational efficiency in the scheduling process for integrated energy systems.
  • The paper also introduces a multi-timescale carbon trading mechanism that dynamically adjusts carbon emission quotas and trading intervals. This approach effectively controls carbon trading costs, mitigating risks associated with the uncertainty in carbon emissions. The dynamic nature of this mechanism offers a resilient and cost-effective solution for managing carbon emissions over time.
  • Additionally, the proposed multi-timescale carbon trading mechanism integrates seamlessly with the flexible regulation capabilities of renewable energy within the system. By optimizing the synergy between carbon trading and renewable energy utilization across different timescales, the framework significantly improves the efficiency of energy resource allocation. This approach not only reduces carbon emissions but also promotes sustainable energy use. It provides a promising pathway for achieving an optimal balance between economic performance and environmental sustainability in modern energy systems.
The optimization scheduling method proposed in this study seeks to enhance the integration of renewable energy, reduce carbon emissions, and bolster energy security. Despite its significant theoretical advantages, the practical application of this model faces challenges, particularly in its integration with existing energy policies and market structures. Consequently, the next phase of research will focus on aligning this model with global energy policy frameworks to accelerate the transition to a low-carbon energy system. Specifically, addressing how to implement this optimized scheduling model across diverse national and regional energy markets—considering varying energy policies, economic conditions, and renewable resource availability—remains a crucial area for further investigation.

Author Contributions

Conceptualization, J.Z.; Methodology, Y.S. and H.F. All authors have read and agreed to the published version of the manuscript.

Funding

This research has obtained the science and technology project of Science and Technology Project of State Grid Corporation of China (52153220000U): Key Technologies and Demonstration Application of Distributed Power Clusters Regulation.

Data Availability Statement

The original contributions presented in this study are included in the article. Further inquiries can be directed to the corresponding author.

Conflicts of Interest

The authors declare that this study received funding from State Grid Corporation of China. The funder was not involved in the study design, collection, analysis, interpretation of data, the writing of this article or the decision to submit it for publication.

References

  1. Kong, F.; Ren, H. Advances in Green Energy, Environment and Carbon Neutralization. Energies 2025, 18, 1016. [Google Scholar] [CrossRef]
  2. Li, J.; Zhu, M.; Lu, Y.; Huang, Y.; Wu, T. A Review of Optimal Scheduling for Integrated Energy Systems. Power Grid Technol. 2021, 45, 2256–2272. [Google Scholar]
  3. Zhang, N.; Wang, H.; Song, K.; Cheng, M.; Zhang, M.; Li, P. Research on dynamic optimal control of integrated energy system based on multi energy demand response. Electr. Meas. Instrum. 2023, 60, 16–24. [Google Scholar]
  4. Yang, M.; Liu, Y. Research on multi-energy collaborative operation optimization of integrated energy system considering carbon trading and demand response. Energy 2023, 283, 129117. [Google Scholar] [CrossRef]
  5. Yue, M.; Lambert, H.; Pahon, E.; Roche, R.; Jemei, S.; Hissel, D. Hydrogen energy systems: A critical review of technologies, applications, trends and challenges. Renew. Sustain. Energy Rev. 2021, 146, 111180. [Google Scholar] [CrossRef]
  6. Kong, L.; Cai, G.; Li, L.; Ji, R.L. Online Energy Regulation Strategy and Experimental Platform Development for Wind-Solar-Hydrogen Integrated Energy Systems. Trans. China Electrotech. Soc. 2018, 33, 3371–3384. [Google Scholar]
  7. Farahani, S.S.; Bleeker, C.; van Wijk, A.; Lukszo, Z. Hydrogen-based integrated energy and mobility system for a real-life office environ-ment. Appl. Energy 2020, 264, 114695. [Google Scholar] [CrossRef]
  8. Cai, Q.; Xiao, Y.; Zhu, Y. Day-Ahead Economic Coordination Scheduling Model for Electrothermal Microgrids Considering Power-to-Hydrogen and Fuel Cells. Electr. Power Autom. Equip. 2021, 41, 107–112. [Google Scholar]
  9. Eslamipoor, R. A two-stage stochastic planning model for locating product collection centers in green logistics networks. Clean. Logist. Supply Chain. 2022, 6, 100091. [Google Scholar] [CrossRef]
  10. Yu, X. Research on the Optimal Configuration and Operation of an Integrated Energy System with Hydrogen Storage and Heat Storage in Industrial Parks. Master’s Thesis, North China Electric Power University, Beijing, China, 2020. [Google Scholar]
  11. Ni, L.; Wang, Y.; Xue, H.; Yu, A. Stochastic-Robust Hybrid Planning for Electro-Hydrogen Integrated Energy Storage Stations Considering Multi-Time-Scale Uncertainties. Energy Storage Sci. Technol. 2023, 12, 846–856. [Google Scholar]
  12. Du, Y.; Tan, Z. Multi-Time-Scale Coordinated Operation Optimization of Electro-Hydrogen Energy Systems Based on Nash Bargaining. Power Syst. Technol. 2024, 48, 2745–2753. [Google Scholar]
  13. Chicco, G.; Mancarella, P. Assessment of the green-house gas emissions from cogeneration and trigeneration systems. Part I: Models and indicators. Energy 2008, 33, 410–417. [Google Scholar] [CrossRef]
  14. Mancarella, P.; Chicco, G. Assessment of the greenhouse gas emissions from cogeneration and trigeneration systems. Part II: Analysis techniques and application cases. Energy 2008, 33, 418–430. [Google Scholar] [CrossRef]
  15. Pan, C.; Hou, X.; Jin, T.; Wang, B.; Wang, G.; Gu, Y. Low carbon research of integrated energy system considering the uncertainty of carbon trading and renewable energy. Electr. Meas. Instrum. 2024, 61, 8–16. [Google Scholar]
  16. Kothe, A.-K.; Kuptel, A.; Seidl, R. Simulating Personal Carbon Trading (PCT) with an Agent-Based Model (ABM): Investigating Adaptive Reduction Rates and Path Dependence. Energies 2021, 14, 7497. [Google Scholar] [CrossRef]
  17. Zhao, B.; Liu, G.; Han, D. Multi-Time-Scale Low-Carbon Optimal Scheduling of Integrated Energy Systems Considering Hydrogen Energy Coupling and Tiered Carbon Trading. J. Electr. Power Sci. Technol. 2023, 38, 35–46. [Google Scholar]
  18. Li, T.; Hu, Z.; Chen, Z.; Liu, S. Multi-Time-Scale Low-Carbon Operation Optimization Strategy for Integrated Energy Systems Considering Electric-Gas-Thermal-Hydrogen Demand Response. Electr. Power Autom. Equip. 2023, 43, 16–24. [Google Scholar]
  19. Liang, J.; Zhang, G.; Li, F.; Xie, C.; Wang, T. Low-Carbon Optimal Scheduling of Integrated Energy Systems Considering Hydrogen Energy Storage, Ammonia Production, and Carbon Capture. Electr. Power Autom. Equip. 2024, 44, 16–23. [Google Scholar]
  20. Laimon, M.; Yusaf, T. Towards energy freedom: Exploring sustainable solutions for energy independence and self-sufficiency using integrated renewable energy-driven hydrogen system. Renew. Energy 2024, 222, 119948. [Google Scholar] [CrossRef]
  21. Zhang, L.; Wu, H.; He, Y.; Xu, B.; Zhang, M.; Ding, M. Optimization Scheduling Method for Hydrogen Energy Integrated Energy Systems Based on Deep Reinforcement Learning. Autom. Electr. Power Syst. 2024, 48, 132–141. [Google Scholar]
  22. Eslamipoor, R. An optimization model for green supply chain by regarding emission tax rate in incongruous vehicles. Model. Earth Syst. Environ. 2023, 9, 227–238. [Google Scholar] [CrossRef]
  23. Chen, H.; Wu, Q.; Han, C. Carbon Price Point and Interval-Valued Prediction Based on a Novel Hybrid Model. Energies 2025, 18, 1054. [Google Scholar] [CrossRef]
  24. Jeong, S.; Kim, B.; Cha, S.; Seo, K.; Chang, H.; Lee, J.; Kim, Y.; Noh, J. Real-Time CNN Training and Compression for Neural-Enhanced Adaptive Live Streaming. IEEE Trans. Pattern Anal. Mach. Intell. 2024, 46, 6023–6039. [Google Scholar] [CrossRef] [PubMed]
  25. Xu, Z.; Li, Y.F.; Huang, H.Z.; Deng, Z.; Huang, Z. A novel method based on CNN-BiGRU and AM model for bearing fault diagnosis. J. Mech. Sci. Technol. 2024, 38, 3361–3369. [Google Scholar] [CrossRef]
  26. Ren, J.J.; Wei, H.; Zou, Z.L.; Hou, T.T.; Yuan, Y.L.; Shen, J.Q.; Wang, X.M. Ultra-short-term power load forecasting based on CNN-BiLSTM-Attention. Power Syst. Prot. Control. 2022, 50, 108–116. [Google Scholar]
  27. Li, G.; Lin, C.; Li, Y. Probabilistic Forecasting of Provincial Regional Wind Power Considering Spatio-Temporal Features. Energies 2025, 18, 652. [Google Scholar] [CrossRef]
  28. Du, M.; Zhang, Z.; Ji, C. Prediction for Coastal Wind Speed Based on Improved Variational Mode Decomposition and Recurrent Neural Network. Energies 2025, 18, 542. [Google Scholar] [CrossRef]
  29. Ghasemi, M.; Zare, M.; Trojovský, P.; Rao, R.V.; Trojovská, E.; Kandasamy, V. Optimization based on the smart behavior of plants with its engineering applications: Ivy algorithm. Knowl. Based Syst. 2024, 295, 111850. [Google Scholar] [CrossRef]
Figure 1. IES structural diagram.
Energies 18 01612 g001
Figure 2. Multi-time scale scheduling solution flowchart.
Energies 18 01612 g002
Figure 3. IVY-CNN-BiGRU-Attention prediction model architecture diagram.
Energies 18 01612 g003
Figure 4. Power curve for a typical summer day.
Energies 18 01612 g004
Figure 5. Power curve for a typical transitional season day.
Energies 18 01612 g005
Figure 6. Power curve for a typical winter day.
Energies 18 01612 g006
Figure 7. The thermal power curve for Scenario 1.
Energies 18 01612 g007
Figure 8. The thermal power curve for Scenario 2.
Energies 18 01612 g008
Figure 9. The thermal power curve for Scenario 3.
Energies 18 01612 g009
Table 1. Equipment parameters.
Device TypeDevice ParameterValue
Gas BoilerMaximum Power55 kW
Minimum Power10 kW
Upward Ramp Power5 kW
Downward Ramp Power10 kW
Electric BoilerMaximum Power55 kW
Minimum Power0
Upward Ramp Power5 kW
Downward Ramp Power10 kW
Fuel CellConversion Efficiency0.9
Maximum Output Power300 kW·h
Maximum Capacity300 kW·h
Energy Storage BatteryCharge/Discharge Efficiency0.9/0.9
Maximum Output Power300 kW
Maximum Capacity300 kW·h
Thermal Storage TankCharge/Discharge Efficiency0.9/0.9
Maximum Output Power250 kW
Maximum Capacity450 kW·h
Thermal Storage TankHydrogen Production Efficiency0.25
Maximum Output Power150 kW
Installed Capacity100 kW·h
Table 2. Cost of each scenario.
ScenarioOperation and Maintenance CostFuel CostCarbon Emission CostPenalty CostTotal Cost
Scenario 1223.56169.9839.2817.96450.78
Scenario 2214.78159.3443.7911.28429.19
Scenario 3210.47156.2941.408.87413.03
Disclaimer/Publisher’s Note: The statements, opinions and data contained in all publications are solely those of the individual author(s) and contributor(s) and not of MDPI and/or the editor(s). MDPI and/or the editor(s) disclaim responsibility for any injury to people or property resulting from any ideas, methods, instructions or products referred to in the content.

