Article

Mitigating Skin and Proximity Effect in High-Voltage Underground Segmented Cables Through Individually Insulating Conductor Strings

Engineering Department, City St George’s, University of London, London EC1V 0HB, UK
*
Author to whom correspondence should be addressed.
Energies 2025, 18(7), 1605; https://doi.org/10.3390/en18071605
Submission received: 5 March 2025 / Revised: 17 March 2025 / Accepted: 19 March 2025 / Published: 24 March 2025
(This article belongs to the Special Issue Applications of Electromagnetism in Energy Efficiency)

Abstract

:
High-voltage underground cables inevitably experience frequency-dependent electromagnetic (EM) losses, driven primarily by skin and proximity effects. These losses become more severe at higher harmonic frequencies, which are increasingly common in modern power networks. In traditional multi-segment cable designs, uninsulated conductor bundles enable large circular eddy current loops that elevate AC resistance and exacerbate both skin and proximity phenomena. This paper investigates the impact of introducing a thin insulating layer between individual conductor strings in a five-segment high-voltage cable model. Two insulation thicknesses, 75 µm and 100 µm, are examined via two-dimensional finite element (FE) harmonic analysis at 0, 50, 150, and 250 Hz. By confining eddy currents to smaller loops within each conductor, the insulating layer achieves up to a 60% reduction in AC losses compared to the baseline uninsulated model, lowering the ratio of AC to DC resistance from about 3.66 down to 1.47–1.49 at 250 Hz. The findings confirm that adding even a modest inter-strand insulation is highly effective at mitigating skin and proximity effects, with only marginal additional benefit from thicker insulation. Such designs offer improved energy efficiency and reduced thermal stress in underground cables, making them attractive for modern power distribution systems where harmonic content is pervasive.

1. Introduction

High-voltage (HV) underground cables are increasingly employed in modern power transmission networks for aesthetic, environmental, and safety reasons [1,2,3,4]. Nonetheless, these cables suffer from significant electromagnetic (EM) losses that grow with frequency [5,6,7], particularly due to the skin effect—pushing current to the outer regions of the conductor—and the proximity effect, whereby neighboring conductors’ magnetic fields distort current distribution [8,9,10]. Both effects increase the conductor’s effective AC resistance R AC relative to its DC resistance R DC , leading to greater joule heating and diminished efficiency.
In contemporary power networks, the proliferation of harmonics (e.g., 150 Hz and 250 Hz, corresponding to the third and fifth harmonics) further exacerbates these EM losses, as each harmonic component can induce additional skin and proximity effects [11,12]. Various sources, including power electronic converters, renewable energy interfaces, and industrial loads, contribute significantly to this harmonic-rich environment [13,14]. Although multi-strand or segmented conductors can mitigate these losses to an extent, unimpeded electrical contact among the strands frequently allows large eddy-current loops, drastically raising R AC [15,16,17].
In present-day networks, the proliferation of non-sinusoidal or harmonic currents exacerbates these EM losses. Power electronic converters, renewable energy interfaces, and industrial loads may inject substantial harmonic components (e.g., 150 Hz or 250 Hz), compelling cables to perform well beyond the fundamental frequency of 50 Hz [2,13,14]. Although multi-strand or segmented conductors can mitigate skin and proximity effects to a degree, unimpeded electrical contact between strands often permits large eddy-current loops. This contact raises AC resistance significantly and accelerates thermal aging [3,4].
One promising solution for further reducing these losses is a thin insulation layer between individual strands or sub-conductors [10,18]. By insulating each strand, the transverse current paths responsible for large eddy-current loops are effectively obstructed. This principle is well-established in the “litz-wire” concept for smaller-scale conductors [19], but it has not been widely applied in large HV underground cables, likely due to manufacturing complexity and cost [16,20].
In this study, we consider a five-segment HV cable with a total copper cross-section of 2711 mm 2 . Multi-segment conductor designs in this size range are commonly employed in modern transmission systems to handle elevated current ratings while mitigating AC losses and facilitating cable bending constraints [1,2,3,4]. Recent work underscores the influence of conductor geometry and air gaps on cable performance, particularly for underground installations [21]. Taken together, these findings underscore the suitability of a five-segment cable design with a 2711 mm 2 cross-section as an effective platform for investigating how introducing thin insulation layers around individual conductor strands can yield further improvements in mitigating skin and proximity effects.

Contributions and Novelty

Although the idea of segmenting conductors is not new [2,3], the inclusion of a dedicated, thin insulating layer around each conductor string within each segment has not been widely explored in HV cable designs. This paper investigates precisely that scenario in a five-segment cable model, where we insulate each conductor string (within the same segment) to disrupt inter-strand eddy currents. We show that even a modest insulation thickness of 75 µm or 100 µm can significantly reduce the ratio R AC / R DC at frequencies up to 250 Hz. Compared to the uninsulated five-segment baseline, the insulated design suppresses large-scale eddy currents and yields a more uniform current distribution, reducing AC losses and potentially improving the cable’s operational efficiency.
While other techniques to mitigate AC losses exist, such as transposing individual segments or applying special interstitial semiconducting layers [10,15,22], these approaches can be limited by mechanical constraints or partial strand contact. By contrast, the method presented here (fully insulating each conductor string) offers a direct way to eliminate cross-strand eddy loops. Although the trade-offs include manufacturing complexity and potential cost increases, our finite element simulations show that the electromagnetic benefits are substantial.
In Section 2, we specify the five-segment cable geometry, the modeling of insulation layers, and the boundary conditions employed for the two-dimensional (2D) FE simulations. Section 3 presents the key results, including current density distributions, magnetic flux lines, and AC loss calculations. Section 4 discusses how insulation thickness affects performance and highlights the diminishing returns beyond a certain thickness. Section 5 concludes the paper and proposes future research directions, such as 3D analyses and mechanical integration.

2. Models and Methods

This section details the two-dimensional FE models of the 5-segment high-voltage cable under investigation. Emphasis is placed on modeling geometry, material properties, boundary conditions, meshing strategy, and solver configurations in ANSYS Mechanical APDL 2023 R1 (developed by Ansys, Inc., Canonsburg, PA, USA). The primary goal is to compare the baseline (no insulation) configuration with the same geometry but introducing a 75 µm or 100 µm insulating layer between each individual conductor string in a segment.

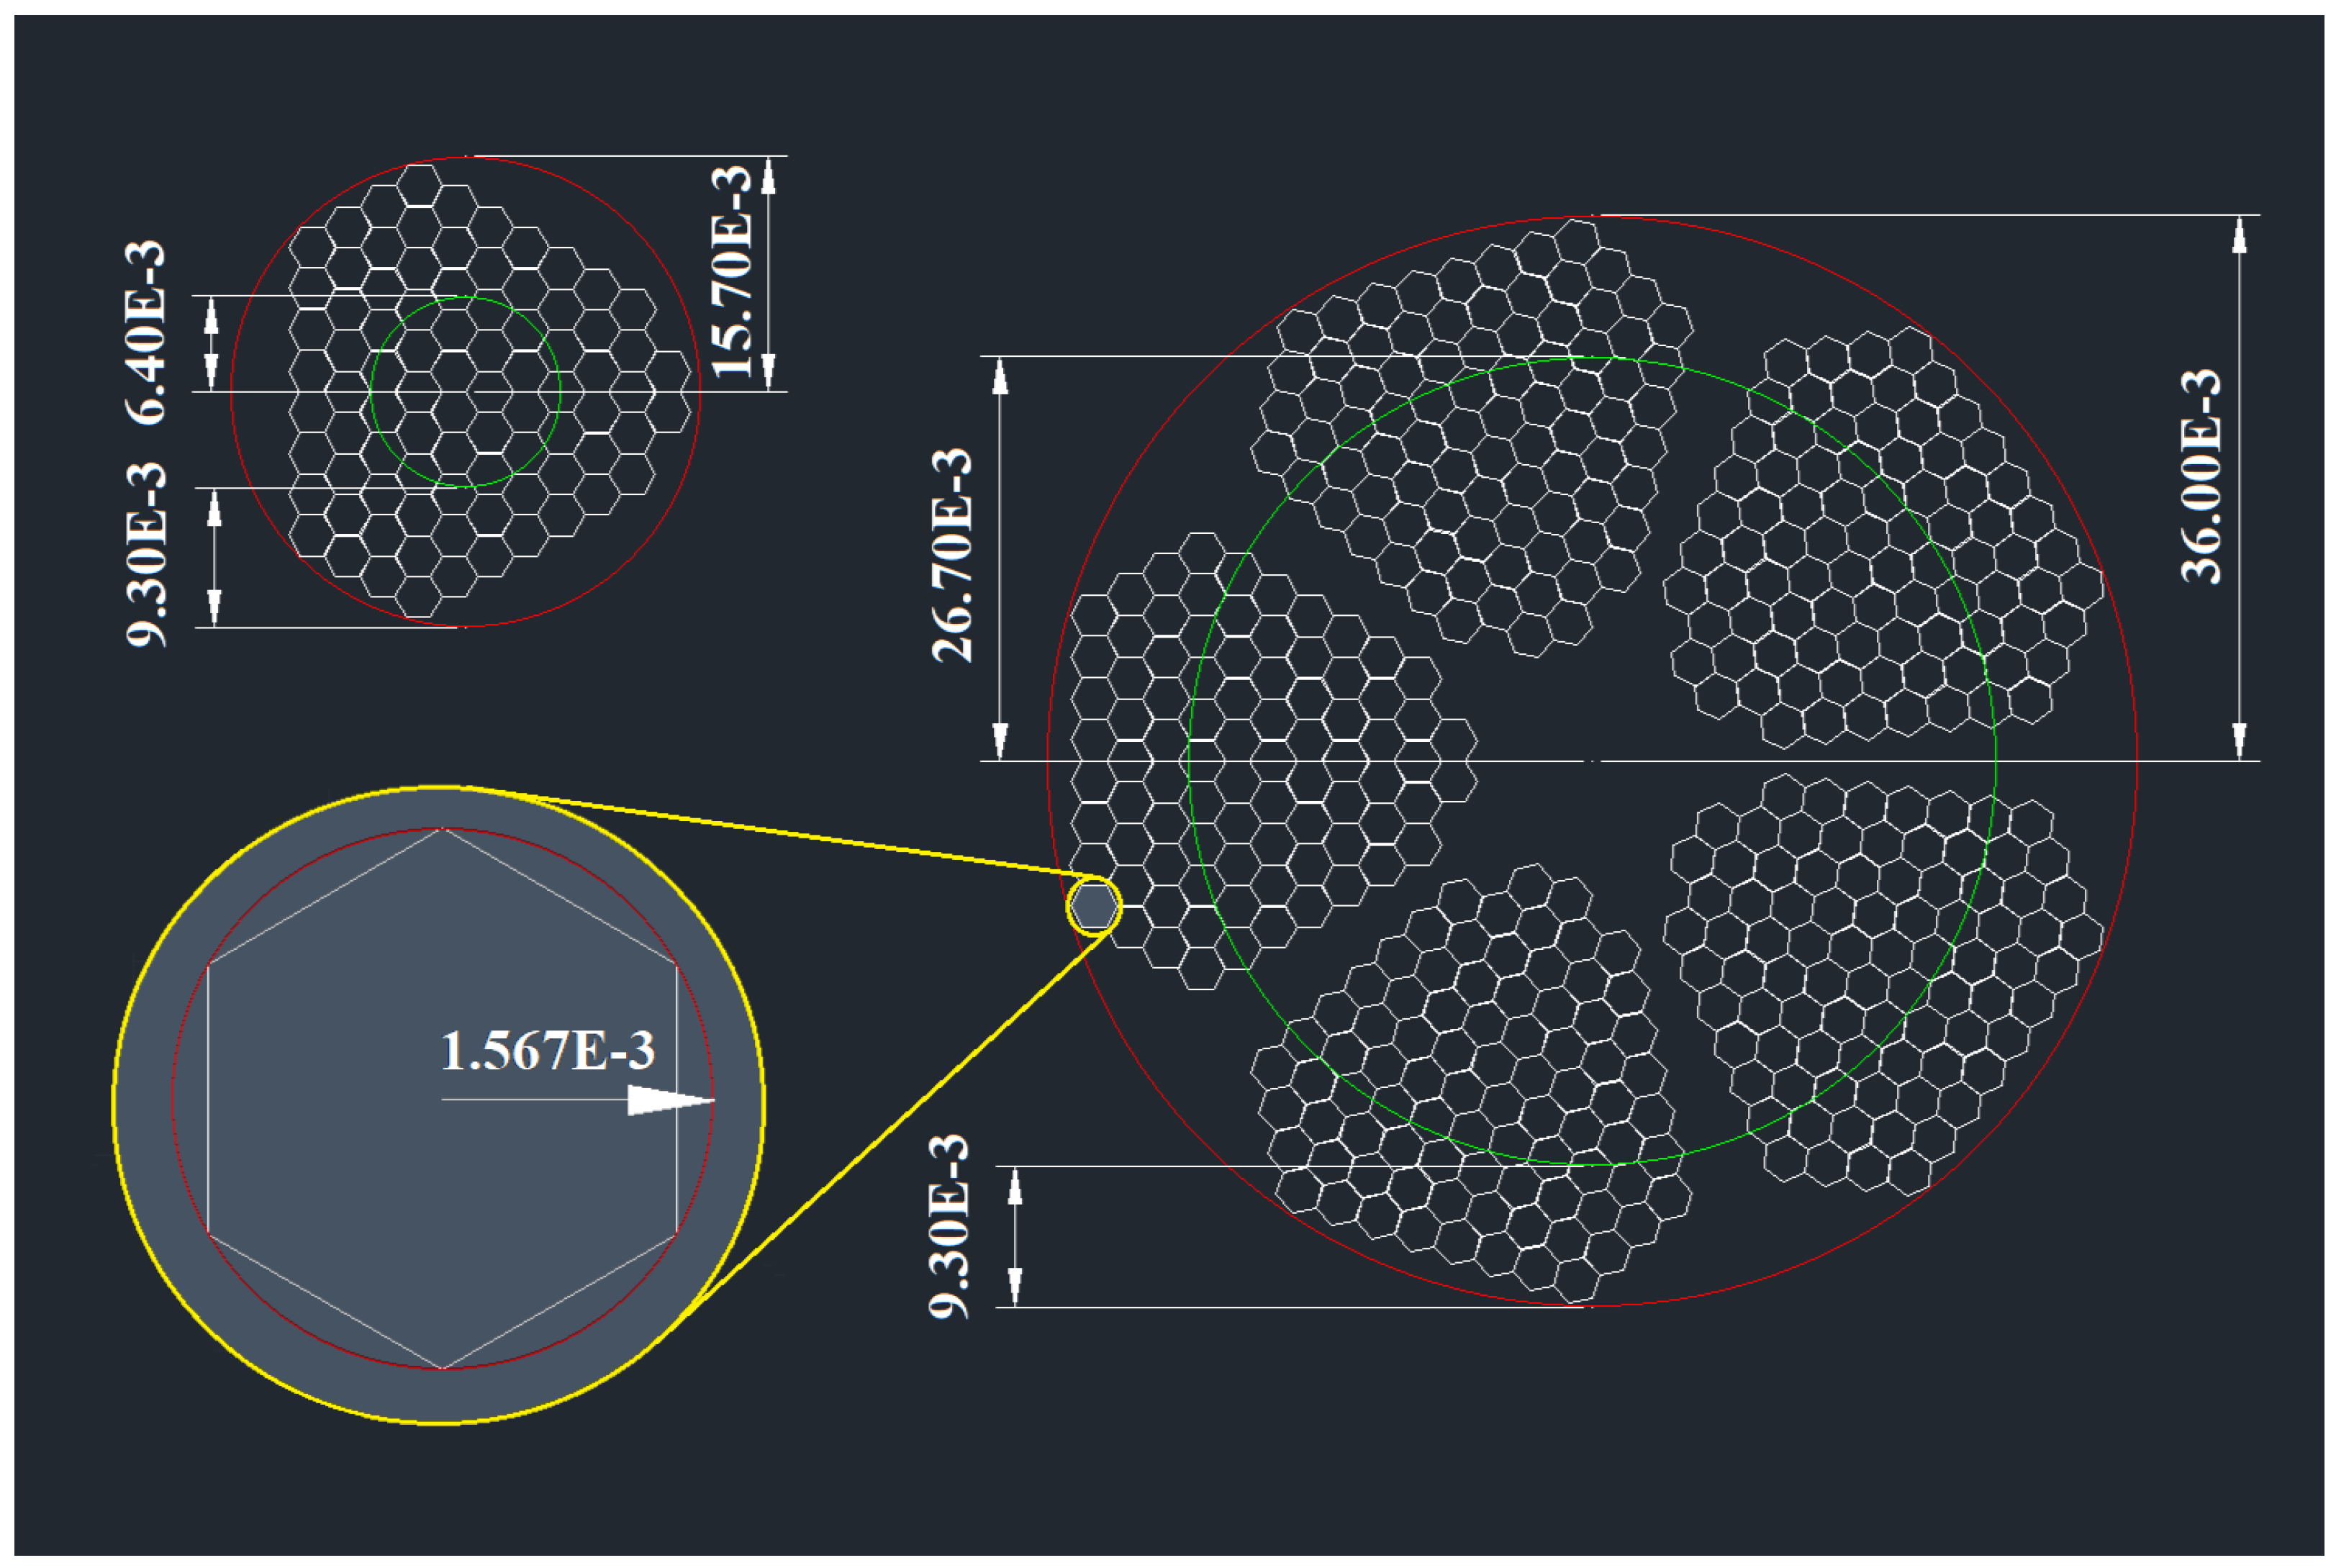
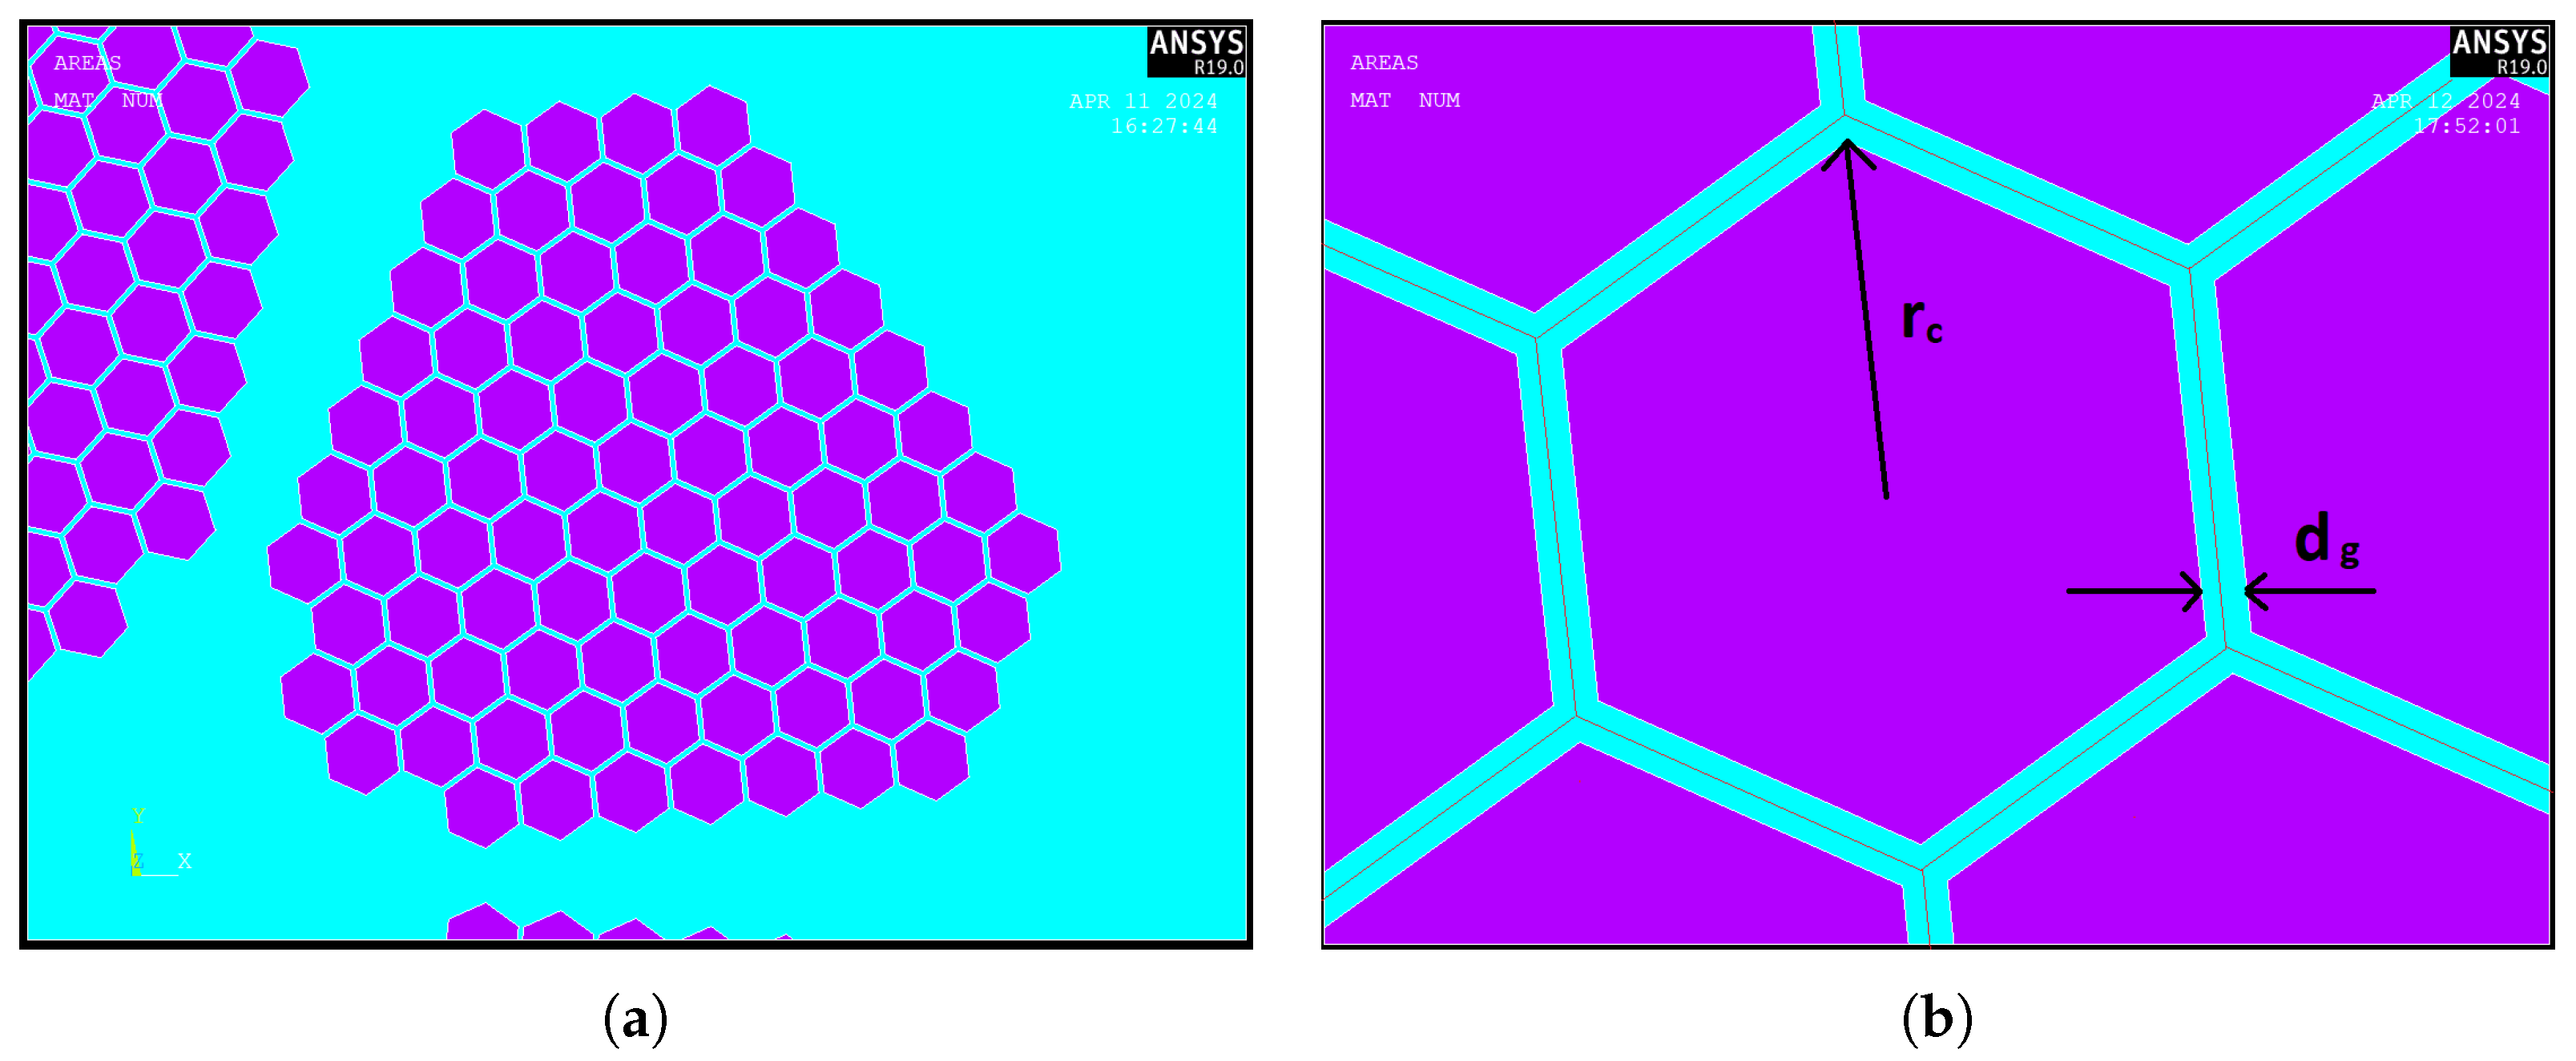
2.1. Five-Segment Cable Geometry

Figure 1 conceptually illustrates the cross-sectional layout of the 5-segment cable base previously conducted in [23,24]. Each segment comprises a compacted bundle of hexagonally shaped copper conductor strings. In the uninsulated case, these hexagons are in direct electrical contact at their boundaries. By contrast, in the insulated configurations, an air-like insulating material is placed between the hexagons, forming a small gap ( d g ). Each segment is electrically isolated from other segments.
The total cross-sectional area of the copper material in each model remains at 2711 mm 2 . Each of the five segments contains 85 hexagonal conductor strings, totaling 425 individual conductor strings across the cable. The outer boundary of the cable is surrounded by 30 cm of air (or insulating environment) to emulate open space and reduce artificial boundary interactions.

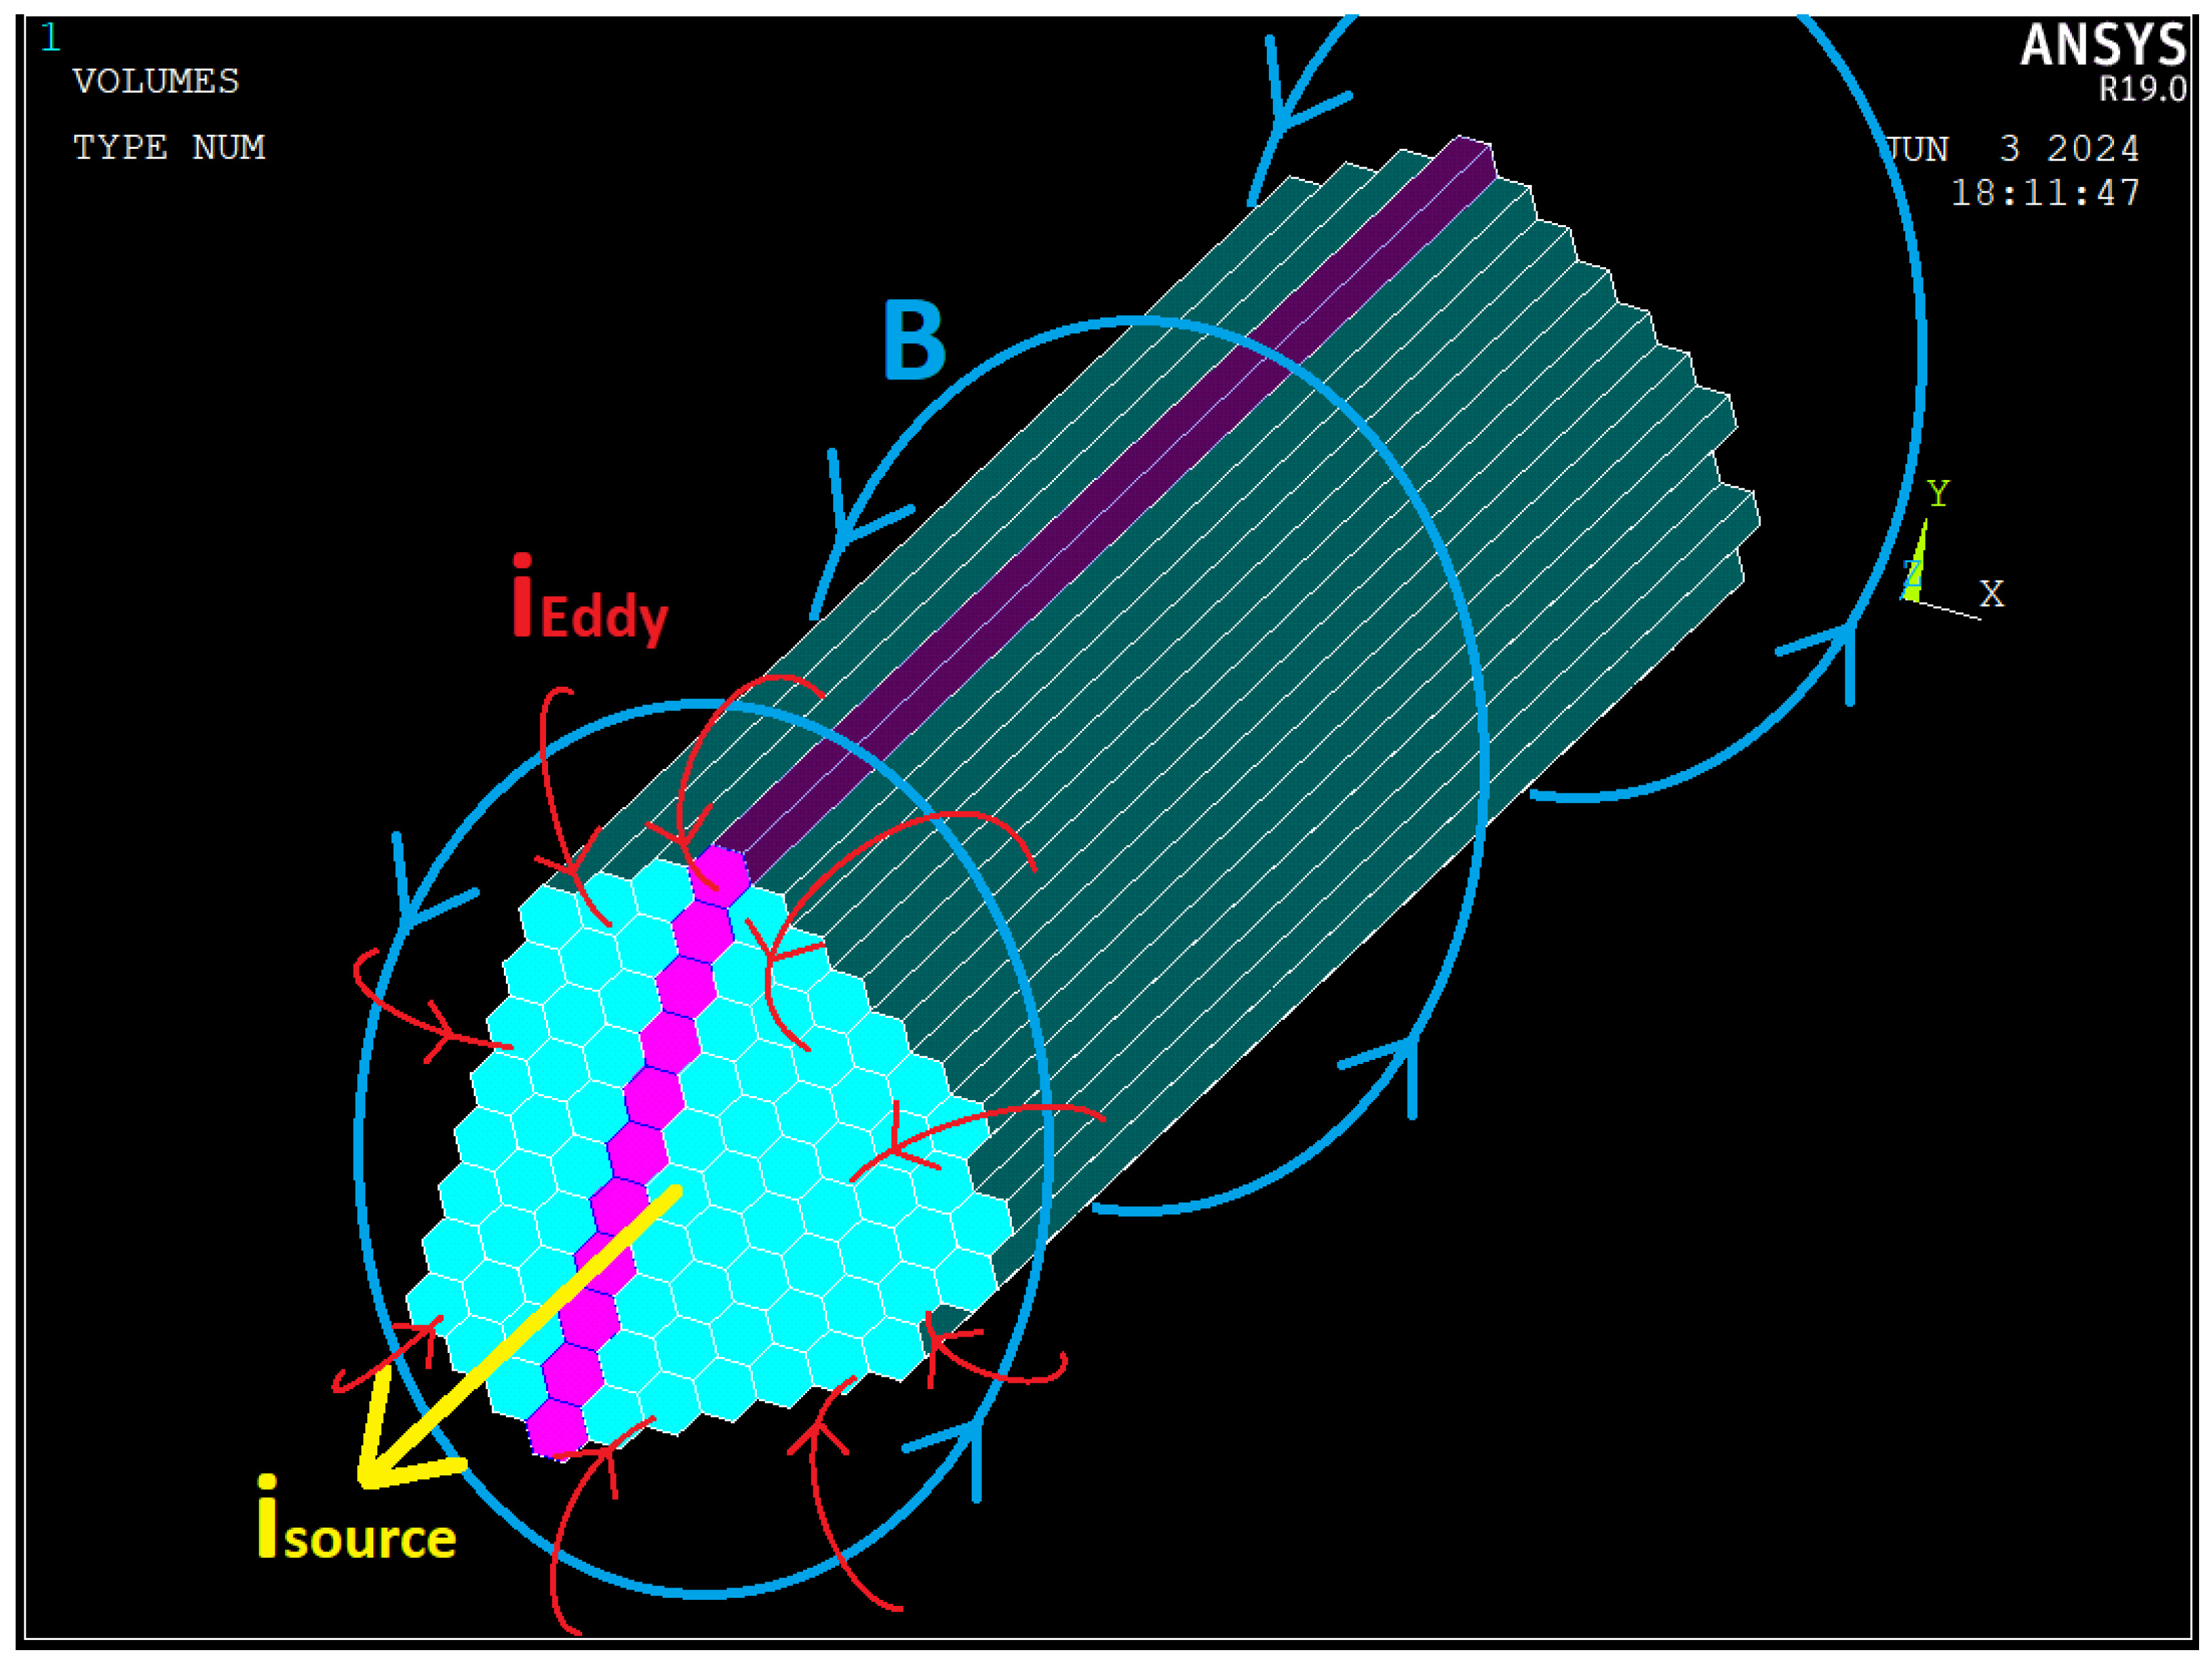
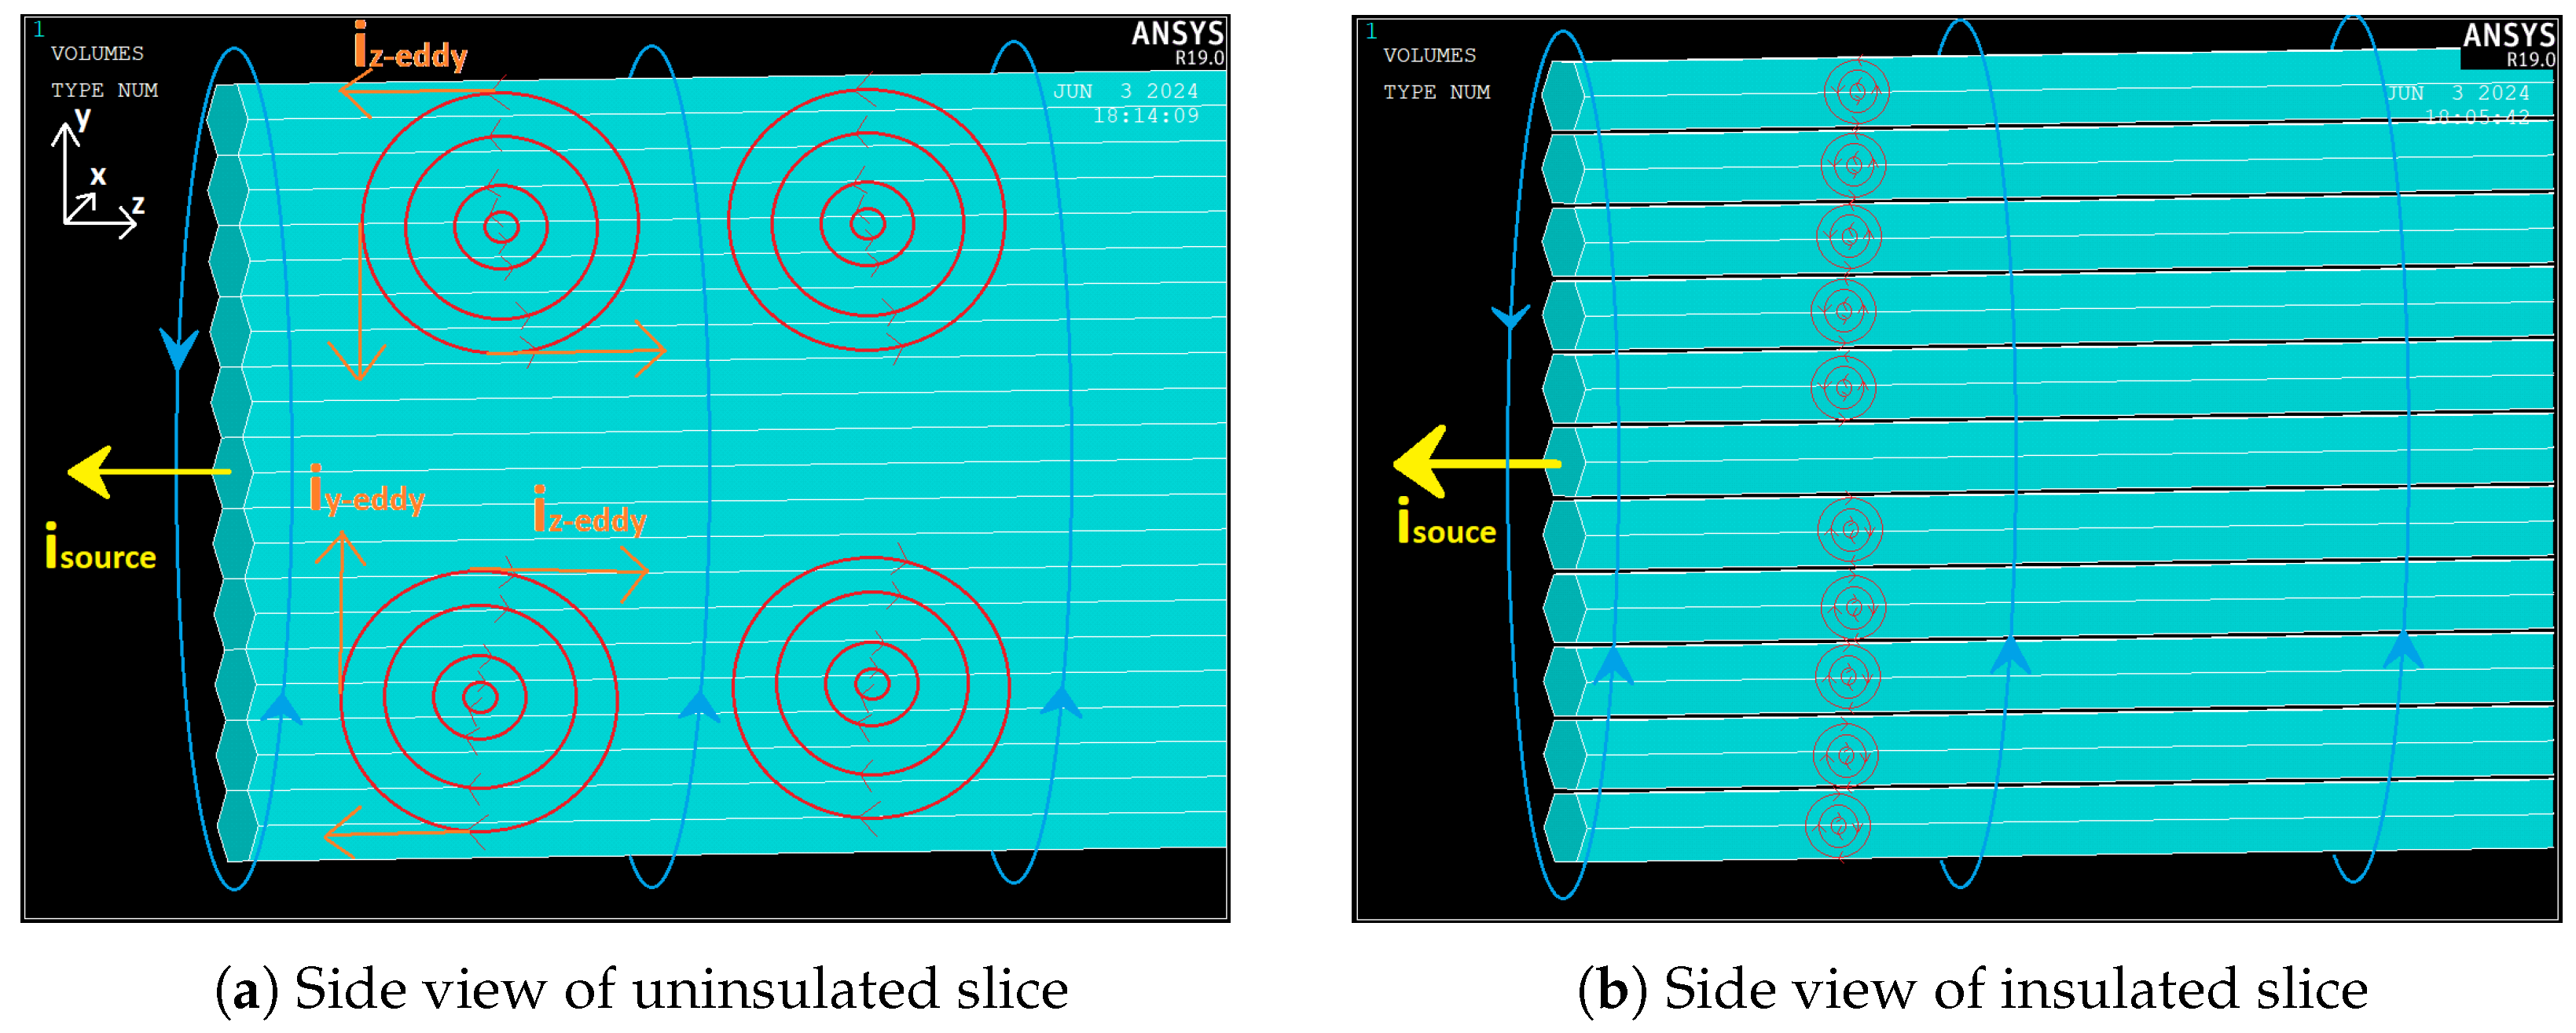
2.2. Rationale for Insulating Individual Conductor Strings

In multi-strand power cables, each segment typically contains numerous conductor strands in direct electrical contact, thereby functioning as a large solid conductor from an electromagnetic standpoint. When alternating current (AC) flows through such a bundle without inter-strand insulation, induced eddy currents can traverse across the strands rather than remaining confined within individual conductors. This behavior effectively mimics a single large conductor, exacerbating both skin and proximity losses.
Figure 2 depicts a single segment from the 5-segment cable, modeled in 3D. Given an external source current i source (in yellow) directed along the z-axis, the surrounding time-varying magnetic field B (in blue) induces eddy currents i Eddy (in red) that may loop freely among the strands if no insulation is present. Because of these loops, the entire segment tends to behave akin to a solid conductor, with skin and proximity effects more pronounced at higher frequencies.
A focused analysis can be performed by considering only the selected purple conductors shown in Figure 2. These parallel conductors, being electrically connected, allow for larger current loops, which facilitate substantial transverse eddy current paths, as illustrated in Figure 3a. Conversely, insulating each conductor string, as shown in Figure 3b, confines the circulating currents to smaller loops, thereby reducing electromagnetic coupling and mitigating both skin and proximity effects.
While eddy currents are generally perpendicular to flux lines in all directions, Figure 3 considers only those parallel to the y-z plane (red circles). The orange vectors represent the tangents of these currents, which cancel out in all directions except parallel to the z-axis. Although some proximity effect persists due to the influence of neighboring strands’ fields, the inability of currents to flow from one conductor to another greatly diminishes losses.
The intensity of skin effect in a conductor is governed by skin depth δ , which is defined by
δ = 2 ρ ω μ ,
where ρ denotes the material resistivity, ω = 2 π f is the angular frequency, and μ = μ 0 μ r is the magnetic permeability (with μ 0 being the permeability of free space and μ r the relative permeability). Within one skin depth from the conductor surface, the current density falls to approximately 1 / e of its surface value J 0 [25,26].
Figure 4 schematically shows how the current density amplitude decays inward from the surface for different conductor radii. Large cross-sectional conductors ( r c δ ) exhibit pronounced current crowding near the surface (Figure 4a), leading to higher AC resistance. By contrast, insulating each smaller conductor string individually ( r c δ ) can distribute current more uniformly (Figure 4d). This advantage motivates the move toward individual conductor insulation, as it effectively breaks up large segments into multiple smaller cross-sectional conductors, each carrying a fraction of the total current while limiting significant eddy current loops within the bundle.

2.3. Insulation Layer and Gap Definition

Two insulation thicknesses, 75 µm and 100 µm, are selected for comparative analysis. The gap d g between two adjacent conductor strings within a segment is twice the thickness of the insulating layer as shown in Figure 5.

2.4. Material Properties

The materials used in the simulations include a conducting material (copper) and an insulating medium (air-like). The conductor is assigned to each hexagonal string (purple areas in Figure 5), while the insulation gap and surrounding environment (blue areas in Figure 5) share the same material properties. The insulation material is assigned properties of air which is similar to typical insulation materials used in underground cables in terms of electromagnetic properties. Each material is characterized by the relative permeability μ r (unitless), the electrical resistivity ρ (measured in Ω · m ), and the electrical conductivity σ (measured in S / m ), as specified in Table 1.

2.5. Boundary Conditions and Source Current

A total current of I source = 10 A (rms) is applied at frequencies of 0 ( DC ) , 50 , 150 , and 250 Hz . These frequencies represent a fundamental of 50 Hz plus higher third and fifth harmonic orders commonly encountered in practical power systems [11,12,27]. Analyzing up to the 5th harmonic proves to be sufficient, since the ohmic effect of higher harmonic orders (7th, 9th, etc.) declines exponentially [28].
  • No-Insulation Model: Voltage degrees of freedom (DOFs) within each segment are coupled, ensuring the current can freely distribute among the 85 conductor strings in that segment. Across different segments, the cable is assumed electrically isolated;
  • Insulated Model: Each conductor string has its own set of coupled nodes, ensuring that current does not jump between adjacent strings in the x-y plane. Instead, I source is divided equally among all 425 conductors (85 in each of 5 segments).
The outer boundary of the 30 cm air region is enforced with a magnetic vector potential A z = 0 , serving as a far-field boundary condition to emulate an unbounded external environment.

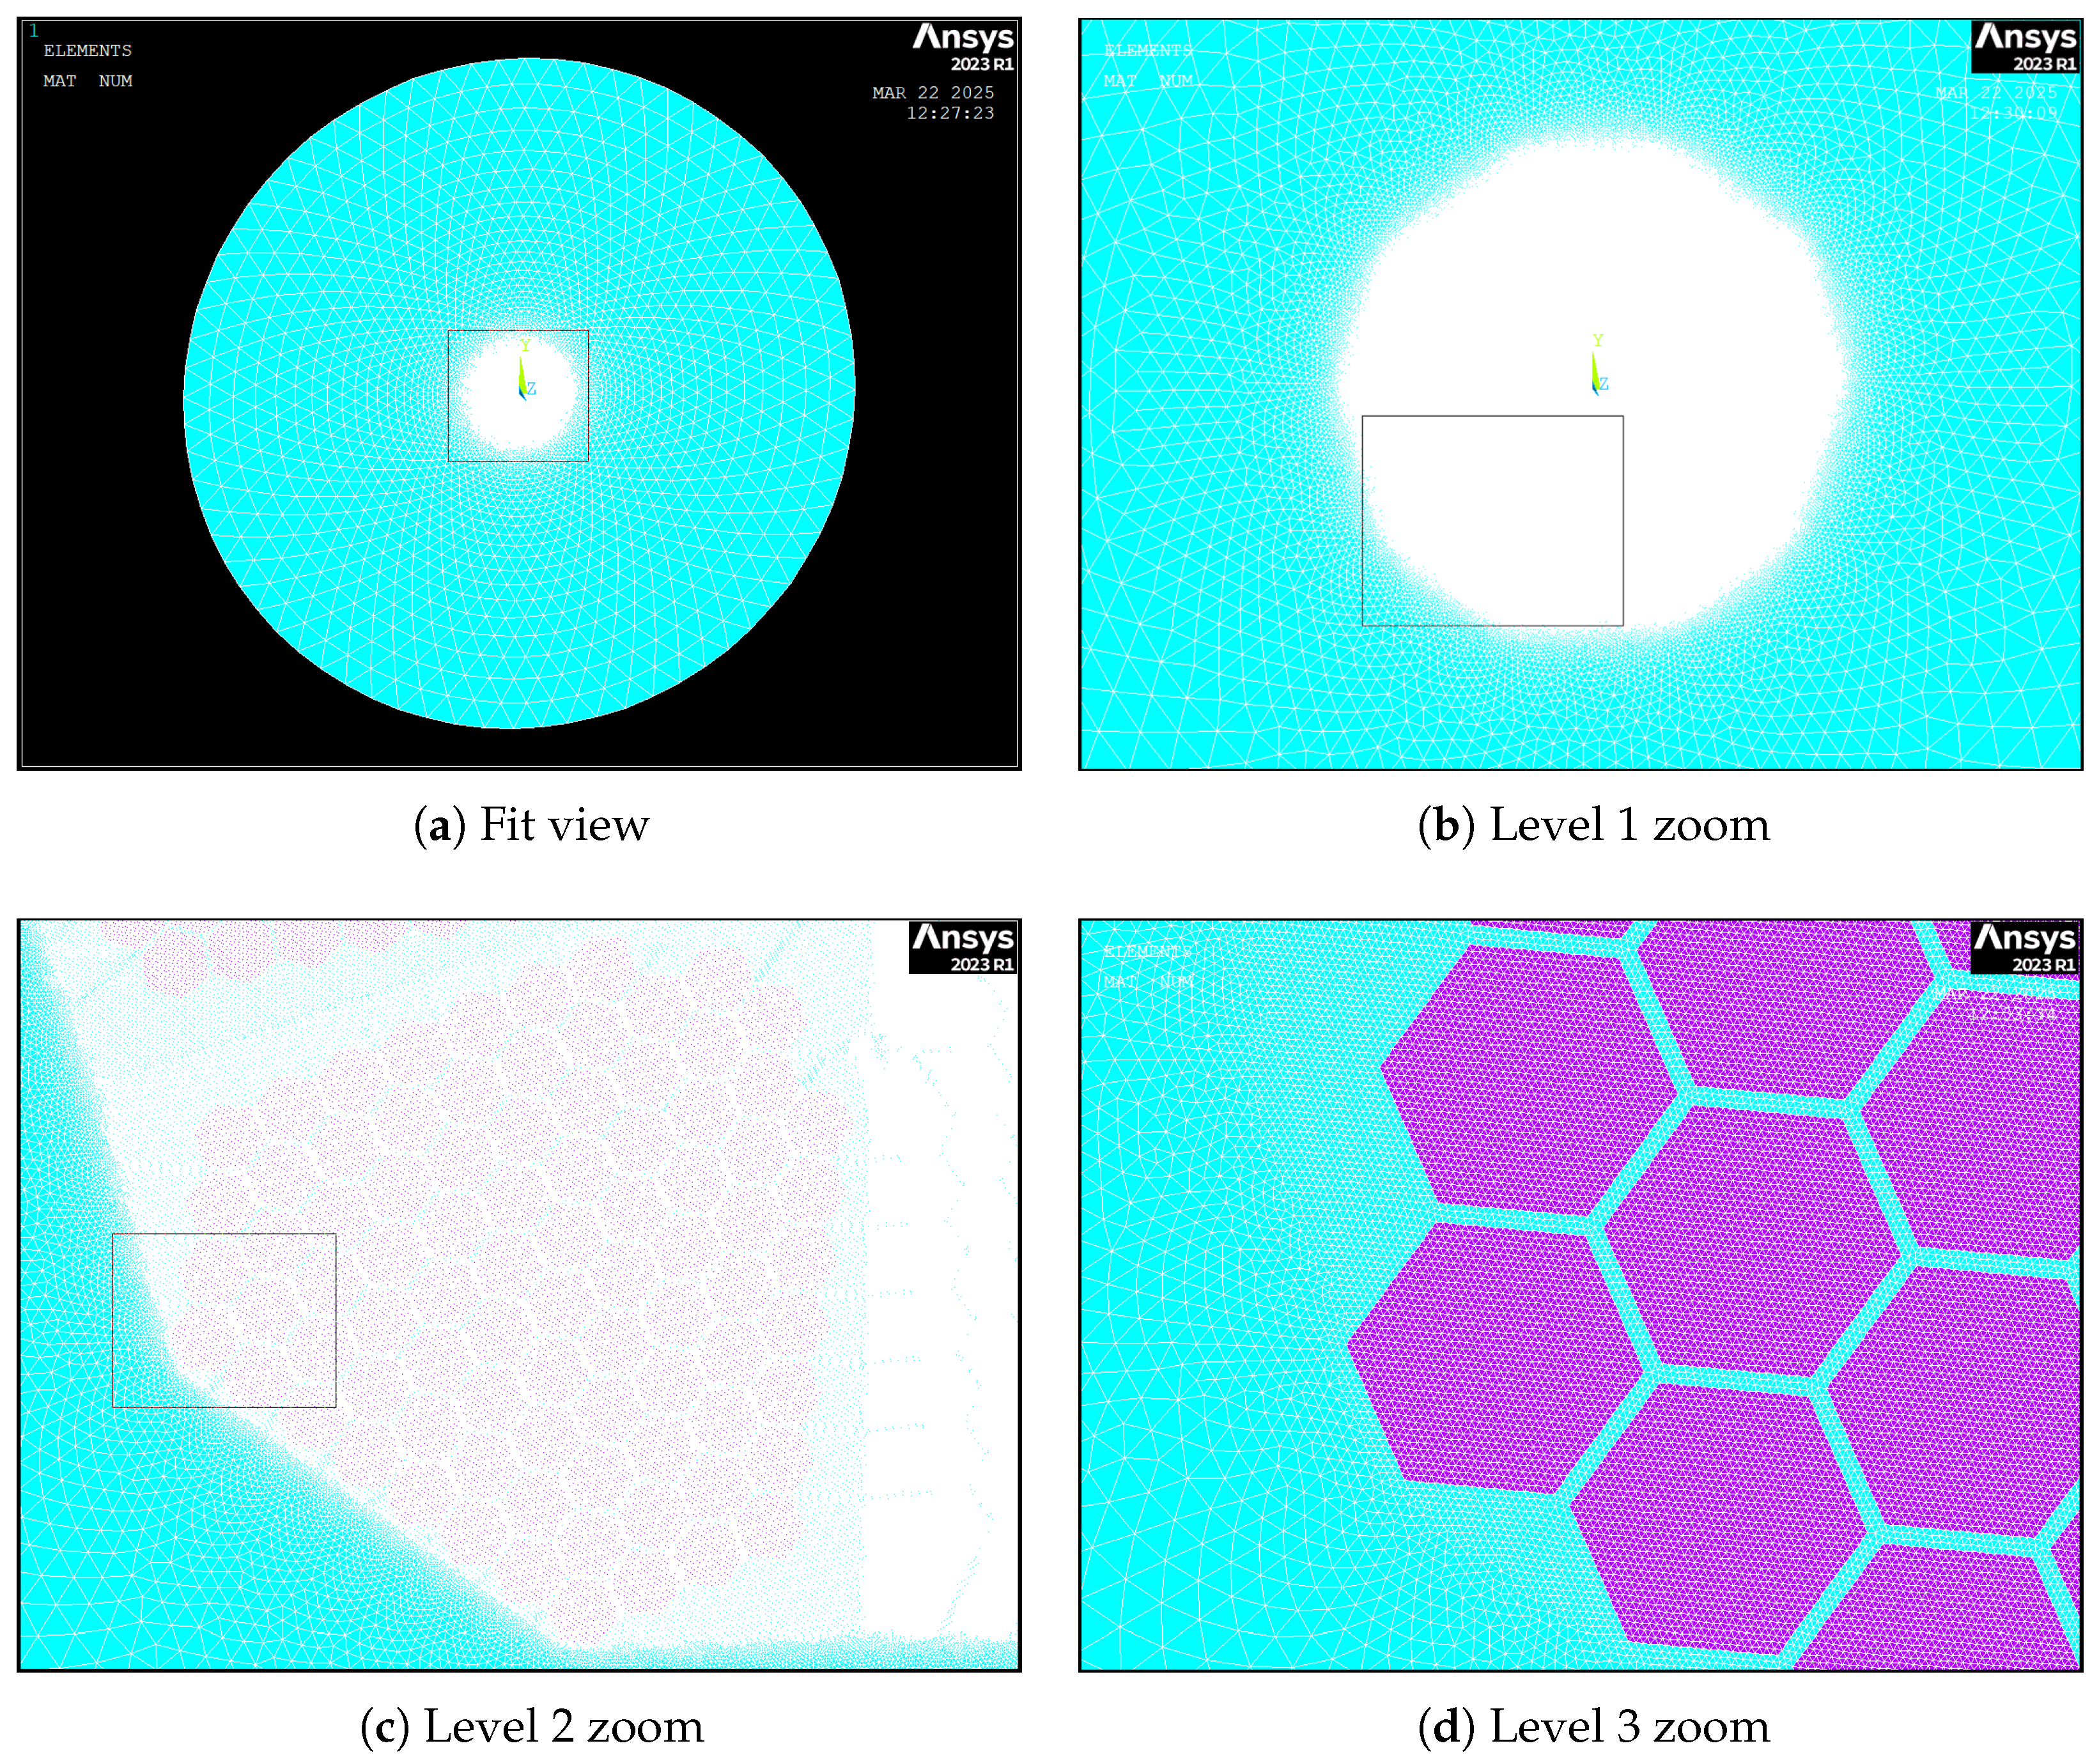
2.6. Finite Element Meshing

Due to the relatively small thickness of the insulation layer (75 or 100 µm) compared to overall cable dimensions, special care is taken to refine the mesh around the conductor–insulator interface. Adaptive meshing is performed in areas of highest electromagnetic field gradient, particularly near corners of the hexagonal conductors. Figure 6 shows a representative meshing strategy.
  • Mapped Mesh for Conductor Core: Hexagonal copper areas are meshed with a mapped or uniform density to accurately capture current distribution;
  • Finer Mesh for Insulating Gaps: The thin air gaps between conductor strings and around segment boundaries are meshed more densely to resolve steep field gradients.

2.7. Solver Setup and Post-Processing

Harmonic electromagnetic analyses are executed at 0 ( D C ) , 50 , 150 , and 250 Hz frequencies. The solver calculates:
  • Current Density (J) within each conductor;
  • Magnetic Flux Density (B) in and around the conductors;
  • Power Loss ( P loss ), from which R AC is deduced via (3).
After each solution, data are exported for visualization of current density and flux lines. Paths are defined to track J radially outward from the cable center, though in the insulated case, multiple path lines are needed, as the insulation gap can interrupt a continuous radial path.

2.8. Definition of Key Parameters

In this subsection, we introduce the principal parameters that characterize electrical performance in our two-dimensional (2D) cable models. Specifically, we focus on the current density J, the per-unit-length power loss P loss - 2 D , and the frequency-dependent and DC baseline resistances, R AC - 2 D and R DC - 2 D , respectively. Each quantity provides insight into how skin and proximity effects manifest in segmented or unsegmented conductors.

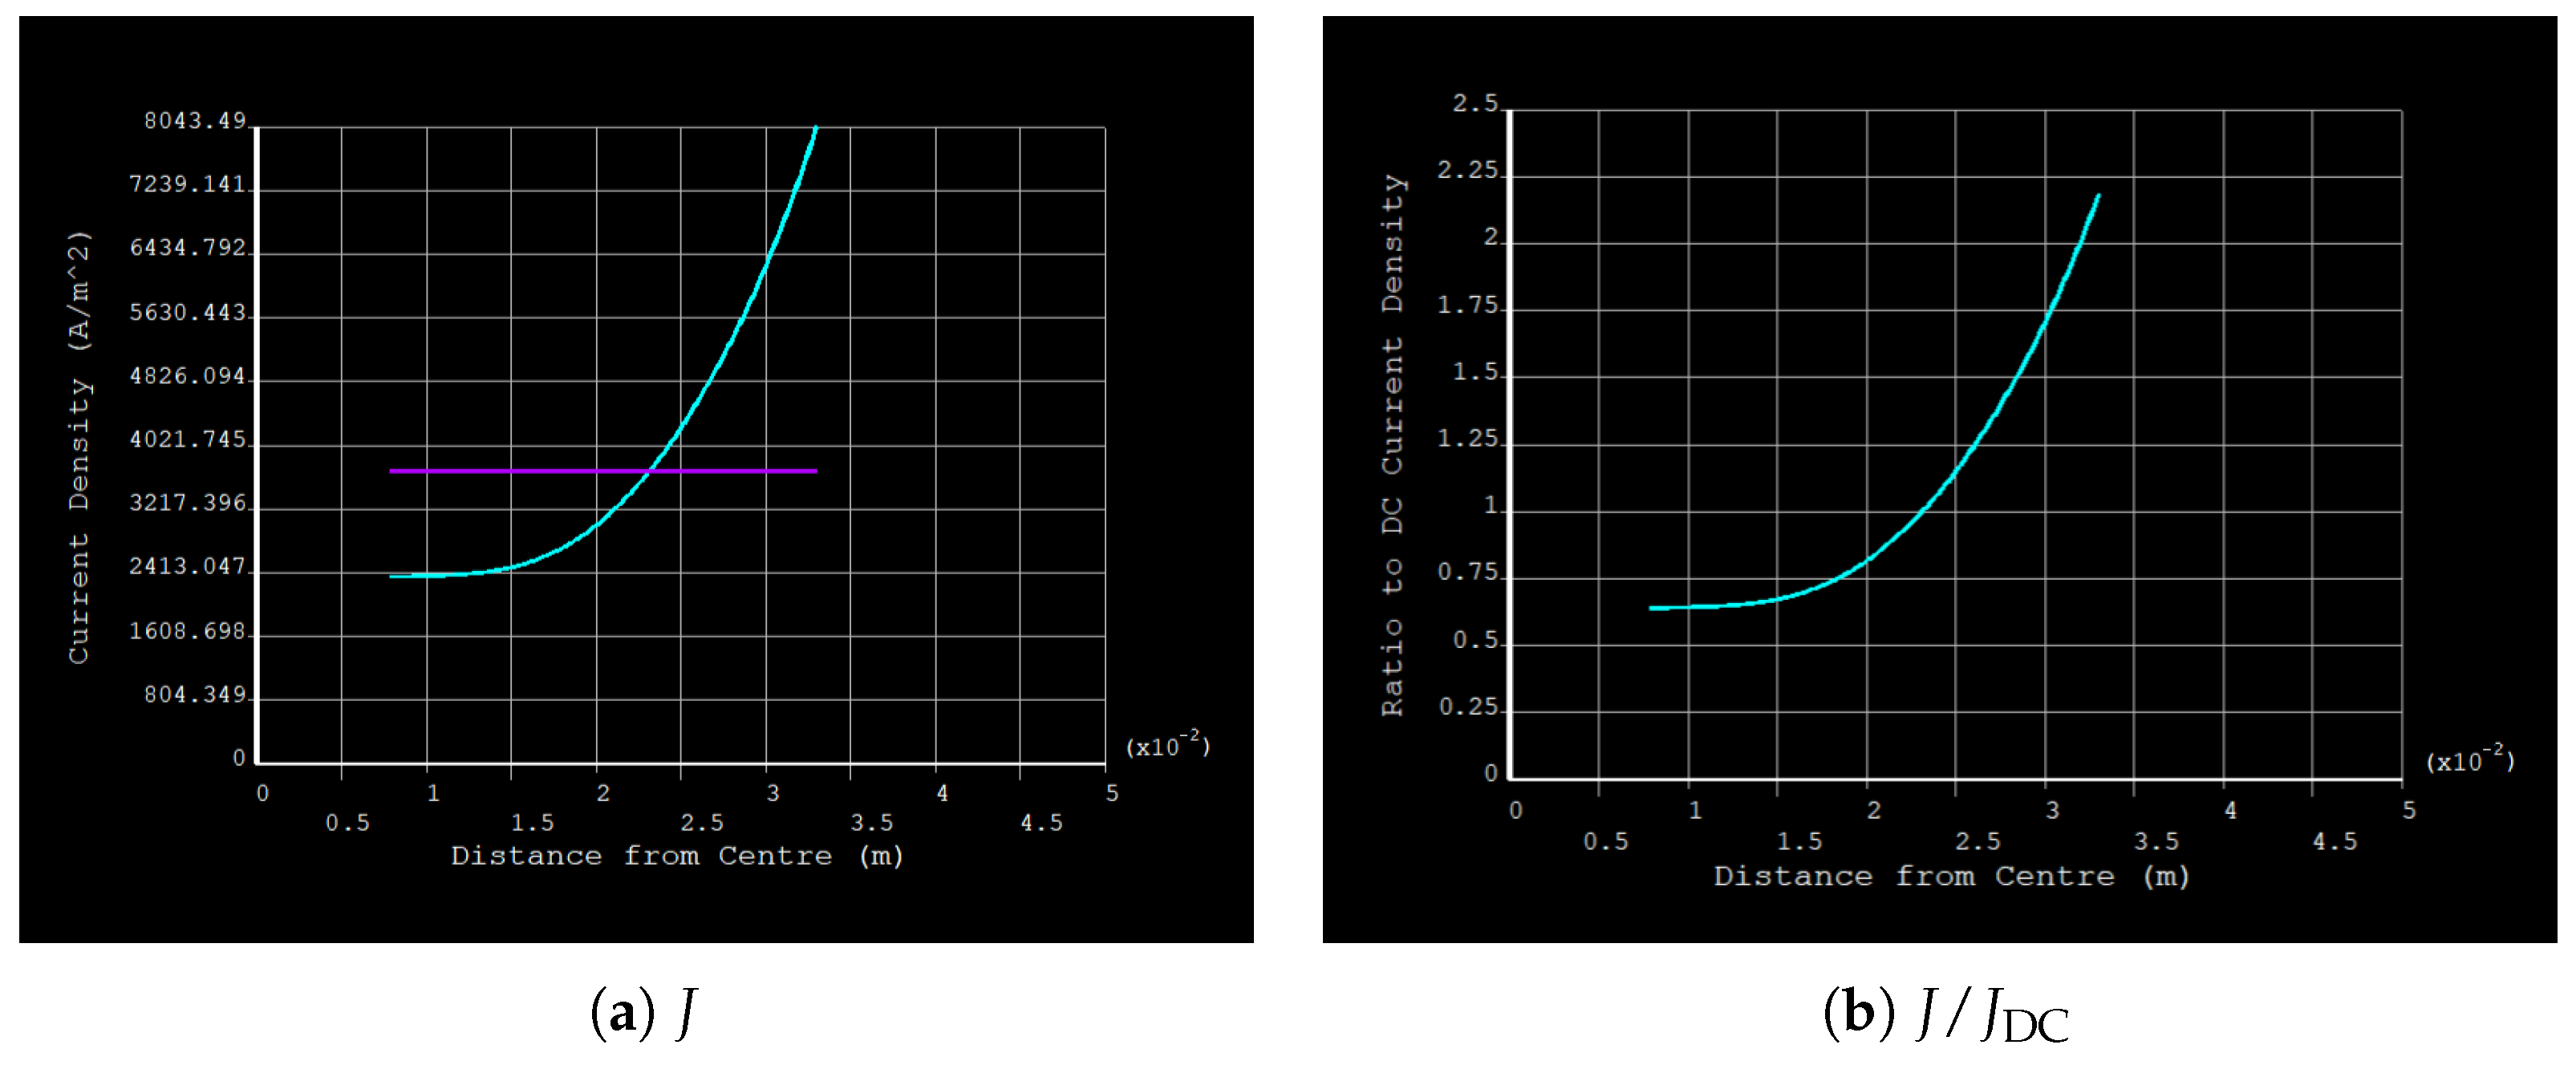
2.8.1. Current Density J (A/m2)

The current density J describes how electric current is distributed across the cross-section of the conductors. In a 2D representation, J is obtained by dividing the local current flow by the elemental area of each finite element. For harmonic (AC) excitation, the phase and magnitude of J vary spatially due to both skin and proximity effects, with more pronounced non-uniformity at higher frequencies.

2.8.2. Power Loss P loss - 2 D (W/m)

Parameter P loss - 2 D denotes the total ohmic (Joule) heating in the conductor, per unit axial length, under AC excitation. In practice, a finite element (FE) solver integrates the product of the local electric field and current density over the 2D cross-section (treated as a 1 m axial extrusion). Mathematically,
P loss - 2 D = S J 2 1 σ d S ( W / m ) ,
where σ is the electrical conductivity of the conductor material and the integration extends over the cross-sectional area S. The resulting value indicates how much power, in watts per meter of cable length, is dissipated as heat [29].

2.8.3. AC Resistance R AC - 2 D ( Ω /m)

To quantify losses under alternating current conditions, we define the AC resistance per unit length:
R AC - 2 D = P loss - 2 D I 2 ( Ω / m ) ,
where I is the total RMS current supplied to the 2D domain. In contrast to an ideal DC conductor, where current is uniformly distributed, high-frequency currents cluster near surfaces or adjacent conductors, increasing resistive losses. Consequently, R AC - 2 D typically grows more significant as frequency rises, reflecting both skin and proximity effects.

2.8.4. DC Resistance R DC - 2 D ( Ω /m)

Finally, the DC resistance per unit length, R DC - 2 D , serves as a reference to which AC resistance can be compared. For a conductor of cross-sectional area A and resistivity ρ , the baseline DC resistance is evaluated (for a 1 m extrusion along the cable axis) as
R DC - 2 D = ρ A ( Ω / m ) .
Because DC current distributes evenly across the conductor cross-section, R DC - 2 D is considered the minimal possible resistance, effectively ignoring higher-frequency loss mechanisms. By comparing R AC - 2 D with R DC - 2 D , it is possible to quantify the extent to which skin and proximity effects elevate cable losses.

3. Results

This section presents the main simulation outcomes such as the distributions of current density, the magnetic flux lines, and the overall power losses leading to R ac / R dc ratios.

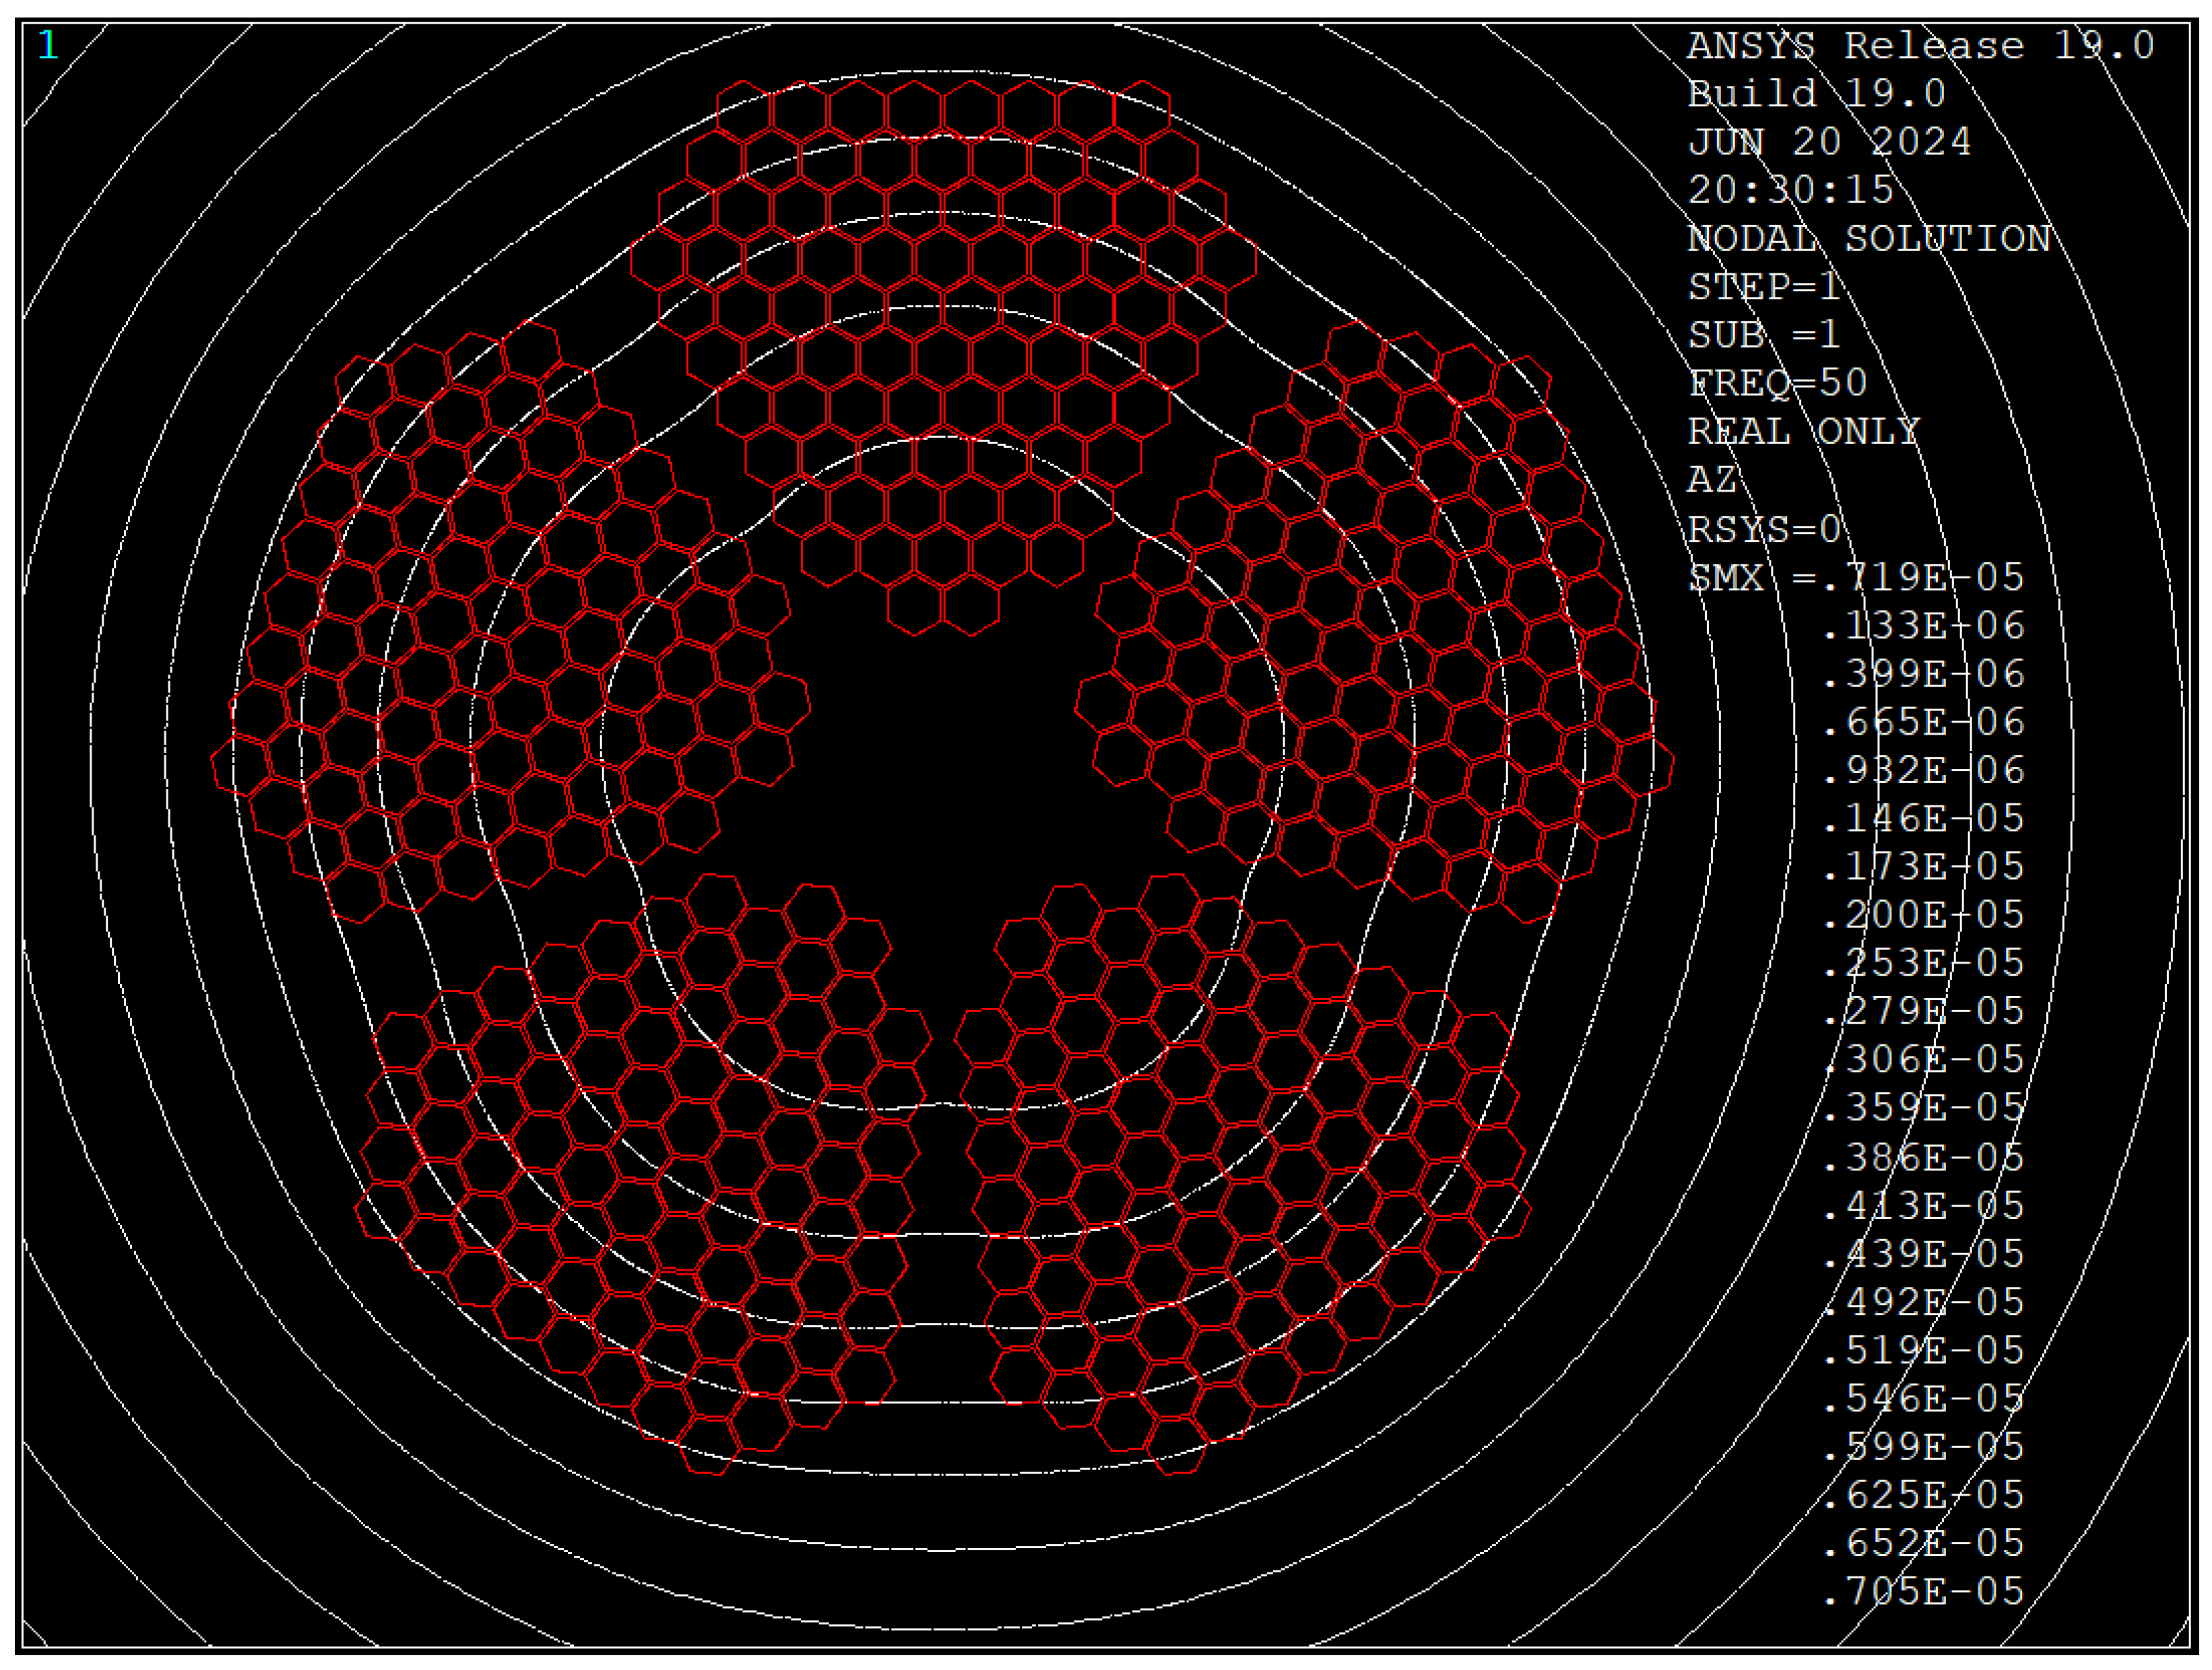
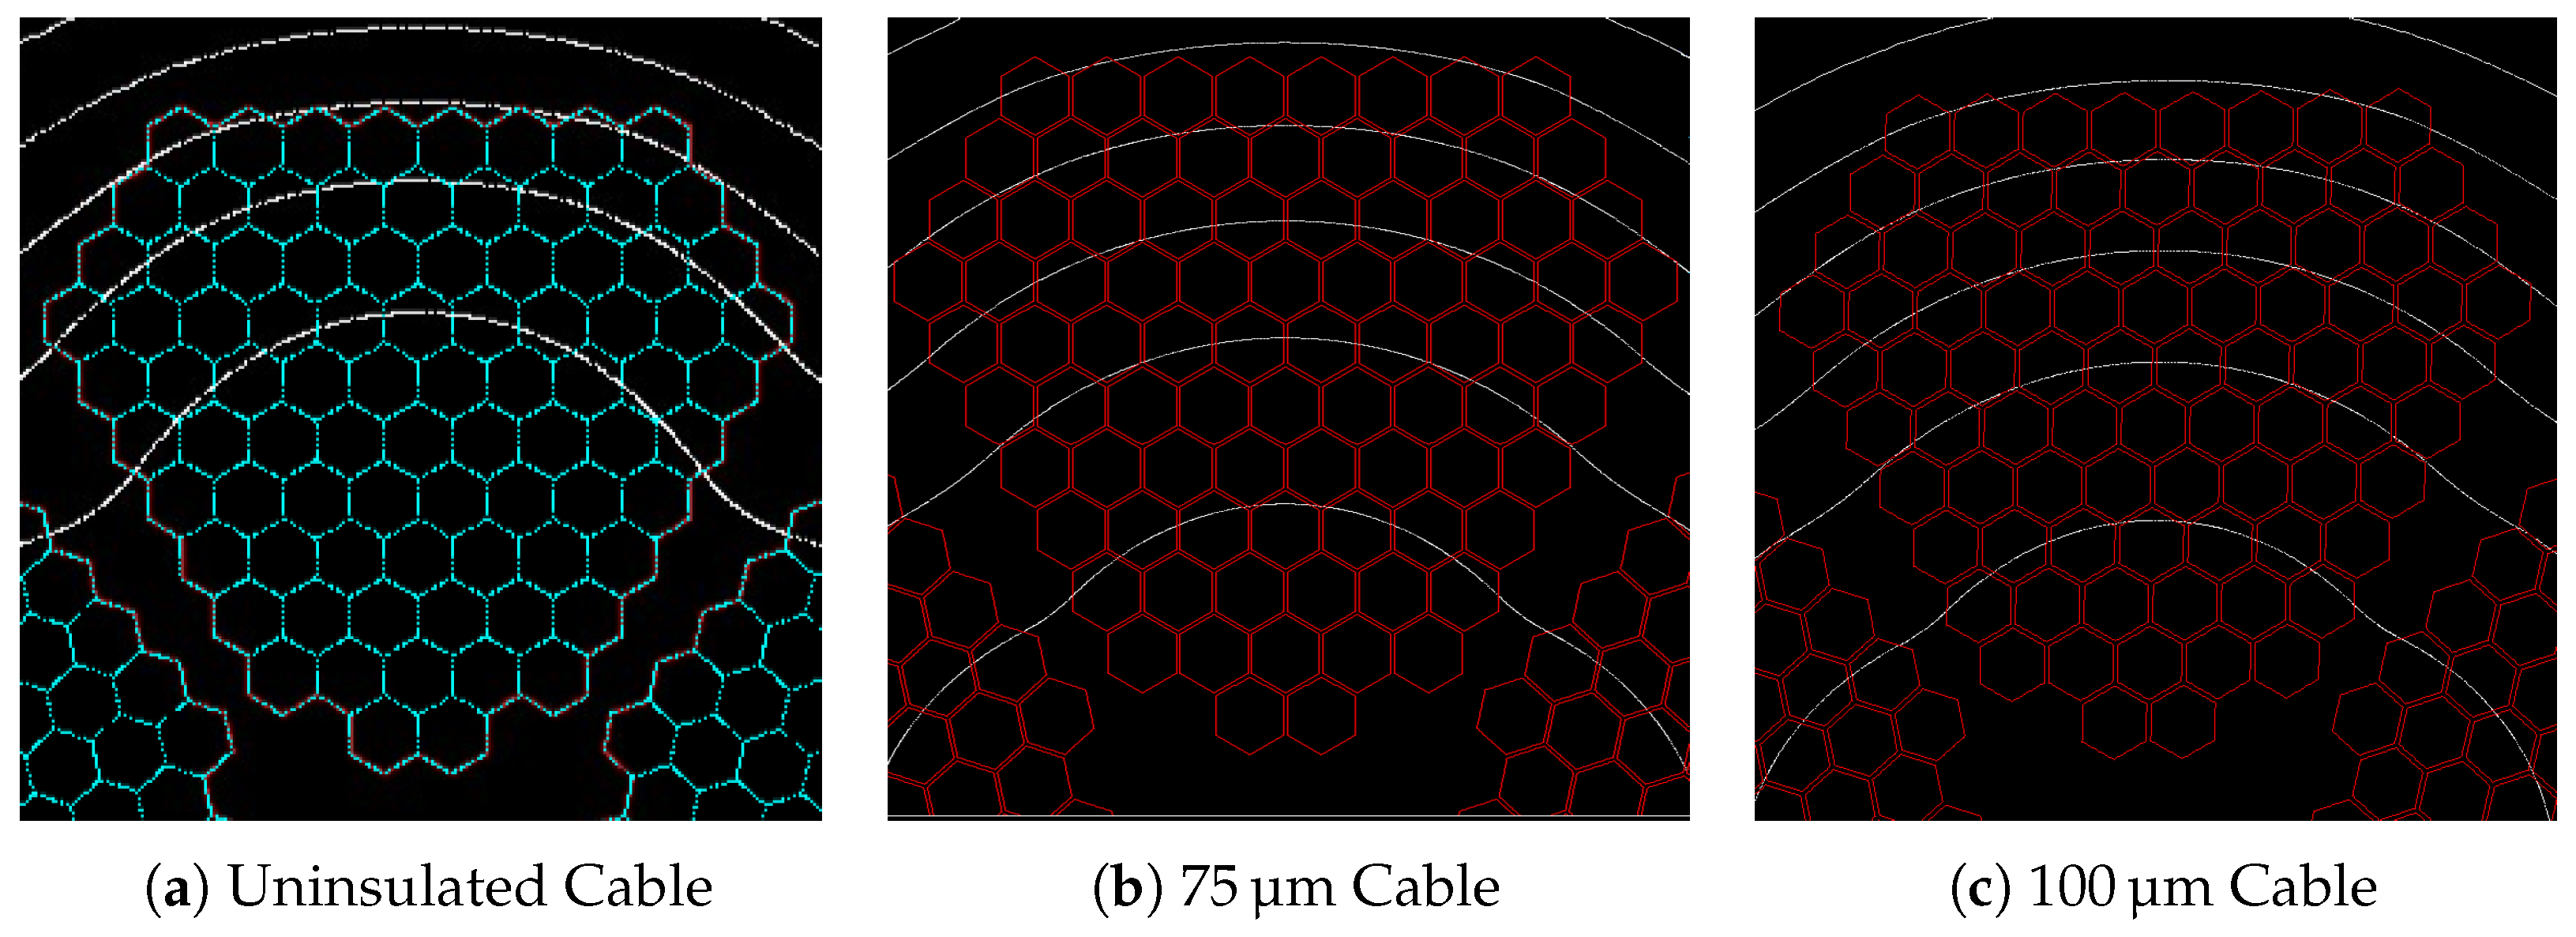
3.1. Uninsulated 5-Segment Cable
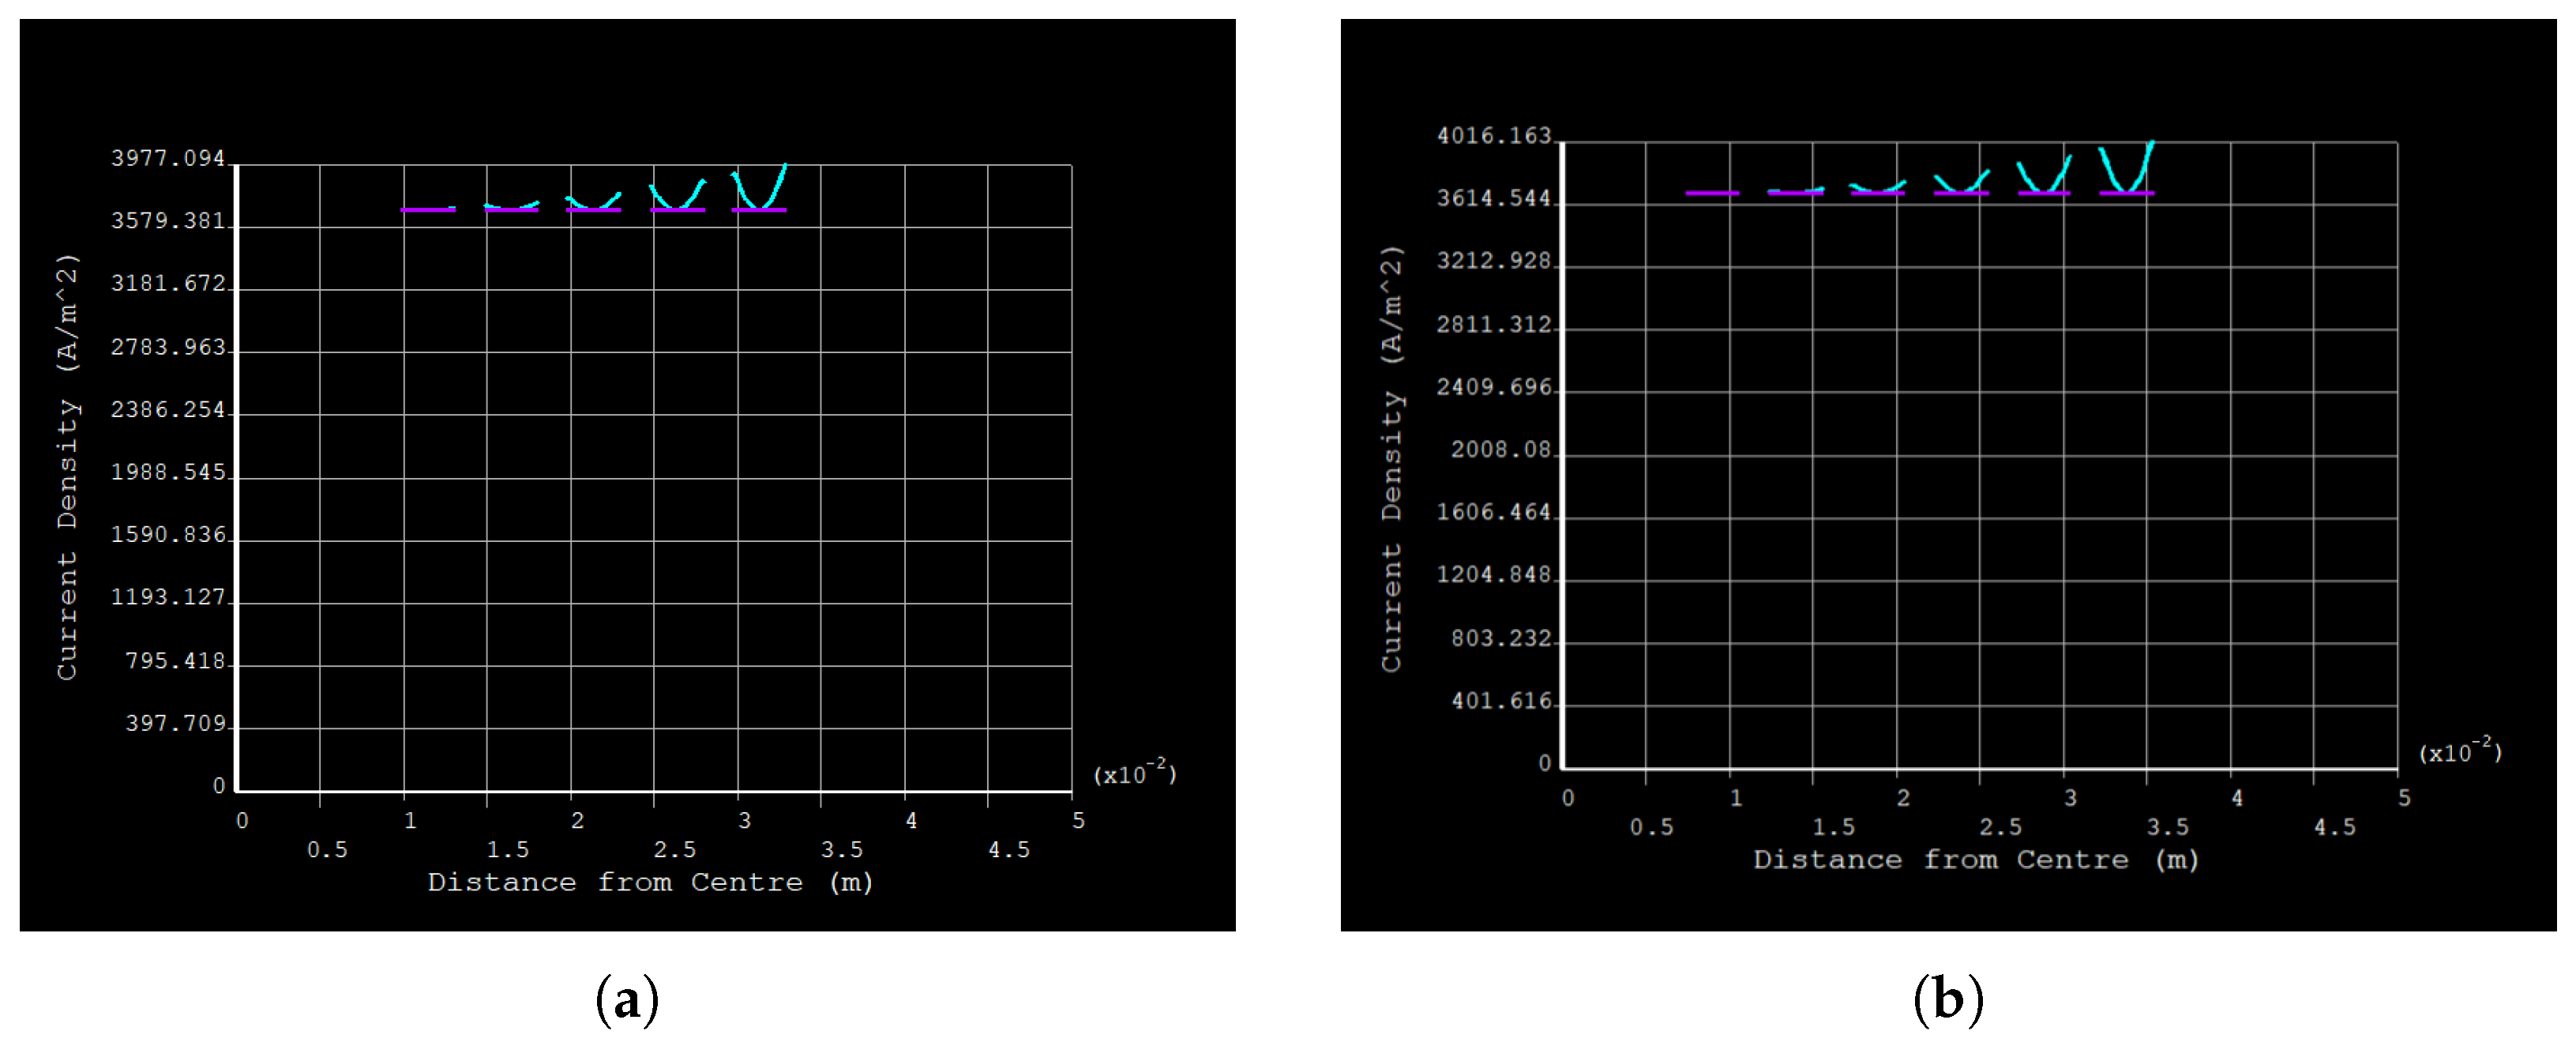
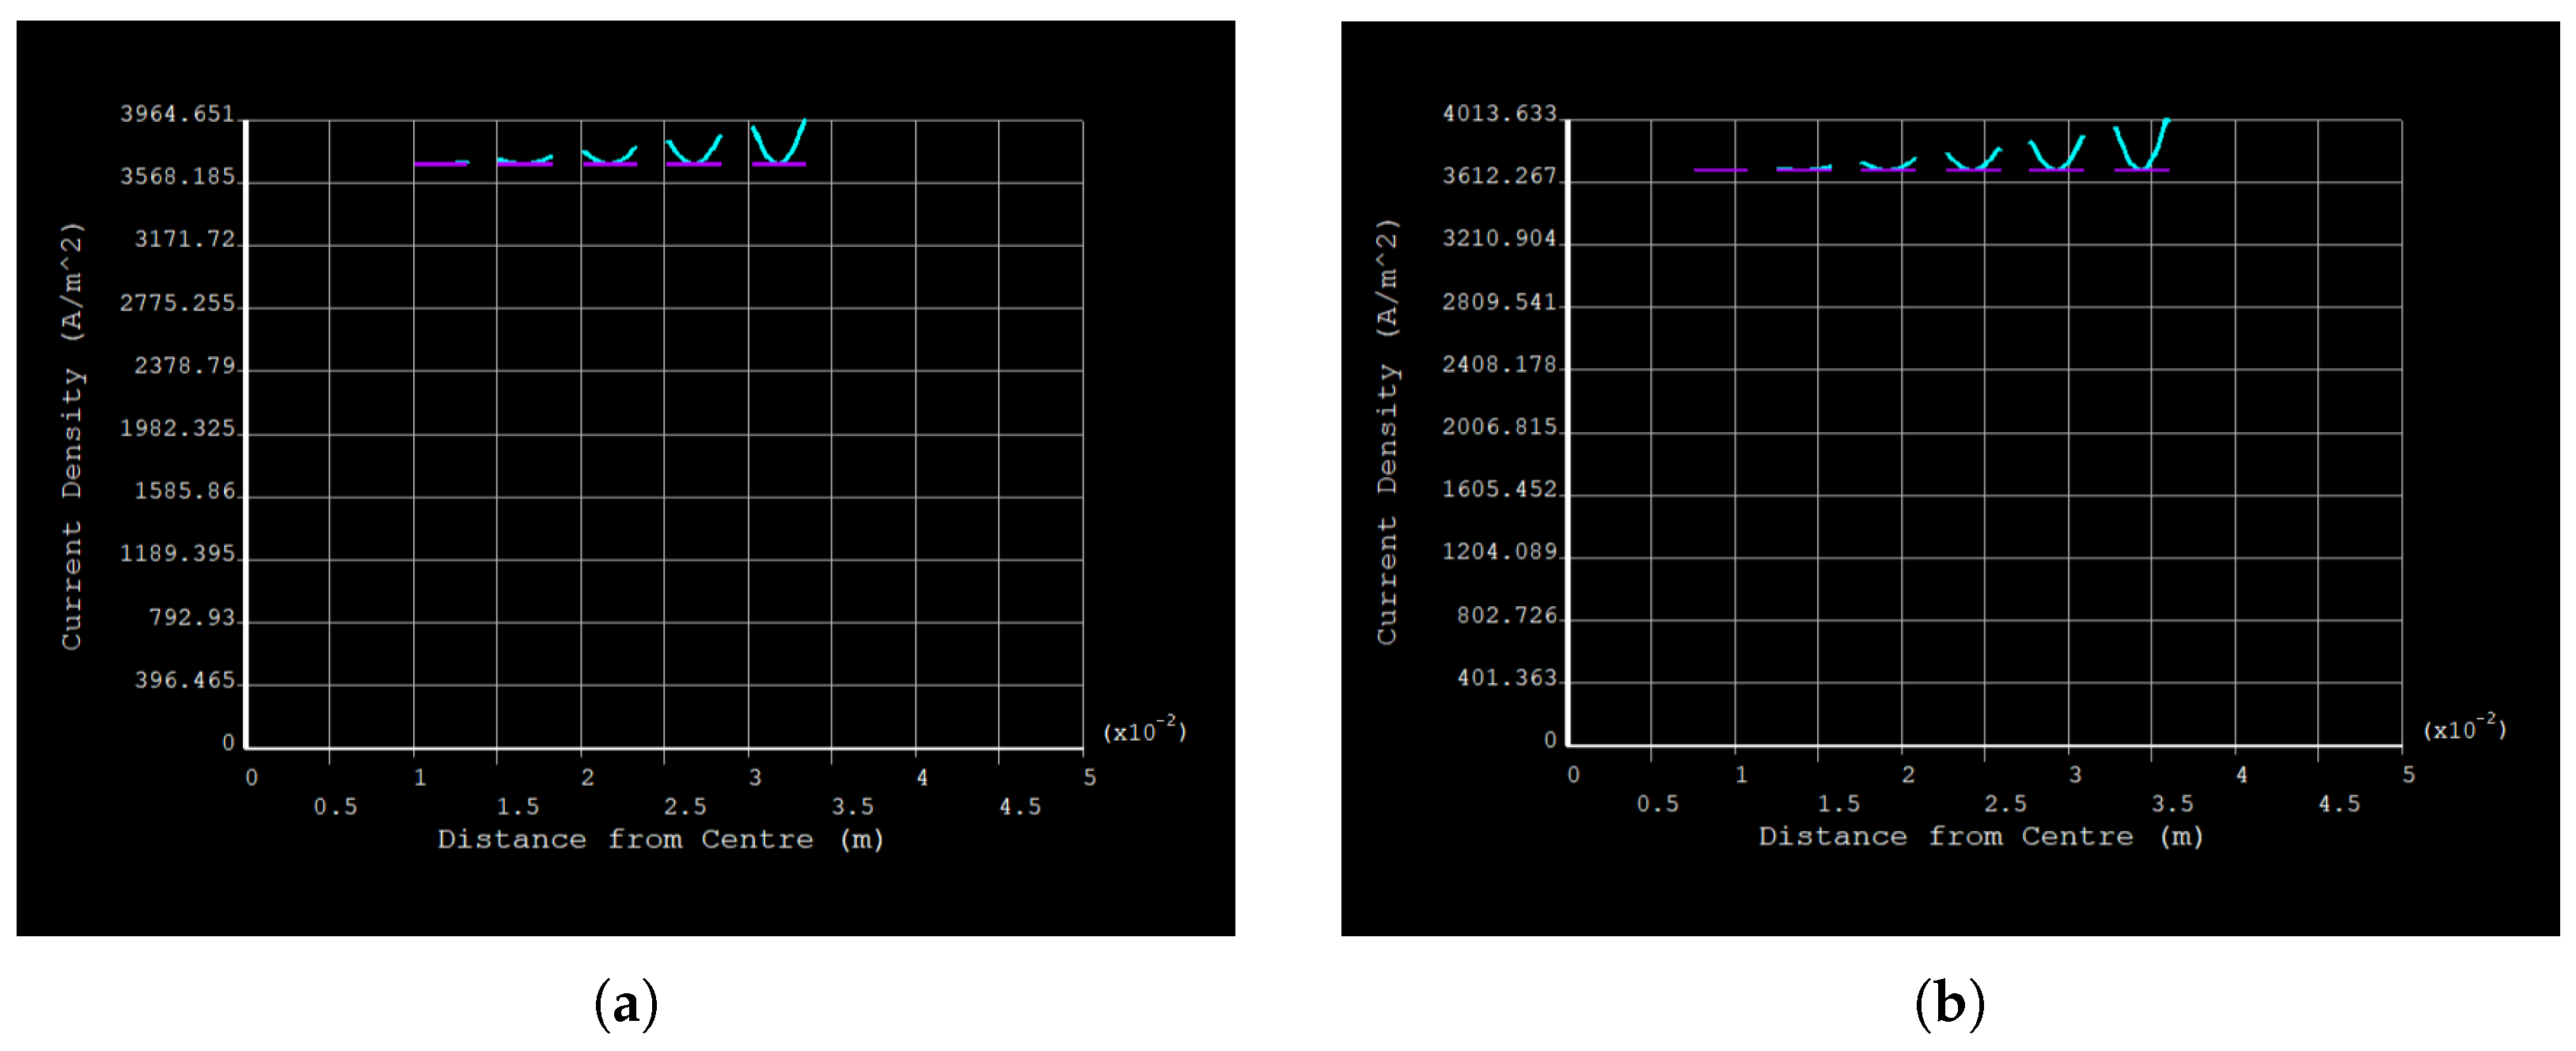
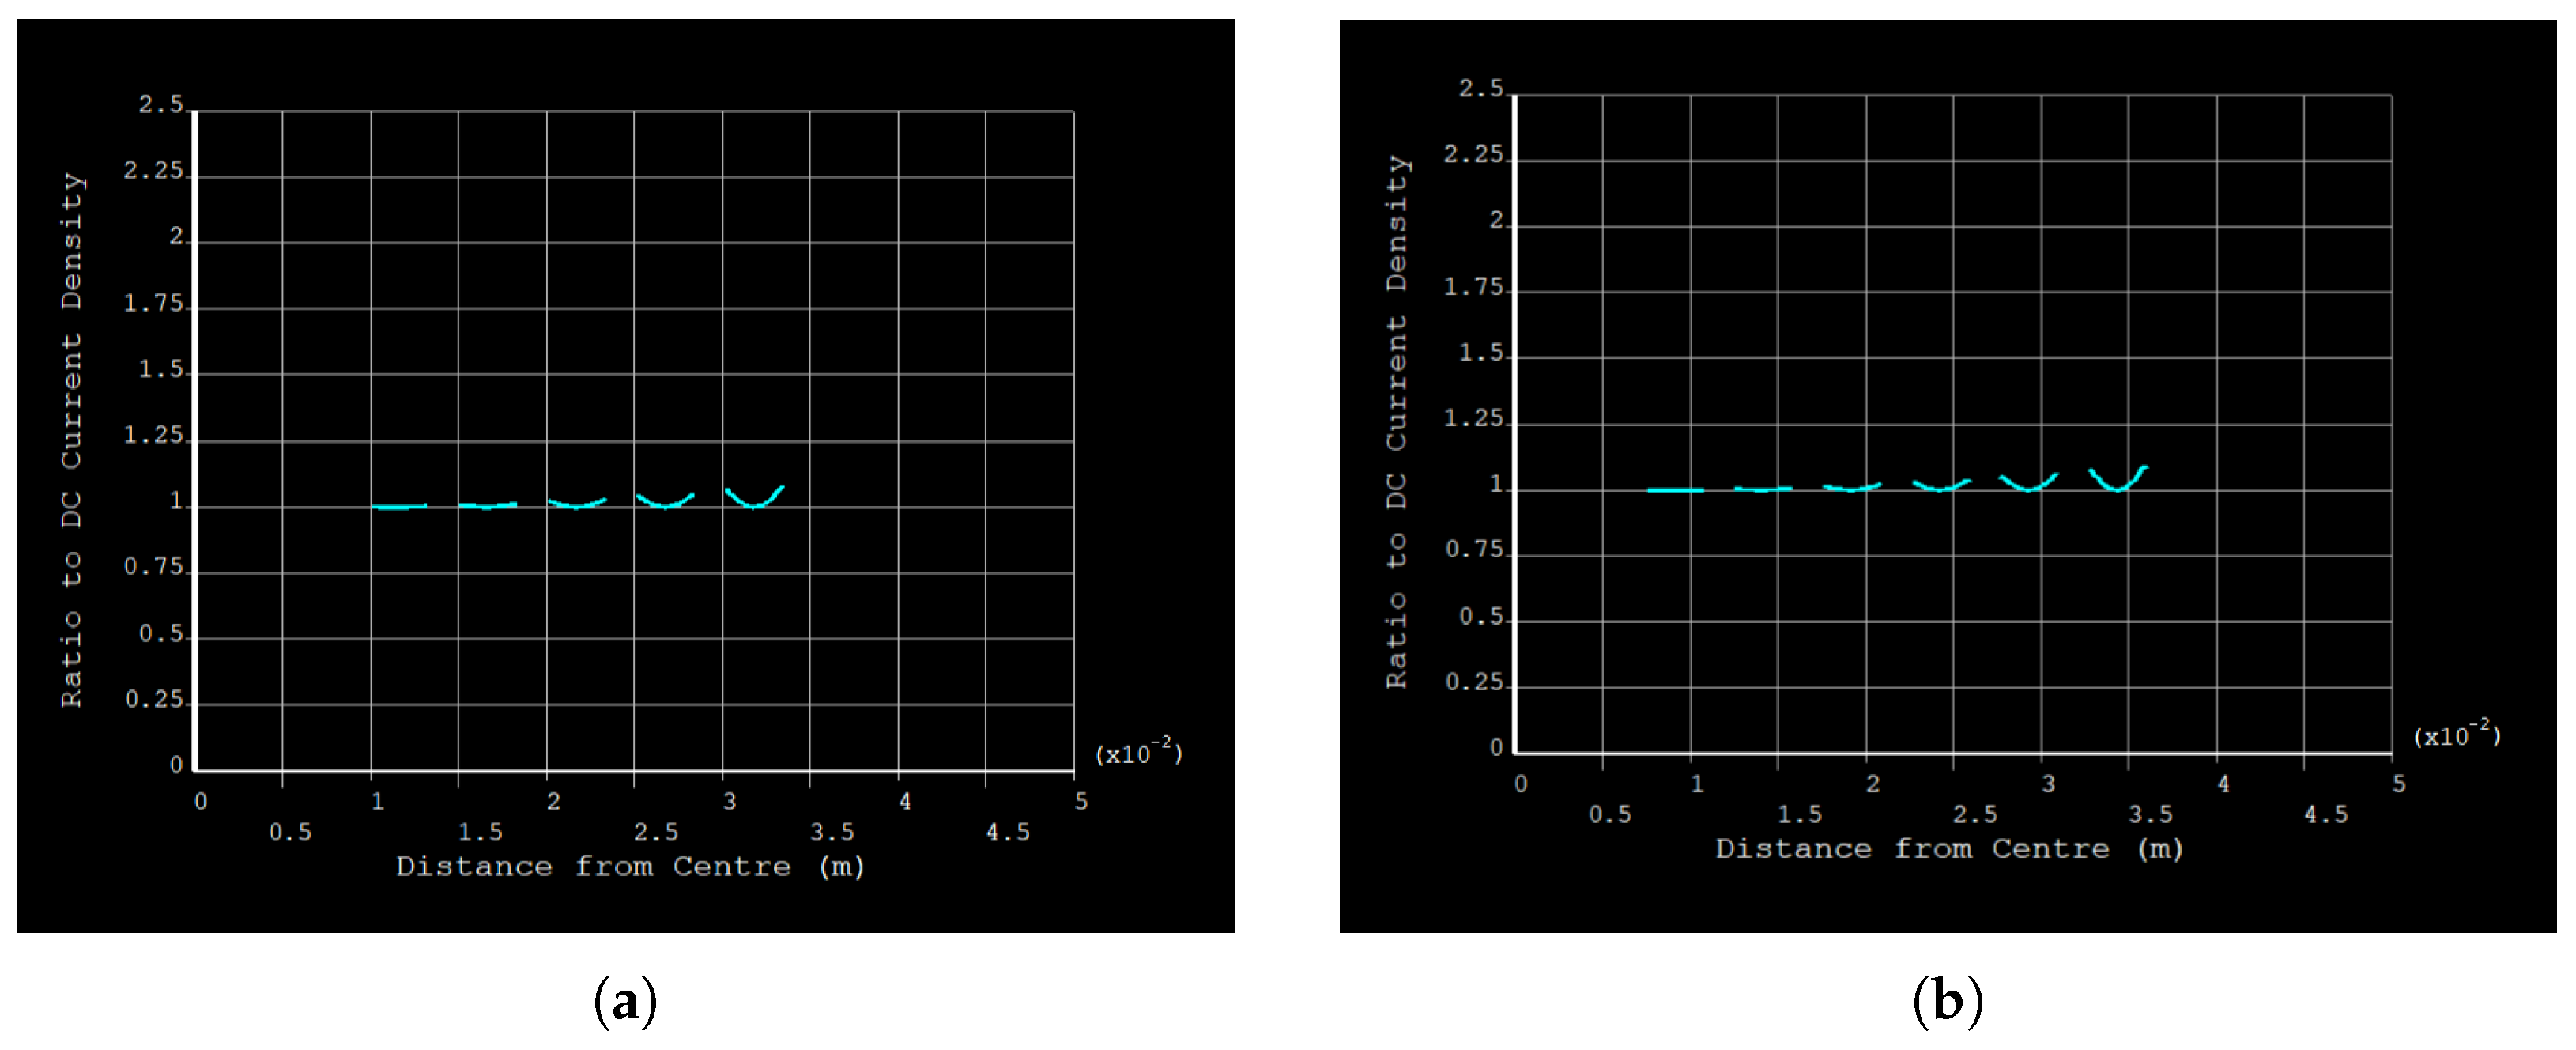
Figure 7 illustrates the distribution of current density J across the uninsulated five-segment cable at 50 Hz . The results reveal substantial current crowding near the outer boundaries of each segment, highlighting the influence of skin and proximity effects.
Figure 8a shows the variation of current density J (blue line) as a function of distance from the cable’s geometric center, along the vertical path shown in Figure 7. The purple line in the same plot denotes the DC current density, J DC , which is the uniform current distribution that would apply under ideal DC conditions. As evident in the figure, the AC current density rises sharply as one moves radially outward.
To further elucidate the impact of skin effect, Figure 8b plots the ratio J / J DC against the same radial coordinate. A ratio of unity indicates that the local AC current density matches the DC level, whereas ratios greater than 1.0 imply significant current crowding at the surface. Here, a clear rise in J / J DC near the conductor boundary is observed, reflecting the well-known skin effect at 50 Hz .
In addition to current density plots, Figure 9 illustrates the magnetic flux lines generated by the uninsulated five-segment model at 50 Hz . These lines are more densely spaced at the outer edges of each segment, indicating stronger magnetic fields where the conductor interfaces are closest. This intensification reinforces the proximity effect and further drives current redistribution away from interior regions.
Table 2 summarizes key parameters for the uninsulated cable at various frequencies. The minimum and maximum current densities J min , J max reflect the severe non-uniformity introduced by AC operation, while P loss quantifies the resulting ohmic heating per meter of cable length. Finally, the R AC / R DC ratio underscores how skin and proximity effects inflate AC resistance above the DC baseline.

3.2. Insulated 5-Segment Cable (75 μ m)

Figure 10 presents the current density distribution J across the five-segment cable with a 75 μ m insulation layer at 50 Hz . Compared to the uninsulated case, the current is noticeably more uniformly dispersed, indicating a substantial reduction in both skin and proximity effects due to the inter-strand insulation.
To quantify this observation, two paths were defined in the cross-section (labeled as Path 1 and Path 2 in Figure 10). Along each path, the variation of J is plotted in blue, and the reference DC current density J DC is indicated in purple. Figure 11 illustrates the results for Path 1 in Figure 11a and for Path 2 in Figure 11b. Despite slight deviations in the local geometry of the strands, the AC current density remains close to J DC across each path, demonstrating the effectiveness of the insulating layer.
A more direct measure of how well the insulation suppresses skin and proximity effects is obtained by plotting the normalized ratio J / J DC . Figure 12 compares this ratio for Path 1 and Path 2. Values near or below unity confirm that the current density is not drastically exceeding the ideal DC distribution, indicating that the induced eddy currents are largely contained within individual conductors thanks to the insulating barrier.
Figure 13 displays the magnetic flux lines for the insulated cable at 50 Hz . Relative to the uninsulated scenario, the flux lines are generally more diffuse, reflecting diminished electromagnetic coupling between adjacent strands. This decreased coupling further corroborates the lower AC losses observed in the cable.
Table 3 summarizes the key electrical parameters of the 75 μ m insulated cable at selected frequencies. In comparing these metrics to those of the uninsulated model, we see that both the peak current densities and the ratio R AC - 2 D / R DC - 2 D are substantially reduced, highlighting the insulating layer’s efficacy in mitigating skin and proximity effects.

3.3. Insulated 5-Segment Cable (100 μ m)

Figure 14 presents the current density distribution J across the five-segment cable when each conductor is surrounded by a 100 μ m insulation layer at 50 Hz . As with the 75 μ m model, insulation restricts inter-strand eddy currents and smooths out the current density profile. However, comparing these results with the thinner insulation case reveals a slightly more pronounced reduction in skin and proximity effects, albeit with diminishing additional benefit.
As shown in Figure 14, two distinct paths (Path 1 and Path 2) are defined to track the current density throughout the cross-section. Figure 15a portrays J (blue) versus distance along Path 1, while Figure 15b does the same for Path 2. In both plots, the purple line indicates the DC current density J DC . Across both paths, the AC current distribution remains close to J DC , indicating that the 100 μ m insulation is highly effective in limiting eddy current loops.
Figure 16 further assesses the degree of insulation effectiveness by plotting the normalized ratio J / J DC along the same two paths. Values near unity reveal that skin and proximity effects are strongly suppressed, with only slight deviations above 1.0, reflecting localized eddy currents. Overall, these normalized plots reinforce the observation that any current crowding is minimal compared to an uninsulated design.
Table 4 presents the numerical outcomes for the 100 μ m insulated cable across several frequencies. Compared to the 75 μ m insulated model, the data exhibit marginally lower maximum current densities and lower R AC - 2 D / R DC - 2 D ratios. While these improvements are incremental, they affirm the beneficial impact of increasing insulation thickness on suppressing skin and proximity effects, up to a point of diminishing returns.
In the magnetic flux map of Figure 17, the flux lines appear less concentrated at conductor boundaries than in the uninsulated arrangement. This milder gradient stems from reduced inter-conductor currents, confirming that the thicker insulation isolates the strands more effectively. As a result, the magnetic coupling driving proximity effects is weakened.

4. Discussion

The results clearly demonstrate that insulating each conductor string within a multi-segment cable effectively suppresses skin and proximity effects.

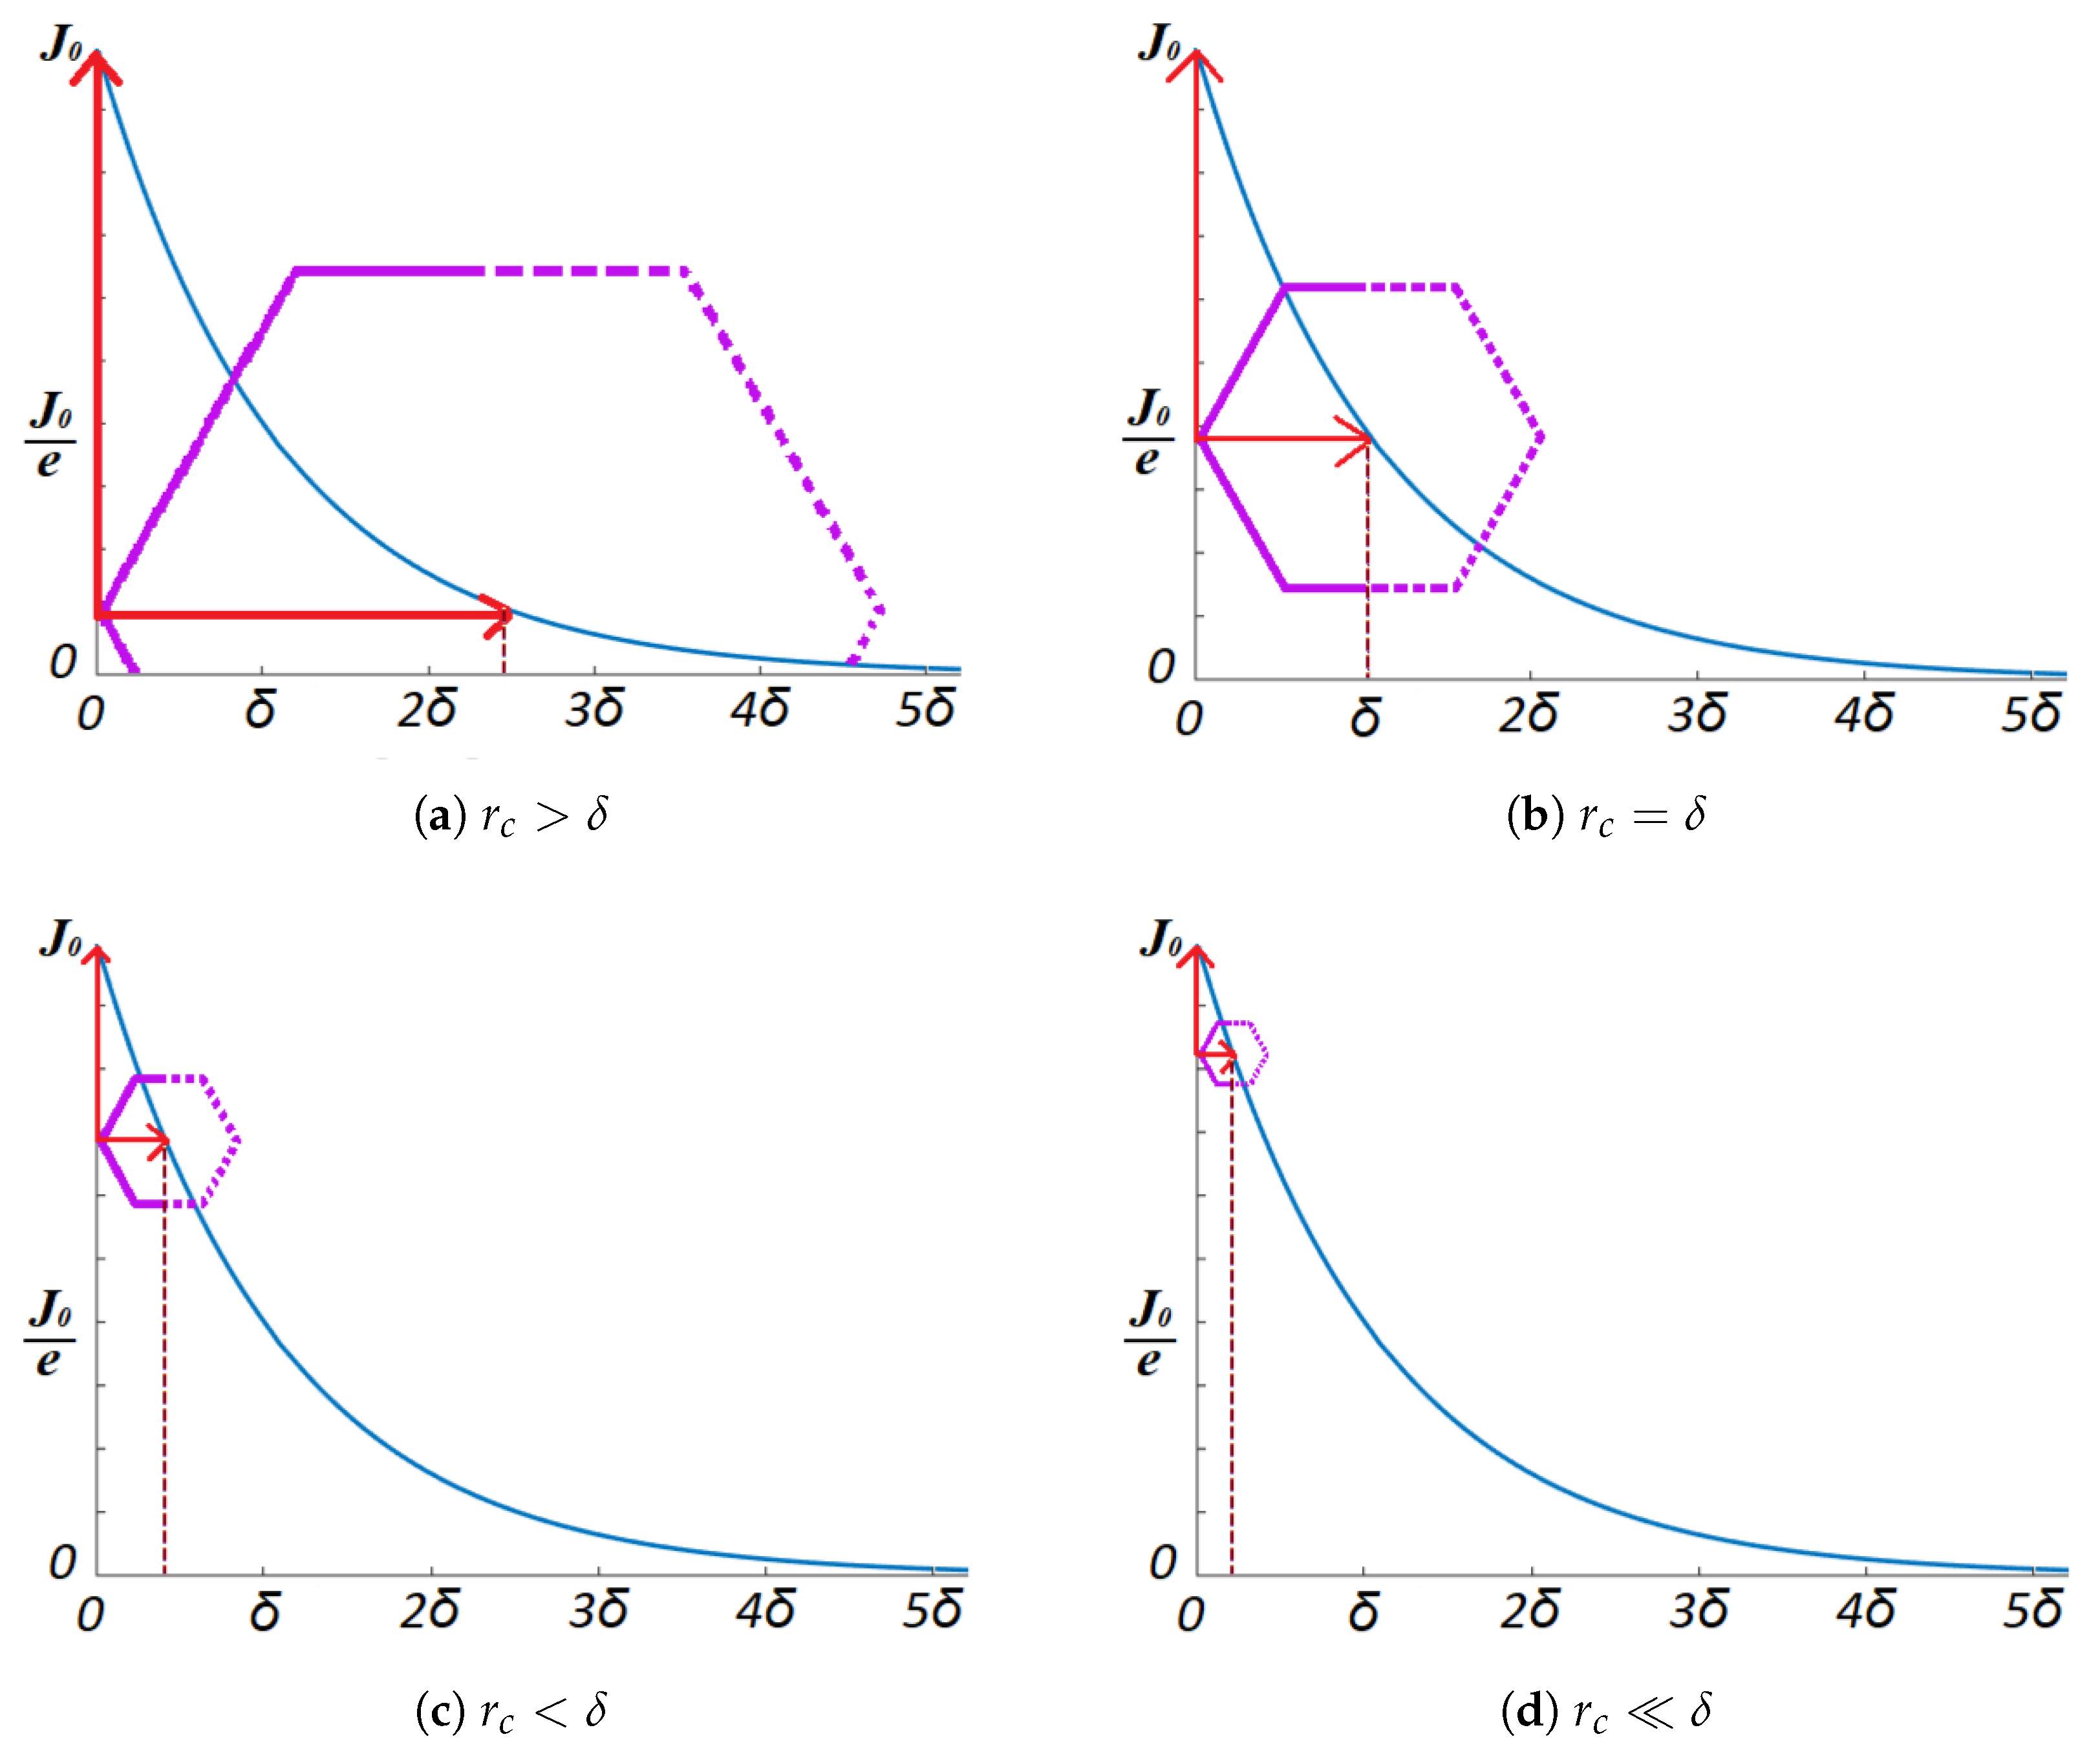
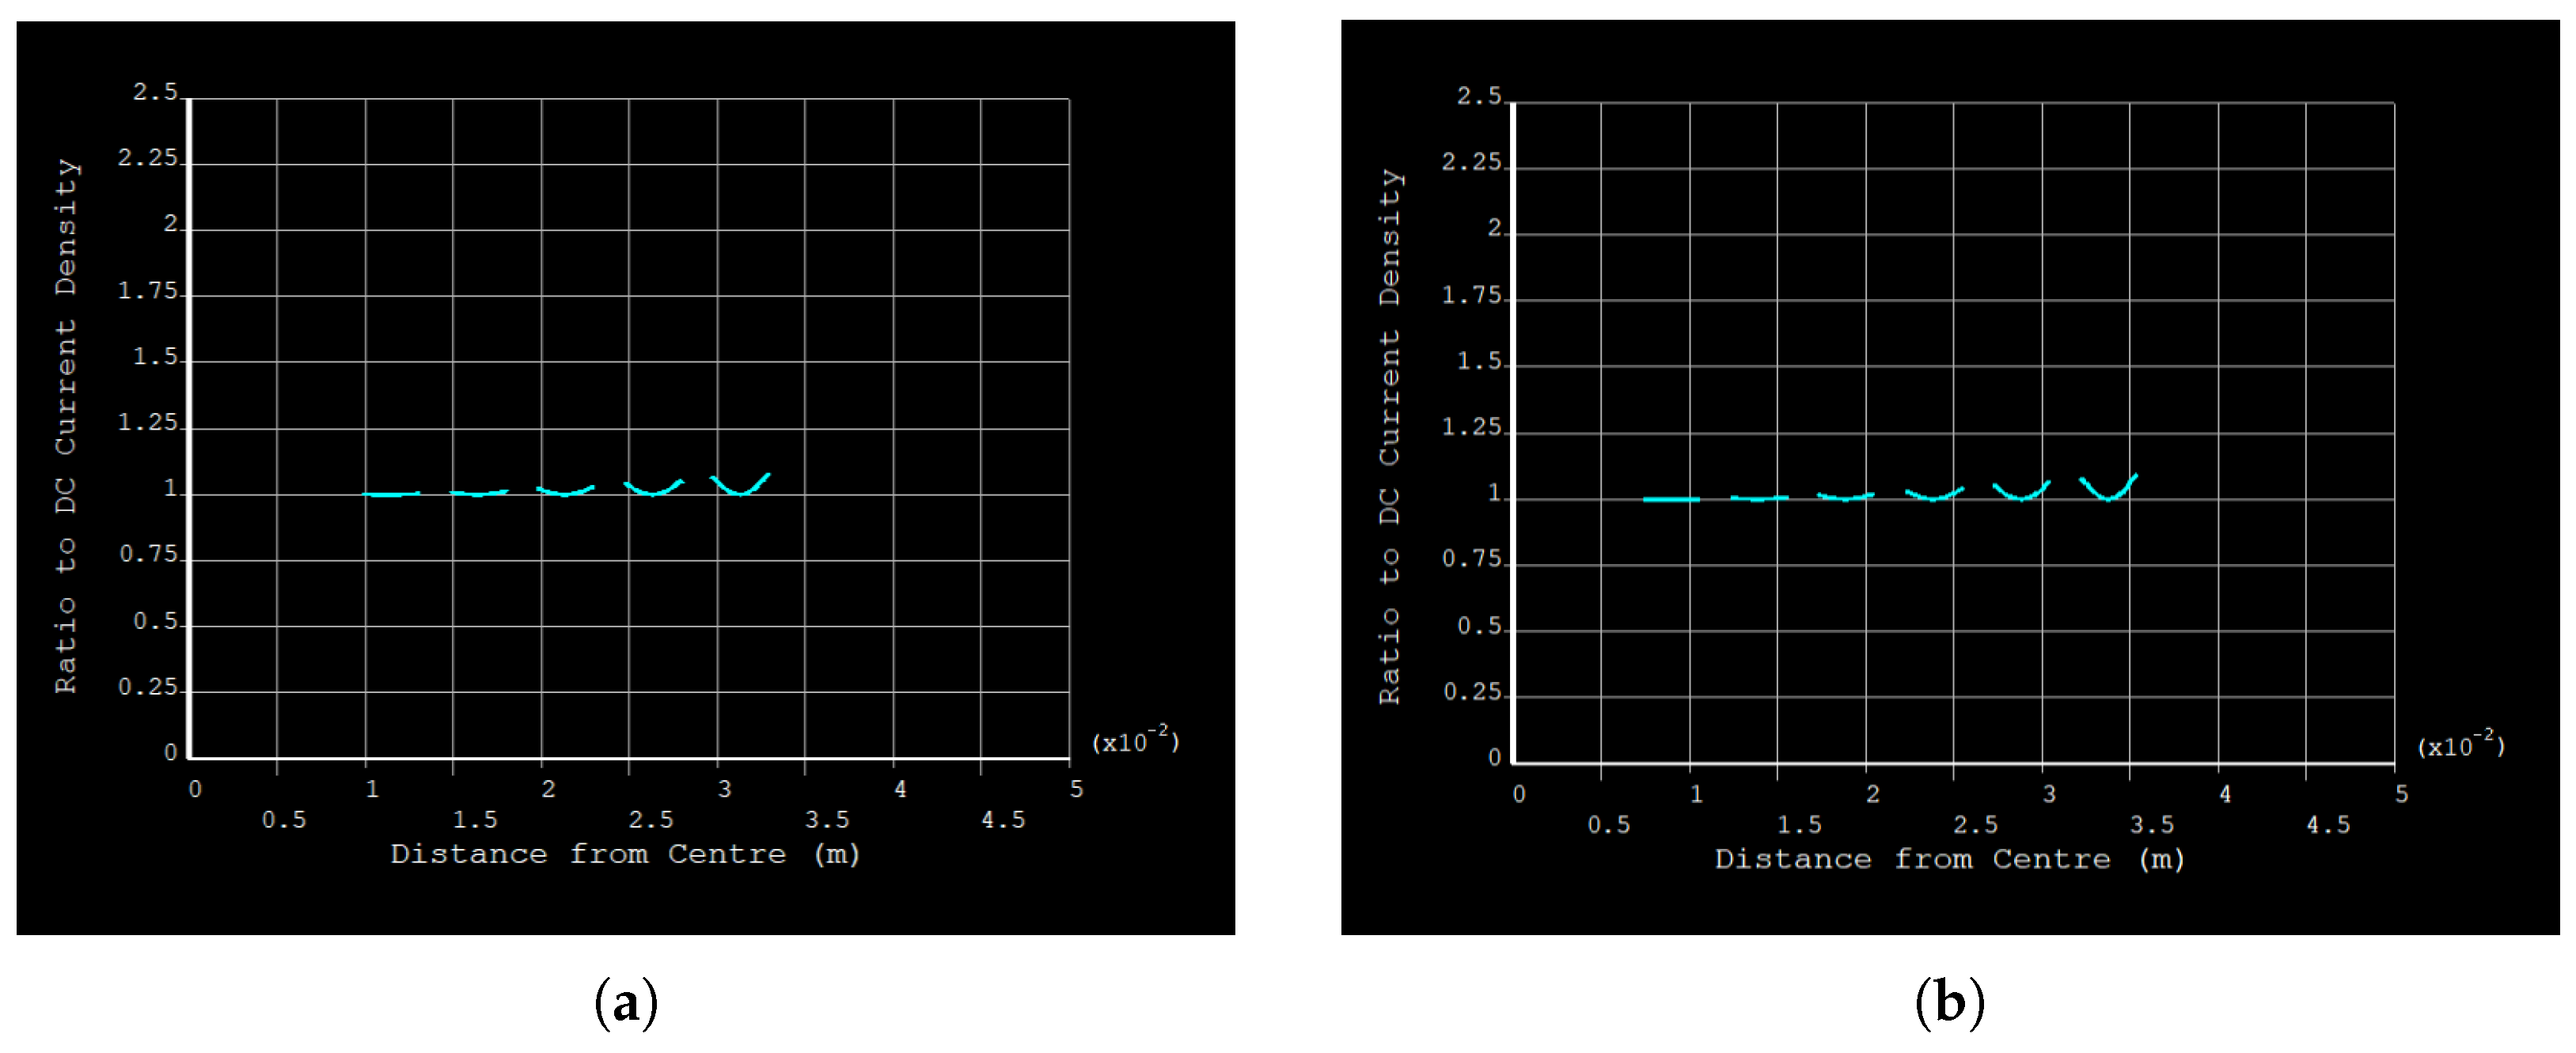
4.1. Skin and Proximity Loss Reduction

Compared to the uninsulated five-segment model, the R ac / R dc ratio for the insulated designs is substantially reduced at all frequencies tested, as shown in Table 5 At 50 Hz, it drops from 1.74 in the uninsulated case to approximately 1.02 with either 75 or 100 μ m insulation. Even at higher harmonics (150 Hz, 250 Hz), the insulated models maintain R ac / R dc < 1.50 , whereas the uninsulated cable approaches 3.66 at 250 Hz. Such dramatic attenuation of AC losses arises because each conductor string is forced to carry the current only within its own cross-section, preventing large eddy-current loops spanning multiple strings.

4.2. Insulation Thickness and Diminishing Returns

While thicker insulation ( 100 μ m) offers slightly better suppression of eddy currents than the 75 µm configuration, the difference is marginal. Beyond a certain thickness, further improvements do not justify the additional cost and complexity. For many practical applications, 75 μ m of insulating layer may suffice to achieve near-optimal performance in mitigating high-frequency losses.

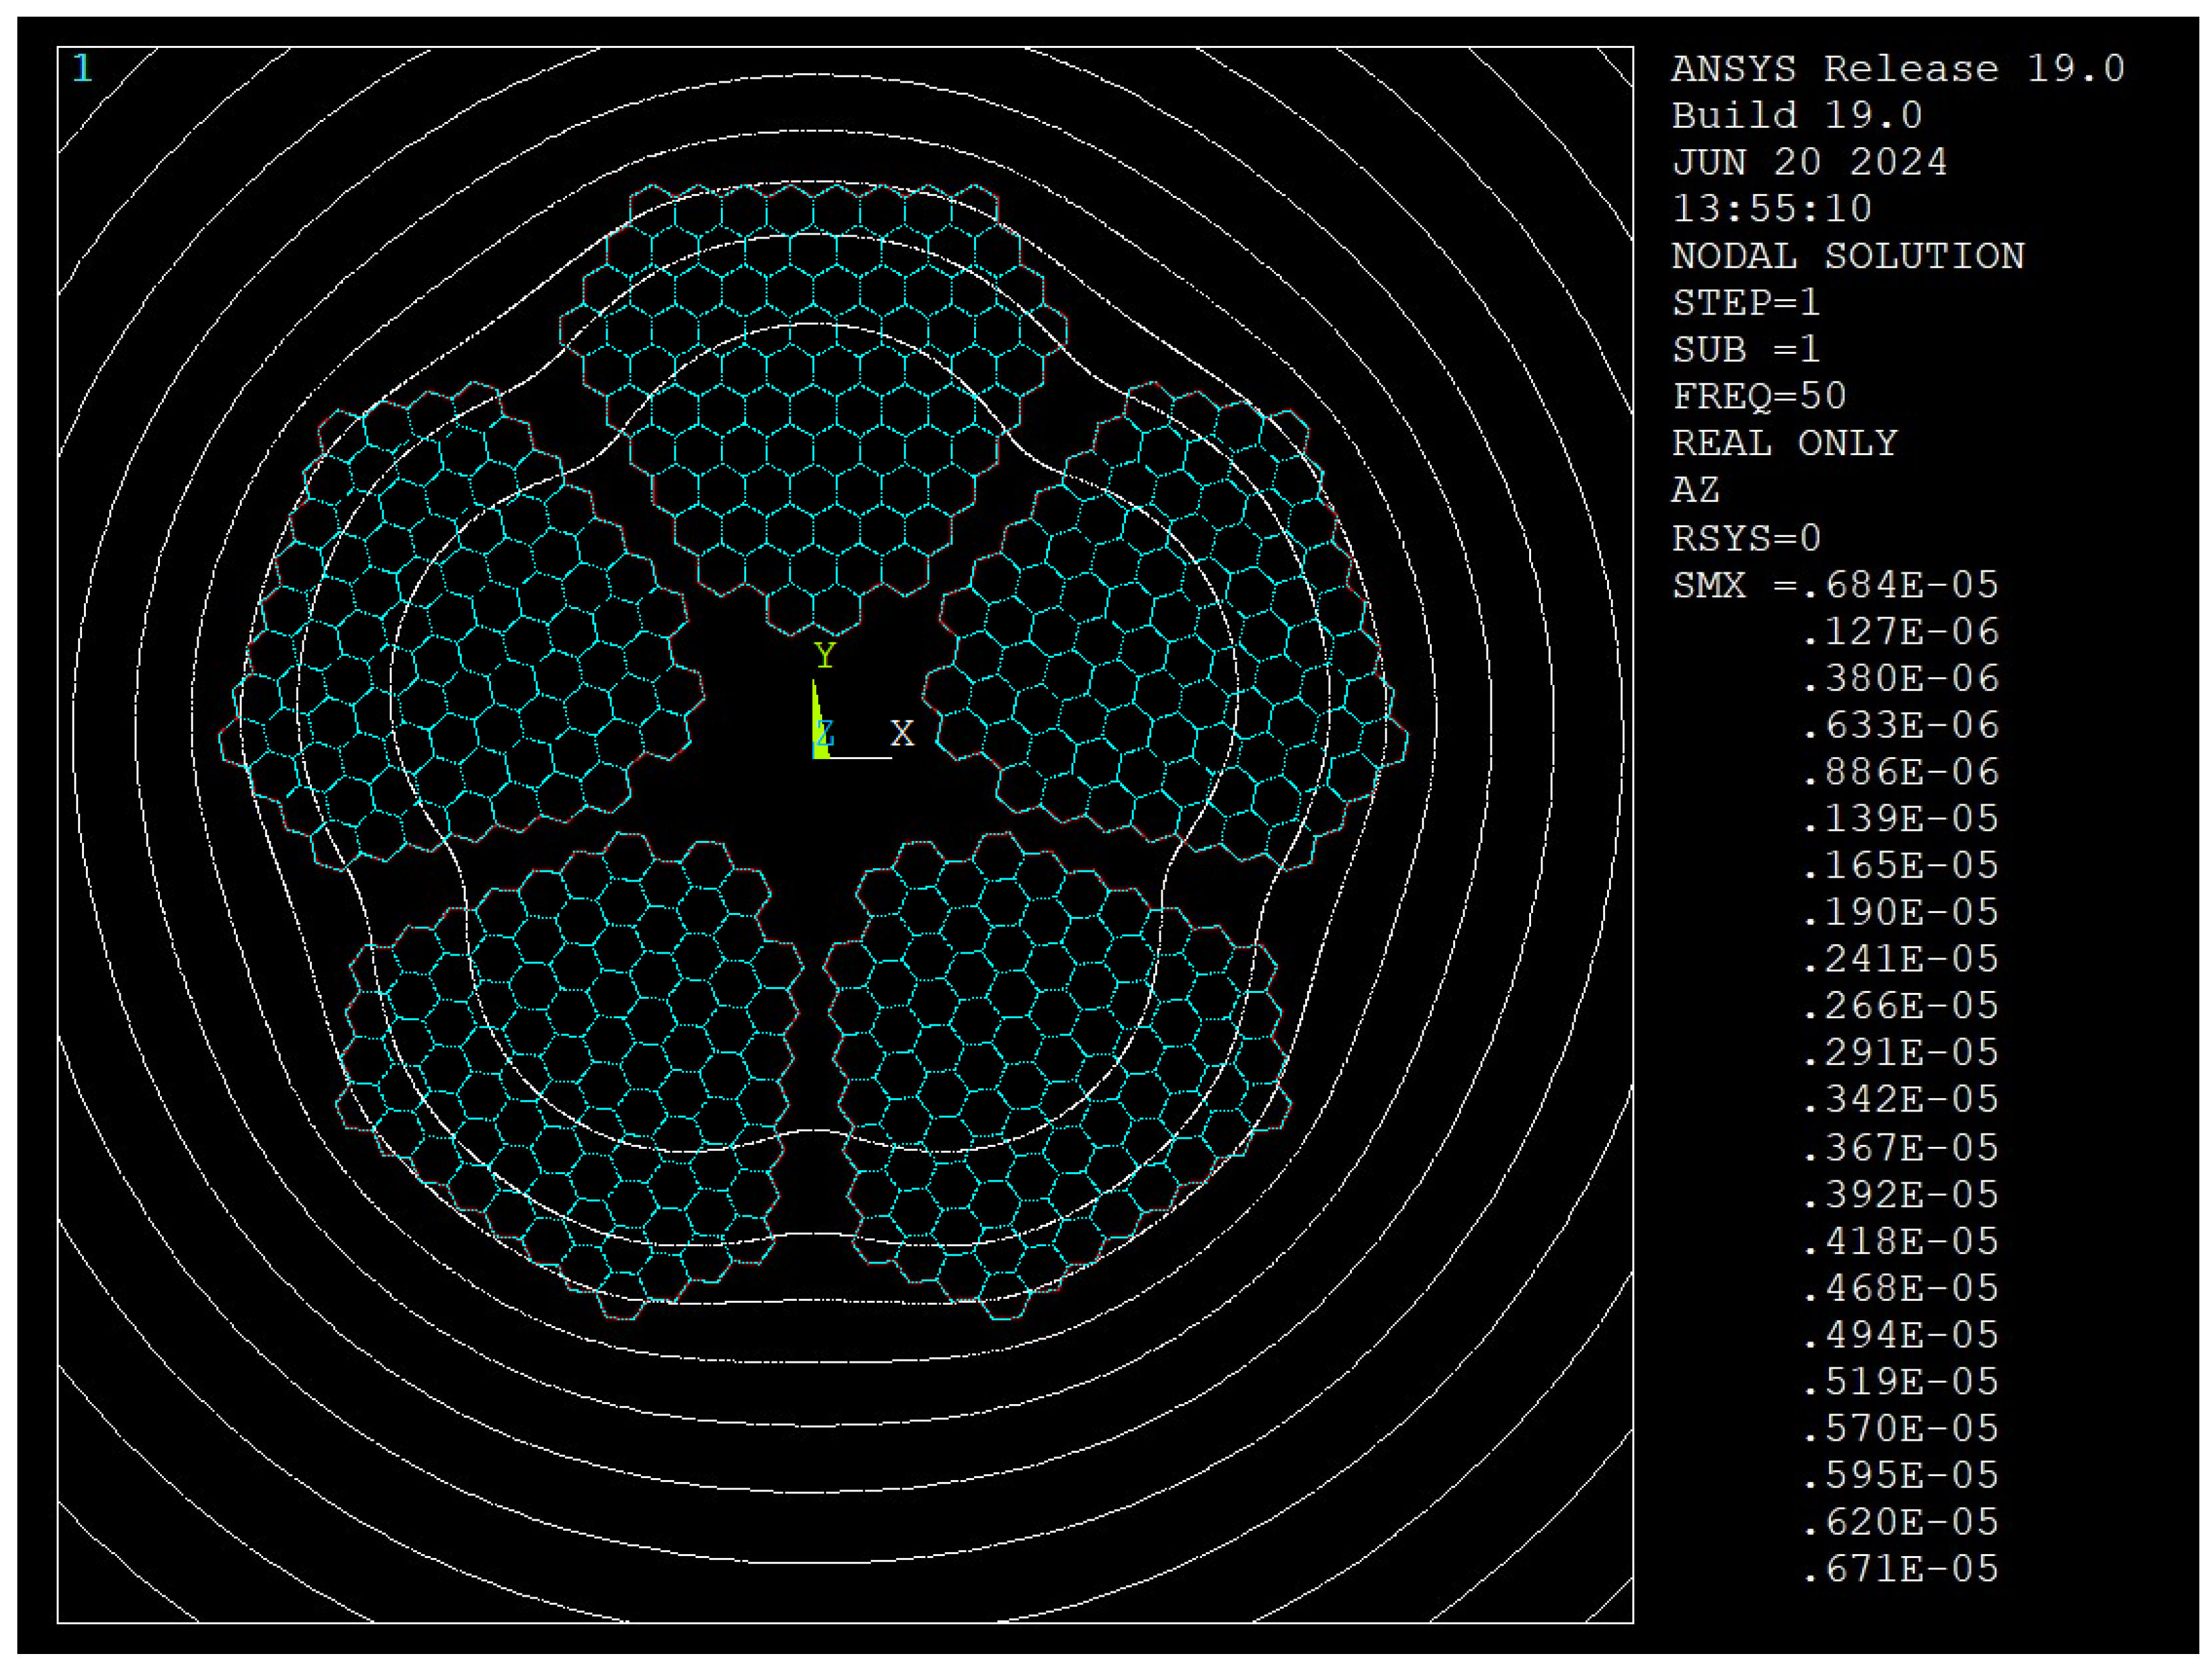
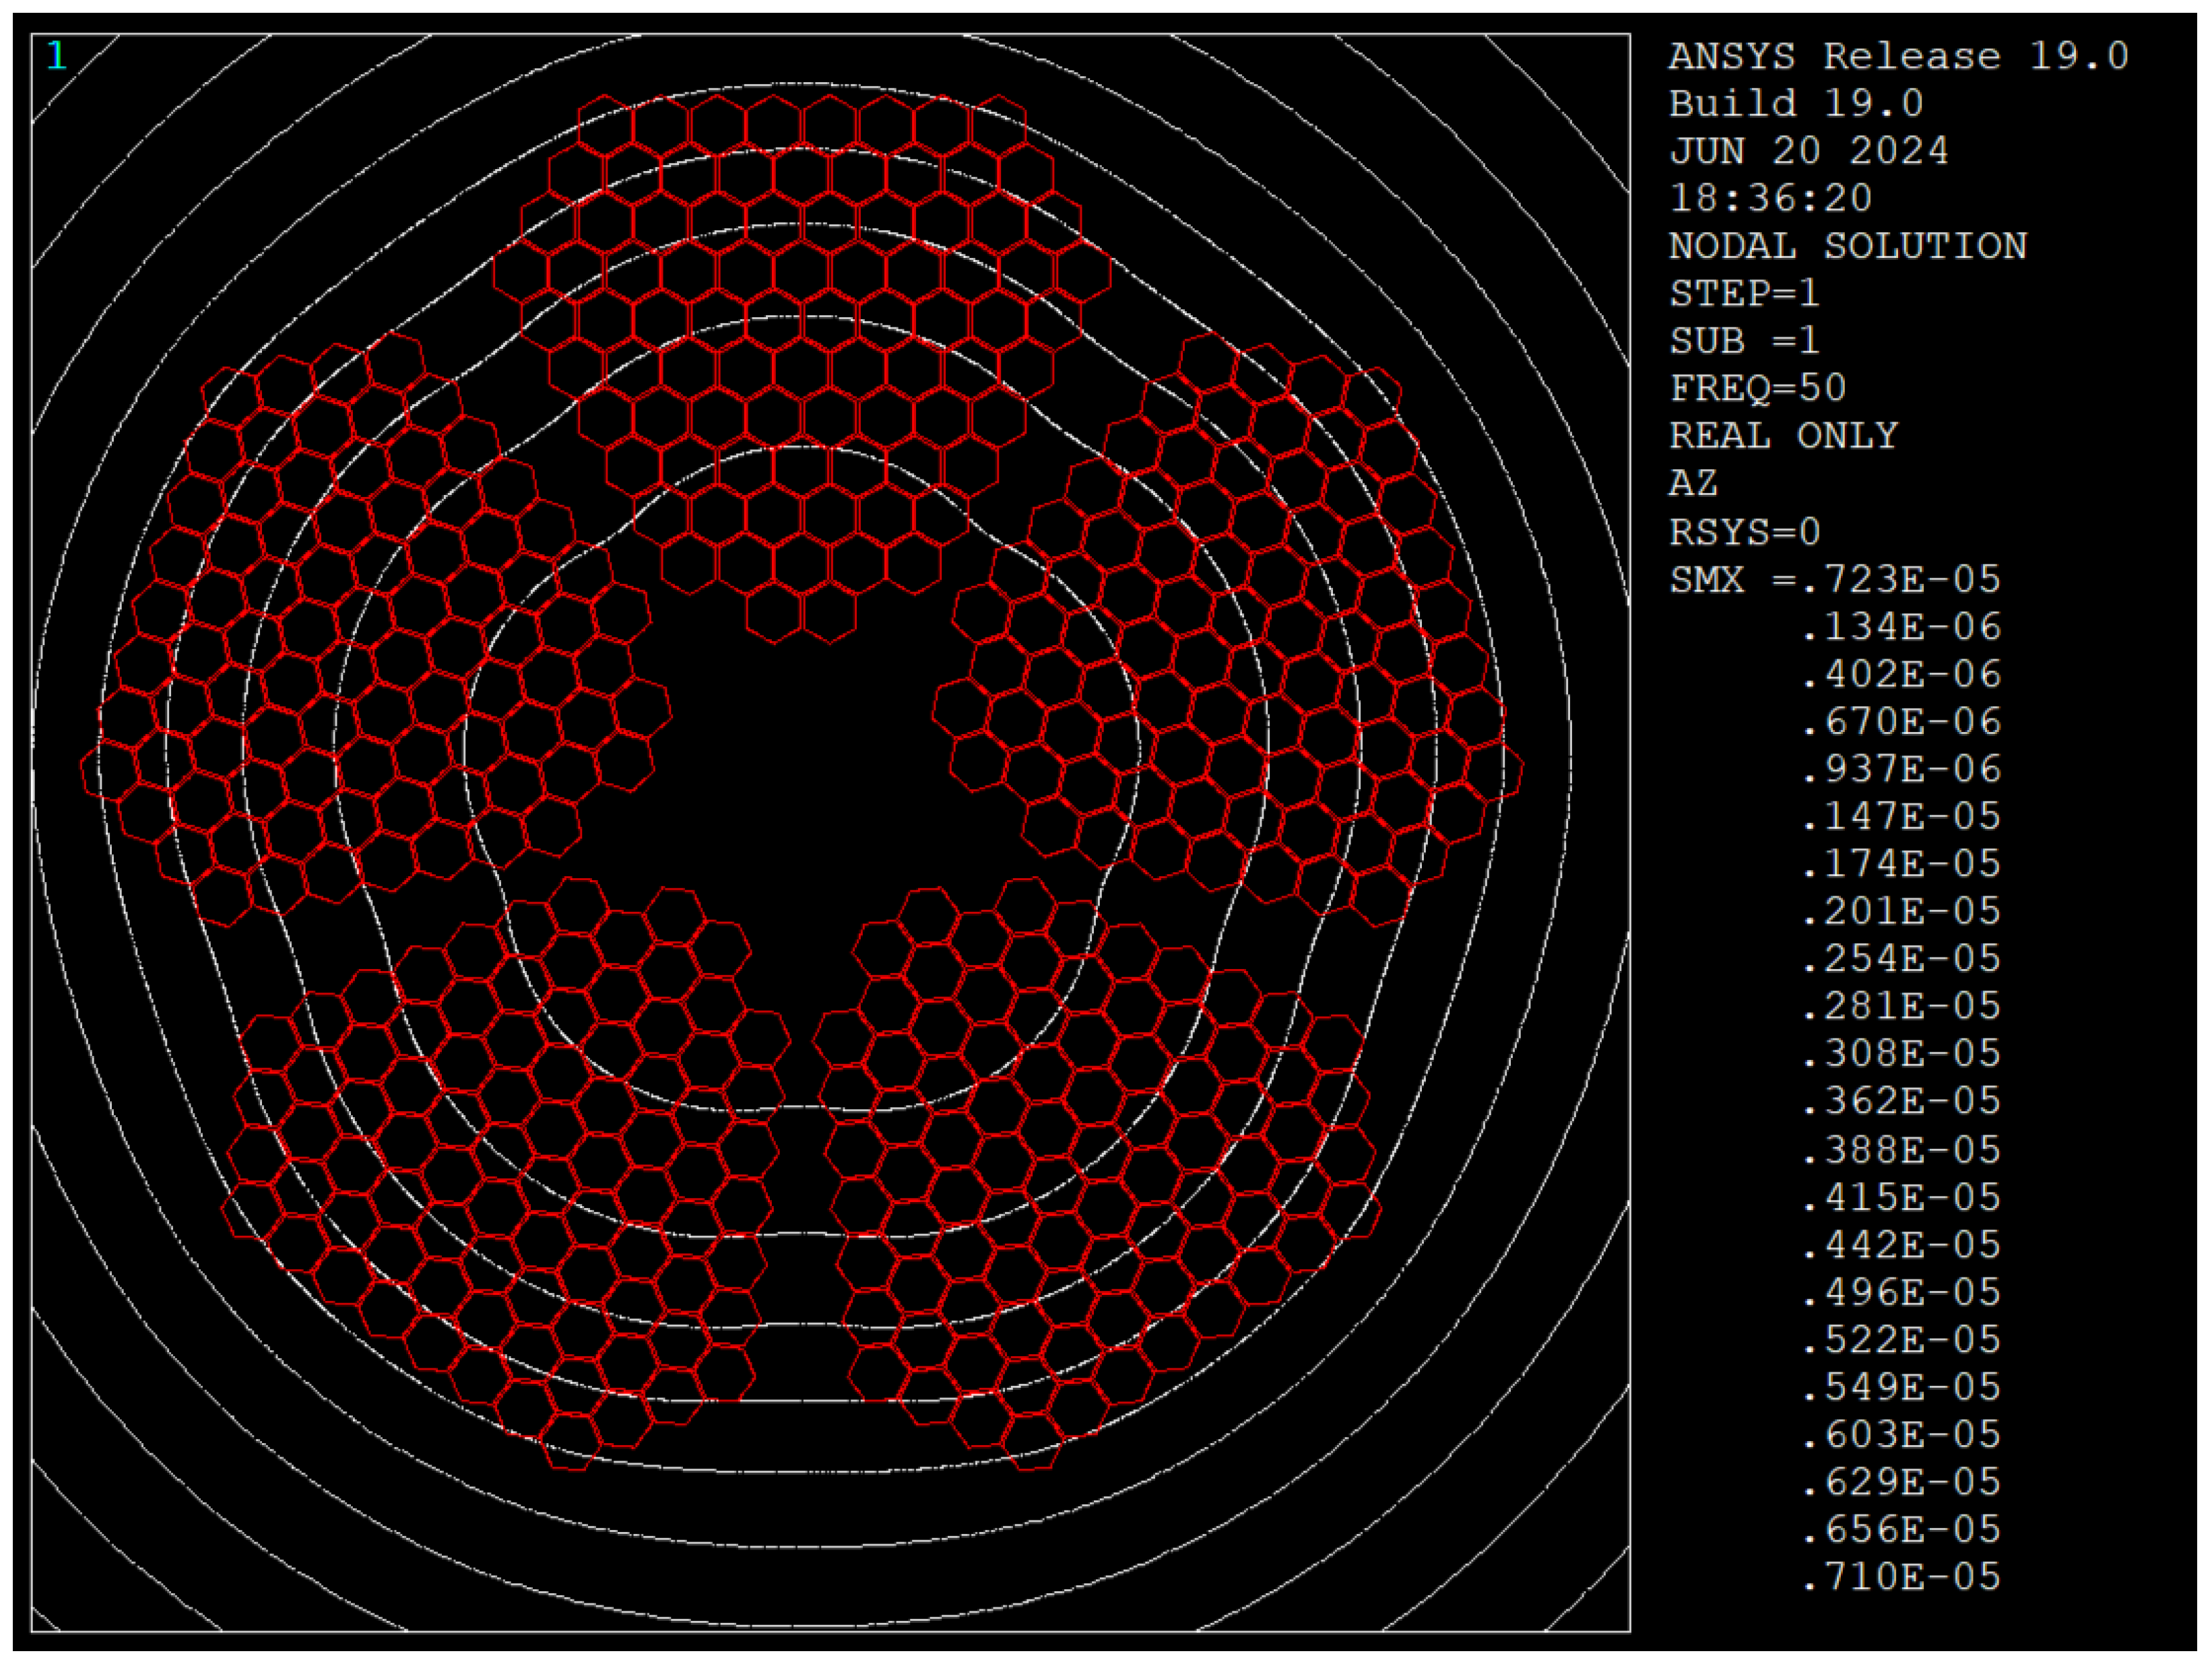
4.3. Comparison of Magnetic Flux Distributions

To visualize how insulation thickness influences electromagnetic coupling, Figure 18 juxtaposes the magnetic flux lines in the uninsulated cable and two insulated cables (75 µm and 100 µm). Each subfigure is shown at 50 Hz , highlighting the degree of flux line concentration in different regions of the cable cross-section.
In the uninsulated configuration (Figure 18a), flux lines converge densely around each segment’s outer edges, signifying strong inter-strand coupling and hence enhanced proximity effects. In contrast, both insulated models show more uniformly spaced flux lines, with fewer regions of high magnetic intensity. This weakened magnetic coupling results from the air gap that restricts direct electrical paths between strands, thereby curtailing eddy currents.
Comparing 75 µm insulation (Figure 18b) with 100 µm insulation (Figure 18c) indicates a further reduction in magnetic field crowding, albeit less pronounced. This observation suggests a trend of diminishing returns: once conductor separation is sufficient to decouple strands electromagnetically, additional thickness brings marginal improvements. In both insulated cases, the diminished concentration of flux lines, particularly at segment interfaces, helps suppress skin and proximity losses by preventing large circular eddy currents.
These comparative flux distributions confirm that one practical strategy for mitigating skin and proximity effects is to maintain a sufficiently diffuse magnetic field profile across the cable cross-section. Ensuring that flux lines are not concentrated in localized areas reduces the intensity of eddy currents, leading to lower AC losses and improved overall efficiency in high-voltage underground cables.

4.4. Model Validation at 50 Hz

Our uninsulated five-segment configuration is identical in geometry to that used in [23] for a 400 kV Milliken-type cable. In the work, authors compared simulated results with experimental measurements and reported a reliable correlation between finite element (FE) predictions and actual power loss data. Using the same geometry and operating frequency of 50 Hz, our model yields an R AC / R DC ratio within 2% of the values presented in [23], thus reinforcing the validity of our simulation methods. This close agreement at 50 Hz provides confidence that the FE approach accurately captures the key electromagnetic phenomena of skin and proximity effects in segmented high-voltage cables, even before introducing interstrand insulation.

4.5. Potential Energy and Cost Savings

To gauge the practical benefits of the proposed insulated cable design, we can compare its power losses against those of an uninsulated reference over a 1 km length operating at a high load current typical of UK transmission. For illustration, our simulations at 50 Hz consider a 1000 A scenario; while this value is representative, actual operating currents for 275–400 kV cables can range roughly from 800 A to well over 2000 A, depending on the conductor size, insulation type, and installation conditions [30,31]. Many modern extruded high-voltage cables in the UK thus fall within this range. Nevertheless, choosing 1 kA as a reference load provides a clear benchmark for quantifying losses, and the associated figures can be readily scaled for cables operating at higher or lower currents.
For instance, an uninsulated, five-segment cable rated at 1000 A might dissipate approximately 1.11 mW/m per phase when extrapolated from the 10 A base case (i.e., a 1000 A load increases losses by a factor of ( 1000 / 10 ) 2 = 10 , 000 ). By contrast, our insulated design (with 75 µm inter-strand insulation) shows around 0.65 mW/m under the same conditions—yielding a net difference of 0.46 mW/m. (All figures here are approximate extrapolations from the finite element data in Section 3 and assume continuous full-load operation). When scaled to 1000 A, this loss gap translates to about 4.6 kW/km of continuously operated cable. Over a year, an insulated cable saves ∼ 4.6 kW × 8760 h 40 MWh of energy per kilometre.
At average wholesale electricity prices of about GBP 100–150 per MWh [32], this corresponds to annual savings in the range of GBP 4000–6000 per kilometer. Actual figures vary with load profiles, cable design, and market volatility, but the principle stands: reducing losses through insulating each conductor strand can yield tangible economic benefits. According to National Grid data, the UK high-voltage grid includes thousands of circuit-kilometers of underground cables at 275 kV and 400 kV levels [33]. Even if only 1000 km of heavily loaded cable was replaced or newly installed with the proposed design, total yearly savings could plausibly reach several million pounds. On a global level, the International Energy Agency has noted significant growth in underground HV infrastructure, driven by urban development and environmental considerations [34]. The widespread adoption of strand-insulated conductors could thus deliver considerable aggregate energy and cost savings worldwide, alongside benefits such as reduced thermal stress and lower greenhouse gas emissions.

5. Conclusions

In this work, a two-dimensional finite element analysis was conducted to investigate skin and proximity losses in a five-segment high-voltage cable under different insulation scenarios. Key findings include:
  • Conductor Insulation Efficacy: Adding a thin insulating layer between conductor strings effectively disrupts large eddy current loops, leading to more uniform current distribution and significantly lower AC resistance. A 75 µm layer alone substantially reduces both skin and proximity effects.
  • High-Frequency Performance: At harmonic frequencies (150–250 Hz), the uninsulated cable’s R AC / R DC ratio can climb to 3.66, whereas the insulated versions remain below 1.50, underscoring the insulation’s resilience to higher-order harmonics.
  • Diminishing Returns: While increasing the layer thickness from 75 µm to 100 µm yields a small additional improvement, the marginal gains may not justify the added cost and manufacturing complexity.
  • Magnetic Flux Dynamics: Simulations confirm that uninsulated segments concentrate flux lines at conductor boundaries, whereas insulating each conductor diffuses these fields, reducing proximity losses.
  • Practical Value: Despite the potential challenges of integrating multiple thin insulation layers, the improved efficiency and reduced thermal stress make this approach well-suited to modern networks with a high harmonic content.
For a more complete understanding of insulation-based solutions, future investigations could include:
  • Thicker Insulation and Capacitance: Further study is needed to see whether thicker insulation can yield additional loss reductions, balanced against increased capacitance and potential mechanical complexities that may affect high-frequency performance.
  • Conductor Twisting and 3D Deformation: Considering conductor twisting may yield insights into how transposition interacts with electromagnetic phenomena. Three-dimensional modeling could also help capture mechanical stresses and deformations in greater detail.
  • Geometric Dependencies: Additional research on the relationship between total cable cross-section area, the cross-sectional area of individual conductor strings, and their arrangement could clarify how these geometric factors influence R AC / R DC .
This study confirms that strategically insulating individual conductor strings in multi-segment cables is a highly effective approach for mitigating skin and proximity losses, offering new design avenues for high-voltage underground cables in modern power systems.

Author Contributions

Conceptualization, S.A.; methodology, S.A. and S.H.K.; simulation, S.A.; validation, S.A. and S.H.K.; formal analysis, K.T.V.G.; writing—original draft preparation, S.A.; writing—review and editing, S.H.K. and K.T.V.G.; supervision, S.H.K. and K.T.V.G. All authors have read and agreed to the published version of the manuscript.

Funding

This research received no external funding.

Data Availability Statement

The data presented in this study are available in this article.

Acknowledgments

The authors thank City St George’s, University of London for providing research facilities.

Conflicts of Interest

The authors declare no conflicts of interest.

References

  1. Morgan, V.T. The Effects of Frequency on the Proximity Losses in Cable Conductors. IEEE Trans. Power Deliv. 1985, 4, 1282–1289. [Google Scholar]
  2. Tang, X.; Qiu, Y.; Zhao, F. Finite Element Modeling of Proximity Effect in Segmented High-Voltage Cables. IEEE Trans. Magn. 2018, 54, 1–8. [Google Scholar]
  3. Okamoto, R.; Matsui, H. Experimental Validation of Segmented Cable Designs for High-Frequency Loss Reduction. Appl. Sci. 2022, 12, 2330. [Google Scholar]
  4. Lee, K.; Dominguez, B. Assessment of Eddy Currents in Multi-Strand Cables under Compressive Contact. In Proceedings of the 2019 IEEE International Conference on Electrical Systems, Kremenchuk, Ukraine, 23–25 September 2019; pp. 102–107. [Google Scholar]
  5. Okonkwo, O.; Li, X. A Review of Modern Harmonic Distortion Sources in HV Systems. IEEE Access 2023, 11, 54839–54850. [Google Scholar]
  6. Sunde, E.D. Earth Conduction Effects in Transmission Systems; Dover Publications: New York, NY, USA, 1968. [Google Scholar]
  7. Gao, Y.; Huang, D.X.; Ren, W. Impacts of Strand Insulation Thickness on Skin Effect Mitigation in HV Cables: A 3D FEM Study. IEEE Trans. Magn. 2017, 53, 1–6. [Google Scholar]
  8. Zhang, L.; Funaki, T. Skin and Proximity Effects in High-Frequency High-Power Cables for Inverter Applications. IEEE Trans. Ind. Appl. 2011, 47, 2165–2174. [Google Scholar]
  9. Brandt, D.; Brown, K.L.; Kim, Y.S. Effect of Air-Gap Insulation on Eddy Current Suppression in Medium-Voltage Conductors. IEEE Trans. Power Deliv. 2021, 36, 2779–2788. [Google Scholar]
  10. Chang, Y.; Wang, K.; Klein, M. Analytical and Numerical Study of High-Frequency Conductor Losses in Segmented Power Cables. IEEE Trans. Ind. Electron. 2021, 68, 10974–10983. [Google Scholar]
  11. IEEE 519-2014; IEEE Recommended Practice and Requirements for Harmonic Control in Electric Power Systems. Institute of Electrical and Electronics Engineers: New York, NY, USA, 2014.
  12. EN 50160; Voltage Characteristics of Electricity Supplied by Public Distribution Systems. European Committee for Electrotechnical Standardization: Brussels, Belgium, 2010.
  13. Carter, M.; Li, G.; Sun, Z. Reducing Skin-Effect Losses in High-Voltage Cables Using Insulated Segments: A 2D FEM Analysis. Energies 2020, 13, 1641. [Google Scholar]
  14. Peterson, J.; Garcia, N. Proximity Effects in Bundled Cables: A Theoretical and Experimental Comparison. Energies 2020, 13, 2369. [Google Scholar]
  15. Song, H.; Liu, J.; Zhu, P. Analysis of Segmented Conductor Designs with Partial Insulation Layers for Reduced AC Resistance. Appl. Sci. 2022, 12, 5150. [Google Scholar]
  16. Shin, H.; Kim, S.; Choi, T.Y. Reduction of Skin Effect in Thick Conductors through Layered Insulation: Experimental Results. In Proceedings of the 2016 IEEE Energy Conversion Congress and Exposition (ECCE), Milwaukee, WI, USA, 18–22 September 2016; pp. 4663–4669. [Google Scholar]
  17. Kumar, A.; Said, M.P.; Goh, T.Y. Finite Element Investigation of Layered Insulation in MV Cables under Harmonic Loads. IEEE Trans. Ind. Electron. 2023, 70, 7512–7523. [Google Scholar]
  18. Roth, R.; Yat, P.S. High Voltage and Electrical Insulation Engineering; Wiley: Hoboken, NJ, USA, 2010. [Google Scholar]
  19. Garcia, M.; Rebollo, J.; del Rio, L.J. High-Frequency Modeling of Shielded Power Cables for Harmonic Current Analysis. IEEE Trans. Magn. 2015, 51, 1–9. [Google Scholar]
  20. Johansson, B.; Borsje, P.M. Influence of Layered Insulation on Current Density Distribution in Compact Power Conductors. IET Electr. Power Appl. 2019, 13, 1162–1170. [Google Scholar]
  21. Quercio, M.; Del Pino Lopez, J.C.; Grasso, S.; Canova, A. Numerical and Experimental Analysis of Thermal Behaviour of High Voltage Power Cable in Unfilled Ducts. Sci. Rep. 2024, 14, 1–16. [Google Scholar] [CrossRef] [PubMed]
  22. Ahmadi, S.; Khan, S.H.; Grattan, K.T.V. Impact of Twisting on Skin and Proximity Losses in Segmented Underground Cables: A 3D Finite-Element Study. Appl. Sci. 2025, 15, 2814. [Google Scholar] [CrossRef]
  23. Khan, S.; Grattan, K.T.V.; Attwood, J.R. Finite Element Modelling of Skin and Proximity Effects in High Voltage Power Cables. In Proceedings of the COMPUMAG, Evian, France, 2–5 July 2001; pp. 2–5. [Google Scholar]
  24. Ahmadi, S.; Khan, S.H.; Grattan, K.T.V. Two-Dimensional vs. Three-Dimensional FE Modeling of Skin and Proximity Effects in Segmented Cables with Parallel Conductors: A Comparative Study. Appl. Sci. 2025, 15, 2981. [Google Scholar] [CrossRef]
  25. Harrington, R.F. Time-Harmonic Electromagnetic Fields; McGraw-Hill Series in Electrical Engineering: New York, NY, USA, 2001. [Google Scholar]
  26. Balanis, C.A. Advanced Engineering Electromagnetics; John Wiley & Sons: Hoboken, NJ, USA, 2012. [Google Scholar]
  27. Zhao, H.; Li, W. Assessment of Low-Frequency Harmonic Distortion in Large Urban Power Grids. IET Gener. Transm. Distrib. 2022, 16, 2005–2013. [Google Scholar]
  28. Abdel Aleem, S.H.E.; Ibrahim, A.M.; Zobaa, A.F. Harmonic assessment-based adjusted current total harmonic distortion. J. Eng. 2016, 2016, 64–72. [Google Scholar] [CrossRef]
  29. Kraus, J.D. Electromagnetics, 4th ed.; McGraw-Hill: New York, NY, USA, 1991. [Google Scholar]
  30. CIGRÉ Study Committee B1. Technical Brochure 880: High Voltage Cables; CIGRÉ: Paris, France, 2021. [Google Scholar]
  31. European Network of Transmission System Operators for Electricity (ENTSO-E): Ten-Year Network Development Plan. 2021. Available online: https://annualreport2021.entsoe.eu/ (accessed on 1 March 2025).
  32. Wholesale Market Indicators. 2023. Available online: https://www.ofgem.gov.uk/ (accessed on 1 March 2025).
  33. Electricity Transmission Network Data. 2023. Available online: https://www.nationalgrid.com/uk/electricity-transmission (accessed on 1 March 2025).
  34. International Energy Agency. World Energy Outlook. 2023. Available online: https://www.iea.org/reports/world-energy-outlook-2023 (accessed on 1 March 2025).
Figure 1. Cross-section of the 5-segment cable without insulation layer. Segments themselves are electrically insulated. All units are in meters.
Energies 18 01605 g001
Figure 2. A single segment of the 5-segment cable, 3D view. The purple volumes highlight a slice that is further analysed in Figure 3.
Energies 18 01605 g002
Figure 3. Schematic of eddy current loops (red circles) in a slice of a segment of the cable.
Energies 18 01605 g003
Figure 4. Qualitative illustration of how the current density (blue lines) distribution changes with conductor radius (horizontal red arrows) r c relative to skin depth δ . The purple lines indicate the physical boundary of a conductor string. The beginning and end of the vertical red arrows represent the minimum (in the centre of the conductor) and maximum (at the skin of the conductor) of the current density, respectively.
Energies 18 01605 g004
Figure 5. (a,b) Introduction of an insulation layer d g / 2 (blue areas) between hexagon conductor strings (purple areas) circumscribed by a circle with radius r c .
Energies 18 01605 g005
Figure 6. Illustrative meshing strategy for the 5-segment cable with insulation in 2D FE analysis. A refined mesh (white boundaries) is visible within and around the conductors (purple areas). Blue areas are the insulating air.
Energies 18 01605 g006
Figure 7. Current density distribution J (A/m2) in the uninsulated 5-segment cable at 50 Hz .
Energies 18 01605 g007
Figure 8. Current density vs. distance form the uninsulated 5-segment cable center at 50 Hz .
Energies 18 01605 g008
Figure 9. Magnetic flux lines in the uninsulated 5-segment cable at 50 Hz . Closer spacing of lines near segment peripheries indicates stronger local magnetic fields.
Energies 18 01605 g009
Figure 10. Current density (J) for the 5-segment cable with 75 μ m conductor insulation at 50 Hz .
Energies 18 01605 g010
Figure 11. Current density J (blue) and DC reference J DC (purple) along two distinct paths, Path 1 (a) and Path 2 (b) through the 75 μ m insulated cable cross-section at 50 Hz .
Energies 18 01605 g011
Figure 12. Normalized current density J / J DC along Path 1 (a), and Path 2 (b) in the 75 μ m insulated cable at 50 Hz . Ratios near 1.0 indicate a uniform distribution similar to the DC case.
Energies 18 01605 g012
Figure 13. Magnetic flux line distribution in the 75 μ m insulated 5-segment cable at 50 Hz . Weaker flux intensities underscore the reduced proximity effect.
Energies 18 01605 g013
Figure 14. Current density (J) for the 5-segment cable with 100 μ m conductor insulation at 50 Hz .
Energies 18 01605 g014
Figure 15. Current density J (blue) and DC reference J DC (purple) along two distinct paths, Path 1 (a) and Path 2 (b), for the 100 μ m insulated cable at 50 Hz .
Energies 18 01605 g015
Figure 16. Normalized current density J / J DC for Path 1 (a) and Path 2 (b) in the 100 μ m insulated cable at 50 Hz . Ratios near 1.0 indicate minimal skin or proximity distortion.
Energies 18 01605 g016
Figure 17. Magnetic flux line distribution in the 100 μ m - nsulated 5-segment cable at 50 Hz . Reduced flux-line density near conductor surfaces indicates diminished eddy current interactions.
Energies 18 01605 g017
Figure 18. Side-by-side comparison of the magnetic flux lines at 50 Hz .
Energies 18 01605 g018
Table 1. Material Properties Used in Simulations.
Material μ r ρ ( Ω · m ) σ ( S / m )
Copper1 1.7241 × 10 8 5.8001 × 10 7
Air1 1.0 × 10 10 1.0 × 10 10
Table 2. Electrical Performance of the Uninsulated 5-Segment Cable at Selected Frequencies.
Frequency
(Hz)
Min J
( A / m 2 )
Max J
( A / m 2 )
P loss
( mW / m )
R AC - 2 D
( μ Ω /m)
R DC - 2 D
( μ Ω /m)
R AC - 2 D R DC - 2 D
03688.683688.680.63596.366.361.00
502352.709860.401.107411.076.361.74
150623.2118,433.401.831718.326.362.88
250174.8324,904.802.328123.286.363.66
Table 3. Electrical Performance of the 75 μ m Insulated 5-Segment Cable.
Frequency
(Hz)
Min J
( A / m 2 )
Max J
( A / m 2 )
P loss
( mW / m )
R AC - 2 D
( μ Ω /m)
R DC - 2 D
( μ Ω /m)
R AC - 2 D R DC - 2 D
03686.433686.430.63596.366.361.00
503686.434032.740.64856.486.361.02
1503668.506122.900.74857.496.361.18
2503632.708933.350.94799.486.361.49
Table 4. Electrical Performance of the 100 μ m Insulated 5-Segment Cable.
Frequency
(Hz)
Min J
( A / m 2 )
Max J
( A / m 2 )
P loss
( mW / m )
R AC - 2 D
( μ Ω /m)
R DC - 2 D
( μ Ω /m)
R AC - 2 D R DC - 2 D
03686.573686.570.63596.366.361.00
503686.574022.140.64816.486.361.02
1503669.736059.950.74497.456.361.17
2503636.138813.770.93789.386.361.47
Table 5. Comparison of R AC / R DC for Different Models at Selected Frequencies.
Frequency (Hz)Uninsulated 75 μ m Insulation 100 μ m Insulation
01.001.001.00
501.741.021.02
1502.881.181.17
2503.661.491.47
Disclaimer/Publisher’s Note: The statements, opinions and data contained in all publications are solely those of the individual author(s) and contributor(s) and not of MDPI and/or the editor(s). MDPI and/or the editor(s) disclaim responsibility for any injury to people or property resulting from any ideas, methods, instructions or products referred to in the content.

