Article

Optimal Protection Coordination for Grid-Connected and Islanded Microgrids Assisted by the Crow Search Algorithm: Application of Dual-Setting Overcurrent Relays and Fault Current Limiters

by
Hossien Shad
1,
Hamid Amini Khanavandi
1,
Saeed Abrisham Foroushan Asl
1,
Ali Aranizadeh
2,
Behrooz Vahidi
2 and
Mirpouya Mirmozaffari
3,*
1
Department of Electrical Engineering, Islamic Azad University, Saveh Branch, Saveh 14778-93855, Iran
2
Department of Electrical Engineering, Amirkabir University of Technology (Tehran Polytechnic), Tehran 3715879817, Iran
3
Department of Industrial Engineering, Dalhousie University, 5269 Morris Street, Halifax, NS B3H 4R2, Canada
*
Author to whom correspondence should be addressed.
Energies 2025, 18(7), 1601; https://doi.org/10.3390/en18071601
Submission received: 20 February 2025 / Revised: 12 March 2025 / Accepted: 21 March 2025 / Published: 23 March 2025
(This article belongs to the Section A1: Smart Grids and Microgrids)

Abstract

:
This paper introduces a two-stage protection coordination framework designed for grid-connected and islanded microgrids (MGs) that integrate distributed generations (DGs) and energy storage systems (ESSs). The first stage focuses on determining the optimal location and sizing of DGs and ESSs within the islanded MG to ensure a stable and reliable operation. The objective is to minimize the combined annual investment and expected operational costs while adhering to the optimal power flow equations governing the MG, which incorporates both DGs and ESSs. To account for the inherent uncertainties in load and DG power generation, scenario-based stochastic programming (SBSP) is used to model these variations effectively. The second stage develops the optimal protection coordination strategy for both grid-connected and islanded MGs, aiming to achieve a rapid and efficient protective response. This is achieved by optimizing the settings of dual-setting overcurrent relays (DSORs) and determining the appropriate sizing of fault current limiters (FCLs), using operational data from the MG’s daily performance. The goal is to minimize the total operating time of the DSORs in both primary and backup protection modes while respecting critical constraints such as the coordination time interval (CTI) and the operational limits of DSORs and FCLs. To solve this complex optimization problem, the Crow Search Algorithm (CSA) is employed, ensuring the derivation of reliable and effective solutions. The framework is implemented on both 9-bus and 32-bus MGs, demonstrating its practical applicability and evaluating its effectiveness in real-world scenarios. The proposed method achieves an expected total daily relay operation time of 1041.36 s for the 9-bus MG and 1282 s for the 32-bus MG. Additionally, the optimization results indicate a reduction in maximum voltage deviation from 0.0073 p.u. (grid-connected mode) to 0.0038 p.u. (islanded mode) and a decrease in daily energy loss from 1.0114 MWh to 0.9435 MWh. The CSA solver outperforms conventional methods, achieving a standard deviation of 1.13% and 1.21% for two optimization stages, ensuring high reliability and computational efficiency. This work not only provides valuable insights into the optimization of MG protection coordination but also contributes to the broader effort of enhancing the reliability and economic viability of microgrid systems, which are becoming increasingly vital for sustainable energy solutions in modern power grids.

1. Introduction

The primary challenge associated with microgrid (MG) operation is ensuring an effective protection scheme that safeguards the MG in both grid-connected and islanded modes by swiftly isolating only the affected portions of the system (Tejeswini et al., 2019) [1]. As MGs integrate increasing levels of distributed generation (DG), the complexity of protection coordination escalates, necessitating adaptive solutions that can distinguish between internal faults and external disturbances. Consequently, the coordination of protection devices, such as dual-setting overcurrent relays (DSORs) and fault current limiters (FCLs), plays a crucial role in optimizing protective solutions at both the network and MG levels (Chabanloo et al., 2018) [2]. The incorporation of fault current limiters in protection coordination strategies not only mitigates excessive fault currents but also enhances the reliability of the protection scheme by maintaining selective tripping sequences.
MGs typically operate in two modes: grid-connected and islanded. In the grid-connected mode, the upstream network serves as the primary backup energy source, ensuring system stability and supporting MG loads when local generation is insufficient. Conversely, in islanded operation, the MG relies entirely on local generation, including DG from renewable (RESs) and non-renewable energy sources (NRESs), as well as energy storage systems (ESSs) (Bukar & Tan, 2019) [3]. The intermittency of RESs, coupled with the variability of load demand, underscores the necessity for robust energy management strategies. Consequently, designing an optimal planning and operational framework is essential for ensuring the reliable performance of islanded MGs by determining the optimal placement, sizing, and scheduling of DGs and ESS. The ability to forecast renewable energy generation, coupled with dynamic load management, is instrumental in improving the resilience of MGs in isolated operation.
As microgrids continue to evolve into more decentralized and autonomous energy networks, the integration of advanced optimization techniques is becoming increasingly essential for enhancing protection, reliability, and efficiency. Approaches such as metaheuristic algorithms and artificial intelligence-based models offer promising solutions for managing the complexities of protection coordination and energy management. These techniques enable real-time decision making for relay coordination, adaptive protection settings, and optimized energy dispatch, allowing microgrids to respond dynamically to changing operating conditions. Additionally, hybrid Multi-Criteria Decision-Making (MCDM) frameworks provide a structured approach to evaluating sustainability considerations in microgrid planning, ensuring a balanced integration of technical, economic, and environmental factors. By leveraging these advanced computational methods, microgrids can achieve greater resilience, improved stability, and a more effective incorporation of renewable energy sources, ultimately supporting the transition toward smarter and more sustainable power systems. Such advancements not only improve fault detection and isolation but also enhance the overall adaptability of microgrid protection schemes. As a result, future microgrid systems can achieve higher efficiency and resilience, ensuring reliable power supply even under dynamic and uncertain conditions.
While significant progress has been made in microgrid protection and optimization, several critical challenges remain. One of the main gaps in current research is the development of adaptive protection coordination strategies that can dynamically adjust to changing operating conditions in both grid-connected and islanded modes. Many existing approaches struggle to balance the trade-offs between protection speed, selectivity, and cost-effectiveness, particularly in microgrids with a high penetration of renewable energy sources and energy storage systems. Furthermore, there is a growing need for optimization frameworks that effectively integrate real-time data and uncertainty modeling to enhance system resilience and operational efficiency.
To address these challenges, this study explores the following key research questions:
  • How can a comprehensive two-stage framework improve both the planning and protection coordination of microgrids to enhance reliability and efficiency?
  • What advantages do advanced optimization techniques, such as the Crow Search Algorithm, offer in improving protection schemes for both grid-connected and islanded microgrid operations?
  • How does the proposed framework compare to conventional methods in terms of relay operation time, energy loss reduction, and voltage stability under varying operating conditions?
By addressing these questions, this research aims to develop a more adaptive and resilient microgrid protection strategy that ensures operational reliability while supporting the broader transition toward smarter and more sustainable energy systems.

2. Literature Review

Several studies have addressed optimal protection coordination (OPC) and the expansion planning of MG sources, though often as separate research areas. For instance, Sharaf et al. (2018) [4] proposed an OPC scheme at the MG level using DSORs, optimizing relay settings to improve coordination. Their work highlights the need for adaptive relay settings that can adjust based on real-time grid conditions, ensuring that protection mechanisms remain effective despite changes in system topology. Similarly, the application of double-inverse overcurrent relay coordination at the distribution network level has been examined by Aghdam et al. (2019) [5] and Shad et al. (2022) [6]. These studies emphasize the importance of selecting appropriate relay characteristic curves to enhance selectivity while minimizing operation times.
Furthermore, transient stability constraints have been incorporated into OPC frameworks, as discussed in Aghdam et al. (2018) [7], while contingency-based approaches have also been explored (Najy et al., 2013) [8]. The integration of transient stability analysis into protection coordination ensures that MGs can withstand sudden disturbances without experiencing cascading failures. The OPC problem is generally formulated as a nonlinear programming (NLP) optimization challenge, addressed through conventional evolutionary algorithms. These approaches include genetic algorithms (GAs) (Alkaran et al., 2018) [9], fuzzy-based GAs (Baghaee et al., 2018) [10], and multi-objective particle swarm optimization (MOPSO) utilizing fuzzy decision-making tools (FDMTs). The use of multi-objective optimization techniques provides a balanced approach, allowing trade-offs between protection speed, selectivity, and fault tolerance to be systematically explored.
Additionally, various studies focus on the expansion planning of DGs and ESSs within distribution networks and MGs. Zhang et al. (2018) [11] proposed a robust planning model for DGs in MGs by employing optimization techniques under worst-case scenarios. Their research underscores the significance of considering extreme operating conditions to ensure MG resilience against unexpected disruptions. Khanavandi et al. (2024a) [12] introduced a single-level robust optimization framework for partitioning and planning active distribution networks (ADNs) into multiple MGs, aiming to minimize investment costs and maximize energy sales through an improved GA-based methodology. Their findings demonstrate that ADN partitioning can significantly enhance the operational efficiency of MGs by reducing power losses and improving fault isolation capabilities. In a complementary study, Khanavandi et al. (2024b) [13] presented a stochastic optimization model that partitions a distribution system into multiple MGs while minimizing costs and enhancing voltage stability, utilizing the Firefly Algorithm (FA) to account for renewable energy uncertainties. These methodologies highlighted the potential of intelligent optimization techniques in designing sustainable MG architecture that effectively balance economic and technical considerations.
The protection coordination scheme proposed by Tanha et al. (2024) [14] was based on minimizing relay operation time for both primary and backup protection modes across various fault locations. Their study introduced a novel approach to adaptive relay coordination that dynamically adjusts settings based on fault location and severity. Constraints include relay operation time calculations, coordination time limits, and the sizing of fault current limiters. Meanwhile, Maleki and Askarzadeh (2014) [15] addressed the optimal sizing of RESs, diesel generators, and ESSs in the Rafsanjan islanded MG. Their research emphasized the need for hybrid energy solutions that integrate multiple generation sources to enhance MG sustainability and cost-effectiveness. Further investigations by Arya (2019) [16] and Ozbak et al. (2024) [17] explored strategies for optimizing wind energy systems in MG applications. These studies underscored the importance of wind forecasting techniques in improving the efficiency of wind-based MGs, thereby reducing the reliance on backup energy sources.
Despite extensive research on OPC and the expansion planning of islanded MG sources, these aspects are often studied in isolation. Conventional evolutionary algorithms, such as GA and particle swarm optimization (PSO), have been widely employed to address these challenges. However, it remains critical for OPC at the MG level to integrate both grid-connected and islanded operation modes to achieve a secure and reliable protection framework [4]. Future research should focus on developing integrated frameworks that combine protection coordination with energy management strategies, ensuring seamless transitions between operating modes while maintaining system stability.
Ensuring the reliable operation of islanded MGs equipped with DGs and ESSs requires precise calculations of network variables before fault occurrences. This is facilitated by defining optimal expansion planning strategies for MG sources, which encompass selecting suitable locations and sizes for DGs and ESSs. Additionally, solving such large-scale problems necessitates robust optimization algorithms that ensure minimal solution variance and computational efficiency (Askarzadeh, 2016) [18]. The integration of artificial intelligence (AI) and machine learning (ML) techniques into MG protection and planning frameworks holds a significant promise for enhancing decision-making accuracy and adaptability. Recent related studies [19,20] further contributed to this area by addressing lifespan estimation and maintenance scheduling for MG equipment, highlighting the importance of long-term operational sustainability in power networks. Their research illustrated how predictive maintenance strategies, combined with condition-based monitoring, can substantially reduce operational costs and enhance equipment longevity.
A recent study conducted by Adewumi et al. (2022) [21] examined the impact of distributed ESSs on power quality in distribution and transmission networks, comparing distributed and centralized ESS architectures. Their finding demonstrated that distributed ESS integration, particularly in distribution networks with high consumer loads, effectively improved voltage regulation and aligns with the UK Grid Code’s 5% voltage compliance requirements.
In summary, while significant progress has been made in the domains of MG protection and expansion planning, future research should prioritize the development of holistic frameworks that integrate these aspects into a unified approach. The increasing penetration of renewable energy, coupled with advancements in optimization techniques and AI-driven decision making, presents new opportunities for improving MG resilience, reliability, and efficiency.
In response to the increasing complexity of protection coordination in microgrids (MGs), this paper introduces a two-stage optimal protection coordination (OPC) approach, designed to ensure a robust and reliable operation for both grid-connected and islanded MGs. This methodology integrates the optimal sizing and location of distributed generations (DGs) and energy storage systems (ESSs), leveraging dual-setting overcurrent relays (DSORs) and fault current limiters (FCLs) for protection.
The first stage of the proposed approach centers around the optimal expansion planning of DGs and ESSs, tailored to meet the energy demands of the islanded MG. The objective is to minimize total annual investment and expected operational costs while simultaneously considering critical constraints such as AC power flow, DG and ESS limitations, and the operational limits of the MG. By optimizing these parameters, the first stage establishes a foundation for a reliable island MG, ensuring that it can meet both current and future energy needs effectively.
The second stage builds upon the results from the first stage, defining the OPC at the MG level. Specifically, this stage focuses on determining the optimal setting parameters for DSORs and the appropriate reactance size of FCLs. The key objective is to minimize the expected operating time of DSORs in both primary and backup protective modes, considering current transformer interaction (CTI) constraints, DSOR setting limits, and the size constraints of FCLs. This optimization is critical to ensuring the protection system responds swiftly and selectively to faults, minimizing downtime and enhancing system resilience.
To address the inherent uncertainties associated with MG operations, particularly those arising from fluctuating loads and renewable energy generation, this paper incorporates a novel approach for modeling these uncertainties. Scenario generation and reduction methods are employed, using the Roulette Wheel Mechanism (RWM) and the Kantorovich method to model load uncertainty and the maximum active power from renewable energy sources (RESs). This enables a more accurate reflection of real-world MG performance under variable conditions. A solver based on the chaotic search algorithm (CSA) is introduced to find the most reliable and secure solution, minimizing standard deviation and ensuring that the optimization process remains computationally efficient.
The principal contributions of this research can be summarized as follows:
  • Development of a stochastic OPC approach for grid-connected and islanded MGs, incorporating the use of DSORs and FCLs for optimal protection coordination.
  • Establishment of a reliable islanded MG through the optimal expansion planning of DGs and ESSs, with the careful consideration of energy demand, operational limits, and cost minimization.
  • Implementation of a robust and secure solver for large-scale optimization problems, ensuring minimal standard deviation in the results and improving the reliability of the system.
  • Enhancement of OPC for DSORs by incorporating real-time daily data on load, generation, and storage parameters, allowing for dynamic adjustments that reflect the actual operational conditions of the MG.
  • Evaluation of OPC strategies that account for DGs and ESSs with optimal locations and sizes, addressing a key limitation in prior research that often relied on fixed sizes and locations for these components.
By presenting this comprehensive two-stage approach, this paper contributes to advancing the state-of-the-art in MG protection and planning. The integration of energy management, protection coordination, and real-time data optimization into a unified framework represents a significant step forward in ensuring the efficient, reliable, and sustainable operation of both grid-connected and islanded MGs. The proposed methodology not only enhances the resilience of MGs but also provides a practical solution to optimize the coordination of protection devices, ensuring system stability and reliability even in the face of renewable energy fluctuations and load variability.
So, by reviewing the references and stating the goals of each one, the summary of the work achieved and its comparison with the innovations of this paper are shown in Table 1.
The remainder of this paper is organized as follows: Section 3 presents a comprehensive overview of the two-stage model developed to address the OPC problem within MGs. This section outlines the key considerations and assumptions in formulating the problem, as well as the methodology employed to ensure effective protection coordination in both grid-connected and islanded modes. In Section 4, we provide a detailed description of the solution methodology, highlighting the steps involved in the optimization process, the algorithms used, and the novel aspects of the approach, including the incorporation of dynamic data inputs and the use of advanced optimization techniques. Section 5 and Section 6 offer the results of extensive numerical experiments, demonstrating the practical application of the proposed model. These sections explore the impact of various design choices on the performance of MGs, providing insight into the effectiveness and robustness of the proposed solution. Finally, Section 7 concludes this paper, summarizing the key findings and contributions, and offers suggestions for future research directions to further enhance OPC in MGs.

3. Proposed Problem Model

Figure 1 shows the flowchart for optimizing the location and sizing power sources in an islanded microgrid and the subsequent protection coordination. It outlines the steps in system parameter definition, optimization, and protection coordination using advanced algorithms.
Based on the suggested flowchart in Figure 1, the process begins with Stage 1, where the optimal location and sizing of islanded microgrid (MG) power sources were determined by defining system parameters, balancing power, and considering energy storage constraints. An objective function was used to minimize investment and operational costs while accounting for uncertainties in load and renewable generation. AC power flow equations were solved, and the locations and sizes of distributed generation (DG) units and energy storage systems (ESSs) were optimized. Stage 2 then focused on protection coordination, where input from Stage 1 was used to minimize relay operating times for primary and backup protection. Dual-setting relays were optimized, and protection coordination was ensured by applying coordination time interval (CTI) constraints and sizing fault current limiters. Short-circuit currents were calculated, and the CSA was employed to optimize the protection coordination strategy, completing the process.
Uncertainties in microgrid operations arise from various factors, such as fluctuations in renewable energy generation, changes in load demand, and unpredictable faults or disturbances. The intermittent nature of renewable energy sources, like solar and wind, creates challenges in maintaining a consistent and reliable power supply. These variations not only affect the power balance within the microgrid but also impact the effectiveness of protection coordination schemes. Traditional protection strategies often assume stable operating conditions, which can lead to miscoordination, unnecessary tripping, or delayed fault isolation when uncertainties are present. To address these challenges, it is essential to develop robust methodologies that can accurately model and adapt to these uncertainties, ensuring both reliability and operational efficiency.
In addition, incorporating uncertainties into microgrid protection optimization presents computational challenges, as conventional deterministic methods may fail to capture the full range of potential operating conditions. Advanced techniques, such as scenario-based stochastic programming (SBSP) and probabilistic modeling, provide effective solutions by accounting for variability in energy generation and demand patterns. These approaches help develop more resilient protection strategies that can adjust to real-time conditions, reducing operational risks. By integrating uncertainty-aware optimization frameworks, microgrid systems can achieve greater stability and efficiency, ensuring that relay coordination and fault isolation perform optimally under a variety of conditions.
To tackle these issues, this study explores the following research questions:
  • How can a comprehensive two-stage framework improve both the planning and protection coordination of microgrids to enhance reliability and efficiency?
  • What advantages do advanced optimization techniques, such as the Crow Search Algorithm, offer in improving protection schemes for both grid-connected and islanded microgrid operations?
  • How does the proposed framework compare to conventional methods in terms of relay operation time, energy loss reduction, and voltage stability under varying operating conditions?
By answering these questions, this research aims to contribute to the development of more adaptive and resilient microgrid protection strategies, supporting the transition toward smarter, more sustainable energy systems.
This section introduces the two-stage protection coordination problem, as illustrated in Figure 2. The first stage focused on determining the optimal locations and sizes of DGs and ESSs within an islanded MG, aiming to minimize investment and operational costs while satisfying the constraints of the islanded MG, DGs, and ESSs. In the second stage, optimal relay settings—such as pickup current (IP) and time dial setting (TDS) for dual-setting relays—and the sizing of FCL were calculated, based on minimizing relay operating time across various fault locations.

3.1. Optimal Location and Sizing of the Islanded MG Power Sources (First Stage)

The first stage of the proposed problem determines the optimal locations and sizes of DGs and ESSs in the islanded MG. This stage focuses on minimizing the total investment and operational costs, subject to AC power flow equations, as well as the constraints of DGs, ESSs, and MG operational limits. The problem is formulated in Equations (1)–(18), with detailed explanations provided in the following sections.

3.1.1. Objective Function

The objective function of the first-stage problem, as expressed in Equation (1), aims to minimize the investment and operational costs of DGs and ESSs. Specifically, the first and second terms in Equation (1) represent the annual investment costs for DGs and ESSs, respectively. Additionally, the third term accounts for the total expected annual operational costs associated with both DGs and ESSs.
min             Cos t = n N I C n D G C n D G + n N I C n E S C n E S + 365 × w S π w n N t S T λ n P n , t , w D G + ρ n c h P n , t , w E S c h + ρ n d c h P n , t , w E S d c h

3.1.2. Islanded MG Constraints

This section incorporates the AC power flow equations and MG operational limits, as outlined in Equations (2)–(5) and (6)–(7), respectively. Constraints (2) to (5) specifically address the active and reactive power balance between loads, DGs, and ESSs, as well as the calculation of active and reactive power flow through transmission lines [28,29]. Additionally, the islanded MG parameters, such as bus voltages and line power flows, are constrained by limits defined in Equations (6) and (7), respectively [30].
P n , t , w D G + P n , t , w E S d c h P n , t , w E S c h l N A n , l L P n , l , t , w L = P n , t , w D               n , t , w
Q n , t , w D G + Q n , t , w E S l N A n , l L Q n , l , t , w L = Q n , t , w D               n , t , w
P n , l , t , w L = g n , l V n , t , w 2 V n , t , w V l , t , w g n , l cos θ n , t , w θ l , t , w + b n , l sin θ n , t , w θ l , t , w                       n , l , t , w
Q n , l , t , w L = b n , l V n , t , w 2 + V n , t , w V l , t , w b n , l cos θ n , t , w θ l , t , w b n , l sin θ n , t , w θ l , t , w             n , l , t , w
P n , l , t , w L 2 + Q n , l , t , w L 2 S n , l L max                           n , l , t , w
V min V n , t , w V max                           n , t , w

3.1.3. DG Constraints

The DG constraints in this paper define the active power limits of RESs in Equation (8), the capacity limits of both RES and non-renewable energy sources (NRESs) in Equation (9) and the sizing limit for DGs in Equation (10). It is important to note that the term ϵ\epsilonϵ in Equation (10) represents the permissible overloading of the islanded MG provided by the DG, which is set at 10% [31].
P n , t , w D G = P ¯ n , t , w D G                           n N R E S , t , w
P n , t , w D G 2 + Q n , t , w D G 2 1 + ε C n D G                           n , t , w
0 C n D G   C ¯ n D G                         n
Z n D G = κ n 1 C ¯ n D G                   n

3.1.4. ESS Constraints

In this section, the energy stored in the ESS from 2:00 to 24:00 and at 1:00 is calculated using Equations (12) and (13), respectively. The ESS energy during the period from 2:00 to 24:00 is determined by the active power of charging and discharging, while, at 1:00, it equals the initial energy. Equation (14) defines the ESS energy limits based on its optimal sizing, while the charging and discharging rate limits are formulated in Equations (15) and (16) as functions of the ESS size (CES) and the charging/discharging duration (τ). Finally, the ESS charger and sizing limits are outlined in Equations (17) and (18), respectively. Similar to DGs, the term ϵ in Equation (16) accounts for the permissible overloading of the islanded MG by the ESS [31].
E n , t + 1 , w = E n , t , w + η n c h P n , t , w E S d c h 1 η n d c h P n , t , w E S c h                   n , t < 24 : 00 , w
E n , t , w = α × C n E S               n , t = 1 , w
α × C n E S E n , t , w 1 + ε C n E S             n , t , w
0 P n , t , w E S d c h τ × C n E S x n , t               n , t , w
0 P n , t , w E S c h τ × C n E S 1 x n , t               n , t , w
P n , t , w E S 2 + Q n , t , w E S 2 1 + ε × β × C n E S                           n , t , w
0 C n E S   C ¯ n E S                         n

3.1.5. Stochastic Programming

In the proposed problem, Equations (1)–(18), the active and reactive load parameters, PD and QD, along with the maximum RES active power, PDG, were treated as uncertain variables. To model this uncertainty, a scenario-based stochastic programming (SBSP) approach was employed, where the load was modeled using a normal probability distribution function (pdf) [32], and the maximum RES active power is represented by either a Beta or Weibull PDF [33]. The Roulette Wheel Mechanism (RWM) was used to generate scenario samples, while the Kantorovich method was applied to reduce the number of scenarios. Further details of this approach can be found in the study of [33,34,35].

3.2. Optimal Protection Coordination (Second Stage)

The protection coordination problem involves minimizing the expected operating time of dual-setting directional overcurrent relays, as formulated in Equation (19). The dual-setting relay includes both forward and reverse settings, which correspond to the relay’s role as primary and backup protection, respectively. The operating times for primary and backup protection were calculated using Equations (20) and (21), with decision variables TDSfw, TDSrv, IP_fw, and IP_rv. In these equations, A and B are time and current constants for the relay, set to 0.14 and 0.02, respectively [4].
Additionally, the CTI constraint is defined in Equation (22), which ensures that the time difference between the primary and backup protection operation is appropriately maintained. CTI is generally considered to be 0.3, as recommended in the study of [4]. The limits for decision variables such as the pickup current and time dial setting are presented in Equations (23) and (24), respectively.
Furthermore, the sizing limit for the FCL is outlined in Equation (25). The FCL was employed in this paper to reduce the short-circuit current at various fault locations within the MG. It is important to note that the relay operating time depends on the short-circuit current (Isc), as indicated in Equations (20) and (21). Algorithm 1 provides the method for calculating the Isc within the MG.
min             T = w , t π w c C i I j J t c , i , j , t , w P _ f w + k K t c , i , j , k , t , w B _ r v
t c , i , j , t , w P _ f w = T D S i f w A I c , i , j , t , w s c I i P _ f w B 1                     c , i , j , t , w
t c , i , j , k , t , w B _ r v = T D S i r v A I c , i , j , k , t , w s c I i P _ r v B 1                     c , i , j , k , t , w
t c , i , j , k , t , w P _ r v t c , i , j , t , w B _ f w C T I                     c , i , j , k , t , w
I ¯ i P I i P _ f w , I i P _ r v I ¯ i P                     i
T D S ¯ i T D S i f w , T D S i r v T D S ¯ i                   i
0 X F C L X ¯ F C L
Algorithm 1 Short-circuit current calculation
  • Solve the energy management problem (EMP) in the grid-connected MG with the objective function as the third term of (1) and constraints (4)–(9), (12)–(17), P n , t , w S + P n , t , w D G + P n , t , w E S d c h P n , t , w E S c h j N A n , j L P n , j , t , w L = P n , t , w D , Q n , t , w S + Q n , t , w D G + Q n , t , w E S j N A n , j L Q n , j , t , w L = Q n , t , w D ; n , t , w while considering the optimal value of CDG and CES obtained from (1)–(18), and remove the term of ε.
  • Solve the EMP in the islanded MG while considering the third term of (1) as the objective function and constraints (2)–(9) and (12)–(17) with the optimal value of CDG and CES based on the problem of (1)–(18).
  • Obtain the voltage value in fault point (it is named bus q) based on KVL law and results of Steps 1 and 2.
  • Calculate the admittance (Ynew) and impedance (Znew) matrix while considering bus q.
  • Calculate of bus voltage after fault occurrence using V n f = V n 0 Z n , q n e w Z f + Z q , q n e w V q 0 . V0/Vf is the bus voltage before/after fault occurrence.
  • Calculate the short-circuit current of all relays based on ohm law.

4. Solution Method

The proposed problems, outlined in Equations (1)–(18) and (19)–(25), are classified as nonlinear programming (NLP) problems. To solve these, this paper employs the Crow Search Algorithm (CSA), a relatively recent optimization method introduced in 2016 [18]. The CSA is known for its low computational time and reliable solutions, characterized by minimal standard deviation. Detailed information on this method can be explained in Algorithm 2.
Algorithm 2 Crow Search Algorithm (CSA)
  • Determine the adjustable parameters such as flock size or crow numbers (N), maximum iteration (itermax), awareness probability (AP), and flight length (fl).
  • Obtain the randomly initialized position and memory of crows.
  • Evaluate the objective function value based on the data of step 2.
  • Update the position of crows
  for iteration = 1: itermax
   for i = 1: N
     Select one of the crow as random (such as j).
     Define the random value between 0 and 1 for crow-j, i.e. rj.
      if rjAP
       position(i, iteration + 1) = position(i, iteration) + rj × fl × {memory(i, iteration)-position(i, iteration)}
        Check of the feasibility of position of all crows.
       else
      position(i, iteration + 1) = a random value for position between its minimum and maximum values.
        End
   end
   Evaluate the objective function value based on the date of new position.
   Update the memory of crows.
     if fitness(position(i, iteration + 1)) is better than
       fitness(position(i, iteration))
     memory(i, iteration + 1) = position(i, iteration + 1)
     else
     memory(i, iteration + 1) = memory(i, iteration)
     end
   end
In this study, we proposed a two-stage framework for optimizing protection coordination in both grid-connected and islanded MGs, focusing on the integration of distributed generation (DG) units and ESSs. We incorporated the Crow Search Algorithm (CSA) to solve this complex optimization problem, which involves multiple steps for both protection and investment optimization.

4.1. Initialization

At the start of the CSA, we randomly generated the positions of multiple “crows” in the solution space. Each crow’s position represents a potential solution to the optimization problem—essentially a candidate configuration of DG and ESS locations, sizes, and protection parameters. These initial positions were randomly distributed, ensuring that the search began with a broad exploration of the solution space.

4.2. Fitness Evaluation

Next, the fitness of each crow was evaluated. For our study, the fitness function includes multiple objectives, such as minimizing the combined investment and operational costs in the first stage and reducing the operating time of protection devices (DSORs and FCLs) while meeting critical system constraints in the second stage. This step determines how effective each solution is in optimizing microgrid performance, considering factors like cost, energy loss, and protection efficiency.

4.3. Leader and Personal Best Update

Each crow evaluated its own personal best solution (pbest), which is the best configuration that it has found so far. Simultaneously, the best solution across all crows (the leader) was identified. This leader solution served as a reference point for the entire group, guiding the crows toward better solutions. The leader’s position in the solution space represents the best combination of DG and ESS configuration, as well as the optimal protection settings.

4.4. Position Update (Exploration and Exploitation)

Once the leader and personal best solutions are established, each crow updates its position based on two factors: the global best (leader) and its personal best (pbest). The update follows the following Equation (26):
X i n e w = X i + φ 1 . ( X i l e a d e r X i ) + φ 2 . ( X i p b e s t X i )
where X i n e w represents the new position of crow  i , and  φ 1 and φ 2  are random factors that ensure a balance between exploring new areas (exploration) and improving the current best solution (exploitation). This step allows the algorithm to search for better configurations that minimize both the operational costs and protection times.

4.5. Boundary Check

After updating the positions, it is essential to ensure that the crows remain within the feasible solution space. If a crow’s updated position exceeds the defined boundaries (such as unrealistic values for DG or ESS sizes), its position is corrected to the nearest feasible point. This ensures that the optimization process stays within practical constraints, like the operational limits of the MG components.

4.6. Leader Update

Once the positions of all crows were updated, we reassessed the fitness of all potential solutions. If any crow found a better solution than the current global leader, the leader was updated to reflect this improvement. This dynamic leader update helps refine the search process by steering the entire algorithm toward more promising solutions.

4.7. Stopping Criterion

Finally, the algorithm continues iterating until a stopping criterion is met. This criterion could be a maximum number of iterations or a minimal improvement in fitness, signaling that further optimization is unlikely to yield significant benefits. At this point, the CSA converged to an optimal or near-optimal solution for both stages of the problem—achieving the best configuration for DGs, ESSs, and protection settings while respecting operational and financial constraints.
The main roles of CSA in the suggested two stages are as follows:
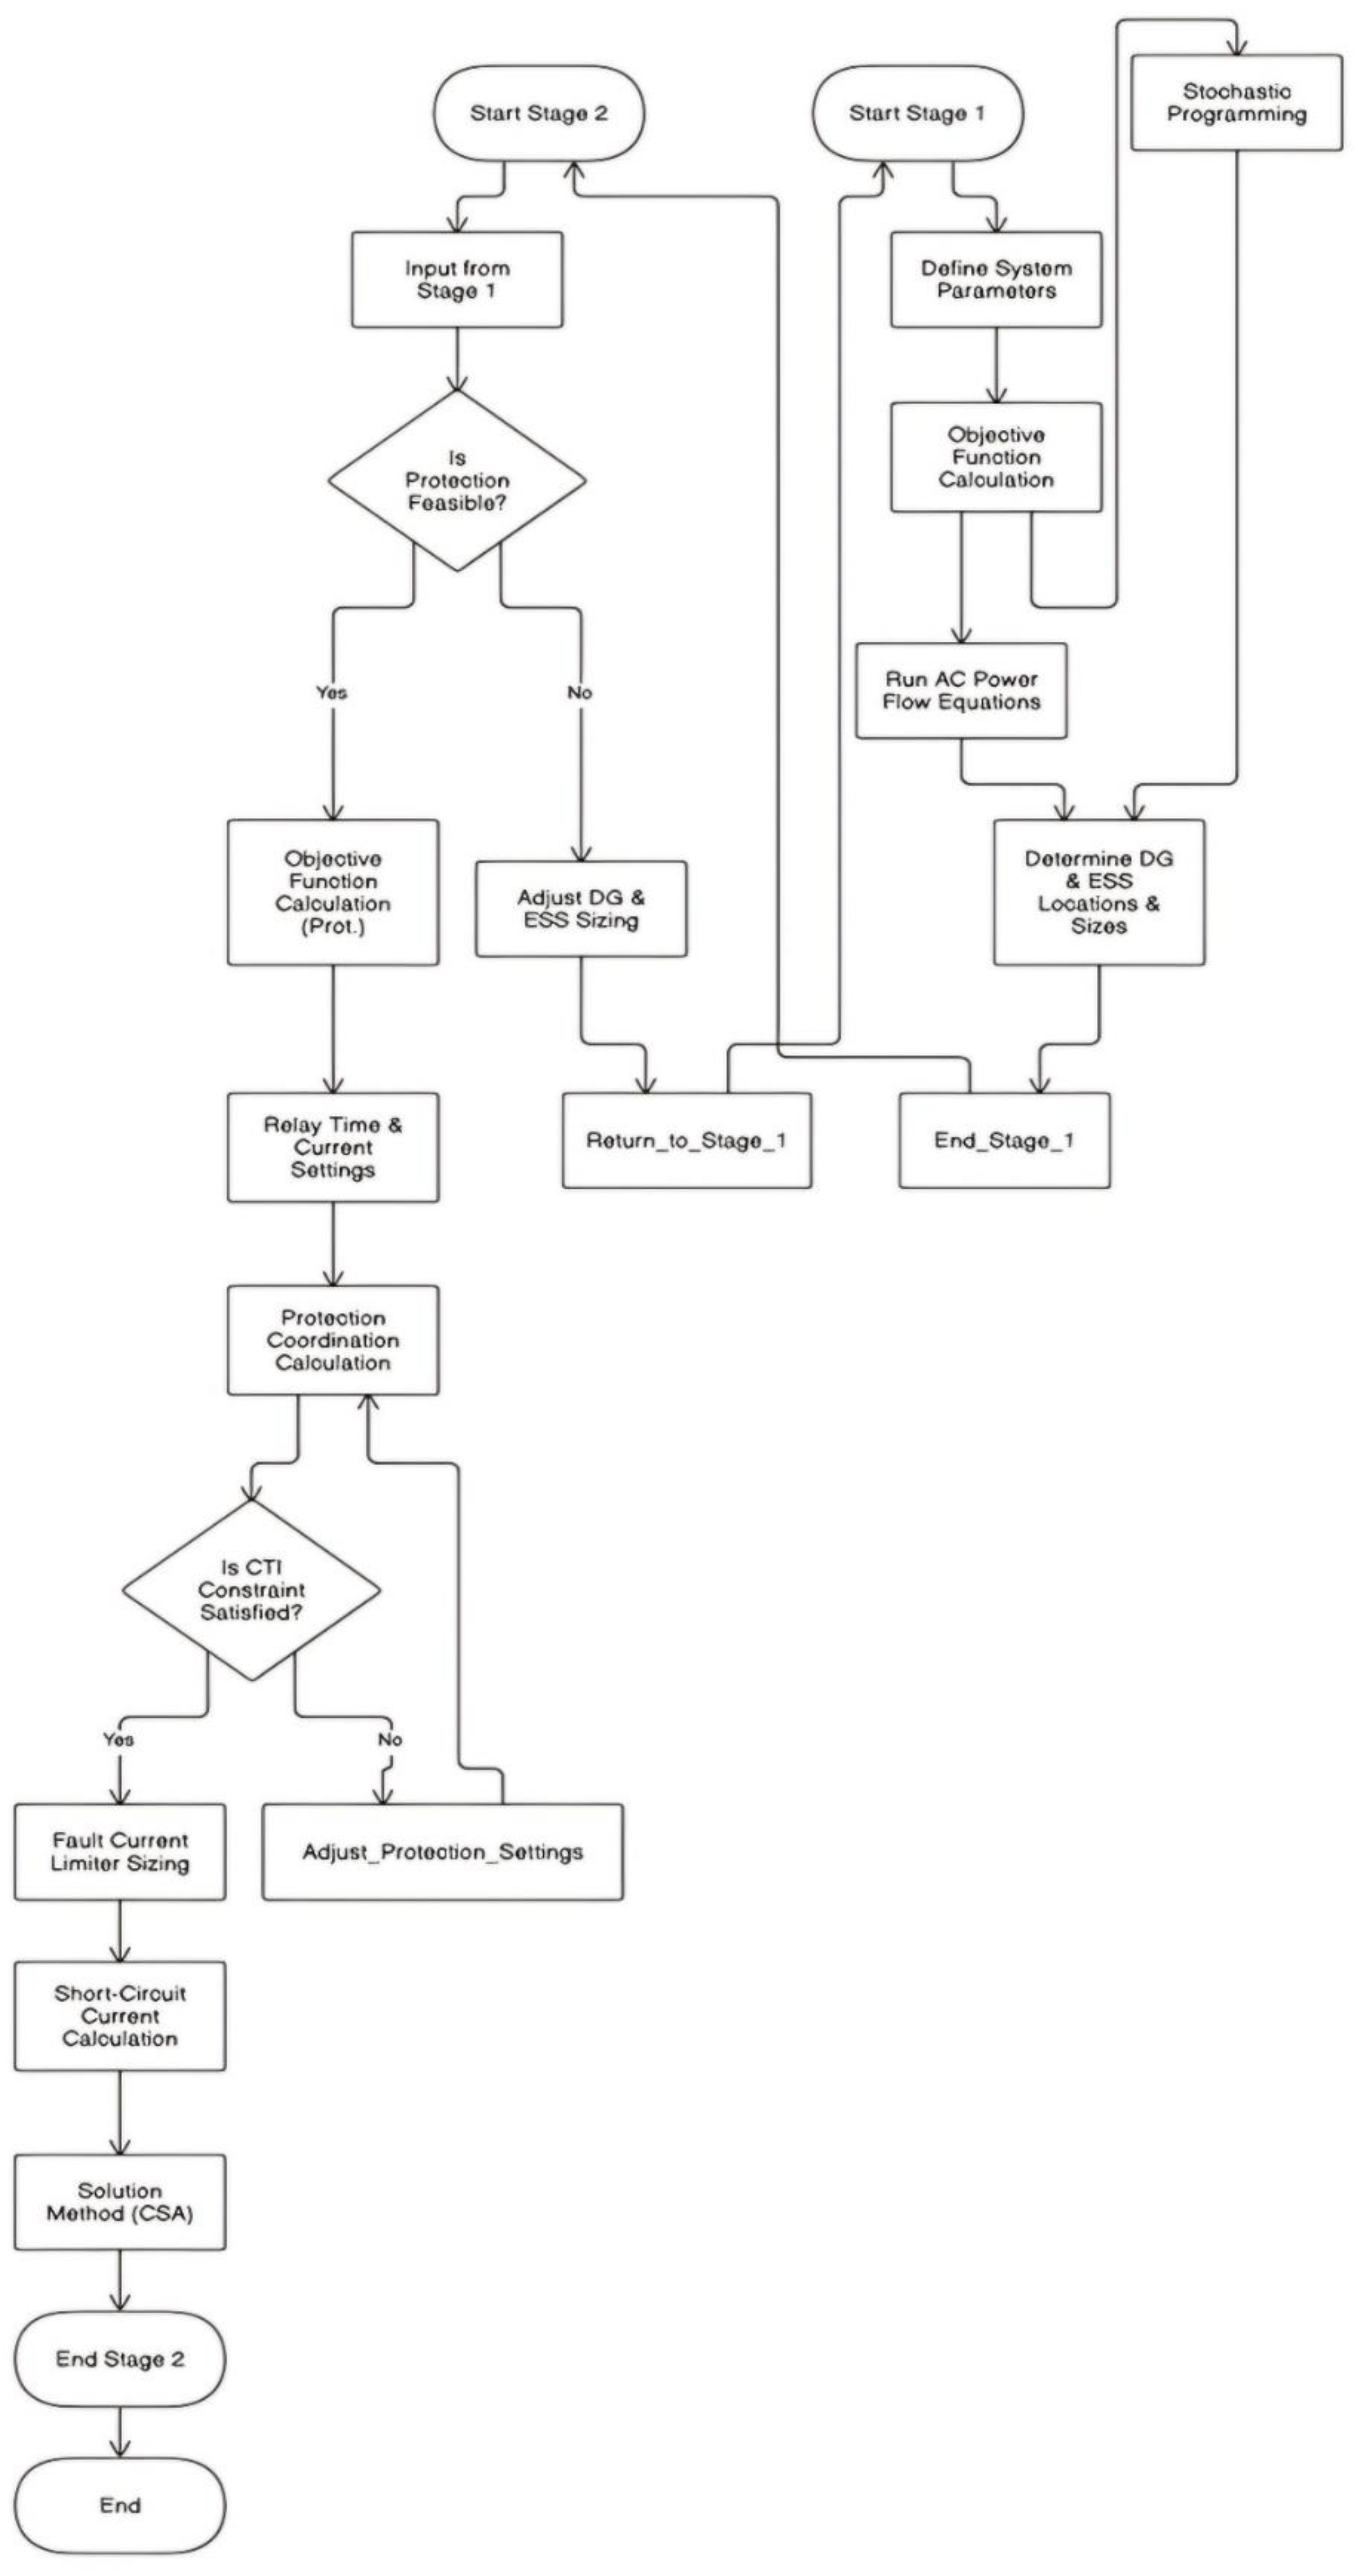
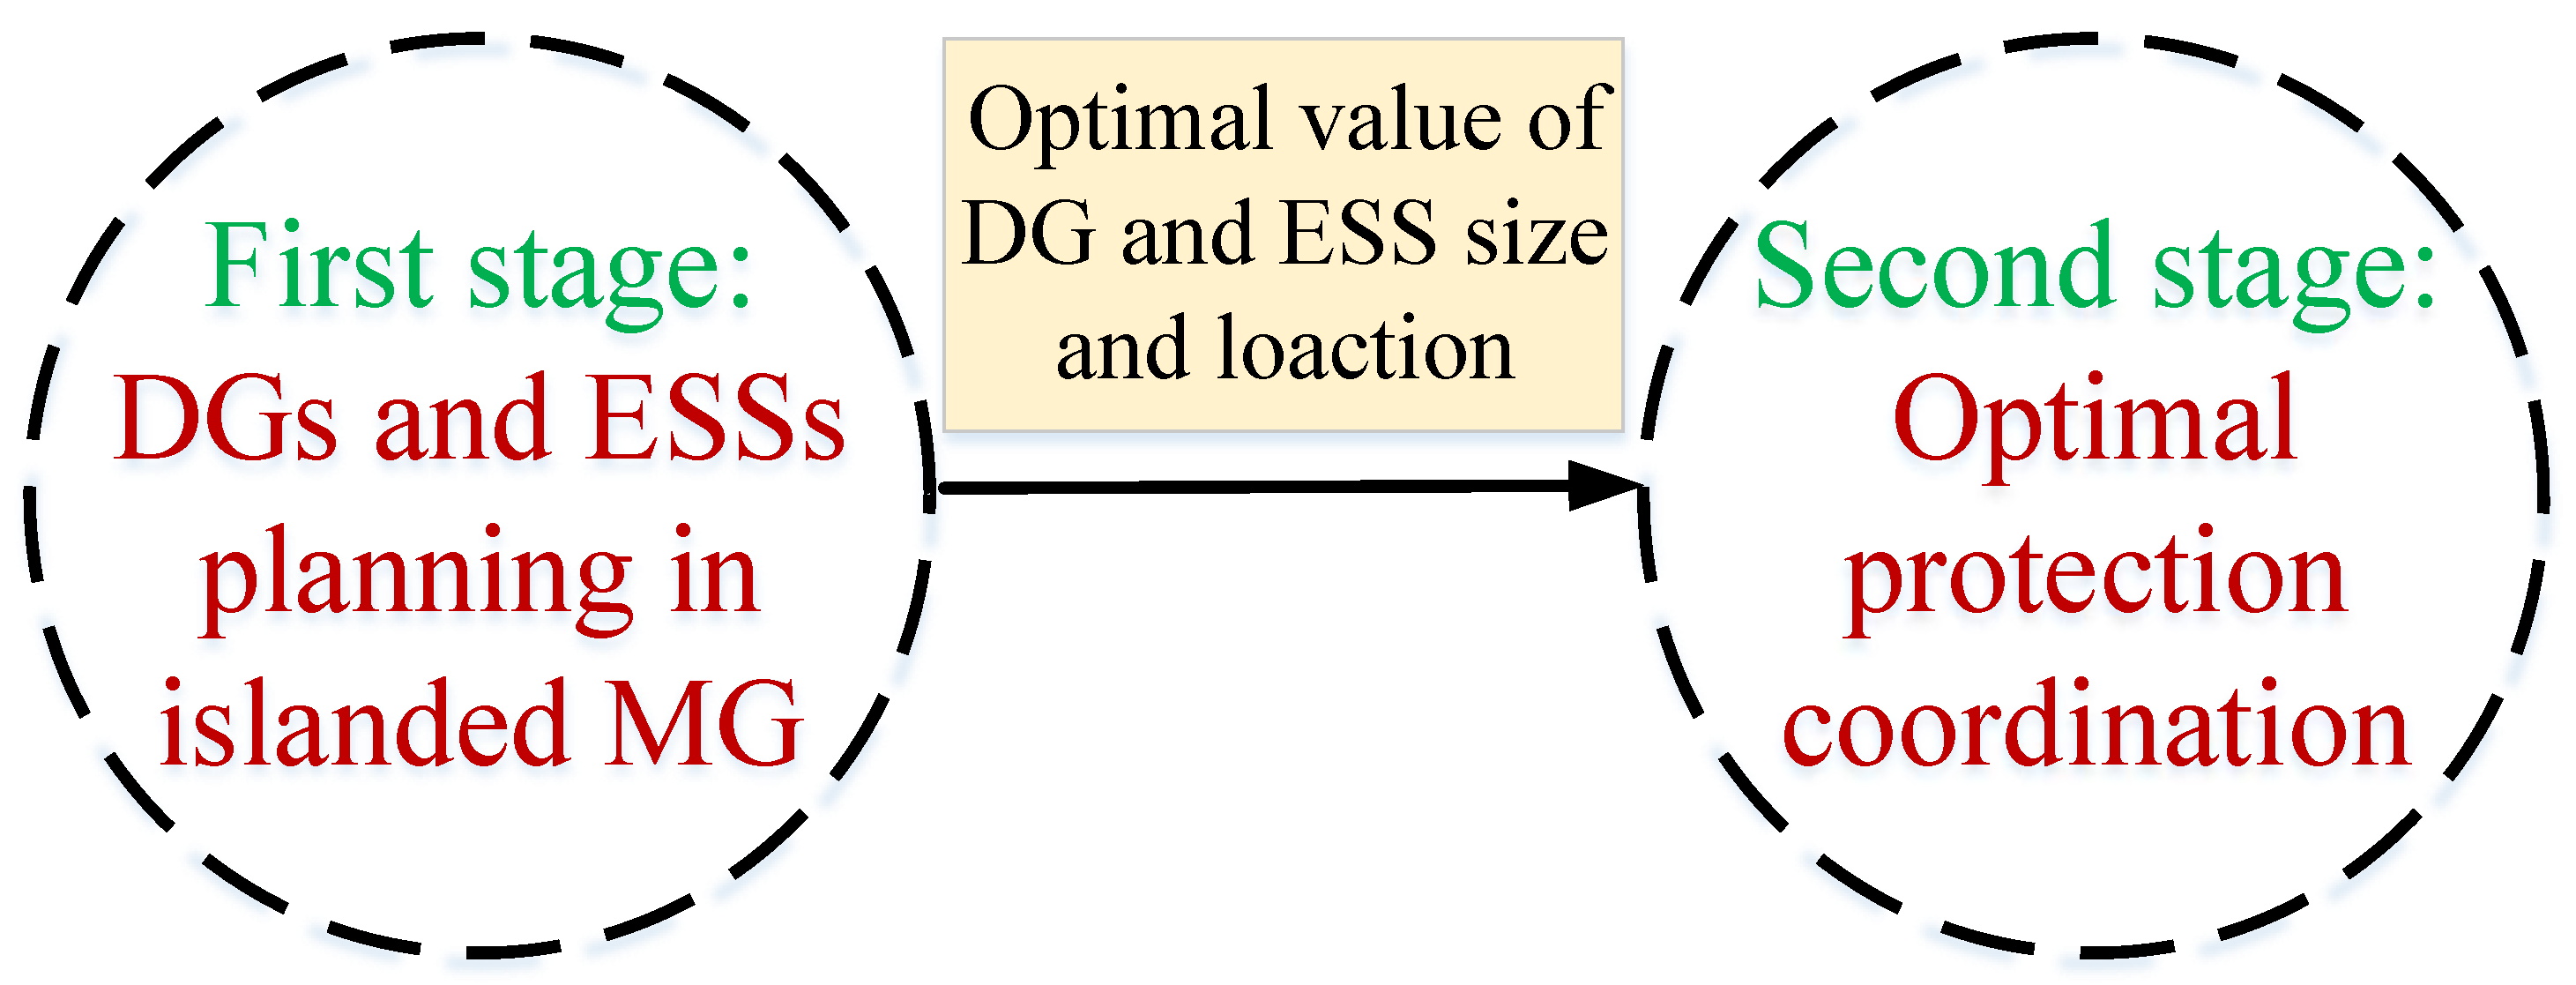
  • Stage One: In the first stage, CSA helped determine the optimal locations and sizes for DGs and ESSs. The algorithm explored different configurations, balancing investment costs with operational expenses and ensuring that the system operates efficiently even under varying load and generation conditions. Using stochastic programming, CSA handled the uncertainties in load demand and DG power generation by considering different possible scenarios.
  • Stage Two: In the second stage, CSA focused on optimizing protection coordination. This involves fine-tuning the settings for DSORs and FCLs to minimize the operating time of these devices while ensuring that the system met critical coordination and protection constraints. The algorithm seeks the optimal balance between quick fault detection and system stability, updating the positions of crows to reflect the most efficient protection settings.
By combining the flexibility and search capability of CSA with the complexities of microgrid optimization, we ensure that both the investment decisions (DG/ESS sizing and placement) and operational strategies (protection coordination) are optimized simultaneously, resulting in a more reliable, cost-effective, and sustainable microgrid solution.

5. Numerical Results

The proposed two-stage Optimal Power Coordination (OPC) problem is simulated on both the 9-bus and 32-bus radial MGs using MATLAB R2022b with the Crow Search Algorithm (CSA) solver [18]. The adjustable parameters for the CSA are set as follows: N = 50 N, itermax = 1000, AP = 0.1, and fl = 2.
The IEEE 9-bus and 32-bus test systems were selected because they represent small and medium-scale MGs with distinct topological and operational characteristics. The 9-bus system is widely used for testing protection coordination strategies in compact MGs, while the 32-bus system allows for evaluating scalability and system response under different fault and load conditions.
If a different bus system were used, the results could vary due to changes in the following:
  • Fault currents: Larger systems might have more dispersed fault currents, requiring different relay settings.
  • Relay coordination: More relays in a complex network might lead to longer computation times and stricter coordination constraints.
  • Energy loss and voltage profile: Larger networks may experience higher losses and more voltage variations, influencing optimal DG and ESS placement.

5.1. 9-Bus Radial MG

The 9-bus test system is illustrated in Figure 3 [8], where it is assumed that a symmetrical fault occurs at the midpoint of the MG lines, specifically at point 10–17 in Figure 2. Additionally, inverter-based DGs, such as photovoltaic (PV) and wind turbine (WT), are utilized in this study due to their zero operational costs. The forecasted power percentages for these DGs are depicted in Figure 4 [15]. Furthermore, the other relevant data for the proposed problem are presented in Table 2, along with the characteristics of the DSORs described in the study of [4].

5.1.1. DG and ESS Planning in the Islanded MG

The optimal locations and sizing of PVs, WTs, and ESSs for the 9-bus test network are presented in Table 3. The analysis indicates that the PV, WT, and ESS packages are strategically positioned at buses 3 and 7 to minimize both investment and expected operational costs, which are USD 560,000 and USD 175,632, respectively. This configuration also results in favorable values for MG indices, including voltage profile, line overloading, and power loss.
The capacity of the WT is set at the maximum size of DG at 4 MVA, as indicated in Table 2. In contrast, the PV capacity is 3 MVA, which is lower than that of the WT. This discrepancy is due to WT’s ability to harvest more energy compared to the PV under comparable conditions, as shown in Figure 4.
The forecast profiles for wind and solar energy in Figure 4 were selected based on the following:
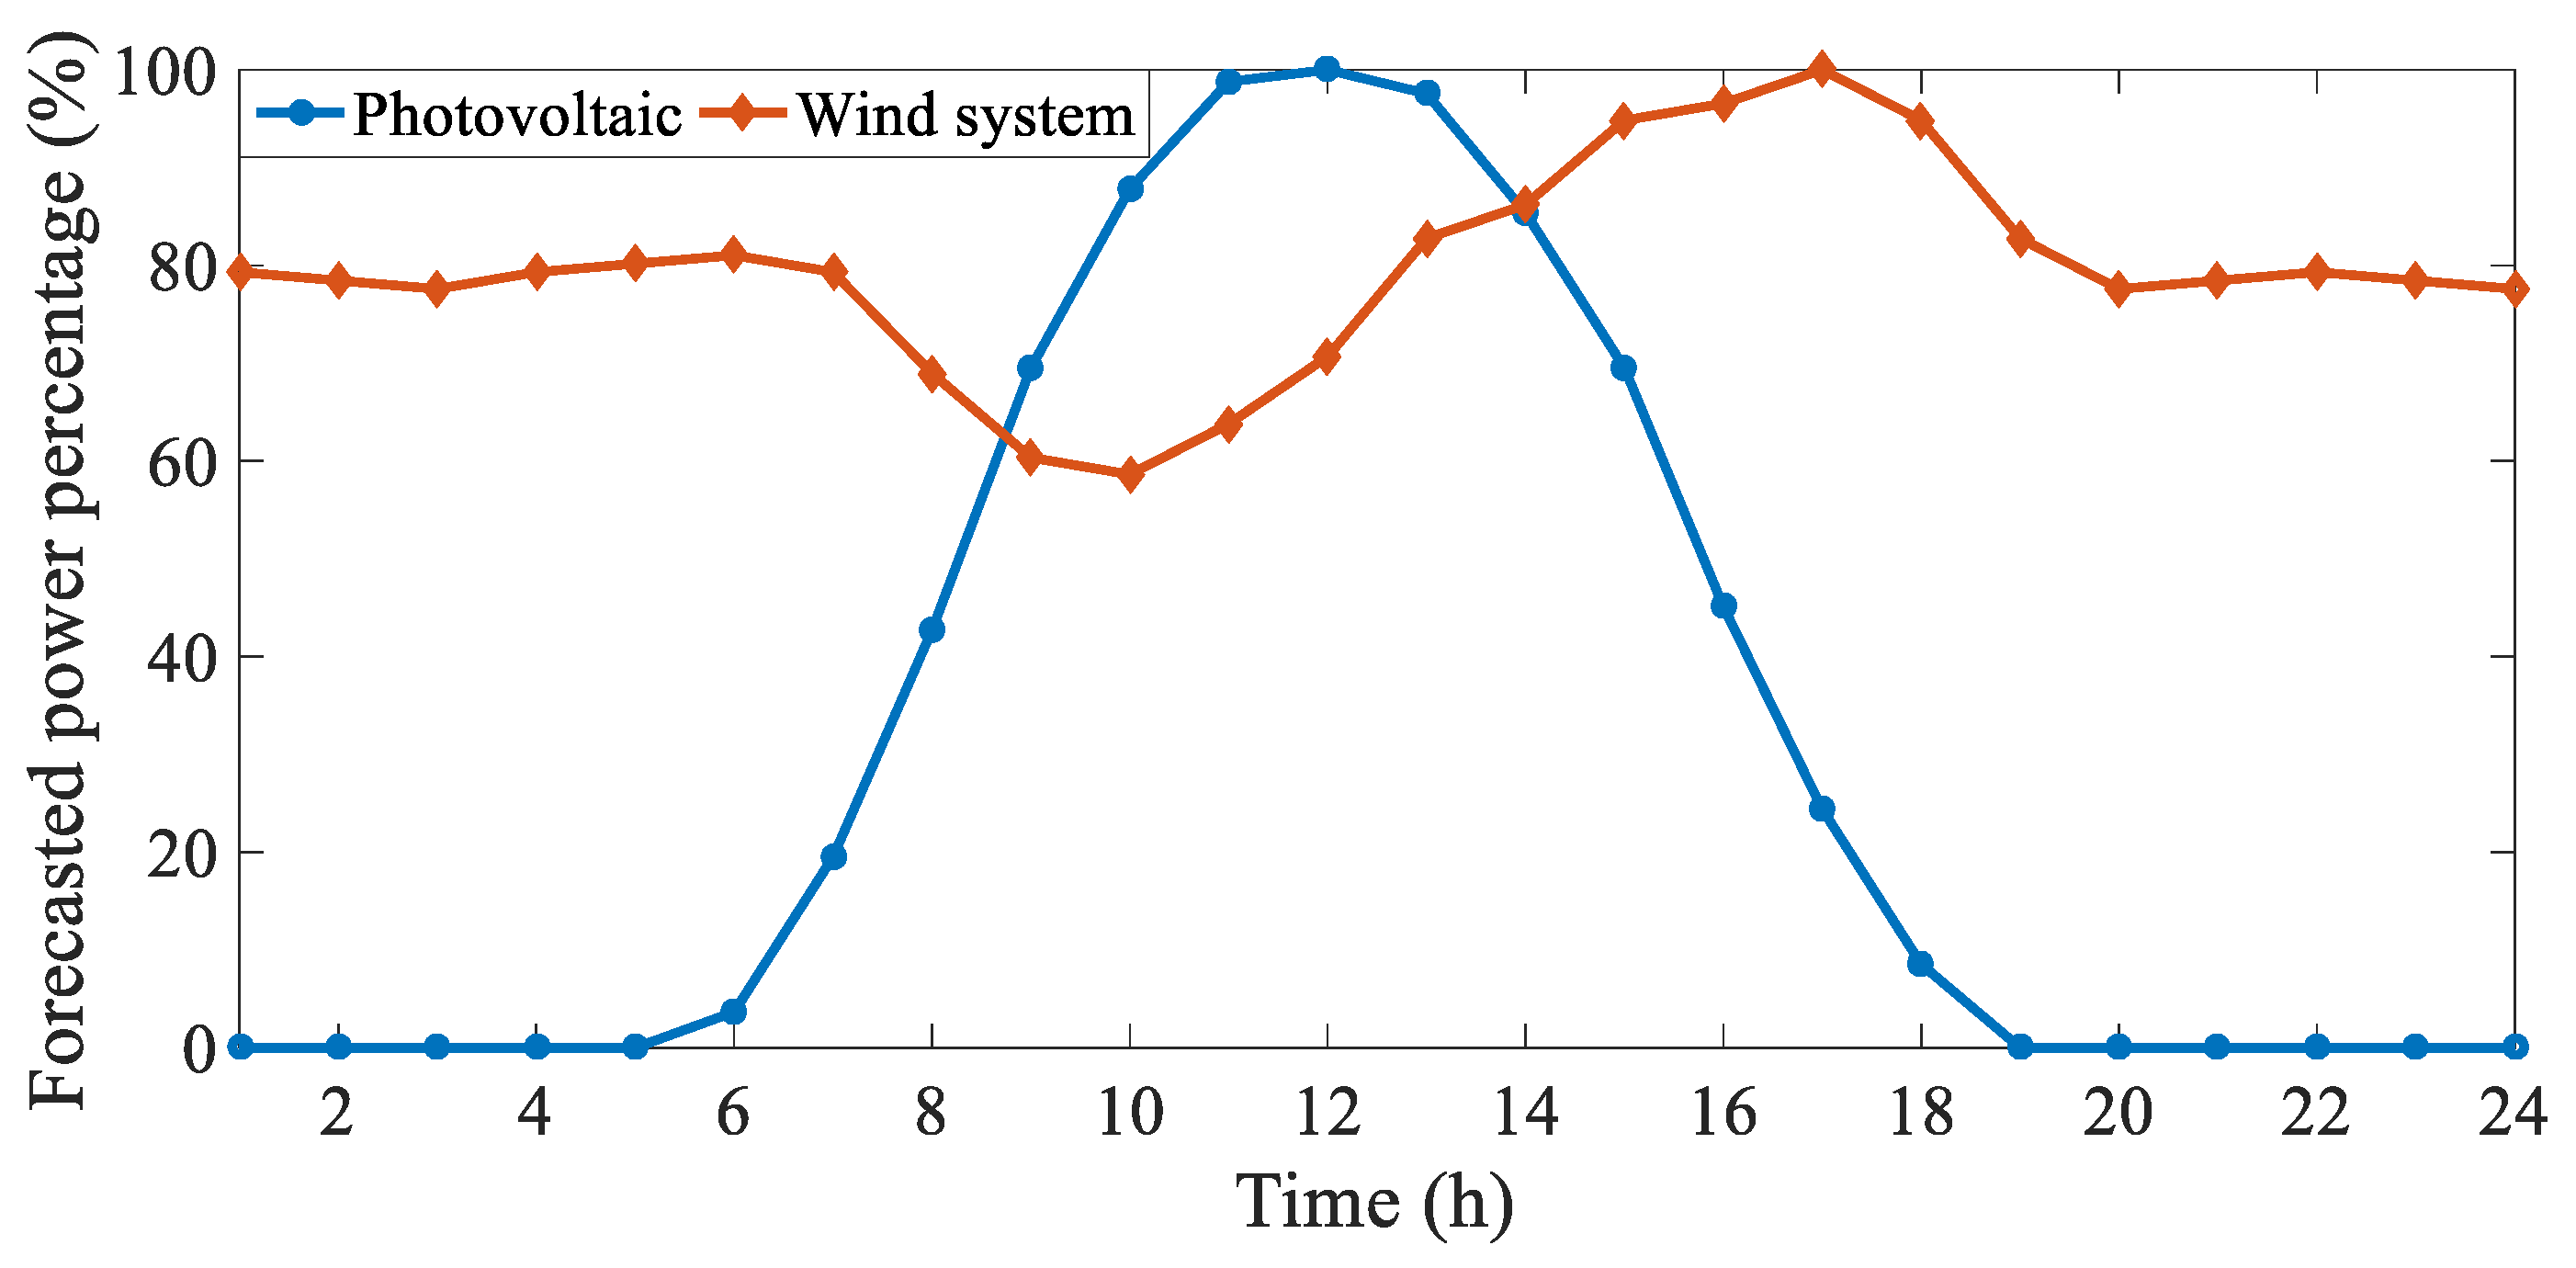
  • Historical data: The forecasted power output of PV and wind turbines was derived from real-world data sources referenced in the study of [15].
  • Seasonal variations: The profiles account for daily fluctuations in solar irradiation and wind speeds, ensuring a realistic energy generation pattern.
  • Load matching: The profiles were adjusted to match the MG’s expected daily load demand and minimize surplus energy waste.
  • Stochastic modeling: The uncertainty in renewable energy generation was modeled using the scenario-based stochastic programming (SBSP) approach, ensuring that forecast variations were accurately represented.
Additionally, the daily expected profiles of active and reactive power for the RESs—the sum of the outputs from PVs and WTs—and ESSs are illustrated in Figure 4. According to Figure 5a, the active power generated by the RESs exceeds the network’s active load from 3:00 to 16:00, while it falls short during other hours. Consequently, the ESSs will be charged between 3:00 and 16:00 and will inject active power into the islanded MG during the periods of 1:00 to 2:00 and 17:00 to 24:00 to ensure flexible operation. Based on Table 3, the optimal capacity for the ESS is determined to be 21 MWh, corresponding to the maximum stored energy illustrated in Figure 5a.
Moreover, the RESs solely meet the network’s reactive load from 1:00 to 9:00; during other hours, both the ESSs and RESs contribute to the reactive load, as indicated in Figure 5b. Consequently, the maximum voltage deviation (drop) and the expected daily energy loss in the islanded MG are calculated to be 0.0038 p.u. and 0.9435 MWh, respectively, based on the optimal power distribution for RESs and ESSs outlined in Figure 5. In comparison, the values for these variables in a grid-connected MG are 0.0073 p.u. and 1.0114 MWh, as reported in Table 4.

5.1.2. Optimal Protection Coordination

This section presents the optimal operating times for DSORs based on the proposed OPC strategy. First, the relay operation modes, derived from the optimal planning results for DGs and ESSs in the previous subsection (4.1.A), are summarized in Table 5. For each fault location, the DSORs positioned on either side of the fault act as primary protection relays, with each primary relay associated with up to four backup relays. For instance, in the event of a fault at point 10, it can be observed that two primary relays, R1 and R2, are activated. Relay R1 can define two backup relays, R10 and R17, while relay R2 is associated with one backup relay, R4.
The optimal setting parameters for the DSORs in both operational modes, based on the OPC strategy, are reported in Table 6. Each DSOR consists of four setting parameters: TDSfw and IP_fw are designated for forward operation as primary protection relays, while TDSrv and IP_rv are utilized for reverse operation as backup relays. Additionally, the optimal size of the FCL required to maintain low short-circuit current levels in the 9-bus radial MG is determined to be 1.5212 p.u, as shown in Table 6.
The expected operation times for the DSORs are summarized in Table 7, which is derived from the results presented in Table 5 and Table 6. The total expected daily operating time for the relays is calculated to be 1041.36 s, with 510 s corresponding to the grid-connected mode and 531.36 s attributed to the islanded mode of the MG. Furthermore, the maximum relay operating time among all DSORs is 2.01836 s, while the minimum operating time is 0.1835 s.

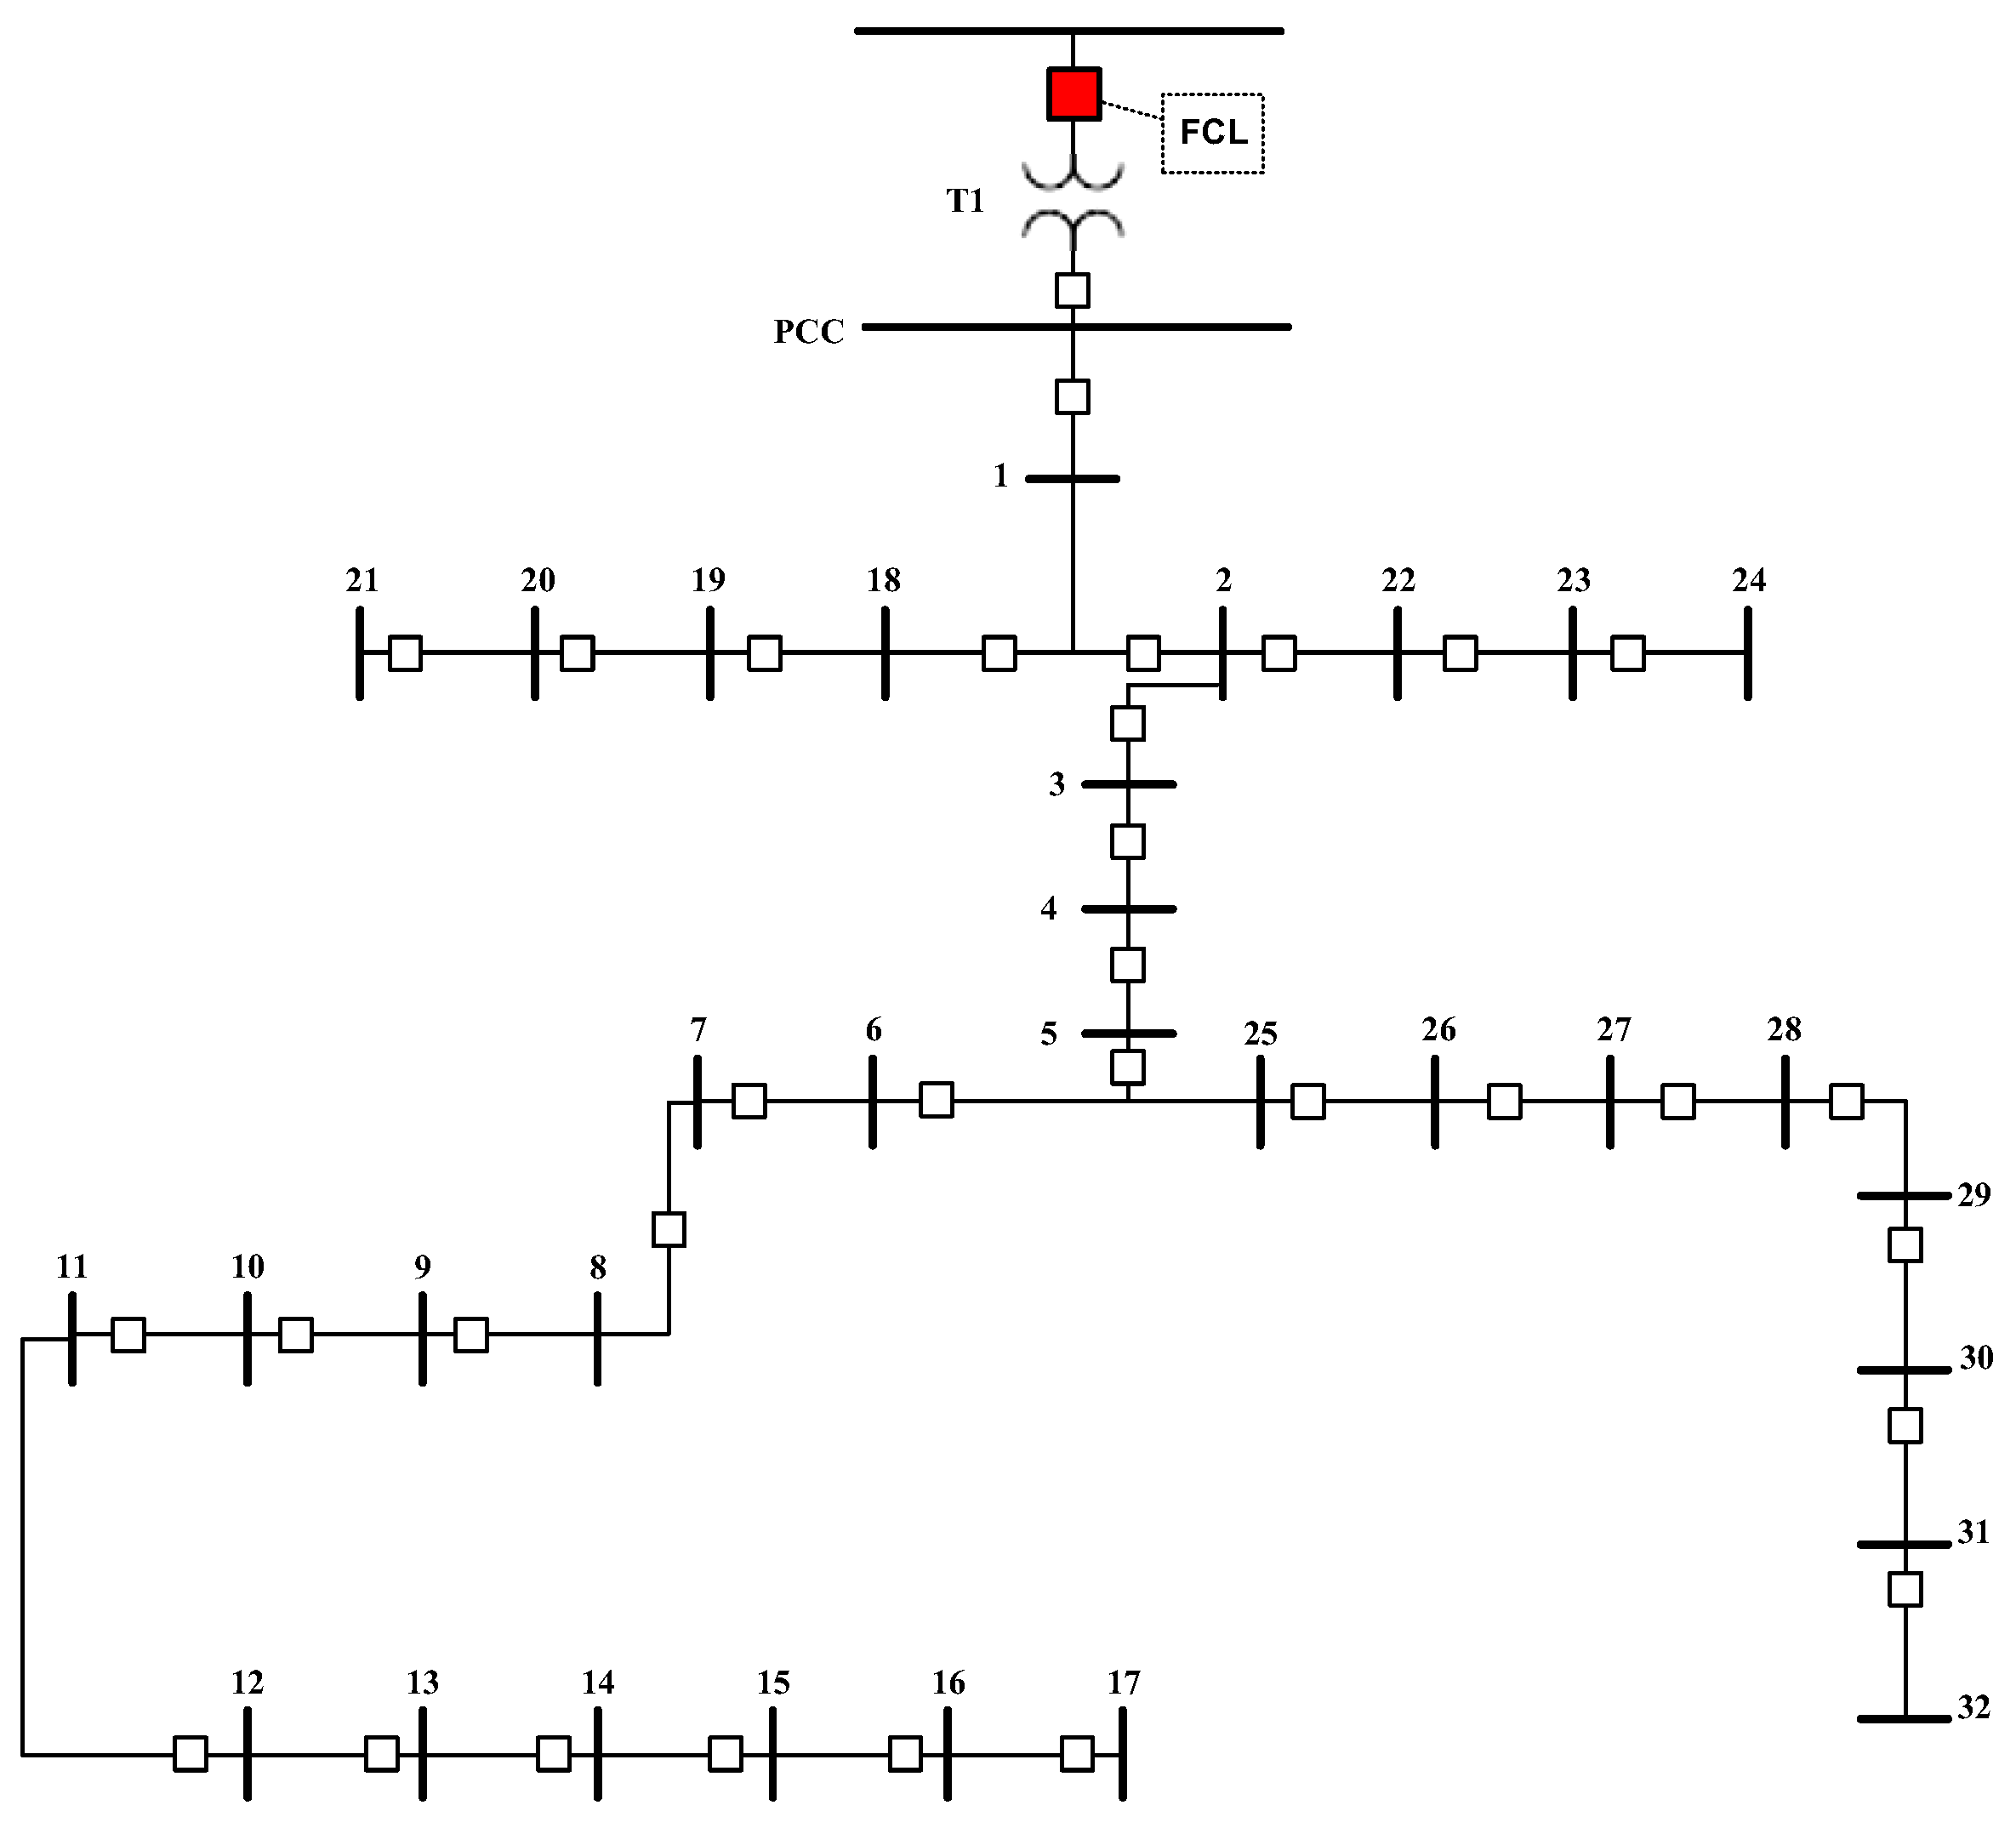
5.2. 32-Bus Radial MG

The 32-bus MG is depicted in Figure 6, where the line and peak load data are provided in reference [32]. Like the 9-bus MG, DSORs are positioned on the left and right sides of bus n, represented as Rn and R’n, respectively. The other data and assumptions—such as fault locations, types of DGs, and characteristics of ESSs and DGs—remain consistent with those used in the 9-bus test network.
The results of this section are summarized in Table 8 and Table 9, which present the optimal planning outcomes for DGs and ESSs as well as the results of the proposed OPC strategy for the 32-bus radial MG.
According to Table 8, the proposed solution selects only the WT as the DG, as the energy production from the WT is greater than that from PV, as indicated in Figure 3. The total capacity of the WTs is 4.15 MVA, with an associated investment cost of USD 194,750. The total capacity of the ESSs is 18.2 MWh, which incurs an investment cost of USD 91,000 and an expected operational cost of USD 56,583.
Additionally, the OPC method yields an expected total daily relay operating time of 1.282 s, with minimum and maximum operating times of 0.1336 s and 1.6422 s, respectively, for the proposed test system. The optimal size of the FCL for this MG is determined to be 1.8735 p.u., based on the results of the OPC analysis.
Finally, the advantages of the CSA solver in comparison to conventional evolutionary algorithms, such as GA and PSO, are presented in Table 10. According to the data in this table, the mean, median, and mode values of the objective function are nearly identical across both stages for the CSA, a consistency not observed in the GA and PSO solvers. As a result, the CSA achieves a low standard deviation of 1.13% for stage 1 and 1.21% for stage 2, highlighting its superior performance relative to traditional evolutionary algorithms. Therefore, the proposed CSA is deemed suitable, secure, and reliable for solving the two-stage OPC method outlined in this study.
Lastly, interdisciplinary collaboration will be essential to bridge the gap between engineering, policy, and social sciences. Collaborating with policymakers, sociologists, and local governments will help ensure that microgrid technologies not only meet technical and economic objectives but also align with broader societal goals of sustainability, equity, and environmental stewardship. By incorporating a human-centered approach, future research can contribute to creating microgrids that are not only technically advanced but also socially responsible and adaptable to the diverse needs of the communities they serve.

6. Discussion

This study demonstrates the effectiveness of the proposed two-stage OPC method in optimizing the protection and operation of MGs under different conditions. The results indicate that the DSORs and FCLs improve fault isolation and coordination time, reducing the relay operation time significantly.
Comparing these findings with real-world MG implementations, several key insights emerge:
  • MG reliability: Similar studies on industrial MGs have shown that integrating FCLs enhances network protection by limiting short-circuit currents, consistent with the findings in this study.
  • Operational efficiency: The reduction in total relay operating time aligns with practical MG setups where optimized relay coordination reduces unnecessary tripping and enhances system stability.
  • Scalability considerations: Larger MGs, such as those deployed in smart industrial parks or university campuses, may require additional computational effort due to increased relay and DG complexity.
Furthermore, the integration of the CSA in optimizing the protection coordination is a notable aspect of this study, offering a robust solution to the inherent complexity of protection scheme optimization in microgrids. CSA’s ability to balance exploration and exploitation ensures that optimal solutions are found even in dynamic and uncertain environments. The algorithm’s effectiveness in both grid-connected and island modes further highlights its versatility, making it a valuable tool for microgrid operators aiming to enhance system reliability and minimize operational downtime. By incorporating CSA, the proposed approach not only optimizes protection coordination but also contributes to the overall sustainability of microgrid systems, particularly in applications where both efficiency and reliability are paramount. As the role of microgrids continues to expand, especially in remote or off-grid areas, advanced optimization techniques will be essential for ensuring the resilience and economic viability of modern energy systems
Future work should extend this study by validating the proposed methodology using real-time operational data from actual MG deployments, ensuring that model assumptions accurately reflect real-world scenarios.

7. Conclusions

This paper presents a stochastic two-stage OPC method for MGs that include DGs such as RESs or non-NRESs and ESSs, considering both grid-connected and islanded modes. In the first stage, the method determines the optimal location and capacity of DGs and ESSs in relation to the energy demand of the islanded MG. This stage aims to minimize the total annual investment and expected operating costs of DGs and ESSs, adhering to AC power flow equations, DG and ESS constraints, and MG operational limits. The second stage focuses on minimizing the total operating time of DSORs in both primary and backup protection modes, taking into account the CTI, DSOR setting parameters, and limits on FCL sizes. Furthermore, SBSP is utilized to model the uncertainties related to load and maximum RES active power, employing a RWM for scenario generation and the Kantorovich method for scenario reduction. Additionally, the numerical results indicate that the CSA provides reliable and secure solutions for the proposed OPC method. The CSA effectively calculates the minimum DSOR operating time and planning costs based on the optimal planning results for DGs and ESSs, as well as FCLs and the optimal settings of DSORs. Although the proposed two-stage OPC approach significantly improves MG protection and operation, it has some limitations. This study assumes fixed load and DG profiles, which may not fully capture real-time variations. Additionally, while tested on 9-bus and 32-bus MGs, larger networks may introduce further computational and coordination challenges. The CSA solver ensures reliable results, but future research should compare its performance with other advanced algorithms. Finally, practical validation using real-world MG deployments and hardware-in-the-loop testing remains necessary to confirm the effectiveness of the proposed method.

Future Studies

Future studies should consider not only the technological and operational aspects of microgrid optimization and protection coordination but also the human factors that influence their successful implementation and sustainability. As energy systems evolve, it is crucial to engage local communities and stakeholders, ensuring that their needs, preferences, and concerns are incorporated into planning and decision-making processes. Understanding the social dimensions of microgrid deployment, such as the potential for job creation, community engagement, and the social acceptance of new energy technologies, can significantly enhance their adoption and success.
Moreover, human behavior and cognitive factors play a key role in the effective operation of microgrids. Exploring the dynamics of human decision making under uncertainty, operator training, and the psychological factors that influence the management of distributed energy resources could provide valuable insights for improving operational efficiency and reliability. Integrating advanced decision support tools that factor in these human elements could lead to more robust, adaptable, and user-friendly systems.
Lastly, interdisciplinary collaboration will be essential to bridge the gap between engineering, policy, and social sciences. Collaborating with policymakers, sociologists, and local governments will help ensure that microgrid technologies not only meet technical and economic objectives but also align with broader societal goals of sustainability, equity, and environmental stewardship. By incorporating a human-centered approach, future research can contribute to creating microgrids that are not only technically advanced but also socially responsible and adaptable to the diverse needs of the communities they serve.

Author Contributions

Conceptualization, H.S. and H.A.K.; methodology, H.S., H.A.K. and S.A.F.A.; software, H.S. and H.A.K.; validation, A.A. and M.M.; formal analysis, M.M.; investigation, A.A. and B.V.; resources, H.S., H.A.K. and S.A.F.A.; data curation, H.S., H.A.K. and S.A.F.A.; writing—original draft preparation, H.S., H.A.K. and S.A.F.A.; writing—review and editing, M.M.; visualization, M.M.; supervision, B.V. All authors have read and agreed to the published version of the manuscript.

Funding

This research received no external funding.

Data Availability Statement

Data are contained within this article.

Conflicts of Interest

There are no conflicts of interest.

List of Symbols

Sets and indices:
c, CIndex and set of MG operating mode, i.e., grid-connected and islanded
i, IIndex and set of the DSOR
j, JIndex and set of the fault location
k, KIndex and set of the backup protection of the DSOR
n, l, N, NRESIndex of the bus and line, set of the bus and RES location
n (j)The virtual bus corresponding to the fault location j
t, STIndex and set of the simulation time
w, SIndex and set of the scenario sample
Variables:
CDG, CESOptimal DG and ESS capacity size (p.u)
CostSummation of the annual investment and operation cost (USD)
EThe stored energy of the ESS (p.u)
IP_fw, IP_rvForward and reverse pickup current setting of the DSOR (p.u)
IscShort-circuit current (p.u)
PDG, QDGActive and reactive power of DG (p.u)
PESch, PESdch, QESCharging and discharging active power and reactive power of the ESS (p.u)
PL, QLActive and reactive power flow of the line (p.u)
PS, QSActive and reactive power of the MG station (upstream network) (p.u)
ZDGThe impedance of the DG (p.u.)
ZImpedance matrices of the network
κImpedance–capacity curve factor of the SDG
V, θVoltage magnitude (p.u) and voltage angles (rad)
TTotal operating time of all DSORs (s)
TDSfw, TDSrvForward and reverse time dial setting of DSORs (s)
tB_reOperating time of the DSOR in reverse setting when it acts in backup protection (s)
tP_fwOperating time of the DSOR in forward setting when it acts in primary protection (s)
XFCLOptimal reactance size of the FCL (p.u)
Constants:
ALIncidence matrix of bus line based on the current direction
C ¯ D G , C ¯ E S Maximum capacity size of DG and the ESS (p.u)
CTICoordination time interval
g, bConductance and susceptance of a line (p.u)
ICDG, ICESAnnual investment cost of the DG and ESS (USD/p.u/year)
I ¯ P , I ¯ P Minimum and maximum value of pickup current setting of the DSOR (p.u)
PD, QDActive and reactive load (p.u)
P ¯ D G Maximum RES active power (p.u)
SLmaxMaximum capacity of a line (p.u)
T D S ¯ , T D S ¯ Minimum and maximum time dial setting of the DSOR (s)
Vmin, VmaxMinimum and maximum voltage magnitude (p.u)
X ¯ F C L Maximum reactance size of the FCL
αRate between the minimum energy of ESS and CES
βRate between ESS charger capacity and CES
εRate of islanded MG overloading providing by DG and ESS
ηch, ηdchCharging and discharging efficiency of the ESS without unit
λOperation price of DG (USD/p.u)
πProbability of the scenario
ρch, ρdchCharging and discharging operation cost of the ESS (USD/p.u)
τTime charging of the ESS (hour)

References

  1. Tejeswini, M.V.; Raglend, I.J.; Yuvaraja, T.; Radha, B.N. An advanced protection coordination technique for solar in-feed distribution systems. Ain Shams Eng. J. 2019, 10, 379–388. [Google Scholar]
  2. Chabanloo, R.M.; Maleki, M.G.; Agah, S.M.M.; Habashi, E.M. Comprehensive coordination of radial distribution network protection in the presence of synchronous distributed generation using fault current limiter. Int. J. Electr. Power Energy Syst. 2018, 99, 214–224. [Google Scholar]
  3. Bukar, A.L.; Tan, C.W. A review on stand-alone photovoltaic-wind energy system with fuel cell: System optimization and energy management strategy. J. Clean. Prod. 2019, 221, 73–88. [Google Scholar] [CrossRef]
  4. Sharaf, H.M.; Zeineldin, H.H.; El-Saadany, E. Protection Coordination for Microgrids with Grid-Connected and Islanded Capabilities Using Communication Assisted Dual Setting Directional Overcurrent Relays. IEEE Trans. Smart Grid 2018, 9, 143–151. [Google Scholar]
  5. Aghdam, T.S.; Karegar, H.K.; Zeineldin, H.H. Optimal Coordination of Double-Inverse Overcurrent Relays for Stable Operation of DGs. IEEE Trans. Ind. Inform. 2019, 15, 183–192. [Google Scholar]
  6. Shad, H.; Gandomkar, M.; Nikoukar, J. Analysis the securable operation and protection coordination indices on multi-objective sitting and sizing of synchronous distributed generations on distribution networks. IET Gener. Transm. Distrib. 2022, 17, 2169–2181. [Google Scholar]
  7. Aghdam, T.S.; Karegar, H.K.; Zeineldin, H.H. Transient Stability Constrained Protection Coordination for Distribution Systems with DG. IEEE Trans. Smart Grid 2018, 9, 5733–5741. [Google Scholar]
  8. Najy, W.K.A.; Zeineldin, H.H.; Woon, W.L. Optimal Protection Coordination for Microgrids with Grid-Connected and Islanded Capability. IEEE Trans. Ind. Electron. 2013, 60, 1668–1677. [Google Scholar]
  9. Alkaran, D.S.; Vatani, M.R.; Sanjari, M.J.; Gharehpetian, G.B.; Naderi, M.S. Optimal Overcurrent Relay Coordination in Interconnected Networks by Using Fuzzy-Based GA Method. IEEE Trans. Smart Grid 2018, 9, 3091–3101. [Google Scholar] [CrossRef]
  10. Baghaee, H.R.; Mirsalim, M.; Gharehpetian, G.B.; Talebi, H.A. MOPSO/FDMT-based Pareto-optimal solution for coordination of overcurrent relays in interconnected networks and multi-DER microgrids. IET Gener. Transm. Distrib. 2018, 12, 2871–2886. [Google Scholar]
  11. Zhang, C.; Xu, Y.; Dong, Z.Y. Probability-Weighted Robust Optimization for Distributed Generation Planning in Microgrids. IEEE Trans. Power Syst. 2018, 33, 7042–7051. [Google Scholar] [CrossRef]
  12. Khanavandi, H.A.; Gandomkar, M.; Nikoukar, J. Resiliency planning of distribution network using of active distribution network partitioning. Heliyon. 2024, 10, e36422. [Google Scholar] [CrossRef] [PubMed]
  13. Khanavandi, H.A.; Gandomkar, M.; Nikoukar, J. Optimal planning and partitioning of multiple distribution Micro-Grids based on reliability evaluation. PLoS ONE 2014, 19, e0305745. [Google Scholar] [CrossRef] [PubMed]
  14. Tanha, M.H.; Gandomkar, M.; Nikoukar, J. Coordination of protection and operation in micro-grids with inverter based distributed generation using SAOA. PLoS ONE 2024, 19, e0311584. [Google Scholar] [CrossRef]
  15. Maleki, A.; Askarzadeh, A. Optimal sizing of a PV/wind/diesel system with battery storage for electrification to an off-grid remote region: A case study of Rafsanjan, Iran. Sustain. Energy Technol. Assess. 2014, 7, 147–153. [Google Scholar]
  16. Arya, Y. Impact of ultra-capacitor on automatic generation control of electric energy systems using an optimal FFOID controller. Int. J. Energy Res. 2019, 43, 8765–8778. [Google Scholar] [CrossRef]
  17. Ozbak, M.; Ghazizadeh-Ahsaee, M.; Ahrari, M.; Jahantigh, M.; Mirshekar, S.; Mirmozaffari, M.; Aranizadeh, A. Improving power output wind turbine in micro-grids assisted virtual wind speed prediction. Sustain. Oper. Comput. 2024, 5, 119–130. [Google Scholar] [CrossRef]
  18. Askarzadeh, A. A novel metaheuristic method for solving constrained engineering optimization problems: Crow search algorithm. Comput. Struct. 2016, 169, 1–12. [Google Scholar] [CrossRef]
  19. Byrne, A.; Nichol, B. A community-centred approach to global health security: Implementation experience of community-based surveillance (CBS) for epidemic preparedness. Glob. Secur. Health Sci. Policy 2020, 5, 71–84. [Google Scholar] [CrossRef]
  20. Abbasghorbani, M.; Mashhadi, H.R.; Damchi, Y. Reliability-centred maintenance for circuit breakers in transmission networks. IET Gener. Transm. Distrib. 2014, 8, 1583–1590. [Google Scholar] [CrossRef]
  21. Adewumi, O.B.; Fotis, G.; Vita, V.; Nankoo, D.; Ekonomou, L. The Impact of Distributed Energy Storage on Distribution and Transmission Networks’ Power Quality. Appl. Sci. 2022, 12, 6466. [Google Scholar] [CrossRef]
  22. Shahbazi, A.; Aghaei, J.; Pirouzi, S.; Niknam, T.; Shafie-khah, M.; Catalão, J.P. Effects of resilience-oriented design on distribution networks operation planning. Electr. Power Syst. Res. 2021, 191, 106902. [Google Scholar] [CrossRef]
  23. Shahbazi, A.; Aghaei, J.; Pirouzi, S.; Shafie-khah, M.; Catalão, J.P. Hybrid stochastic/robust optimization model for resilient architecture of distribution networks against extreme weather conditions. Int. J. Electr. Power Energy Syst. 2021, 126, 106576. [Google Scholar] [CrossRef]
  24. Asl, S.A.F.; Gandomkar, M.; Nikoukar, J. Optimal protection coordination in the micro-grid including inverter-based distributed generations and energy storage system with considering grid-connected and islanded modes. Electr. Power Syst. Res. 2020, 184, 106317. [Google Scholar] [CrossRef]
  25. Ghobadpour, S.; Gandomkar, M.; Nikoukar, J. Determining Optimal Size of Superconducting Fault Current Limiters to Achieve Protection Coordination of Fuse-Recloser in Radial Distribution Networks with Synchronous DGs. Electr. Power Syst. Res. 2020, 185, 106357. [Google Scholar] [CrossRef]
  26. Elmitwally, A.; Kandil, M.S.; Gouda, E.; Amer, A. Mitigation of DGs Impact on Variable-Topology Meshed Network Protection System by Optimal Fault Current Limiters Considering Overcurrent Relay Coordination. Electr. Power Syst. Res. 2020, 186, 106417. [Google Scholar] [CrossRef]
  27. Farzinfar, M.; Jazaeri, M. A novel methodology in optimal setting of directional fault current limiter and protection of the MG. Int. J. Electr. Power Energy Syst. 2020, 116, 105564. [Google Scholar] [CrossRef]
  28. Pirouzi, S.; Aghaei, J.; Vahidinasab, V.; Niknam, T.; Khodaei, A. Robust linear architecture for active/reactive power scheduling of EV integrated smart distribution networks. Electr. Power Syst. Res. 2018, 155, 8–20. [Google Scholar] [CrossRef]
  29. Pirouzi, S.; Aghaei, J. Mathematical Modeling of Electric Vehicles Contributions in Voltage Security of Smart Distribution Networks. Simul. Trans. Soc. Model. Simul. Int. 2018, 95, 429–439. [Google Scholar]
  30. Pirouzi, S.; Aghaei, J.; Shafie-khah, M.; Osório, G.J.; Catalão, J.P.S. Evaluating the security of electrical energy distribution networks in the presence of electric vehicles. In Proceedings of the 2017 IEEE Manchester PowerTech, Manchester, UK, 18–22 June 2017; pp. 1–6. [Google Scholar]
  31. Hamidpour, H.; Aghaei, J.; Dehghan, S.; Pirouzi, S.; Niknam, T. Integrated resource expansion planning of wind integrated power systems considering demand response programmes. IET Renew. Power Gener. 2018, 13, 519–529. [Google Scholar] [CrossRef]
  32. Kavousi-Fard, A.; Khodaei, A. Efficient integration of plug-in electric vehicles via reconfigurable microgrids. Energy 2016, 111, 653–663. [Google Scholar] [CrossRef]
  33. Aghaei, J.; Barani, M.; Shafie-khah, M.; AASdl, N.; Catalão, J.P.S. Risk-constrained offering strategy for aggregated hybrid power plant including wind power producer and demand response provider. IEEE Trans. Sustain. Energy 2016, 7, 513–525. [Google Scholar] [CrossRef]
  34. Sheta, A.N.; Sedhom, B.E.; Eladl, A.A. Comparative framework for AC-microgrid protection schemes: Challenges, solutions, real applications, and future trends. Prot. Control Mod. Power Syst. 2023, 8, 1–40. [Google Scholar] [CrossRef]
  35. Aranizadeh, A.; Mirmozaffari, M.; Farahani, B.K. Maximizing Wind Turbine Power Generation Through Adaptive Fuzzy Logic Control for Optimal Efficiency and Performance. Wind 2025, 5, 4. [Google Scholar] [CrossRef]
Figure 1. Flowchart for optimal location, sizing, and protection coordination in islanded microgrid systems.
Energies 18 01601 g001
Figure 2. The framework of the proposed two-stage problem of protection coordination.
Energies 18 01601 g002
Figure 3. The 9-bus test MG [8].
Energies 18 01601 g003
Figure 4. Forecasted power percentage of RESS [15].
Energies 18 01601 g004
Figure 5. Expected daily power curve of network load, RESs and ESSs: (a) active power and (b) reactive power.
Energies 18 01601 g005
Figure 6. The 32-bus test MG [32].
Energies 18 01601 g006
Table 1. Compare the proposed method and previous methods.
No.Aspect[6][12][13][14][22][23][24][25][26][27]PS
1Opt. Algorithm
2Protection
3MG Clustering
4MMG
5Reliability
6DG Planning
7FCL Planning
8Economic
9Operation
10Security
PS: Proposed Strategy, Opt: Optimal, MG: Microgrid, MMG: Multi-MG.
Table 2. The data of the proposed problem related to 9-bus MG.
ParameterValue
Load power (MVA) at peak load time2
Load power factor0.9
Forecasted load profile (percentage)Hourly pattern for one day based on [28]
Line length (m)500
Resistance of line (Ω/km)0.1529
Reactance of line (Ω/km)0.1406
Transformer characterize 20 MVA, 115 kV/12.47 kV
Maximum reactance size of FCL (Ω)6
Minimum and maximum voltage (p.u)0.9 and 1.05 [29]
Maximum capacity size of DG and ESS (p.u)4 MVA and 25 MWh
Annual investment cost of DG and ESS ($/p.u/year)5000 and 1000
Horizon planning 5 years
Charging and discharging efficiency of ESS0.88
α, β, τ, ε0.1, 0.5, 2.5 h, 0.1
ρch, ρdch ($/MWh)1, 1.5
Table 3. DGs and ESSs planning results in islanded MG.
DeviceLocation (Bus)CapacityRelay NumberInvestment Cost (USD)Expected Operation Cost (USD)
PV133 MVAR1875,0000
PV273 MVAR1975,0000
WS134 MVAR20100,0000
WS274 MVAR21100,0000
ESS1321 MWhR22105,00087,816
ESS2721 MWhR23105,00087,816
Total cost (USD)560,000175,632
Table 4. Grid-connected and islanded MG index results.
Grid-Connected ModeIslanded Mode
VariableValueVariableValue
Maximum voltage deviation (p.u)0.0073Maximum voltage deviation (p.u)0.0038
Expected daily energy loss (MWh)1.0114Expected daily energy loss (MWh)0.9435
Table 5. Relay operation mode while considering optimal planning of DGs and ESSs in 9-bus radial MG.
Fault LocationThe Operation Mode of Relays, P: Primary, B: Backup
P1BP2B
F10R1R10, R17R2R4
F11R3R1R4R6, R18, R20, R22
F12R5R3, R18, R20, R22R6R8
F13R7R5R8
F14R9R2, R17R10R12
F15R11R9R12R14, R19, R21, R23
F16R13R11, R19, R21, R23R14R16
F17R15R13R16
Table 6. Optimal setting parameters of DSORs and sizing of FCLs.
RelayTDSfw (s)TDSrv (s)IP_fw (p.u)IP_rv (p.u)
R10.10.21350.46480.4648
R20.10.18880.51550.5248
R30.10.50000.25970.2597
R40.10.47820.53500.5350
R50.10.12000.20580.2058
R60.10.45190.67830.6783
R70.10.34020.10000.1000
R80.10.10.99980.9998
R90.10.41790.31070.3107
R100.10.29660.58160.5816
R110.10.10.48780.4878
R120.10.49590.39880.3988
R130.10.10.30570.3057
R140.10.12000.71290.7129
R150.10.10.10000.1000
R160.10.33660.72730.7273
R170.10.30280.67470.6747
R180.10.45300.78910.8561
R190.10.31160.97800.9780
R200.10.49970.66740.6674
R210.10.48350.78910.7891
R220.10.32230.97800.9780
R230.10.10.66740.6674
ze of FCL (XFCL)1.5212 p.u
Table 7. Results of the proposed optimal protection coordination strategy.
MG Operation ModeGrid-Connected ModeIslanded ModeBoth Modes of Operation
Expected total daily relay operation time (s)510531.361041.36
Expected total hourly relay operation time (s)21.2522.1443.39
Minimum operation time (s)0.18350.19240.1835
maximum operation time (s)1.95412.018362.01836
Table 8. DGs and ESSs planning results in islanded MG.
DeviceBusCapacityRelay Number
WS1, ESS1180.45 MVA, 1.8 MWhR33, R34
WS2, ESS2221.1 MVA, 4.8 MWhR35, R36
WS3, ESS3250.6 MVA, 2.5 MWhR37, R38
WS4, ESS4300.6 MVA, 2.5 MWhR39, R40
WS5, ESS560.7 MVA, 2.8 MWhR41, R42
WS6, ESS6130.7 MVA, 2.8 MWhR43, R44
Total investment cost = USD 194,750. Expected operation cost = USD 56,583.
Table 9. DGs and ESSs planning results is islanded MG.
MG Operation ModeGrid-Connected ModeIslanded ModeBoth Modes of Operation
Expected total daily relay operation time (s)578.4652.321282
Expected total hourly relay operation time (s)24.1027.1851.28
Minimum operation time (s)0.13360.14110.1336
maximum operation time (s)1.53721.64221.6422
Size of FCL (XFCL) = 1.8735 p.u
Table 10. Statistical results of different solvers.
ParameterStage 1
CSAGAPSO
Minimum of the objective function226,331257,302249,463
Maximum of the objective function226,342257,518249,685
Mean of the objective function226,336257,422249,574
Median of the objective function226,335257,404249,564
Mode of the objective function226,336257,445249,588
Standard deviation the of objective function1.13%5.33%3.74%
ParameterStage 2
CSACSACSA
Minimum of the objective function1280.341280.341280.34
Maximum of the objective function1285.231285.231285.23
Mean of the objective function1282.111282.111282.11
Median of the objective function1281.961281.961281.96
Mode of the objective function1282.111282.111282.11
Standard deviation the of objective function1.21%1.21%1.21%
Disclaimer/Publisher’s Note: The statements, opinions and data contained in all publications are solely those of the individual author(s) and contributor(s) and not of MDPI and/or the editor(s). MDPI and/or the editor(s) disclaim responsibility for any injury to people or property resulting from any ideas, methods, instructions or products referred to in the content.

