
An Enhanced NSGA-II Algorithm with Parameter Categorization for Computational-Efficient Multi-Objective Optimization of Active Glass Curtain Wall Shading Systems

Abstract
1. Introduction
2. Establishment of Building Model
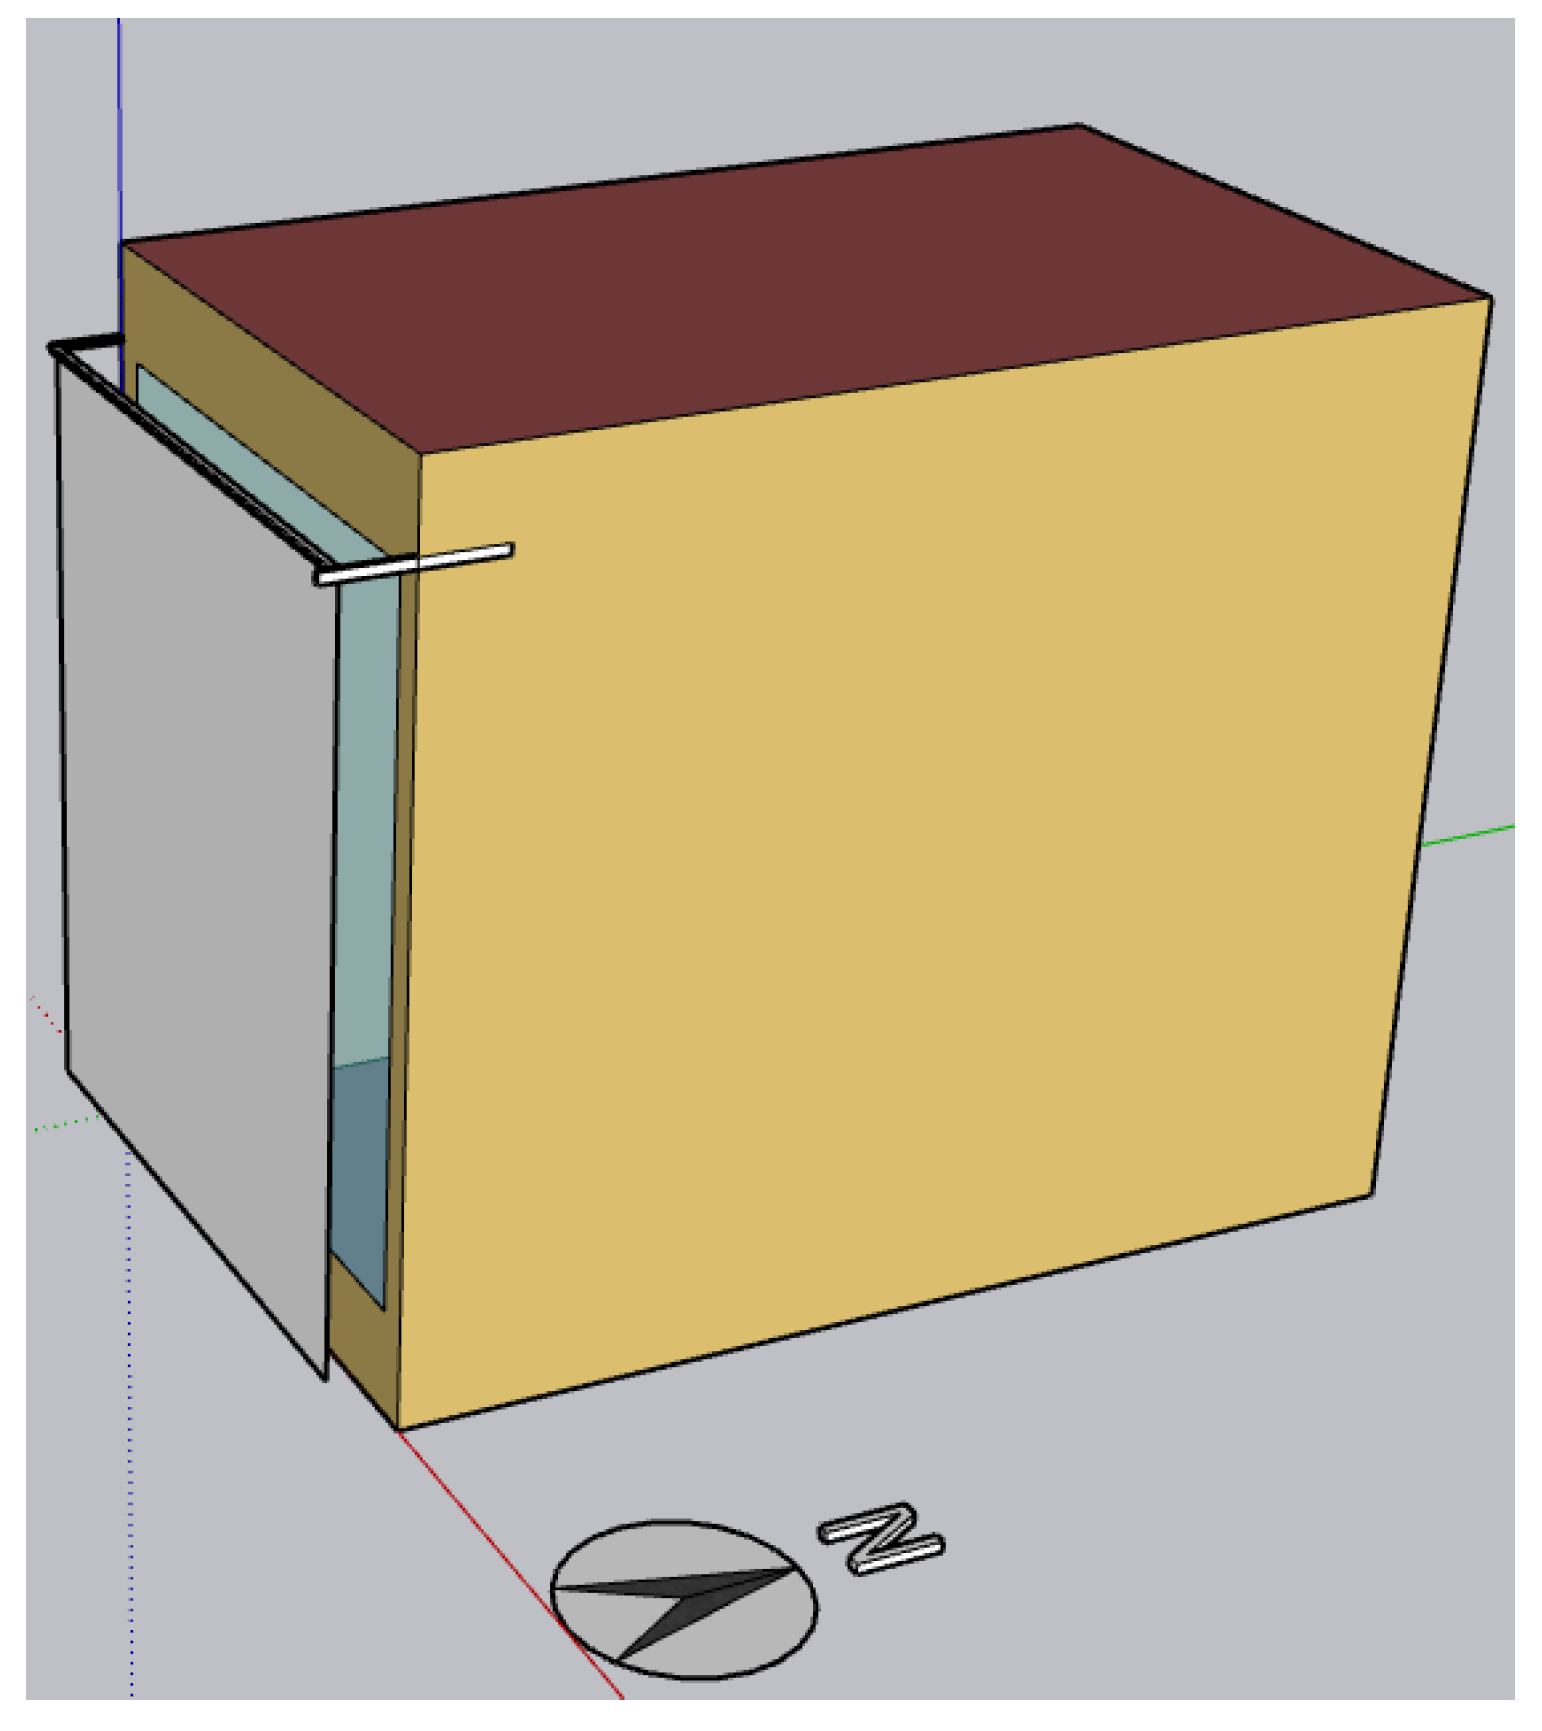
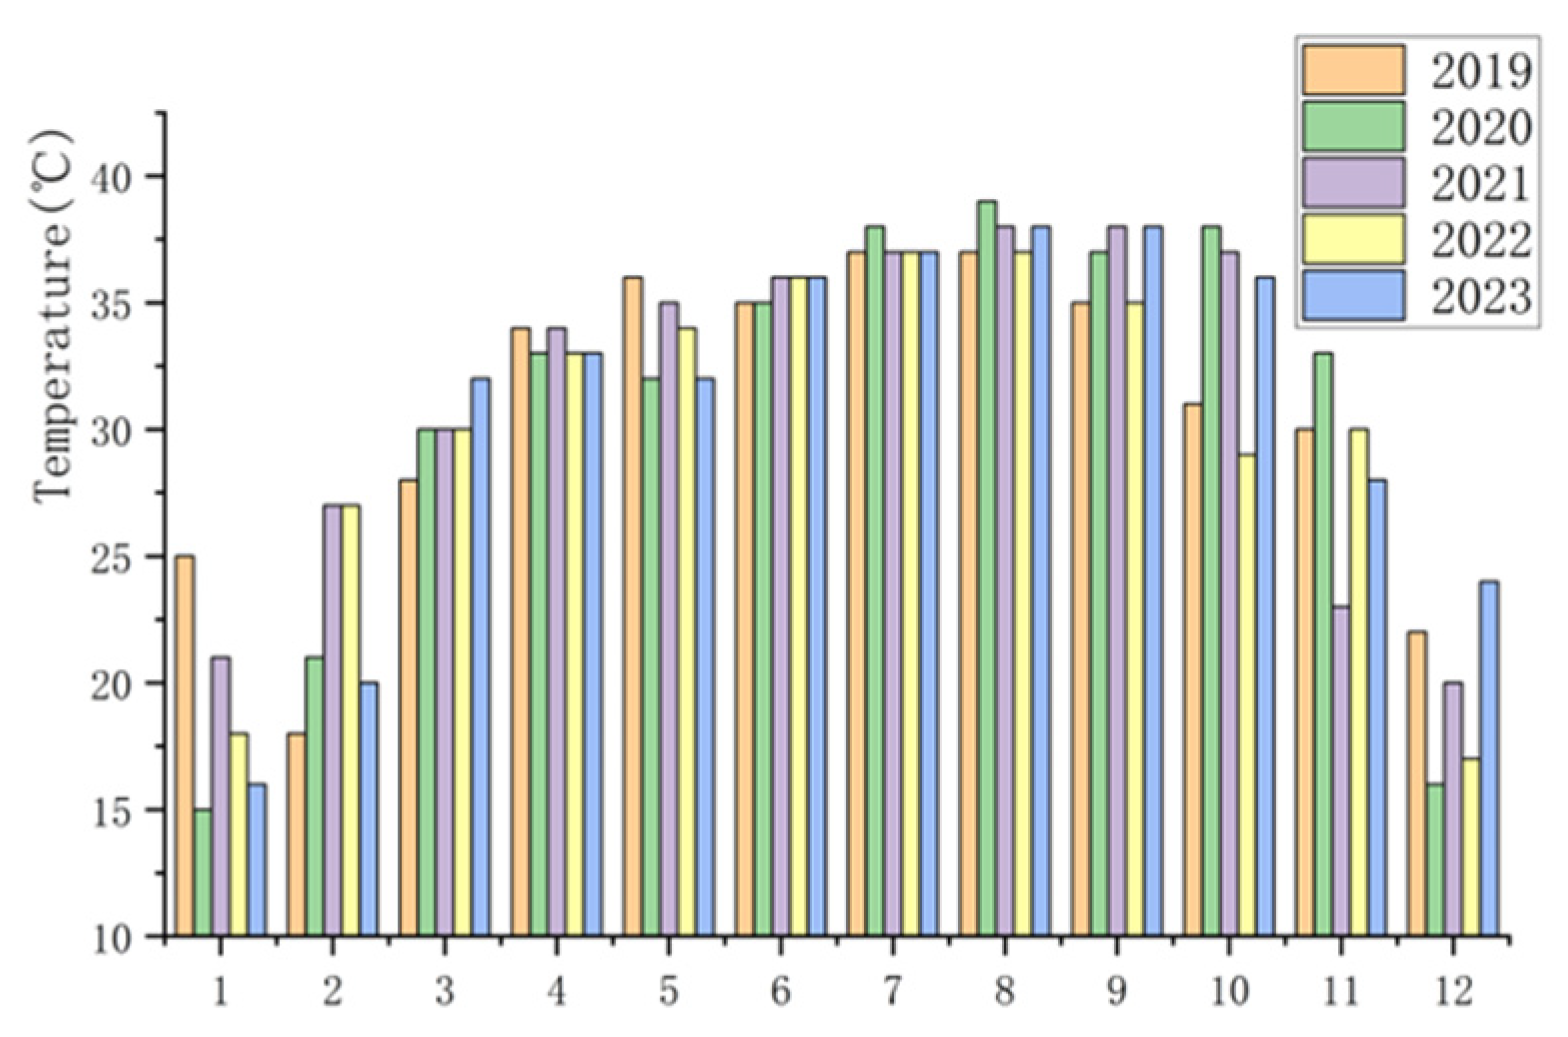
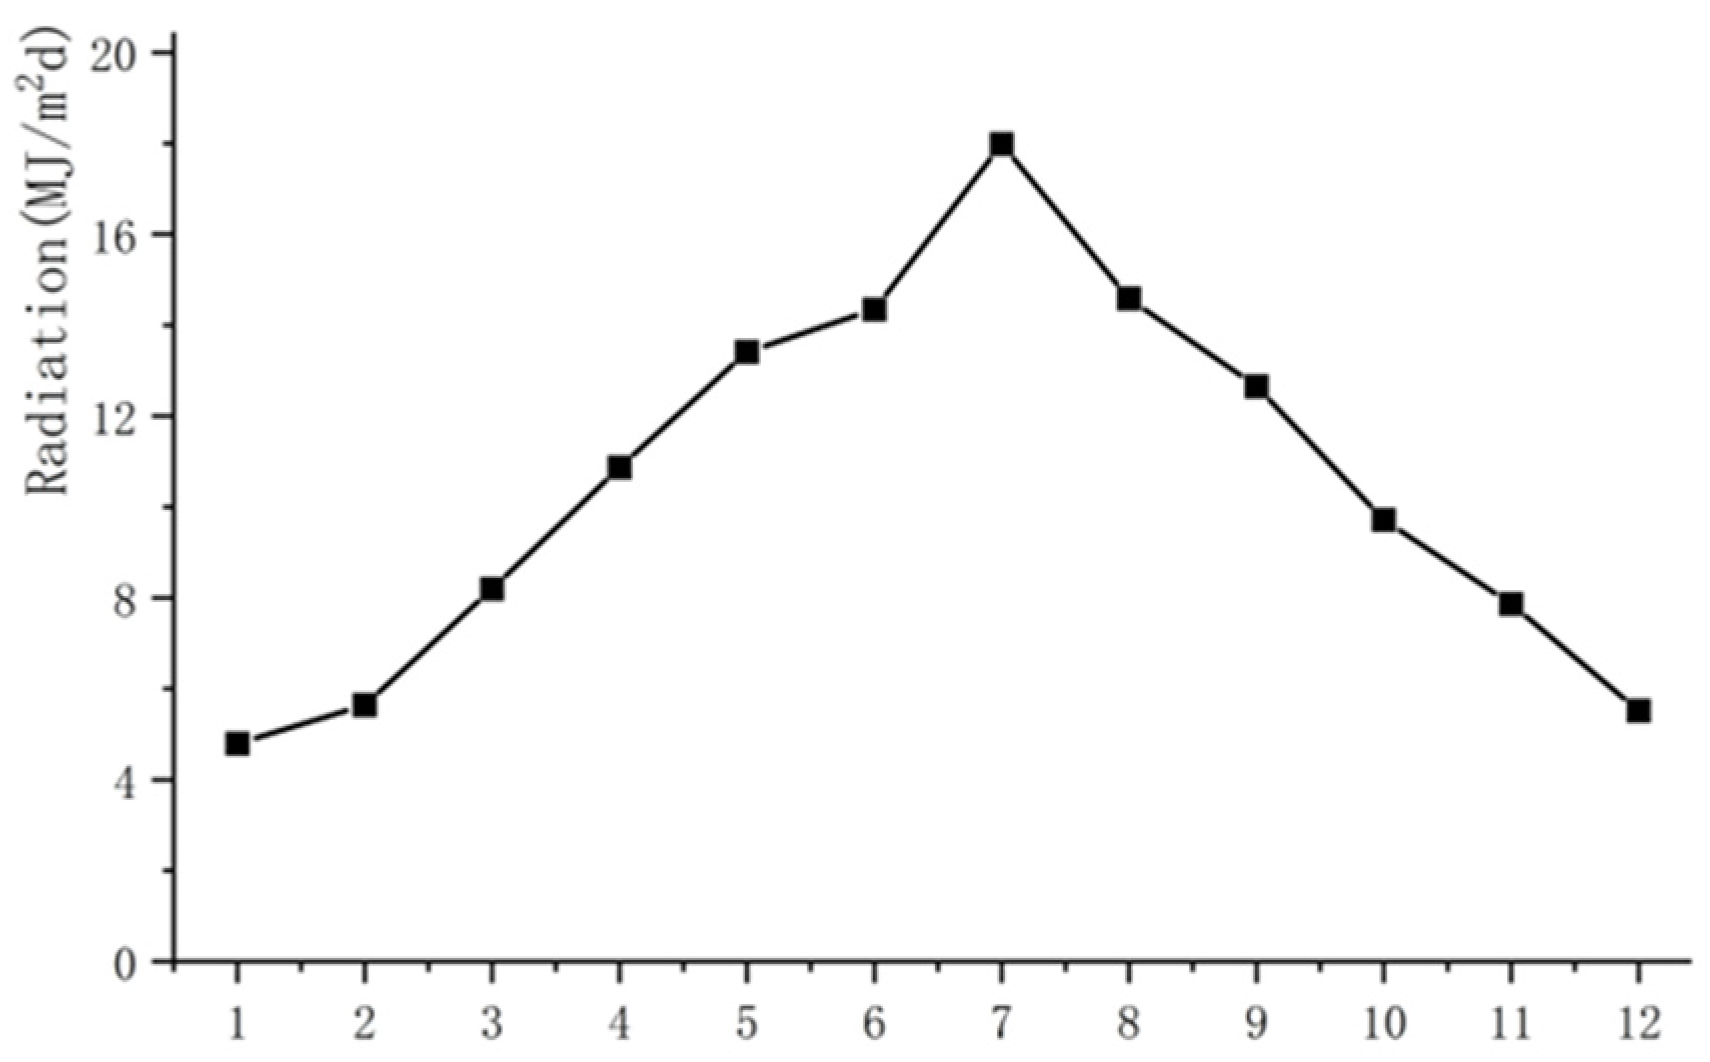
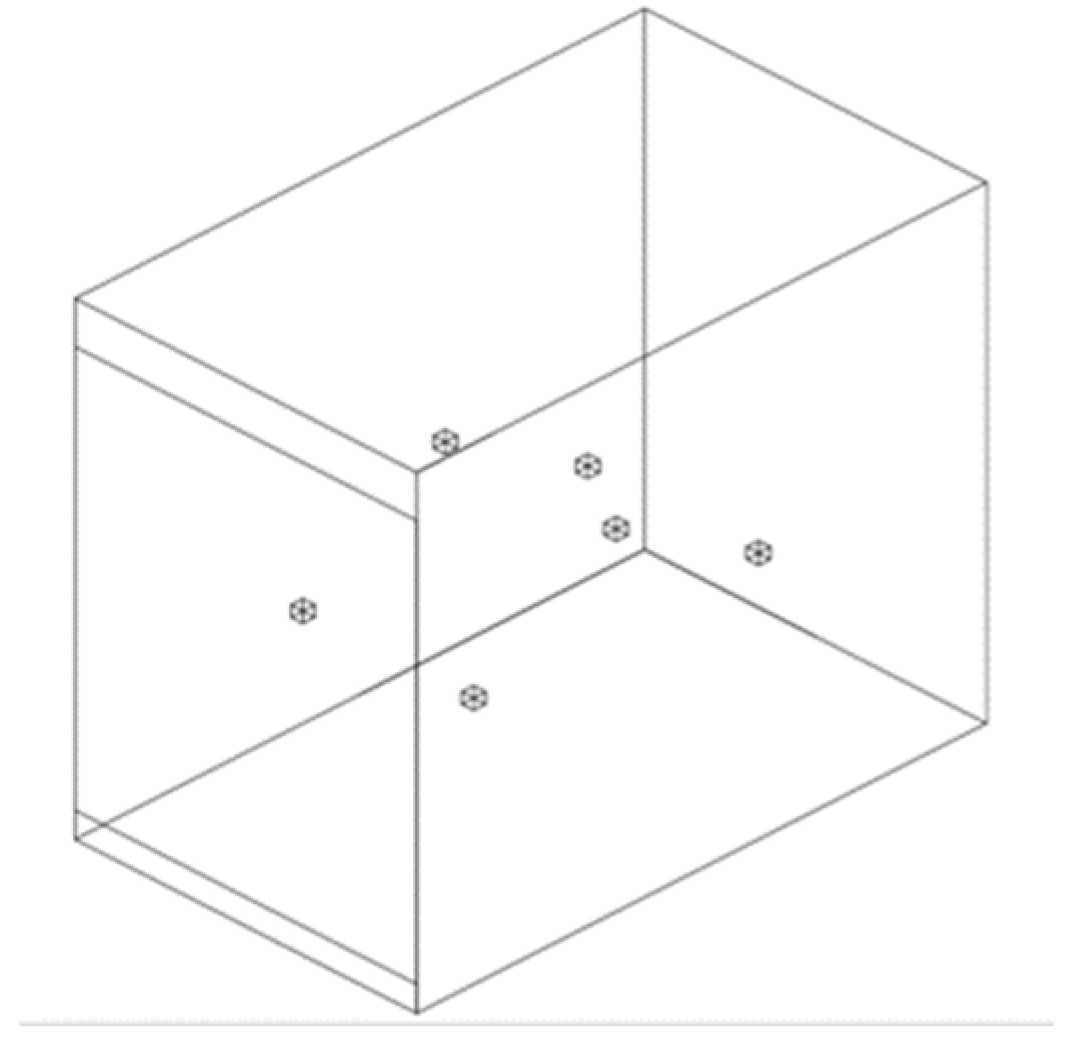
2.1. Experimental Object
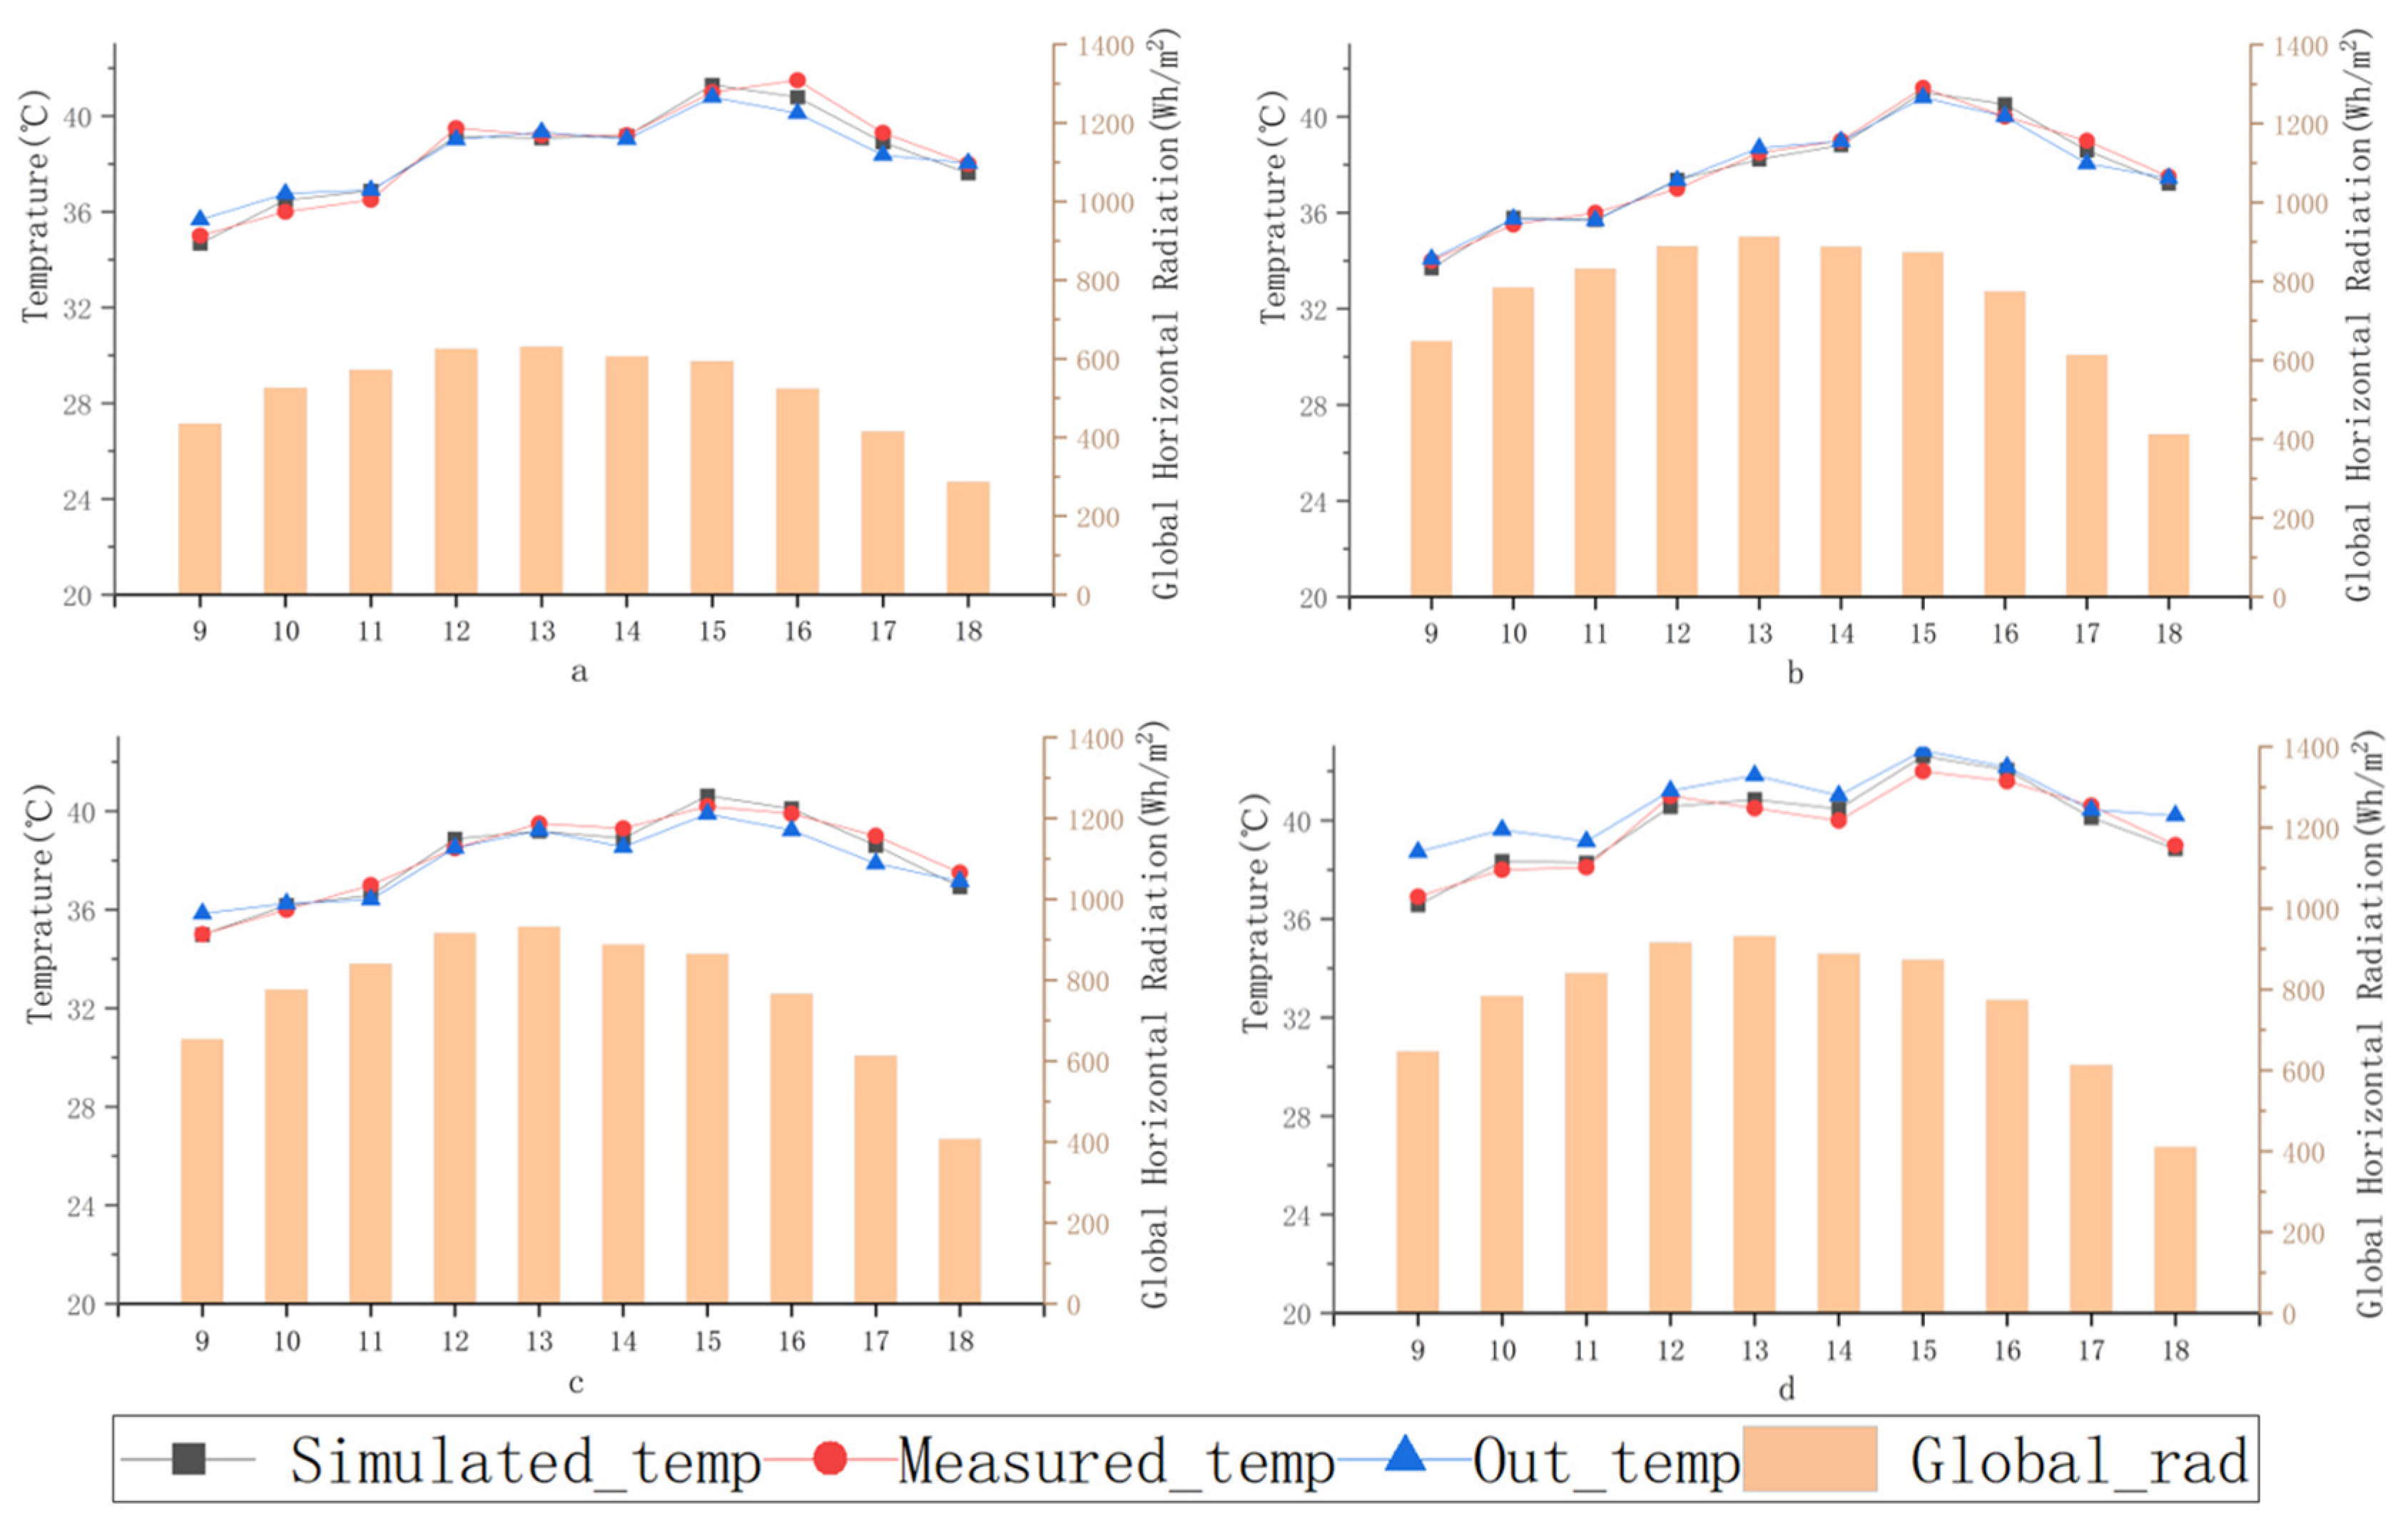
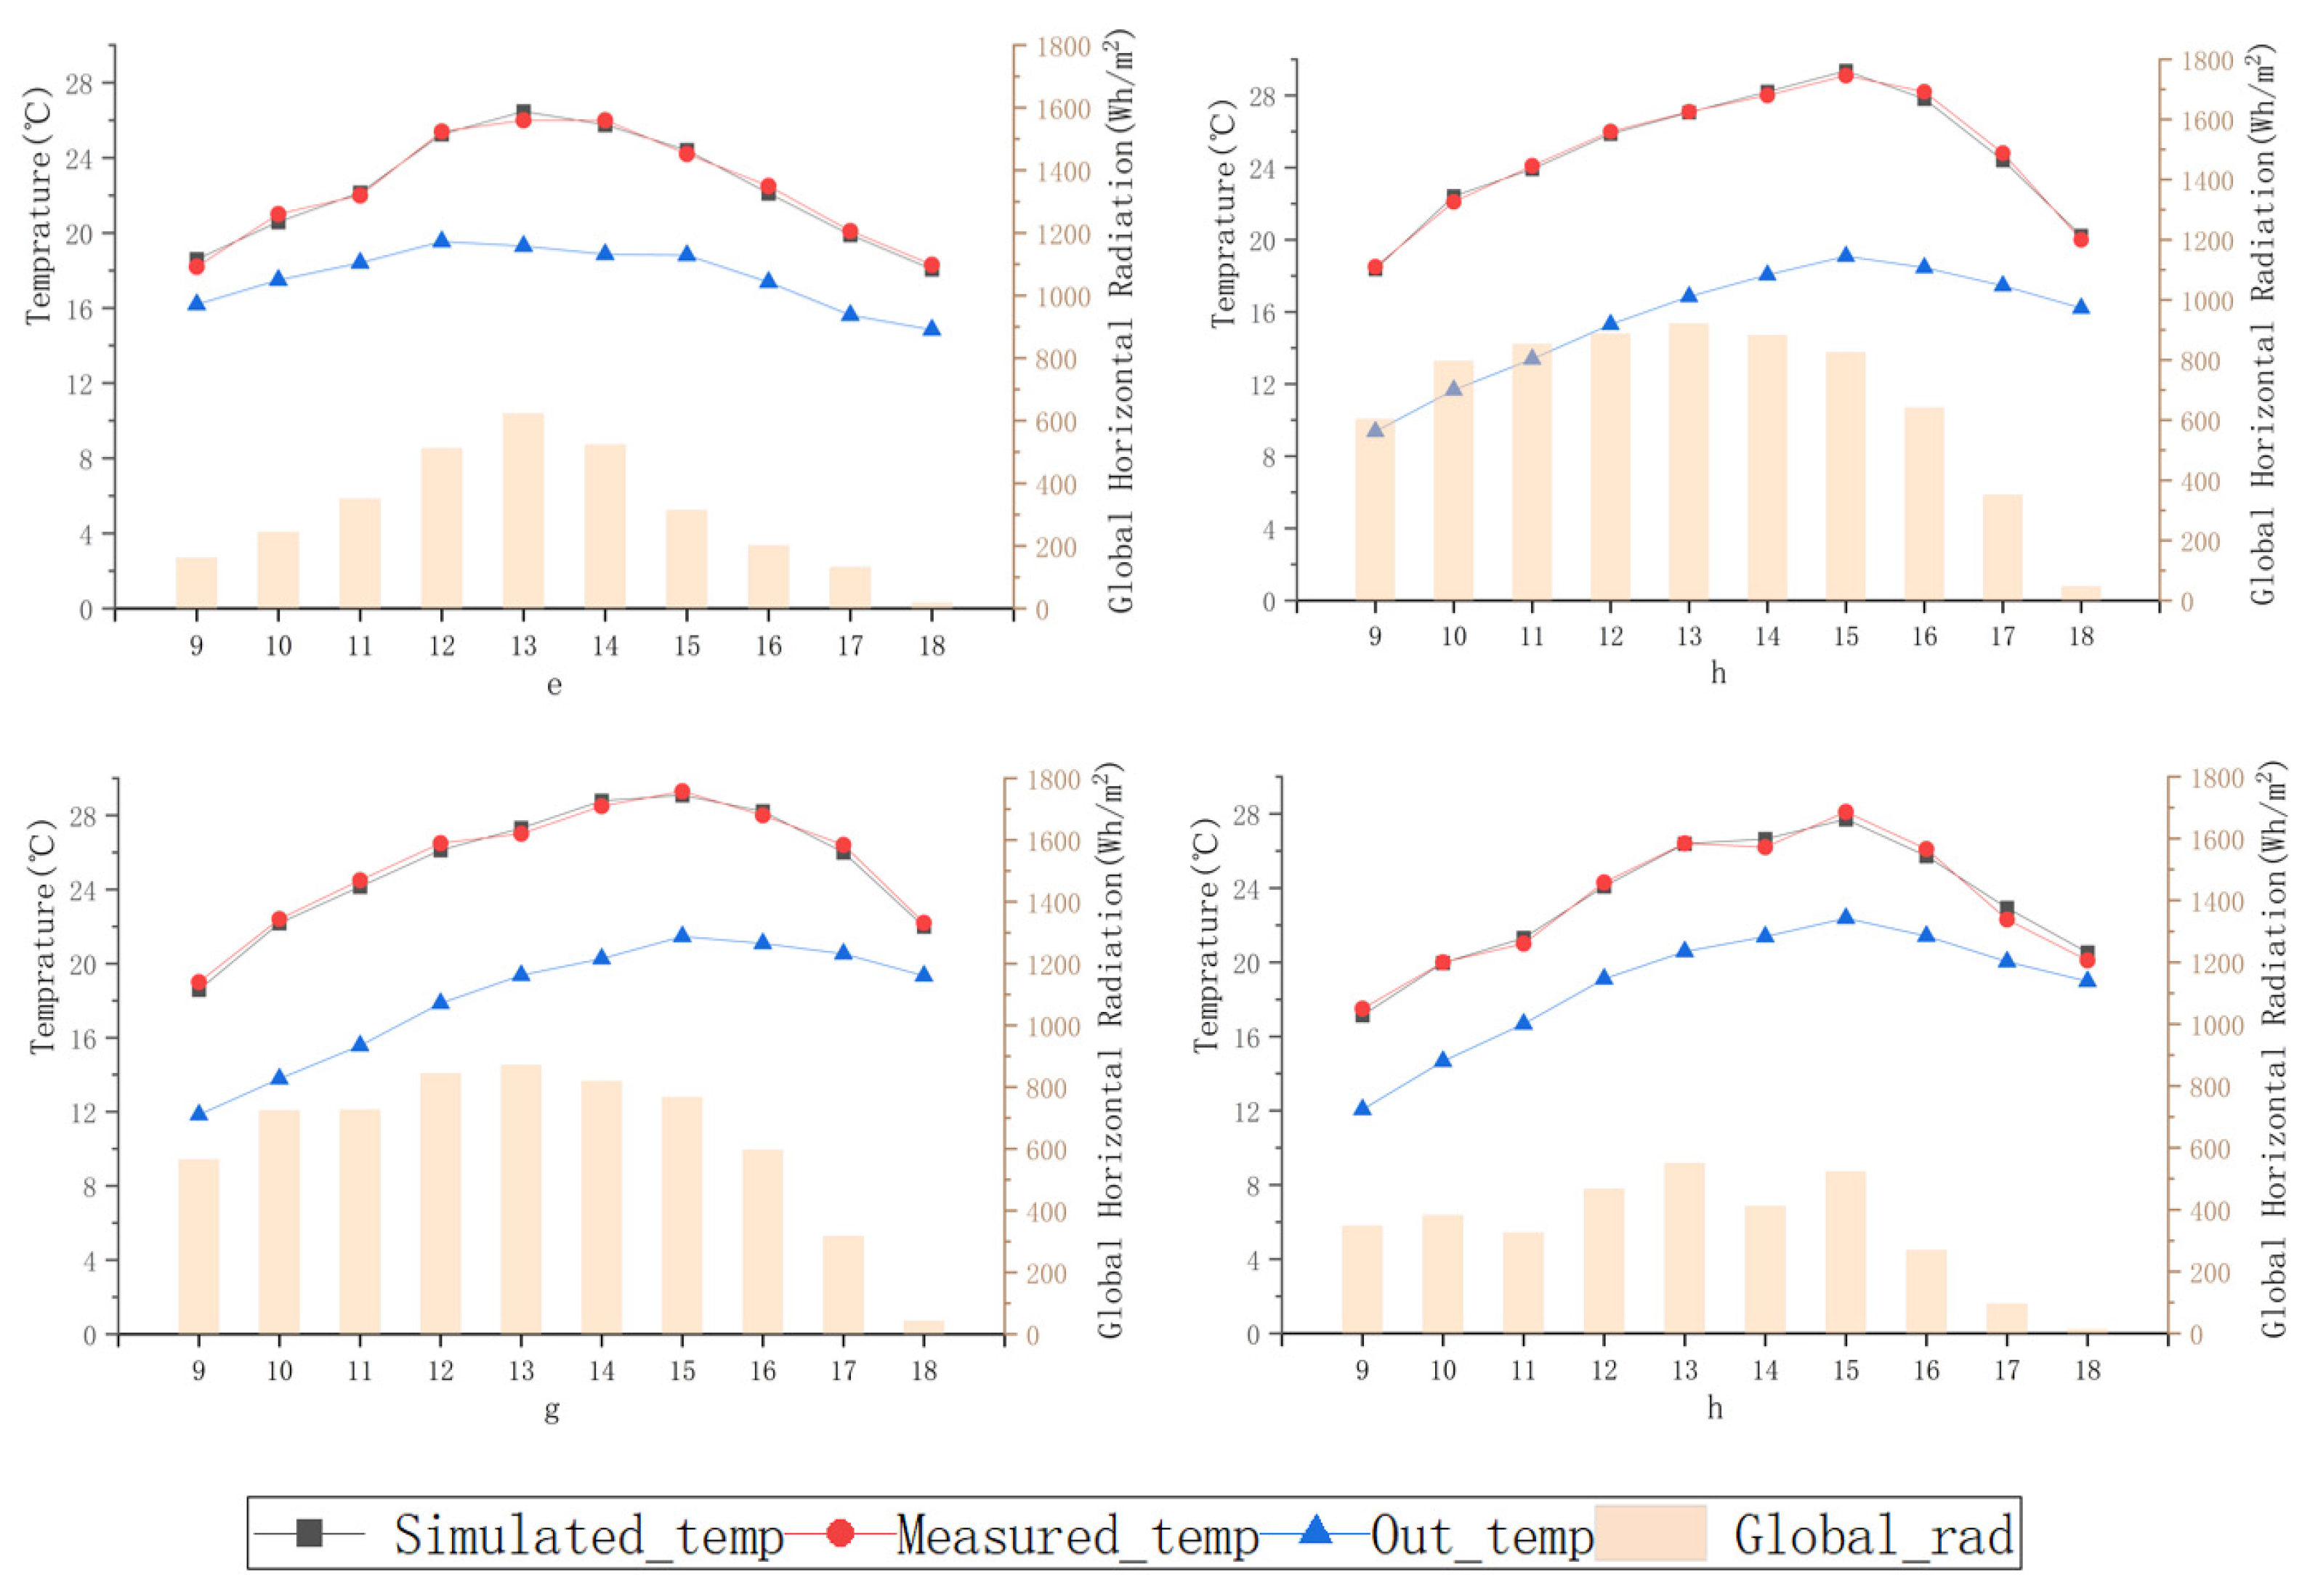
2.2. Validation Model
- Root Mean Square Error:
- 2.
- Normalized RMSE:
- Summer condition: RMSE = 0.138 °C (NRMSE = 0.00359)
- Winter condition: RMSE = 0.0964 °C (NRMSE = 0.00403)
2.3. The Building’s Internal Loads and the HVAC System
3. Methodology
3.1. Multi-Objective Optimization
- Reducing Computational Complexity: NSGA-II introduces a fast non-dominated sorting method, reducing the algorithm’s computational complexity from O(MN3) to O(MN2), where M is the number of objectives and N is the population size.
- Maintaining Population Diversity: NSGA-II uses a crowding comparison operator to estimate the crowding degree among individuals. Within the same non-dominated level, individuals with higher crowding degrees are more likely to be selected, preventing the algorithm from prematurely converging to local optimal solutions.
- Introducing the Elite Retention Mechanism: The offspring generated by individuals selected for reproduction compete with their parent individuals to form the next generation population.
3.2. Visual Discomfort Time
3.3. Building Energy Consumption
3.4. Objective Function
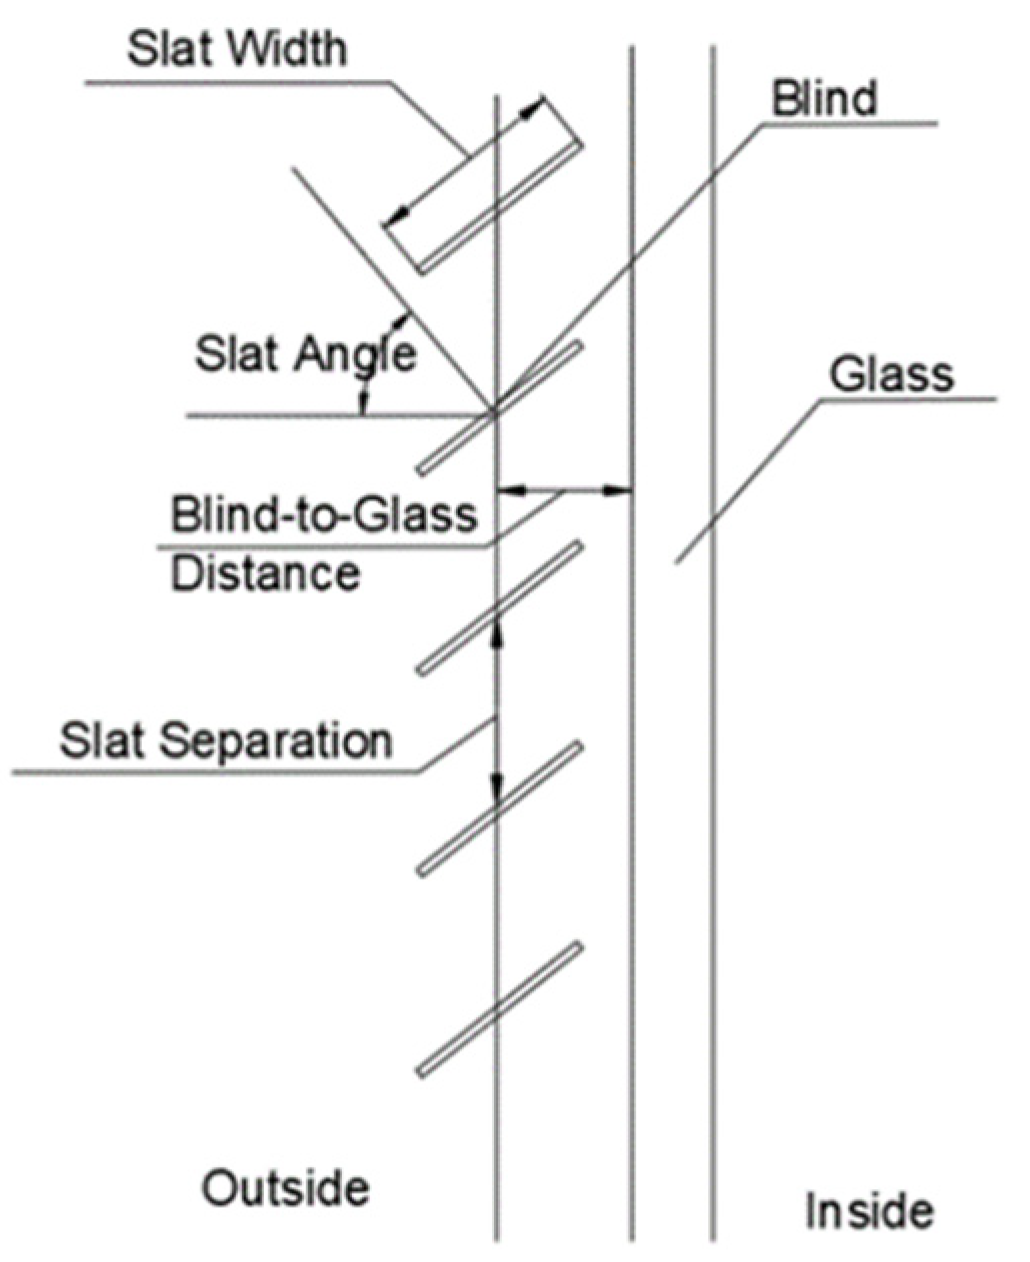
3.5. Bound Variable
- Slat Width Constraint: 0.01 m ≤ B ≤ 0.2 m;
- Slat Angle Constraint: 20° ≤ A ≤ 160°;
- Blind to glass distance Constraint: 0.01 m ≤ D ≤ 0.25 m;
- Slat Separation Constraint: 0.01 m ≤ S ≤ 0.2 m.
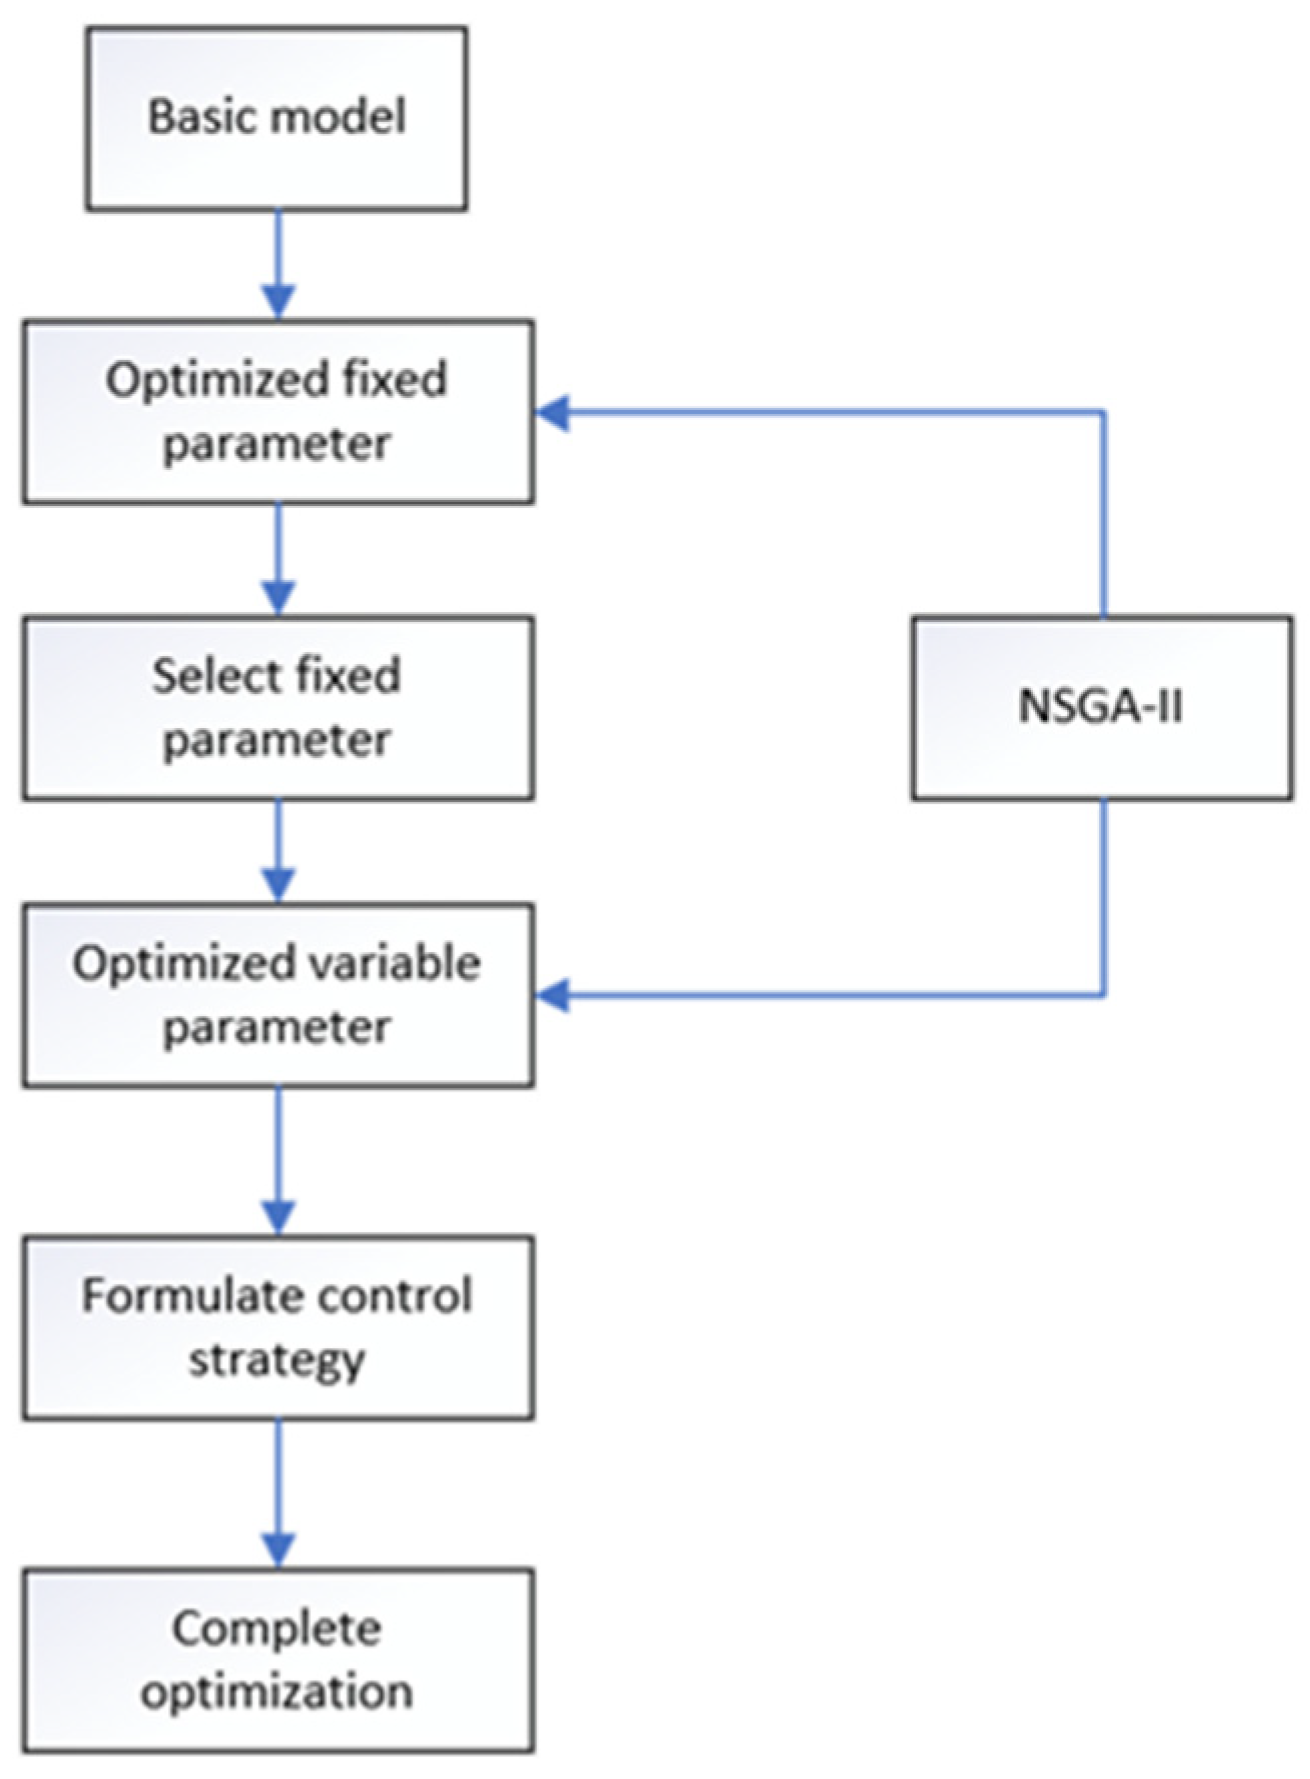
3.6. Improved Optimization Algorithm
4. Results
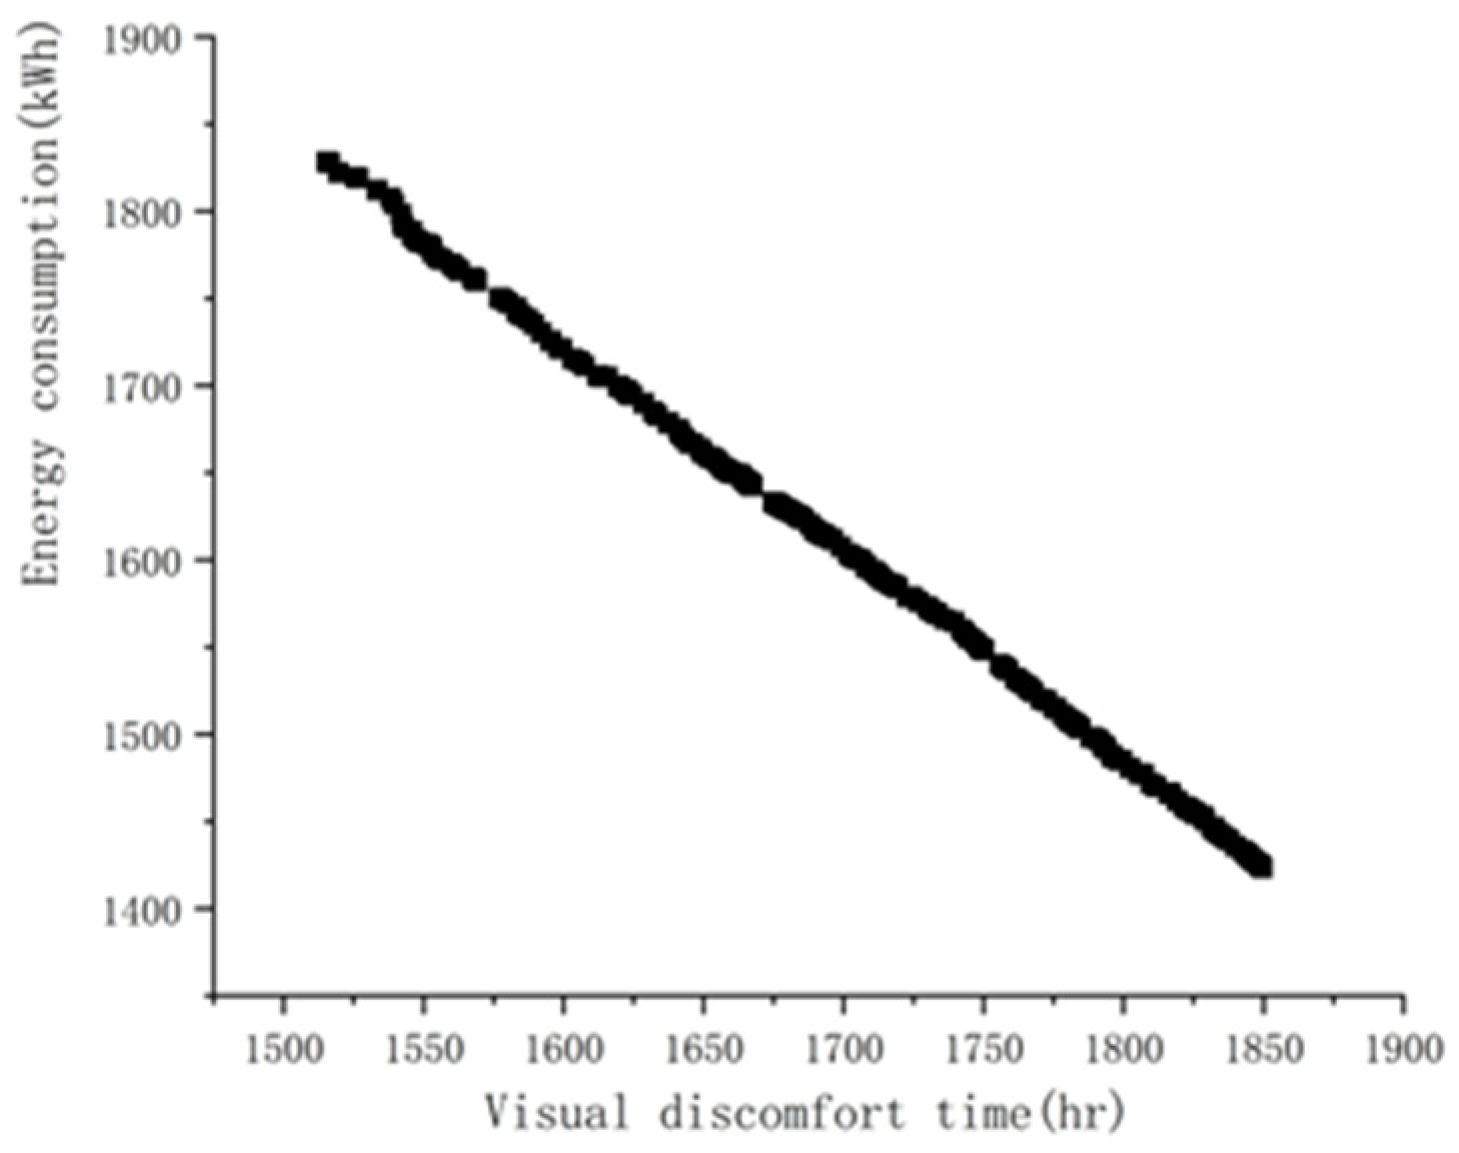
4.1. The Result of Optimization of Fixed Parameters
- Energy consumption weight (a1) = 0.4 vs. daylight discomfort duration weight (a2) = 0.6;
- Energy consumption weight (a1) = 0.6 vs. daylight discomfort duration weight (a2) = 0.4
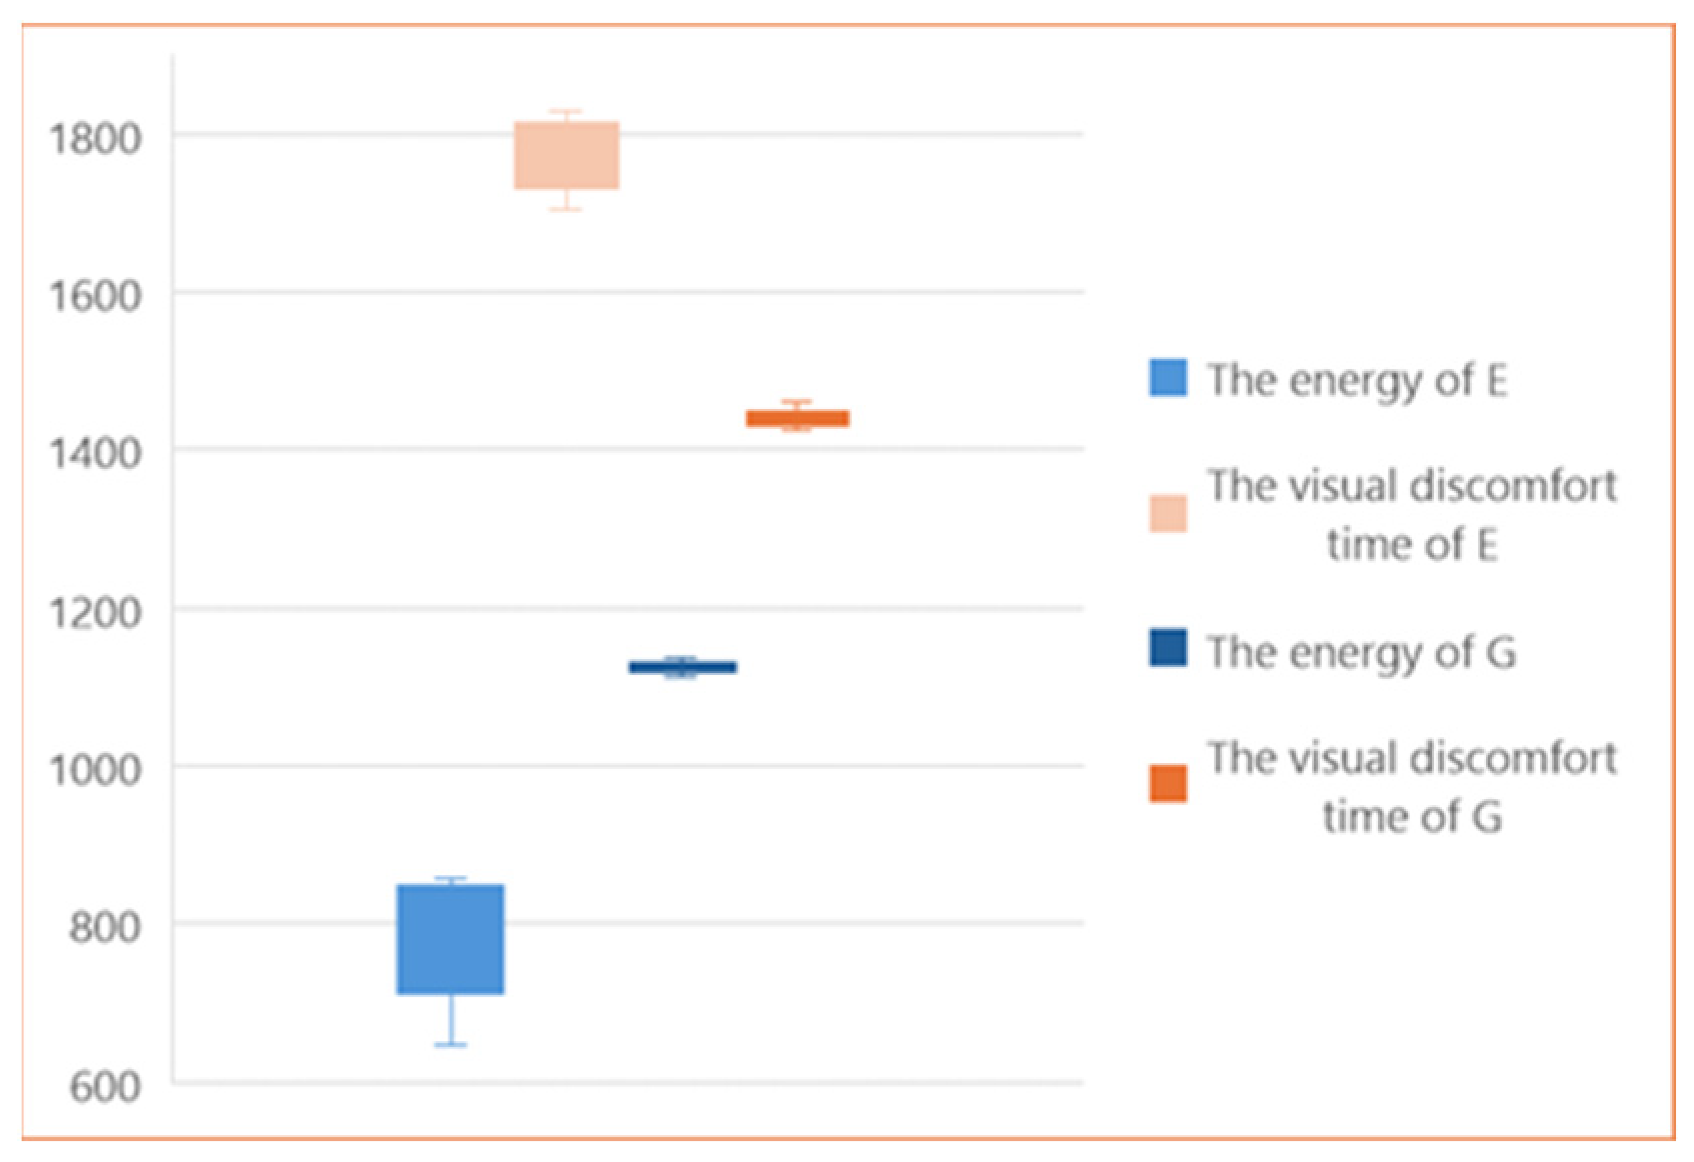
- Scenario G: Louver width = 0.01 m, louver spacing = 0.19 m;
- Scenario E: Louver width = 0.12 m, louver spacing = 0.09 m.
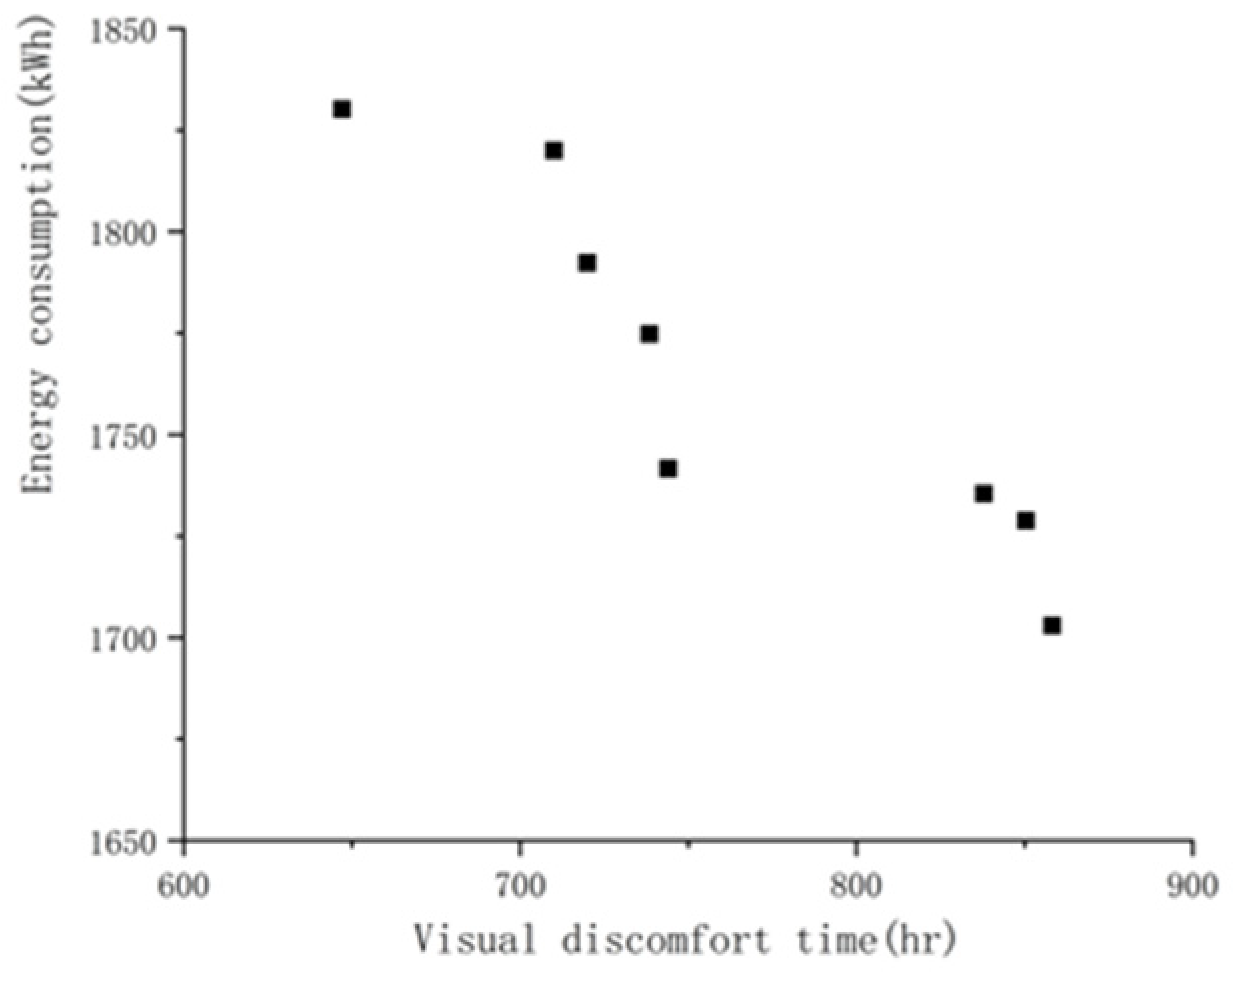
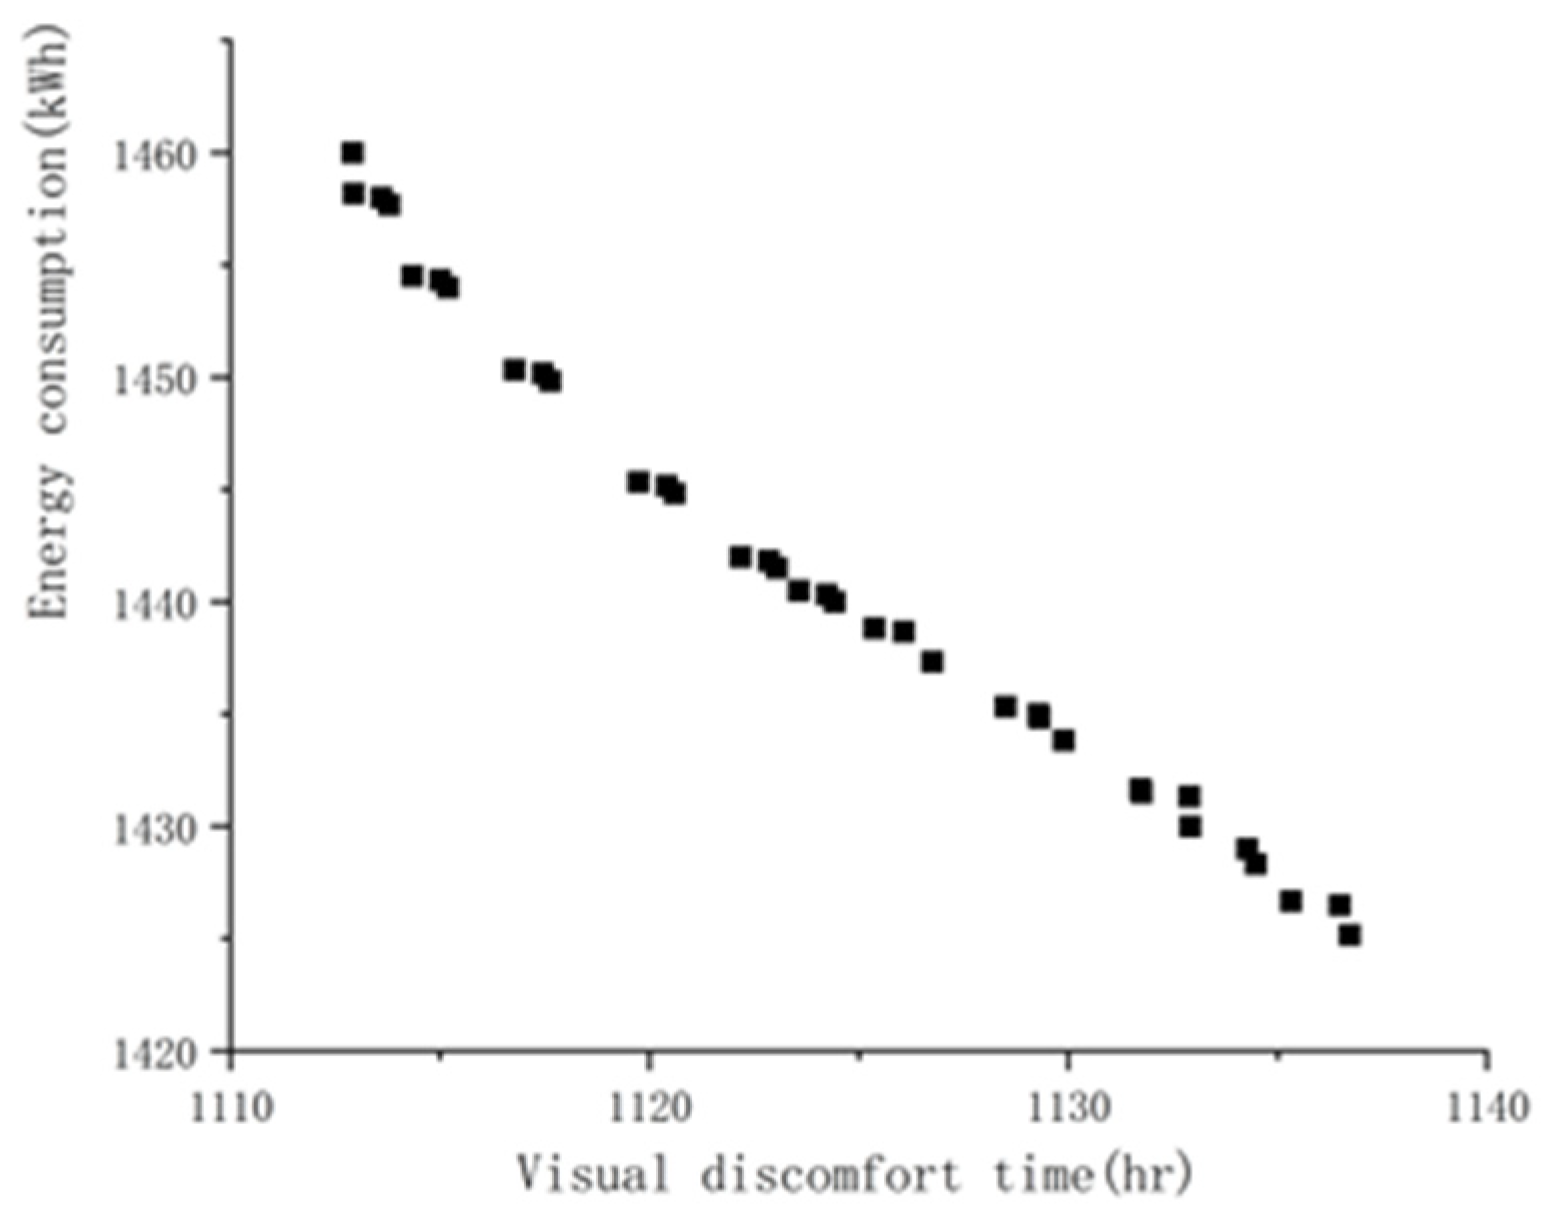
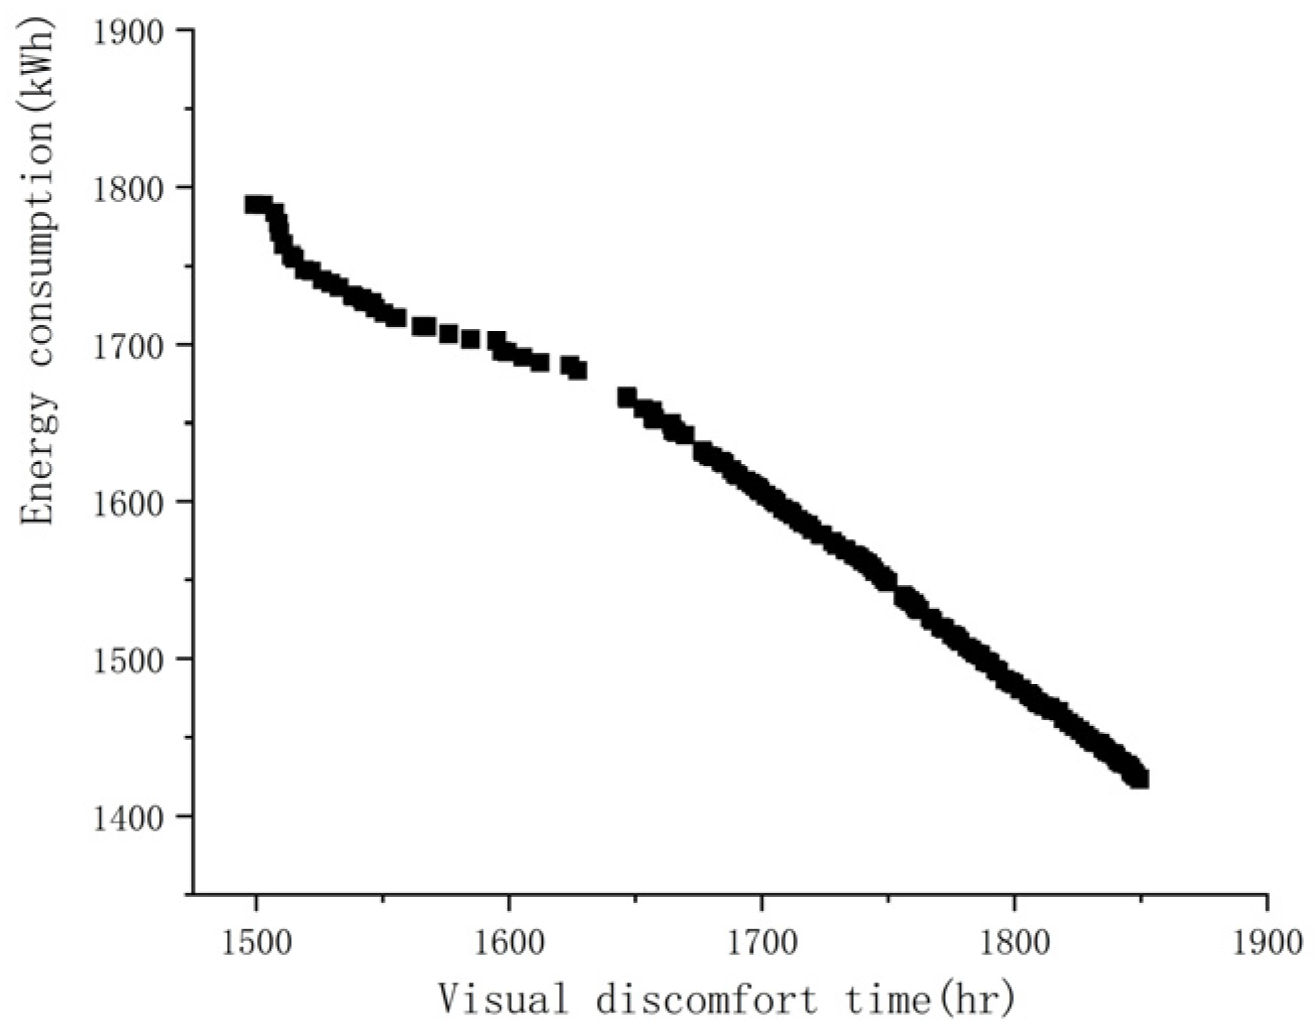
4.2. The Result of Variable Parameter Optimization
- Angle θ1: Louver orientation during period B;
- Angle θ2: Shared orientation for periods A and C;
- Blind to glass distance.
5. Conclusions
Author Contributions
Funding
Data Availability Statement
Conflicts of Interest
References
- China Association of Building Energy Efficiency; Institute of Urban and Rural Construction and Development; Chongqing University. Research report on building energy consumption and carbon emission in China (2023). Constr. Archit. 2024, 2, 46–59. [Google Scholar]
- Bao, S.; Zou, S.; Li, B.; Chen, Q.; Zhao, M. Experiments on the cooling effect of modular vertical greening on double-glazed façade in summer. Build. Environ. 2022, 226, 109771. [Google Scholar] [CrossRef]
- Othman, A.R.; Khalid, A.A.M. Comparative Performance of Internal Venetian Blind and Roller Blind with Respects to Indoor Illumination Levels. Procedia—Soc. Behav. Sci. 2013, 101, 542–553. [Google Scholar]
- Hashemi, A. Daylighting and solar shading performances of an innovative automated reflective louvre system. Energy Build. 2014, 82, 607–620. [Google Scholar]
- Lee, J.H.; Kang, J.-S. Study on Lighting Energy Savings by Applying a Daylight-Concentrating Indoor Louver System with LED Dimming Control. Energies 2024, 17, 3425. [Google Scholar] [CrossRef]
- Fang, J.; Zhao, Y.; Tian, Z.; Lin, P. Analysis of dynamic louver control with prism redirecting fenestrations for office daylighting optimization. Energy Build. 2022, 262, 112019. [Google Scholar] [CrossRef]
- Konstantoglou, M.; Tsangrassoulis, A. Dynamic operation of daylighting and shading systems: A literature review. Renew. Sustain. Energy Rev. 2016, 60, 268–283. [Google Scholar]
- Hammad, F.; Abu-Hijleh, B. The energy savings potential of using dynamic external louvers in an office building. Energy Build. 2010, 42, 1888–1895. [Google Scholar]
- Uribe, D.; Vera, S.; Bustamante, W.; McNeil, A.; Flamant, G. Impact of different control strategies of perforated curved louvers on the visual comfort and energy consumption of office buildings in different climates. Sol. Energy 2019, 190, 495–510. [Google Scholar]
- Liu, J.; Baghoolizadeh, M.; Basem, A.; Hamza, H.; Sudhamsu, G.; Al-Musawi, T.J.; Sultan, A.J.; Salahshour, S.; Alizadeh, A. Geometrical optimization of solar venetian blinds in residential buildings to improve the economic costs of the building and the visual comfort of the residents using the NSGA-II algorithm. Int. Commun. Heat Mass Transf. 2024, 157, 107723. [Google Scholar]
- Zhang, H.; Cui, Y.; Cai, H.; Chen, Z. Optimization and prediction of office building shading devices for energy, daylight, and view consideration using genetic and BO-LGBM algorithms. Energy Build. 2024, 324, 114939. [Google Scholar] [CrossRef]
- Ziaee, N.; Vakilinezhad, R. Multi-objective optimization of daylight performance and thermal comfort in classrooms with light-shelves: Case studies in Tehran and Sari, Iran. Energy Build. 2022, 254, 111590. [Google Scholar] [CrossRef]
- Jung, S.K.; Kim, Y.; Moon, J.W. Performance Evaluation of Control Methods for PV-Integrated Shading Devices. Energies 2020, 13, 3171. [Google Scholar] [CrossRef]
- Fan, Z.; Liu, M.; Tang, S. A multi-objective optimization design method for gymnasium facade shading ratio integrating energy load and daylight comfort. Build. Environ. 2022, 207, 108527. [Google Scholar] [CrossRef]
- Naderi, E.; Sajadi, B.; Behabadi, M.A.; Naderi, E. Multi-objective simulation-based optimization of controlled blind specifications to reduce energy consumption, and thermal and visual discomfort: Case studies in Iran. Build. Environ. 2020, 169, 106570. [Google Scholar] [CrossRef]
- Xiong, J.; Tzempelikos, A. Model-based shading and lighting controls considering visual comfort and energy use. Sol. Energy 2016, 134, 416–428. [Google Scholar] [CrossRef]
- Chen, X.; Zhao, H.; Wang, B.; Xia, B. Study of Factors Influencing Thermal Comfort at Tram Stations in Guangzhou Based on Machine Learning. Buildings 2025, 15, 865. [Google Scholar] [CrossRef]
- Chen, Z.; Cui, Y.; Zheng, H.; Ning, Q. Optimization and prediction of energy consumption, light and thermal comfort in teaching building atriums using NSGA-II and machine learning. J. Build. Eng. 2024, 86, 108687. [Google Scholar] [CrossRef]
- Michael, A.; Heracleous, C. Assessment of natural lighting performance and visual comfort of educational architecture in Southern Europe: The case of typical educational school premises in Cyprus. Energy Build. 2017, 140, 443–457. [Google Scholar] [CrossRef]
- Nezamdoost, A.; Van Den Wymelenberg, K.; Mahic, A. Assessing the energy and daylighting impacts of human behavior with window shades, a life-cycle comparison of manual and automated blinds. Autom. Constr. 2018, 92, 133–150. [Google Scholar] [CrossRef]
- Li, L.; Ma, Q.; Gao, W.; Wei, X. Incorporating users’ adaptive behaviors into multi-objective optimization of shading devices: A case study of an office room in Qingdao. Energy Build. 2023, 301, 113683. [Google Scholar]
- Vasquez, N.G.; Rupp, R.F.; Andersen, R.K.; Toftum, J. Occupants’ responses to window views, daylighting and lighting in buildings: A critical review. Build. Environ. 2022, 219, 109172. [Google Scholar] [CrossRef]
- Nivethitha, S.; Gauthama, R.M.R.; Krithi, R. A deep learning framework for building energy consumption forecast. Renew. Sustain. Energy Rev. 2021, 137, 110591. [Google Scholar]
- ASHRAE Standard 140-2020; Method of Test for Evaluating Building Performance Simulation Software. ASHRAE: Peachtree Corners, GA, USA, 2020.
- T/CABEE 042-2023; Basic Data Standard for Building Energy Consumption Simulation and Employment Behavior. National Library of Standards: Beijing, China, 2023.
- GB/T 51161-2016; Standards for Energy Consumption of Building. National Library of Standards: Beijing, China, 2016.
- Deb, K.; Pratap, A.; Agarwal, S.; Meyarivan, T.A.M.T. A fast and elitist multi-objective genetic algorithm: NSGA-II. IEEE Trans. Evol. Comput. 2002, 6, 182–197. [Google Scholar]
- Zhang, Y. Use jEPlus as an efficient building design optimisation tool. In Proceedings of the CIBSE ASHRAE Technical Symposium, London, UK, 18–19 April 2012. [Google Scholar]
- Lara, R.A.; Naboni, E.; Pernigotto, G.; Cappelletti, F.; Zhang, Y.; Barzon, F.; Gasparella, A.; Romagnoni, P. Optimization tools for building energy model calibration. Energy Procedia 2017, 111, 1060–1069. [Google Scholar]
- EnergyPlus Input Output Reference; US Department of Energy (DOE): Washington, DC, USA, 2019.
- Zahra, H.; Ebrahim, S.; Henry, S.; Trevor, H.; Ruwan, F.; Joshua, L.; Karine, D. Visual discomfort and glare assessment in office environments: A review of light-induced physiological and perceptual responses. Build. Environ. 2019, 153, 267–280. [Google Scholar]
- Yao, B.; Salehi, A.; Baghoolizadeh, M.; Khairy, Y.; Baghaei, S. Multi-objective optimization of office egg shadings using NSGA-II to save energy consumption and enhance thermal and visual comfort. Int. Commun. Heat Mass Transf. 2024, 157, 107697. [Google Scholar]
- Delgarm, N.; Sajadi, B.; Delgarm, S. Multi-objective optimization of building energy performance and indoor thermal comfort: A new method using artificial bee colony (ABC). Energy Build. 2016, 131, 42–53. [Google Scholar]
- Karmellos, M.; Kiprakis, A.; Mavrotas, G. A multi-objective approach for optimal prioritization of energy efficiency measures in buildings: Model, software and case studies. Appl. Energy 2015, 139, 131–150. [Google Scholar]

| Experimental Group | Angle | Distance from Glass | Experimental Time |
|---|---|---|---|
| a | 60° | 5 cm | July |
| b | 90° | 15 cm | July |
| c | 135° | 5 cm | July |
| d | 60° | 15 cm | July |
| e | 60° | 15 cm | November |
| f | 30° | 10 cm | November |
| g | 135° | 5 cm | November |
| h | 150° | 10 cm | November |
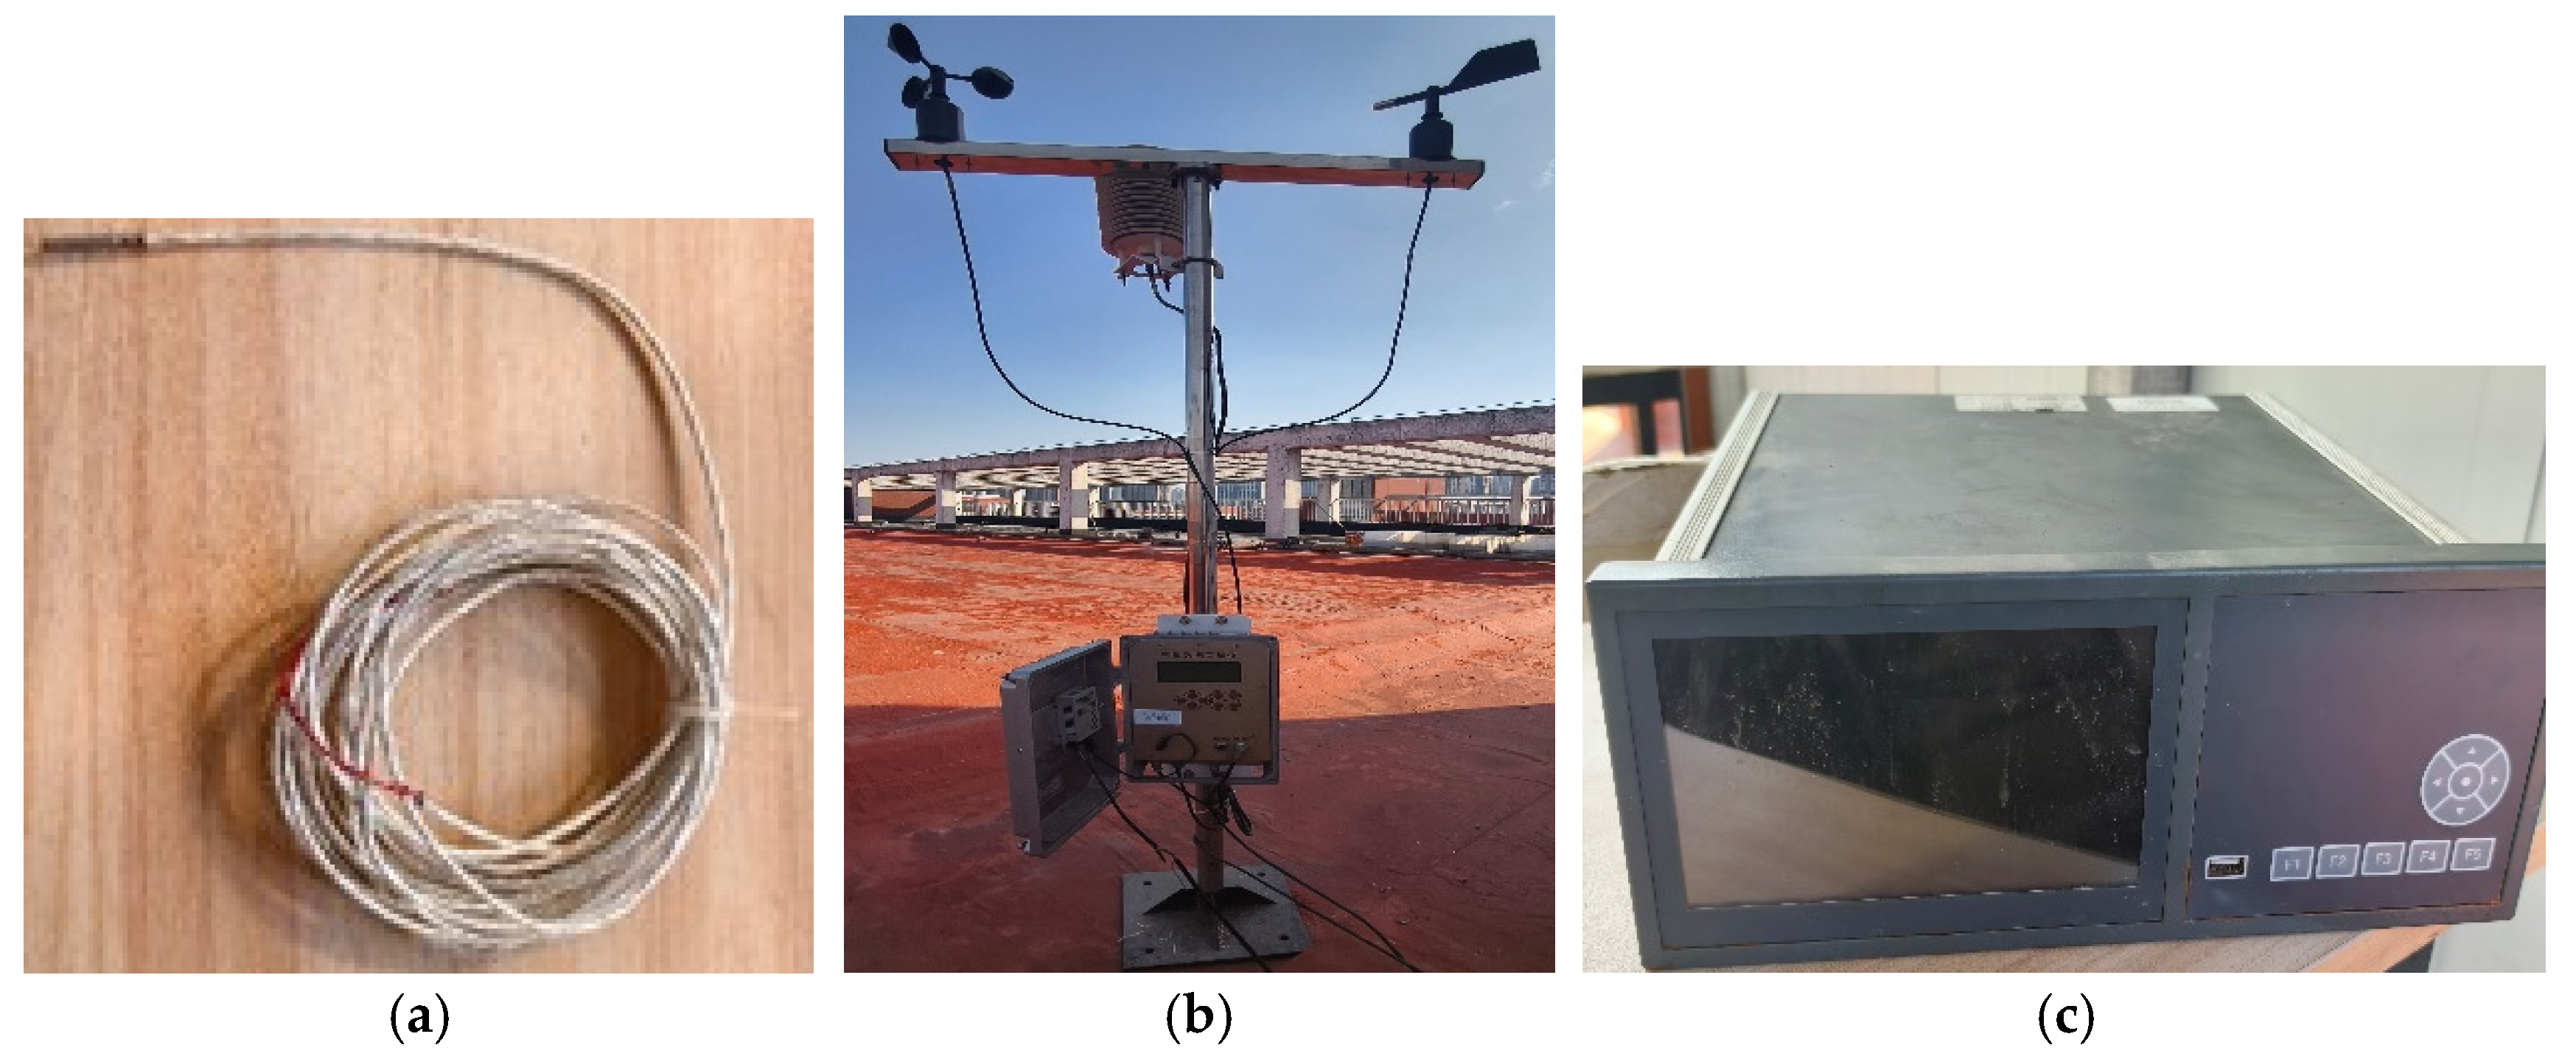
| Equipment | Function | Device Model | Range/Sensitivity |
|---|---|---|---|
| Meteorological station | Record of meteorological conditions | JLG-QTF, JinZhouLiChen, JinZhou, China | Total solar radiation: 0~2000 w/m2, ±0.5 w/m2; Temperature: −40~120 °C ± 0.5 °C; humidity: 0~100 %RH, 1 %RH ± 3 %RH; wind rate: 0~70 m/s |
| Thermistor sensors | measure temperature | WRNT-010, HangZhouHongDa, HangZhou, China | ±0.1 °C |
| Paperless recorder | Data collection and preservation | WPR50A-48XUSBVO, SuZhouXunPeng, SuZhou, China | 24 V, ±0.2% |
| Construct | Description | Heat Transfer Coefficient (W/(m2∙k)) |
|---|---|---|
| Roof | cinder concrete and reinforced concrete (90 mm thickness) | 1.05 |
| Wall | Extruded polybenzene board (30 mm thickness) + cement mortar (20 mm thickness) | 0.72 |
| Location | Zhuzhou |
|---|---|
| Latitude, Longitude, Height | 113.15, 27.84, 100.00 |
| Orientation | South |
| Equipment heat gain | Light: 11 W/m2; 0:00–24:00 |
| Occupation | 4 m2/person |
| People radiant fraction | 0.3 |
| Activity level | 126 w/person |
| Heating thermostat setpoint | 18 °C |
| Cooling thermostat setpoint | 24 °C |
| Work Schedule Period | Time | Value | Unit |
|---|---|---|---|
| A | 8:00–11:00 | A1 | ° |
| B | 11:00–14:00 | A2 | ° |
| C | 14:00–18:00 | A1 | ° |
| N | 17:00–24:00, 0:00–8:00 | 5 | ° |
| Glare Characterization | DGI |
|---|---|
| Intolerable | >28 |
| Only intolerable | 28 |
| Uncomfortable | 26 |
| Only uncomfortable | 24 |
| Acceptable | 22 |
| Only acceptable | 20 |
| Perceptible | 18 |
| Only perceptible | ≦16 |
| B (m) | S (m) | A1 (°) | A2 (°) | D (m) | Energy Consumption (kWh) | Visual Discomfort Time (hr) | |
|---|---|---|---|---|---|---|---|
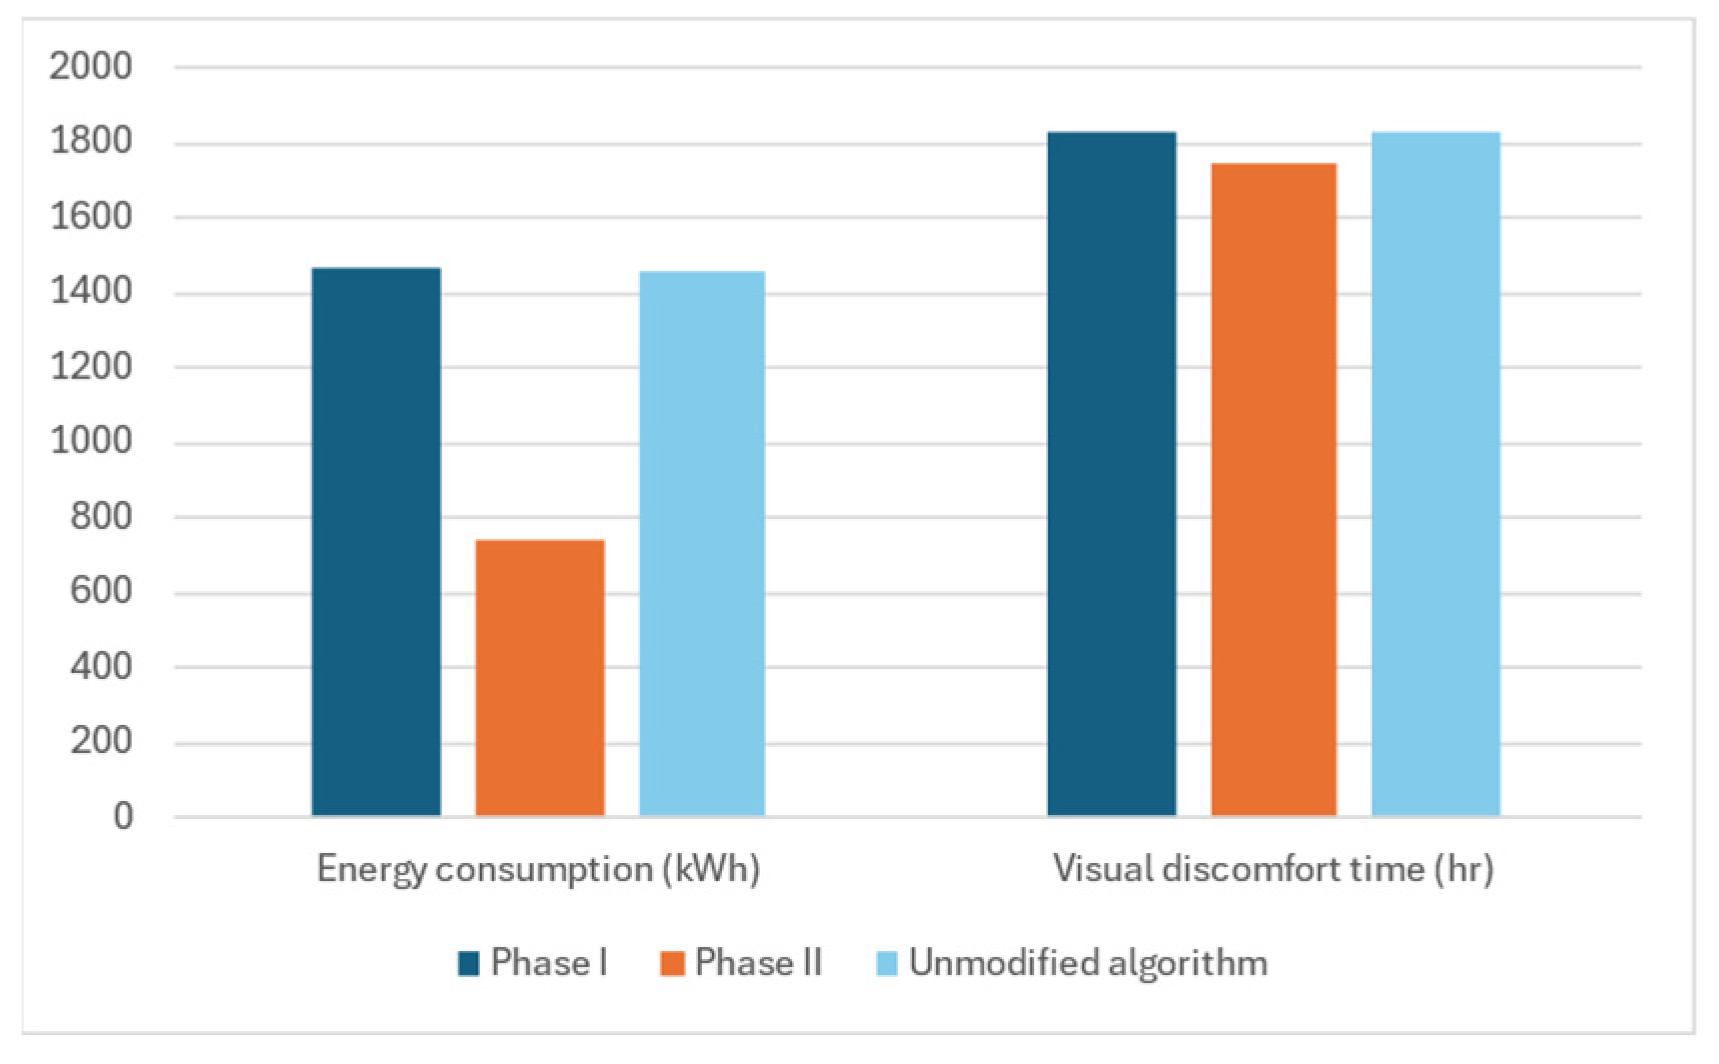
| First-phase | 0.12 | 0.09 | 40 | 40 | 0.13 | 1462.80 | 1830.17 |
| Second-phase | 0.12 | 0.09 | 125 | 35 | 0.25 | 743.99 | 1741.67 |
| Unmodified algorithm | 0.16 | 0.12 | 55 | 40 | 0.24 | 1460.11 | 1832.26 |
Disclaimer/Publisher’s Note: The statements, opinions and data contained in all publications are solely those of the individual author(s) and contributor(s) and not of MDPI and/or the editor(s). MDPI and/or the editor(s) disclaim responsibility for any injury to people or property resulting from any ideas, methods, instructions or products referred to in the content. |
© 2025 by the authors. Licensee MDPI, Basel, Switzerland. This article is an open access article distributed under the terms and conditions of the Creative Commons Attribution (CC BY) license (https://creativecommons.org/licenses/by/4.0/).
Share and Cite
Tang, D.; Wang, Z. An Enhanced NSGA-II Algorithm with Parameter Categorization for Computational-Efficient Multi-Objective Optimization of Active Glass Curtain Wall Shading Systems. Energies 2025, 18, 1584. https://doi.org/10.3390/en18071584
Tang D, Wang Z. An Enhanced NSGA-II Algorithm with Parameter Categorization for Computational-Efficient Multi-Objective Optimization of Active Glass Curtain Wall Shading Systems. Energies. 2025; 18(7):1584. https://doi.org/10.3390/en18071584
Chicago/Turabian StyleTang, Dezhao, and Zhiyong Wang. 2025. "An Enhanced NSGA-II Algorithm with Parameter Categorization for Computational-Efficient Multi-Objective Optimization of Active Glass Curtain Wall Shading Systems" Energies 18, no. 7: 1584. https://doi.org/10.3390/en18071584
APA StyleTang, D., & Wang, Z. (2025). An Enhanced NSGA-II Algorithm with Parameter Categorization for Computational-Efficient Multi-Objective Optimization of Active Glass Curtain Wall Shading Systems. Energies, 18(7), 1584. https://doi.org/10.3390/en18071584