Article

The Solar Shading Performance of the Multi-Angled Façade System and Its Impact on the Sustainable Improvement of the Buildings

1
Department of Design Engineering & Mathematics, Middlesex University, London NW4 4BT, UK
2
Department of Computer Science, Middlesex University, London NW4 4BT, UK
*
Authors to whom correspondence should be addressed.
Energies 2025, 18(7), 1565; https://doi.org/10.3390/en18071565
Submission received: 27 January 2025 / Revised: 18 March 2025 / Accepted: 19 March 2025 / Published: 21 March 2025

Abstract

:
This research paper explores the visual potential of the multi-angled façade system, allowing office employees to achieve optimal exposure to the external environment through the room façade. This contributes to sustainability objectives by enhancing indoor climate quality, promoting health and well-being, and aligning with the UN Sustainable Development Goals 3, 9, and 11. This façade concept provides a solution to the issue of shading devices being fully closed for long periods due to intense solar radiation on the room’s window. The concept of a multi-angled window involves incorporating two differently oriented window sections within each façade along a vertical axis (right and left), rather than tilting them upward or downward. The larger section is oriented more toward the north to maximize daylight access and external views, while the smaller section faces south to enhance passive solar heating. The visual potential is assessed based on the periods when the solar shading devices are not fully closed—meaning one section of the multi-angled façade may remain open while the other is shaded. To evaluate this, along with the resulting energy consumption and indoor climate, the software program IDA ICE version 4.8 is utilized. Simulation results indicate that the duration of complete shading closure is significantly lower for a multi-angled façade compared to a flat façade, in some instances nearly half, thereby improving visual comfort, daylight availability, and heat gain while simultaneously reducing spatial energy consumption.

1. Introduction

1.1. Background

One of the important functions of windows is the exposure to the external environment and view, which has a large impact on the indoor climate and the working atmosphere inside an office building. In addition to that, the use of natural light has become an important strategy for improving the overall energy efficiency of buildings. By providing occupants natural light, the reliance on artificial lighting to perform daytime activities is reduced [1].
Light affects human daily routines and well-being on physiological, psychological, and biological levels. Exposure to daylight is linked to various health benefits, and making the most of natural light has become an important strategy for improving energy efficiency by decreasing the need for artificial lighting, heating, and cooling [2].
Passive solar heating is a sustainable building strategy focused on optimizing and using natural light and heat. Architects design the building to capture and store solar thermal energy within the structure when heating is needed, or to block heat from entering the building when cooling is needed, depending on the building’s requirement [3]. To control the passive solar heating in an office building, a suitable solar shading system is needed.
Harnessing solar radiation for energy generation is a sustainable building strategy primarily centered on energy production and photovoltaic (PV) placement. However, an innovative approach for a modular system integrates transparent thin-film PV glass with vertical farming, moving beyond the conventional focus on energy generation alone. This design achieves a seamless combination of renewable energy production and vertical agricultural cultivation. Moreover, the system’s standardized modular design ensures remarkable flexibility and adaptability, making it a versatile solution for sustainable development [4].
BIPV applications on building façades are often favored over rooftop solar systems, especially for tall buildings with limited roof space. This preference has led to the development of the prefabricated unitized BIPV wall (PUBW), an advanced, opaque, multi-layered BIPV system. Designed for efficiency and safety, PUBW minimizes the risks associated with on-site work at height while offering high-performance electricity generation, rapid installation, and cost-effectiveness [5].
Shading devices are an important component of the façade design that help facilitate an accepted thermal indoor climate and reduce glare. According to [6], a building with good thermal comfort is still subjected to overheating in the summer months, and has low thermal resilience. Furthermore, during the summer months, there is always an overheating risk in the afternoon; thus, sun blinds are essential in case of extreme shocks like heat waves. Dynamic solar shading is often recommended as a solution to mitigate overheating issues while maintaining ample daylight and solar exposure through windows when required [7].
A number of interviews about building façade design were conducted with some of the leading architectural firms in Denmark, which are also involved in projects in Northern Europe and worldwide. The interviews primarily focused on, among other things, the visual potential of the office building façades.
According to C.F. Møller Denmark A/S (www.cfmoller.com, accessed on 15 February 2017), daylight and views of the external environment were taken into consideration when designing all building façades. The amount of daylight was increased by enlarging the windows facing south [8].
According to PLH Arkitekter A/S (www.plh.dk, accessed on 4 January 2017), there was a focus on using skylights in the building to enhance daylight and improve views to the outside [9].
According to NOVA5 Arkitekter (www.nova5.dk, accessed on 2 March 2017), daylight is an important factor that the architectural firm has focused on. There can sometimes be issues with overheating, but shading devices and their control strategies can provide a solution. The firm typically uses tall windows to allow more daylight and improve views of the outside [10].
According to the Nordic Office of Architecture (www.nordicarch.com, accessed on 5 April 2017), the transparent part of the façade is an important component, and designers always strive to increase it, when possible, by making windows higher or wider [11].
According to NIRAS A/S (www.niras.com, accessed on 11 April 2018), daylight and views to the outside are important considerations in building design. The use of colored glass might help mitigate overheating issues, but it can negatively impact the visual quality of the façade [12].
In general, according to the interviews, the focus was on increasing daylight and views to the outside on one hand and reducing overheating hours on the other. The use of shading devices may help reduce overheating hours, but they negatively impact the view outside. Most architectural firms used triple-layer glass windows, and external shading was generally preferred over internal shading, especially dynamic shading.

1.2. Research Problem

Although an office space could have a large window and pleasant view to the outside, the shading device might be closed for several hours, depending on solar radiation intensity and sun orientation, thus preventing any exposure to the external environment and blocking daylight from penetrating inside the room [13].
Experts from the Technical University of Denmark note that many office employees have reported frustration when shading devices remain fully closed due to intense solar radiation. As a result, natural daylight and outdoor views are blocked for several hours, potentially affecting the office environment and employee well-being [14].

1.3. The Objectives

This research study primarily aims to explore a new office building façade design that maximizes outdoor views while integrating an effective solar shading system. This façade system addresses the limitations of flat façade designs and bridges the gap where shading devices block natural daylight and outdoor views for several hours, potentially impacting the office environment.
This research introduces a multi-angled façade system that incorporates two distinct window orientations per façade along a vertical axis (right and left), without tilting up or down (see Figure 1 and Figure 2). In this design, the larger section of the façade faces more toward the north, while the smaller section is oriented southward. By strategically combining this configuration with appropriate glass properties and solar shading control systems, the design aims to optimize daylight utilization and solar radiation while minimizing overheating issues, as explored in this study [15].

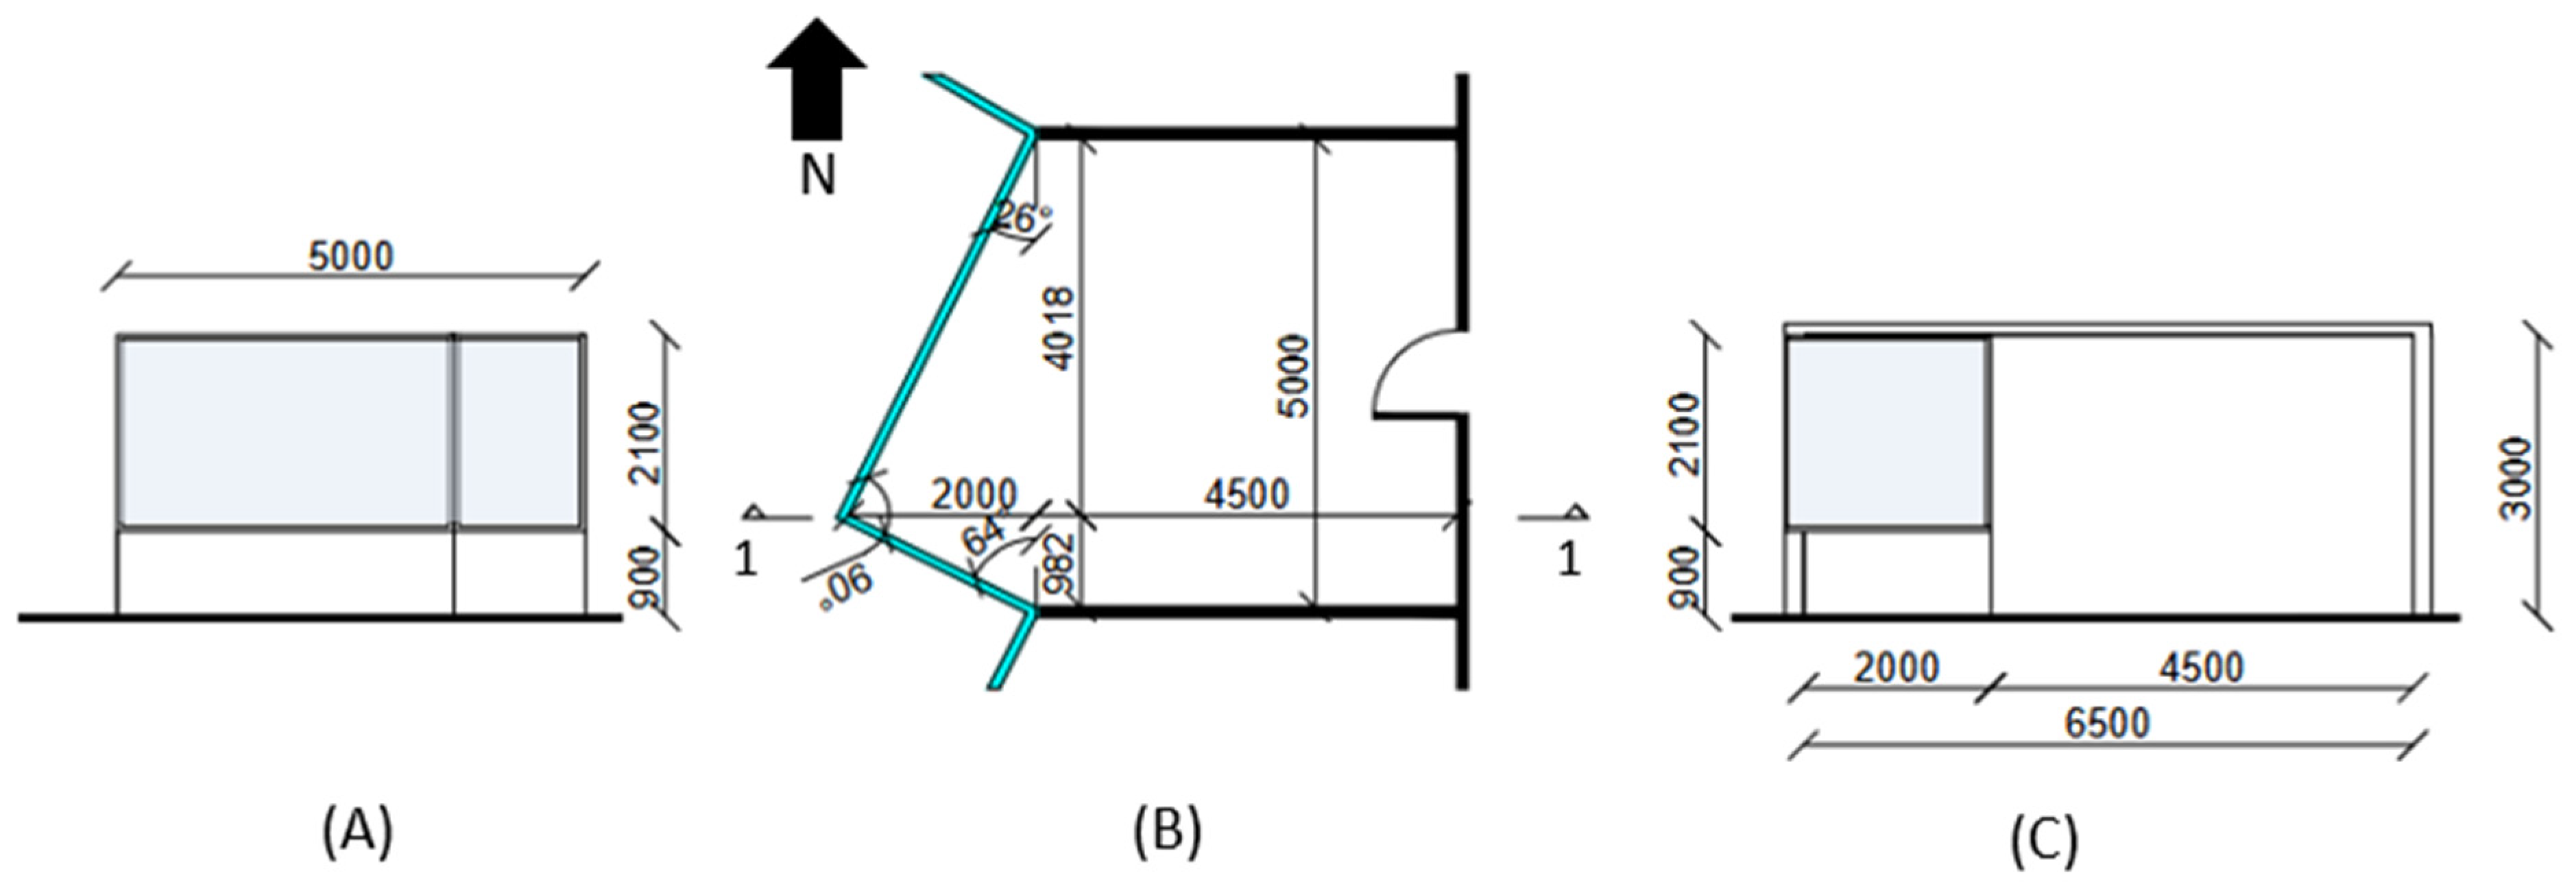
1.4. The Design Concept of the Multi-Angled Façade
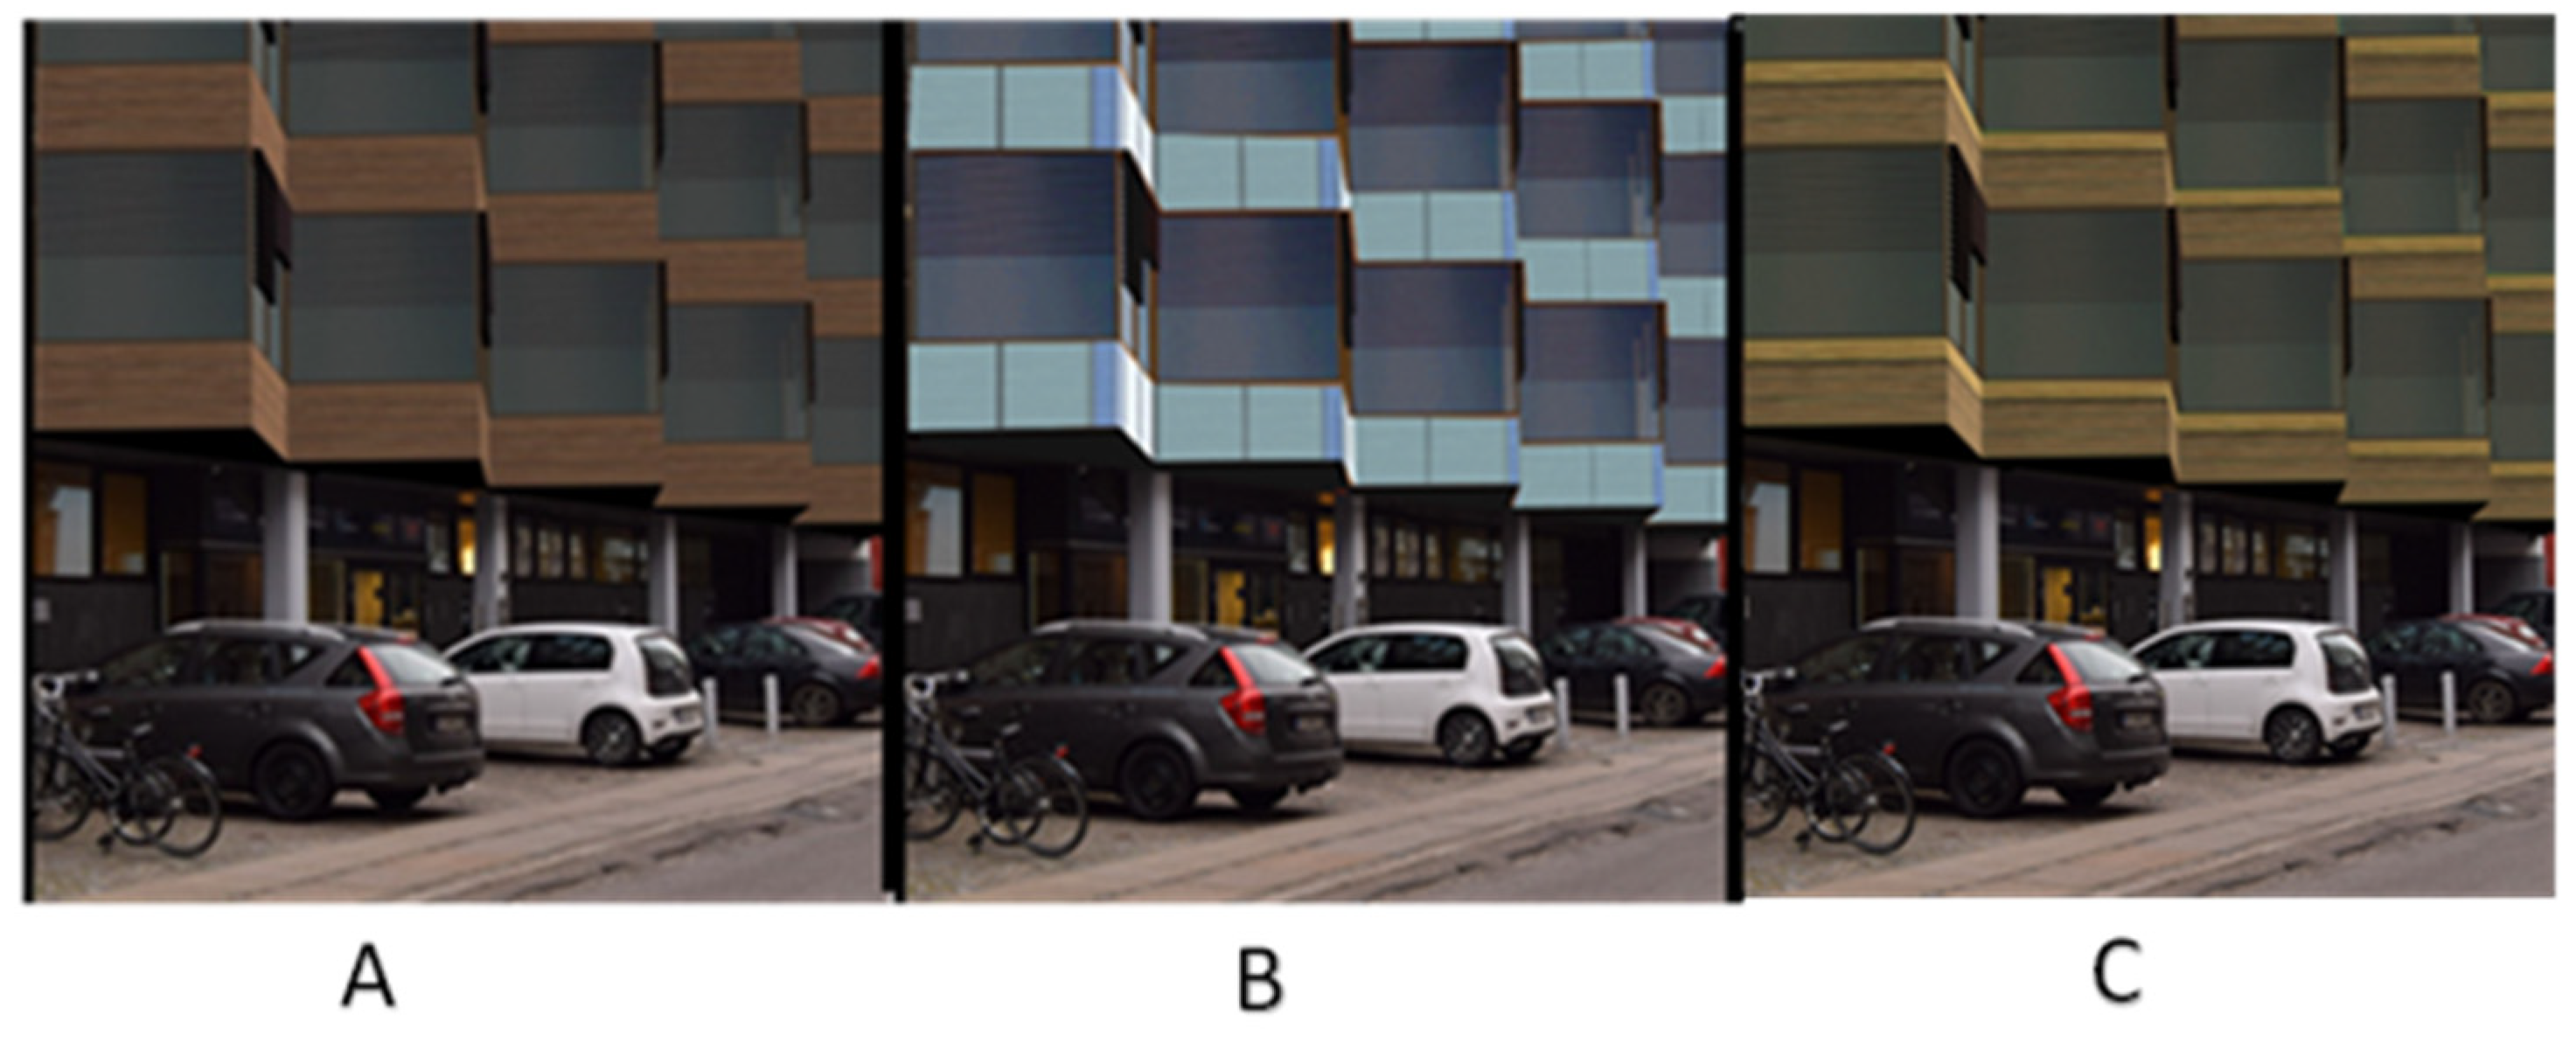
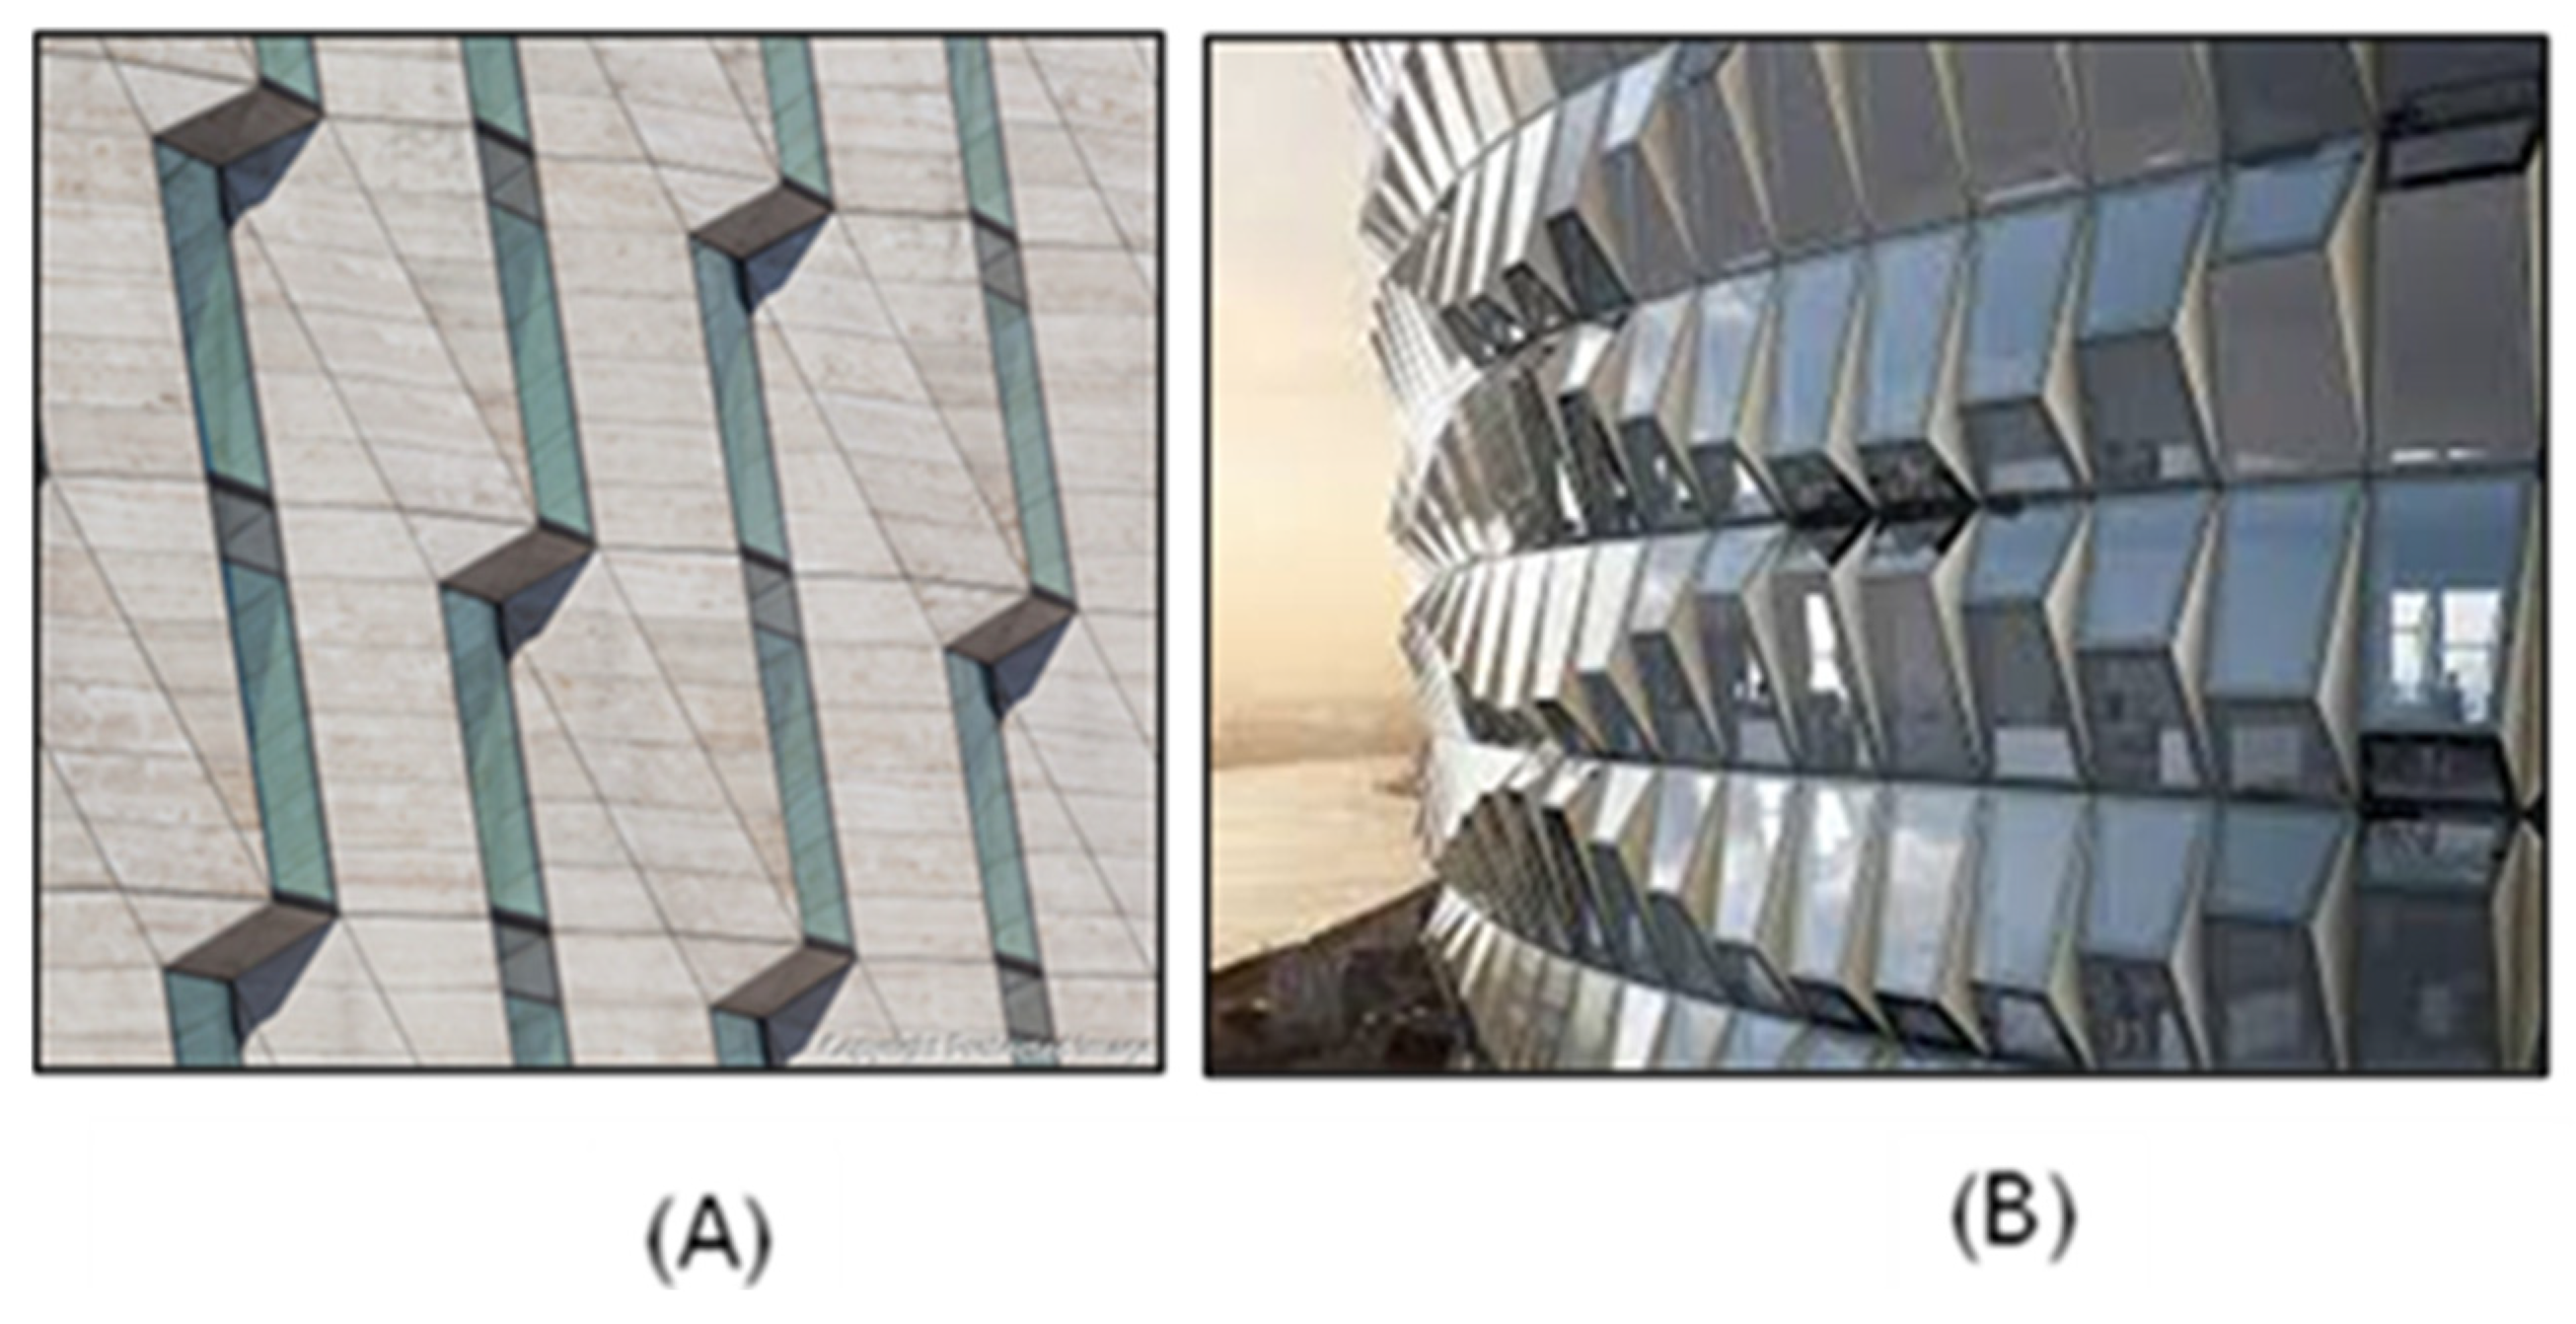
Figure 1 illustrates an office room plan incorporating solutions for multi-angled façades (Figure 1A), highlighting the distinction between this concept and traditional flat façades with conventional dynamic shading systems (Figure 1C). Simulations will be conducted for both façade types to evaluate their potential.
A room featuring a multi-angled façade allows for greater flexibility in shading control. One window section can have its shading device closed while another remains open, maintaining the outdoor view. By contrast, a flat façade with a closed shading device blocks the entire window, fully obstructing the view. This design offers notable visual benefits that significantly impact daylight availability in office spaces. These effects, along with other factors, such as glare, will be explored in a separate research paper [15].
Throughout architectural history, designers have sought to maximize daylight penetration into interior spaces. One approach has been extending windows outward to enhance natural light and provide a better external view. This technique is evident in bay windows, commonly used during the late Victorian and Edwardian periods (see Figure 3A). With advancements in glass technology, bay windows became a staple of English vernacular architecture. In modern buildings, outwardly extended windows serve multiple purposes, such as increasing daylight access, creating private spaces within structures [16], or forming cozy reading nooks that rely solely on natural light (see Figure 3B,C). These façade configurations can be optimized to enhance daylighting, ultimately contributing to reduced energy consumption in buildings. The multi-angled façade system explored in this study functions as a façade extension with enhanced performance, specifically optimized to improve outdoor visibility. This aspect will be examined in detail throughout the research paper [15].
The multi-angled façade system provides several key benefits, including improved energy efficiency, enhanced indoor thermal and visual comfort, increased daylight availability, economic and environmental advantages, and aesthetic appeal. These benefits, along with the associated challenges, have been analyzed in various published research studies.
Our first research study focused on the fundamental design of the multi-angled façade to reduce energy consumption in office buildings while enhancing indoor climate quality. The research highlights the system’s positive impact on lowering energy use, improving indoor environmental conditions, and optimizing daylight availability [15].
Our second research paper focused on optimizing the design of multi-angled façade systems, including dimensions and angles, to enhance energy efficiency in office buildings and improve indoor climate quality [18].
Our third research paper focused on analyzing the influence of glass properties on the energy efficiency and embodied carbon of multi-angled façade systems [19].
This research paper aims to explore the visual potential of the multi-angled façade system, allowing office employees to achieve optimal exposure and an unobstructed view of the external environment. It examines the solar shading performance of the system and assesses its impact on outdoor visibility through the façade, as well as its effect on passive solar heating within the building.

1.5. Case Studies

Other buildings also incorporate outward-extending windows to improve daylight access, such as the Horten Headquarters in Hellerup Municipality, Denmark, designed by 3XN [20] (see Figure 4A). The primary difference between this building and the multi-angled façade concept lies in their design approaches. The multi-angled façade incorporates two distinct window orientations within each façade: a larger north-facing section to maximize daylight and a smaller south-facing section to enhance solar radiation and heat gain. By contrast, the Horten building’s façade primarily focuses on the north-facing section for daylight access, while the other section remains a solid wall. This distinction underscores a fundamental difference between the design principles of these façade types and the concept of multi-angled façade systems [15].
Another example of a 3D façade system is the Schüco Parametric System, which provides a geometrically freeform 3D façade design. This system solution enables the customization of three-dimensional building envelopes to meet specific design requirements [21]. At the core of this system is a seamless, closed digital process chain that integrates all design, planning, and fabrication phases. The façade modules are based on Schüco’s proven modular system, enabling highly individualized designs [22]. Compared to the Schüco Parametric System (see Figure 4B), the multi-angled façade concept explored in this research is significantly simpler in both design and production. Unlike the Schüco system, which relies on a specialized closed software chain for seamless integration, the multi-angled façade is faster to implement, less complex, and more cost-effective, making it a practical solution for both façade renovations and new constructions.
The innovative multi-angled façade systems offer advantages that surpass those of the Schüco Parametric System. They enable optimal utilization of daylight and solar heat within office spaces while maintaining a simpler design, manufacturing, and transportation process. This distinction highlights the gap between traditional 3D façades and the novel concept of multi-angled façade systems, emphasizing their uniqueness and benefits [15].
The multi-angled façade systems offer advantages that surpass those of the Horten Headquarters building façade, as they optimize both daylight utilization and solar heat gain within office spaces through their dual-part façade design. This distinction highlights the gap between the 3D façades of the Horten Headquarters and the innovative concept of multi-angled façade systems [15].
This research examines a multi-angled façade system composed of three angles within a triangular plane. Adjusting these angles affects the lengths of the façade’s two primary sections: the longer section, which is oriented more towards the north, and the shorter section, which faces south. Additionally, these adjustments influence the façade’s overall extension. The simulated multi-angled façade consists of two acute angles and a potential right angle. By increasing or decreasing the two acute angles, the orientation of the façade’s sections shifts—either directing more towards the north, enhancing daylight penetration through the transparent portion, or more towards the south, increasing heat absorption through the transparent part.
Regarding the limitations of the research and methodology, while this case study focuses on Denmark’s climate, the findings can be applied to similar climates worldwide, including many northern hemisphere cities with comparable cold conditions. Some may view the applicability of this façade design to office buildings in significantly hotter or colder climates as a potential limitation.
Another limitation is the orientation of the building façade, with the west-facing external façade being the most optimal. This orientation is similar to the east but receives more solar heat in the afternoon. Rooms with east or west orientations, as well as those with northwest, northeast, southwest, or southeast-angled façades, benefit from northern exposure for daylight and southern exposure for winter heat gain. While the multi-angled façade concept can also be applied to façades facing northwest, southwest, northeast, and southeast, these orientations are less optimal compared to west and east.
The design methodology is centered on establishing a correlation between the performance of shading devices, energy consumption, indoor climate, and heat gain and loss.
Following the Introduction section, the workflow of this research paper is outlined in Figure 5, which presents a general flowchart illustrating the research process and the key steps involved.

2. Materials and Methods

This section outlines several key steps, including selecting the appropriate software to evaluate both the visual potential of the façade and energy consumption. Additionally, it involves defining scenarios for both flat and multi-angled façades, determining the type of shading devices, and establishing unified input data for the simulations, as illustrated in Figure 6 below.

2.1. The Software

To assess the visual potential of the façade, energy consumption, energy performance, and indoor climate of the building, this study utilized the software program IDA ICE version 4.8 [23]. This software is widely recommended by scholars and practitioners in Scandinavian countries (Sweden, Norway, Denmark, and Finland) for research purposes, particularly for evaluating energy usage, façade-related energy performance, and indoor climate conditions. Researchers have relied on IDA ICE for simulations, validation, testing, and statistical comparisons for over 25 years, in accordance with ASHRAE 140 (2004) [24], CEN Standard EN 15255 and 15265, 2007 [25,26], and the International Energy Agency SHC Task 34 [27].

2.2. The Scenarios

A 3D model of office rooms is built in four scenarios for a flat façade and multi-angled façades with various solar shading control strategies, as summarized in Table 1. Scenario 1 presents an office room with a flat façade, which will be compared to the performance of three other scenarios. Scenarios 2–4 feature office rooms with multi-angled façades, each utilizing different solar shading control strategies for comparison. The solar shading control strategies are as follows:
Scenario 1: Flat façade with an external shading system, which is closed when the solar radiation intensity is 250 W/m2, the value recommended in Denmark, measured at the external surface of the window.
Scenario 2: The multi-angled façade features an external shading system for the south-facing window, which operates based on the operative temperature (closes at 24 °C, as the temperature for triggering cooling in summer is 25.5 °C (category 1), in a single office [28]. The external shading system for the north-facing window operates based on solar radiation intensity, closing when the external solar radiation reaches 250 W/m2, as recommended in Denmark (see Table 1).
Scenario 3: The multi-angled façade features an external shading system for the south-facing window, which operates based on the operative temperature (closes at 25 °C), which is expected to make changes for the indoor temperature and the periods where the shading devices are closed compared to Scenario 2. In case of increasing the operative temperature in the control system one degree more (closes at 26 °C), the indoor climate will be relatively hot on some summer days. The external shading system for the north-facing window operates based on solar radiation intensity, closing when the external solar radiation reaches 250 W/m2, as recommended in Denmark (see Table 1).
Scenario 4: The multi-angled façade features an external shading system for both the south-facing and north-facing windows, which operates based on solar radiation intensity, closing when the external radiation reaches 250 W/m2 (see Table 1).

2.3. The Chosen Period for the Simulation

Three predefined periods have been selected for the simulation based on their specified solar radiation intensity. These periods are as follows:
Mid-July: This period experiences high solar radiation intensity, significantly affecting the shading devices, which will remain closed for extended periods throughout the day.
Mid-May: During this period, solar radiation intensity is lower than in July. As a result, the shading devices will be closed for shorter durations compared to July.
Mid-March: This period has a moderate solar radiation intensity, leading to even shorter shading device closure times than in May.
Through looking at these three periods, this section can present the situation for the shading devices in terms of their visual quality and the possibility to have a view to the external environment through the façade. It is also possible to analyze the shading devices impact on the energy consumed for heating, mechanical ventilation, and electrical lighting.
The characteristics of the chosen two days in spring (in March and May) are almost exactly mirrored by corresponding autumn days in September and November, which is why no days were chosen from that season. Choosing a day in the winter, at which time there is very little intensity of solar radiation, somewhat high energy consumption for heating and low energy consumption for mechanical ventilation, will not have an impact on the status of the shading devices and they will be almost always opened. This is due to the fact that neither the solar radiation intensity nor the indoor temperature will trigger the shading control system to close the shading device. Therefore, during those winter days, the outdoor climate does not impact reducing the view of the external environment through the façade; hence, this is not within the direct scope of this study for this period of the year.
Furthermore, while the solar radiation in winter is generally lower than in the summer, the sun’s elevation angle in winter is considerably low, giving direct solar radiation and glare from the south orientation. This can be controlled manually by using an internal roller shading device on the smaller window of the multi-angled façade that is oriented more towards the south.

2.4. The Shading Devices

Both sections of the multi-angled façade system utilize external dynamic shading device (Venetian blinds). While roller shading devices are also an option, Venetian blinds offer adjustable slats that, in some cases, can be controlled by occupants. According to the Danish standard (SBI Guide No. 264, Shading Devices), these shading systems have a shading factor of 0.2. The dynamic shading devices are controlled either according to the solar radiation intensity on the window glass or the temperature inside the room as described in the four scenarios above (see Table 1). In addition to the automated control of the shading device, it has the possibility to be controlled manually by the occupants according to their requirements; for example, by adjusting the slat of the shading device when it is closed due to high irradiance to enable some daylight to penetrate inside the room or to avoid glare.

2.5. The Input Data

The input data for simulating all four scenarios in IDA ICE was collected through a combination of interviews, site visits, and adherence to Danish and European standards and building codes. The data was then analyzed using the IDA ICE software [23]. Site visits were carried out for 34 office buildings in Copenhagen, which were categorized into groups based on their façade components and properties. The analysis of these buildings was presented in the research paper “Façade System for Existing Office Buildings in Copenhagen” [29]. Additionally, interviews were conducted with seven Danish architectural firms, as mentioned in the Introduction of this research paper [30], and the questions focused on the various technical, aesthetic, functional, economic, and environmental aspects of office buildings façade design in Copenhagen. These interviews helped define some of the input data for the simulated model, such as the properties of the windows and the opaque parts of the façade. The model’s input data are discussed in detail below.

2.5.1. Building Model and Location

The model represents a room with internal dimensions of 5 × 4.5 × 3 m (L × W × H), which were based on site visits and a case study of numerous office buildings in Copenhagen. These dimensions are typical for office rooms. The modeled room is adjacent to other rooms on each side, as well as above and below, and is simulated with two types of external façades: a flat façade and a multi-angled façade. The larger section of the multi-angled façade faces more toward the north, while the smaller section faces the south, as shown in Figure 7.
The optimized dimensions and angles of this façade were determined through several simulations conducted on this façade concept. The room’s external façade is oriented toward the west, with the optimal usage of this façade being either to the west or east.
The building is located in Copenhagen, Denmark (latitude 55.633° N, longitude 12.667° E), and the meteorological data used for this study is from the 2022 weather year, with the weather file for energy modeling sourced from IWEC (International Weather for Energy Calculation).
It is assumed that the room is occupied by two employees, each with an activity level of 1.2 MET [28]. (Metabolic rates refer to the measure of how quickly the body expends energy. One MET is defined as 1 kcal/kg/h, approximately equal to the energy expenditure of sitting quietly.) The expected average occupancy is 80%, with two occupants using two computers (40 W per computer).

2.5.2. Electric Lighting

The office room is equipped with energy-efficient fluorescent lighting, which operates during occupancy hours and provides 500 Lux [28] for the designated working area, assumed to cover two-thirds of the room. The lighting system has a total power of 110 W with a luminous efficacy of 80 lm/W. Additionally, the lighting is controlled and dimmed based on daylight availability to optimize energy efficiency.

2.5.3. Ventilation System

The office is equipped with a mechanical ventilation system that uses variable air volume (VAV) during working hours (08:00–17:00). The system is controlled based on the room temperature and CO2 concentration. It features a heat exchanger with an efficiency of 80%, which is an average value for Lindab A/S products. The fan efficiency (electricity to air) is 0.8, a standard market value [31]. The system operates with a normal pressure drop of approximately 800 Pa and a specific fan power (SFP) of 1000 J/m3, ensuring efficient ventilation with a reasonable pressure drop [32]. Because the climate in Denmark is mild in the summer, the author did not use a cooling coil in the ventilation system, and depending on air changing through the ventilation system can help to provide an accepted indoor climate. The following criteria are related to the indoor climate and are regulated through the ventilation system:
The maximum room temperature was 25 °C, measured with an occupant seated 1 m from the front window and 1.5 m from the side wall at a height of 1.1 m.
The relative humidity ranged between a minimum of 20% and a maximum of 80%, corresponding to Category 3 [28]. Humidity levels below 20% may lead to discomfort, such as skin dryness, while levels above 80% could result in condensation forming on building surfaces and equipment.
According to Danish building regulations (BR15), CO2 concentration should not exceed 1000 ppm for extended periods. The maximum allowable level is 1100 ppm, in line with Category 3 standards for office buildings [28].
The researchers set the ventilation rates between a minimum of 0.35 l/s·m2 and a maximum of 10 l/s·m2. The minimum value is defined by Danish Building Regulation BR15, while the expected ventilation rate for a single office room in Category 2 (for non-low polluted buildings) is 2.1 l/s·m2 [33]. The maximum ventilation rate of 10 l/s·m2 requires the installation of two air terminal devices per room, each connected to a 250 mm diameter duct. Calculations were conducted following [32]. During short periods in summer, when the ventilation rate reaches 10 l/s·m2, no issues related to ventilation system noise are observed.

2.5.4. Heating System

The heating system is assumed to consist of water-based radiators, with a set point of 21 °C during working hours (07:00–17:00) [28] and 16 °C outside these hours. The building’s heating and domestic hot water are assumed to be powered by district heating.

2.5.5. External Walls and Windows

The parapets beneath the windows have a U-value of 0.125 W/m2K, compliant with the 2015 Building Regulation. They consist of a 0.1 m thick concrete panel on the interior, 0.245 m of insulation, and an exterior layer of wood façade cladding (see Table 2).
A three-layer glass window is used for the window of the flat façade (Ug is 0.53 W/m2 K, LTg 0.72, gg 0.5, Uf 1.56 W/m2K) [34] (see Table 3). This window is also used for the large part of the multi-angled façade, while the smaller part has a three-layer glass window (Ug is 0.62 W/m2 K, LTg 0.74, gg 0.63, Uf 1.56 W/m2K) [35], which has a higher g-value compared to the other window. This is in order to provide more passive heat gain as it is oriented more towards the south. In case of using a window with a higher g-value, other properties might also change; for example, the U-value might increase in parallel with that. If the U-value is increased there will be a negative impact on the thermal efficiency of the façade. In the case of using a two-layer window, the g-value would increase at a higher rate than for a three-layer window, and the U-value might increase in parallel with that. These three-layer glass window properties were chosen based on a thorough investigation of window types available in the Danish and European markets. The decision to choose three-layer glass windows was based on interviews conducted with seven leading Danish architectural firms [30], as mentioned in the Introduction of this research paper. The lower window frame is positioned 0.9 m above the floor, and the upper window frame is located 2.85 m from the floor for the flat façade, which is a typical window height in Danish office buildings. For the multi-angled façade, the height is increased to 3 m to allow for more daylight. The window area below 0.9 m does not contribute to daylight in the working area and also increases heat loss. The ratio of glass area to total window area is approximately 0.82. This applies to the narrowest window frame, which features three-layer glazing and is produced in Denmark from wood/aluminum, with a thickness of 5.4 cm [35].

2.5.6. Infiltration

According to BR15, air leakage through the building envelope must not exceed 1.00 l/s per m2 of heated floor area when tested under a pressure difference of 50 Pa [36].

3. Results

This section presents the simulation results for office rooms with flat and multi-angled façade systems across the four scenarios discussed in the previous section. The results illustrate the solar shading performance throughout the day across different times of the year, along with insights into energy consumption, indoor climate conditions, and the energy performance of the building’s external façade.
The simulation results showed significant variations in shading performance across the four scenarios, with the most noticeable impact observed in the shading performance of the small south-facing window, as shown in Figure 8, Figure 9 and Figure 10.
The energy consumption across the four scenarios varied due to differences in solar shading performance, as shown in Table 4. The multi-angled façade system (Scenario 2) achieved a 15% reduction in total area-weighted energy consumption compared to the conventional flat façade (Scenario 1). Similarly, Scenarios 3 and 4 also demonstrated reductions in energy consumption compared to Scenario 1.
The results in Table 4 are presented per unit of area (square meter) in order to take into consideration the difference in the room area between Scenario 1 and Scenarios 2, 3, and 4.
The indoor climate simulations reveal variations between the four scenarios due to differences in the solar shading performance. Notably, the number of occupied hours falling under the four thermal indoor climate categories varies. For instance, Scenario 2 (with a multi-angled façade) shows a higher number of hours in Category 1 compared to Scenario 1 (with a flat façade), as presented in Table 5.
The energy performance of the external façade varies across the four scenarios due to differences in solar shading performance. A clear correlation can be observed between the amount of solar radiation penetrating through the façade and the energy consumption for heating and mechanical ventilation, as shown in Table 6 and Table 7.

4. Discussion

4.1. General Description

The aim of this research is to investigate the visual potential of the multi-angled façade system in terms of evaluating the periods where the solar shading devices are not totally closed (this means that the shading can be closed on one element of the multi-angled façade, but not both). This is also coupled with an evaluation of various solar shading control systems and their effects on the visual quality through the façade, in addition to their impact on the total energy consumption of the building and the indoor climate inside the office rooms.
The results present the total energy consumption (see Table 4 and Figure 11) and the indoor climate for the whole year (see Table 5) in addition to detailed analyses for the three specific periods throughout the year. Through looking at these three periods, this section can present and discuss the situation for the shading devices in terms of their visual quality and their impact on the energy consumed for heating, mechanical ventilation, and electrical lighting.
The discussion is carried out mostly in two main groups, the first group is a comparison between Scenarios 1 and 2, which have different façade configurations (a flat façade and a multi-angled façade) and the second group is between Scenarios 2, 3, and 4, which have different shading control systems (see a visual presentation of the four scenarios in Figure 12 below).

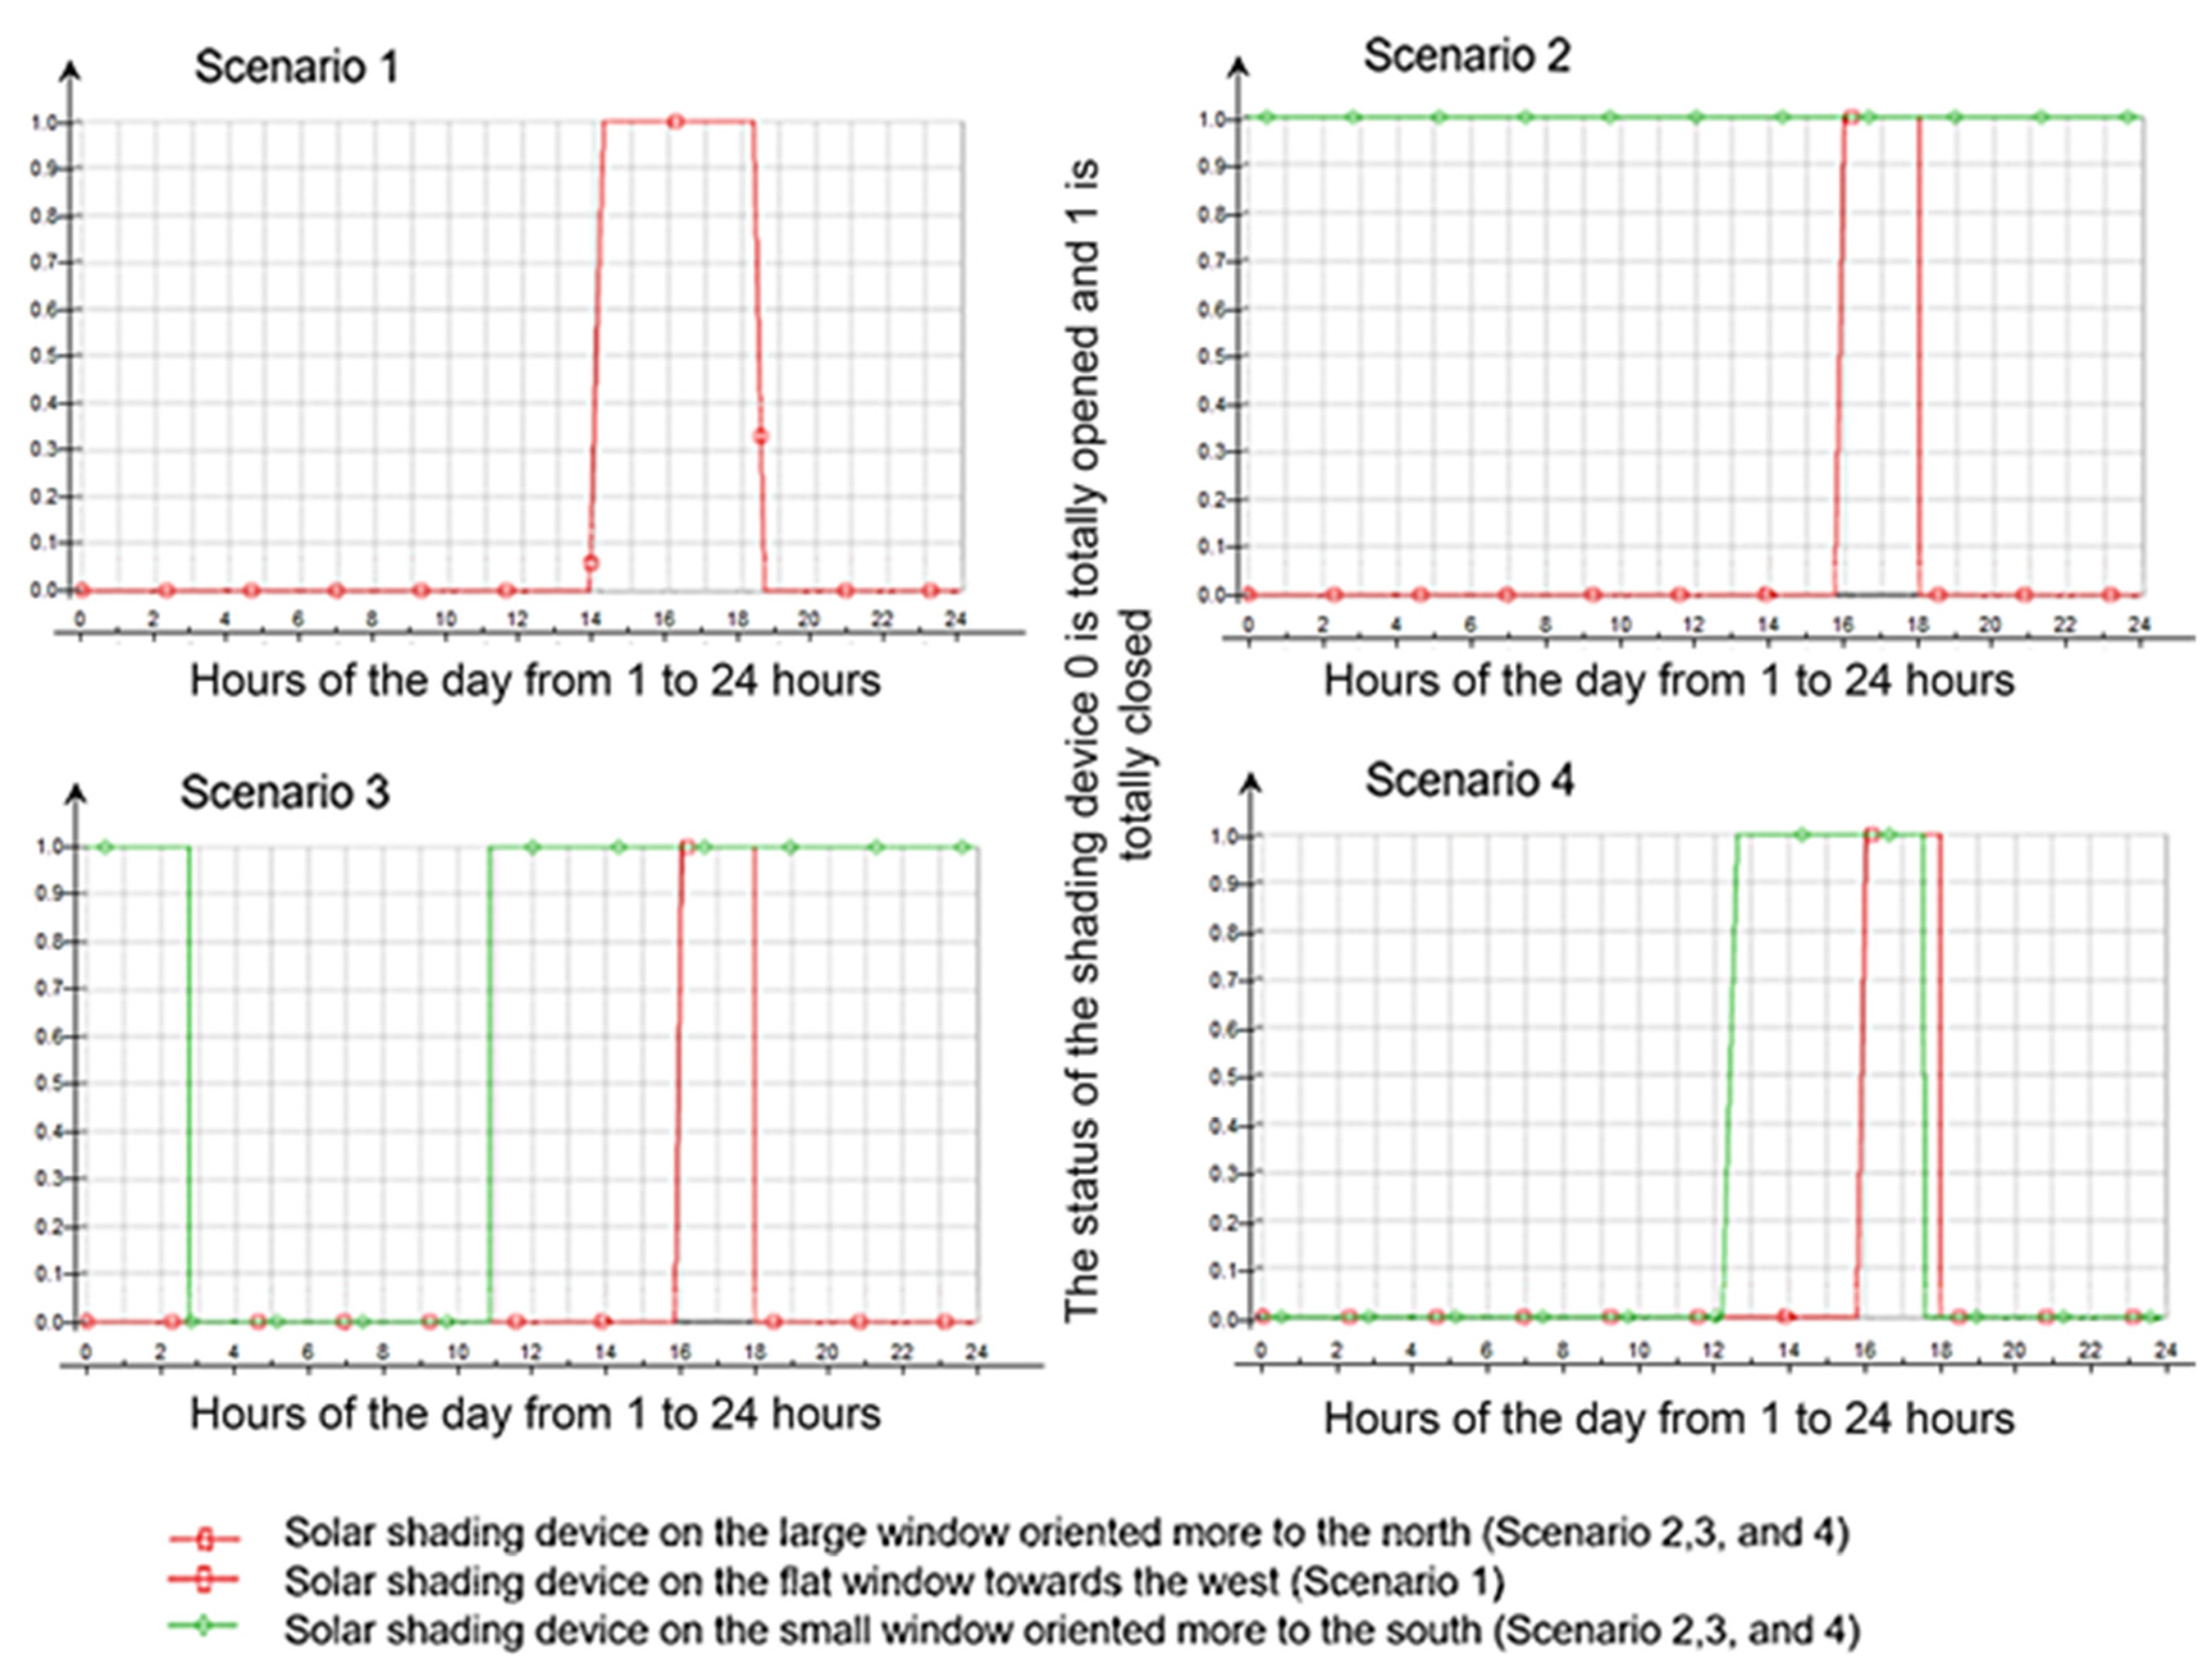
4.2. The Status of the Shading Device and the Visual Quality in Scenarios 1 and 2

Figure 8, Figure 9 and Figure 10 present the periods when the shading devices are closed, both for the office room with the flat façade and the office rooms with the multi-angled façade, in the four scenarios. By comparing Scenarios 1 and 2, it can be observed that the length of time for which the shading device is totally closed in Scenario 1 is double that in Scenario 2 for the day in July. The shading device in Scenario 2 for the window oriented more towards the south might be closed for the whole day, but the shading device for the window oriented more towards the north is closed only for a small period, thus allowing a view and exposure to the external environment. The same is the case for the day in May for Scenarios 1 and 2, but for shorter periods; while on the day in March, the shading device in Scenario 2 for the window oriented more towards the south is closed for a very short period, little more than an hour. In Scenario 2, the time for which both shading devices are closed is almost an hour, compared with four hours in Scenario 1, which has an impact on the visual quality inside the office room.

4.3. The Status of the Shading Device and the Visual Quality in Scenarios 2, 3, and 4

By comparing Scenarios 2, 3, and 4, as shown in Figure 8, Figure 9 and Figure 10, the periods when the shading device is closed on the small window oriented more towards the south are shorter in Scenarios 3 and 4 than in Scenario 2 for the days in May and July, which has a positive impact on the visual quality inside the room. This is, of course, because the shading device in Scenario 3 closes at a temperature a little higher than in Scenario 2, while in Scenario 4, the control of the shading device of the small window depends on solar radiation intensity, which might not have reached the predefined amount of solar radiation intensity to be closed (closes at 250 W/m2; measured externally, as defined in the control system for the shading), for several hours through the day. This means that the shading would take longer to close, allowing more visibility and exposure to the outside environment. The periods when the shading device is closed on the small window oriented more towards the south are shorter in Scenario 3 compared to Scenario 4 in March, due to the lower temperature inside the room in Scenario 3, which does not lead to the closure of the shading device. These periods of shading device closure are also higher in May and July in Scenario 3. This is due to the higher room temperature, which exceeds the limit that is defined in the control of the shading device, leading to the closure of the shading on the small window. The shading control system strategies in Scenarios 3 and 4, in general, do have positive impacts on the visual quality inside the room, but this has a negative impact on the indoor climate and the energy consumption, as discussed below.

4.4. The Impact of the Shading Device on the Energy Consumption for Heating in Scenarios 1 and 2

The visual quality of the four scenarios, as discussed above, is combined with other qualities, such as the energy efficiency, where a scenario might have better visual quality, but perhaps lower energy efficiency compared to the other scenarios. Comparing Scenarios 1 and 2, the total yearly area-weighted energy consumption (which is the yearly energy consumed divided by the room area (kWh/(m2·year)) of the building in Scenario 1 is higher than Scenario 2 by 15% (see Table 4). The yearly area-weighted energy consumption for heating is higher in Scenario 1 by 7% than the energy consumed in Scenario 2 (see Table 4); looking at Figure 10, it can be observed that, in March, the solar shading device in Scenario 1 is closed between 13:00 and 17:00 (the afternoon), while in Scenario 2 the shading device on the small window oriented more to the south is closed between 16:30 and 17:15, thus allowing a lot of heat gain to penetrate inside the room and reduce the energy consumed for heating, which is almost zero between 13:00 and 17:00 (see Table 6). In addition, the shading device on the large window oriented more to the north in Scenario 2 is closed only between 15:30 to 17:15 (see Figure 10), thus allowing a lot of heat gain from diffused and direct solar radiation (see Table 6) to penetrate inside the room.

4.5. The Impact of the Shading Device on the Energy Consumption for Mechanical Ventilation in Scenarios 1 and 2

The yearly area-weighted energy consumption for mechanical ventilation is higher by 22% in Scenario 1 compared to that consumed in Scenario 2 (see Table 4). Looking at Figure 8, it can be seen that, in July, the solar shading device in Scenario 1 is closed between 14:00 and 18:30, while in Scenario 2 the shading device on the small window oriented more to the south is totally closed for the whole day (see Figure 8), thereby preventing solar radiation from penetrating inside the room and reducing the consumed energy for mechanical ventilation. The shading device on the large window oriented more to the north is closed between 16:00 and 18:00 (see Figure 8), which is almost half the period in Scenario 1. This provides good visual quality and, at the same time, the solar radiation penetrating inside the room is still lower in Scenario 2 compared with Scenario 1 (see Table 7).

4.6. The Impact of the Shading Device on the Energy Consumption for Heating in Scenarios 2, 3, and 4

By comparing Scenarios 2, 3, and 4, the total yearly area-weighted energy consumption of the building (for lighting, HVAC Aux, heating) in Scenario 4 is higher than in scenario 2 by 13%; while in Scenario 3 it is higher than in Scenario 2 by 2% (see Table 4). In order to understand that difference in the total yearly area-weighted energy consumption of the building in these scenarios, a more detailed evaluation for the impact of the shading device on the energy consumption for heating in Scenarios 2, 3, and 4 is conducted below.
The yearly area-weighted energy consumption for heating is higher in Scenario 4 by 10% compared to Scenario 2, whereas Scenario 3 is almost the same as Scenario 2 (see Table 4). Looking at Figure 10, it can be seen that, in March (where there is high energy consumption for heating compared to May and July, due to the cold climate inside the room, hence this is why this month was chosen as a worst case scenario), the solar shading device on the large window oriented more towards the north is closed for the same period in the three Scenarios 2, 3, and 4, whereas the shading device on the small window oriented more to the south is closed only between 16:30 to 17:30 in Scenario 2 and it is open for the whole day in Scenario 3, due to the operative temperature limit in the shading control system, which is 1 °C more in Scenario 3 than in Scenario 2. This allows a lot of heat gain to penetrate into the room, and reduces the energy consumed for heating, which is almost zero between 13:00 and 17:00 in Scenario 3 (see Table 6). The shading device on the small window oriented more to the south is closed between 12:00 and 17:00, the whole afternoon, in Scenario 4 (see Figure 10), because the solar radiation intensity might have reached the predefined amount to be closed (closes at 250 W/m2; measured externally, as defined in the control system for the shading), leading to much less solar heat gain for this period compared with Scenarios 2 and 3, and thus leading to higher energy consumption for heating (see Table 6). It can be concluded from these results that Scenario 3 has the best control system for the shading devices with regard to heat energy consumption.

4.7. The Impact of the Shading Device on the Energy Consumption for Mechanical Ventilation in Scenarios 2, 3, and 4

The yearly area-weighted energy consumption for mechanical ventilation is higher in Scenario 4 by 21% compared with Scenario 2, and higher in Scenario 3 by 9% compared with Scenario 2 (see Table 4). Looking at Figure 8, it can be observed that, in July (where there is high energy consumption for mechanical ventilation compared to May and March, due to the high room temperature, hence this is why this month was chosen as worst case scenario), the solar shading device on the large window oriented more towards the north is closed for the same period in Scenarios 2, 3, and 4, whereas the shading device on the small window oriented more to the south is closed for the whole day in Scenario 2, thus preventing solar radiation from penetrating inside the room and reducing the energy consumed for mechanical ventilation (see Table 7). By comparison, the same shading device is closed from late morning (11:00) until nighttime in Scenario 3, but only between 12:30 and 17:30 in Scenario 4 (see Figure 8), which has an impact on increasing the solar radiation penetrating inside the room, and increases the energy consumed for mechanical ventilation compared with Scenario 2 (see Table 7). It can be concluded from these results that Scenario 2 has the best control system for the shading devices with regard to the mechanical ventilation energy consumption.

4.8. The Impact of the Shading Device on the Thermal Indoor Climate for the Four Scenarios

The results for the simulation of thermal indoor climate for the four scenarios show that Scenario 2 has the best thermal indoor climate with the highest number of the thermal indoor climate for occupied hours in Category I (1724 h, which are 73% of the total occupied hours) (see Table 5). Scenarios 1, 2, and 3 have a better thermal indoor climate compared to Scenario 4, which has a lower number of the thermal indoor climate occupied hours in Category I (1355 h, which are 58% of the total occupied hours) (see Table 5). It is possible to improve the thermal indoor climate in Scenario 4 by adding a cooling coil to the ventilation system, but this will increase the building’s energy consumption.

4.9. Economic Analysis

To assess the economic potential of multi-angled façade systems, three key aspects must be considered:
Initial Cost Increase: The cost of a multi-angled façade system is higher than that of a flat façade, due to the increased areas of windows, solar shading, and opaque façade parts. According to a study conducted by the authors of this paper, the cost of multi-angled façade components is approximately 188% of the cost of a flat façade [37]. The specifications and dimensions of both the multi-angled and flat façades are detailed in the Materials and Methods section.
Energy Consumption Costs: Over the building’s assumed 30-year lifespan, the energy consumption cost for an office room with a flat façade is about 4% higher than that of a multi-angled façade [37]. The energy consumption for both façade types is detailed in Table 4 of the Materials and Methods section. This reduction in energy costs benefits the building owner when opting for a multi-angled façade system.
Increased Rental Income: The multi-angled façade system allows for an increase in room area, leading to an approximate 22% rise in rental income compared to an office space with a flat façade [37]. This additional income is advantageous for the building owner.
The economic evaluation is conducted using the Net Present Value (NPV) method, which calculates the present value of all potential costs, outflows, and inflows of an investment [38]. The NPV for a flat façade is higher by approximately 148% to 1200%, depending on the real interest rates, compared to the NPV for a multi-angled façade system. This finding demonstrates that adopting a multi-angled façade system for office buildings is more economically efficient than using a flat façade.

4.10. Structural and Weather-Sealing Considerations

For an optimal structural design of the building façade, the prefabricated multi-angled façade unit should be as lightweight as possible to ensure proper support by the building’s structural system. The multi-angled component’s slab is constructed from reinforced concrete and forms an integral part of the room slab.
When these multi-angled façade units are installed from the first floor up to the top floor, additional columns may be incorporated if needed to support the load. The external corner of the façade system can be stabilized by columns on one side, while the opposite side can be fixed to the building’s bearing structure.
If further weight reduction of the multi-angled façade system is required, the windows can be downgraded from triple-glazed to double-glazed. While this modification would decrease the thermal efficiency of the façade unit, it would significantly lighten the overall weight of the system.
Since the multi-angled façade consists of two outward-extending sections, its exposure to the external environment per surface area is greater than that of a flat façade. Therefore, careful attention must be given to infiltration control during the design phase. Efficient sealing of air leaks around movable building components, such as operable windows, is essential. Additionally, gaps in stationary components must be properly filled. Moreover, thermal bridges in various façade components should be carefully addressed to enhance the overall energy efficiency of the system.
The long-term durability of the façade components is another critical factor. In this context, the quality of the dynamic solar shading system should be assessed, including the potential need for replacement over time. Additionally, the durability of the triple-layer windows must be considered, particularly regarding the gas filling in the gaps, which requires effective sealing to maintain performance and energy efficiency.
In general, a building’s façade incorporates key technical elements, such as insulation, natural ventilation, lighting, overheating control, glare reduction, acoustics, fire safety, escape routes, and outdoor views. When designing or renovating a façade, balancing these various factors can lead to conflicts, requiring compromises to achieve a sustainable design that addresses each aspect effectively.
The design methodology for multi-angled façade systems establishes a correlation between different façade design elements, including shading device performance, energy consumption, indoor climate, and heat gain and loss. The results of the shading performance analysis demonstrated the potential of a novel multi-angled façade configuration, which enhances outdoor views compared to conventional flat façades. Additionally, this study explores the impact of this innovative façade design on energy consumption and indoor climate.
The simulation results indicated that multi-angled façade systems have the potential to optimize daylight utilization and solar heat gain within office spaces while maintaining a less complex design process compared to the Schüco Parametric System mentioned in the Introduction. Additionally, the findings demonstrated that these systems can effectively enhance both daylight access and solar heat distribution through the two sections of the façade, offering advantages over the building façade of Horten Headquarters, also referenced in the Introduction.

5. Conclusions

The evaluation of the visual potential of office room façades in enhancing external views through windows revealed that the duration during working hours when the shading device remains fully closed is significantly higher for a flat façade (Scenario 1) compared to a multi-angled façade system (Scenario 2). Specifically, the shading device closure time was reduced by 20% in July, 10% in May, and 20% in March for the multi-angled façade system (the shading device can be closed on one of the multi-angled façade parts, while the other remains open). Additionally, the total yearly area-weighted energy consumption of the building in Scenario 1 is higher than in Scenario 2 by 15%, by 13% in Scenario 3, and by 1.5% in Scenario 4. In Scenario 2, the shading device on the smaller section of the multi-angled façade remains closed for extended periods during the hot season, and for shorter periods during the cold season. This helps reduce energy consumption and improves the indoor climate by minimizing solar heat gain in summer, while allowing heat gain in winter.
The shading control system in the multi-angled façade system has an impact on the visual quality of the façade, in addition to its impact on the energy consumption and the indoor climate of the building (thermal comfort and heat gain). The shading control system applied in Scenario 4 (depending on solar radiation intensity of 250 W/m2 on both windows) has a better visual quality. In July, the duration of solar shading closure (in hours) on the small window in Scenario 4 is 28% shorter than in Scenario 3, and 55% shorter than in Scenario 2. Similarly, in May, the shading closure time in Scenario 4 is reduced by 50% compared to Scenario 3, and by 72% compared to Scenario 2. The shading control system used in Scenario 2 demonstrates a more positive effect on energy consumption, reducing it by 2.5% compared to Scenario 3, and by 13% compared to Scenario 4. Additionally, it contributes to an improved indoor climate within the building. The three chosen periods for the simulations can be generalized over the whole year, as explained and argued at the beginning of the results section.
This study’s key contributions can be summarized as follows: From a visual standpoint, the façade system in Scenario 4 is the preferred choice, whereas from an economic and indoor climate perspective, Scenario 2 offers a more sustainable solution. Both façade systems in Scenarios 2 and 4 are designed as multi-angled façades which, as demonstrated in the results, outperform flat façades in overall performance. Focusing on the visual potentials of the multi-angled façade systems in office buildings and improving the indoor climate aligns with the UN Sustainable Development Goals 3, 9, 11, 12, and 13, which are as follows: (3) Good Health and Well-being; (9) Industry, Innovation and Infrastructure; (11) Sustainable Cities and Communities; (12) Responsible Consumption and Production; (13) Climate Action [39].
Future research could explore a daytime lighting analysis in combination with energy simulations. The focus could be on assessing Spatial Daylight Autonomy (sDA) and Annual Sunlight Exposure (ASE) in line with LEED certification standards.

Author Contributions

Writing—original draft, L.H.; Supervision, N.S. and G.D. Conceptualization, L.H. and N.S.; methodology, L.H.; software, L.H.; validation, L.H., N.S. and G.D.; formal analysis, L.H.; investigation, L.H.; resources, L.H.; data curation, L.H.; writing—original draft preparation, L.H.; writing—review and editing, L.H.; visualization, L.H.; supervision, N.S.; project administration, L.H. All authors have read and agreed to the published version of the manuscript.

Funding

This research received no external funding.

Data Availability Statement

The original contributions presented in this study are included in the article. Further inquiries can be directed to the corresponding author.

Conflicts of Interest

The authors declare no conflict of interest.

References

  1. Aksamija, A. Sustainable Facades; John Wiley & Sons, Inc.: Hoboken, NJ, USA, 2013. [Google Scholar]
  2. Hopfe, C.J.; Mcleod, R.S. The Passivehaus Designer’s Manual; Routledge: London, UK; New York, NY, USA, 2015. [Google Scholar]
  3. Thorpe, D. Passive Solar Architecture Pocket Reference; Routledge: London, UK; New York, NY, USA, 2017. [Google Scholar]
  4. Zhang, Y.; Chen, T.; Gasparri, E.; Lucchi, E. A Modular Agrivoltaics Building Envelope Integrating Thin-Film Photovoltaics and Hydroponic Urban Farming Systems: A Circular Design Approach with the Multi-Objective Optimization of Energy, Light, Water and Structure. Sustainability 2025, 17, 666. [Google Scholar] [CrossRef]
  5. Chen, T.; Tai, K.F.; Raharjo, G.P.; Heng, C.K.; Leow, S.W. A novel design approach to prefabricated BIPV walls for multi-storey buildings. J. Build. Eng. 2023, 63, 105469. [Google Scholar]
  6. Sengupta, A.; Deleu, J.; Lucidarme, B.; Breesch, H.; Steeman, M. Assessing Thermal Resilience to Overheating in an Office Building; IAQ: Boulder, CO, USA, 2020. [Google Scholar]
  7. Skarning, G.; Hviid, C.; Svendsen, S. The effect of dynamic solar shading on energy, daylighting and thermal comfort in a nearly zero-energy loft room in Rome and Copenhagen. Energy Build. 2017, 135, 302–311. [Google Scholar] [CrossRef]
  8. C.F. Møller Danmark A/S. Facade Design Parameters. Available online: www.cfmoller.com (accessed on 15 February 2017).
  9. PLH Architects A/S. Facade Design. Available online: www.plh.dk (accessed on 4 January 2017).
  10. NOVA5 Architects. Building Facade Design. Available online: www.nova5.dk (accessed on 2 March 2017).
  11. The Nordic Office of Architecture. Daylight in Buildings. Available online: www.nordicarch.com (accessed on 5 April 2017).
  12. NIRAS A/S. Building Facades. Available online: www.niras.com (accessed on 11 April 2018).
  13. Juan, L. Eco-Friendly Building Façade; Artpower International Publishing Co., Ltd.: Hong Kong, China, 2022. [Google Scholar]
  14. Christensen, J.E. Daylight Potentials. Available online: https://dtu.ac.in (accessed on 12 January 2018).
  15. Hannoudi, L.; Saleeb, N.; Dafoulas, G. Study of a Novel 3D Façade Configuration and Its Impact on Energy Performance and Office Space Sustainability. Energies 2024, 17, 4420. [Google Scholar] [CrossRef]
  16. EUmiesAward. European Union Prize. Available online: https://miesarch.com/work/1468 (accessed on 24 September 2024).
  17. Freepedia. Available online: www.freepedia.co.uk (accessed on 11 May 2020).
  18. Hannoudi, L.; Saleeb, N.; Dafoulas, G. Configuration optimisation of office multi-angled façade systems to reduce energy consumption and improve indoor climate quality. Energies 2024, 17, 5295. [Google Scholar] [CrossRef]
  19. Hannoudi, L.; Saleeb, N.; Dafoulas, G. The impact of glass properties on the energy efficiency and embodied carbon of multi-angled façade systems. J. Clean. Prod. 2024, 437, 140725. [Google Scholar] [CrossRef]
  20. 3XN. Available online: http://3xn.com/ (accessed on 3 January 2020).
  21. Schüco International KG. Available online: www.schueco.com (accessed on 12 January 2021).
  22. Young, E. Schueco Tackles the Affordability Issue Surrounding Parametric Design. Available online: www.ribaj.com/products/schueco-parametric-system-facades-digital-planning-affordable-design (accessed on 12 June 2019).
  23. EQUA. IDA Indoor Climate and Energy. EQUA Simulation AB. Available online: https://www.equa.se/en/ida-ice (accessed on 25 June 2022).
  24. ASHRAE 140-2004; Building Thermal Envelope and Fabric Load Tests. American Society of Heating, Refrigerating and Air-Conditioning Engineers, Inc.: Atlanta, GA, USA, 2010.
  25. CEN Standard EN 15255; Energy Performance of Buildings—Sensible Room Cooling Load Calculation. European Committee for Standardisation (CEN): Brussels, Belgium, 2007.
  26. CEN Standard EN 15265; Energy Performance of Buildings—Calculation of Energy Needs for Space Heating and Cooling Using Dynamic Methods—General Criteria and Validation Procedures. European Committee for Standardisation (CEN): Brussels, Belgium, 2007.
  27. Loutzenhiser, P.; Manz, H.; Maxwell, G. Empirical Validations of Shading/Daylighting/Load Interactions in Building Energy Simulation Tools; International Energy Agency: Dübendorf, Switzerland, 2007. [Google Scholar]
  28. DS/EN 16798; Energy Performance of Buildings. CEN Technical Secretariat, European Committee for Standardization: Brussels, Belgium, 2019.
  29. Hannoudi, L.; Lauring, M.; Christensen, J.E. Façade system for existing office buildings in Copenhagen. In Proceedings of the 6th International Building Physics Conference (IBPC), Torino, Italy, 14–17 June 2015. [Google Scholar]
  30. Hannoudi, L.; Lauring, M.; Christensen, J.E. Practicing Façade Renovation of Danish Buildings Built Between 1960 and 1980; UCL Press: London, UK; London South Bank University: London, UK, 2017; Proceeding 9; pp. 153–160. ISSN 2398-9467. [Google Scholar]
  31. Lindab A/S. Lindab Components. Available online: https://www.lindab.dk/ (accessed on 14 July 2023).
  32. Hvlid, C. Design of Ventilation; DTU: Lyngby, Denmark, 2014. [Google Scholar]
  33. European Commission. Energy Performance of Buildings Directive. Available online: https://ec.europa.eu/ (accessed on 24 September 2020).
  34. Secretariat of the Energy Labeling Scheme for Vertical Windows. Available online: http://energivinduer.dk (accessed on 18 May 2022).
  35. Rasmusen, S. Velfac Window Products. Available online: www.velfac.dk (accessed on 11 March 2023).
  36. Building and Housing Agency. Available online: http://bygningsreglementet.dk/ (accessed on 27 April 2019).
  37. Hannoudi, L.; Saleeb, N.; Dafoulas, G. Investigating the Sustainability Potential of Multi-Angled Façade Systems as a Renovation Strategy for Office Buildings; Middlesex University: London, UK, 2023. [Google Scholar]
  38. Insider, Inc. Personal Finance. Available online: https://www.businessinsider.com/ (accessed on 7 January 2022).
  39. UN/Department of Economic and Social Affairs (UNDESA). Sustainable Development. Available online: https://sdgs.un.org/ (accessed on 14 March 2023).
Figure 1. (A) A diagram illustrating an office room plan with multi-angled façade solutions. (B) A façade system designed with multi-angled façade. (C) An office room layout featuring a flat façade. (D) A design representation of a flat façade.
Energies 18 01565 g001
Figure 2. (AC) Three virtual simulations conducted by the authors for office buildings featuring multi-angled façade systems with varying cladding materials.
Energies 18 01565 g002
Figure 3. (A) Bay windows used in the late Victorian and Edwardian eras. (B,C) Contemporary buildings in Denmark incorporating façade extensions. Photo source: (A): Freepedia [17]. (B,C) EUmies awards [16].
Energies 18 01565 g003
Figure 4. (A) The façade of Horten Headquarters, designed by 3XN in Hellerup, Denmark. (B) The Schüco Parametric System, featuring a geometrically freeform 3D façade design. Photo source: (A) 3XN website: https://3xn.com (accessed on 12 March 2022); (B) https://www.schueco.com (accessed on 20 April 2021).
Energies 18 01565 g004
Figure 5. A presentation for the research process included in this research study.
Energies 18 01565 g005
Figure 6. Key steps outlined in the Materials and Methods section.
Energies 18 01565 g006
Figure 7. (A) The multi-angled façade system. (B) Floor plan of an office room featuring a multi-angled façade system, where the larger section faces north and the smaller section faces south. Dimensions are included to illustrate the relationship between the façade extension and the overall room layout. (C) Section view (sec 1-1) through the office room.
Energies 18 01565 g007
Figure 8. Scenarios in which the shading devices are closed on a day in the middle of July.
Energies 18 01565 g008
Figure 9. Scenarios in which the shading devices are closed on a day in the middle of May.
Energies 18 01565 g009
Figure 10. Scenarios in which the shading devices are closed on a day in the middle of March.
Energies 18 01565 g010
Figure 11. The simulation results present the total primary energy consumption for all four scenarios in compliance with BR15.
Energies 18 01565 g011
Figure 12. Visual presentation of the four scenarios.
Energies 18 01565 g012
Table 1. The different scenarios for solar shading control strategies.
ScenarioSolar Shading Control System
Flat FaçadeMulti Angled Façade
The Small Window (Oriented
Towards the South)
The Large Window (Oriented
Towards the North)
1Closed at a solar radiation intensity of 250 W/m2
2 Closed at an operative indoor
temperature 24 °C
Closed at a solar radiation intensity of 250 W/m2
3 Closed at an operative indoor
temperature 25 °C
Closed at a solar radiation intensity of 250 W/m2
4 Closed at a solar radiation intensity of 250 W/m2Closed at a solar radiation intensity of 250 W/m2
Table 2. Material properties in the opaque part of the external envelope.
External Envelop MaterialsThickness
(m)
Thermal Conductivity
(W/m·K)
Total Thickness
m
Total U-Value
(W/m2·K)
Wood covering (outside)0.0300.1400.40.125
Air gap0.0200.170
Insulation0.2450.036
Concrete panel (inside)0.1080.150
Table 3. Window glass properties for the office rooms with a flat and a multi-angled façade.
Façade TypeFaçade PartsWindow Glass Properties
U-Value
W/m2 K
Light Transmittance
%
g-Value
%
Flat façadeFront façade 0.530.720.5
Multi-angled façadeLarge part 0.530.720.5
Small part 0.620.740.63
Table 4. The simulation results for primary energy consumption cover lighting, HVAC auxiliary systems, heating, and total primary energy consumption across the four scenarios, in accordance with BR15.
Scenario (1)Scenario (2)Scenario (3)Scenario (4)
The room area
(m2)
22.527.527.527.5
Lighting
(kWh/(m2·year))
5.74.14.14.2
HVAC Aux (fans & pumps)
(kWh/(m2·year))
13.310.411.413.2
Heating
(kWh/(m2·year))
26.925.124.927.9
Total
(kWh/(m2·year))
46.039.740.445.4
Table 5. The results for the thermal indoor climate across the four scenarios are presented in accordance with EN 16798-1/2.
ScenariosThe Number and Percentage of Occupied Hours Classified Under Each Thermal Indoor
Climate Category
Category I
(High)
Category II
(Medium)
Category III
(Moderate)
Category IV
(Low)
11667 (71%)601 (25%)63 (3%)18 (1%)
21724 (73%)536 (23%)73 (3%)16 (1%)
31670 (71%)590 (25%)73 (3%)16 (1%)
41355 (58%)883 (38%)84 (4%)27 (1%)
Table 6. The heat gain from solar radiation and energy from the heating units inside the office room for the four scenarios (1, 2, 3, and 4) on a day in the middle of March through the working hours 08:00–17:00 h.
HourScenario (1)Scenario (2)Scenario (3)Scenario (4)
Solar
Radiation W
Heating Unit
W/m2
Solar
Radiation W
Heating Unit
W/m2
Solar
Radiation W
Heating Unit
W/m2
Solar
Radiation W
Heating Unit
W/m2
86622871887148925
91351418011180918416
10257103648369637713
1132694976495350810
123797737373425757
13456515430154304614
14242317210171904582
15103213250132404892
16158116120145503890
1718506310112302110
Table 7. The heat gain from solar radiation and the energy consumption for mechanical ventilation inside the office room for the four scenarios (1, 2, 3, and 4) on a day in the middle of July through the working hours 08:00–17:00 h.
HourScenario (1)Scenario (2)Scenario (3)Scenario (4)
Solar
Radiation W
Mechanical Ventilation W/m2Solar
Radiation W
Mechanical Ventilation W/m2Solar
Radiation W
Mechanical Ventilation W/m2Solar
Radiation W
Mechanical Ventilation W/m2
82263207230723142
92809260438653957
103281530674551046613
113571533594821352214
124067386438656617
134356438443856267
1452815497134961450415
1511714512135101452416
169675868632962411
1713016148161541715418
Disclaimer/Publisher’s Note: The statements, opinions and data contained in all publications are solely those of the individual author(s) and contributor(s) and not of MDPI and/or the editor(s). MDPI and/or the editor(s) disclaim responsibility for any injury to people or property resulting from any ideas, methods, instructions or products referred to in the content.

