Article

A Novel Water-Flooding Characteristic Curve Based on Fractal Theory and Its Application

1
State Key Laboratory of Offshore Oil and Gas Exploitation, Beijing 100028, China
2
CNOOC Research Institute Co., Ltd., Beijing 100028, China
*
Author to whom correspondence should be addressed.
Energies 2025, 18(6), 1555; https://doi.org/10.3390/en18061555
Submission received: 3 December 2024 / Revised: 23 February 2025 / Accepted: 7 March 2025 / Published: 20 March 2025
(This article belongs to the Section H: Geo-Energy)

Abstract

There are currently numerous types of water-flooding characteristic curves, most of which are derived from fundamental theories such as material balance, relative permeability, along with experimental results. A single exponential or power function expression cannot accurately characterize the complex flow characteristics of different types of reservoirs, and the equivalent relationships corresponding to production wells and entire oilfields remain unclear. Consequently, practical applications often encounter issues such as curve tailing, difficulty in determining linear segments, inability to identify anomalous points, and inaccuracies in dynamic fitting and prediction. This paper derives a novel water-flooding characteristic curve expression based on fractal theory, incorporating the fractal characteristics of two-phase oil–water flow in reservoirs, as well as the micro-level pore–throat flow features and macro-level dynamic laws of water flooding. The approach is analyzed and validated with real oilfield cases. This study indicates that fitting with the novel water-flooding characteristic curve yields high correlation coefficients and excellent fitting results, demonstrating strong applicability across various types of oilfields and water cut stages. It can more accurately describe the water-flooding characteristics under different reservoir conditions and rapidly predict recoverable reserves, offering significant application value in the dynamic analysis of oilfields and the formulation of development strategies.

1. Introduction

The water-flooding characteristic curve is one of the commonly used reservoir engineering methods. Unlike other methods [1,2], the water-flooding characteristic curve is primarily based on the development dynamics and displacement mechanisms of water-driven reservoirs, focusing on analyzing the quantitative relationships between reservoir pressure, water cut, cumulative oil production, and other factors during the process of waterflood development. The core variables of the water-flooding characteristic curve typically include water cut, cumulative oil production, cumulative water injection, and recovery factor [3,4]. Utilizing mathematical models, it reflects the displacement efficiency and residual oil distribution characteristics of water-driven reservoirs, characterizing the physical displacement process. The water-flooding characteristic curve plays a crucial role in analyzing water injection dynamics and forecasting production in various oilfields, providing a solid foundation for reservoir monitoring, production planning, and long-term policy analysis.
Numerous conventional water-flooding characteristic curves exist, such as the Generalized Maxim and Nazarov series [5,6,7], primarily derived from material balance theory using experimental results and theoretical expressions involving leading-edge displacement and relative permeability. In recent years, scholars from both domestic and international institutions have expanded upon these traditional theories, introducing innovations such as those by Wang et al. [8], who fitted new water-flooding characteristic curves based on high water content data from different field sections, aiding in the prediction of dynamic production post-curve upturn. Similarly, Zhu et al. [9] developed diagrams correlating geological reserves with the slope of the linear segments, more accurately reflecting the variations in water content and extraction levels in oilfields. Additionally, Gu et al. [10] refined the representation of oil–water relative permeability, proposing a new type of Beta water-flooding characteristic formula using least squares and exhaustive methods for automated curve fitting, useful for characterizing the changes in water–oil ratios during high water-cut stages. The derivation of these curves heavily depends on the description of microscale flow processes within reservoir pore structures, making their ability to accurately portray these processes and integrate with macroscale oilfield production a critical factor in their widespread applicability. Current water-flooding characteristic curves, typically derived from conventional relative permeability experiments [11,12,13,14], often fail to directly reflect reservoir rock porosity traits in their parameters, leading to ambiguities at the oilfield scale. This results in issues such as curve upturns, significant discrepancies in fitted or predicted recoverable reserves, and variable predictive accuracy across different oilfields and individual wells [15,16,17,18,19,20]. Given that the two-phase flow of oil and water is influenced by multiple factors including physical properties, pore–throat distribution, and fluid characteristics, traditional curves based on exponential equations struggle to represent the complex flow under varied pore–throat conditions. Fractal representation methods, which consider fractal flow characteristics within different pore structures [21,22,23], may offer a viable solution to these challenges.
This paper derives a novel water-flooding characteristic curve by integrating fractal theory with the fractal characterization of oil–water two-phase flow in reservoirs with complex pore structures. The aim is to better capture the dynamic relative permeability and the macroscopic development and production characteristics of oilfields (reservoirs). This paper is divided into three sections: the first section details the derivation process of the theoretical formulas; the second section presents a comparative analysis of the application effects of different types of water-flooding curves using various oilfield (reservoir) examples, highlighting the significant advantages of the novel curve proposed in this study; and the third section provides a summary of the paper.

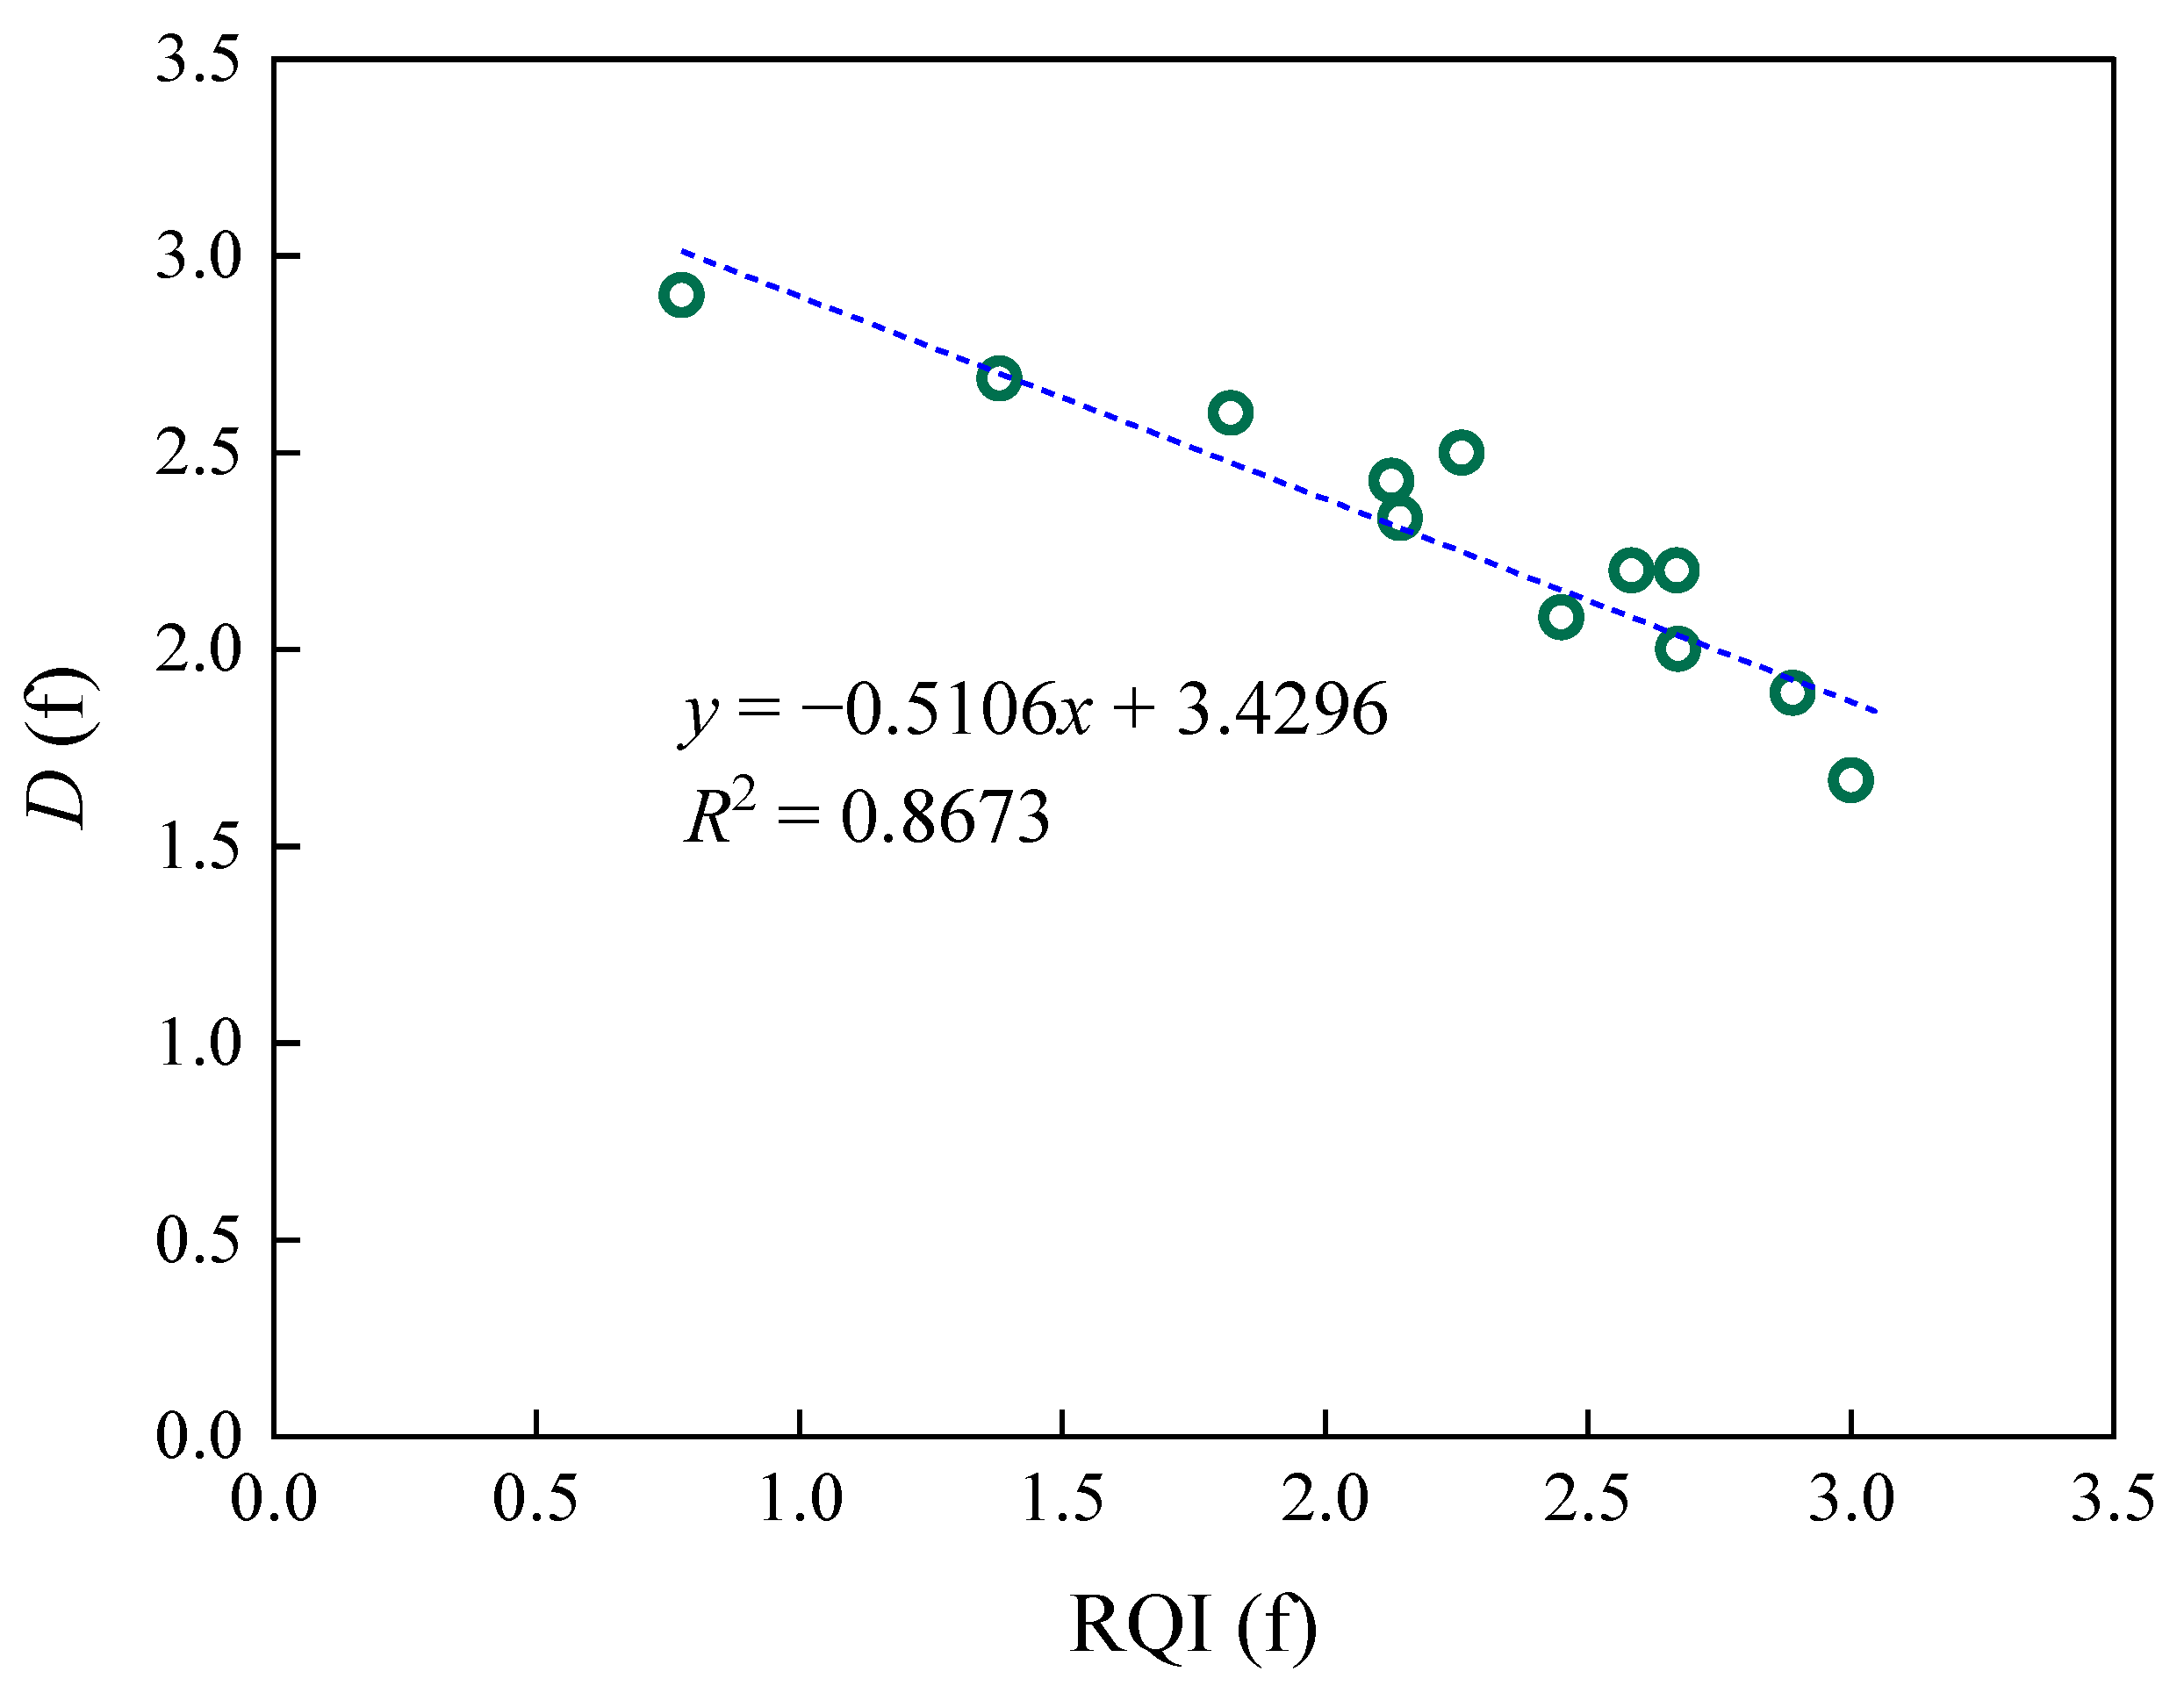
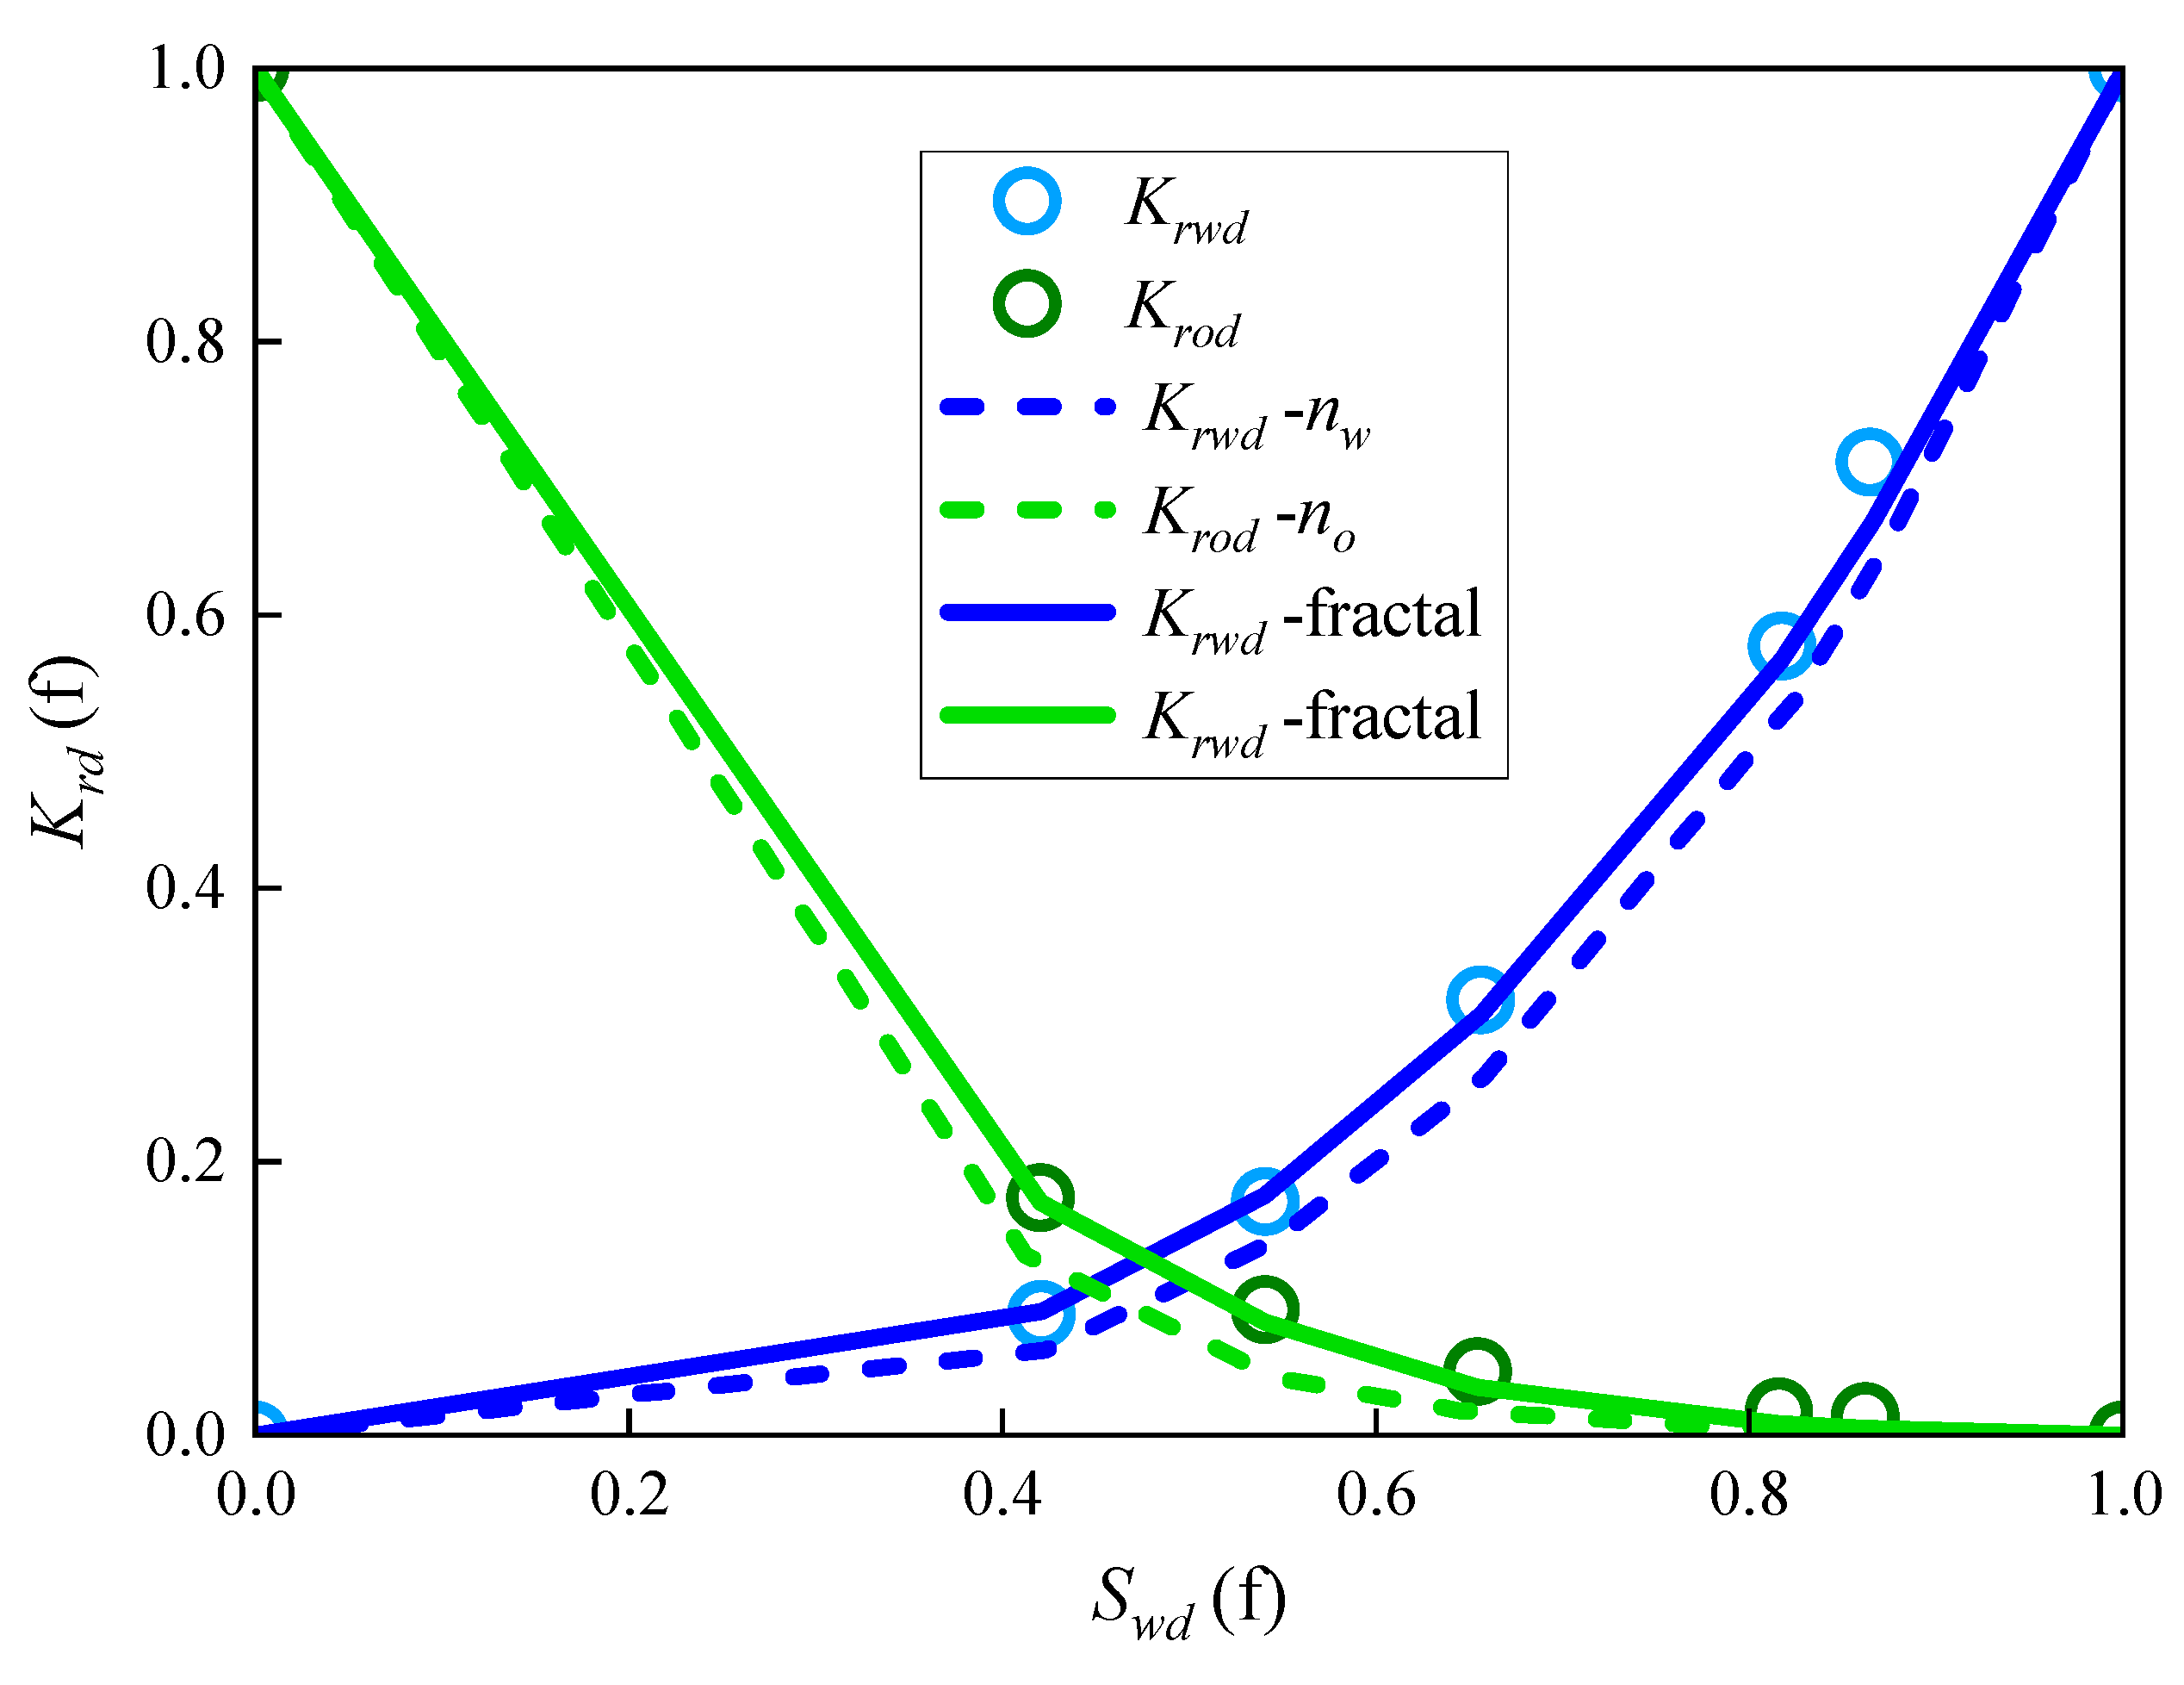
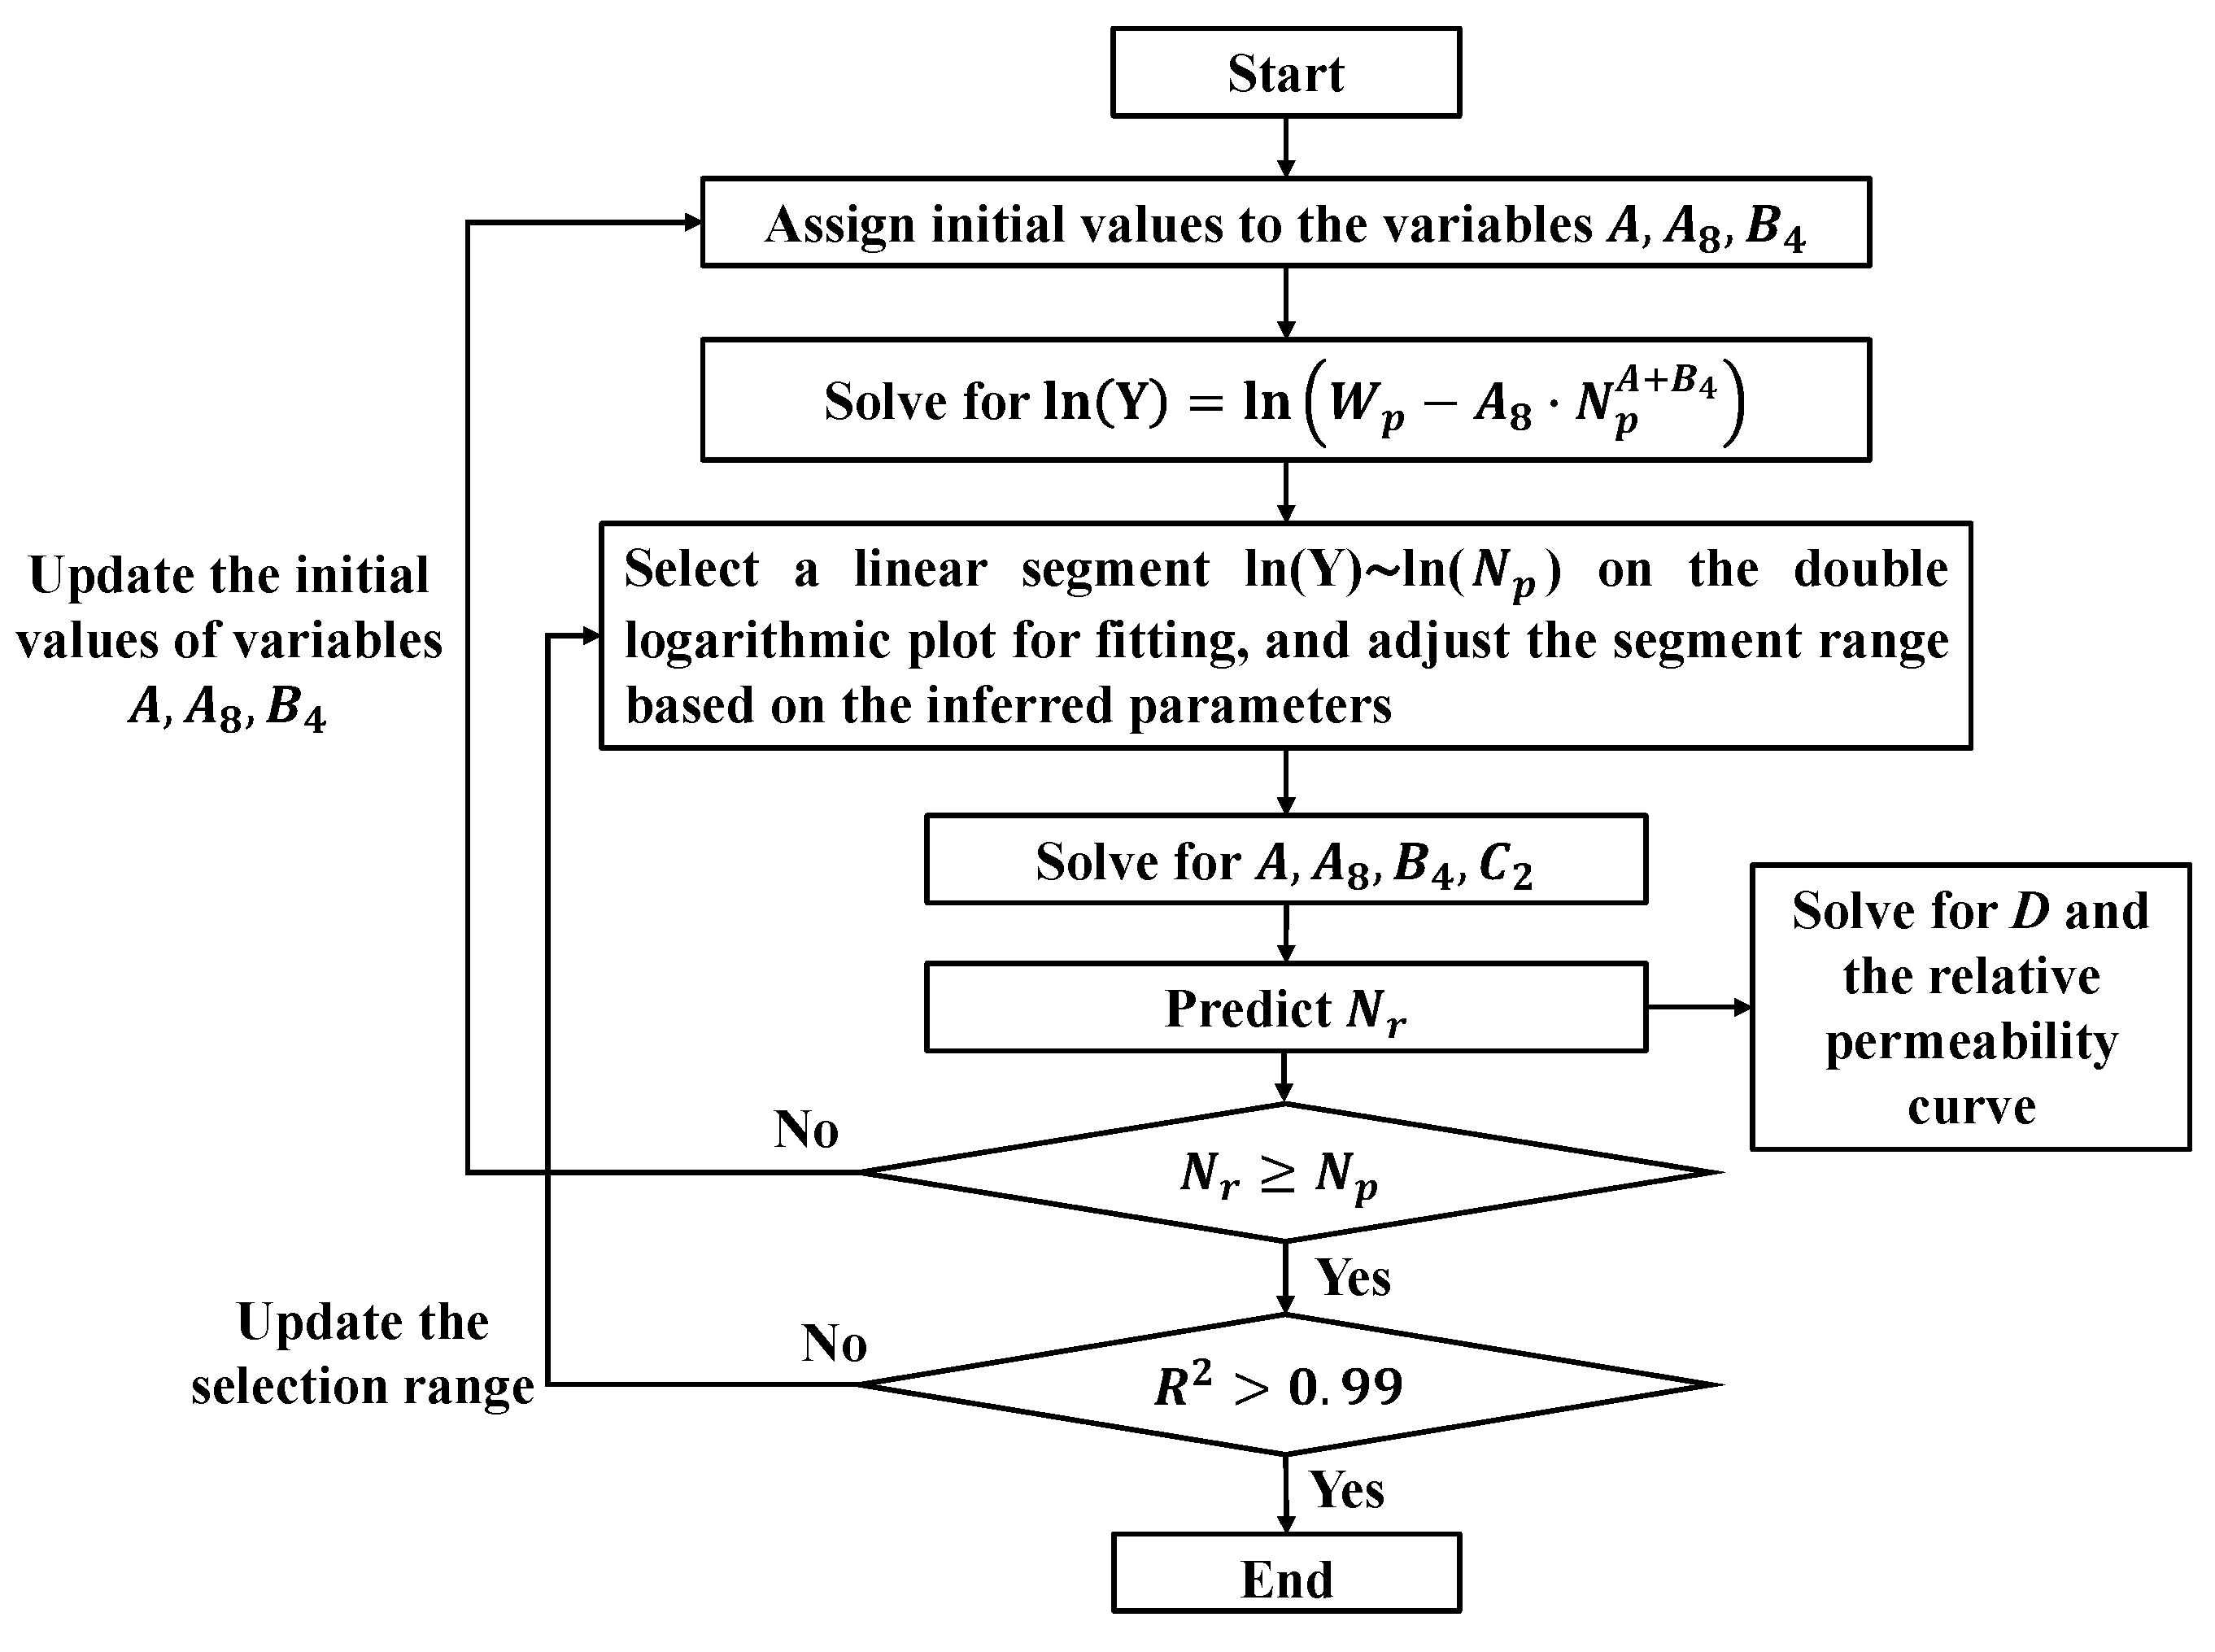
2. Establishment of the Mathematical Model

At the beginning of the establishment of the mathematical model, relevant fundamental assumptions were introduced: (1) the reservoir fluids consist of two phases, oil and water (no free gas); (2) the oil–water seepage conforms to Darcy’s law; (3) the seepage process is isothermal; and (4) the effects of gravity and capillary forces are neglected.
This paper selected a river facies oilfield in the Bohai Bay Basin as a typical example to illustrate the relationship between the Reservoir Quality Index (RQI) and the fractal dimension (D). The definition of the RQI is shown in Equation (1). The fractal dimension is a dimensionless physical quantity that characterizes the complexity of the distribution of microscopic pore–throat structures in the rock [21,22,23]. The current understanding is that the smaller the fractal dimension, the better the sorting of the reservoir rock, the lower the complexity of the pore–throat distribution, and the better the reservoir properties. The studied oilfields are located in the eastern part of the Bohai Bay Basin and consist of typical thin interbedded sandstone reservoirs formed by meandering and braided river deposits. The oil-bearing intervals are relatively long (up to 500 m), with a large number of sublayers (up to 47). The reservoirs have porosities ranging from 22% to 28% and permeabilities between 300 and 500 mD. The lithology comprises medium-to-fine-grained lithic feldspathic sandstones, with intergranular pores serving as the main reservoir space. The reservoirs are water-wet, and the formation crude oil viscosity ranges from 7 to 944 mPa·s. As shown in Figure 1, each point in the figure represents the result of a water-driven core relative permeability curve experiment. It can be observed that the fractal dimension shows a strong linear correlation with RQI corresponding to different cores. The smaller the fractal dimension, the larger the RQI. A similar linear relationship is also observed in other water-flooded reservoirs.
R Q I = 0.314 × k /
where k is the absolute permeability, D, and ∅ is the effective porosity, %.
Current research results on oil–water two-phase flow based on fractal dimension are shown in Equations (2)–(4) [23,24]. It is possible to conveniently fit and predict the seepage process of reservoirs with different characteristics based on the correlation analysis results from Figure 1 and Equations (2) and (3). Taking a core sample from the Bohai Bay Basin as an example, the normalized relative permeability curve is shown in Figure 2. It can be observed that by introducing the concept of fractal dimension, the seepage characteristics of the oil–water two-phase flow can be fitted more accurately, providing a basis for the derivation of the novel water-flooding characteristic curve.
K r o d = S o d 2 · [ 1 S w d 5 D 3 D ]
K r w d = S w d 11 3 D 3 D
S o d = 1 S w d
where Krod and Krwd represent the normalized relative permeabilities of the oil and water phases, respectively; Sod and Swd represent the normalized oil saturation and normalized water saturation, respectively; and D is the fractal parameter.
Combining Equations (2) and (3) yields
K r w d / K r o d = [ S w d 2 ( 1 S w d ) 2 ] · S w d A / ( 1 S w d A )
where A = ( 5 D ) / ( 3 D ) .
It is known that under the conditions of oil–water two-phase flow, the relationship between the relative permeability of the oil phase and water phase and the water saturation can be expressed as follows [6]:
K r w / K r o = a · ( S w d b ) c
The widely used power function expression for the relative permeability curve can be represented as follows:
K r w = K r w ( S o r ) · S w d n w K r o = K r o ( S w i ) · ( 1 S w d ) n o
By combining Equations (6) and (7), we can obtain
S w d n w ( 1 S w d ) n o = M · S w d N
By approximating Equation (5) using the power function expression as shown in Equation (8), the following expression can be obtained:
K r w d / K r o d = A 1 · S w d B 1 · A 2 · S w d A B 2 · 1 S w d A S w d A
Equation (9) can be transformed to
K r w d / K r o d = A 3 · S w d B 1 + A B 2 A · ( 1 S w d A )
where A1, A2, B1, and B2 are constant. Let A 3 = A 1 · A 2 and B 3 = B 1 + A B 2 A . Then,
K r w d / K r o d = A 3 · S w d B 3 · ( 1 S w d A )
Equation (11) can be further expressed as follows:
K r w d / K r o d = A 3 · S w d B 3 A 3 · S w d A + B 3
According to Darcy’s law, it is known that
K r w / K r o = Q w μ w B w / Q o μ o B o
where Qo and Qw represent the oil and water production rates, respectively, m3/d; μ o and μ w denote the viscosities of oil and water, respectively, mPa·s; B o and B w are the volume coefficients for oil and water, respectively.
Combining Equations (12) and (13), we obtain the following:
Q w = Q o · μ o B o μ w B w · K r w o r · A 3 · S w d B 3 A 3 · S w d A + B 3
where K r w o r represents the water-phase relative permeability at the residual oil endpoint.
The relationship between the oil saturation at the outlet and the daily oil production can be expressed as follows [25,26]:
Q o = N o 1 S w i · 2 3 · d S w e d t
where No represents the geological reserves of crude oil, m3; S w i is the irreducible water saturation; S w e is the water saturation at the outlet; t represents time, in days.
The cumulative water production of the oilfield, W p , can be expressed as follows:
W p = 0 t Q w d t
Substituting Equations (12), (14), and (15) into Equation (16) yields the following:
W p = A 4 · 0 S w d [ S w d B 3 S w d A + B 3 ] · d S w d
where
A 4 = A 3 · μ o B o μ w B w · N o 1 S w i · 2 3 · 1 1 S w i S o r · K r w o r
In the equation, S o r represents the residual oil saturation.
Integrating Equation (17) results in the following:
W p = A 4 · 1 B 3 + 1 · S w d B 3 + 1 1 A + B 3 + 1 · S w d A + B 3 + 1 + C 1
In the equation, C 1 is a constant. Let A 5 = A 4 · 1 B 3 + 1 , A 6 = 1 A + B 3 + 1 · A 4 . Given that S w d = N p / N r , which represents the ratio of cumulative oil production to movable oil volume, it follows that
W p = A 5 · N p N r B 3 + 1 + A 6 · N p N r A + B 3 + 1 + C 1
Let A 7 = A 5 / N r B 3 + 1 and A 8 = A 6 / N r A + B 3 + 1 . Then,
W p = A 7 · N p B 3 + 1 + A 8 · N p A + B 3 + 1 + C 1
Let C 1 = 0 . This leads to the characteristic solution of Equation (21), which is as follows:
W p = A 7 · N p B 3 + 1 + A 8 · N p A + B 3 + 1
Let B 4 = B 3 + 1 . Then,
W p = A 7 · N p B 4 + A 8 · N p A + B 4
Equation (23) can also be transformed into a linear form, which is as follows:
l n ( W p A 8 · N p A + B 4 ) = B 4 · l n ( N p ) + C 2
where C 2 = l n ( A 7 ). Equations (23) and (24) represent the newly derived expressions for the water-flooding characteristic curve.
Differentiating Equation (22), we obtain the following:
Q w = A 7 · B 3 + 1 · N p B 3 · Q o + A 8 · ( A + B 3 ) · N p A + B 3 · Q o
Let R = N p / N r represent the recovery factor of movable oil. By transforming Equation (25), the relationship between the water cut f w and R can be derived as follows:
f w 1 f w = A 7 · B 3 + 1 · R B 3 · N r B 3 + A 8 · A + B 3 · R A + B 3 · N r A + B 3
This new type of water-flooding characteristic curve can describe the water-flooding patterns in different types of reservoirs or individual wells.
According to the definitions of A5, A6, and B4,
A 6 / A 5 = B 3 + 1 A + B 3 + 1 = B 4 A + B 4
From this, A can be obtained as follows:
A = B 4 B 4 · A 5 A 6
From the definition of A , the fractal dimension D and the corresponding dynamic relative permeability curves can be obtained as follows:
D = ( 3 A 5 ) / ( A 1 )
Using Equations (27)–(29), dynamic relative permeability curves can be obtained, which reflect the coupled micro- and macroscopic behavior of water flooding within the operational range of reservoirs or individual wells. These curves are applicable to research in various aspects including well- or field-scale reservoir quality, displacement efficiency, production dynamics, reservoir history matching, well placement optimization, and forecasting recoverable water-flooding reserves. The methodology flow chart of the novel model proposed in this paper is illustrated in Figure 3.

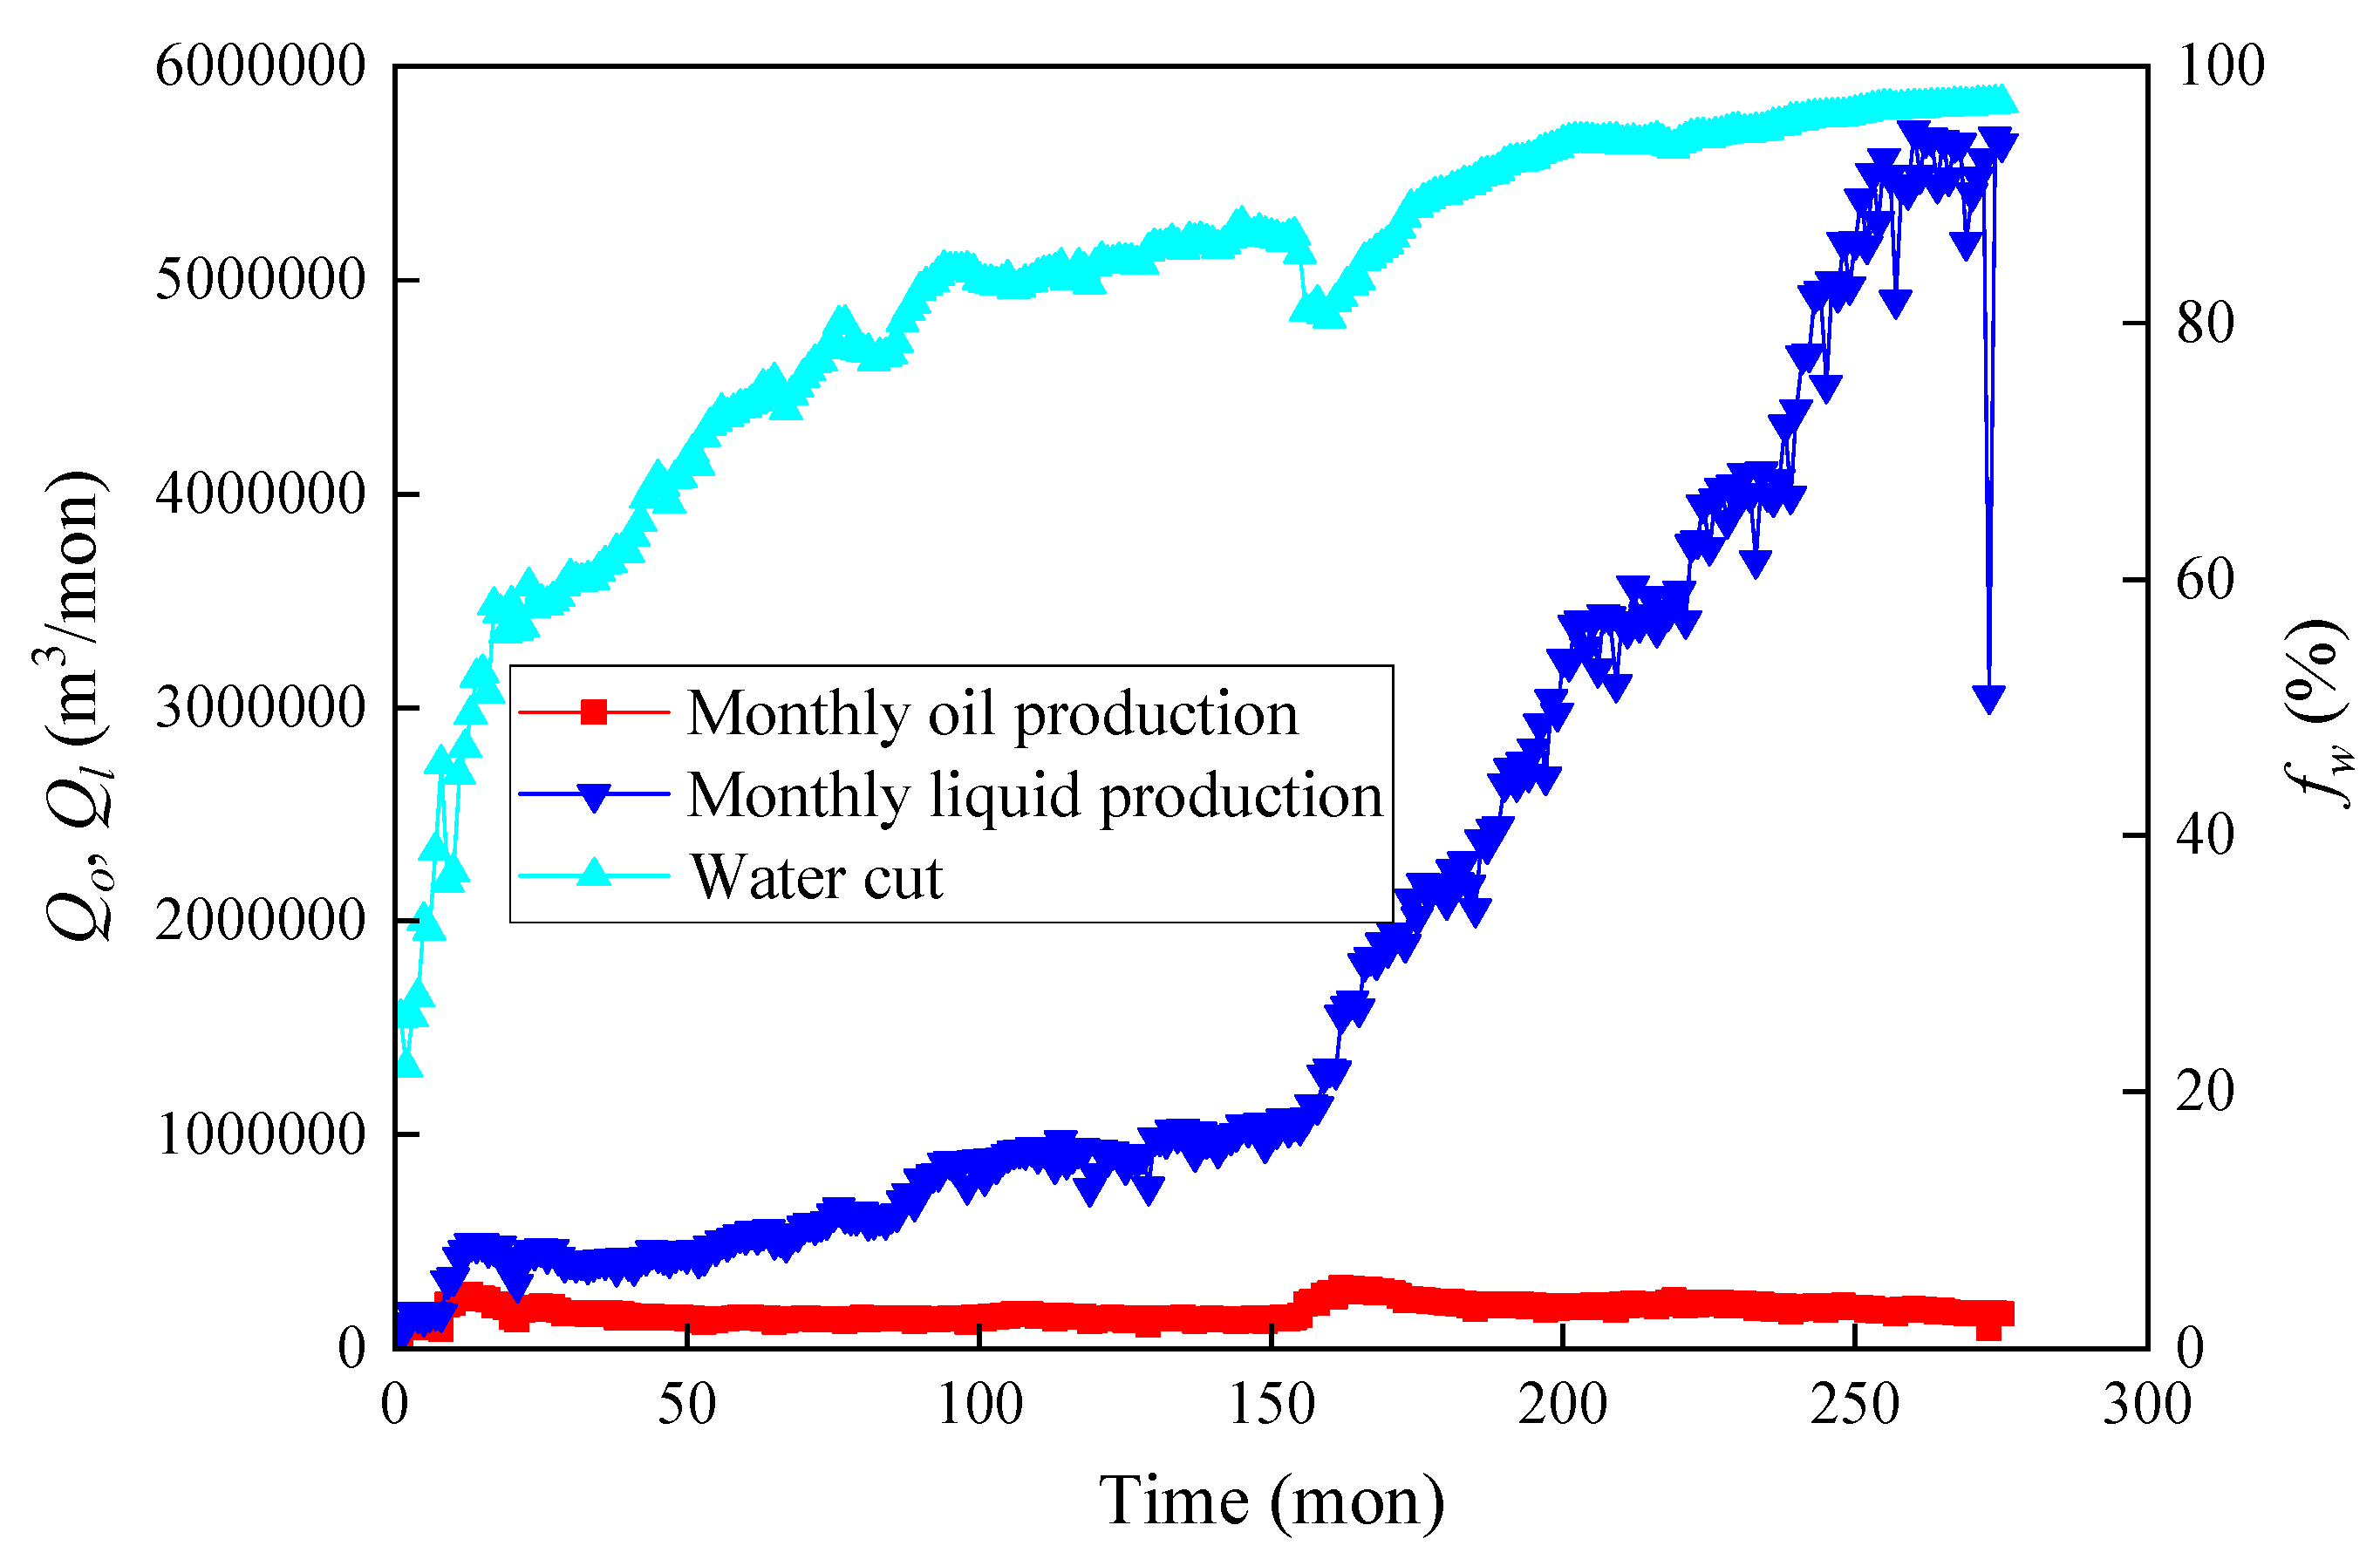
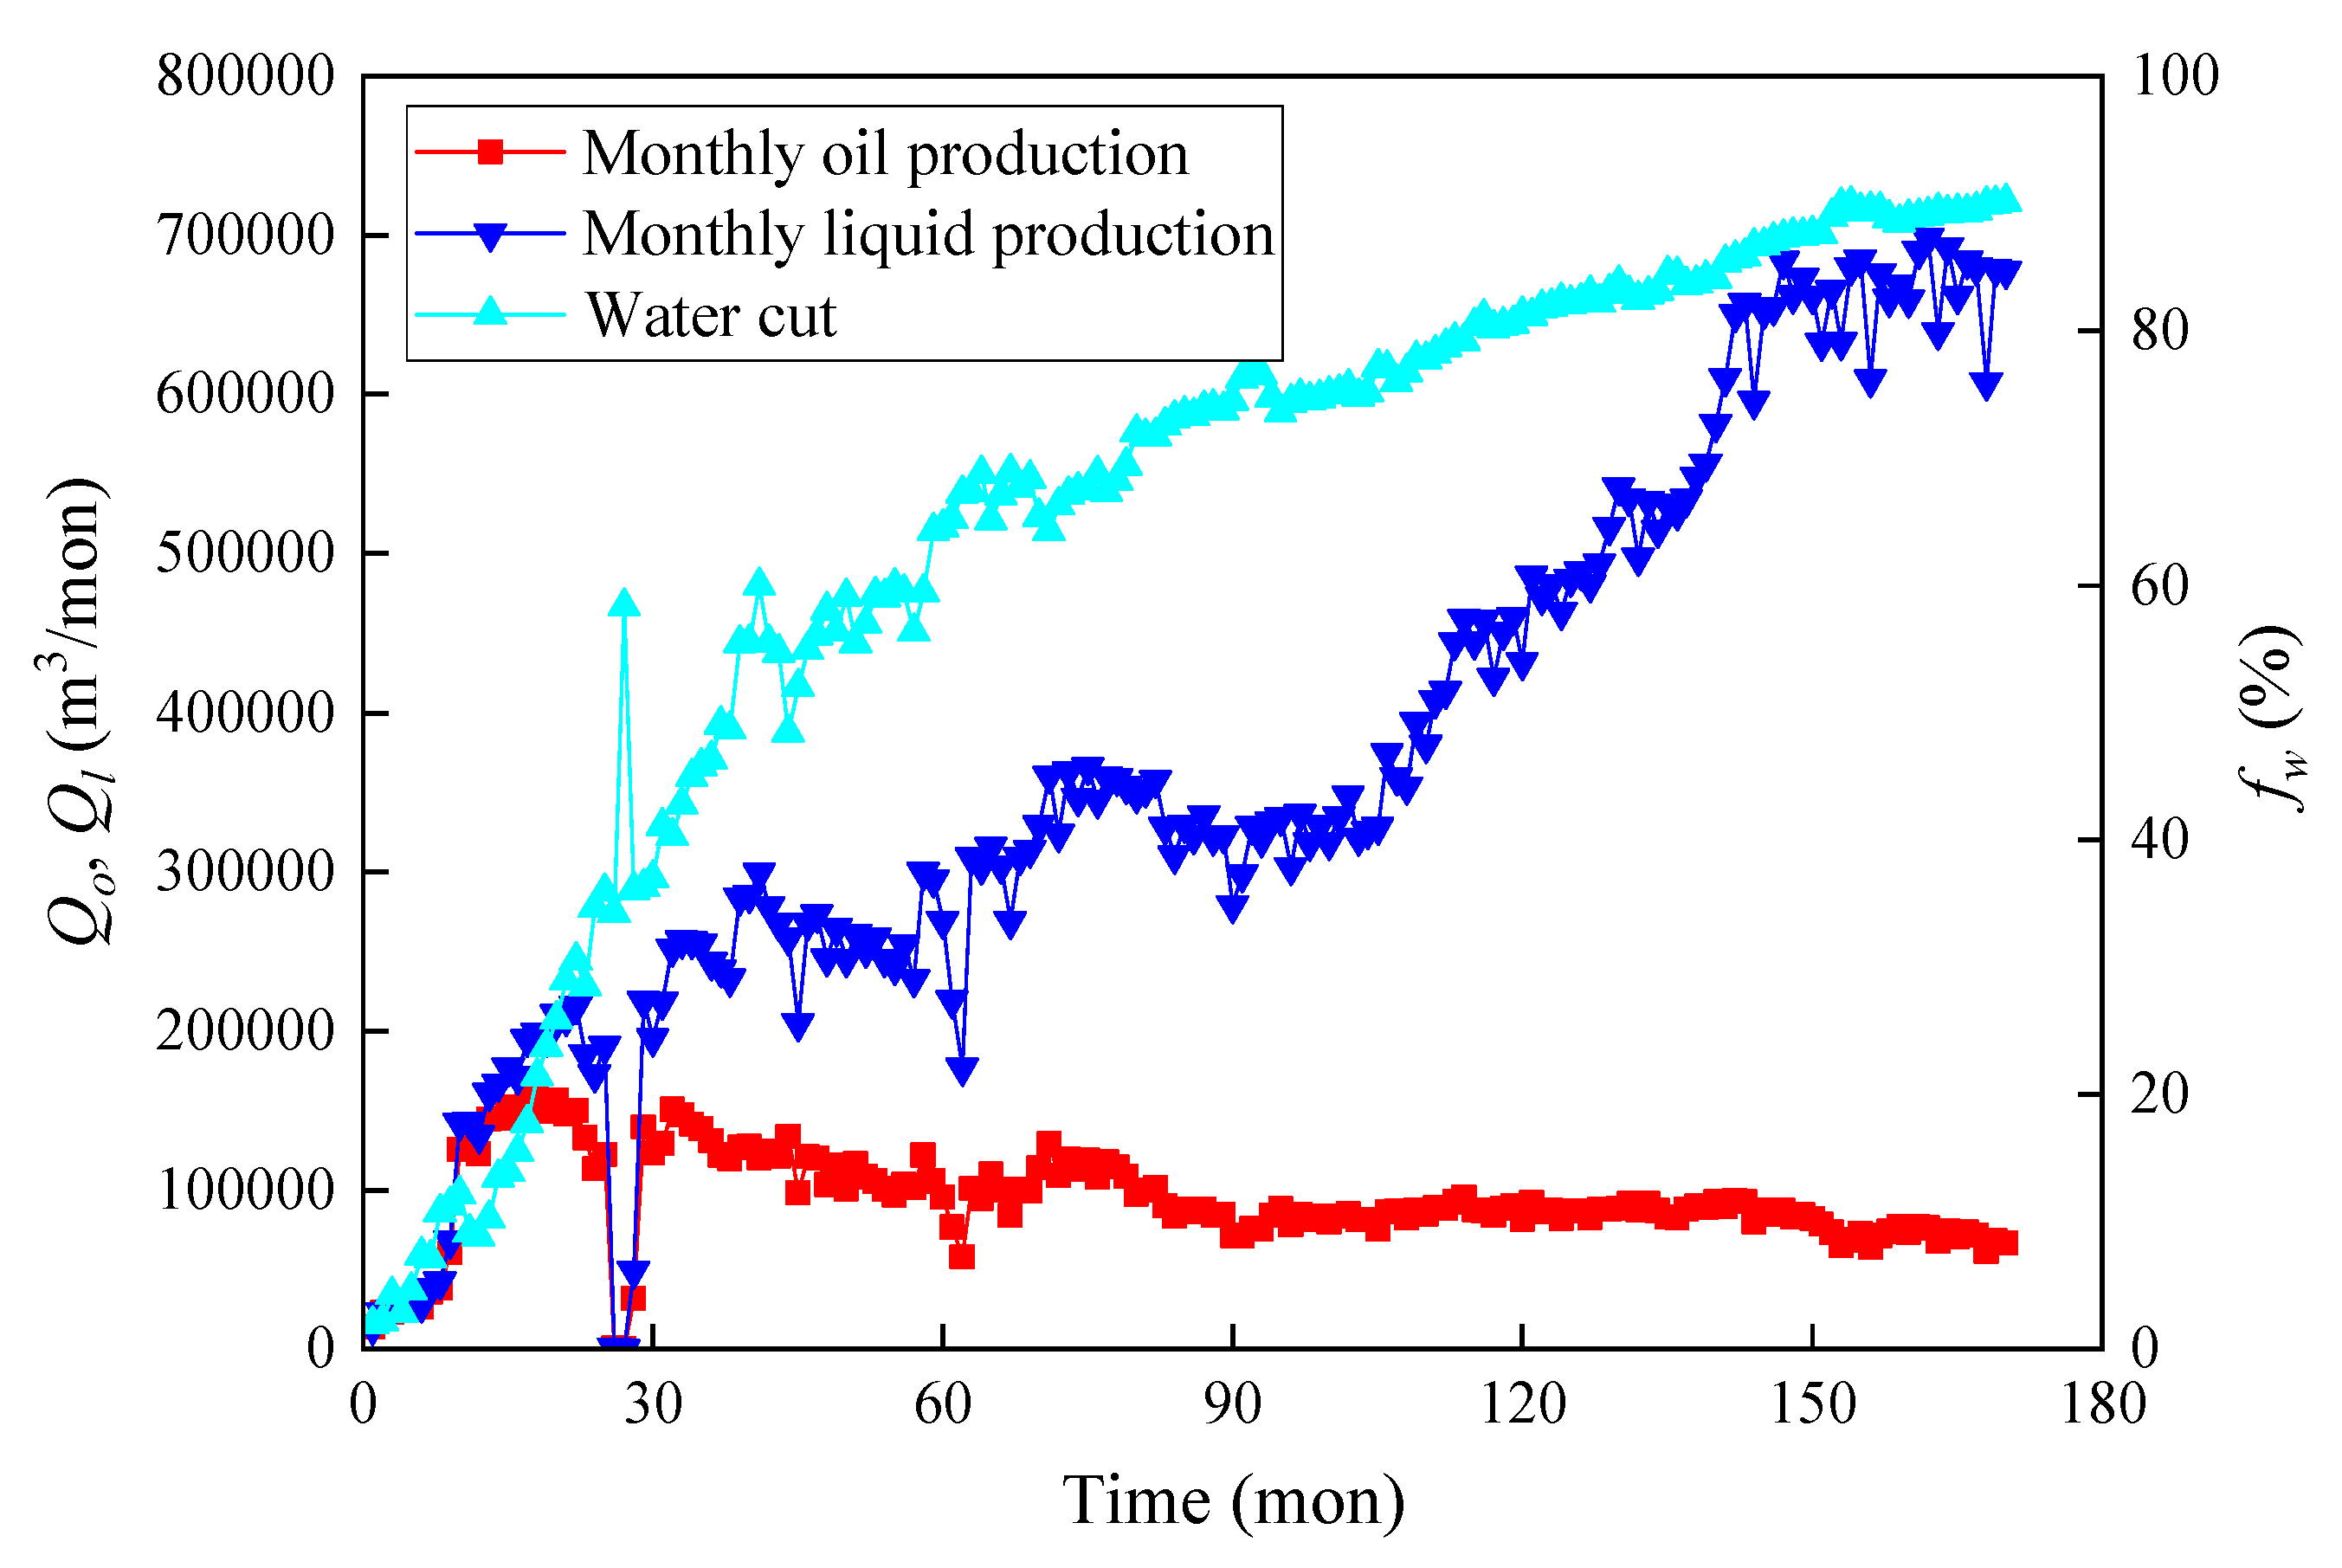
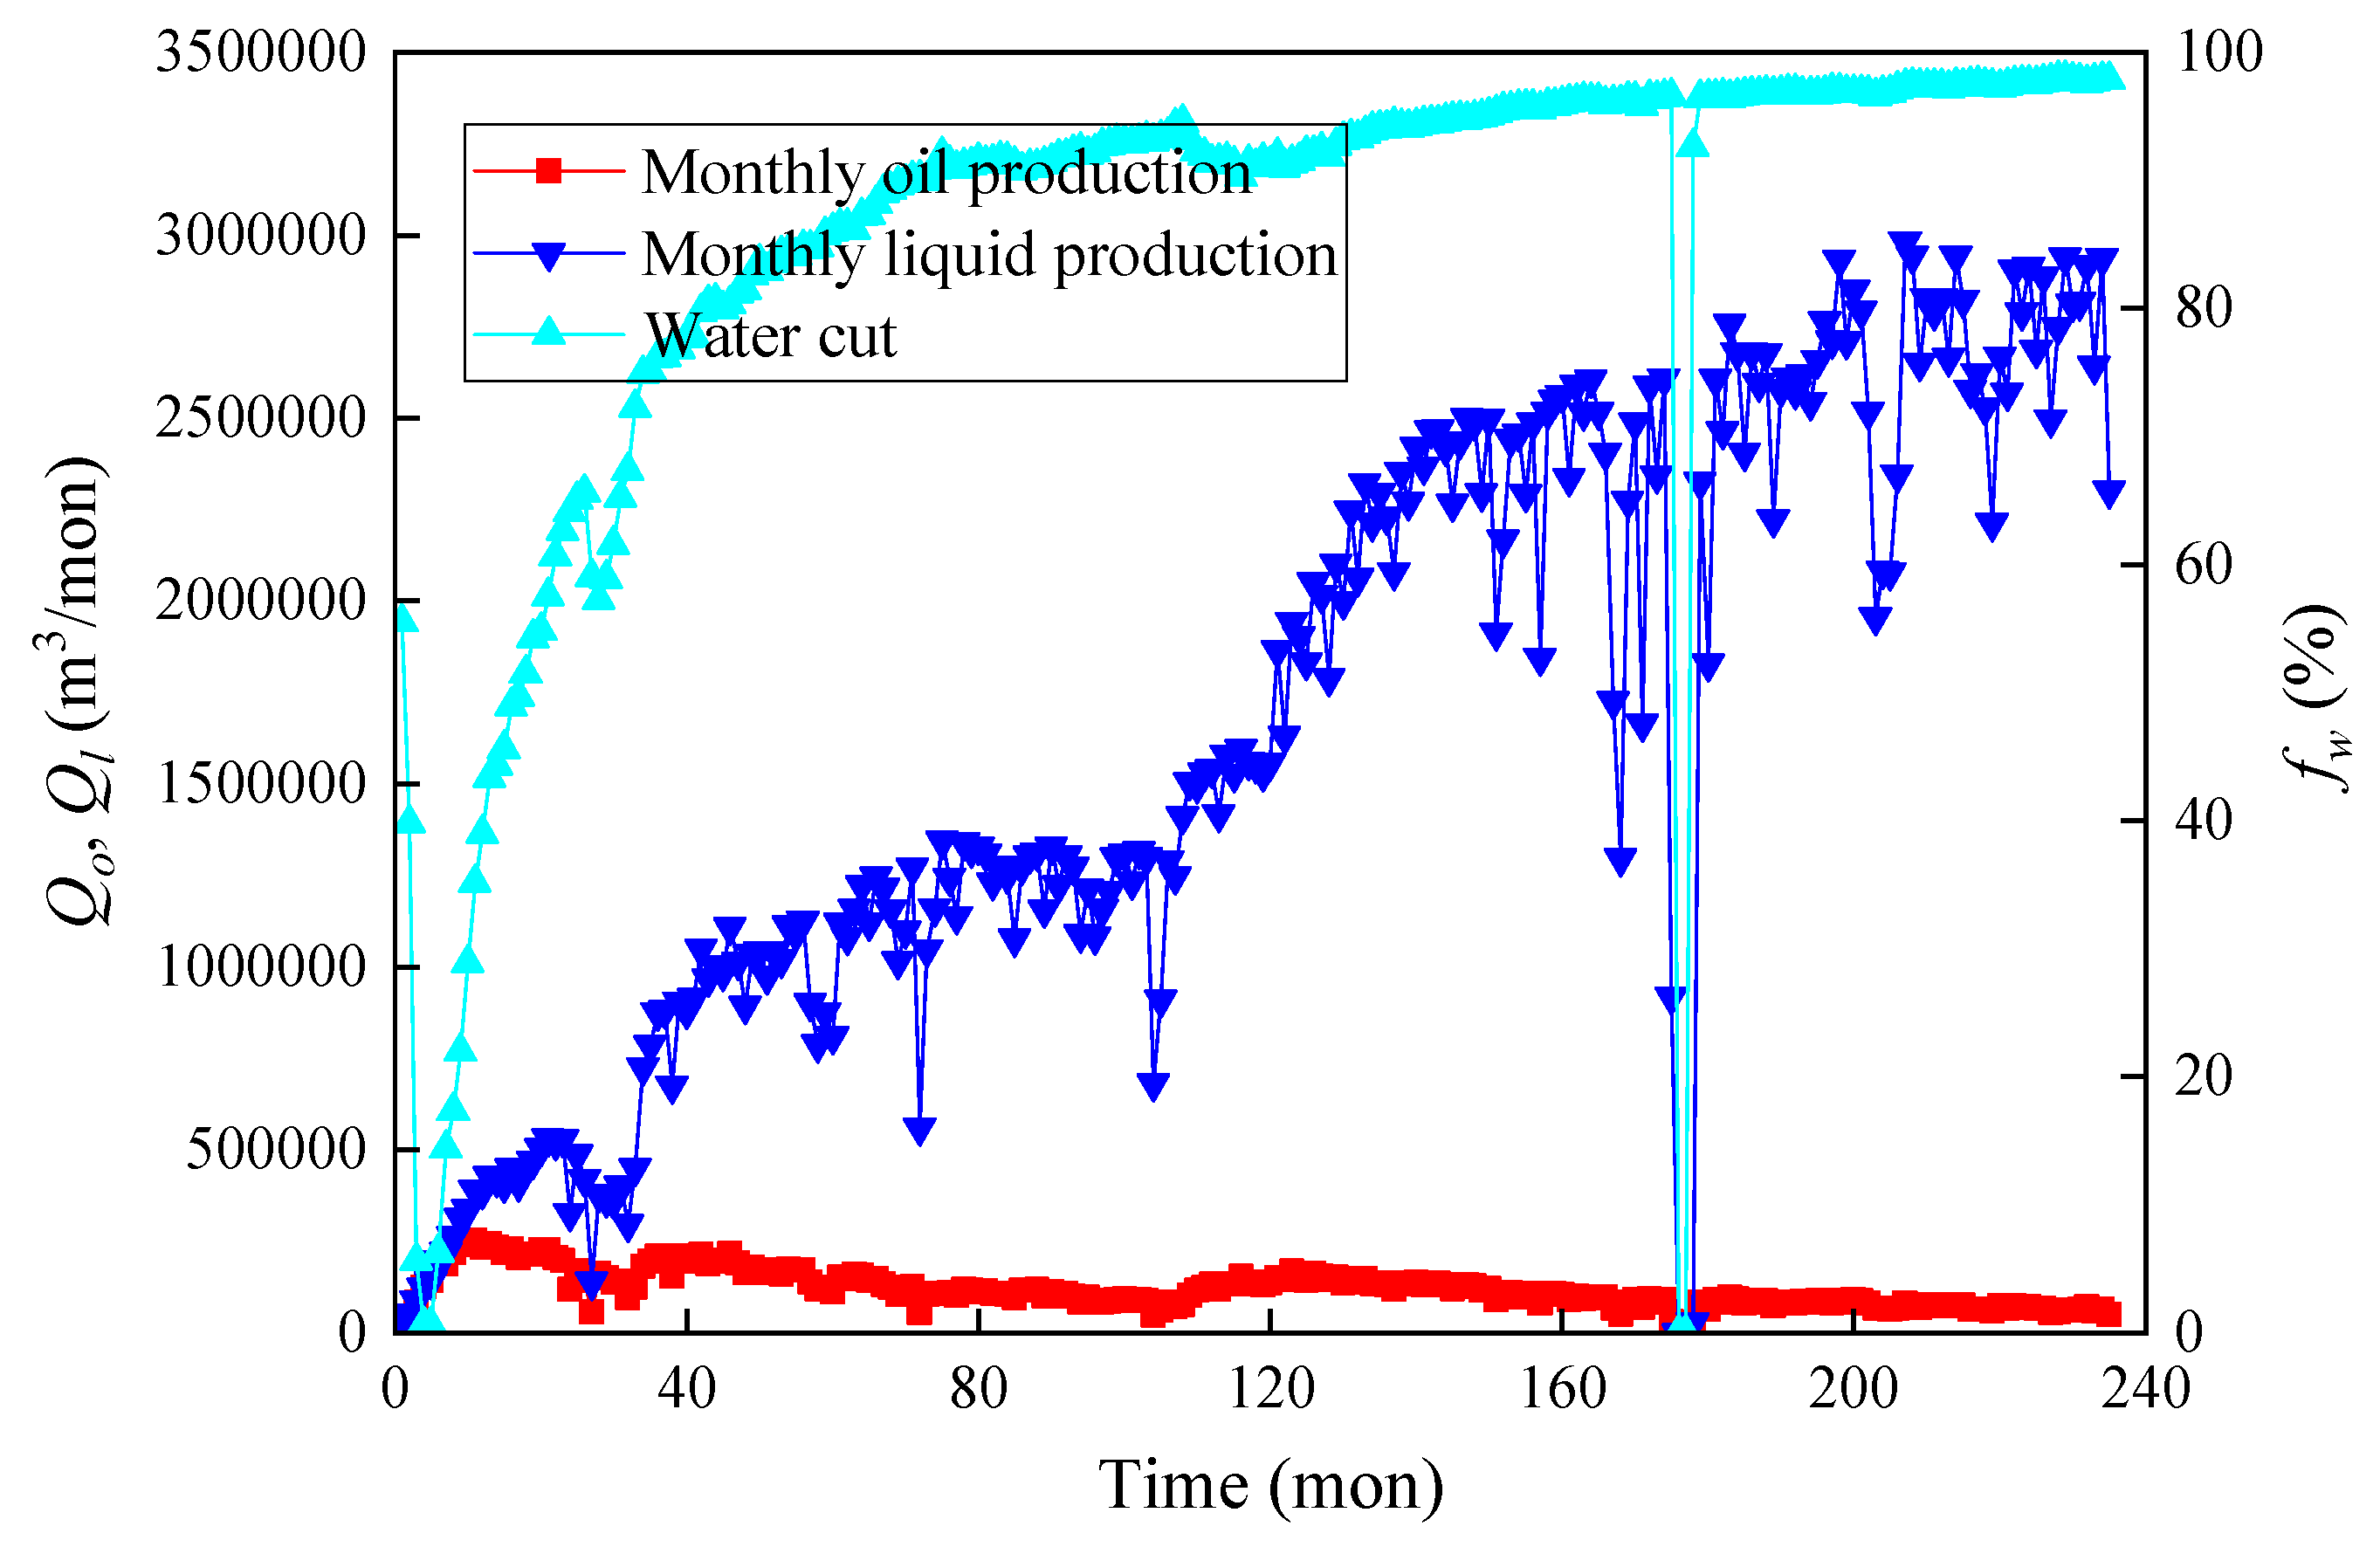
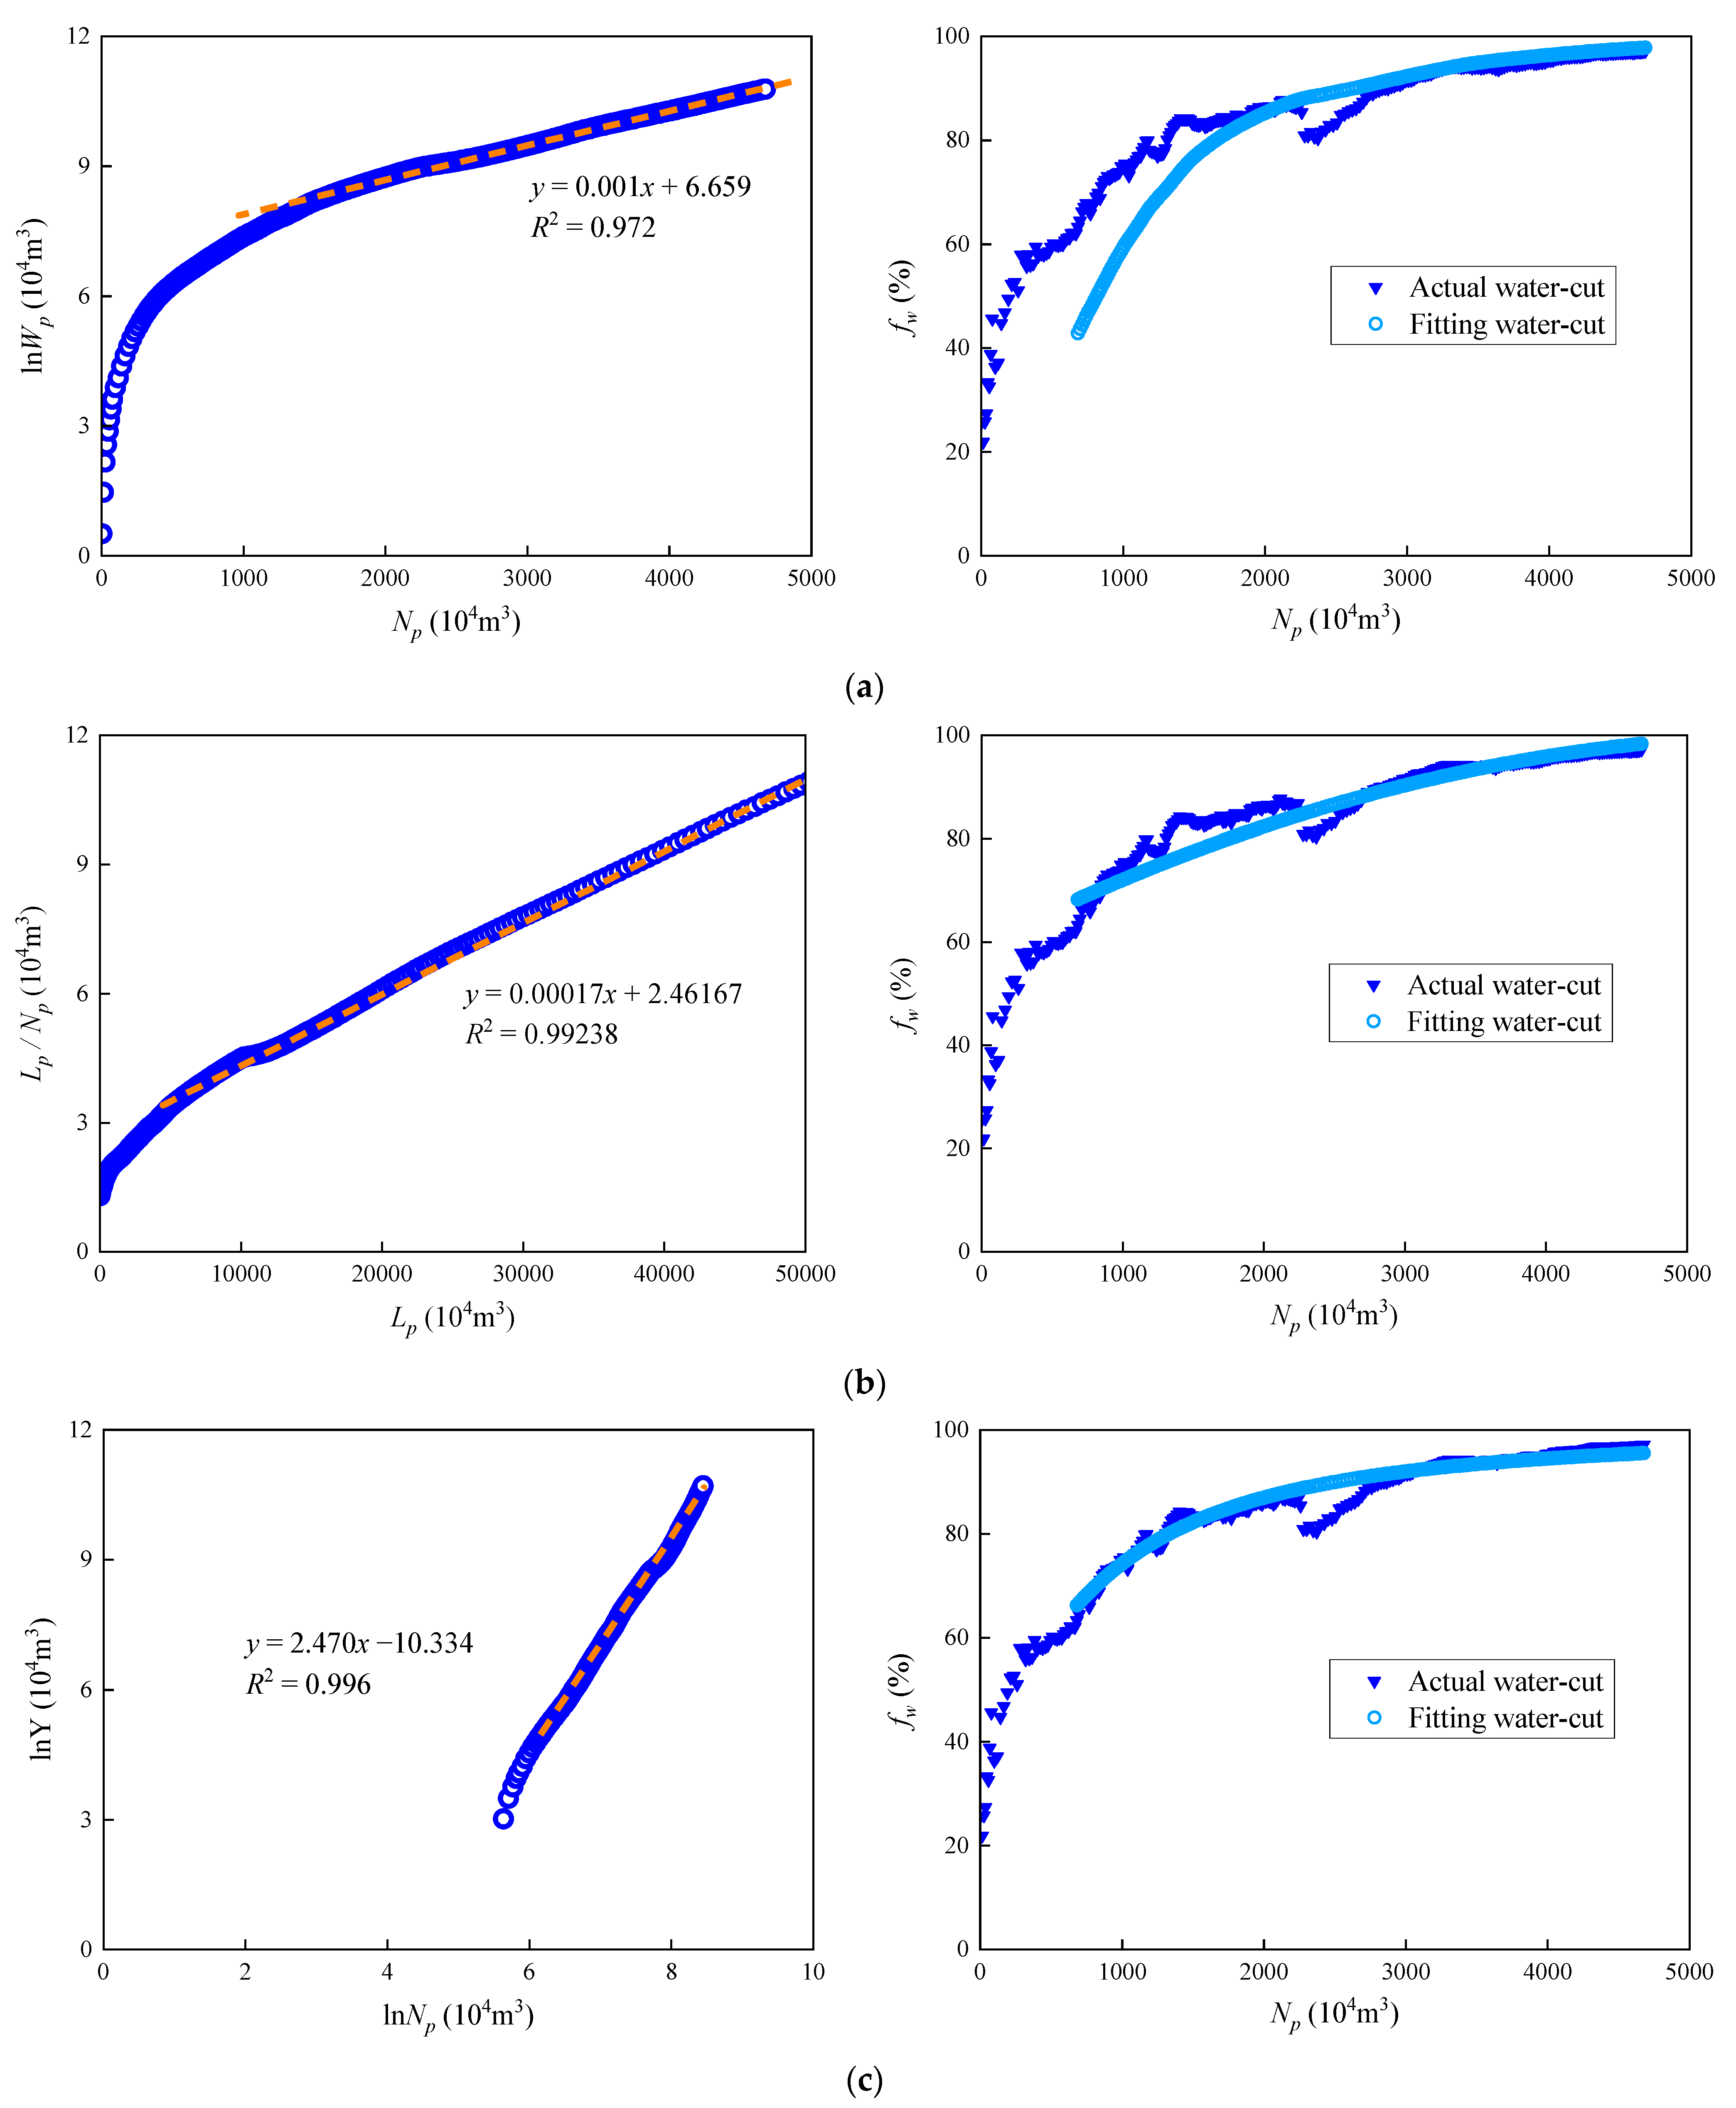
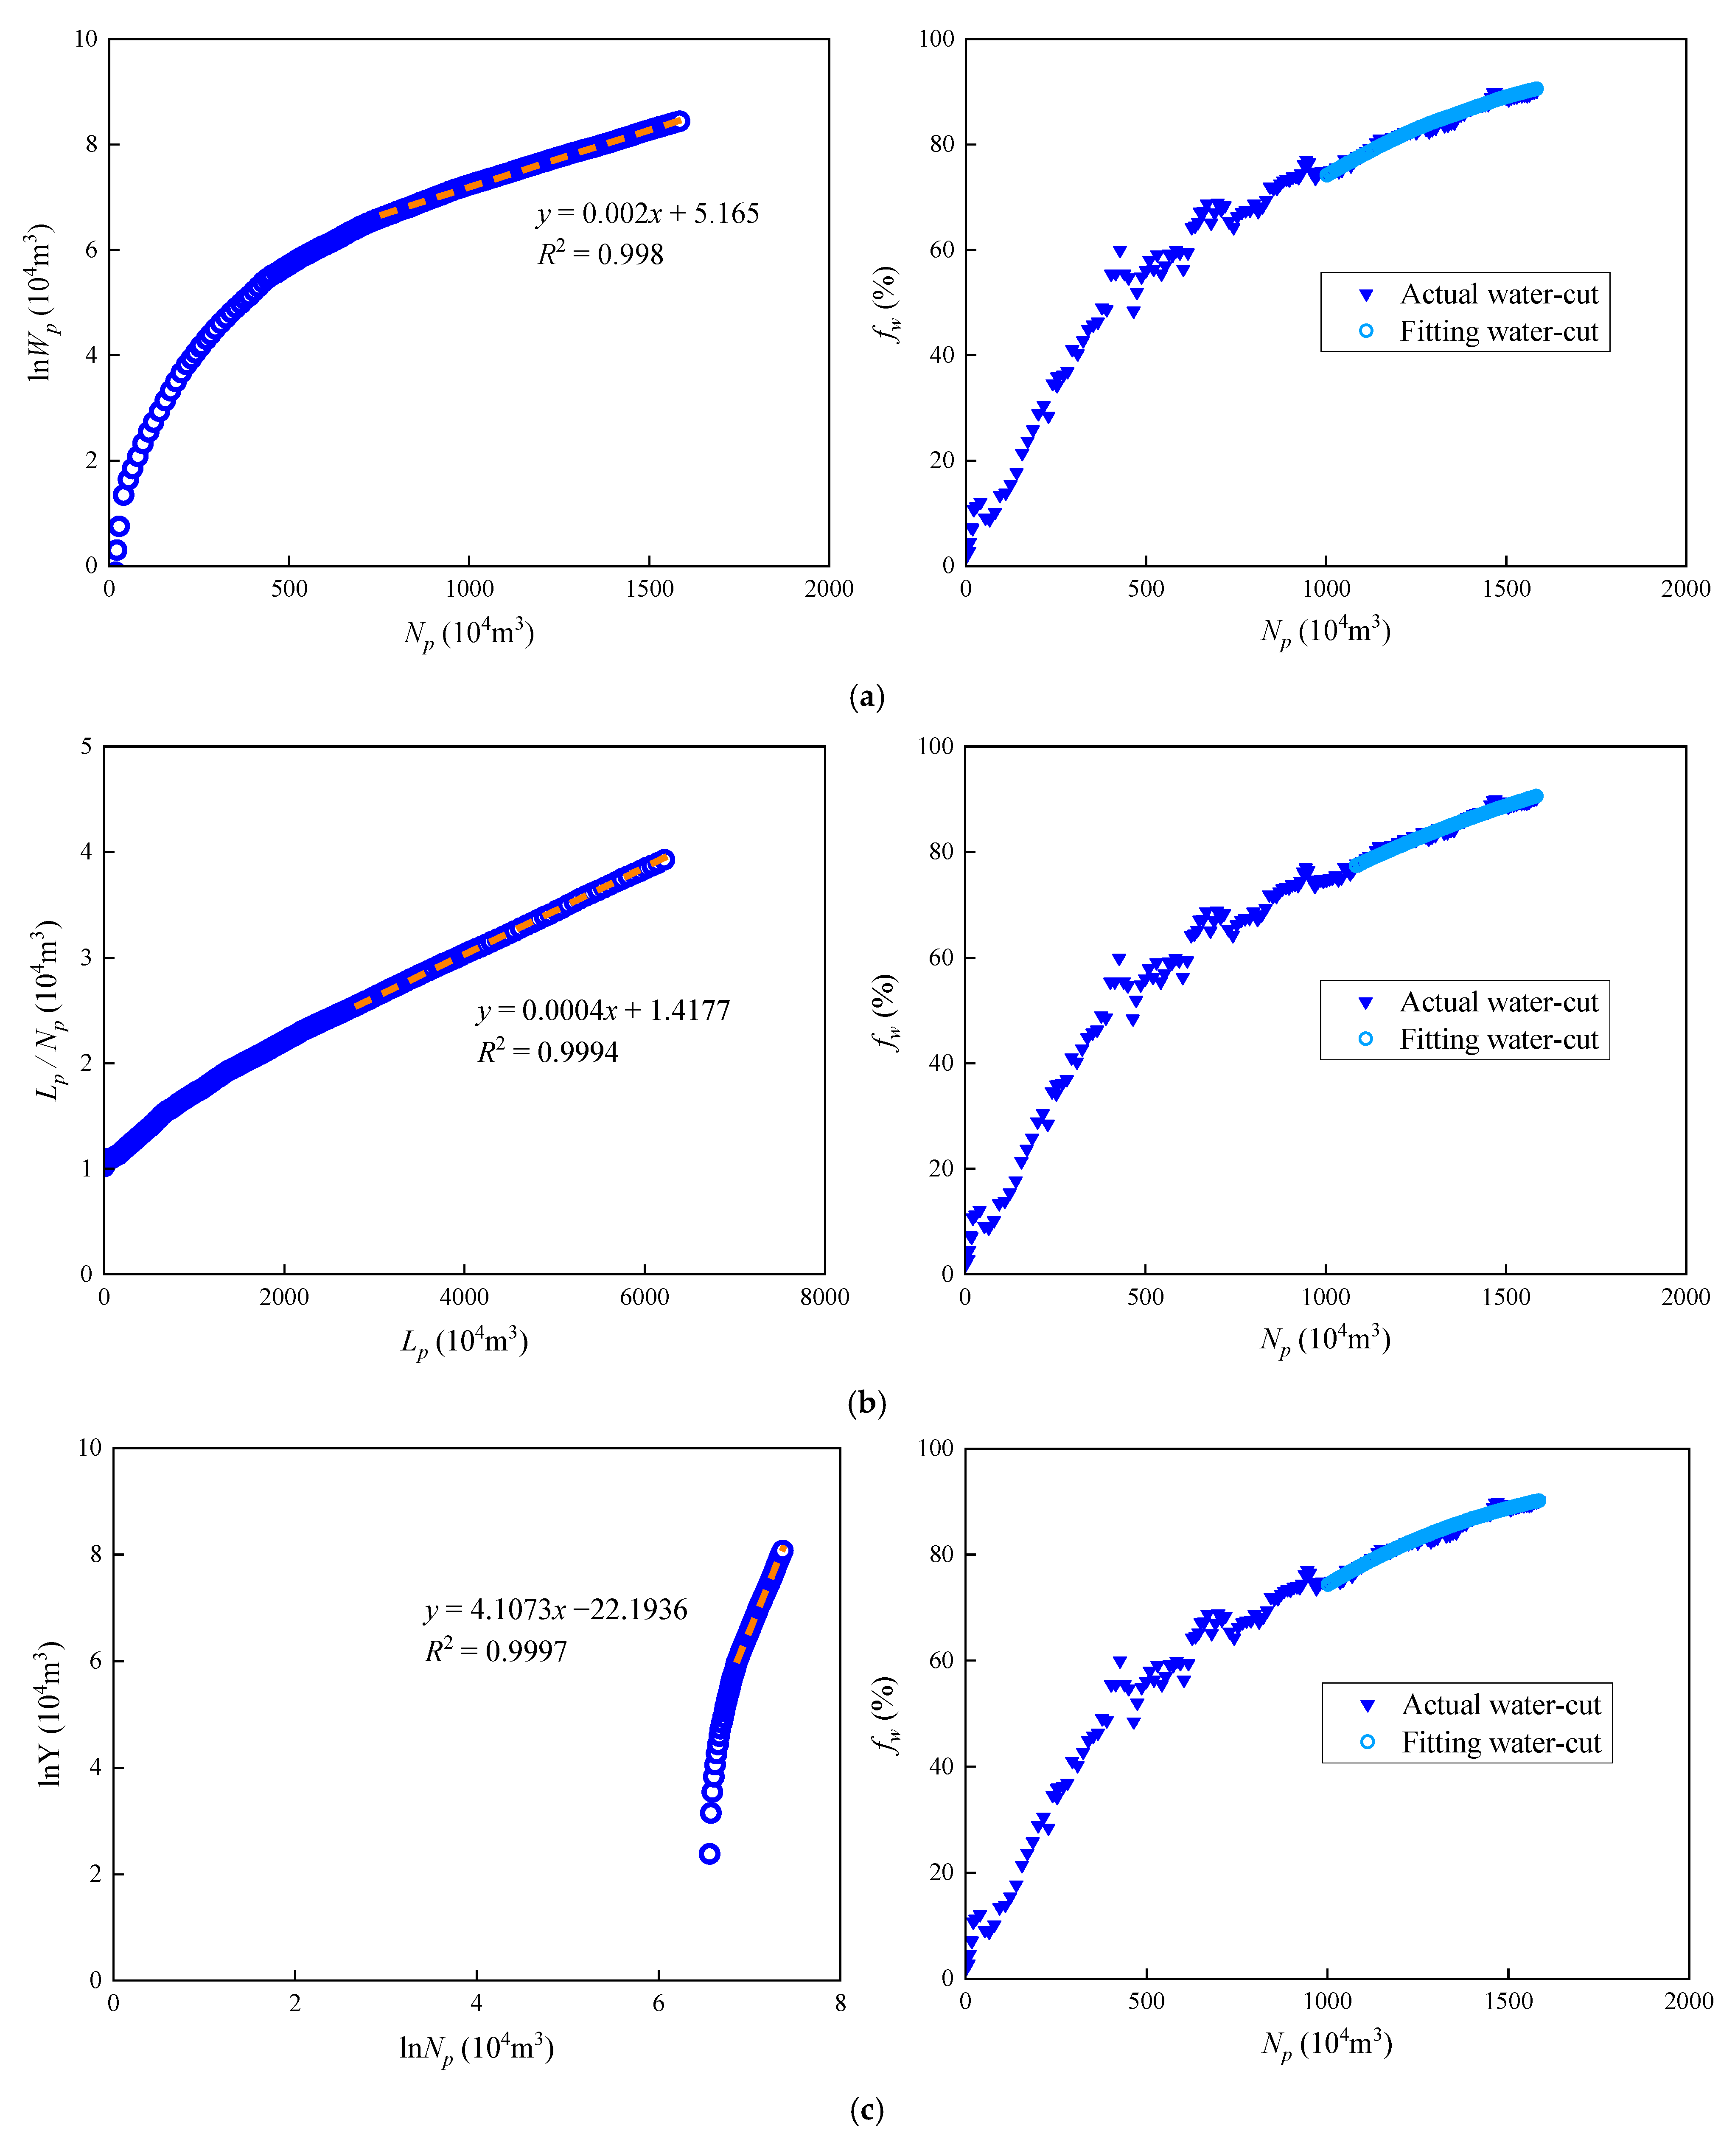
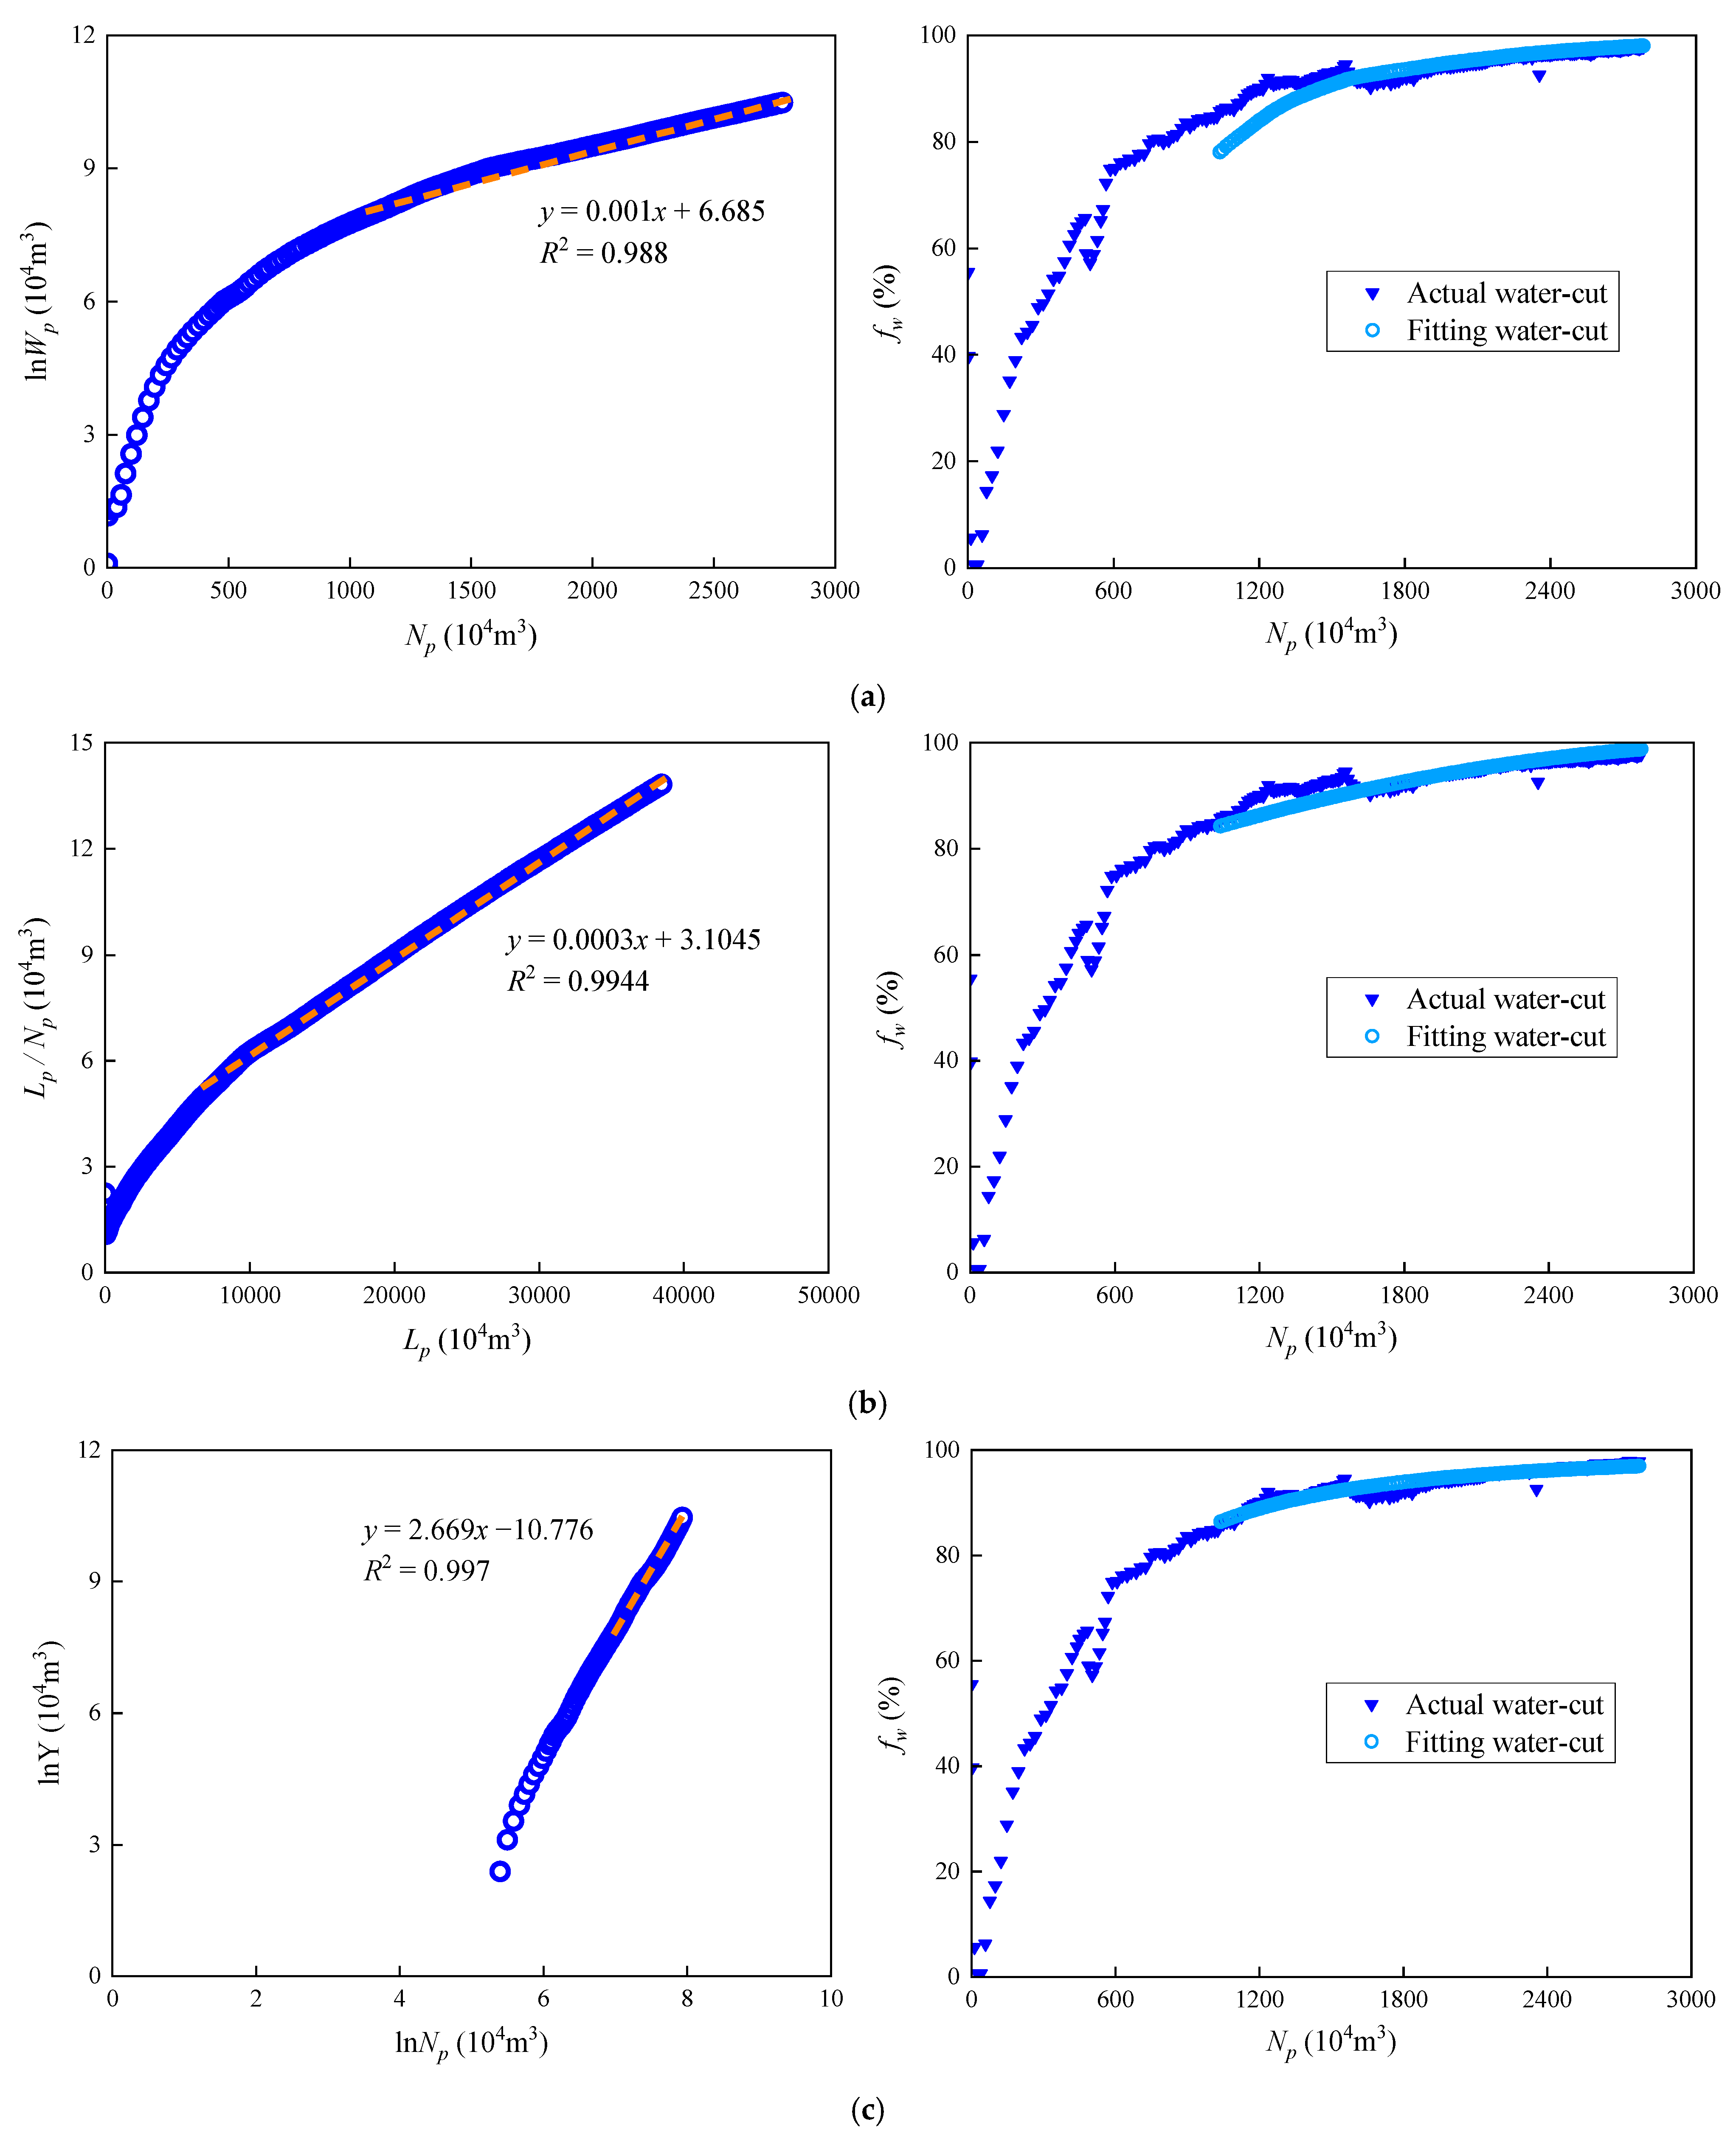
3. Case Study Analysis and Validation

To validate the application effectiveness of the newly proposed water-flooding characteristic curves, three typical oilfields were analyzed, as shown in the production dynamics curves in Figure 4, Figure 5 and Figure 6. Field Q is a continental heavy oilfield with braided river deposits, moderate to high porosity and permeability, and a formation oil viscosity of 130 mPa·s. It includes the heavy oil reservoir Q1 and the bottom water reservoir Q2. The field primarily employs a combined network of directional and horizontal wells with stratified development, where production dynamics are significantly influenced by reservoir variations and fluid properties. Field B is a continental oilfield with medium-to-low viscosity, characterized by meandering river and shallow delta deposits, high porosity and permeability, and a formation oil viscosity of 20.5 mPa·s. Field B includes two sand bodies, B1 and B2. It primarily utilizes horizontal wells for water injection development, with production dynamics heavily influenced by channel sequences, main channel distribution features, levees, and other reservoir changes. Field P is a marine sandstone oilfield with high porosity and permeability. Field P includes the P1 light oil reservoir with bottom water and the P2 heavy oil reservoir. The formation oil viscosity has a complex vertical distribution, ranging from low to conventional heavy oil (5.5–135.4 mPa·s), primarily using multi-layer harvesting with directional wells and natural energy development. Production dynamics are greatly affected by channels, levees, lithology, and variations in physical properties among different reservoirs. Due to their distinct reservoir characteristics, these three typical oilfields often experience significant dynamic fitting errors and discrepancies in recoverable reserve forecasts when conventional water-flooding characteristic curves are used during high-to-ultra-high water-cut phases. There is an urgent need to adopt suitable water-flooding characteristic curves for dynamic analysis and forecasting to provide a theoretical basis for accurately analyzing reservoir dynamics, formulating production enhancement measures, and optimizing overall production structures.
Both the traditional water-flooding characteristic curves (M-T water-flooding characteristic curve and Type C water-flooding characteristic curve) and the new water-flooding characteristic curve proposed in this paper were fitted to the three types of oilfields and reservoirs mentioned above. The expressions of the different models are given in Equations (30)–(32). a, b, c, and d represent the coefficients to be fitted in the water-flooding characteristic curve formulas, respectively. They have different values in different formulas. The fitting results and comparisons are shown in Figure 7, Figure 8 and Figure 9, where Np represents cumulative oil production (in 104 m3), Wp represents cumulative water production (in 104 m3), Lp represents cumulative liquid production (in 104 m3), and fw represents water cut (in %). It is noteworthy that x and y represent different meanings when using different water-flooding characteristic curves. x represents Np, and y represents lnWp in the fitting formula of the M-T water-flooding characteristic curve. x represents Lp, and y represents Lp/Wp in the fitting formula of the Type C water-flooding characteristic curve. x represents lnNp, and y represents ln(Wp−a·Npb) in the fitting formula of the new water-flooding characteristic curve. From the comparison of the fitting effects of the water-flooding characteristic curves in typical oilfields, it is evident that for reservoirs with different geological characteristics and different water cut rise patterns, the new water-flooding characteristic curve produces a straight-line segment earlier and achieves better fitting results, accurately describing the water-flooding behavior. Table 1 compares the fitting effects of different water-flooding characteristic curves for these typical oilfields and their associated reservoirs and predicts the recoverable reserves under a 98% water cut limit. The results of fitting and predicting recoverable reserves for the different oilfields and reservoirs in Table 1 were evaluated using the correlation coefficient of the water-flooding characteristic curve fit and the sum of squared residuals to judge the fitting quality. The data comparison in the table shows that the new water-flooding characteristic curve performs well across different reservoir types, development characteristics, and water cut stages. It exhibits higher correlation coefficients and smaller residual sum of squares for the water cut, resulting in higher fitting accuracy. Overall, the fitting results for different types of oilfields and reservoirs indicate that the new water-flooding characteristic curve has broad applicability across various development stages and water cut phases.
M - T :   L n ( W p ) = a + b · N p
Type   C :   L p / N p = a + b · L p
This   paper :   l n ( W p a · N p b ) = c l n ( N p ) + d

4. Conclusions

(1) Based on extensive core experimental data from actual oilfields, this paper addresses the limitations of conventional water-flooding characteristic curves, which struggle to accurately represent the coupling relationship between reservoir quality, rock structure characteristics, and dynamic development features at different scales. Issues such as the unclear physical meaning of some related parameters are also considered. The high correlation between the reservoir quality factor and the fractal dimension was analyzed, and a new water-flooding characteristic curve expression was derived from fractal theory.
(2) Through historical fitting of cumulative oil and water production, the newly proposed water-flooding characteristic curve formula enables rapid calculation of recoverable reserves, accurately describing water-flooding behavior in various reservoir types and individual wells. Generally, recoverable reserves increase as the slope B4, constant A8, and intercept C2 of the water-flooding characteristic curve decrease.
(3) Validation of the new water-flooding characteristic curve was performed by fitting it to three typical oilfields—continental heavy oil, continental medium-to-low viscosity oil, and marine sandstone. The results demonstrate that the new curve performs well across different reservoir types, development characteristics, and water cut stages, showing high correlation coefficients, low residual sum of squares for water cut, and high fitting accuracy. This indicates broad applicability and valuable potential for use in oilfield dynamic analysis, technical policy formulation, and development adjustment studies.

Author Contributions

Conceptualization, K.L. and J.L.; methodology, X.D. and J.L.; validation, K.L. and J.L.; formal analysis, X.D. and J.L.; investigation, J.L.; resources, K.L.; data curation, K.L.; writing—original draft preparation, K.L.; writing—review and editing, J.J. and S.C.; supervision, K.L. and X.D.; project administration, J.L.; funding acquisition, K.L. All authors have read and agreed to the published version of the manuscript.

Funding

This research received funding from the CNOOC Comprehensive Research Project: “Research and Application of Grading System for Development Effectiveness of Different Types of Offshore Oil Fields” (Grant No. KJZH-2023-2205).

Data Availability Statement

The original contributions presented in this study are included in the article. Further inquiries can be directed to the corresponding author.

Acknowledgments

Sincere thanks to all members of the dynamic research team at CNOOC Research Institute Co., Ltd.

Conflicts of Interest

Authors Ke Li, Xulin Du, Jing Li, Junzhe Jiang and Shaobin Cai are employed by the company CNOOC Research Institute Co., Ltd. The authors declare that the research was conducted in the absence of any commercial or financial relationships that could be construed as a potential conflict of interest.

Nomenclature

K r o d normalized oil-phase relative permeability S o d normalized oil saturation
K r w d normalized water-phase relative permeability S w d normalized water saturation
D fractal dimension K r o oil-phase relative permeability
K r w water-phase relative permeability S w i irreducible water saturation
S o r residual oil saturation n w water-phase index
n o oil-phase index Q w water production rate
Q o oil production rate μ w water-phase viscosity
μ o oil-phase viscosity B w water-phase volume factor
B o oil-phase volume factor N o geological reserves of crude oil
S w e water saturation at the outlet t time
W p cumulative water production N p cumulative oil production
N r movable oil volume f w water cut
K r w o r water-phase relative permeability at the residual oil endpoint
R recoverable oil reserves extraction degree
A intermediate variables in the formula, A = ( 5 D ) / ( 3 D )
a , b , c , d fitting coefficients in the empirical formulas and have different values in different formulas
M , N the undetermined coefficients in the formula
A 1 , A 2 , A 3 , A 4 A 5 , A 6 , A 7 , A 8 the undetermined coefficients in the formula
B 1 , B 2 , B 3 , B 4 the undetermined coefficients in the formula
C 1 , C 2 constant

References

  1. Amrouche, F.; Blunt, M.; Iglauer, S.; Short, M.; Aiouache, F. Electrical heating impacts on wetting properties in electrical enhanced oil recovery (EEOR). In Proceedings of the Third EAGE Workshop on EOR, Buenos Aires, Argentina, 3–4 October 2024. [Google Scholar]
  2. Amrouche, F.; Blunt, M.J.; Iglauer, S.; Aiouache, F.; Short, M. A novel hybrid enhanced oil recovery technique to enhance oil production from oil-wet carbonate reservoirs by combining electrical heating with nanofluid flooding. Mater. Today Sustain. 2024, 27, 100915. [Google Scholar]
  3. Dou, H.; Zhang, H.; Shen, S. Correct understanding and application of waterflooding characteristic curve. Pet. Explor. Dev. 2019, 46, 755–762. [Google Scholar]
  4. Zhang, J.; Yang, R. Proposing of theoretical waterflooding curve and discussion on the relationships between theoretical waterflooding curve and production decline curve. China Offshore Oil Gas 2018, 30, 86–92. [Google Scholar]
  5. Gao, W.; Yin, R.; Yang, J. Establishment and theoretical basis of the new water-flooding characteristic curve. Acta Pet. Sin. 2020, 41, 342–347. [Google Scholar]
  6. Gao, W.; Xu, J. Theoretical study on common water-drive characteristic curves. Acta Pet. Sin. 2007, 28, 89–92. [Google Scholar]
  7. Gao, W.; Liu, Y.; Wang, Z.; Liu, Y. Establishment and study on transitional water displacement curve. Xinjiang Pet. Geol. 2001, 22, 247–250. [Google Scholar]
  8. Wang, Y.; Shi, C.; Wang, J. New equations for characterizing water flooding in ultra-high water-cut oilfields. Oil Gas Geol. 2020, 41, 1282–1287. [Google Scholar]
  9. Zhu, M.; Shi, L.; Xue, Y.; Wen, J.; Li, S.; Liu, M.; Xin, C. Study and application of new water drive characteristic curve. Unconv. Oil Gas 2022, 9, 65–70. [Google Scholar]
  10. Gu, J.; Ren, Y.; Zhang, Y.; Cui, W. Research and application of an improved Type-B water-flooding characteristic curve. Spec. Oil Gas Reserv. 2020, 27, 102–107. [Google Scholar]
  11. Zhang, X. The laboratorial measurement of relative permeability curve of oil and water. Oil Drill. Prod. Technol. 1994, 16, 87–90. [Google Scholar]
  12. Zhang, B.; Pu, C.; Zhu, J.; Yu, H.; Zeng, X. Effect of temperature on the oil/water relative permeability of heavy oil of different viscosity. J. Xi’an Shiyou Univ. (Nat. Sci. Ed.) 2013, 28, 61–63. [Google Scholar]
  13. Guo, P.; Zhang, T.; Zhu, Z.; Du, J.; Wu, G. Study on oil-water relative permeability experiments of fractured-porous reservoirs. Reserv. Eval. Dev. 2013, 3, 19–22. [Google Scholar]
  14. Gao, H.; Jiang, H.; Chen, M. Simulation study on the effect of the microscopic parameters of reservoir pore structure on oil-water relative permeability. J. Xi’an Shiyou Univ. (Nat. Sci. Ed.) 2007, 22, 56–59. [Google Scholar]
  15. Chen, Y.; Du, X. A comparison between the different forms of displacement characteristic curves and the criterion for the appearance of straight line section. Pet. Explor. Dev. 1986, 6, 55–63. [Google Scholar]
  16. Chen, Y. Derivation of water drive curve at high water-cut stage and its analysis of up warding problem. Fault Block Oil Gas Field 1997, 4, 19–24. [Google Scholar]
  17. Huang, Y. Waterflooding performance of oil reservoir in ultra-high water-cut stage. Spec. Oil Gas Reserv. 2018, 25, 95–99. [Google Scholar]
  18. Li, Z.; Sun, L.; Deng, H.; Zhang, J.; Li, Y. The research of suitable conditions to water drive characteristic curve. Comput. Tech. Geophys. Geochem. Explor. 2012, 34, 143–146. [Google Scholar]
  19. Yu, Q. How to study and apply the water displacement curves correctly. Pet. Explor. Dev. 2000, 27, 122–126. [Google Scholar]
  20. Li, L.; Han, J.; Chen, J. Optimization of predicted recoverable reserves by using water drive type curves. Xinjiang Pet. Geol. 2017, 38, 719–722. [Google Scholar]
  21. Li, J.; Liu, F.; Liu, C.; Li, K.; Yang, R.; Tang, S.; Yang, L.; Zhang, Y.; Pei-wen, W. Comparisons of fractal normalized relative permeability models and its application in P oilfields, China. In Proceedings of the International Field Exploration and Development Conference, Wuhan, Hubei, China, 20–22 September 2023. [Google Scholar]
  22. Li, K. More general capillary pressure and relative permeability models from fractal geometry. J. Contam. Hydrol. 2010, 111, 13–24. [Google Scholar] [CrossRef]
  23. Li, K. Analytical derivation of Brooks–Corey type capillary pressure models using fractal geometry and evaluation of rock heterogeneity. J. Pet. Sci. Eng. 2010, 73, 20–26. [Google Scholar]
  24. Li, K.; Horne, R.N. Experimental verification of methods to calculate relative permeability using capillary pressure data. In Proceedings of the SPE Western Regional/AAPG Pacific Section Joint Meeting, Anchorage, AK, USA, 20–22 May 2002. [Google Scholar]
  25. Chen, Y. Derivation of relationships of water drive curves. Acta Pet. Sin. 1985, 6, 69–78. [Google Scholar]
  26. Ahmed, T. Reservoir Engineering Handbook; Petroleum Industry Press: Beijing, China, 2009; pp. 288–330. [Google Scholar]
Figure 1. Relationship between RQI and D of a core from P oilfield in Bohai Bay Basin.
Energies 18 01555 g001
Figure 2. Comparison of various fitting results of normalized relative permeability curves of a core from P oilfield in Bohai Bay Basin.
Energies 18 01555 g002
Figure 3. The methodology flow chart.
Energies 18 01555 g003
Figure 4. Production curve for Field Q.
Energies 18 01555 g004
Figure 5. Production curve for Field B.
Energies 18 01555 g005
Figure 6. Production curve for Field P.
Energies 18 01555 g006
Figure 7. Comparison of fitting results for Q oilfield: (a) the M-T water-flooding curve; (b) the Type C water-flooding curve; (c) the novel water-flooding curve.
Energies 18 01555 g007
Figure 8. Comparison of fitting results for B oilfield: (a) the M-T water-flooding curve; (b) the Type C water-flooding curve; (c) the novel water-flooding curve.
Energies 18 01555 g008
Figure 9. Comparison of fitting results for P oilfield: (a) the M-T water-flooding curve; (b) the Type C water-flooding curve; (c) the novel water-flooding curve.
Energies 18 01555 g009
Table 1. Comparison of fitting results for water-flooding characteristic curves in different types of oilfields (reservoirs).
Oilfield (Reservoir)Current Monthly Oil ProductionCurrent Water CutThe M-T Water-Flooding
Curve
The Type C Water-Flooding CurveThe Novel Water-Flooding Curve
Fitting Correlation CoefficientThe Sum of Squared Residuals of fw~NpPredicted Recoverable ReservesFitting Correlation CoefficientThe Sum of Squared Residuals of fw~NpPredicted Recoverable ReservesFitting Correlation CoefficientThe Sum of Squared Residuals of fw~NpPredicted Recoverable Reserves
104 m3%ff104 m3ff104 m3ff104 m3
Q oilfield16.097.20.97213,870.04591.40.9922179.24577.10.9961091.98333.2
Q1 reservoir0.894.80.9408925.0149.90.9801835.7152.40.997429.4195.7
Q2 reservoir2.197.70.9591299.4181.30.974464.4184.50.998172.7240.5
B oilfield6.790.20.99935.52370.80.99937.120790.99935.52791.1
B1 reservoir0.872.50.9921133.595.60.991706.4141.10.995544.0209.8
B2 reservoir0.489.30.9642459.791.80.9841739.293.30.994752.2178.7
P oilfield1.997.60.9881142.32723.30.994624.62589.70.997173.13628.4
P1 reservoir0.197.20.9191969.711.70.9889308.812.50.994506.214.8
P2 reservoir0.697.60.994186.1121.20.99782.7122.40.99972.4137.4
Disclaimer/Publisher’s Note: The statements, opinions and data contained in all publications are solely those of the individual author(s) and contributor(s) and not of MDPI and/or the editor(s). MDPI and/or the editor(s) disclaim responsibility for any injury to people or property resulting from any ideas, methods, instructions or products referred to in the content.

