3.1. Gas Composition
Various climate measurements must be defined to estimate a substance’s impact on the global greenhouse effect (GHE). One of the most commonly used measurements is global warming potential (GWP) [
65]. The global warming potential measures how much energy the emissions of one ton of gas will absorb over a given period compared to one ton of CO
2. GWP is expressed as a factor, with CO
2 having a GWP of 1. For example, if a gas has a GWP of 10, it means that one ton has the same effect on the climate as the emission of 10 tons of CO
2 over the same period [
66]. The GWP of NO
2 is 273, an NO
x’s GWP is 33 [
10].
The following table (
Table 6) analyzes the emissions of different fuel blends and their respective GWPs. The data demonstrates that pure coal combustion has the highest GWP among all the tested blends.
As can be seen from the data, the GWP of the combustion gases produced from the mixture containing 100% coal at a feed rate of 250 kg/h is 0.6642, which represents the highest GWP value among the scenarios analyzed. This indicates that the combustion of this coal-dominant mixture has a significant environmental impact in terms of greenhouse gas emissions and contribution to global climate change. In contrast, the GWP of the combustion gases from the mixture containing 100% ammonia at a feed rate of 250 kg/h is significantly lower, at 0.0200. This value is 3215% lower than the GWP of coal-based combustion, highlighting the vastly reduced environmental impact of using ammonia as a fuel compared to coal. The results indicate that while pure coal combustion is the most energy-efficient, it has the highest GWP. This suggests that transitioning to cleaner fuel blends, such as those incorporating ammonia and RDF, could significantly reduce the environmental impact of power generation. These findings are consistent with those of Kobayashi et al. [
67]. This study found that co-firing ammonia with coal can reduce CO
2 emissions by up to 50% compared to pure coal combustion, as seen in blends with ammonia. Ito et al. [
68] reported that co-firing ammonia with coal can directly reduce CO
2 emissions. For example, applying 20% ammonia co-firing to a USC boiler reduced CO
2 emissions from 795 g-CO
2/kWh to 636 g-CO
2/kWh.
Additionally, implementing carbon capture and storage (CCS) technologies can improve the environmental performance of coal and blended fuel combustion. CCS involves capturing CO
2 emissions produced during power generation and storing them underground to prevent their release into the atmosphere. This technology can significantly reduce the overall GWP of coal combustion by capturing up to 90% of CO
2 emissions [
69]. When combined with ammonia and RDF blends, CCS can enhance the reduction of greenhouse gas emissions, making power generation even more sustainable. Integrating CCS with existing power plants can also provide flexibility and stability to power networks, supporting the transition to low-carbon energy systems.
It is important to note that the combustion of pure ammonia generates significantly higher amounts of N2O and NOx. Their GWP is 273 times and 33 times greater than CO2, respectively. However, the overall quantities of these pollutants produced are tiny. As a result, the GWP values for the blends containing ammonia are considerably lower than the mixtures with a higher coal content. This underscores the importance of considering the relative proportions and potencies of various greenhouse gases when evaluating the environmental impact of different fuel sources.
The findings suggest that the incorporation of ammonia and RDF, even in small amounts, can help mitigate the overall environmental impact of fuel combustion despite the potent warming effects of N2O and NOx. This information could be valuable for policymakers, industry stakeholders, and researchers in exploring more sustainable energy solutions that balance economic needs with environmental protection.
The study conducted by Ebrahim Nadimi et al. [
70] has provided valuable insights into the potential of using ammonia as a fuel additive to reduce CO
2 emissions from the combustion of fossil fuels. Their findings suggest that introducing ammonia during the combustion process can significantly lower the overall CO
2 emissions, which is crucial in addressing the pressing issue of climate change. However, the researchers also acknowledge a notable drawback of this approach—the formation of N
2O.
As highlighted above, introducing ammonia into the combustion process produces N
2O as a byproduct. However, the amount of N
2O produced during ammonia combustion is typically small, often negligible compared to the overall emissions. This finding is consistent with the research conducted by Jeffrey V. et al. [
71], which explored the emissions profile of ammonia-based combustion systems.
Ekenechukwu C. [
72] mentions that the low levels of N
2O emissions are primarily because N
2O is reduced through two critical reactions. The first is the reaction with the hydrogen (H) atom, which has a markedly high-temperature sensitivity:
This means that this reaction occurs rapidly in regions of the flame where the temperature is very high, such as the inner core of the flame. The high temperature gives the reaction the necessary activation energy to proceed quickly, efficiently converting the N2O into molecular N2 and the hydroxyl OH radical.
However, the rate of this reaction drops off significantly at relatively lower flame temperatures, which can occur in the outer regions of the flame. This is where the second reaction becomes more critical—the thermal dissociation reaction:
Here, the N2O molecule is split apart by collisions with other molecules, designated by (M), to form N2 and an oxygen (O) atom. While this thermal dissociation reaction may proceed slower than the high-temperature H-atom reaction, it can continue even at lower flame temperatures.
Further data analysis may reveal additional insights, such as the optimal blend ratios, the potential trade-offs between different pollutants, and the feasibility of implementing ammonia-based fuels on a larger scale. Ongoing research and innovation in this field can contribute to developing cleaner and more efficient energy systems that minimize the carbon footprint and support global efforts to address climate change.
3.1.1. Influence of Temperature for NOx and N2O Formation
Various factors contribute to the formation of NO
x during combustion processes. However, the most critical factor governing NO
x formation is the temperature within the combustion zone [
73,
74,
75]. As the temperature increases, the rate of NO
x formation rises exponentially due to the high activation energy required for the chemical reactions that produce NO
x.
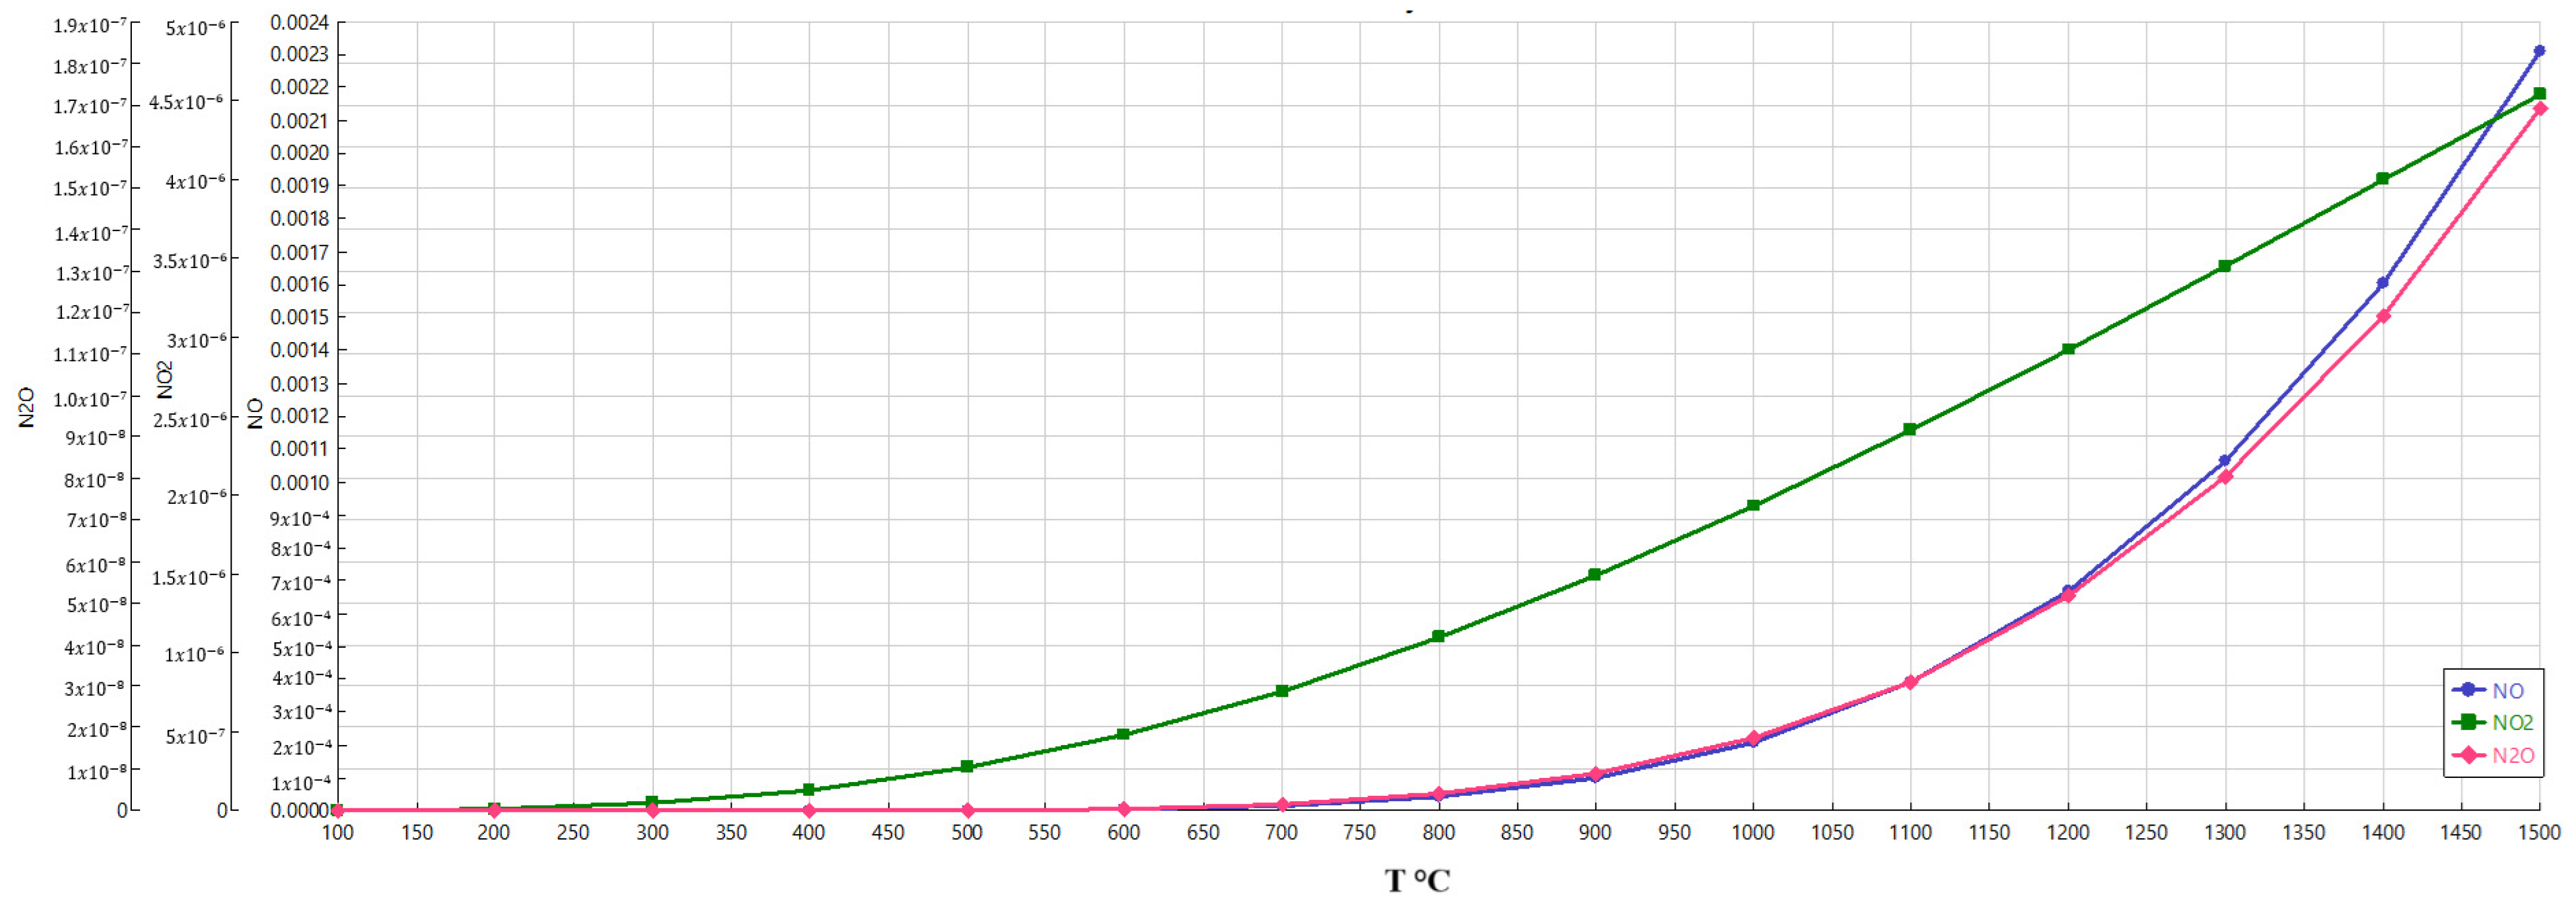
As shown in
Figure 2, NO
x and N
2O are strongly related to temperature. The relationship between temperature and the formation of NO
x and N
2O is a well-established phenomenon. As the temperature increases, the kinetic energy of the molecules involved in the combustion reactions also increases. This higher energy breaks the solid triple bond in the nitrogen molecule, allowing the nitrogen and oxygen atoms to recombine and form the various nitrogen oxides.
The trend observed in the figure shows that the formation of these compounds increases gradually as the temperature rises. However, it becomes much more pronounced after the 600 °C mark. Higher thermal energy overcomes the activation energy barriers, leading to a rapid acceleration in the reaction rates and, consequently, the production of pNOx and N2O.
3.1.2. Influence of Air Flow on NOx and CO2
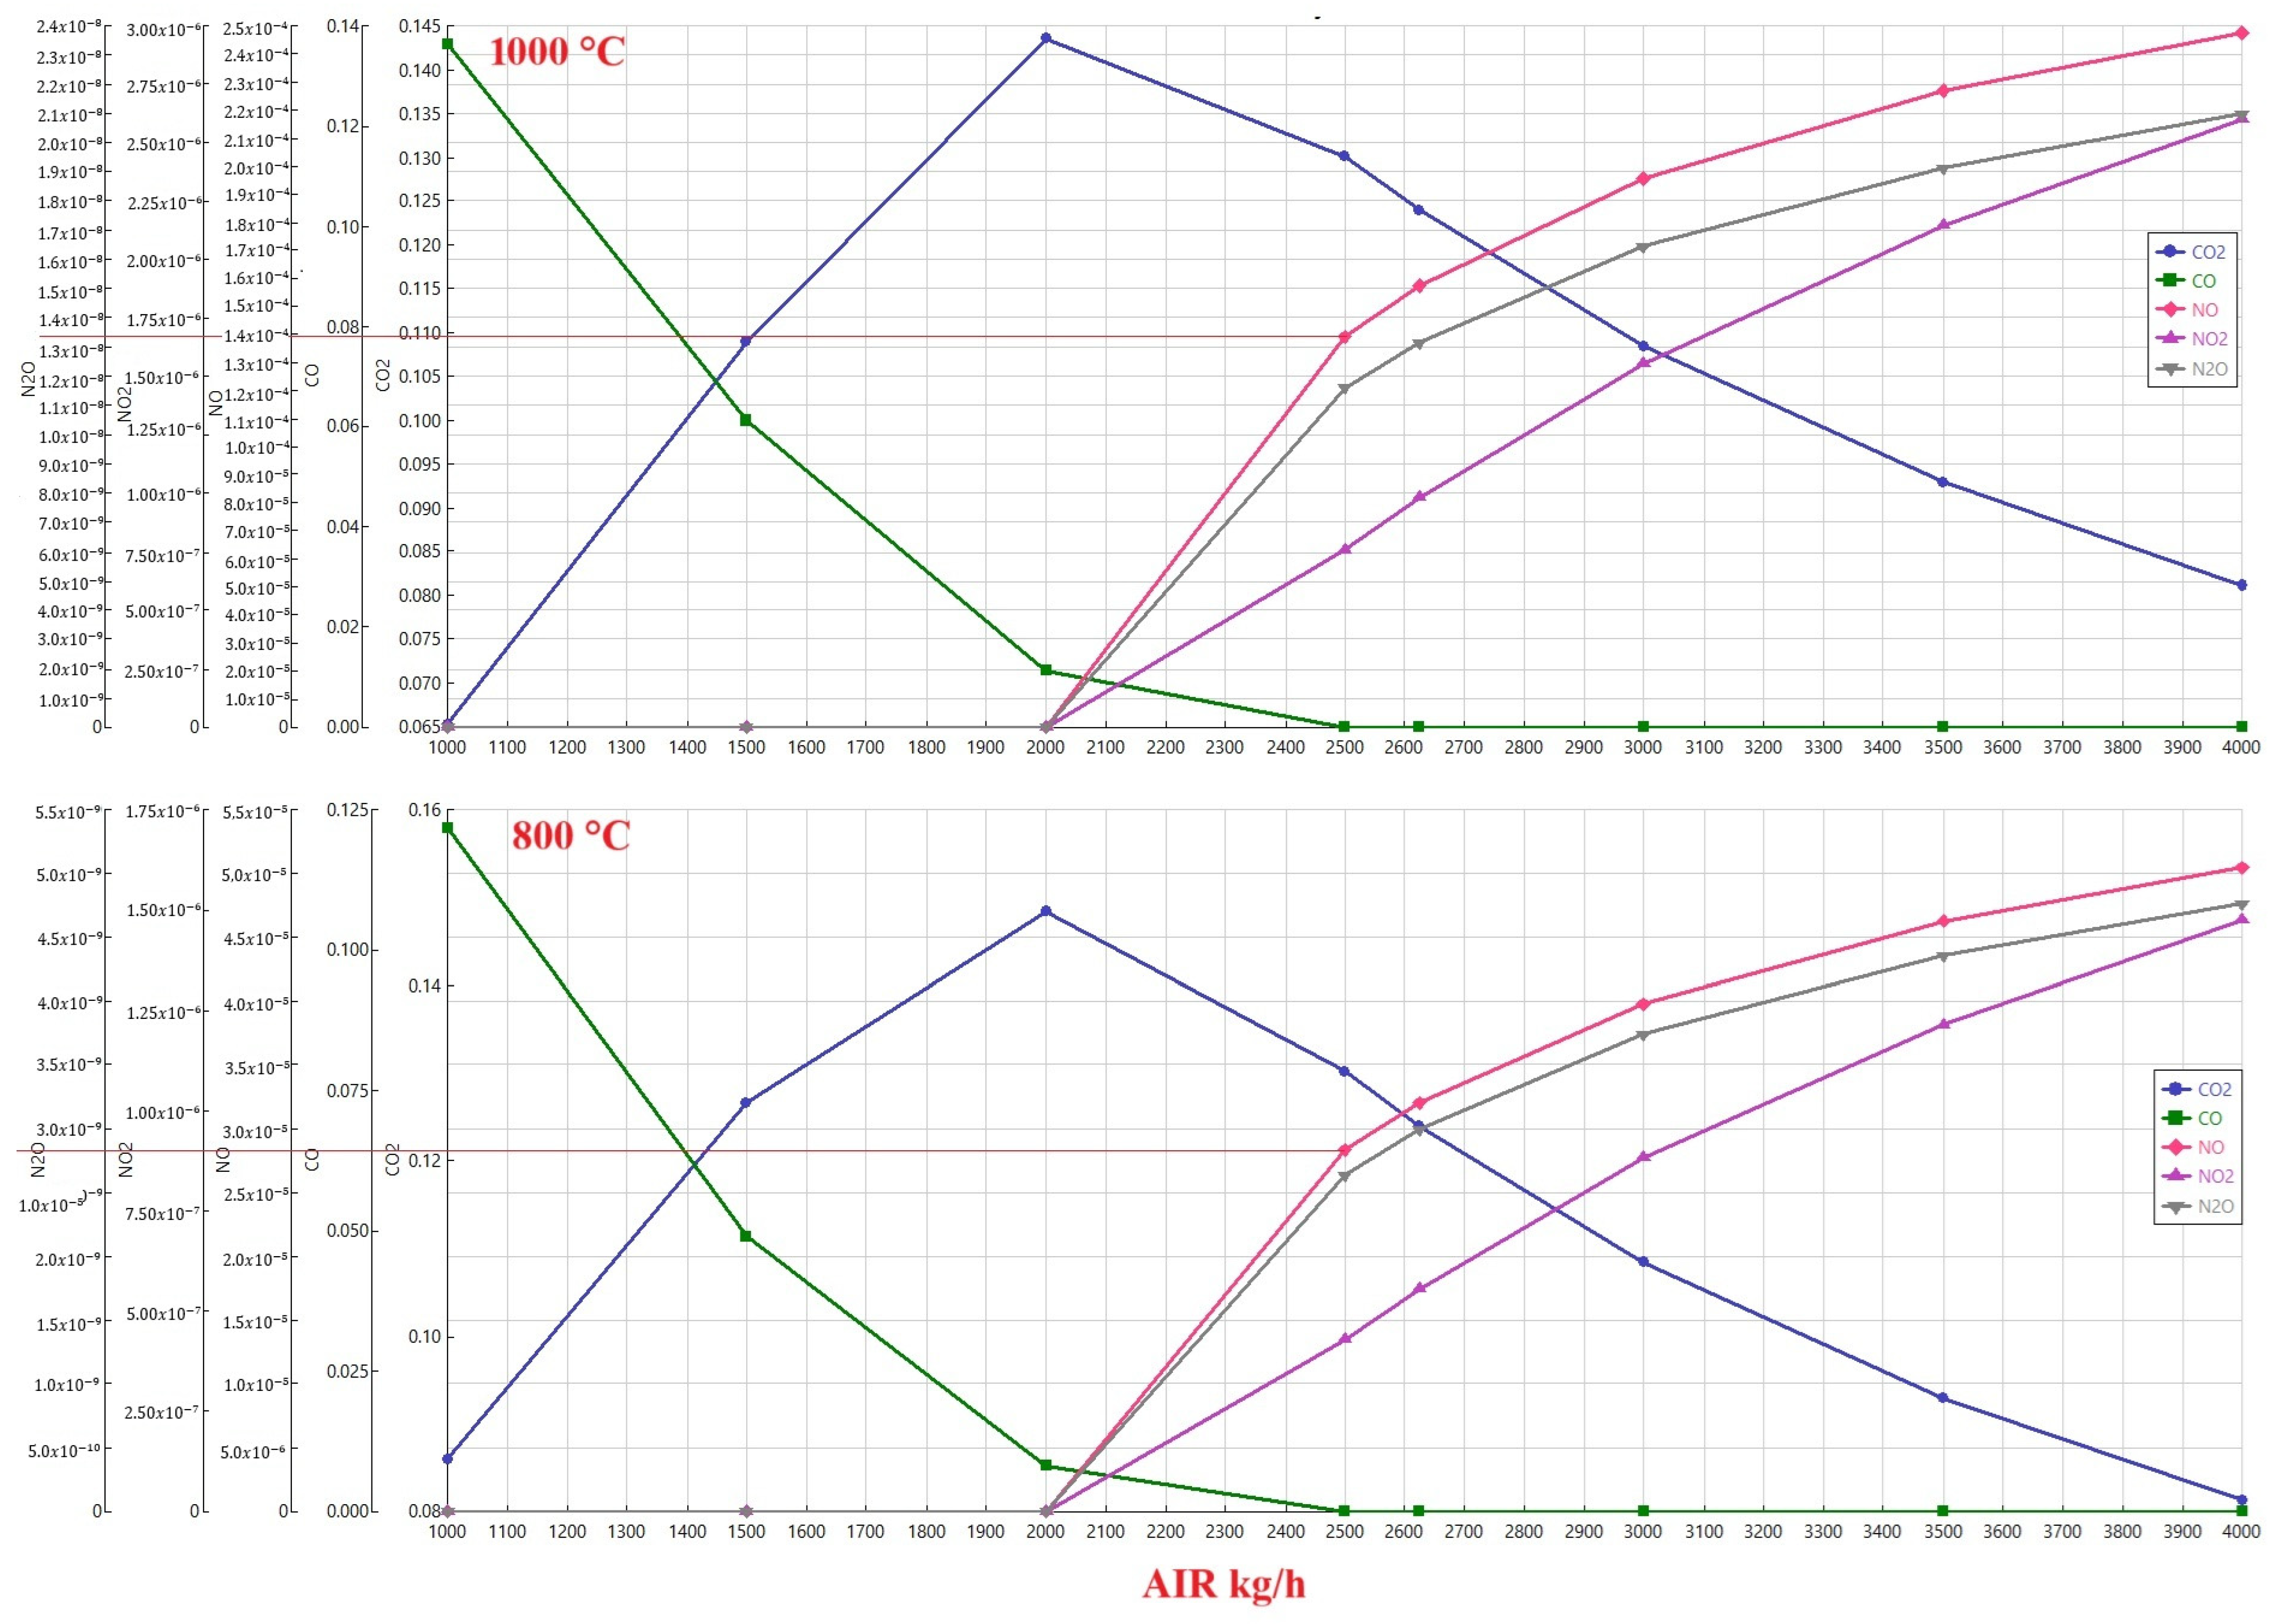
Figure 3 illustrates the complex relationship between airflow rates and emissions during the combustion of a 50/50 coal-ammonia blend, explicitly focusing on the influence of temperature. The data presented compares emissions profiles at two distinct temperatures: 1000 °C and 800 °C. Despite the temperature difference, a similar trend emerges across both scenarios, indicating a consistent pattern in how airflow impacts the generation of various gaseous products.
The data reveals a significant reduction in the formation of NOx and N2O when the combustion occurs at a lower temperature of 800 °C. This suggests that lower temperatures favor pathways that are less conducive to forming these specific nitrogen-containing pollutants. This is likely due to the reduced availability of activation energy required for the chemical reactions that lead to NOx and N2O formation at the lower temperature.
Furthermore, the analysis highlights the behavior of CO2 emissions as airflow increases, mainly after complete combustion is achieved. The observation indicates that CO2 decreases with increasing airflow due to a dilution effect. As more air is introduced into the system, the concentration of CO2 in the exhaust gas is reduced as it is mixed with a larger volume of air. This dilution effect is a straightforward consequence of increasing the total volume of exhaust gas without a corresponding increase in the absolute amount of CO2 produced.
However, a contrasting trend is observed for NOx and N2O emissions. The data demonstrates that the amounts of NOx and N2O increase rapidly as airflow increases. This phenomenon is attributed to the heightened availability of nitrogen at higher airflow rates. The presence of more air inherently introduces more nitrogen into the combustion chamber. This excess nitrogen then participates in chemical reactions, forming higher concentrations of NOx and N2O. Increasing the airflow while diluting CO2 simultaneously provides more nitrogen for forming undesirable nitrogen-based emissions, thus increasing their levels. Therefore, optimizing airflow becomes a delicate balancing act, aiming to burn all fuel while mitigating the formation of NOx and N2O.
3.1.3. Influence of Ammonia for NOx and CO2 Formation
NO
x formation during ammonia combustion is a complex and poorly understood phenomenon. The mechanisms underlying NO
x formation during combustion remain a topic of ongoing research and debate [
76]. However, it is well known that the combustion of ammonia produces higher amounts of NO
x and N
2O than conventional fossil fuels. [
77,
78].
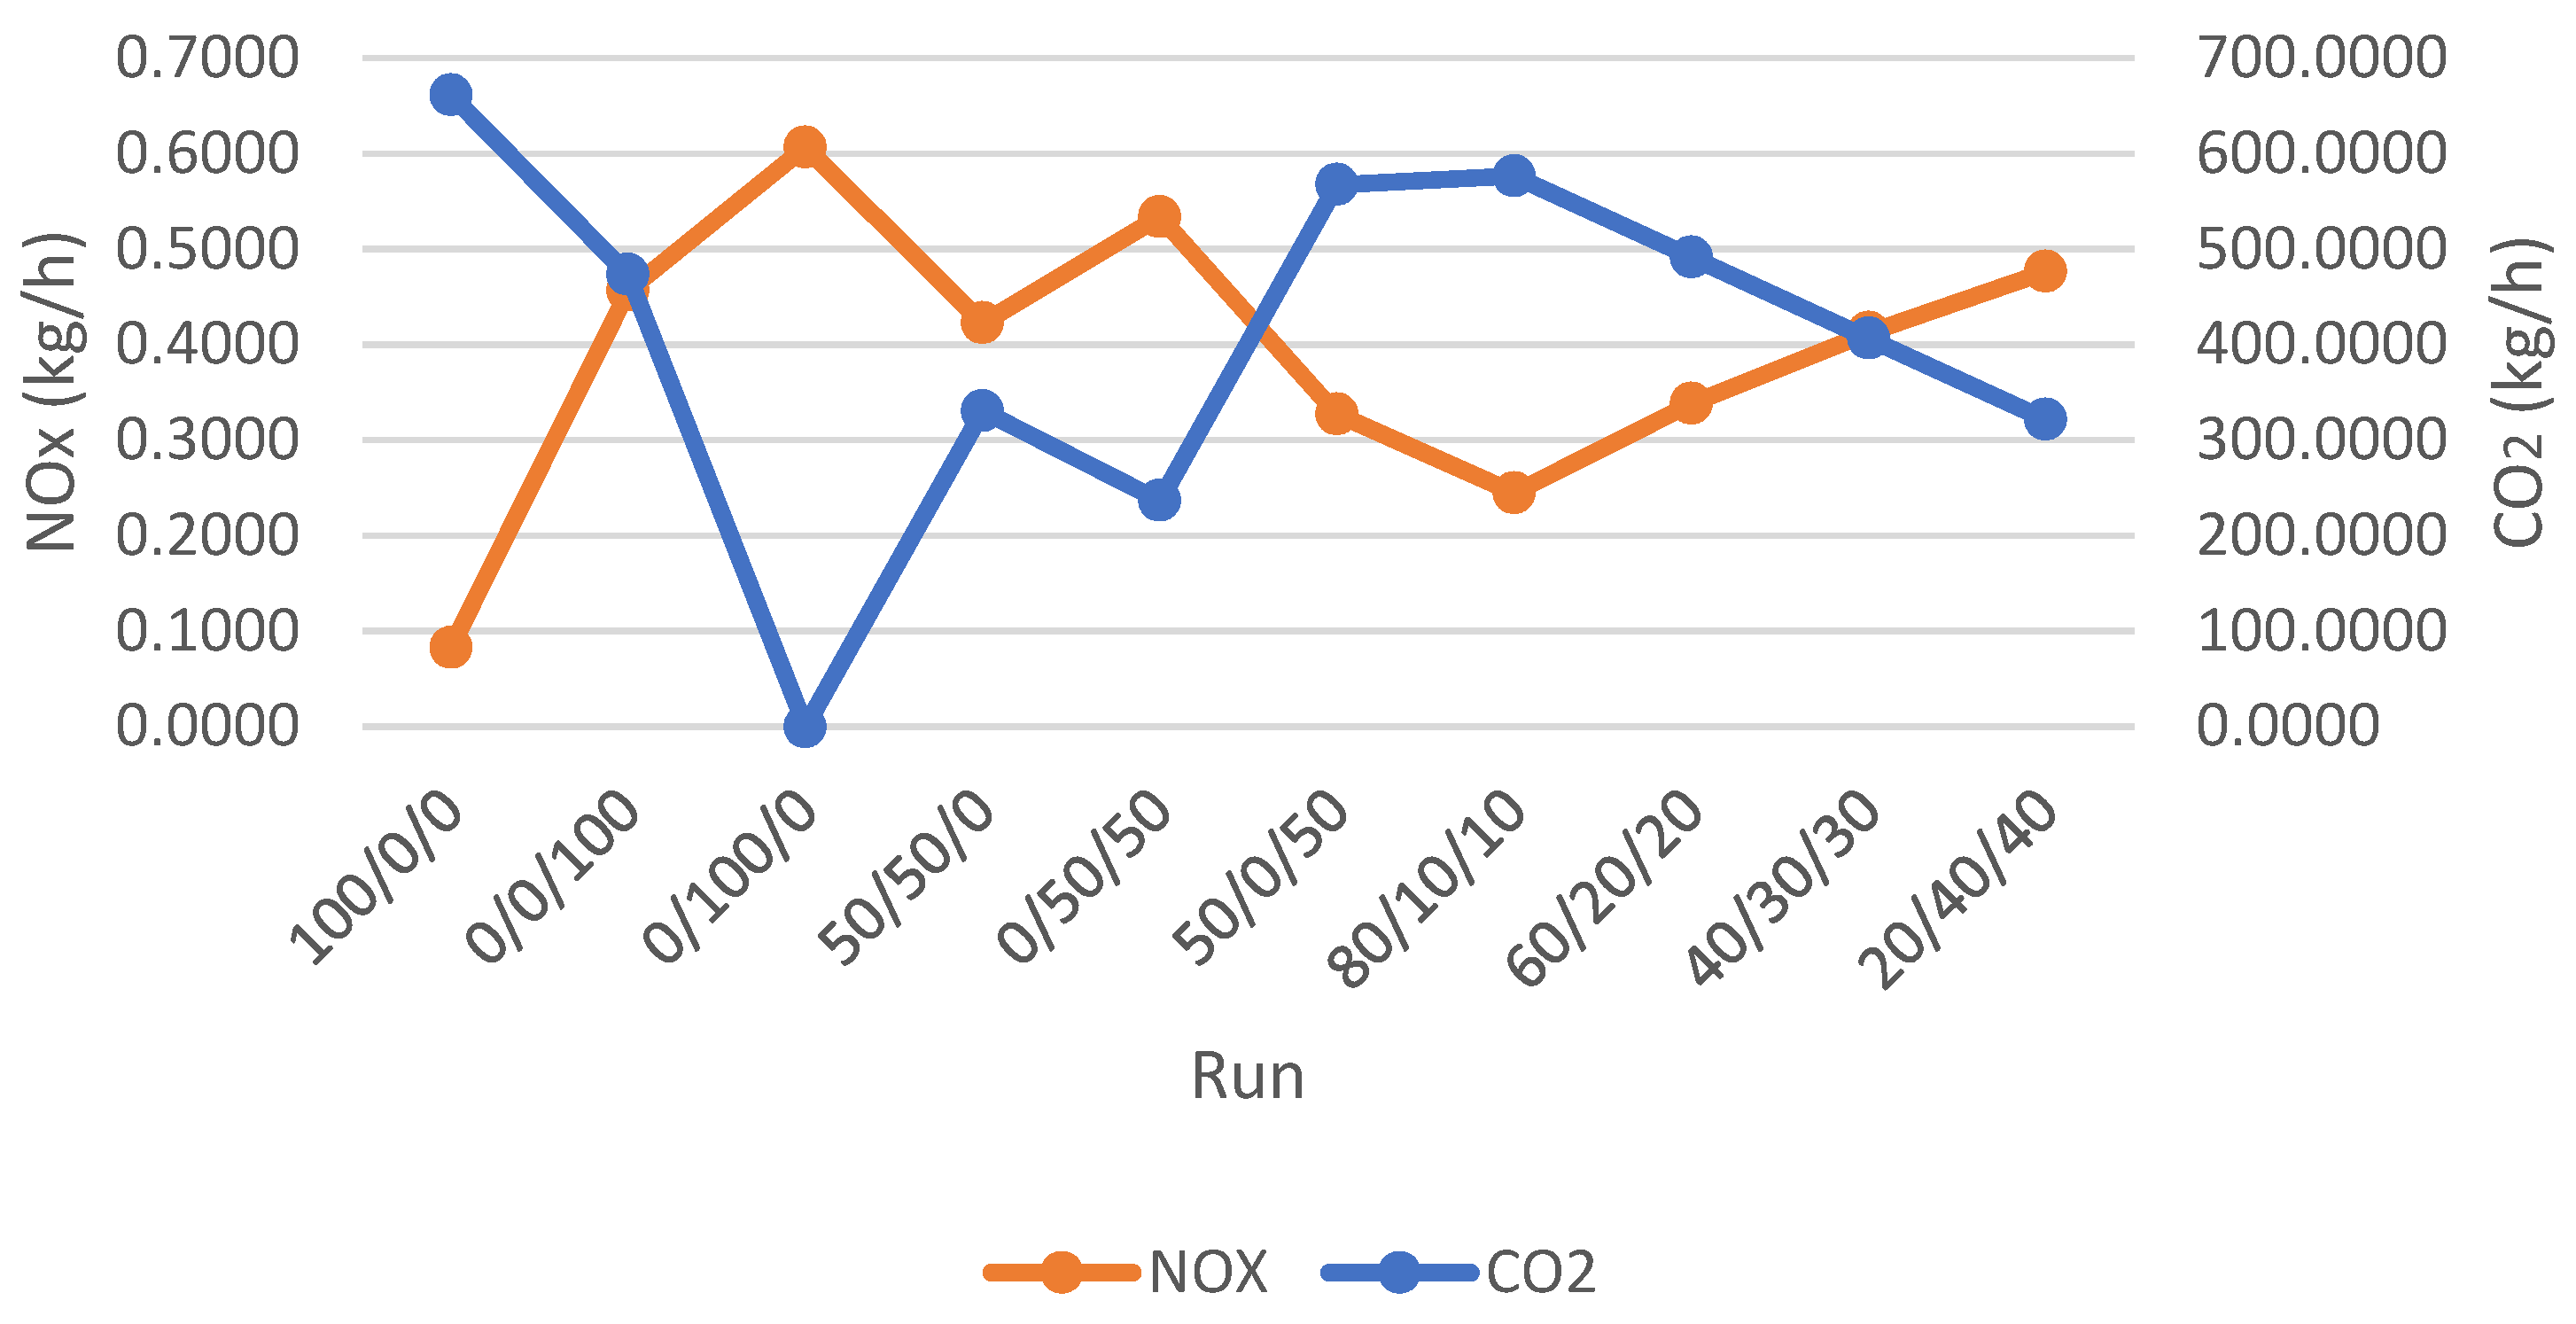
Figure 4 depicts the correlation between NO
x and CO
2 emissions for various experimental runs. The data indicates that mixtures with a higher NH
3 content generate significantly less CO
2. The run where the mixture was composed entirely of ammonia (100% NH
3) resulted in zero CO
2 emissions. Conversely, the mixtures with a more significant proportion of coal exhibited higher CO
2 production.
On the flip side, the data also reveals a direct correlation between the addition of NH3 and the increase in NOx emissions. Mixtures with a higher proportion of ammonia consistently generate more significant quantities of nitrogen oxides. This is because the nitrogen atoms in the ammonia molecules are readily available to participate in forming various NOx species during the high-temperature combustion reactions.
The observed trends significantly affect the development of more efficient and environmentally friendly combustion systems. By carefully controlling the ammonia-to-carbon ratio in the fuel mixture, a balance may be struck between minimizing CO2 emissions and managing the production of NOx.
3.1.4. Influence of Ammonia on N2O
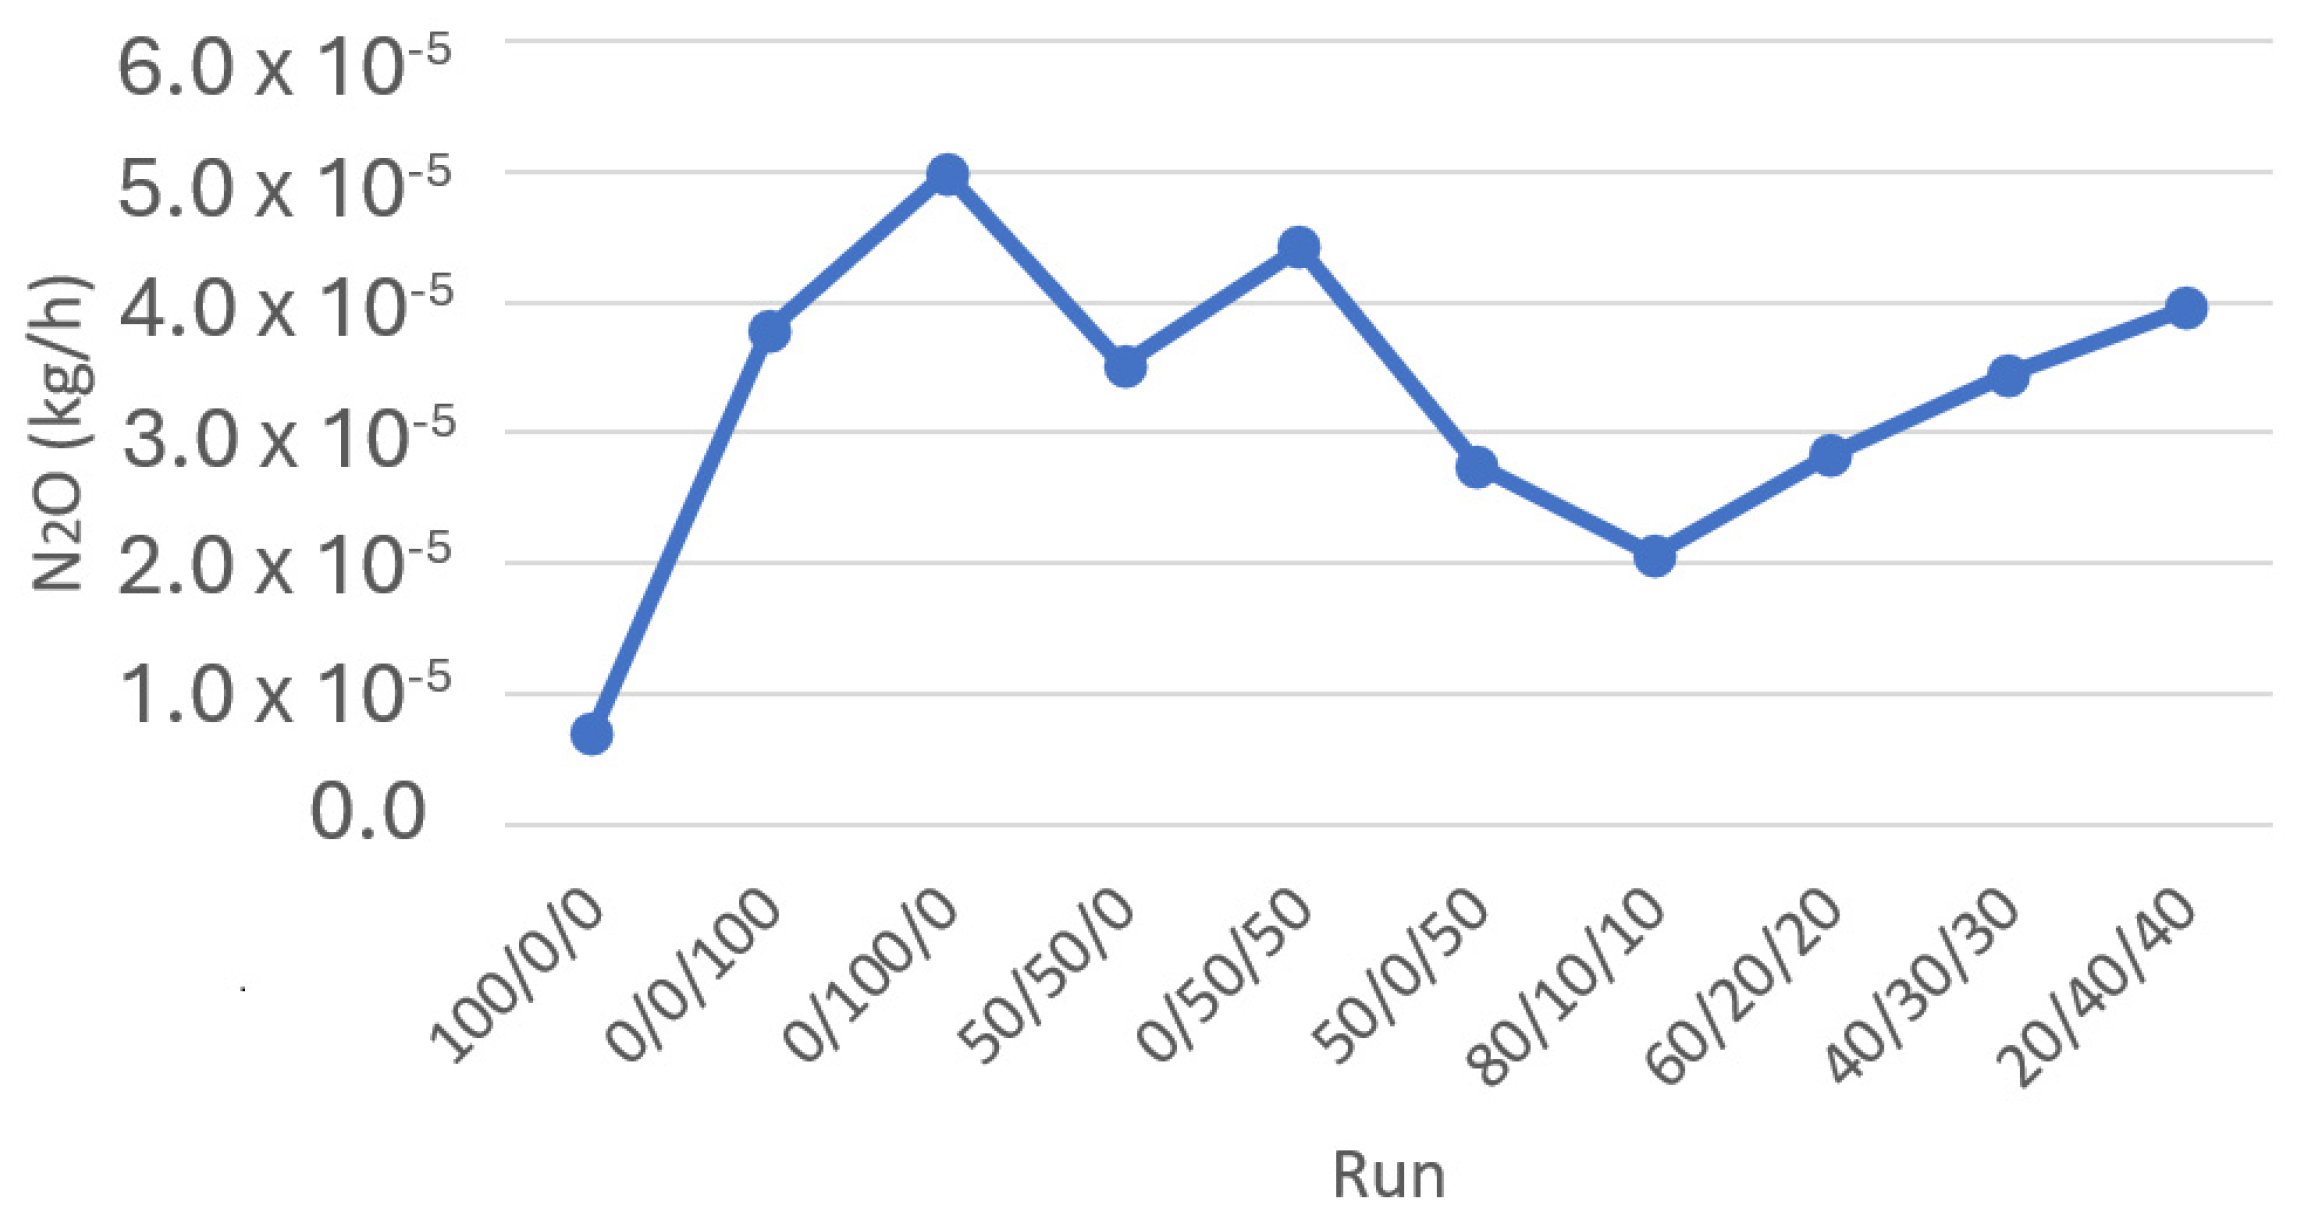
Figure 5 shows the ratio of N
2O formation in the different simulation runs conducted. As can be seen from the data presented in the figure, the amount of N
2O formed by the combustion of 250 kg of various fuel blends is relatively minuscule. However, despite the overall low levels of N
2O formation, a clear trend can be observed in the results. The data indicates that as the amount of NH
3 present in the fuel blend increases, there is a corresponding increase in the production of N
2O. This suggests that including higher proportions of ammonia in the fuel blends leads to a rise in N
2O emissions during combustion.
3.2. Energy Balance
Table 7 shows the kWh produced by each of the simulated runs. The blends with higher coal content create a more significant number of kWh. This is because coal is a highly energy-dense fuel, containing a considerable amount of stored chemical energy that can be released during combustion. Suppose it is compared to a blend of 100% coal with 100% RDF and 100% ammonia. In that case, the differences in energy output become more apparent.
The combustion of ammonia will require 265.39% additional mass to produce the same amount of energy as coal combustion. This is due to ammonia’s lower energy density compared to coal. Ammonia is a promising alternative fuel with a significantly lower calorific value than coal. This means a much larger ammonia is required to generate the same energy as coal. The additional mass needed for the combustion of ammonia to match the energy output of coal is a significant drawback, as it can lead to more extensive and expensive fuel storage, equipment, and handling requirements.
Meanwhile, the combustion of pure RDF would need 30.36% additional mass to equal the energy produced by the combustion of pure coal. RDF, a fuel derived from the non-recyclable components of MSW, has a higher energy content than ammonia but is still lower than coal. The 30.36% increase in mass required for RDF combustion to match coal’s energy output reflects the difference in the energy density of these two fuel sources.
The variations in energy output between these fuel sources highlight the importance of considering different fuels’ specific properties and characteristics when designing and operating power generation systems. Understanding various fuel mixtures’ energy density and combustion efficiency is crucial for optimizing power plant performance and efficiency.
3.3. Economic Analysis
Table 8 presents the NPV, IRR, and PBP for various fuel mixture scenarios at four different discount rates. As can be seen from the results, only four scenarios are deemed economically viable at a discount rate of 15%.
The most economically viable scenario is the combustion of pure coal, which has an NPV of EUR 2,394,839, an IRR of 26%, and a PBP of 7.30 years. This scenario is the most attractive, despite having the highest costs for CO2 emissions, at EUR 423,234. The reason for this is that the price of the raw material, coal, is much lower than that of ammonia and slightly higher than that of RDF. Furthermore, pure coal combustion produces more energy than RDF and ammonia, generating more income.
The second viable scenario uses 100% RDF. This is followed by a ternary mixture of 80% coal, 10% ammonia, and 10% RDF, and finally, a binary mixture of 50% coal and 50% RDF. These scenarios demonstrate the trade-offs between fuel costs, emissions, and economic viability.
Two additional scenarios become economically viable when the discount rate is reduced to 10%. The first is a mixture of 60% coal, 20% ammonia, and 10% RDF. The second is a binary blend of 50% coal and 50% RDF. The combustion of pure coal reduces the PBP to 4.88 years.
Similarly, two new scenarios are viable when the discount rate is 5%. Finally, when considering a discount rate of 3%, the only scenario that is not economically feasible is the combustion of pure ammonia.
Introducing these new viable scenarios at a lower discount rate highlights the sensitivity of the economic analysis to the chosen discount rate. It also suggests that as policymakers and decision-makers seek to promote more sustainable fuel blends, adjusting the discount rate may be an essential lever to incentivize the adoption of cleaner but potentially more expensive fuel sources.
The PBP of coal at 100% (4.88 years) is very close to the PBP reported by Keval Nikam et al. [
79] in their study on the economic and exergoeconomic investigation of a 660 MW coal-fired power plant. The study by Nikam et al. found a PBP of 4.5 years for a plant with a 30-year lifespan and an interest rate of 9%. The proximity of the PBP values between the pure coal combustion scenario and the specific power plant analyzed by Nikam et al. suggests that the operating parameters and financial assumptions used in the two cases are similar. This alignment of the PBP metrics indicates that the pure coal combustion approach can achieve a relatively short payback period, making it potentially attractive from an investment perspective.
Yuli Fitrianingrum et al. [
80] developed a techno-economic analysis to explore the viability of co-firing RDF in a coal-fired power plant. The study indicates a PBP of 6.33 years, assuming a discount rate of 8%. Interestingly, these results are remarkably similar to the findings of the current investigation, which examined the use of pure RDF at a slightly higher discount rate of 10%. In this case, the PBP was calculated to be 6.14 years, somewhat shorter than the co-firing scenario. The close alignment of the payback periods between the two studies suggests that RDF can be a financially attractive option for power plant operators.
Du Wen et al. [
81] examined the potential of using ammonia as an energy carrier within a multi-generation system. Their analysis resulted in a PBP of 22 years. An investment with a PBP of 22 years is generally considered unattractive for many investors, as it takes a long time to recoup the initial capital outlay. Investors typically prefer investments with shorter payback periods, as they offer a faster return on their capital. Consequently, the long payback period obtained by Du Wen et al. would likely deter investors from committing funds to such a project. The current study found that energy generation from ammonia alone resulted in a financial loss, as no payback period was achieved under any of the scenarios investigated at different discount rates. This poor economic performance is primarily attributed to the high production costs associated with “Blue” ammonia, which refers to ammonia produced through low-carbon or carbon-neutral processes.
Therefore, the only viable way to utilize ammonia for energy generation is by combining it with other energy sources, such as RDF or coal. This approach would help offset the high costs of “Blue” ammonia and make the overall energy generation system more economically feasible. The viability of using 100% ammonia as an energy source could be improved if either energy prices rise significantly or if there is government intervention in the form of subsidies or other support mechanisms. Such interventions could help bridge the gap between the production costs of ammonia-based energy and traditional fossil fuel-based processes, making the former a more attractive and competitive option for investors and energy providers.
Improving Viability
Two primary strategies enhance the appeal and viability of zero-emission fuels such as ammonia.
EU Carbon Permit Prices: The expense associated with EU carbon permits is pivotal. The EU Emissions Trading System (ETS) renders carbon-intensive fuels like coal more costly. As permit prices rise, it becomes increasingly expensive for power plants and industries to use polluting fuels, making cleaner alternatives more attractive [
82].
Government Programs and Incentives: Several government initiatives can advance zero-emission fuels. These initiatives encompass research grants, subsidies, tax incentives, loans, infrastructure investments, public–private partnerships, supportive regulations, and training programs. For example, the U.S. government has launched the National Blueprint for Transportation Decarbonization, aiming to eradicate all greenhouse gas emissions from the transportation sector by 2050 [
83]. The EU’s Innovation and Modernization Fund provides financial support for developing and implementing low-carbon technologies [
84]. In summary, economic pressure from rising EU carbon permit prices and robust government programs and incentives can significantly enhance the feasibility and adoption of zero-emission fuels like ammonia, paving the way toward a sustainable, low-carbon future.
3.4. Retrofitting Plants Implications
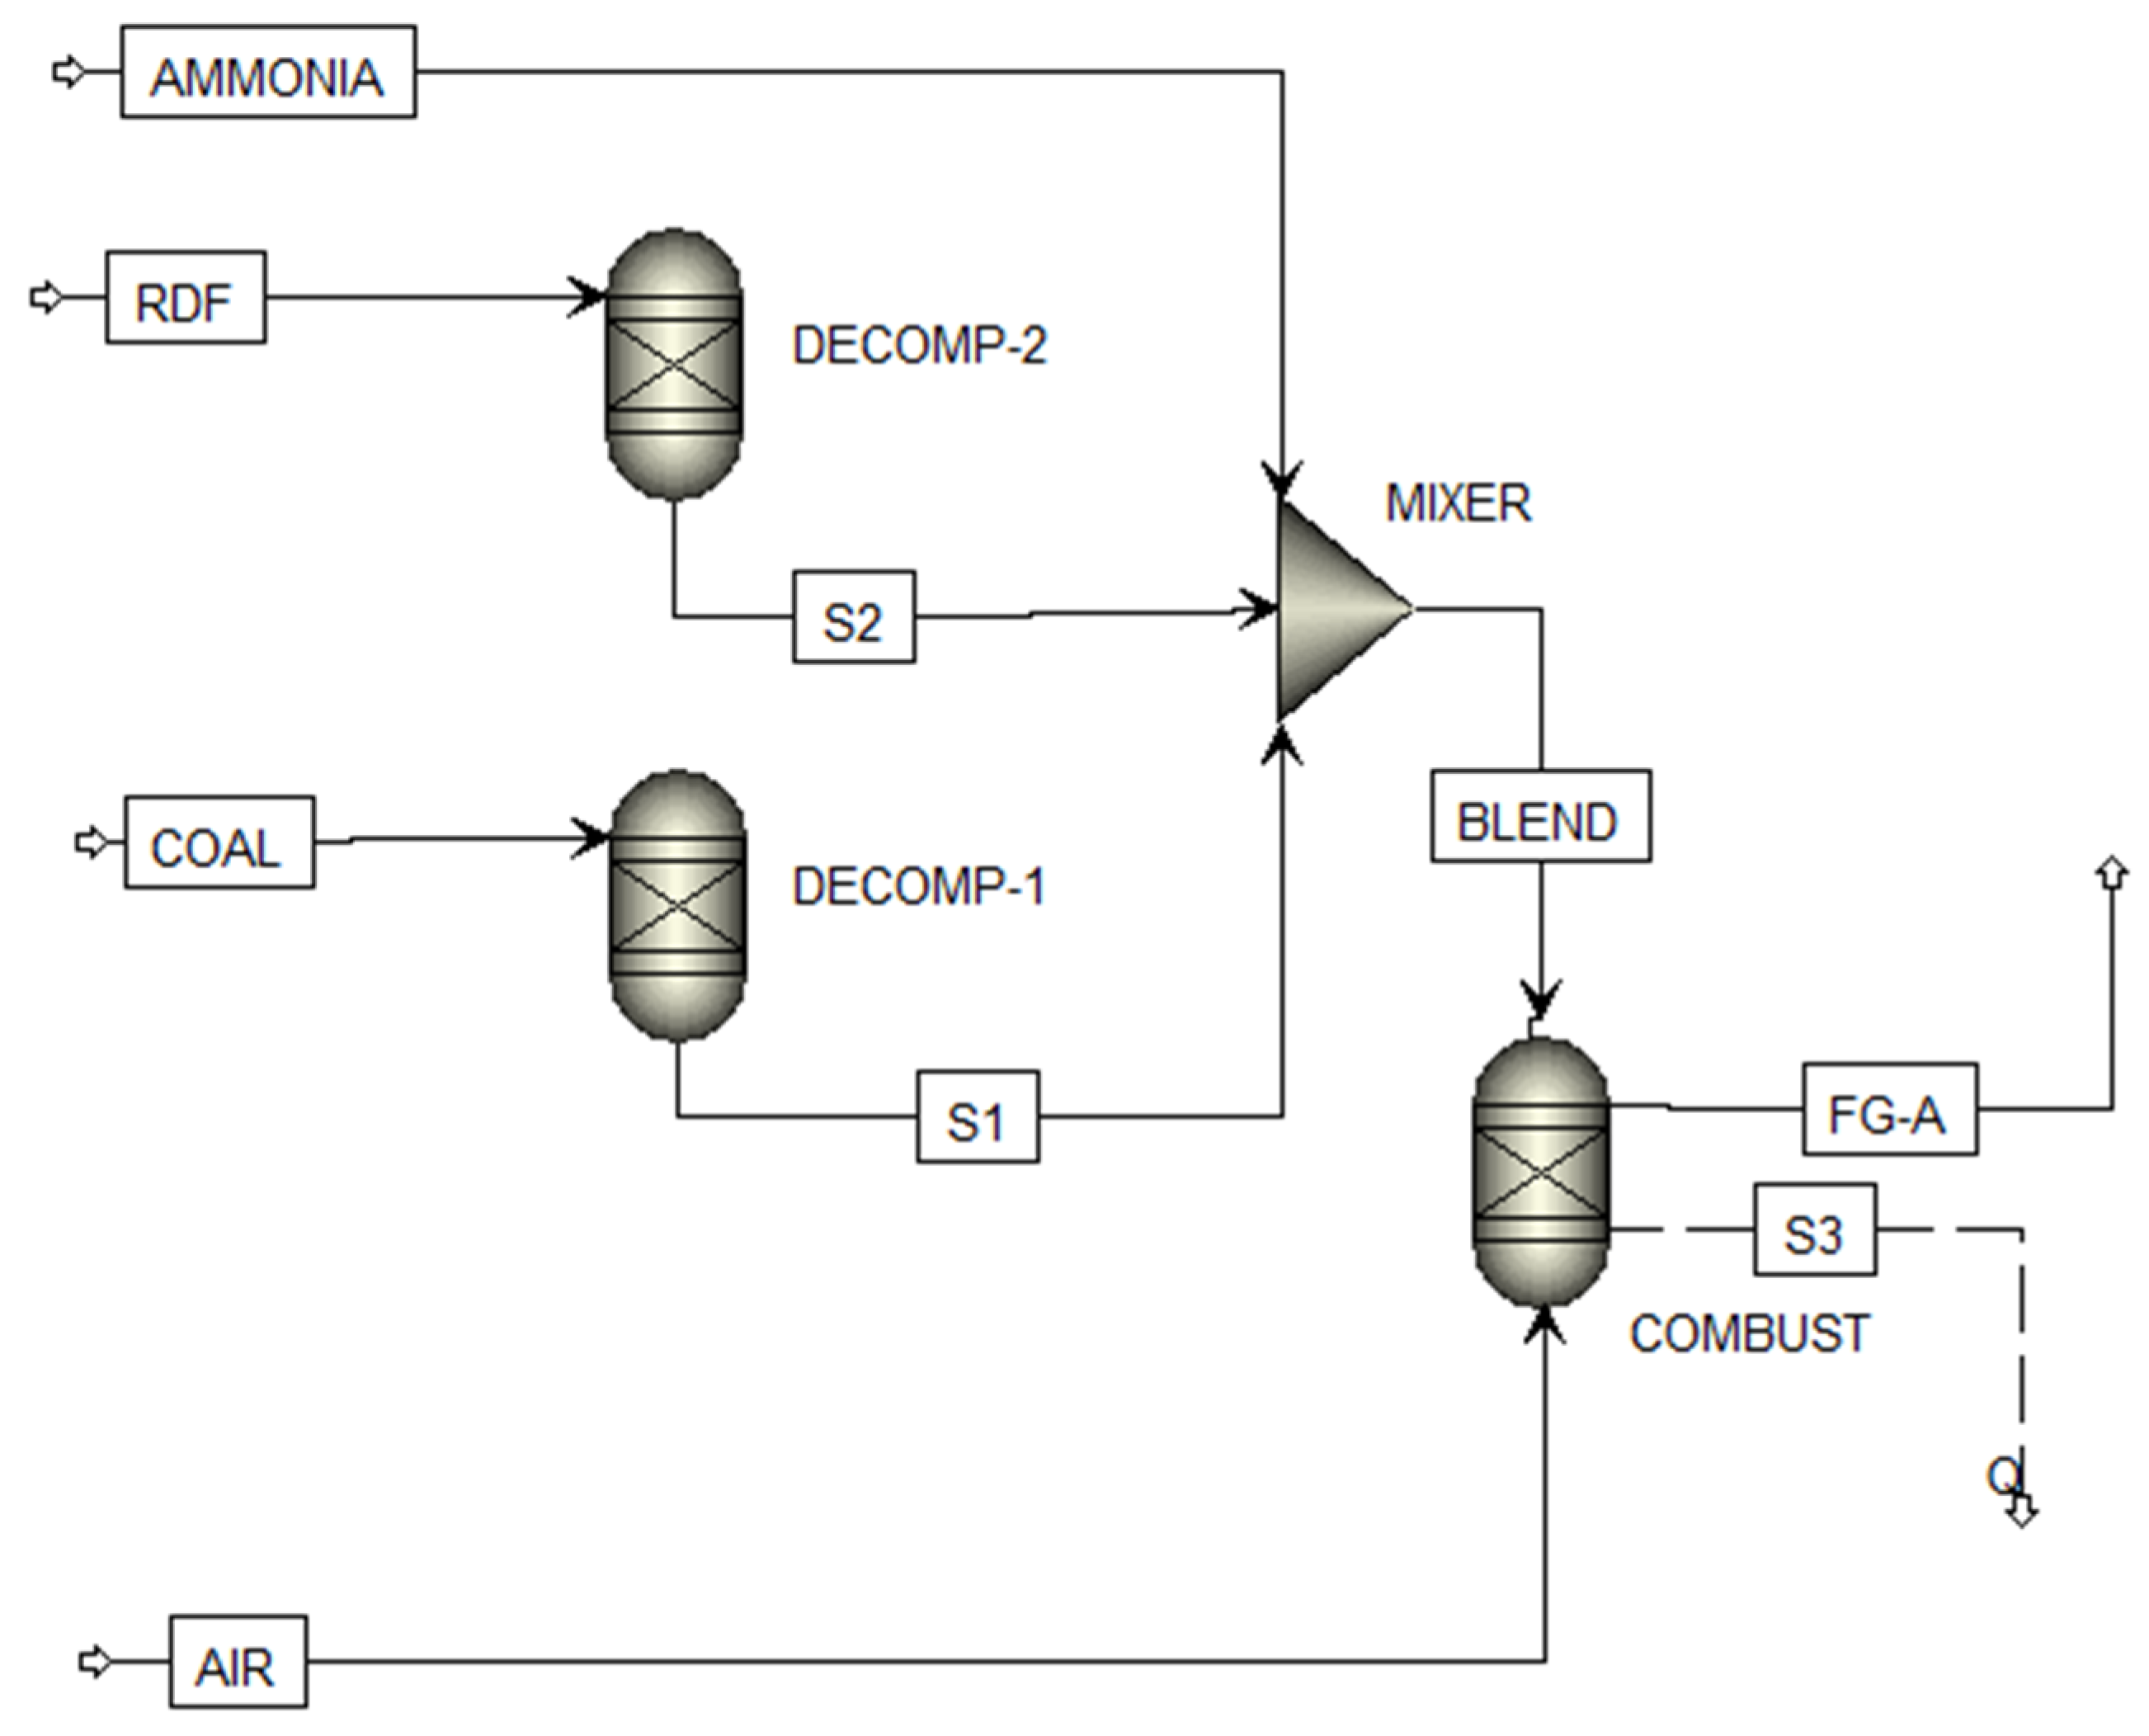
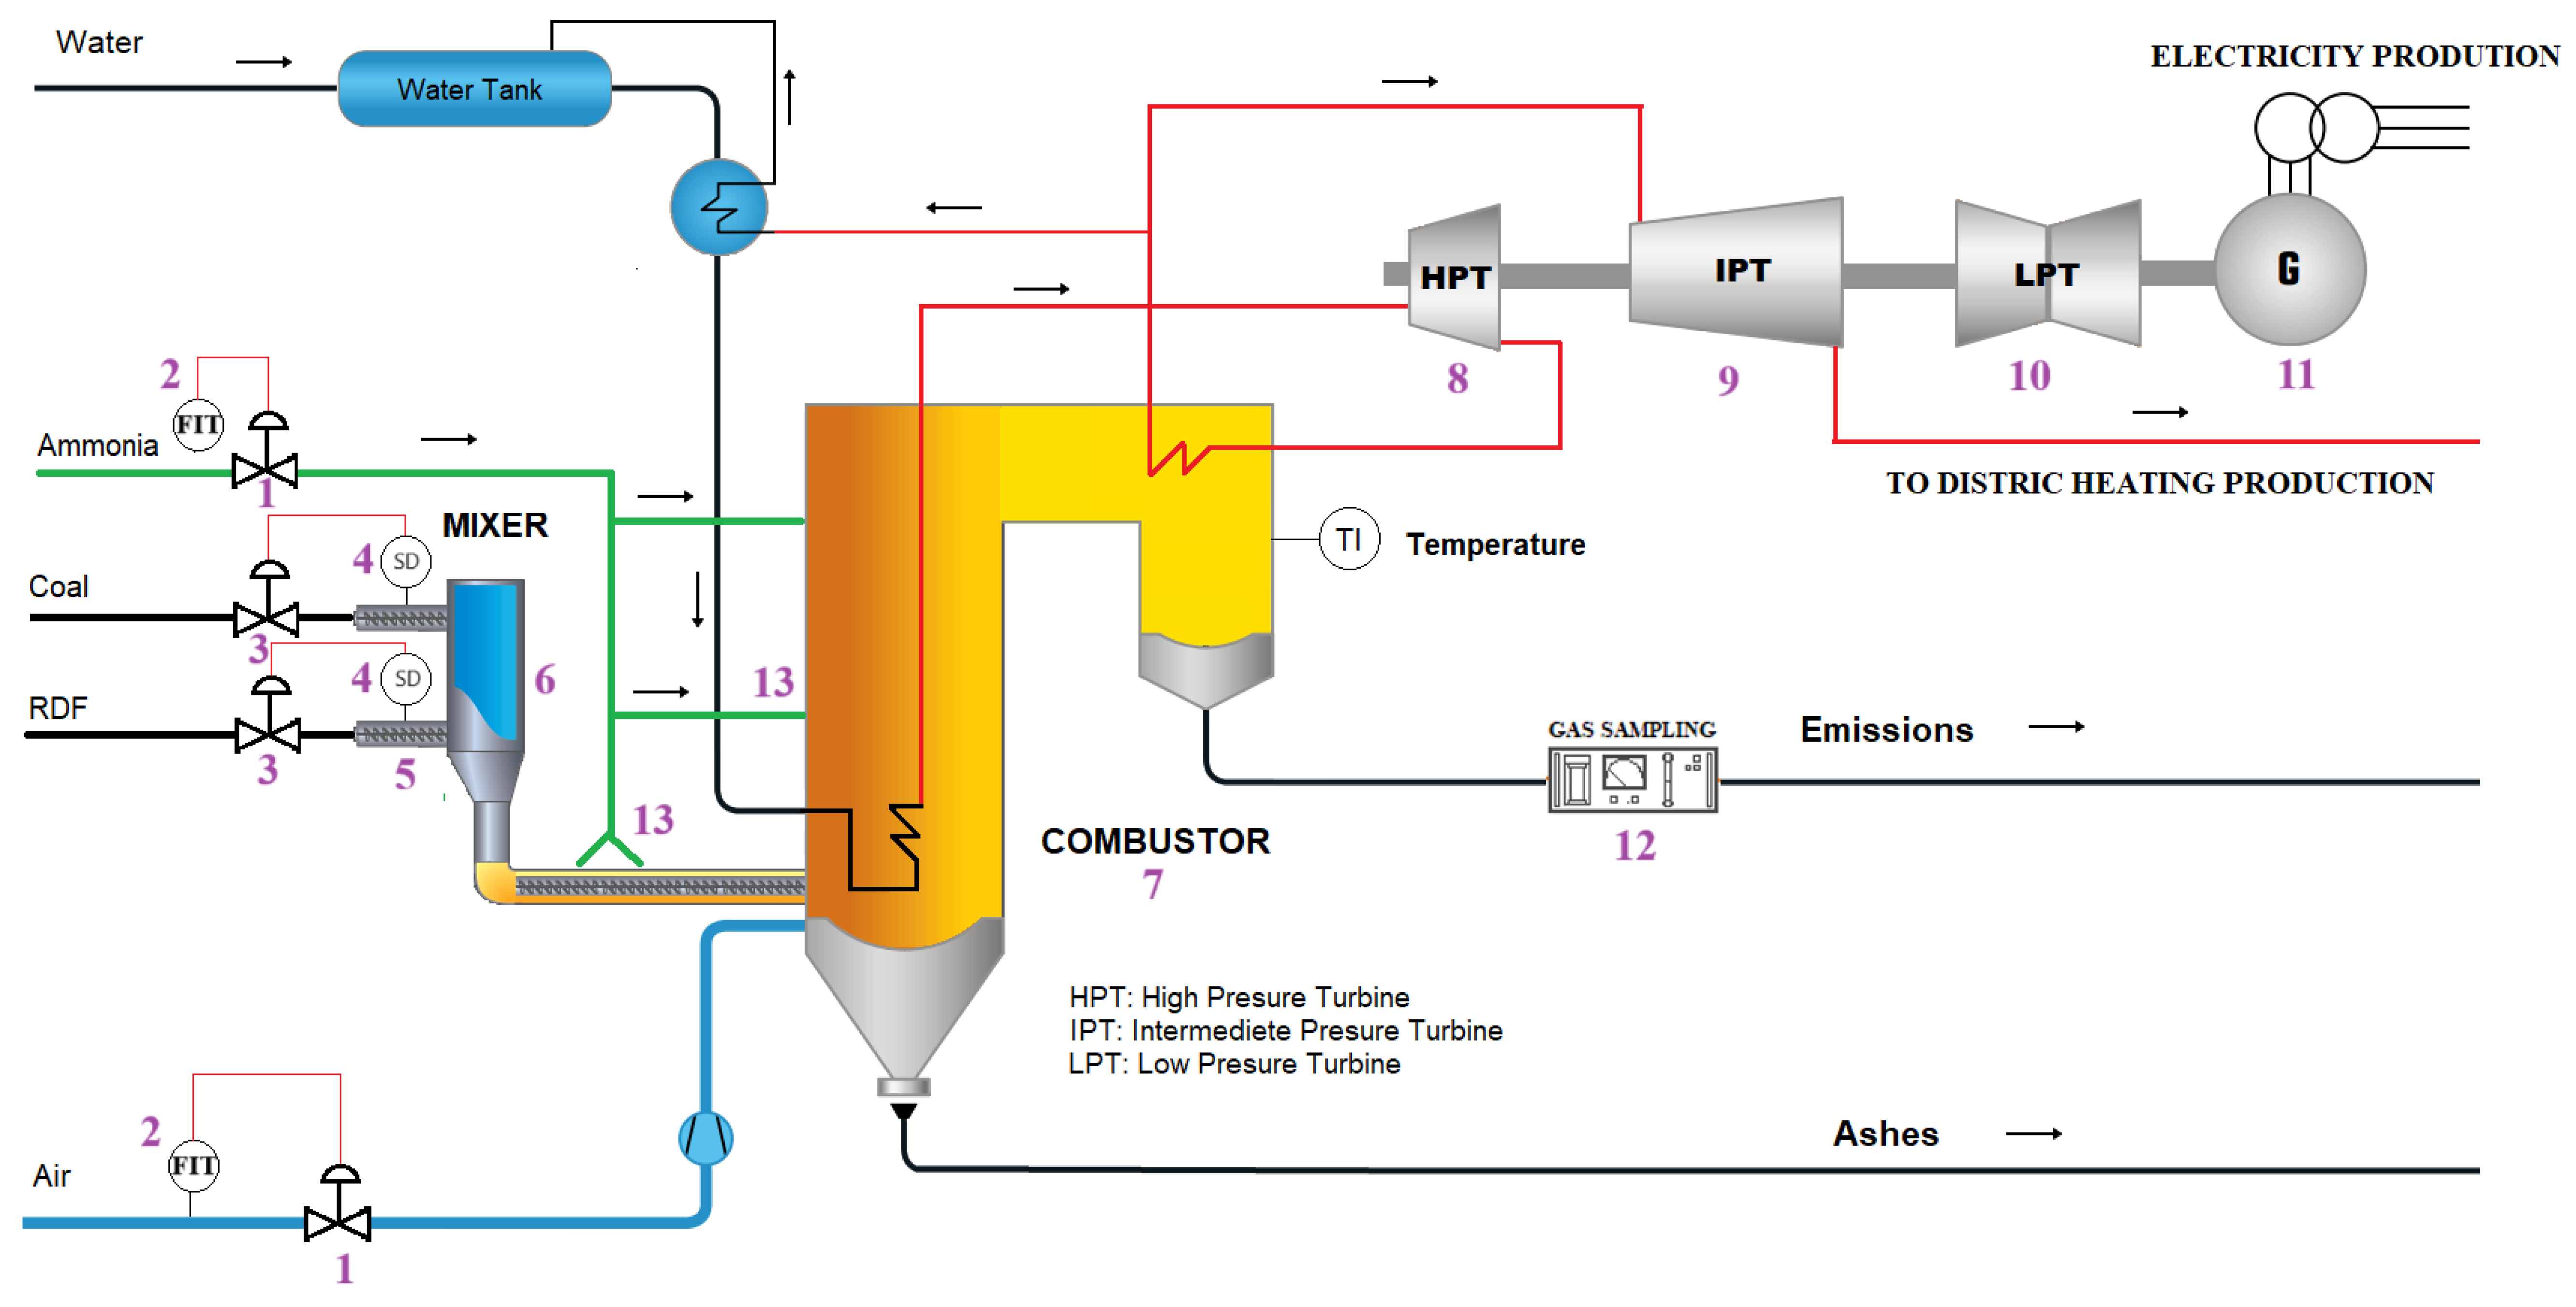
Implementing ammonia and RDF in coal-fired power plants requires several modifications to existing processes to ensure efficient and environmentally responsible operation (See
Figure 6). While co-firing coal with biomass is an established practice, integrating ammonia and RDF presents unique challenges and opportunities for optimization [
85].
A sophisticated control system is recommended to manage the introduction of RDF and ensure stable combustion effectively. Specifically, a pneumatic logic valve (PLV) system should be installed to regulate airflow. This PLV would connect to multiple control valves (CVs) strategically positioned throughout the system. The PLV’s operation would be guided by a Feedback Input Transducer (FIT) that is continuously monitoring airflow. By utilizing the FIT for real-time airflow data, the PLV can dynamically adjust the CVs, maintaining optimal combustion conditions and preventing issues like incomplete combustion or excessive emissions [
86].
Furthermore, precise control over the fuel mixture is crucial. To achieve this, the system should incorporate two-blade control valves directly linked to the speed driver (SD) of the screw conveyor motor, which is responsible for transporting both RDF and coal. This direct connection allows for immediate and accurate adjustments to the flow rates of each fuel component. By monitoring the motor’s SD, the CVs can regulate the proportion of RDF and coal entering the combustion chamber, ensuring a consistent and controlled fuel supply. This is essential for maintaining stable combustion temperatures and minimizing variations in energy output. The combined, precisely controlled fuel flow and airflow will connect to the burner, forming the combustion input [
87].
The injection of ammonia for NOx reduction also requires careful consideration. Several approaches can be employed, each with its advantages and drawbacks. One method involves impregnating the RDF and coal mixture with ammonia within the screw conveyor or in the mixing hopper. This pre-treatment allows for a more homogeneous distribution of ammonia throughout the fuel stream. Another approach involves installing a series of nozzles with spray systems strategically located along the burner body. These nozzles would inject ammonia directly into the combustion zone, allowing for more targeted and responsive NOx control.
Crucially, research indicates that the location of ammonia injection significantly impacts NOx formation due to the varying temperature profiles along the burner. Regions experiencing the highest temperatures tend to promote NOx formation. Therefore, the careful mapping of the temperature gradients within the burner is essential for determining the optimal injection points. The overall efficiency of NOx reduction can be significantly enhanced by strategically positioning the ammonia injection system in cooler regions or areas where it can effectively react with NOx precursors. This detailed understanding of temperature profiles and their influence on chemical reactions is vital for minimizing environmental impact and optimizing the performance of coal-fired power plants that utilize ammonia and RDF.
The scientific world is deeply engaged in solving the complex influence of NH
3 on the performance and emissions of burners and internal combustion engines. This research spans many investigations, from understanding how ammonia combustion characteristics differ from traditional fuels to pinpointing the precise chemical kinetics of its oxidation [
88]. Furthermore, a significant portion of this research is dedicated to evaluating and developing effective strategies to mitigate the formation of NO
x. These NO
x emissions are an essential concern, contributing to smog, acid rain, and respiratory problems. Scientists are exploring various techniques, including optimizing combustion parameters like temperature and air-to-fuel ratio, employing advanced burner designs that promote lean combustion, and investigating post-combustion technologies like selective catalytic reduction (SCR) to minimize NO
x release into the atmosphere. Ultimately, the goal is to harness the potential of ammonia as a cleaner-burning fuel while reducing its environmental impact [
89].
3.5. Operational and Safety Challenges of Using Ammonia as Fuel
Incorporating ammonia into coal power generation presents storage, safety, and transportation challenges. Therefore, developing ammonia infrastructure requires careful planning and implementation to minimize risks and ensure efficient operation.
Ammonia storage, for instance, necessitates specialized tanks and containment systems designed to prevent leaks and spills, often demanding specific pressure and temperature controls based on the scale and type of storage. Fortunately, this is regulated by the ASME Boiler and Pressure Vessel Code (BPVC) [
90], ASTM (American Society for Testing and Materials) [
91] and DOT (Department of Transportation) [
92].
Safety protocols are critical since ammonia is toxic and corrosive. This parameter is also regulated by some institutions, namely OSHA (Occupational Safety and Health Administration) [
93] and NIOSH (National Institute for Occupational Safety and Health) [
94], which comprehensively include training programs for personnel, emergency response procedures, and the proper use of personal protective equipment. It is worth noting that ammonia is rated as a one on a scale from zero to four, indicating that ammonia requires preheating before ignition. The safety protocols are reported by NFPA (National Fire Protection Association) [
95].
Regarding the large-scale transportation of ammonia—whether by pipeline, truck, or rail—they are also regulated by EPA (Environmental Protection Agency) [
96], which addresses potential environmental impacts.
These significant considerations do not require completely reinventing the wheel. The Haber–Bosch process for ammonia production has existed for over a century, and ammonia’s industrial applications are extensive. This means there is a wealth of existing knowledge and best practices available from various industries, including fertilizer production and chemical manufacturing, which can be utilized to tackle the challenges of using ammonia in coal power plants. Extensive research and operational experience have already been established regarding ammonia handling, storage, transportation, and safety, allowing for adapting and optimizing proven technologies and procedures rather than starting from scratch. Rather than pioneering entirely new solutions, the emphasis can be placed on customizing existing methods to fit the requirements and constraints of integrating ammonia into the coal power generation process. This established knowledge base offers a solid foundation for developing a safe, efficient, and environmentally responsible ammonia co-firing system.


