Article

CFD-DEM Modeling and Experimental Verification of Heat Transfer Behaviors of Cylindrical Biomass Particles with Super-Ellipsoid Model

1
Institute of Process Equipment, College of Energy Engineering, Zhejiang University, Hangzhou 310027, China
2
School of Qilu Transportation, Shandong University, Jinan 250061, China
*
Authors to whom correspondence should be addressed.
Energies 2025, 18(6), 1504; https://doi.org/10.3390/en18061504
Submission received: 27 February 2025 / Revised: 13 March 2025 / Accepted: 14 March 2025 / Published: 18 March 2025
(This article belongs to the Section J1: Heat and Mass Transfer)

Abstract

:
The heat transfer (HT) characteristics of cylindrical biomass particles (CBPs) in fluidized beds (FBs) are important for their drying, direct combustion, and thermochemical transformation. To provide a deeper insight into the complex mechanisms behind the HT behaviors involving CBPs, this study developed a cylindrical particle HT model within the framework of computational fluid dynamics coupled with the discrete element method (CFD-DEM) in which the CBPs were characterized by the super-ellipsoid model, which has the unique merit of striking a balance between computational accuracy and efficiency. The newly developed heat transfer model considers particle–particle (P-P), particle–wall (P-W), and fluid–particle (F-P). Its accuracy was verified by comparing the numerical results with the experimental infrared thermography measurements in terms of the temperature evolution of the cylindrical particles. The effects of the gas velocity, inlet temperature, and thermal conductivity of particles on the HT behaviors of the CBPs were investigated comprehensively. The results demonstrated the following: (1) Gas velocity can improve the uniformity of bed temperature distribution and shorten the fluctuation process of bed temperature uniformity. (2) A 26.8% increase in inlet temperature leads to a 13.4% increase in the proportion of particles with an orientation in the range of 60–90°. (3) The thermal conductivity of particles has no obvious influence on the bed temperature, convective HT rate, or orientation of particles.

1. Introduction

As a renewable and clean energy source, biomass has significant advantages over traditional fossil fuels and is bound to receive increasing attention in the context of the global commitment to net zero emissions. Among several devices, gas–solid fluidized beds (FBs), due to their superior heat and mass transfer properties, are recognized as the ideal carrier to treat biomass, which is usually preprocessed into cylindrical particles for fuller combustion [1,2,3]. Understanding the HT behaviors in gas–solid fluidized beds with CBPs is of significant importance to the efficient utilization of biomass energy.
Benefiting from the advancements in measurement techniques, our understanding of the dynamics and thermal behaviors of CBPs in FBs has been significantly enhanced. Boer et al. [4] used a digital image technique that captured the position and orientation of particles in a bubbling fluidized bed to study the mixing behavior of spherical and cylindrical particles. Wu et al. [5] used an improved particle tracking velocity method to study the flow characteristics of particles in a lift tube. Buist et al. [6] used magnetic particle tracking to study the flow behavior of cylindrical particles with different aspect ratios. Li et al. [7] used a high-speed infrared camera to capture the fluidization and thermal behavior of spherical particles in a quasi-two-dimensional FB. Patil et al. [8] combined infrared, particle image velocity, and digital image analysis to explore the evolution of particle volume fraction, particle volume flux, and temperature distribution. Yu et al. [9] studied the influence of adding fine powder on the HT performance of FBs using array thermocouple. These experimental works laid a solid foundation for us to probe the typical flow and HT characteristics in FBs but do not address the microscopic features of these processes, hindering us from obtaining a deeper insight into the complex interactions between particles and fluids. Furthermore, experiments are often time-consuming and cannot well capture the details at different times and spatial scales.
Since the pioneering work of Tsuji et al. in 1993 [10], computational fluid dynamics coupled with the discrete element method (CFD-DEM), which combines the Eulerian method, capable of resolving fluid flow with turbulence, and the Lagrangian method, able to track the motion of each individual particle, has been a widely used numerical method for understanding gas–solid interaction mechanisms [11,12,13,14,15,16]. Based on the CFD-DEM, Wang et al. [17] studied the influence of diameter, bed temperature, and feed location on gasification performance, taking into account heat conduction, convection, and radiation. Lian et al. [18] found that convective HT is the dominant mechanism in the biomass combustion process, and the HT of F-P weakens as particle cohesion increases. Mohseni et al. [19] exploited a model that accounts for heating, drying, and pyrolysis processes during biomass conversion. Although the fluidization behavior and HT characteristics of spherical biomass particles have been studied extensively, the related mechanisms of CBPs have rarely been reported.
Compared with spherical biomass particles, CBPs have more complex geometric structures that inevitably complicate the fluid mechanics and HT characteristics of particles. Some progressive researchers used the multi-sphere model to describe the morphology of CBPs considering their simplicity and applicability to different shapes. Lu et al. [20] used the glued sphere model to study the influence of particle shape on intra-particle HT and pyrolysis yield. Prakotmak et al. [21] investigated the flow of multi-sphere particles in an FB and analyzed the influence of fluid velocity and particle shape on HT. Zhang et al. [22] utilized a multi-sphere model (MSM) to characterize biomass particles during steam gasification in a fluidized bed, examining the impact of particle aspect ratio on HT characteristics. The MSM aggregates multiple spherical particles into a single entity based on specific algorithms, theoretically enabling the construction of particles with any shape. However, the MSM presents a challenge in achieving a balance between computational efficiency and accuracy, particularly in large-scale simulations. With a limited number of sub-spheres, the accuracy in representing the shape of CBPs is compromised. Conversely, when an adequate number of sub-spheres is used to accurately capture the geometry of CBPs, the computational load is significantly increased. Compared with the MSM, the super-ellipsoid is an ideal alternative for describing the morphology of CBPs and can balance the computational accuracy and efficiency [1,23,24,25,26]. However, there are few modeling methods that take into account calculation accuracy and efficiency in HT research on CBPs.
Most of the biomass in actual industrial processes is cylindrical. Using spheres to describe CBPs can cause real particles to lose their inherent geometric properties. Geometric properties affect the forces (e.g., drag) and heat transfer (e.g., convective heat transfer coefficient) of particles in a fluid. The conductive and convective HT modes of CBPs are different from those of spherical particles. The contact mode and orientation of CBPs affect the HT characteristics. The over-assumption of real CBPs as spherical may lead to a decrease in model accuracy. In addition, there are relatively few experimental data on the HT of CBPs, and the establishment and experimental verification of a CBP heat transfer model is one of the main challenges at present.
Synthesizing the above, this work represents the first attempt to develop and experimentally verify an HT model of CBPs using the super-ellipsoid model within the CFD-DEM framework. The newly developed model takes into account convective and conductive HT mechanisms based on the calculation of Hertz contact. The influences of the gas velocity, inlet temperature, and thermal conductivity of particles on bed temperature and the orientation distribution of particles were analyzed by CFD-DEM simulation and the heat transfer mechanisms of CBPs were investigated comprehensively.

2. Mathematical Model

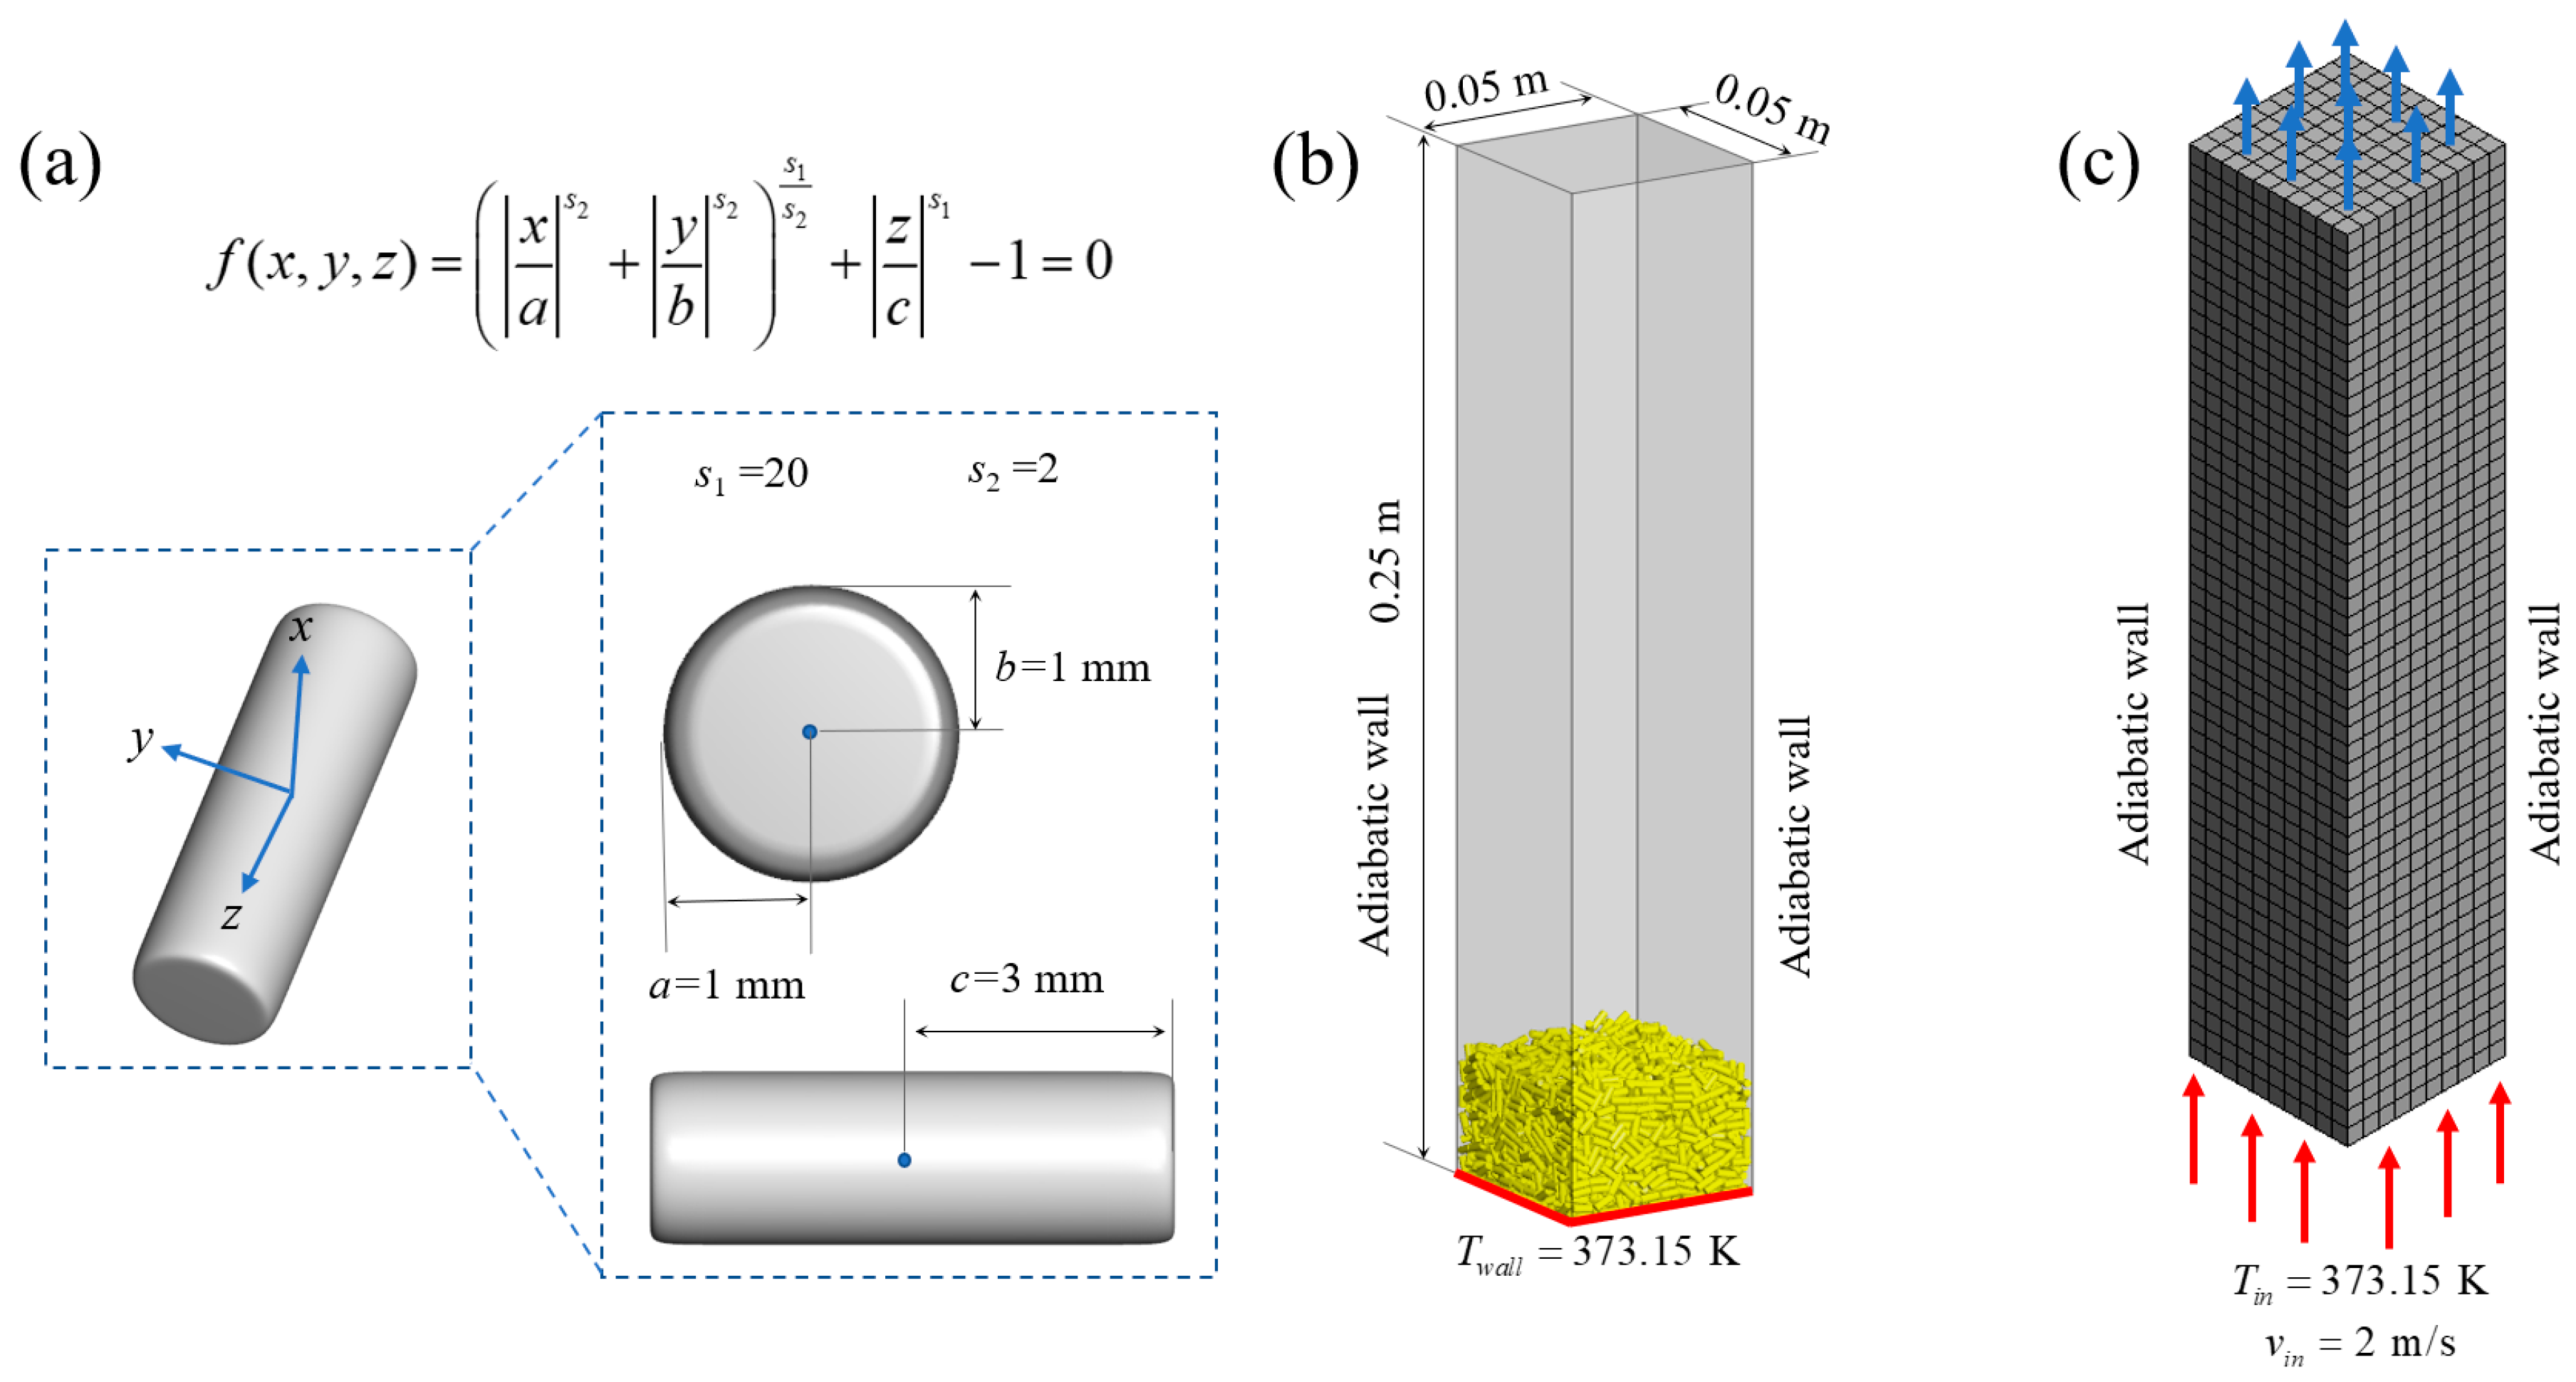
2.1. Particle Geometry Governing Equation

The shape of CBPs can be described by the super-ellipsoid, and the governing equation of its surface shape is expressed by [27]
f ( x , y , z ) = x a s 2 + y b s 2 s 1 s 2 + z c s 1 1 = 0
where a, b, and c denote the semi-axis lengths of particles in three directions. s1 and s2 are shape indices controlling the curvature of particles. When s1 and s2 are 20 and 2, respectively, Equation (1) can describe CBP well [1], so s1 = 20 and s1 = 2 were taken to describe CBPs in this study.

2.2. Governing Equations of Particles

The motion of CBPs follows Newton’s laws, which are given as
m p d v d t = m p g + F c + F d + F b
d ( I ω ) d t = T c
where mp is the mass of the CBPs, t is the time, v is the velocity of the CBPs, g is the gravitational acceleration, Fc is the contact force, Fd is the drag force, Fb is the buoyancy force, I is the moment of inertia, ω is the angular velocity, and Tc is the contact torque. The details of the forces calculation, contact detection, and particle orientation are based on our previous work [28].
The energy equation for a cylindrical particle is expressed by
m p c p , p d T p d t = Q p p + Q p w + Q f p
where cp,p is the specific heat capacity of the particle, Tp is the temperature, and Qpp and Qpw are the particle–particle (P-P) and particle–wall (P-W) conductive HT rates, respectively. Qfp is the fluid–particle (F-P) convective HT rate.

2.3. Governing Equations of Fluid

Within the CFD-DEM framework, the fluid is treated as a continuous medium governed by the volume-averaged Navier–Stokes equations, while the presence of CBPs is characterized by the volume fraction of the computational element. Its continuity and momentum equations are given as
t ( ε f ρ f ) + ( ε f ρ f u ) = 0
t ( ε f ρ f u ) + ( ε f ρ f u u ) = p + ( ε f τ ) + ε f ρ f g + F s
where ρf is the fluid density, u represents the fluid velocity, p represents the gas pressure, τ is the viscous stress, Fs represents the source term of the force of F-P, and εf is the element voidage. In a dense FB, a single CBP could occupy more than one element simultaneously. If the element voidage is calculated based on the total volume of the CBP whose centroid is located at the element, simulation accuracy and stability will be largely compromised, especially for cases with small-sized elements. Therefore, a single CBP can be divided into multiple subparticles using the subunit method and then the voids can be calculated using the centroid method. The details of this approach can be found in our previous work [1]. The element voidage can be obtained by
ε f = 1 i = 1 n V p , i V c
where Vp,i is the volume of sub-particle i, n represents the number of subparticles in this element, and Vc represents the volume of this element.
The fluid energy conservation equation can be written as
ε f ρ f C p , f T f t + ε f ρ f u C p , f T f = ε f k f T f i = 1 n Q f p V c
where Cp,f is the specific heat capacity of the fluid, Tf is the fluid temperature, and kf is the thermal conductivity of the fluid. Due to the wide range of temperature variations in the FB, the density and thermodynamic properties of the gas cannot be considered constant. The density of fluid can be formulated as
ρ f = M f p f R f T f
where Mf is the molar weight of the gas and Rf is the molecular constant of the gas. Based on the work of Xia et al. [29], the viscosity, specific heat capacity, and thermal conductivity of gas can be calculated as
μ f = 7.21 × 10 7 + 6.42 × 10 8 T f 3.65 × 10 11 T f 2 + 1.61 × 10 14 T f 3
C p , f = 1002.47 + 0.0483 T f + 4.49 × 10 4 T f 2 3.18 × 10 7 T f 3 + 6.53 × 10 11 T f 4
k f = 0.0013 + 9.04 × 10 5 T f 1.08 × 10 8 T f 2 + 9.77 × 10 12 T f 3

2.4. Interphase Force Model

The drag force of CBPs is closely related to the direction of fluid flow, which can be expressed as [30,31]
F d = 1 2 ρ f ε f 1 γ C d A | u v | ( u v )
γ = 3.7 0.65 exp 1.5 log Re p 2 2
Re p = ρ f d p ε f | u v | μ f
where A is the projected area of the CBPs in the direction of fluid flow. dp is the diameter of an equal-volume sphere of the CBPs. Cd is the drag coefficient. For CBPs, the drag model of spherical particles [32,33] may not be applicable, so the drag coefficient of CBPs is [34]
C d = 8 Re p 1 ϕ + 16 Re p 1 ϕ + 3 Re p 1 ϕ 3 / 4 + 0.42 × 10 0.4 ( log ϕ ) 0.2 1 ϕ
where ϕ is sphericity, which is defined as the ratio of the surface area of the equal-volume sphere to that of the CBPs, and ϕ is the ratio of the projected area of the equal-volume sphere to that of the CBPs in the direction of flow. The buoyancy force on a particle is
F b = V p ρ g g
When Fd and Fb in a fluid element are determined, the force of CBPs acting on the element can be calculated as
F s = i = 1 n ( F d + F b ) V c

2.5. Heat Transfer Model

FV HT occurs through mainly conduction, convection, and radiation. Conductive HT mainly occurs in P-P and P-W. Convective HT is usually carried out at F-P and fluid–wall interfaces. Radiation is the heat transferred by fluid, walls, and particles to the surrounding medium in the form of electromagnetic waves, which can be ignored at lower temperatures [8].
Conductive HT occurs through contact between two objects. A significant number of collisions can appear in a dense FB within a short period, but the contact time of each collision is extremely short, which results in a small amount of HT per collision. However, on long-time scales, the conductive HT mechanism cannot be ignored. For two CBPs in a single collision, the conductive HT rate between them is usually determined by the contact area, the thermal conductivity of the particles, and the temperature difference between the two particles. The conductive HT rate between two particles can be described as [35]
Q p p , i j = 4 k p , i k p , j k p , i + k p , j R c , i j ( T p , i T p , j )
where kp,i and kp,j are the thermal conductivity of CBPs i and j, respectively, and Rc,ij is the equivalent radius of the contact surface of CBPs i and j. In order to obtain a larger time step within an acceptable overlap range, the soft sphere-based DEM uses a much smaller spring stiffness than that of the actual particles, which results in a much larger contact area of the particles during the actual collision. If this contact area is used directly, the HT between particles will be overestimated.
It is very challenging to determine the contact radius of two CBPs analytically; thus, a method is needed to reduce the irregular shape to a spherical object; this has been adopted by many studies [36,37,38,39]. For two CBPs, we used equal-volume spheres based on Hertz contact to describe the contact force equilibrium relationship between them [40]:
1 v i 2 π E i + 1 v j 2 π E j π 2 q c 4 R c , i j = r i + r j 2 r i r j
where vi and vj are the Poisson ratio of CBPs i and j, respectively. Ei and Ej are the elastic moduli of particles i and j, respectively. ri and rj are the radii of the equal-volume sphere of CBPs i and j, respectively. qc is the stress at the center of the contact surface, which can be described as [40]
q c = 3 F n 2 π R c , i j 2
where Fn is the total pressure on the contact area. By substituting Equation (21) into Equation (20), the radius of the contact area can be obtained:
R c , i j = 3 4 r i r j r i + r j 1 v i 2 E i + 1 v j 2 E j F n 1 3
For the conductive HT of P-W, the wall is regarded as a CBPs with infinite radius, where the conductive HT rate and the contact radius of P-W can be calculated by Equation (19) and Equation (22), respectively.
According to Newton’s Law of cooling, the rate at which heat migrates from a fluid element to a particle can be written as
Q f p = h A T f T p
where A is the surface area of the CBPs. h represents the convective HT coefficient, which is
h = N u d p k f
where Nu is the Nusselt number, which can be described as [32]
N u = 1.76 + 0.55 ϕ P r 1 3 R e ϕ 0.075 + 0.014 P r 1 3 R e 2 3 ( ϕ ϕ ) 7.2
where Pr is the Prandtl number, which can be given as
P r = μ f C p , f k f
Note that we kept the Biot number Bi = dph/kp < 0.1 in this work, which allowed us to describe the temperature of the particles by the lumped parameter method, ignoring the temperature gradient inside the particles. Meanwhile, this study did not consider frictional HT. This may have led us to underestimate the actual warming rate of the particles.

3. Model Validation

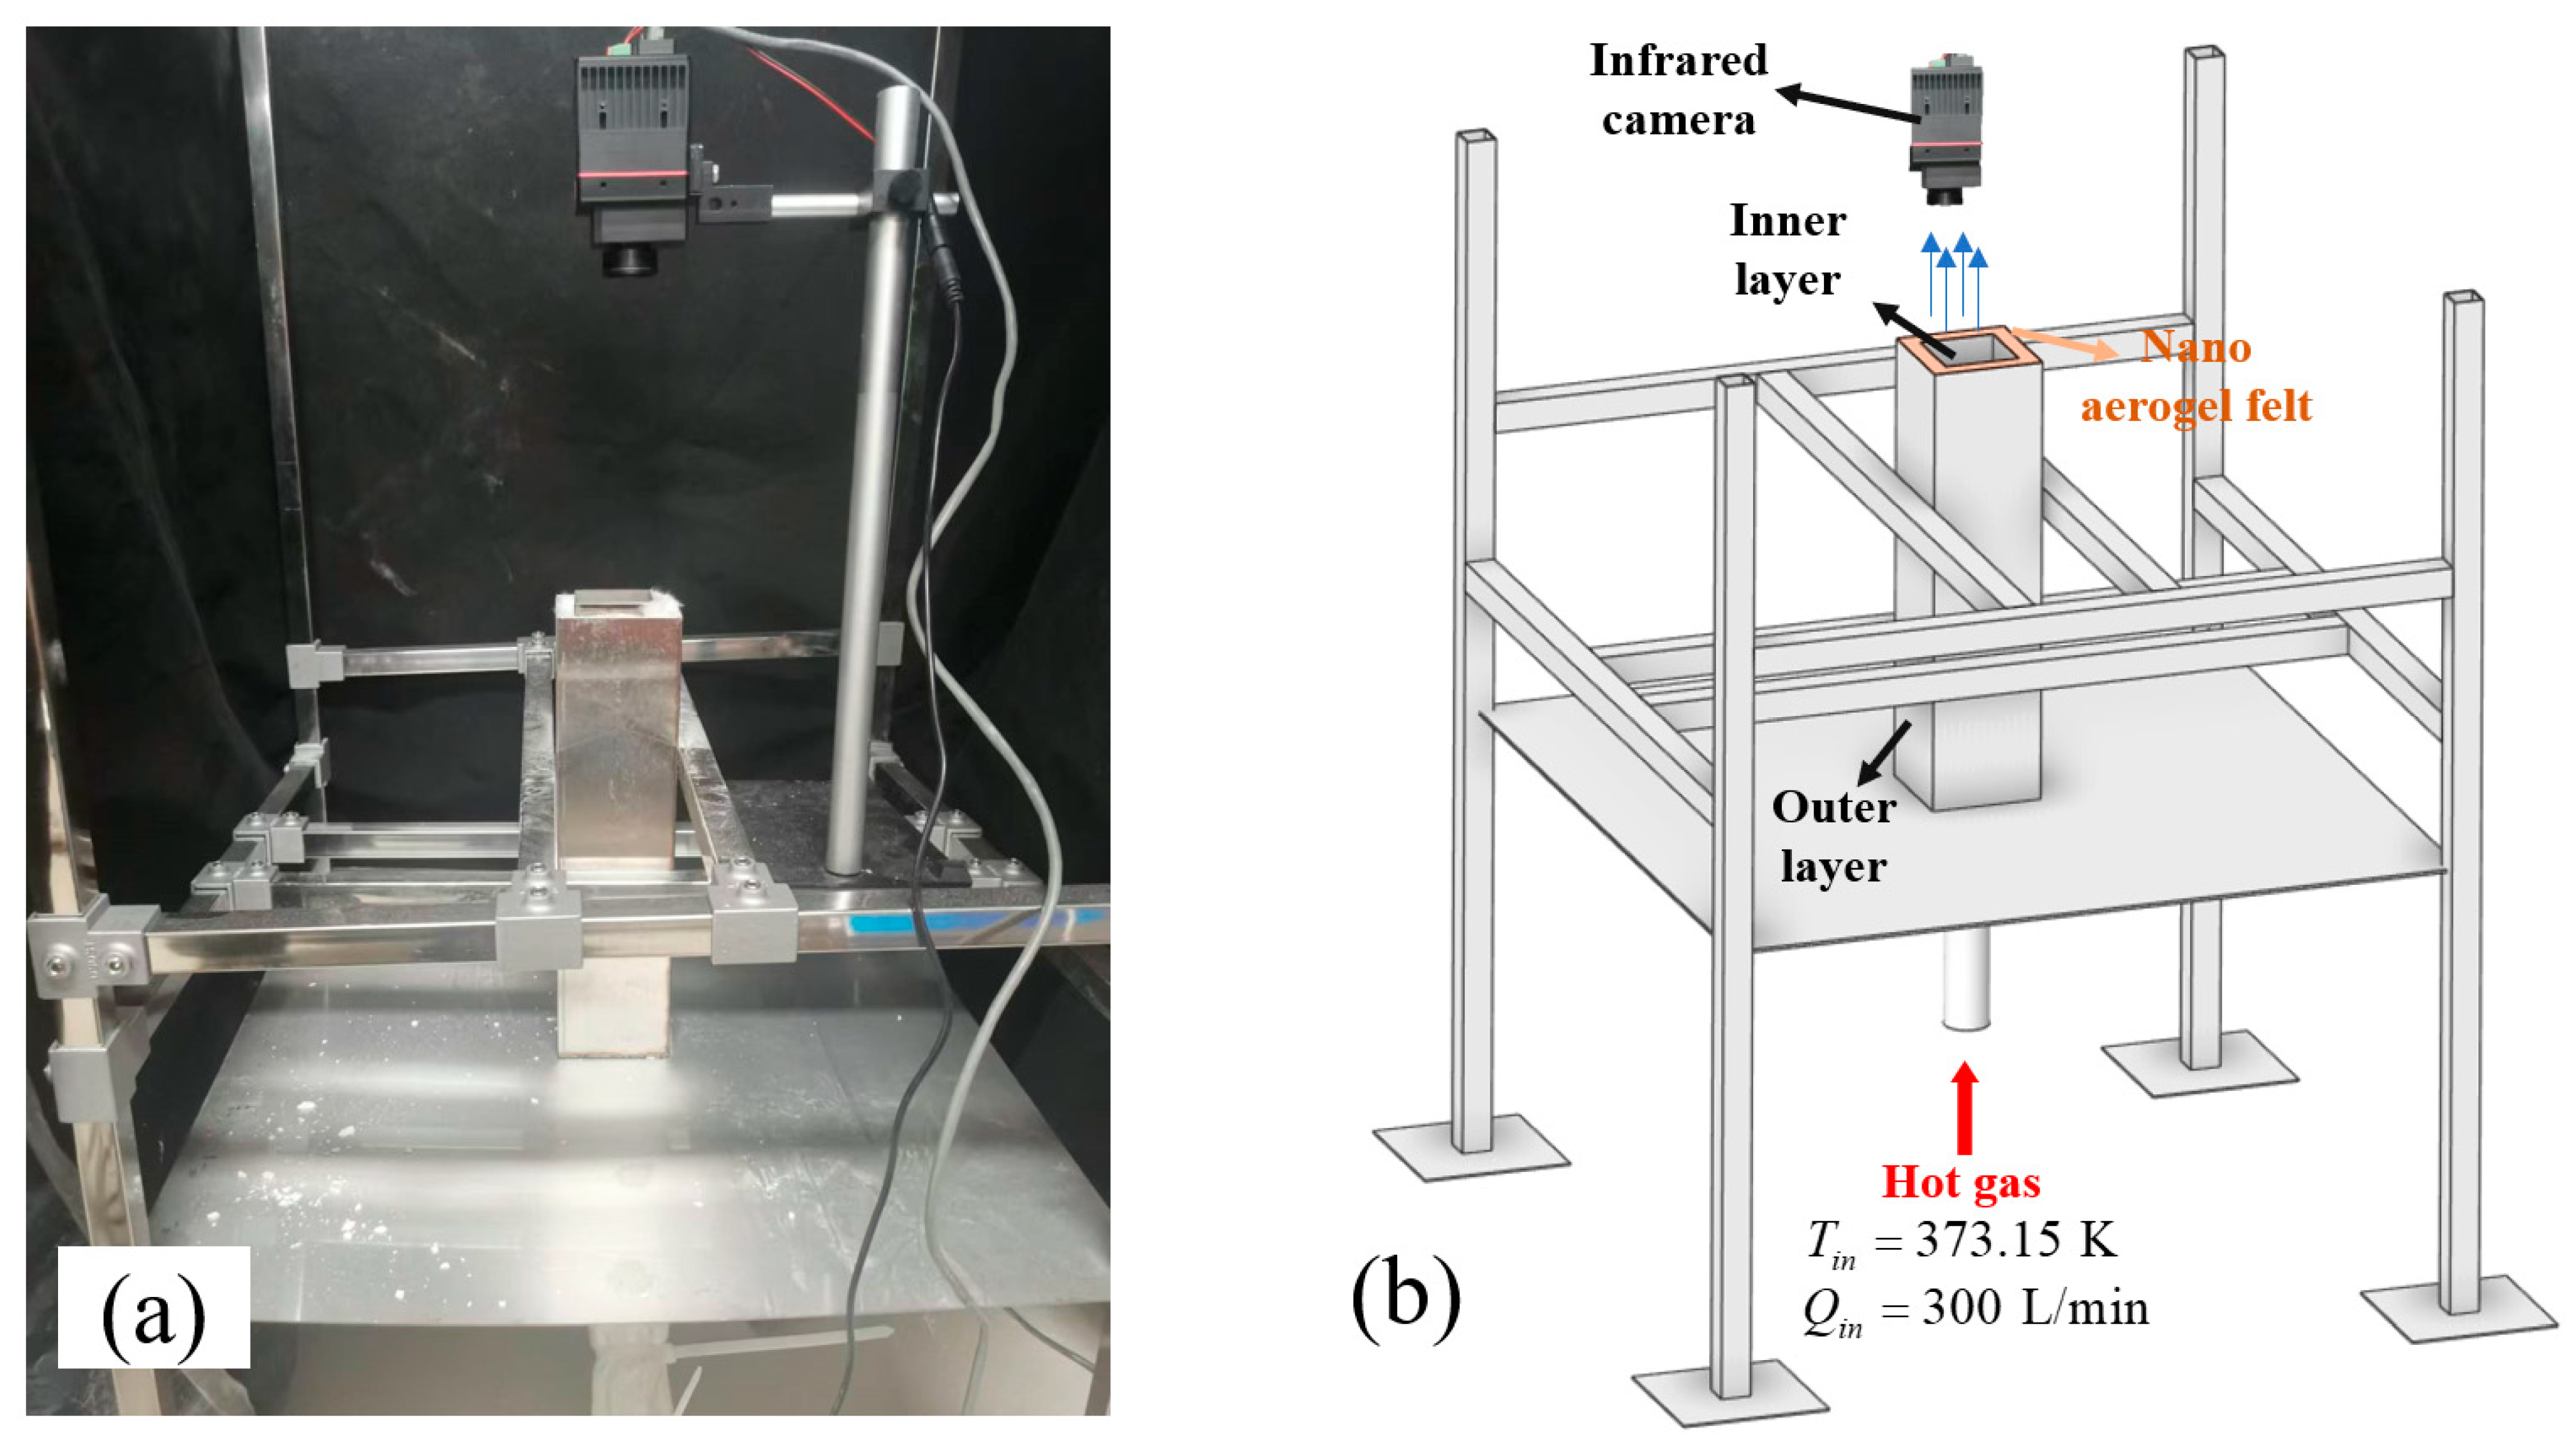
3.1. Experiment Settings

In the experiment, we used steel, which is easier to obtain and process than wood pellets, as an alternative to wood. The use of steel did not affect the correctness of the comprehensive heat transfer model. In the fourth section of this article, we describe the use of the biomass density and specific heat capacity of the particles, which can help us better understand the HT process of the CBPs.
Thermocouples and infrared cameras are two commonly used instruments to measure temperature. Considering that the accuracy of measuring the temperature of particles using thermocouples in forced convective HT can be affected by fluid flow, infrared cameras were used in three-dimensional fixed bed surfaces in this study. The experimental system is shown in Figure 1. The particle container had a double-layer structure, with the inner and outer layers made of stainless steel. The total height, length, and width of the inner layer were 0.25 m, 0.05 m, and 0.05 m, respectively. The middle of the inner and outer layers was a nano aerogel felt with a thermal conductivity of 0.018 W/(m·K). An infrared camera (Guide IPT640) with a resolution of 640 × 512 and an operation wavelength of 8–14 μm was fixed above the outlet of the particle container. The accuracy of the infrared camera was affected by the ambient temperature and particle emissivity. First, the ambient temperature was measured several times by a calibrated thermocouple so that the infrared camera could obtain accurate temperature supplementation. Multiple particles were heated to different temperatures and a calibrated thermocouple measurement was used to calibrate the emissivity of the object measured by the infrared camera. In this experiment, hot air with a temperature of 373.15 K entered from the bottom of the fixed bed at a flow rate of 300 L/min. The hot air supply unit was calibrated with a standard flow meter and thermocouple. Before the experiment, the infrared camera was kept on and the temperature of surface particles was collected every 1 s. The properties and experimental conditions of the CBP are summarized in Table 1.

3.2. Simulation Settings

The schematic diagram of the cylindrical particle based on the super-ellipsoid model is shown in Figure 2a, where a = 1 mm, b = 1 mm, and c = 3 mm, and the simulation conditions of CFD and DEM are shown in Figure 2b,c, respectively. The computational domain in CFD and DEM was consistent with the actual device size. The bottom was the inlet boundary condition with a velocity of 2 m/s and a temperature of 373.15 K and the sidewalls were adiabatic walls without slip. The fluid phase was solved by Pressure Implicit with Splitting of Operators (PISO) [41] and the transient terms, convection terms, and diffusion terms were discretized using the Crank–Nicolson scheme [42], QUICK scheme [43], and central difference scheme, respectively. The particle phase was solved by the explicit time integration method [44]. In the DEM side, the bottom wall kept a constant temperature of 373.15 K and the sidewalls were adiabatic walls, and there was no wall on the upper surface. The normal and tangential spring stiffness of the particles were 7000 N/m and 2000 N/m, respectively. Simulation parameters and properties are shown in Table 2. Before introducing the fluidized gas, CBPs with random orientations needed to be created. These particles fell and accumulated under the action of gravity. When the velocities of all particles in the DEM decayed to 0, the simulation was performed with an additional 60 s of physical time.

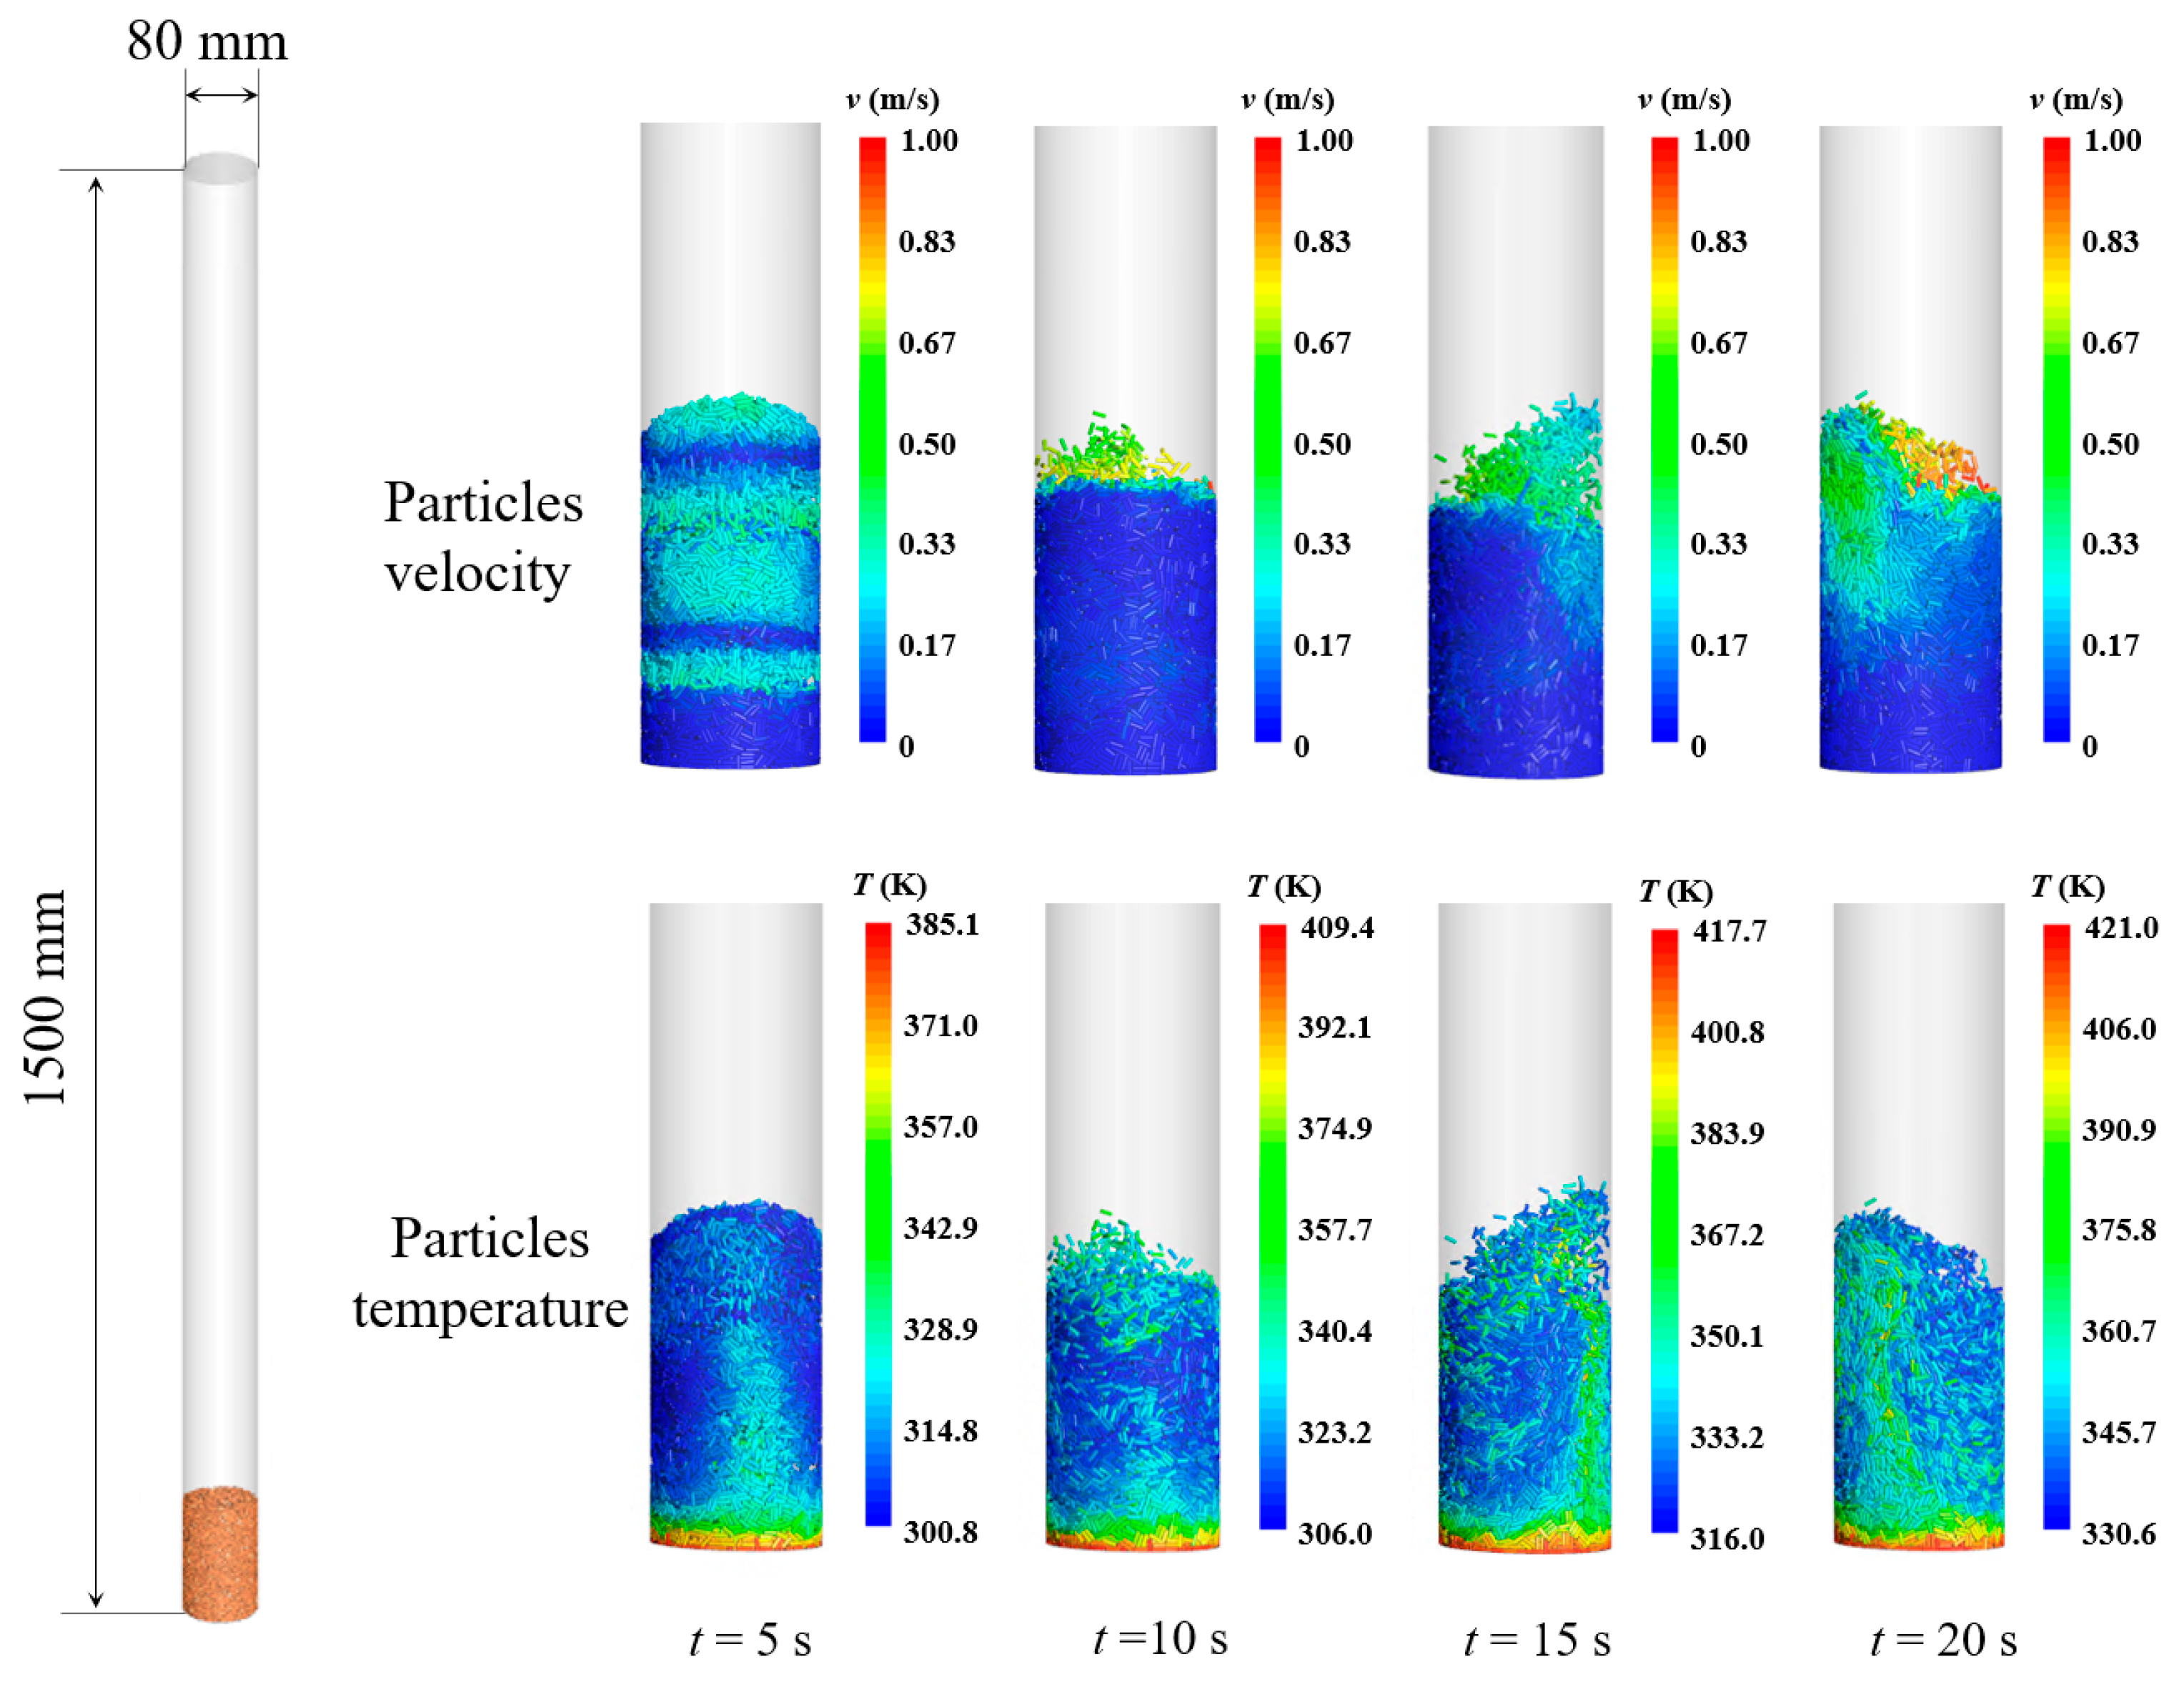
3.3. Comparison of Numerical Results with Experiments

The Tp on the surface of the fixed bed in the experiment and simulation are shown in Figure 3. The average Tp was 298.15 K at the beginning of the experiment. Accompanied by the introduction of hot air, the fastest temperature rise of particles occurred in the near-wall area. This phenomenon can be explained as the large voidage in the near-wall area. The flow of hot air along the wall led to a large convective HT rate near the wall, resulting in a rapid increase in the temperature of particles in the near-wall area. Through the sustained introduction of hot air, it can be found that the high-temperature area began to expand from the near-wall area to the bed center. In the CFD-DEM simulation, the observed evolution of Tp over time and space was similar to that in the experiment. The predicted maximum surface Tp in the simulation was 368.2 K at 60 s, which also agreed well with the experimental measurement of 367.2 K.
The average Tp on the surface was obtained by processing the results of the infrared camera with Guide Infrared Analysis software. The average particle temperature in the experiment was within a narrow range. Under the circumstances, the traditional relative error was too small to evaluate the difference between the predicted values and experimental measurements because the denominator in the relative error equation was very large. In this study, the following temperature deviation description was used:
ε = T sim T exp T exp , t = 60 T exp , t = 0 × 100 %
where Tsim is the predicted temperature, Texp is the measured temperature, and Texp,t=0 and Texp,t=60 are the initial and final average particle temperatures in the experiment, respectively. The evolution of average Tp on the surface is shown in Figure 4. The maximum deviation was 7.63% and the average deviation was 4.83%, which is satisfactory for the forced convective heat transfer of cylindrical particles. Although materials with very low thermal conductivity were used for wall insulation, hot air convection still acted on walls that we assumed to be insulated. In addition, the influence of conductive HT between the sidewalls and the CBPs was also ignored in the simulation, which may also have been one of the sources of deviation between the experiment and the simulation. Combining the results from Figure 3 and Figure 4, we can draw the conclusion that the newly proposed HT model is accurate enough to describe the HT behaviors of CBPs.

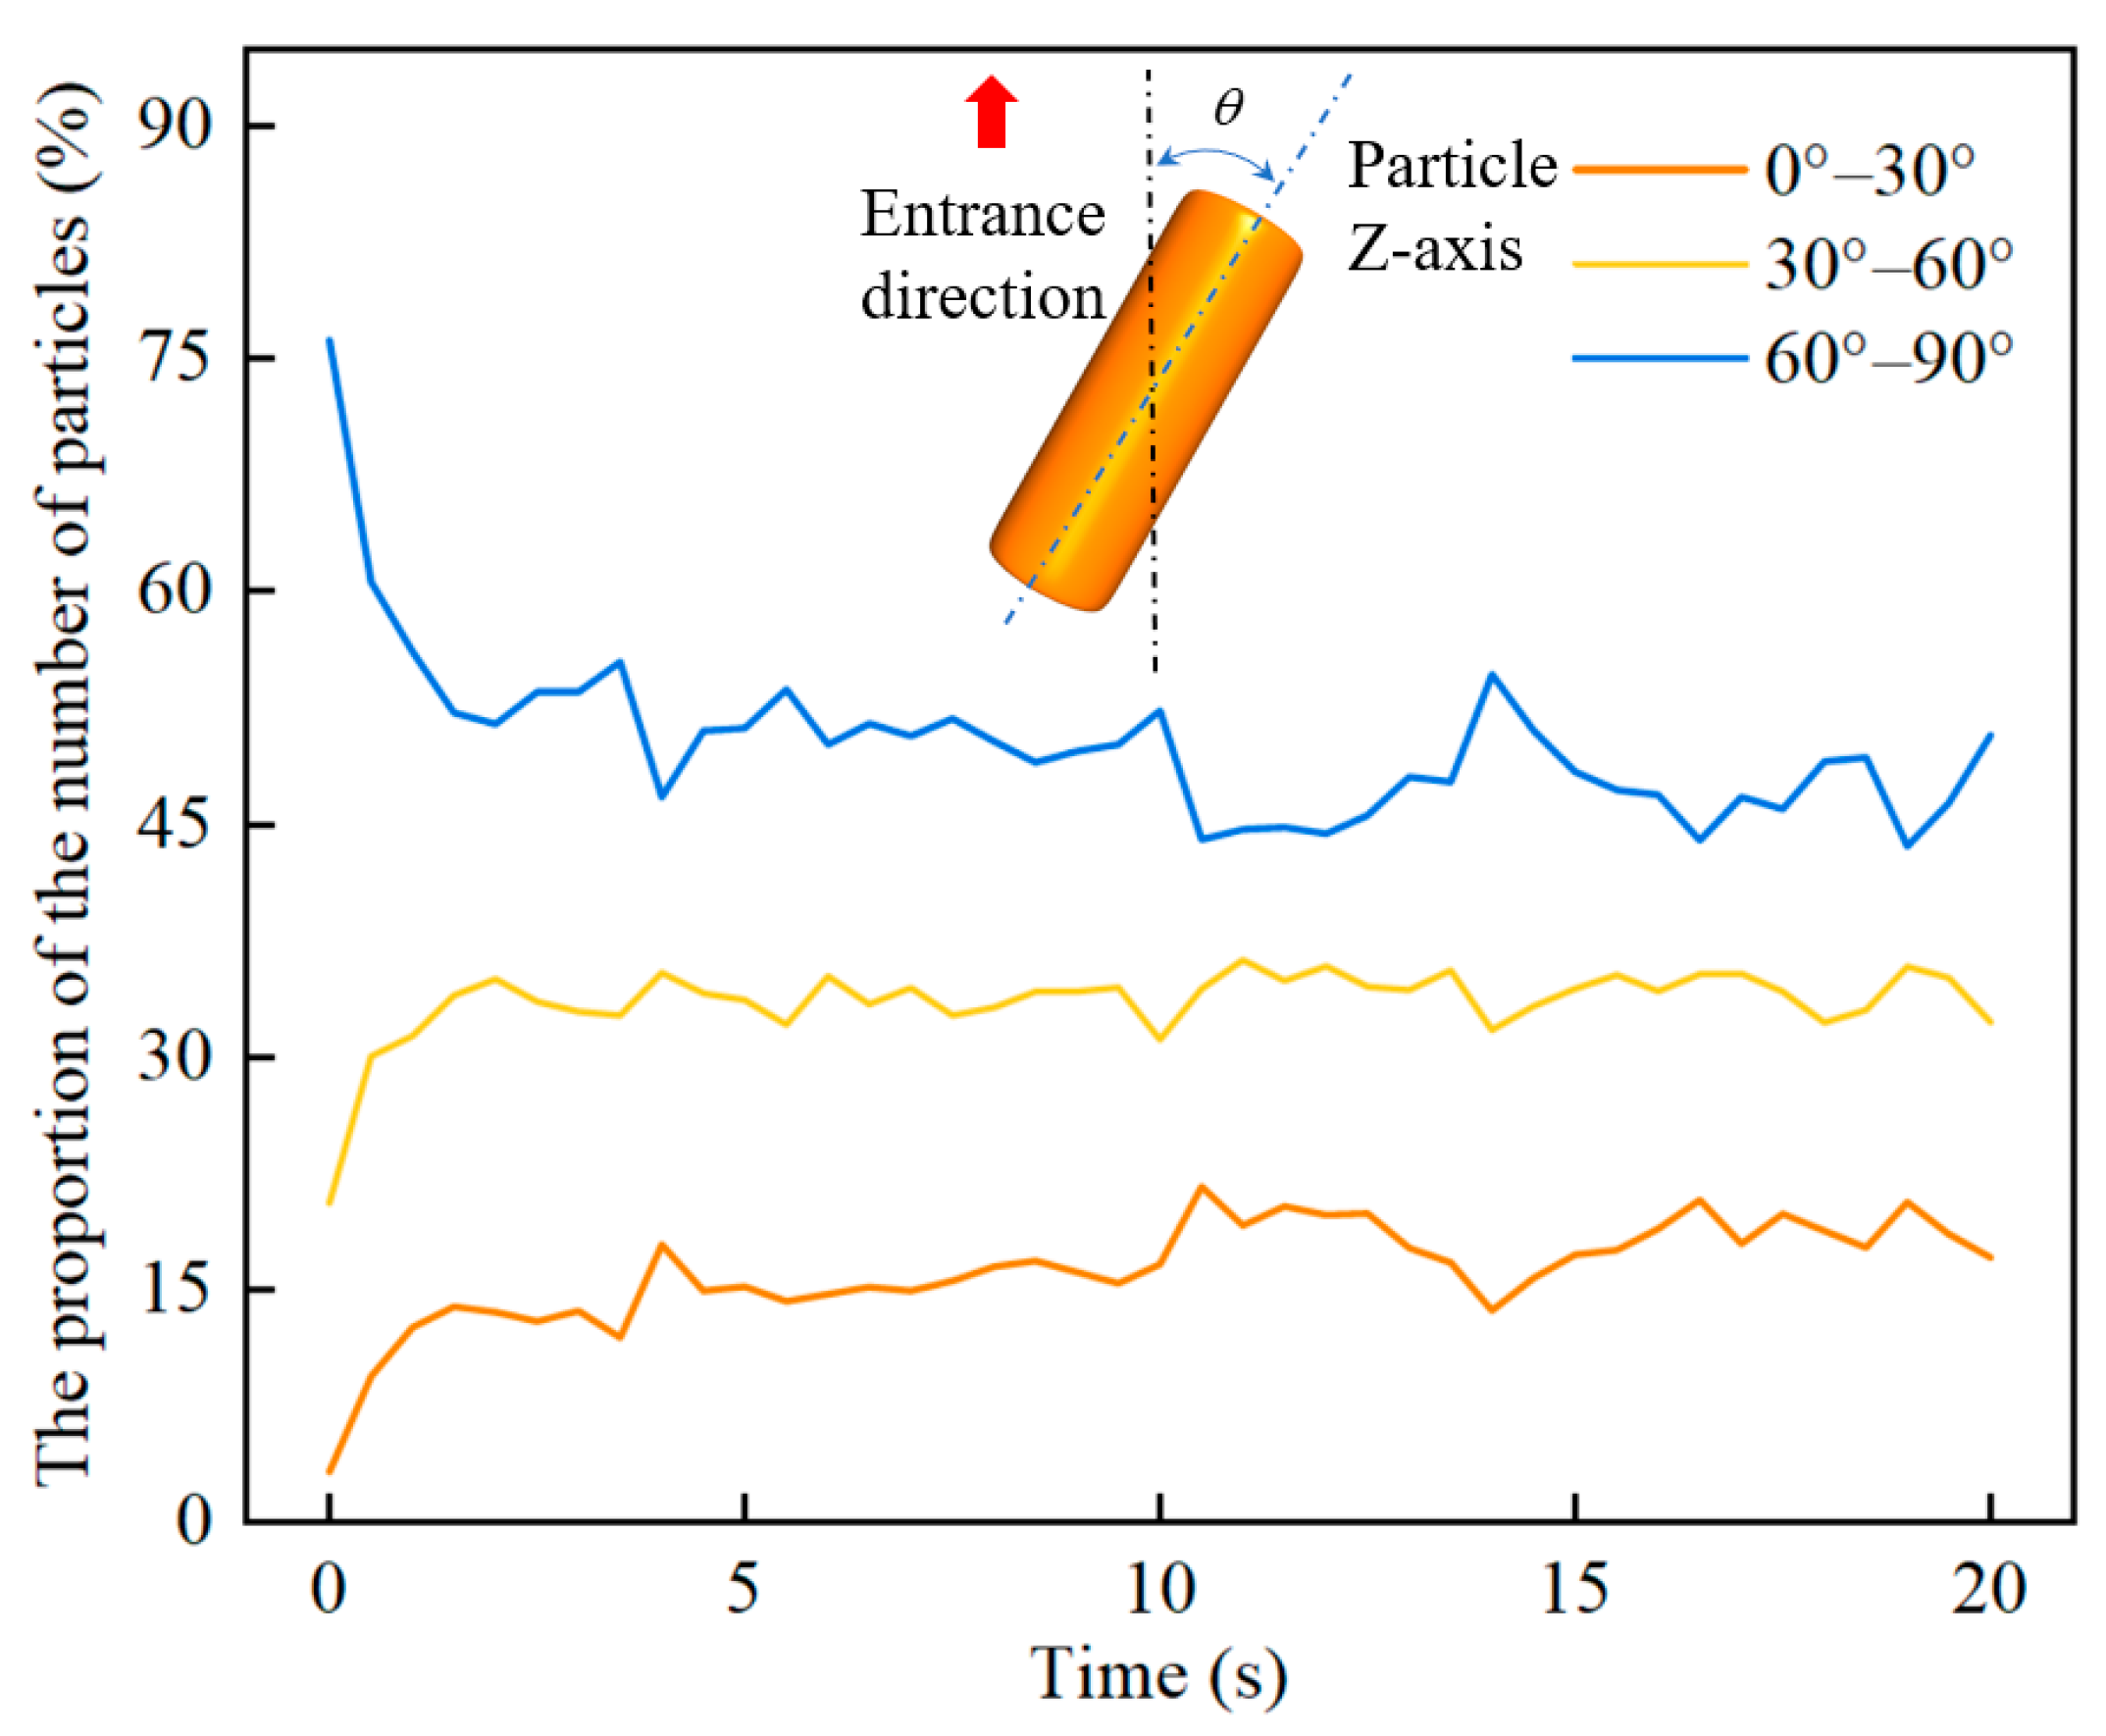
4. Results and Discussion

In this section, we take a cylindrical FB and particles with biomass-like properties as an example. An FB with a diameter of 80 mm and a height of 1500 mm was loaded with 18,000 CBPs. In the DEM part, the bottom boundary was 423.15 K and the sidewalls were adiabatic. The contact parameters of P-P and P-W remained the same. The sidewalls were adiabatic walls without slip. The discretized mesh size was around 10 mm, which was about 3 times the feature size of the particles. Since the minimum fluidization velocity varied with the temperature and density of the gas, we used the specific gas velocity value instead of the dimensionless gas velocity based on minimum fluidization velocity in these cases. Additional simulation settings can be found in Section 3.2. The relevant parameters used in the simulation are listed in Table 3.
The Tp and v evolution of cylindrical particles in the cylindrical fluidized bed is shown in Figure 5. Although the CBPs in the top area had the highest velocities, they did not have the highest temperature. On the contrary, the CBPs located at the bottom of the bed had almost zero velocities but the highest temperature. This was because the Tf at the bottom was higher, providing a greater HT rate to the CBP. When the high-temperature gas flowed through the FB, some of its heat was absorbed by the CBPs in the bottom region, which affected the heat exchange between the CBPs in the top region and the fluid. When the time was 5 s, 10 s, 15 s, and 20 s, the minimum Tp in the FB was 300.8 K, 306 K, 316 K, and 330.6 K, respectively, while the maximum Tp was 385.1 K, 409.4 K, 417.7 K, and 421 K, respectively. However, CBPs with low temperatures could still exchange heat with the fluid carrying a lot of heat, causing the Tp to rise swiftly.
The orientation of CBPs was defined as the angle θ between the Z-axis of the CBP and the entrance direction in this study, which ranged from 0° to 90° due to the geometric symmetry of the CBPs. The temporal evolution of the orientation distribution of CBPs is shown in Figure 6. At the beginning, the proportion of particles with an orientation of 60–90° was 76.2%. The proportion of particles with an orientation of 60–90° decreased by 25.1% within 0 < t < 5 s, while the proportion of particles with an orientation of 0–30° and 30–60° increased by 12% and 13.1% during this period, respectively. Particles with a larger orientation had a larger windward area and drag, which tended to flow in the parallel principal axis direction.
The spatial evolution of average particle temperature in axial and radial directions is shown in Figure 7. The average Tp at the bottom of the bed was the highest, which decreased sharply with the increase in the distance from the bottom of the bed. When the gas velocity was 1.2 m/s, the force of the fluid on the particles could only drive a few particles out from the bottom, and the internal circulation in the FB was not violent. The same conclusion can be drawn from the temperature evolution in Figure 5. The average Tp in the radial direction presented a symmetrical distribution when t = 5 s, which subsequently rose in a wave-like form. When the gas velocity was 1.2 m/s, the movement of particles in the axial direction was not drastic; only a few high-temperature particles were fluidized in the axial direction, while most of the CBPs lacked axial fluidity but had significant circulation flow in the radial direction.

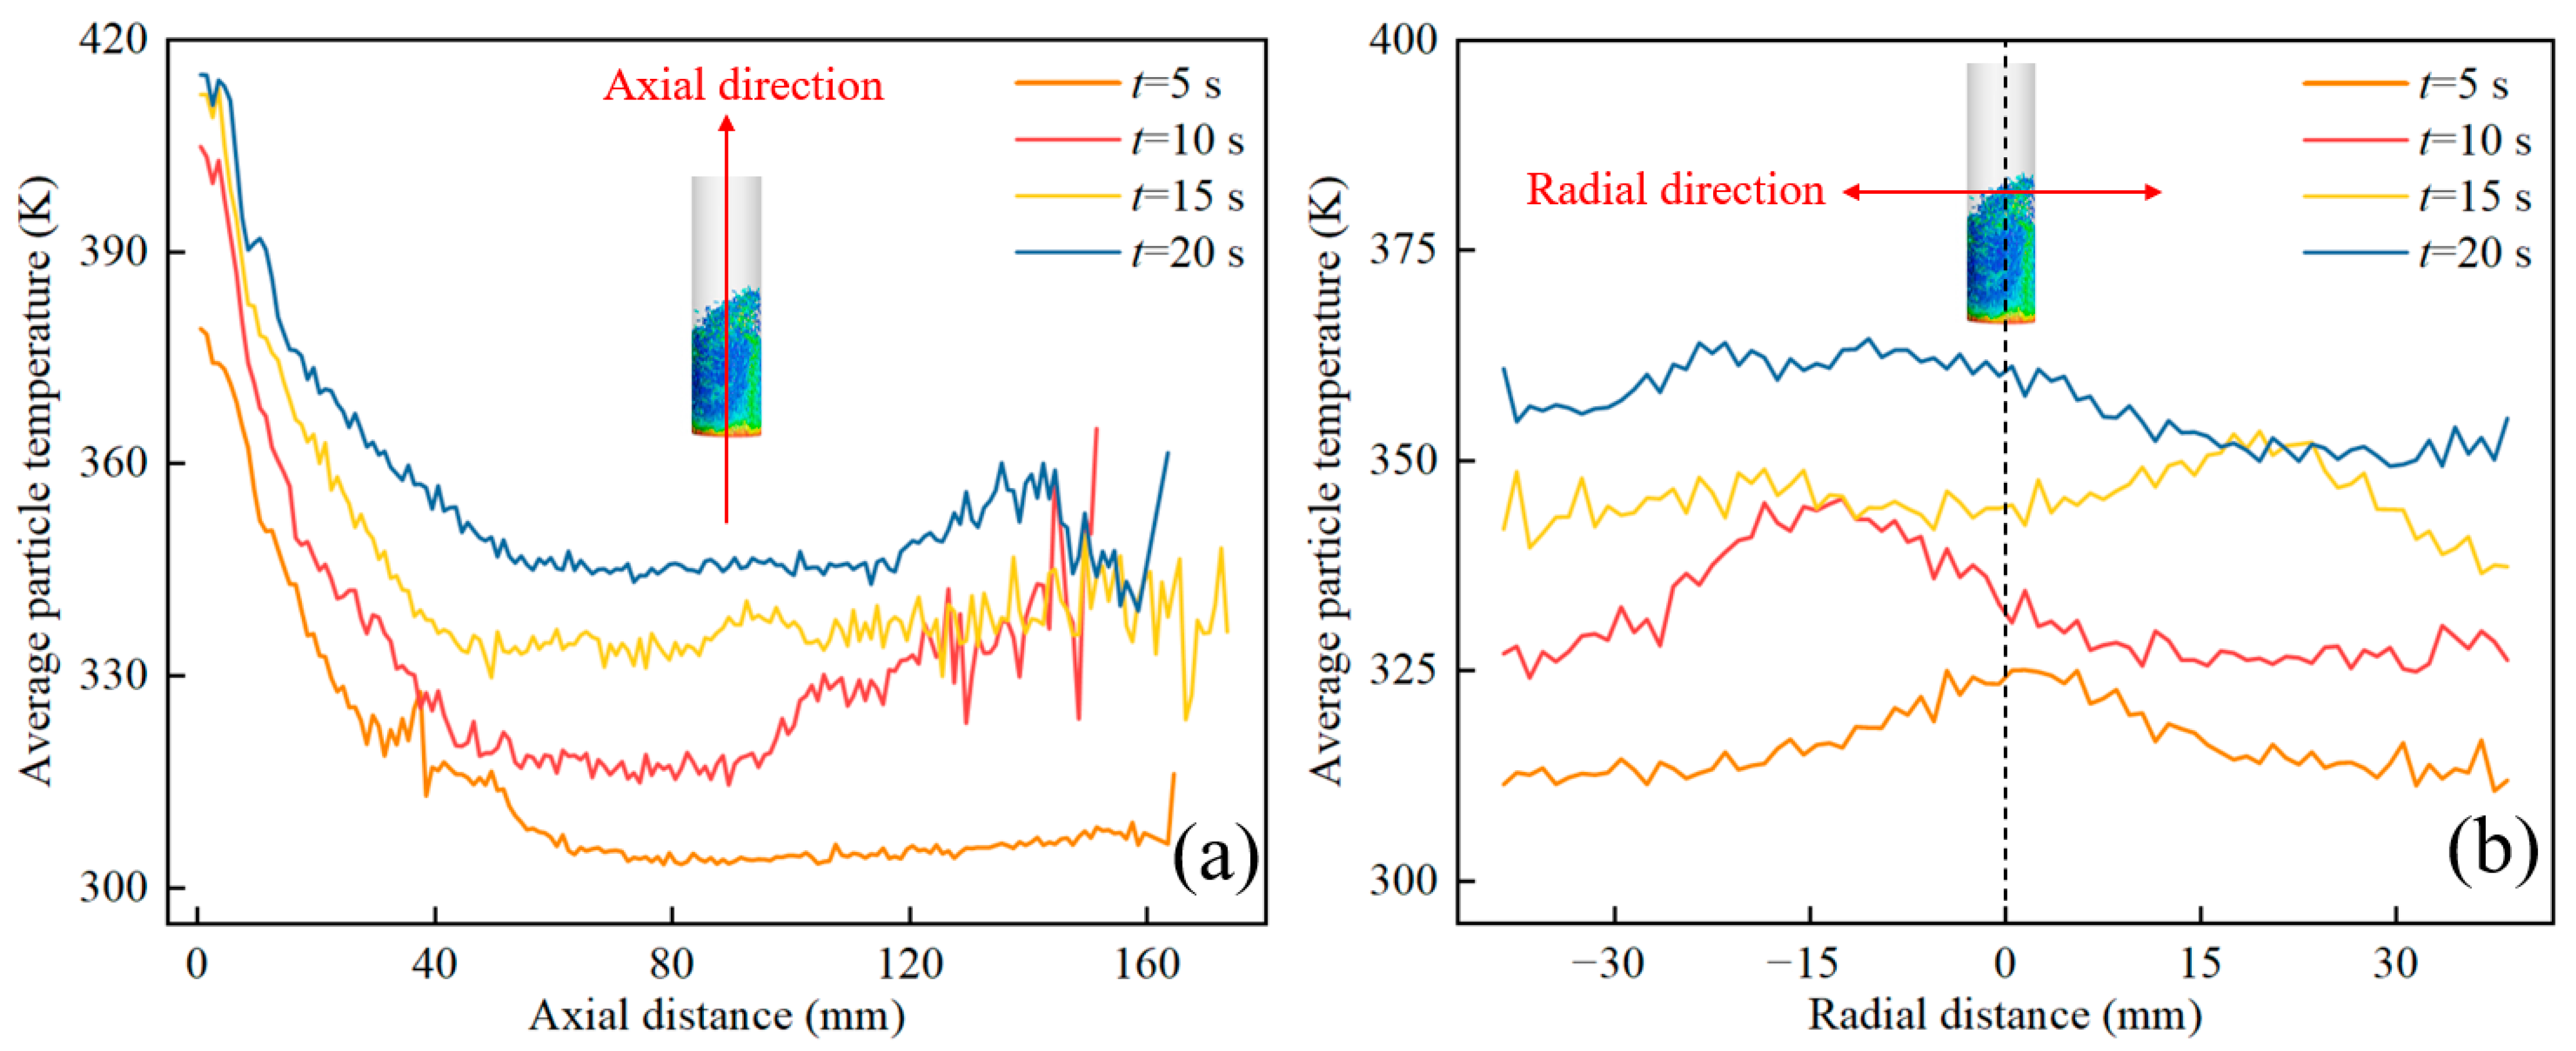
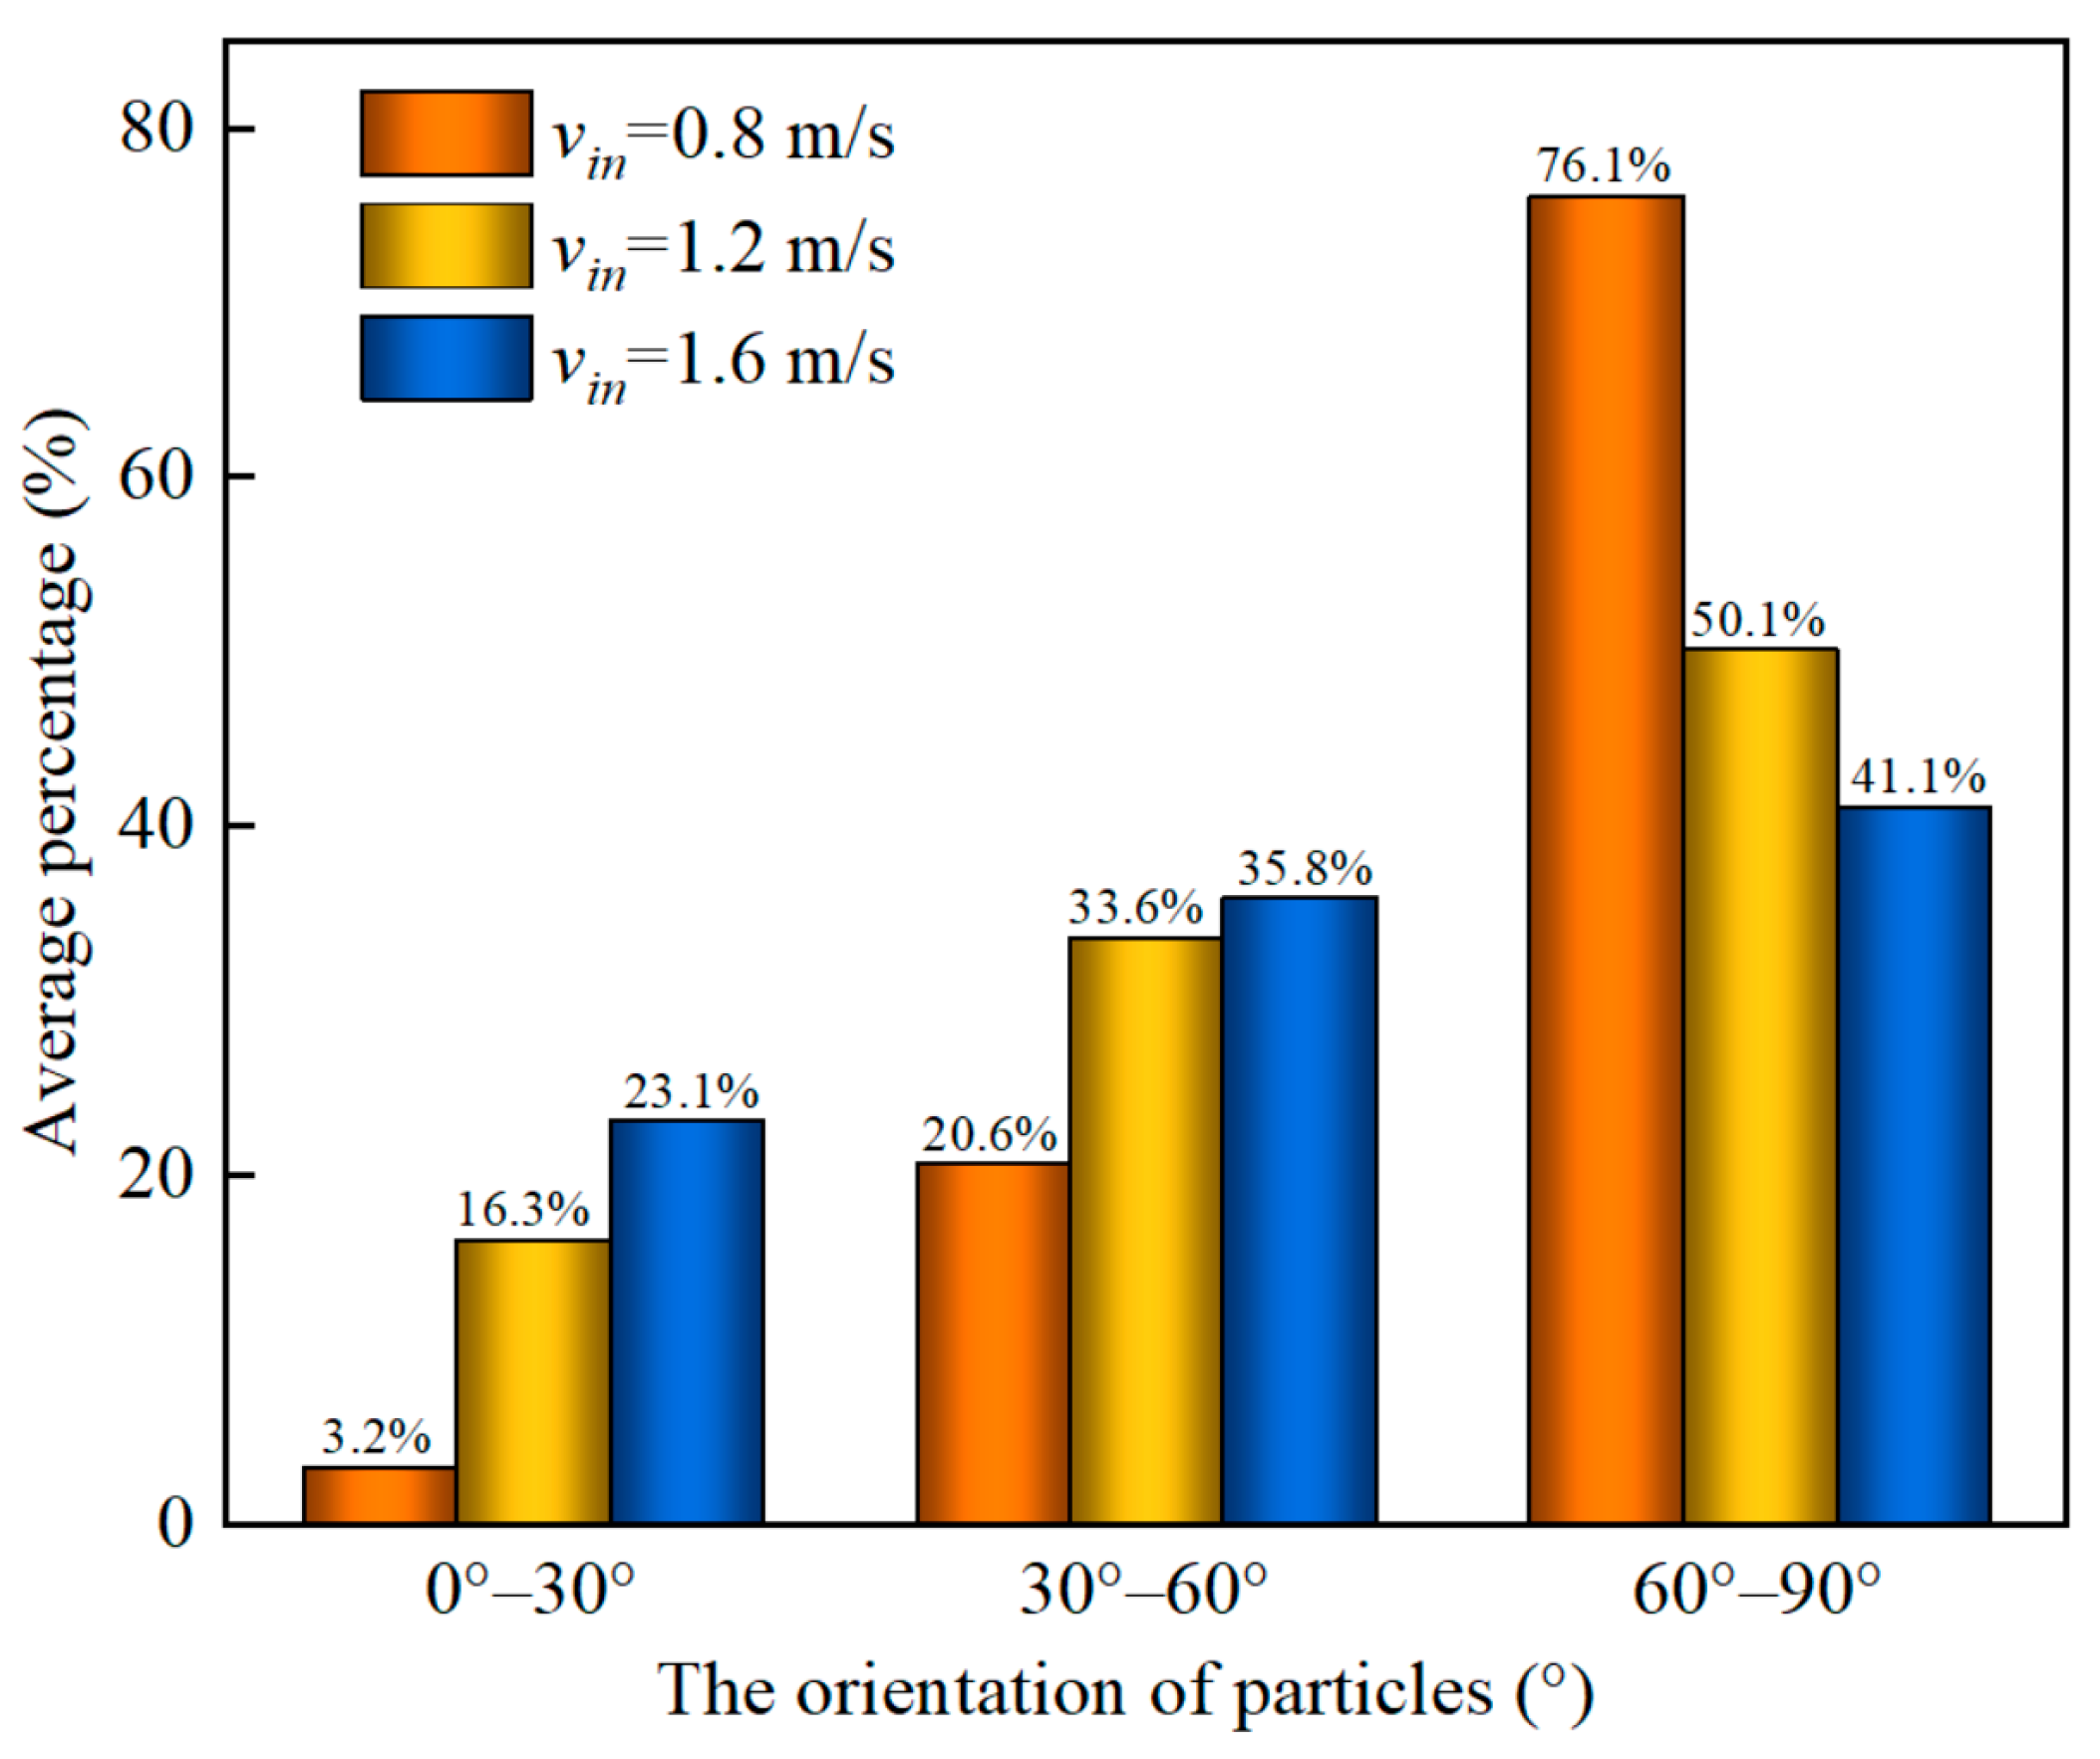
4.1. The Effect of Gas Velocity

The influence of gas velocity on the average Tp is shown in Figure 8a. The increase in the gas velocity enhanced the average particle temperature. The HT of the F-P coefficient was affected by the Nusselt number. As the flow rate of the gas increased, the Nusselt number also increased, which further increased the Nusselt number and eventually led to a growth in the average Tp. The standard deviation of Tp was an important index to measure the uniformity of particles Tp. The evolution of the standard deviation of Tp with gas velocity is shown in Figure 8b. The standard deviation of particle temperature first increased rapidly to reach the maximum values of 28.8 K and 18.7 K at gas velocities of 1.2 m/s and 1.6 m/s, respectively; subsequently, the standard deviation of particle temperature decreased faster with higher gas velocity. At the initial stage of fluidization, the rise in particle temperature in the bottom region was faster, while the heat exchange of particles in the top region was not intense, generating an increase in the nonuniformity of Tp distribution. With the continuous injection of hot gas, hot particles at the bottom of the bed entered the top region, while cold particles above descended to the bottom for heat exchange with hot fluid, thus reducing the uneven temperature distribution across the bed.
The influence of gas velocity on the conductive HT rate is shown in Figure 9a. It should be noted that the conductive HT rate in this work refers to the whole particle system, whereas the conduction between particles is an internal function that is not included; thus, the conductive HT rate was only calculated for wall–particle HT. The gas velocity in the initial fluidization stage had an inverse effect on the heat transfer rate. When the gas velocity was 0.8 m/s, 1.2 m/s, and 1.6 m/s, the maximum conductive HT rate in the whole fluidization process was 23.8 W, 15 W, and 8.2 W, respectively. Under the condition of high gas velocity, the larger interphase force on the CBPs could reduce the contact force and contact area between the bottom particles and the wall surface, bringing about a decrease in the conductive HT rate. In addition, the high temperature of the gas also increased the Tp, which led to a reduction in the temperature difference between the particles and the wall and the conductive HT rate.
The effect of gas velocity on the convective HT rate is shown in Figure 9b. The relationship between gas velocity and convective HT was positive in the early stage of fluidization. The influence of the gas velocity on the fluctuation of convective heat transfer was positive, which was consistent with the effect of gas velocity on the average Tp. High gas velocity made the velocity and axial direction of the particles update more frequently, resulting in a larger convective heat transfer rate. As shown in Figure 9a,b, the convective HT rate was more than 20 times that of the conductive HT rate, indicating that convective HT was the main HT mechanism in the FB.
The convective HT rate of the CBPs was closely related to the orientation; thus, it was necessary to explore the distribution of the orientation of the particles. The influence of gas velocity on the orientation of the CBPs in the whole fluidization process is shown in Figure 10. The increase in gas velocity significantly improved the proportion of CBPs with an orientation in the range of 0–30°. When the gas velocity increased from 0.8 m/s to 1.2 m/s and 1.6 m/s, the proportion of CBPs with an orientation in the range of 0–30° increased by 5.1 and 7.2 times, respectively. CBPs under the action of gravity tended to be more stable in the horizontal direction. In order to make the cylindrical particles vertical, it was necessary to provide enough energy to drive the particles to rotate. However, the low-velocity air carried low kinetic energy that could not effectively contribute to the change in orientation.

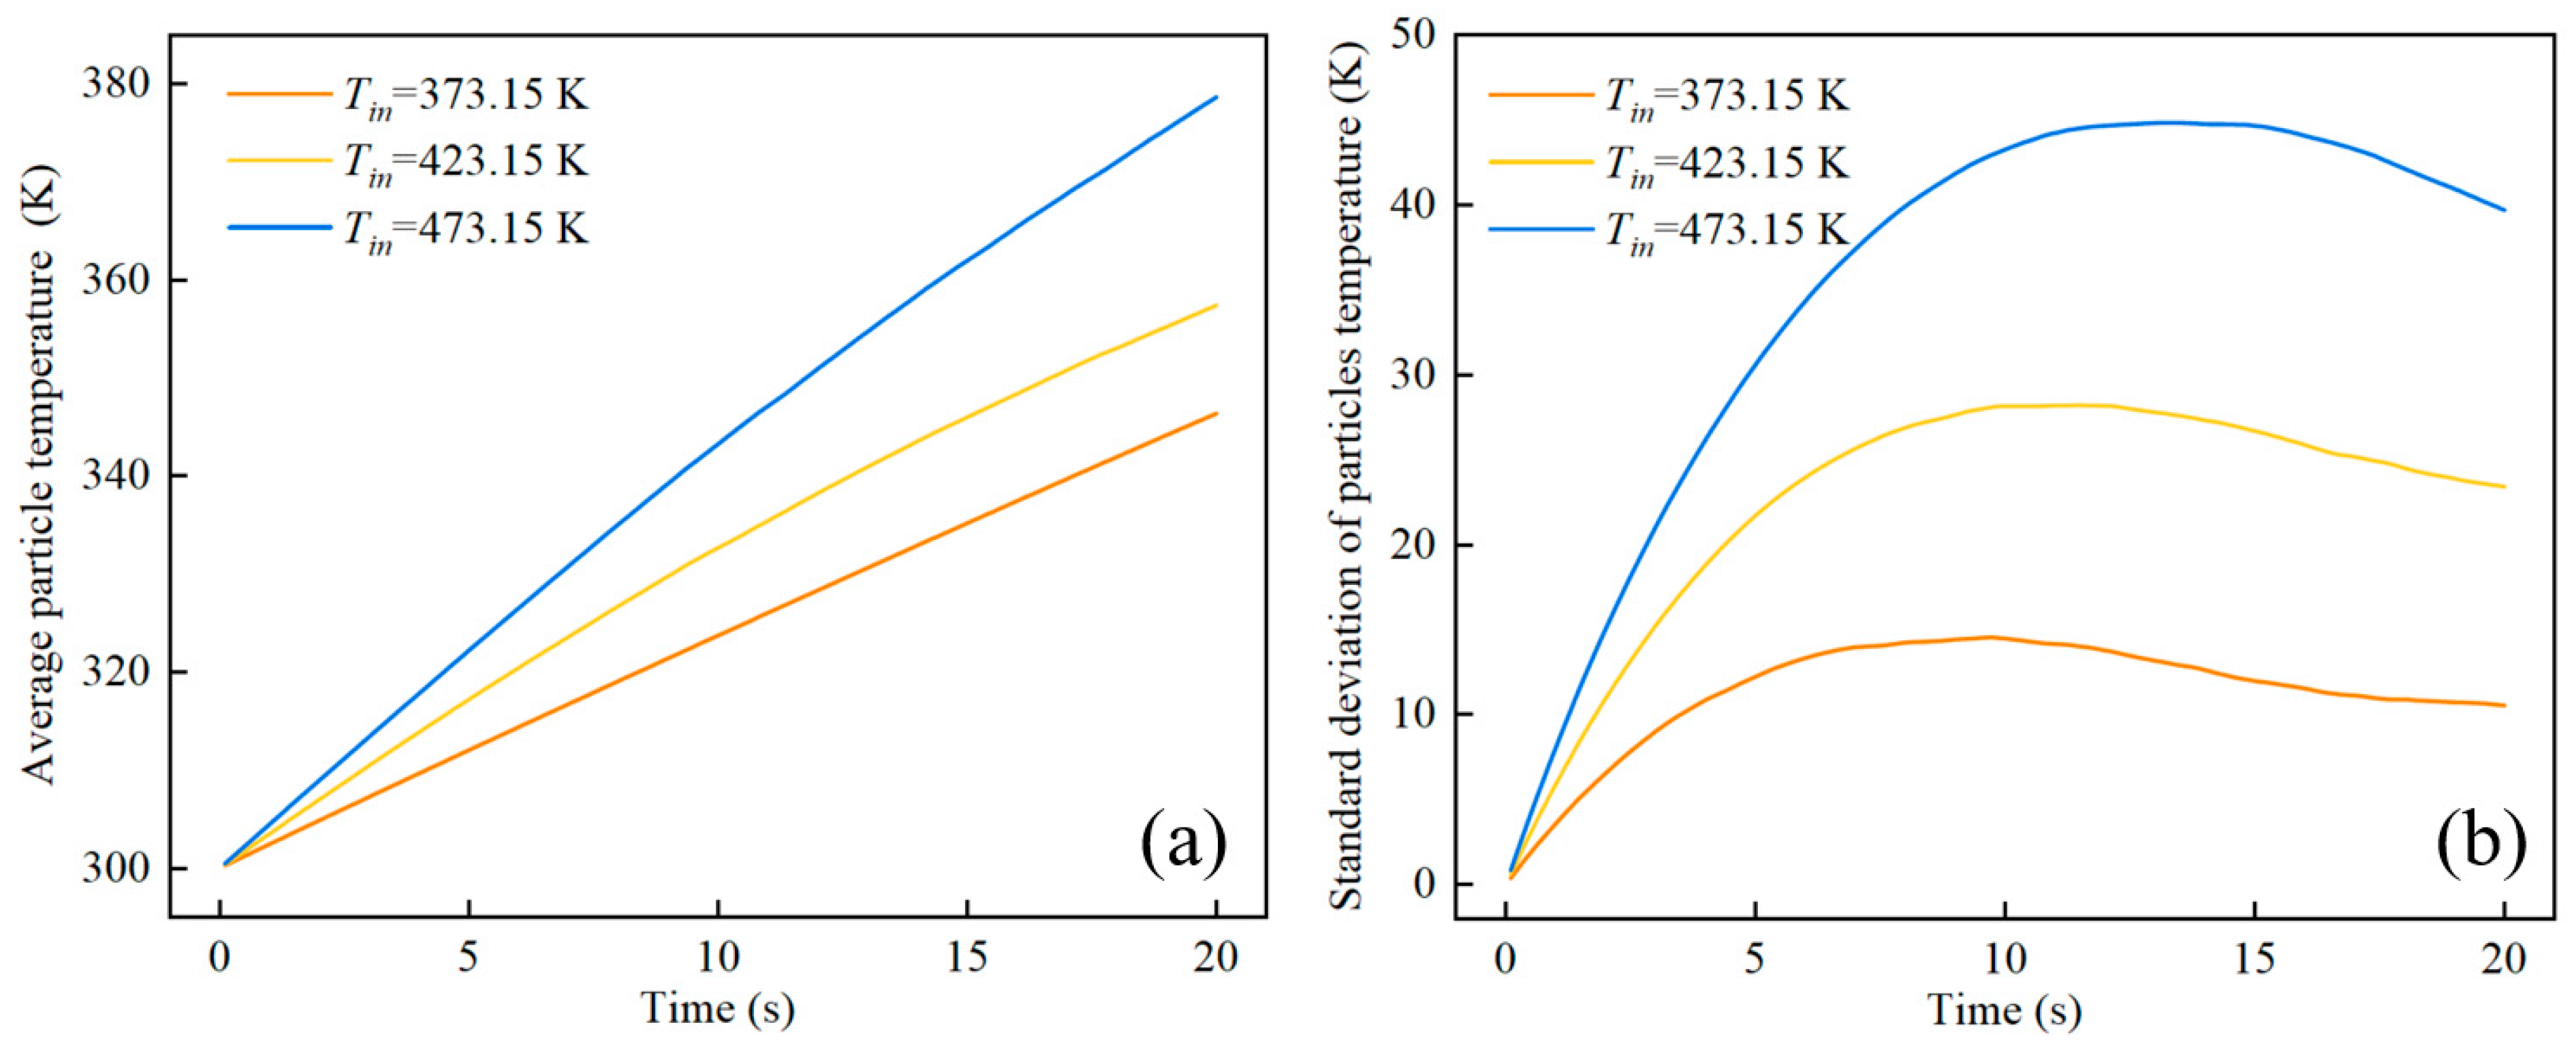
4.2. The Effect of Inlet Temperature

The effect of inlet temperature on the average particle temperature and standard deviation of particle temperature is shown in Figure 11. It can be seen that the inlet temperature had a positive effect on the average particle temperature. When the inlet temperature changed from 373.15 K to 423.15 K and from 423.15 K to 473.15 K, the increment in the average particle temperature caused by the second change was about 1.92 times that of the first change. An increase in the inlet temperature caused a change in the density and thermodynamic properties of the air, which greatly enhanced the heat transfer between the gas and the particles, causing the average particle temperature to rise faster.
It can be seen from Figure 11b that an increase in inlet temperature increased the standard deviation of particle temperature over 0–20 s. When the inlet temperature was 373.15 K, 423.15 K, and 473.15 K, the maximum standard deviation of particle temperature was 14.53 K, 28.18 K, and 44.81 K, corresponding to the time of 9.1 s, 11.4 s, and 13.4 s, respectively. The inlet temperature increased the maximum standard deviation of particle temperature and prolonged its occurrence time. In the long term, the inlet temperature promoted temperature uniformity.
The influence of inlet temperature on heat transfer rate is shown in Figure 12. The increase in inlet temperature was beneficial to conductive and convective HT. The conductive HT rate at different inlet temperatures eventually fluctuated around a small value close to 0, which may have been due to the temperature of the bottom particles rising to a higher level in the fluidization process and the small temperature difference between the CBPs and the wall limiting conductive HT. The convective HT rate increased with increasing inlet temperature. It can be seen from Equation (19) that when the gas temperature increased, the convective HT rate also increased.
The effect of inlet temperatures on the orientation of particles in the whole fluidization process is shown in Figure 13. The increase in inlet temperature led to a decrease in the proportion of particles with an orientation in the range of 0–30°. When the inlet temperature increased from 373.15 K to 423.15 K and 473.15 K, the average proportion of particles with an orientation in the range of 0–30° decreased to 0.84 and 0.73 times in the whole fluidization process, respectively. This was because an increase in inlet temperature reduced the density of the air and increased the viscosity of the air, resulting in a decrease in the Reynolds number in the FB, which reduced the force of the fluid on the particles and weakened its influence on the orientation of the particles. When the inlet temperature increased, the orientation of the non-spherical particles changed and the windward area of the non-spherical particles was raised. Non-spherical particles had convective heat transfer under the dual action of the Nusselt number and thermodynamic properties of the fluid, which was significantly different from the spherical particles.

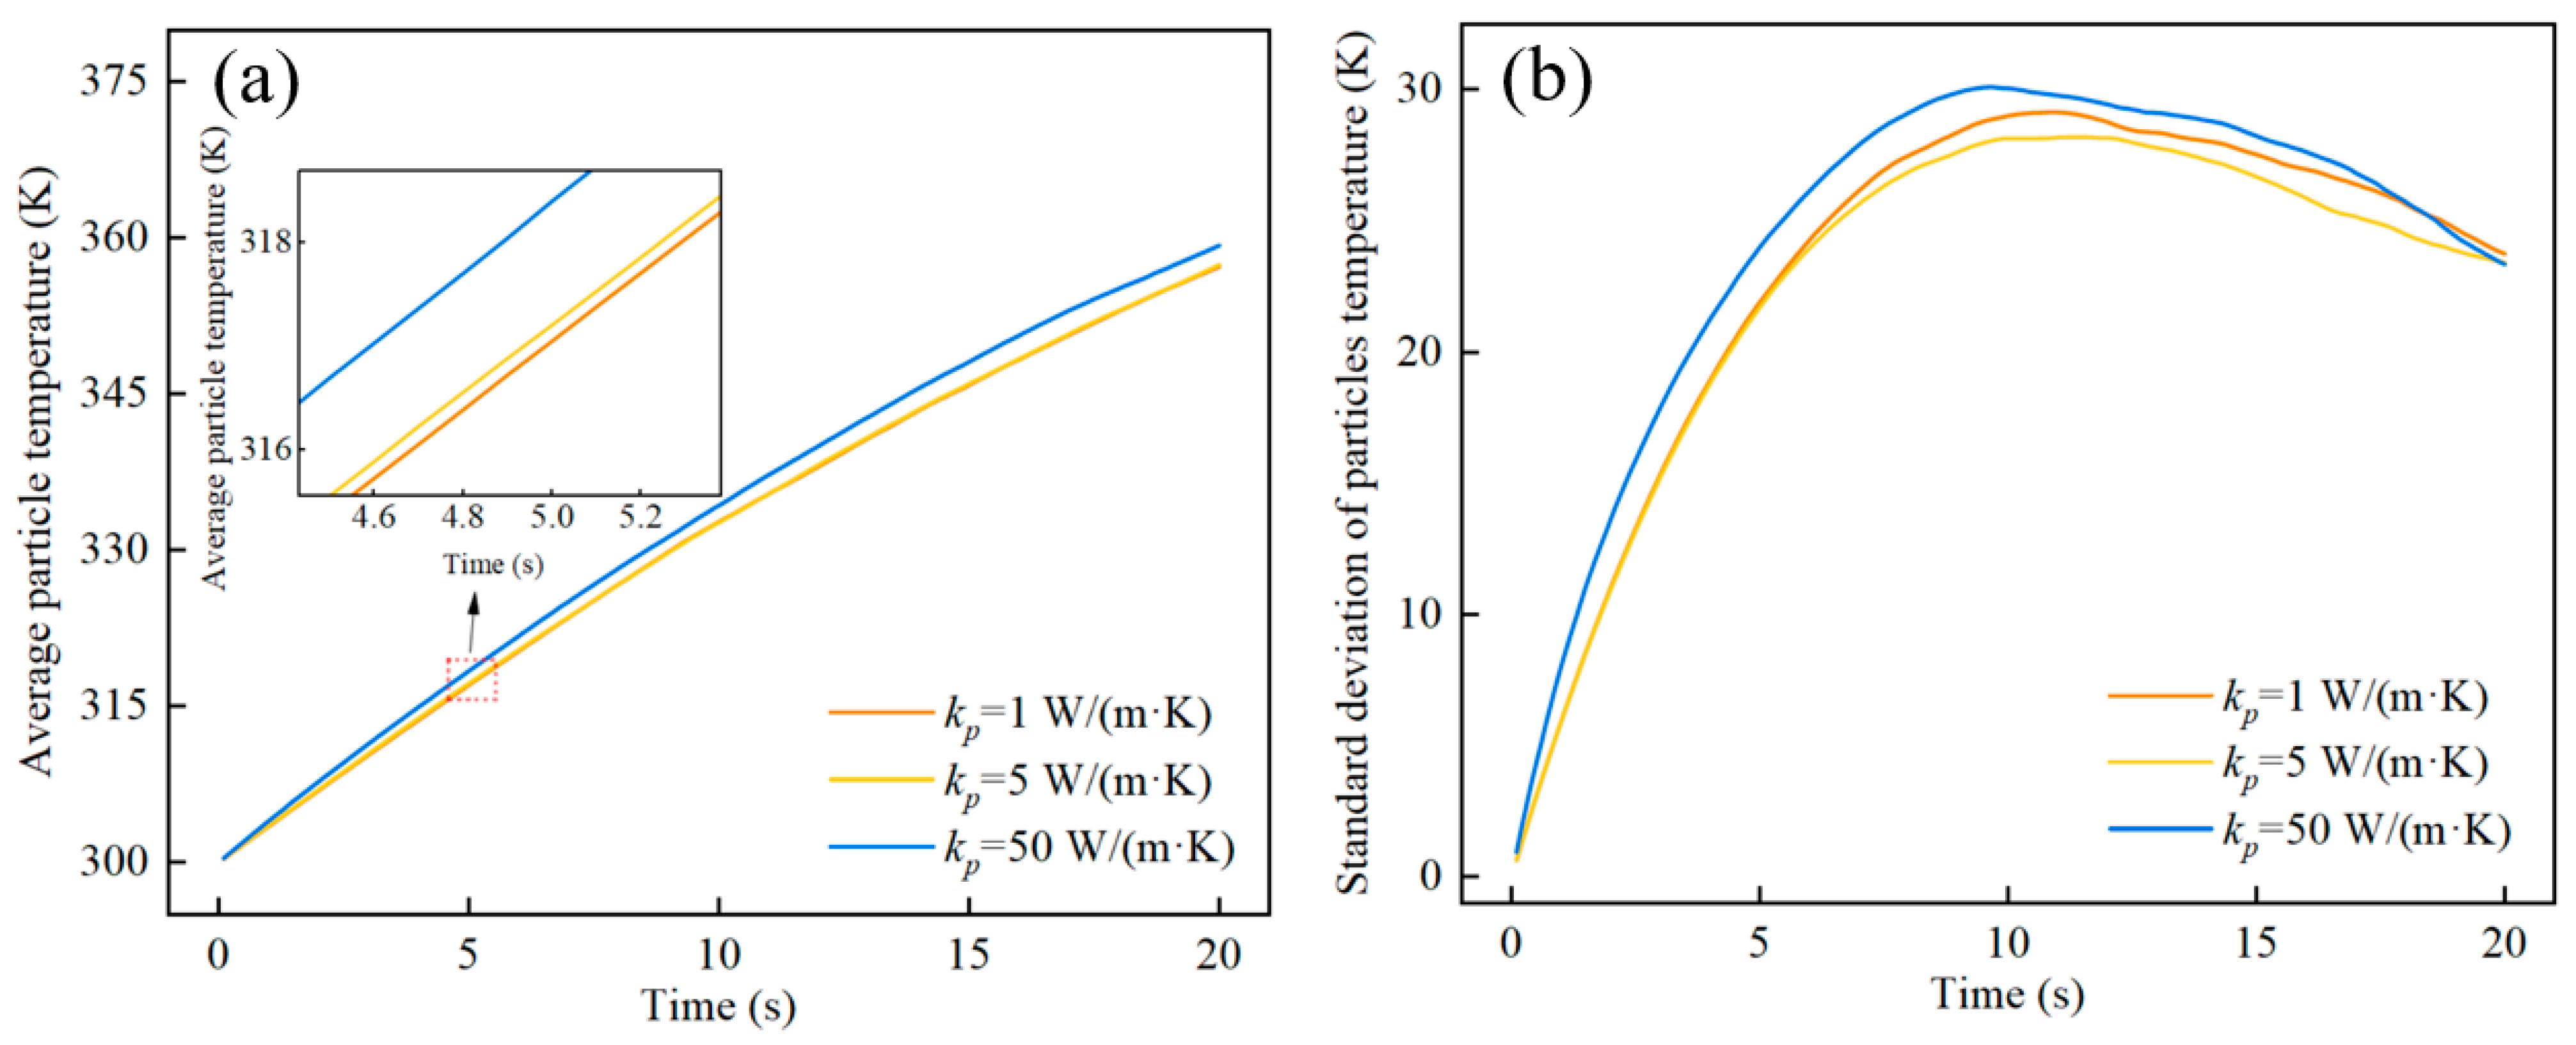
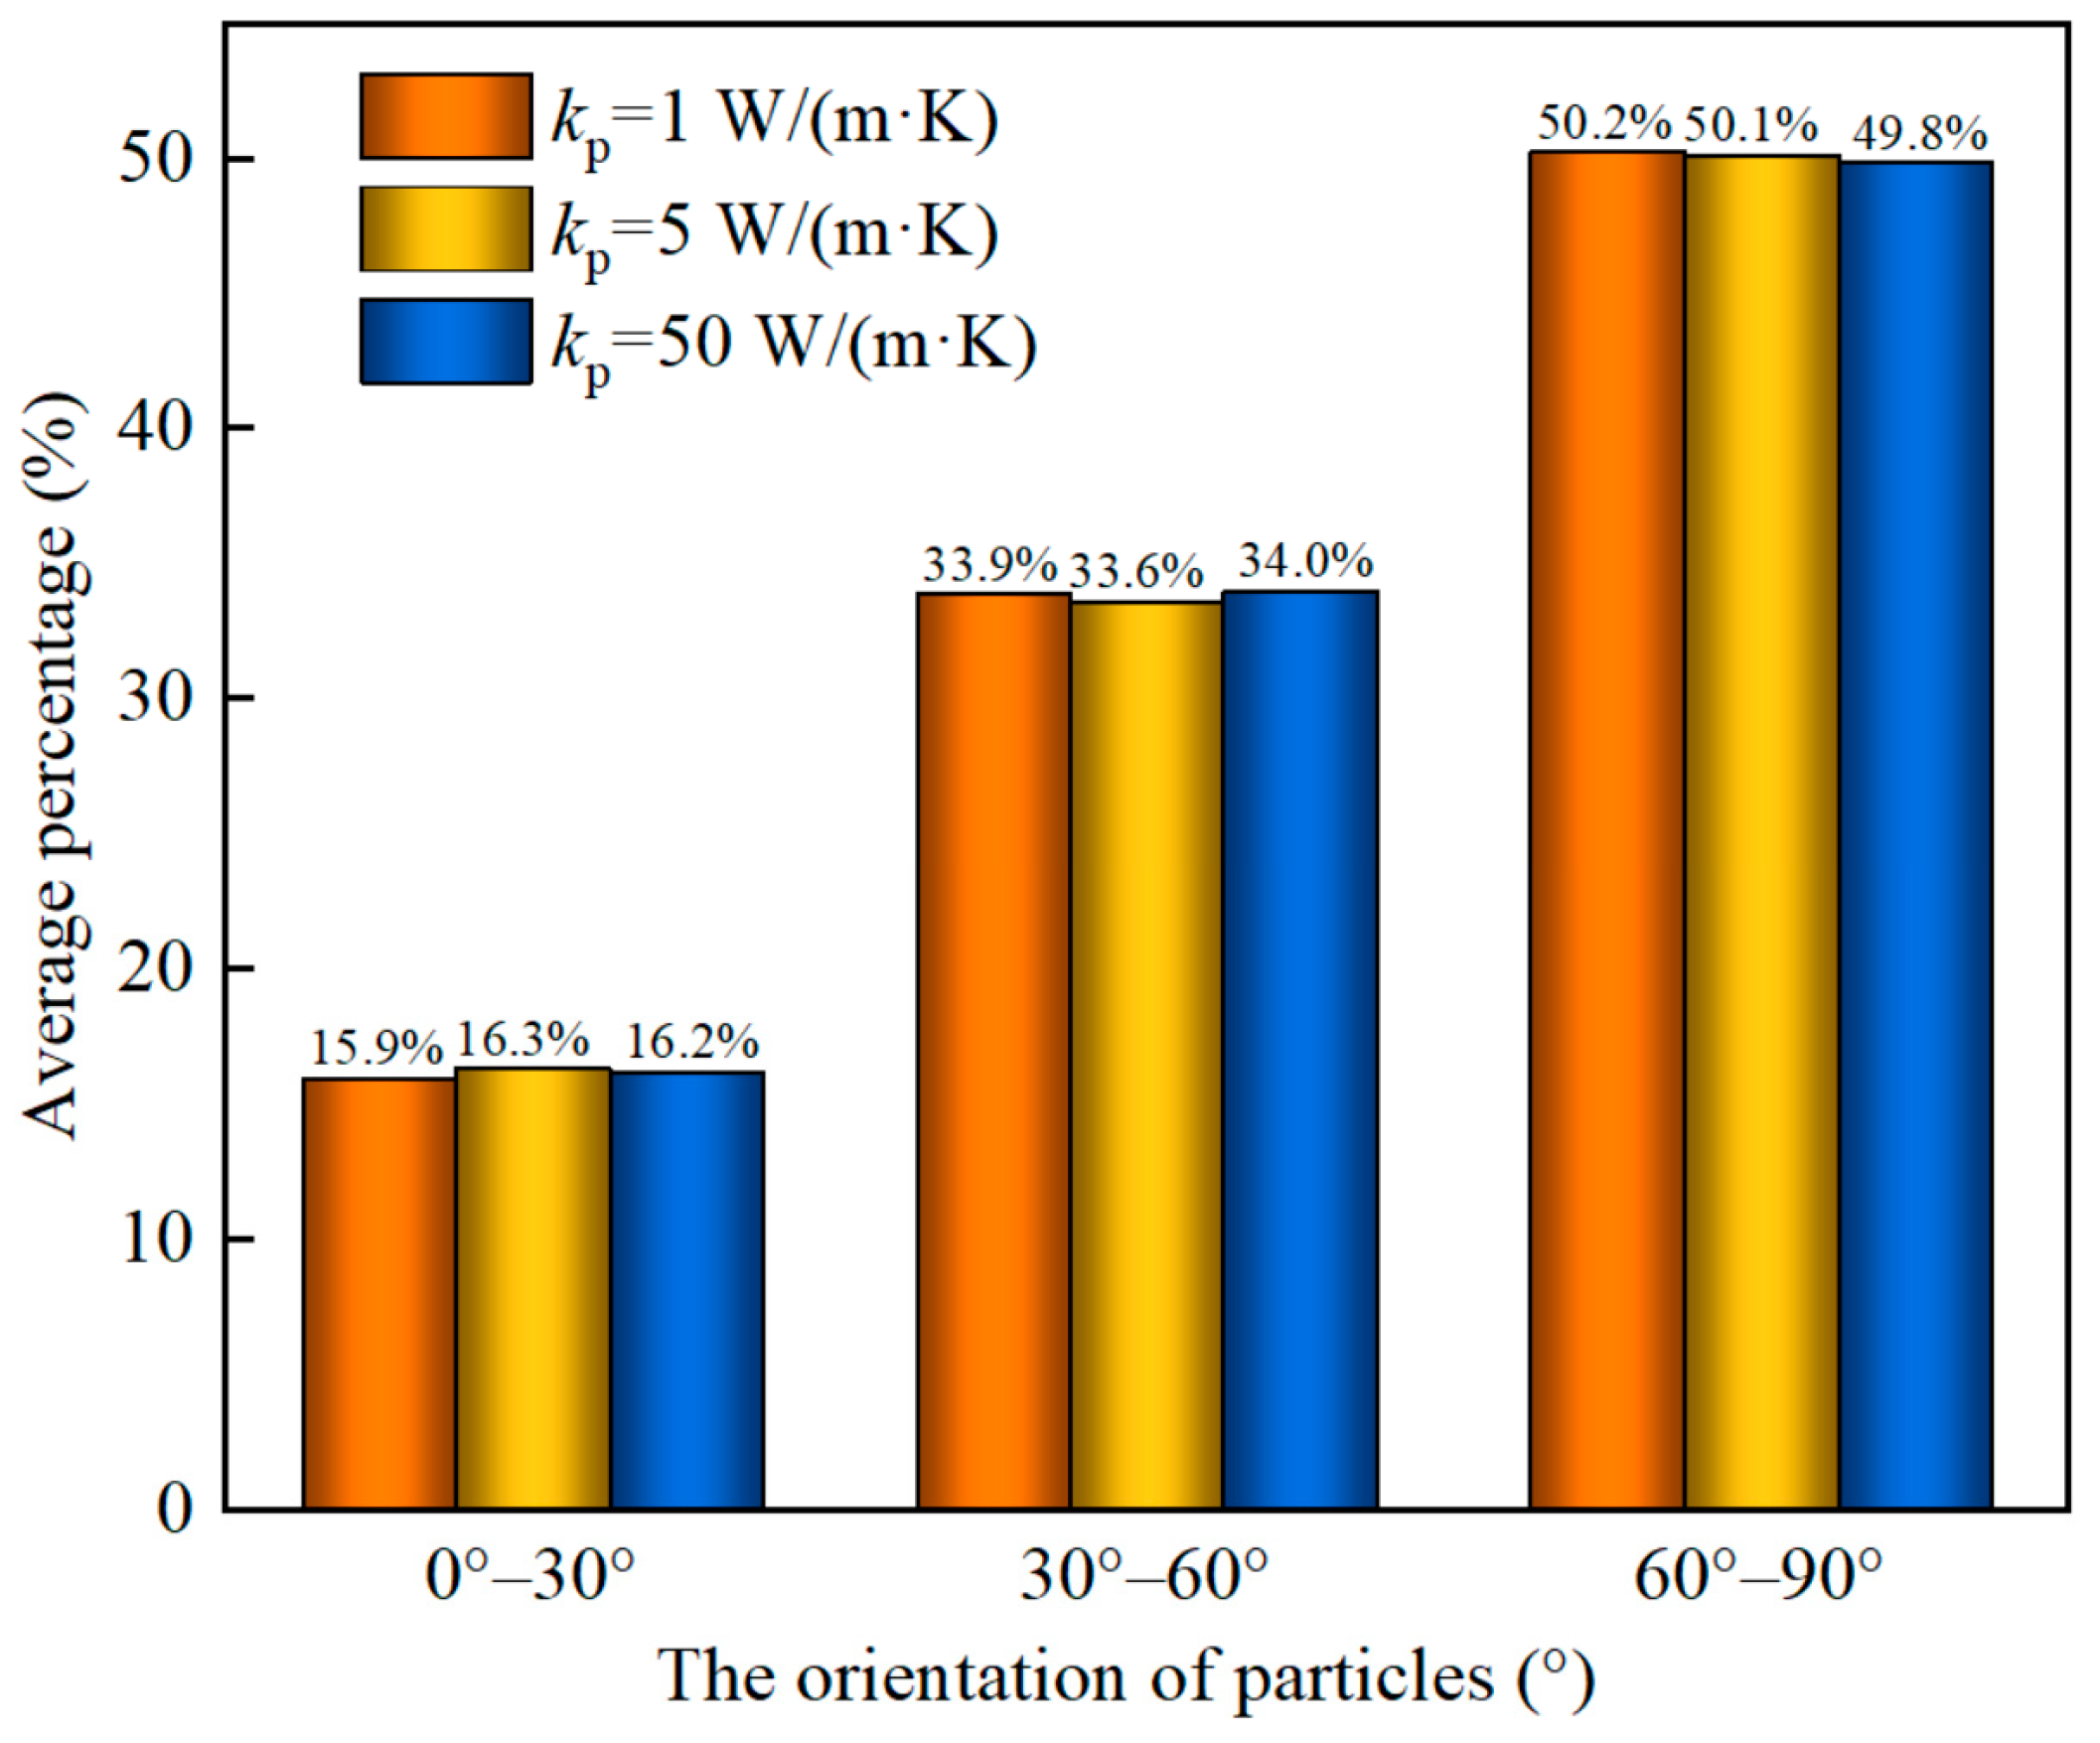
4.3. The Effect of the Thermal Conductivity of Particles

The influence of the kp on the evolution of Tp is shown in Figure 14. When the kp increased from 1 W/(m·K) to 5 W/(m·K), the average Tp was basically the same. When the kp increased from 5 W/(m·K) to 50 W/(m·K), the average Tp increased by about 1.8 K at 20 s. Due to the small contact area of the P-P, the amount of HT after this accumulation was still a small value, although there were many collisions between the particles and the wall. The kp was not conducive to temperature uniformity in the early stage of fluidization. The kp contributed to the temperature uniformity of the bed in the long term, but these effects were relatively limited.
Figure 15 shows the influence of the kp on the HT rate. The kp was positively correlated with the conductive HT rate. It can be seen from Figure 15b that the kp had no significant influence on the convective HT rate. Although the change in the kp caused a change in the conductive HT rate, the contribution to the Tp was small, and the temperature difference between the fluid and the particles did not change significantly. Therefore, the kp had no significant effect on the convective HT rate. Comparing the two figures shows that although the HT rate provided by the high thermal conductivity was significantly improved, the maximum convective HT rate was still 5.1 times the maximum conductive HT rate. In addition, the decay of the conductive HT rate with time was significantly faster than that of the convective HT rate, which again suggests that the main HT mechanism in a low-temperature FB is convective.
The influence of kp on the orientation of particles in the whole fluidization process is shown in Figure 16. Although the kp changed by a factor of 5 or 10, it had little effect on the orientation of the particles. However, there was an extremely small fluctuation in the orientation distribution of the particles, which may have been due to the change in the Tp caused by the change in the thermal conductivity. The Tp altered the temperature and density of the surrounding air, which affected the motion of the particles themselves.

5. Conclusions

This work developed a cylindrical particle heat transfer model within the framework of CFD-DEM that contained multiple HT mechanisms, including F-P, P-P, and P-W. Infrared camera technology was used to measure the particle temperature in the experiment. The correctness of the model was verified by comparing the results of the experiment and simulation. Based on this model, the effects of the gas velocity, inlet temperature, and thermal conductivity of the particles on the bed temperature, HT rate, and the orientation of the particles were analyzed. From this study, the following conclusions were obtained:
1. The convective HT coefficient and the average particle temperature can be significantly increased by gas velocity. Gas velocity is beneficial to the uniformity of particle temperature distribution, which can significantly shorten the variation process of bed temperature uniformity.
2. The inlet temperature is favorable for the increase in bed temperature and can also significantly elevate the convective heat transfer rate. From a long-term perspective, the inlet temperature can improve the bed temperature uniformity.
3. The thermal conductivity of particles has no distinct influence on the bed temperature and convective HT rate, which can have an active effect on the conductive heat transfer rate, but this effect contributes little to the total heat transfer rate.
4. The gas velocity can obviously change the orientation of the particles, but the thermal conductivity of the particles has no significant influence on the orientation of the particles. When the inlet temperature increased from 373.15 K to 473.15 K, the proportion of particles with an orientation in the range of 60–90° increased from 46.2% to 52.4%.
There are works to be conducted on the fluidization HT of cylindrical particles based on the CFD-DEM. For example, the effects of lift, particle frictional heat transfer, or more complex thermal radiation should be considered. In conclusion, the current CFD-DEM provides an effective framework to study the HT of cylindrical particles, which is of great significance for a deep understanding of fluidization and HT in FBs.

Author Contributions

Conceptualization, L.C.; methodology, Z.L.; software, Y.H.; validation, H.M.; formal analysis, L.C. and H.M.; data curation, L.Z.; writing—original draft preparation, Y.H.; visualization, Z.L.; supervision, L.Z. and Y.Z.; funding acquisition, Y.Z. All authors have read and agreed to the published version of the manuscript.

Funding

This research was funded by the National Natural Science Foundation of China (No. 22078283).

Data Availability Statement

The authors confirm that the data supporting the findings of this study are available within the article.

Acknowledgments

Thanks to Chen Weilin from the Hong Kong Polytechnic University.

Conflicts of Interest

The authors declare no conflict of interest.

References

  1. Zhou, L.; Ma, H.; Liu, Z.; Zhao, Y. Development and verification of coarse-grain CFD-DEM for nonspherical particles in a gas–solid fluidized bed. AIChE J. 2022, 68, e17876. [Google Scholar] [CrossRef]
  2. Kong, D.; Luo, K.; Wang, S.; Yu, J.; Fan, J. Particle behaviours of biomass gasification in a bubbling fluidized bed. Chem. Eng. J. 2022, 428, 131847. [Google Scholar] [CrossRef]
  3. Hou, Q.F.; Zhou, Z.Y.; Yu, A.B. Gas–solid flow and heat transfer in fluidized beds with tubes: Effects of material properties and tube array settings. Powder Technol. 2016, 296, 59–71. [Google Scholar] [CrossRef]
  4. Boer, L.; Buist, K.A.; Deen, N.G.; Padding, J.T.; Kuipers, J.A.M. Experimental study on orientation and de-mixing phenomena of elongated particles in gas-fluidized beds. Powder Technol. 2018, 329, 332–344. [Google Scholar] [CrossRef]
  5. Wu, K.; Dai, L.; Li, B.; Gu, C.; Yuan, Z.; Luo, D. Study on flow characteristics of dilute phase flexible ribbon particles in a fluidised bed riser using particle tracking velocimetry. Chem. Eng. Res. Des. 2019, 152, 254–268. [Google Scholar] [CrossRef]
  6. Buist, K.A.; Jayaprakash, P.; Kuipers, J.A.M.; Deen, N.G.; Padding, J.T. Magnetic particle tracking for nonspherical particles in a cylindrical fluidized bed. AIChE J. 2017, 63, 5335–5342. [Google Scholar] [CrossRef]
  7. Li, Z.; Janssen, T.C.E.; Buist, K.A.; Deen, N.G.; van Sint Annaland, M.; Kuipers, J.A.M. Experimental and simulation study of heat transfer in fluidized beds with heat production. Chem. Eng. J. 2017, 317, 242–257. [Google Scholar] [CrossRef]
  8. Patil, A.V.; Peters, E.A.J.F.; Kuipers, J.A.M. Comparison of CFD-DEM heat transfer simulations with infrared/visual measurements. Chem. Eng. J. 2015, 277, 388–401. [Google Scholar] [CrossRef]
  9. Yu, Y.; Lu, F.; Bai, H.; Wei, F.; Zhang, C. Effect of fines addition on heat transfer performance in gas-solid fluidized bed: An integrated experimental, simulation, and theoretical study. Chem. Eng. J. 2023, 476, 146806. [Google Scholar] [CrossRef]
  10. Tsuji, Y.; Kawaguchi, T.; Tanaka, T. Discrete particle simulation of two-dimensional fluidized bed. Powder Technol. 1993, 77, 79–87. [Google Scholar] [CrossRef]
  11. Kang, Z.; Su, F.; Fang, L.; Zhu, H. DEM-CFD coupled simulation of limestone calcination and fuel combustion in beam type lime shaft kiln. Appl. Therm. Eng. 2023, 231, 120935. [Google Scholar] [CrossRef]
  12. Kong, R.; Bi, D.; Yao, D.; Zhang, Y.; He, J.; Liu, J. CFD-DEM study of a V-shaped Down-tube pyrolysis Reactor: Flow and heat transfer between heat carrier and biomass. Appl. Therm. Eng. 2022, 207, 118179. [Google Scholar] [CrossRef]
  13. Lu, W.; Ma, C.; Liu, D.; Zhao, Y.; Ke, X.; Zhou, T. A comprehensive heat transfer prediction model for tubular moving bed heat exchangers using CFD-DEM: Validation and sensitivity analysis. Appl. Therm. Eng. 2024, 247, 123072. [Google Scholar] [CrossRef]
  14. Oyedeji, O.A.; Pecha, M.B.; Finney, C.E.A.; Peterson, C.A.; Smith, R.G.; Mills, Z.G.; Gao, X.; Shahnam, M.; Rogers, W.A.; Ciesielski, P.N.; et al. CFD–DEM modeling of autothermal pyrolysis of corn stover with a coupled particle- and reactor-scale framework. Chem. Eng. J. 2022, 446, 136920. [Google Scholar] [CrossRef]
  15. Wang, S.; Luo, K.; Fan, J. CFD-DEM coupled with thermochemical sub-models for biomass gasification: Validation and sensitivity analysis. Chem. Eng. Sci. 2020, 217, 115550. [Google Scholar] [CrossRef]
  16. Ostermeier, P.; Fischer, F.; Fendt, S.; DeYoung, S.; Spliethoff, H. Coarse-grained CFD-DEM simulation of biomass gasification in a fluidized bed reactor. Fuel 2019, 255, 115790. [Google Scholar] [CrossRef]
  17. Wang, S.; Shen, Y. CFD-DEM study of biomass gasification in a fluidized bed reactor: Effects of key operating parameters. Renew. Energy 2020, 159, 1146–1164. [Google Scholar] [CrossRef]
  18. Lian, G.; Zhong, W. Coupling CFD-DEM with cohesive force and chemical reaction sub-models for biomass combustion in a fluidized bed. Fuel 2023, 350, 128858. [Google Scholar] [CrossRef]
  19. Mohseni, M.; Peters, B.; Baniasadi, M. Conversion analysis of a cylindrical biomass particle with a DEM-CFD coupling approach. Case Stud. Therm. Eng. 2017, 10, 343–356. [Google Scholar] [CrossRef]
  20. Lu, L.; Gao, X.; Shahnam, M.; Rogers, W.A. Simulations of biomass pyrolysis using glued-sphere CFD-DEM with 3-D intra-particle models. Chem. Eng. J. 2021, 419, 129564. [Google Scholar] [CrossRef]
  21. Prakotmak, P.; Wangchai, S. CFD-DEM simulation of fluidization of multi sphere-modeled corn particles. Part. Sci. Technol. 2022, 40, 752–761. [Google Scholar] [CrossRef]
  22. Zhang, R.; Ku, X.; Yang, S. Study of air-steam gasification of spherocylindrical biomass particles in a fluidized bed by using CFD-DEM coupling with the multi-sphere model. Energy Convers. Manag. 2023, 276, 116561. [Google Scholar] [CrossRef]
  23. Tsuji, T.; Sakamoto, Y.; Harada, S.; Uemoto, K.; Oshitani, J.; Washino, K.; Tanaka, T.; Kajiwara, H.; Matsuoka, K. FPM-SE: A numerical model for dense gas–solid flows with large non-spherical object. Chem. Eng. Sci. 2022, 264, 118149. [Google Scholar] [CrossRef]
  24. Chen, H.; Zhao, S.; Zhou, X. DEM investigation of angle of repose for super-ellipsoidal particles. Particuology 2020, 50, 53–66. [Google Scholar] [CrossRef]
  25. Liu, Z.; Ma, H.; Zhou, L.; Xu, C.; Zhang, X.; Zhao, Y. DEM-DDM investigation of the intra-tablet coating uniformity for tablets with different shapes. Powder Technol. 2024, 438, 119666. [Google Scholar] [CrossRef]
  26. You, Y.; Zhao, Y. Discrete element modelling of ellipsoidal particles using super-ellipsoids and multi-spheres: A comparative study. Powder Technol. 2018, 331, 179–191. [Google Scholar] [CrossRef]
  27. Barr. Superquadrics and Angle-Preserving Transformations. IEEE Comput. Graph. Appl. 1981, 1, 11–23. [Google Scholar] [CrossRef]
  28. Ma, H.; Xu, L.; Zhao, Y. CFD-DEM simulation of fluidization of rod-like particles in a fluidized bed. Powder Technol. 2017, 314, 355–366. [Google Scholar] [CrossRef]
  29. Xia, L.; Zhang, H.; Wang, B.; Yu, C.; Fan, X. Experimental and numerical analysis of oil shale drying in fluidized bed. Dry. Technol. 2017, 35, 802–814. [Google Scholar] [CrossRef]
  30. Di Felice, R. The voidage function for fluid-particle interaction systems. Int. J. Multiph. Flow 1994, 20, 153–159. [Google Scholar] [CrossRef]
  31. Gao, X.; Yu, J.; Lu, L.; Li, C.; Rogers, W.A. Development and validation of SuperDEM-CFD coupled model for simulating non-spherical particles hydrodynamics in fluidized beds. Chem. Eng. J. 2021, 420, 127654. [Google Scholar] [CrossRef]
  32. Richter, A.; Nikrityuk, P.A. Drag forces and heat transfer coefficients for spherical, cuboidal and ellipsoidal particles in cross flow at sub-critical Reynolds numbers. Int. J. Heat Mass Transf. 2012, 55, 1343–1354. [Google Scholar] [CrossRef]
  33. Brazhenko, V.; Mochalin, I. Terminal velocity and drag coefficient of a smooth steel sphere moving in the water-filled vertical and inclined glass pipe (Newton regime). Powder Technol. 2024, 446, 120120. [Google Scholar] [CrossRef]
  34. Hölzer, A.; Sommerfeld, M. New simple correlation formula for the drag coefficient of non-spherical particles. Powder Technol. 2008, 184, 361–365. [Google Scholar] [CrossRef]
  35. Zhao, Y.; Jiang, M.; Liu, Y.; Zheng, J. Particle-scale simulation of the flow and heat transfer behaviors in fluidized bed with immersed tube. AIChE J. 2009, 55, 3109–3124. [Google Scholar] [CrossRef]
  36. Shen, Y.; Zheng, B.; Sun, P.; Qi, C.; Wang, M.; Dong, Y.; Wang, Y.; Lv, J.; Wang, Y. Effects of ellipsoidal and regular hexahedral particles on the performance of the waste heat recovery equipment in a methanol reforming hydrogen production system. Int. J. Hydrogen Energy 2023, 48, 11141–11152. [Google Scholar] [CrossRef]
  37. Korkerd, K.; Zhou, Z.; Zou, R.; Piumsomboon, P.; Chalermsinsuwan, B. Effect of immersed tubes configurations on mixing and heat transfer of mixed biomass and silica sand in a bubbling fluidized bed using CFD-DEM and statistical experimental design analysis. Powder Technol. 2024, 437, 119542. [Google Scholar] [CrossRef]
  38. Handayani, S.U.; Wahyudi, H.; Agustina, S.; Yulianto, M.E.; Aryanto, H.D. CFD-DEM Study of heat and mass transfer of ellipsoidal particles in fluidized bed dryers. Powder Technol. 2023, 425, 118535. [Google Scholar] [CrossRef]
  39. Gan, J.; Zhou, Z.; Yu, A. Particle scale study of heat transfer in packed and fluidized beds of ellipsoidal particles. Chem. Eng. Sci. 2016, 144, 201–215. [Google Scholar] [CrossRef]
  40. Xu, C.; Liu, Z.; Zhou, L.; Song, T.; Yang, J.; Zou, G.; Ma, H.; Zhao, Y. An improved model for predicting the erosion within the DEM framework. Powder Technol. 2023, 428, 118786. [Google Scholar] [CrossRef]
  41. Barton, I.E. Comparison of simple- and piso-type algorithms for transient flows. Int. J. Numer. Methods Fluids 1998, 26, 459–483. [Google Scholar] [CrossRef]
  42. Crank, J.; Nicolson, P. A practical method for numerical evaluation of solutions of partial differential equations of the heat-conduction type. Math. Proc. Camb. Philos. Soc. 1947, 43, 50–67. [Google Scholar] [CrossRef]
  43. Leonard, B.P. A stable and accurate convective modelling procedure based on quadratic upstream interpolation. Comput. Methods Appl. Mech. Eng. 1979, 19, 59–98. [Google Scholar] [CrossRef]
  44. Cundall, P.A.; Strack, O.D.L. A discrete numerical model for granular assemblies. Geotechnique 1979, 29, 47–65. [Google Scholar] [CrossRef]
Figure 1. Fixed bed experimental equipment with infrared camera: (a) physical diagram and (b) schematic diagram.
Energies 18 01504 g001
Figure 2. Simulated conditions in the fixed bed: (a) parameters of cylindrical particle, (b) boundary conditions in DEM, and (c) boundary conditions in CFD.
Energies 18 01504 g002
Figure 3. The snapshots of the Tp on the surface of the fixed bed in the experiment and simulation.
Energies 18 01504 g003
Figure 4. The evolution and deviation of average Tp on the surface in the fixed bed in the experiment and simulation.
Energies 18 01504 g004
Figure 5. The snapshots of velocity and temperature of CBPs in the cylindrical FB.
Energies 18 01504 g005
Figure 6. The temporal evolution of the orientation distribution of CBPs.
Energies 18 01504 g006
Figure 7. The spatial evolution of average Tp in (a) axial and (b) radial directions at different times.
Energies 18 01504 g007
Figure 8. Influence of gas velocity on the temporal evolution of (a) average Tp and (b) standard deviation of Tp.
Energies 18 01504 g008
Figure 9. Influence of gas velocity on the temporal evolution of (a) conductive and (b) convective HT rates.
Energies 18 01504 g009
Figure 10. Influence of gas velocities on the orientation of CBPs in the whole fluidization process.
Energies 18 01504 g010
Figure 11. Effect of inlet temperature on the temporal evolution of (a) average Tp and (b) standard deviation of Tp.
Energies 18 01504 g011
Figure 12. Influence of inlet temperature on the temporal evolution of (a) conductive and (b) convective HT rate.
Energies 18 01504 g012
Figure 13. Influence of inlet temperatures on the orientation of particles in the whole fluidization process.
Energies 18 01504 g013
Figure 14. Effect of the kp on the temporal evolution of (a) average Tp and (b) standard deviation of Tp.
Energies 18 01504 g014
Figure 15. Effect of the kp on the evolution of (a) conductive and (b) convective HT rate.
Energies 18 01504 g015
Figure 16. Effect of the kp on the orientation of particles in the whole fluidization process.
Energies 18 01504 g016
Table 1. Parameters used in the experiment.
Properties and ParametersValue
Particle size, a × b × c (mm × mm × mm)1 × 1 × 3
Particle number3000
Particle density (kg/m3)7874
Elastic modulus of particle (GPa)194.02
Poisson ratio of particle0.3
Specific heat capacity of particle (J/(kg·K))500
Thermal conductivity of particle (W/(m·K))16.3
Initial particle temperature (K)298.15
Emissivity of particle0.7
Ambient temperature (K)298.15
Gas flow rate (L/min)300
Inlet gas temperature (K)373.15
Table 2. The properties and parameters used in the simulation.
ParametersValue
Particle size, a × b × c (mm × mm × mm)1 × 1 × 3
Particle number3000
Particle density (kg/m3)7874
Elastic modulus of particle (GPa)194.02
Poisson ratio of particle0.3
Specific heat capacity of particle (J/(kg·K))500
Thermal conductivity of particle (W/(m·K))16.3
Initial particle temperature (K)298.15
Normal spring stiffness (N/m)7000
Tangential spring stiffness (N/m)2000
Restitution coefficient0.9
Friction coefficient0.3
Grid size, x × y × z (mm × mm × mm)5 × 5 × 5
Inlet gas velocity (m/s)2
Inlet gas temperature (K)373.15
DEM time step (s)2 × 10⁻⁵
CFD time step (s)1 × 10⁻⁴
Total simulation time (s)60
Table 3. Parameters used in the simulation of the cylindrical FB.
ParametersValue
CBP, a × b × c (mm × mm × mm)1 × 1 × 3
CBP number18,000
CBP density (kg/m3)700
Elastic modulus of CBP (GPa)10
Poisson ratio of CBP0.2
Specific heat capacity of CBP (J/(kg·K))1800
Thermal conductivity of CBP (W/(m·K))5
Initial CBP temperature (K)300
Normal spring stiffness (N/m)700
Tangential spring stiffness (N/m)200
Restitution coefficient0.9
Friction coefficient0.3
Inlet gas velocity (m/s)1.2
Inlet gas temperature (K)423.15
DEM time step (s)4 × 10⁻⁵
CFD time step (s)2 × 10⁻⁴
Total simulation time (s)20
Disclaimer/Publisher’s Note: The statements, opinions and data contained in all publications are solely those of the individual author(s) and contributor(s) and not of MDPI and/or the editor(s). MDPI and/or the editor(s) disclaim responsibility for any injury to people or property resulting from any ideas, methods, instructions or products referred to in the content.

