Abstract
This study analyzes the potential impact of the electrification of the delivery fleet on sustainability in the e-commerce sector, forecasting trends up to 2050. Scenario analysis, forecast models, and Monte Carlo simulations are utilized to evaluate the following three scenarios: business-as-usual (BAU), partial electrification, and full electrification. This study focuses on reducing CO2 emissions, optimizing operating costs, and delivery time efficiency. The results indicate that full electrification can reduce CO2 emissions by more than 75% and operating costs by around 30% by 2050, while improving delivery time by around 15%. Partial electrification shows moderate benefits, with a reduction in CO2 emissions of around 50% and cost savings of 15%. This study emphasizes the significant potential of fleet electrification in solving environmental problems and increasing operational efficiency in e-commerce logistics, while identifying challenges in implementation and areas for future research.
1. Introduction
The contemporary digital economy, propelled by technological advancement and burgeoning internet proliferation, is catalyzing the rapid expansion of the e-commerce sector [1,2]. E-commerce, encompassing the execution of commercial transactions through electronic means, has profoundly transformed the consumer purchasing landscape, proffering conveniences, enhanced accessibility [3,4], and an expansive array of options [5,6]. However, the surge in online shopping has led to a substantial increase in demand for logistics services, particularly in the context of last-mile delivery [7,8], which refers to the final stage of delivering parcels directly to the recipient [9,10].
The growth of e-commerce has given rise to a number of challenges for the transport sector in terms of its environmental impact. Transport, and road transport in particular, is a significant source of greenhouse gas emissions, contributing to the problem of climate change and air pollution in cities [11,12]. The transport sector is responsible for a significant proportion of global CO2 emissions [13], and delivery transport in cities generates a substantial proportion of these emissions [14,15], contributing to increased air pollution [16,17], noise, and congestion [18,19,20]. The increase in the volume of e-commerce deliveries leads to an increase in the number of vehicles on city streets, which exacerbates these problems [16,21].
In the context of sustainable development, the electrification of the transport fleet has been identified as a key solution for reducing the carbon footprint, enhancing operational efficiency [22,23] and reducing operating costs [24,25]. The use of electric delivery vehicles (EDV) has been shown to contribute to improving air quality in urban areas and reducing the negative impact on public health [26,27]. Moreover, the operational costs of electric vehicles are lower due to the lower cost of electricity compared to that of fossil fuels and due to them having fewer moving parts [28,29], which results in lower maintenance costs [30,31].
However, the transition of delivery transport towards full electrification involves a number of technological [32], financial, and infrastructural challenges [33,34]. The key aspects include the development of battery technology [35], the construction of charging infrastructure, and the optimization of routes that would enable the efficient management of an electric vehicle fleet [36,37,38]. It is also important to consider the impact of external factors, such as ambient temperature, on battery performance [39]. Furthermore, it is important to consider social and economic aspects, such as consumer acceptance of electric commercial vehicles [40,41] and the availability of a qualified work-force to operate and service these vehicles [42,43].
The evolution of environmental regulations and the escalating environmental consciousness among consumers are precipitating an augmented demand for sustainable logistics solutions [44,45,46,47]. E-commerce companies are increasingly implementing measures to mitigate their environmental impact, offering customers CO2-neutral delivery options [48,49] and utilizing environmentally friendly packaging [50,51]. A significant number of companies have adopted sustainable supply chain strategies, incorporating monitoring and reduction in CO2 emissions at every stage of the logistics process [52].
A plethora of publications have analyzed the impact of electric vehicles on CO2 emissions in urban logistics [7,17,19], but many of them have focused mainly on the overall urban transport or long-distance transport, ignoring the specifics of the e-commerce sector. Furthermore, the few studies that do exist do not fully integrate the analysis of operating costs with the assessment of the efficiency of last-mile deliveries. Consequently, there is a paucity of coherent models that would enable the estimation of the following:
- The long-term operating costs of an EV fleet in e-commerce;
- The potential to reduce CO2 emissions and fossil fuel consumption;
- The impact on delivery time (operational efficiency).
Other gaps in the literature concern the lack of consideration of uncertainty and volatility of energy prices or battery costs in the context of a long-term perspective (e.g., until 2050). This gap is addressed by using a multi-stage approach combining trend forecasts with scenario analysis and Monte Carlo simulation.
In terms of the operational efficiency of electric vehicles, there are several specific areas where electrification can be advantageous. Firstly, the simpler design of the drive system results in lower maintenance costs, since, for example, there is no need to change engine oil. Secondly, optimizing routes becomes easier because electric vehicles can be charged during standard logistics stops (e.g., at trans-shipment centers), which reduces the need for additional refueling. Furthermore, the cost-effectiveness of electricity in comparison to fossil fuels leads to more efficient management of the operating budget.
The aim of this study is to conduct a scenario analysis to assess the impact of the electrification of the delivery fleet in the e-commerce sector on key sustainability aspects, including the following:
- Reduction in CO2 emissions;
- Reduction in transport operating costs;
- Optimization of delivery times;
- Reduction in fossil fuel consumption.
This study considers the following three scenarios for the implementation of electric vehicles: business-as-usual, partial electrification, and full electrification.
The analysis incorporates predictive modeling employing linear trend regression and extrapolation of historical data, enabling an assessment of the long-term impact of electrification up to 2050. Monte Carlo simulation was utilized to ascertain the sensitivity of the results to input variables, facilitating the estimation of potential fluctuations in operating costs and delivery efficiency depending on technological and regulatory policy changes.
The growing demand for sustainable logistics solutions, precipitated by evolving environmental regulations and heightened consumer environmental awareness, is a salient factor in this context. However, the efficacy and sustainability of a fully electrified delivery fleet in the e-commerce sector over an extended timeframe remains a pivotal question.
The fundamental research questions to be addressed are as follows:
- Will the electrification of the delivery fleet contribute meaningfully to the reduction in CO2 emissions and lower operating costs by 2050?
- What challenges and barriers may affect the pace of EV technology implementation in logistics?
- Can the electrification of urban and international transport ensure optimal operational efficiency without negatively affecting costs and service availability?
In the context of the rapid growth of e-commerce and the increasing demand for last-mile deliveries, the logistics sector is confronted with a growing tension between the need for efficient logistics and the imperative to reduce environmental harm. According to various industry reports and academic studies (e.g., IEA, ACEA), the near-complete electrification of urban transport has the potential to reduce CO2 emissions by 70–80%, while also mitigating the operational costs associated with fossil fuels. However, the extent to what these benefits can be realized in a large-scale e-commerce context remains uncertain, especially given the investment required for charging infrastructure, the limitations of battery technology, and consumer acceptance of eco-friendly deliveries.
To systematically examine these challenges, the following hypotheses were formulated:
H1.
The full electrification of the delivery fleet will enable a reduction in CO2 emissions by more than 75% by 2050.
H2.
The implementation of electric vehicles will lead to a reduction in transport operating costs compared to a combustion fleet.
H3.
Electrification will have a positive impact on delivery efficiency through route optimization and the elimination of refueling.
H4.
The transition to electric vehicles will significantly reduce the consumption of fossil fuels but will require significant investment in the charging infrastructure.
By setting a target of more than 75% reduction in CO2 emissions (H1), this study was aligned with the upper estimates suggested by previous analyses indicating that the almost complete adoption of electric vehicles could drastically reduce greenhouse gas emissions. Meanwhile, hypotheses H2 and H3 address cost and efficiency gains, respectively, which are vital for competitiveness in e-commerce logistics. Finally, H4 explicitly acknowledges the infrastructural and financial barriers—especially charging networks—that could impede an otherwise promising transition.
The verification of these hypotheses will be conducted through a multifaceted approach encompassing scenario analysis, predictive modeling, and Monte Carlo simulations. This study will encompass a comprehensive consideration of key parameters, including energy costs, advancements in energy storage technologies, and the implementation timeline of regulatory policies.
The formulation of hypotheses is predicated based on two factors, as follows: the intensification of e-commerce services and the pressure for fast deliveries, on the one hand, and the urgent need to reduce the carbon footprint and increase operational efficiency on the other. These two objectives are often in conflict (emissions vs. increase in the number of shipments), which justifies the need for research into fleet electrification scenarios for 2050.
The issue of sustainability in e-commerce not only includes reducing the carbon footprint, but also the efficient use of resources, minimizing noise and traffic congestion in urban areas and ensuring the economic viability of logistics processes [16,21]. The hypotheses formulated relate directly to the following challenges:
- H1 (CO2 reduction)—concerns the primary environmental objective of reducing emissions in the rapidly growing e-commerce sector;
- H2 (operating costs)—reflects the economic dimension of sustainable development (efficiency + profitability);
- H3 (improved delivery efficiency)—translates into less congestion, faster deliveries, and a higher level of service for customers, which combines social and economic aspects;
- H4 (investment in infrastructure)—emphasizes that without adequate investment in charging stations and modernization of the power grid, the implementation of sustainable solutions will be difficult.
It is evident that each hypothesis provides a distinct contribution to the framework for an integrated assessment of sustainability in e-commerce. These contributions pertain to the various pillars of sustainability, including the environmental, economic, and social aspects.
2. Materials and Methods
Due to the complex nature of the problem, the following three complementary methods were used:
- Scenario analysis—allows for a comparison of different variants of market development (BAU, partial, and full electrification) and an assessment of their impact on emissions and costs [53].
- Predictive modeling (linear trend regression)—enables the quantification of long-term trends (CO2 emissions, costs, and supply efficiency) based on historical data and extrapolation to 2050 [54].
- Monte Carlo simulation—used to take uncertainty into account (e.g., the variability of costs, energy prices, or the degree of infrastructure development), giving a distribution of possible outcomes instead of a single deterministic forecast [55].
The combination of these methods provides a comprehensive assessment—from a variety of scenarios, through quantitative forecasts, to risk assessment and sensitivity of results—which is crucial in a long-term study fraught with many unknowns.
2.1. The Scope and Data Sources
In order to ensure a solid empirical basis, the analysis was based on various data sets from both industry reports and official statistics. The main sources included the following:
- The Statista platform (report “Sustainability in e-commerce” and related statistical overviews), which provides indicators on CO2 emissions, shipment volumes, and trends in e-commerce [56,57].
- Data from the International Energy Agency (IEA), which present information on energy consumption and emissions on a global level (including the transport sector) [58,59].
- Reports and analyses by ACEA (European Automobile Manufacturers Association), which include statistics on the electric vehicle (EV) market, such as sales dynamics and information on charging infrastructure [60,61].
- EU regulatory documents and national guidelines (regarding the decarbonization of transport), which allow us to estimate the possible pace of the implementation of policies supporting the electrification of fleets [62,63,64].
The historical period of 2010–2024 served as a basis for identifying trends and calibrating models. These data were compiled in tabular form and then cleaned up (e.g., units were standardized and incomplete/contradictory observations were removed). This resulted in a coherent set of input data for further forecasting analysis.
In terms of the reliability and granularity of the data, it should be emphasized that, in addition to information from the Statista platform, IEA and ACEA reports, and EU documents, a cross-check was also carried out with other industry and statistical sources in order to confirm the consistency of the main historical trends in the e-commerce and logistics sector. For instance, data concerning the rise in the number of electric vehicles were meticulously compared with official vehicle registers in selected countries, while information on energy and fuel prices was contrasted with publications from government agencies.
Furthermore, the accuracy and consistency of the data were ensured by removing duplicates, standardizing units (e.g., converting gallons to liters and miles to kilometers), and averaging outliers in the case of missing observations. Although primary data in the strict sense were not collected in the field, the multi-source method used allowed a satisfactory level of detail and reliability to be achieved.
2.2. The Predictive Modeling (Linear Trend Regression)
The basis for forecasting future emission values, operating costs, and delivery efficiency (measured, for example, by shorter delivery times) was a linear model in which a constant rate of change (trend) was assumed for the time horizon up to the year 2050. Formally, the model can be written as follows:
Yt = α + βt + εt
Yt—value of the forecast variable (CO2 emissions, costs, and efficiency) in year t;
α—free parameter (initial value in the base year);
β—trend factor, estimated on the basis of data from 2010 to 2024;
εt—random component (assumption that it has an expected value of 0 and constant variance).
For each key variable (e.g., CO2 emissions, costs), the coefficients α and β were individually estimated based on the historical data. The trend value was then extrapolated to 2050, taking into account the assumptions regarding the increase in the share of electric vehicles in the fleet, according to the individual scenarios (BAU, partial, and full electrification). This resulted in point forecasts for emissions, costs, and efficiency indicators for the years 2025 to 2050.
2.3. The Critical Assumptions in the Analysis
2.3.1. Operating Costs for Transport
It is assumed that electric vehicles have ~30% lower operating costs (operation, fuel/energy, and service) than combustion vehicles, which is based on the literature [30,32] and industry data [55,57,58]. In the partial electrification scenario (50–75% EV), moderate savings of 15–20% are assumed. In BAU, costs increase with fossil fuel prices and environmental levies.
2.3.2. CO2 Emissions
For combustion vehicles, a constant unit emission (t CO2/km) was assumed based on the averages from 2010 to 2024, adjusted for a slight improvement in combustion engine efficiency (several percent by 2050). Electric vehicles were considered to generate zero local emissions (well-to-wheel emissions are not directly taken into account here, in accordance with most regulations—so-called zero-emission vehicles). In addition, in the partial/full electrification scenarios, it was assumed that the EV fleet grows in line with the historical trend but accelerated as a result of decarbonization policies.
2.3.3. Number of Vehicles/Delivery Intensity
It is assumed that the intensification of e-commerce by 2050 will lead to a gradual increase in the number of vehicles required for deliveries (especially in BAU). In the electrification scenarios, it is assumed that route optimization and better planning can reduce some of the fleet growth (e.g., EVs can have higher daily utilization with an efficient charging infrastructure).
2.4. The Monte Carlo Simulation and Distribution Assumptions
A Monte Carlo simulation of 1000 iterations was used to capture uncertainty in the long-term projections.
The key random variables (energy costs, battery costs, and EV share growth rate) were assigned normal (Gaussian) distributions, where the mean value (μ) and standard deviation (σ) were estimated from historical data (2010–2024) and industry forecasts [65,66].
In each iteration, the values of these variables were randomly drawn, and the projected CO2 emissions, operating costs, and delivery times were recalculated over a horizon to 2050.
This provided a distribution of results (e.g., histograms illustrate the likely range of cost reductions), rather than a single deterministic value.
The Monte Carlo results made it possible, among other things, to assess how stable and sensitive the predicted benefits (e.g., cost reduction in full electrification) are, depending on fluctuations in energy prices and other factors.
In order to avoid over idealizing the results, the following restrictions were introduced in the simulation:
- In the partial electrification scenario, a maximum EV share of 75% by 2050 was assumed, with the assumption that a certain part of the fleet would remain combustion-engine-based due to costs or lack of infrastructure in peripheral areas;
- Normal distributions of energy prices and battery costs were assumed, while recognizing that they can only fall to a certain minimum level (due to raw material costs);
- In the full electrification scenario, it was assumed that the development of the charging infrastructure will be supported by government policies [32,35], which does not exclude the possibility that progress may be slower in reality due to investment constraints.
In addition, in order to increase the reliability and comparability of the scenarios, the results were compared with forecasts [19,67], which presented a similar level of emission reduction in urban transport. This gives the analysis a stronger basis in the literature and allows us to conclude that the results obtained are similar to those of other studies on the decarbonization of supply.
2.5. The Analytical Tools and Transparency
Data were pre-processed in Python (v.3.10) using the pandas (v.1.5.2) and numpy (v.1.23.4) libraries. Linear trend regression was performed using statsmodels (v.0.13.2), and Monte Carlo simulation was performed using scipy.stats (v.1.9.3). Visualizations (including histograms of Monte Carlo results) were generated using matplotlib (v.3.6.2) and seaborn (v.0.12.1).
All assumptions regarding probability distributions (e.g., normal) and definitions of scenarios (business-as-usual, partial electrification, and full electrification) have been explicitly described and include, among others, the following:
- The parameters of distributions (mean values and standard deviations) for cost variables (e.g., energy prices, vehicle costs), estimated on the basis of historical data (2010–2024) and industry reports (Statista, IEA, and ACEA).
- The extent of electrification of the fleet in each scenario, i.e., the projected percentage share of electric vehicles by 2050, together with a justification based on EU regulatory documents and industry assumptions.
- Accepted CO2 emission rates for combustion vehicles, taking into account slight annual technological improvements in engines, and the assumption of zero local CO2 emissions for electric vehicles.
- Operating costs, including initial energy costs (fuel vs. electricity), maintenance rates, and other factors that influence the differences between combustion and electric fleets.
The graphs and results presented in the manuscript are the direct result of scripts written in Python, which can be re-run by changing, for example, the parameters of Monte Carlo distributions.
3. Results
This article refers to data from Statista, IEA, and ACEA reports, which provide a global perspective on the phenomena related to the development of e-commerce and the impact of this sector on the environment. This means that the data have a global dimension, but its application in forecasting models can be adapted to specific markets as needed. In the context of this work, these data are the starting point for analyzing the electrification of commercial vehicle fleets from the perspective of the broadly understood global market, with detailed forecasts or infrastructure assumptions being able to be additionally scaled and refined at the local level.
A pivotal element in the transition of the e-commerce sector towards sustainability pertains to the mitigation of CO2 emissions stemming from delivery transportation. Combustion vehicles constitute a substantial source of greenhouse gas emissions, and their continued operation without the modernization of fleets can precipitate an escalation in environmental and regulatory burdens. To ascertain the prospective advantages of the integration of electric vehicles, a scenario analysis was conducted, encompassing three market development scenarios up to the year 2050.
The first scenario, termed business-as-usual, assumes that current trends will continue without significant electrification of the fleet, leading to a projected increase in CO2 emissions to approximately 30 million tons by 2050. This scenario reflects the adverse impact of maintaining a fleet dependent on fossil fuels. Conversely, the partial electrification scenario anticipates that 50–75% of the fleet will be substituted by electric vehicles, thereby enabling a steady decline in emissions to approximately 15 million tons by 2050. Conversely, the full electrification of the fleet will result in a substantial reduction in emissions, with levels falling below 5 million tons by 2050.
Figure 1 provides a visual representation of the projected changes in CO2 emissions for each of the analyzed scenarios.
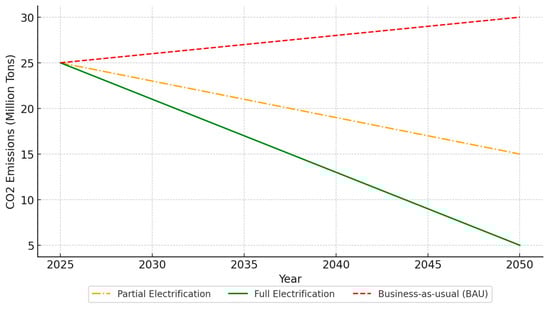
Figure 1.
Projected CO2 emissions under different electrification scenarios.
As illustrated in Figure 1, the projected CO2 emissions were derived from the modeling of a linear trend, with additional consideration given to the proportion of the electric fleet in specific scenarios (BAU, partial, and full electrification). The emission reduction in these scenarios was considered to be a result of two factors, as follows: firstly, a decline in the number of combustion vehicles, and secondly, the assumption of zero local CO2 emissions in electric vehicles. The linear model adopted was based on the steady growth of the e-commerce sector between 2010 and 2024, as well as on delivery volumes. Additional factors, such as a potential improvement in the efficiency of conventional engines or a slight increase in the demand for deliveries, have been reflected in the trend parameters. In the event of non-linear spikes in energy prices, the model can be supplemented with non-linear variants, as indicated in the directions for further work.
The operating costs of delivery transport have been identified as a pivotal factor in the strategic decision making of e-commerce companies. The electrification of fleets has the potential to engender substantial alterations in cost structures, both through the elimination of fossil fuel expenses and the reduction in vehicle operating costs. In order to evaluate the impact of electrification on operating costs, a comprehensive analysis was conducted, encompassing the following three distinct scenarios: business-as-usual partial electrification (50–75% EV fleet), and full electrification (100% EV).
The BAU scenario demonstrates a steady escalation in operating costs, attributable to rising fossil fuel prices, emission charges, and the maintenance and servicing costs for combustion vehicles. Partial electrification enables a gradual reduction in costs; however, expenses continue to be incurred in maintaining a mixed fleet of combustion and electric vehicles. Conversely, full electrification offers the most significant cost benefits through the minimization of fuel expenses and the reduction in maintenance costs.
Figure 2 illustrates the projected changes in operating costs for the three scenarios analyzed.
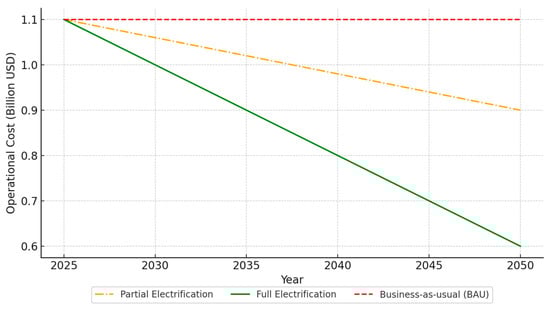
Figure 2.
Projected operational cost under different electrification scenarios.
Despite the evident benefits of full electrification of the fleet in terms of optimal operating costs, there are factors that can lead to substantial financial expenditure. These include the costs associated with replacing batteries after prolonged intensive vehicle usage and the necessity for expanding charging infrastructure in logistics centers and urban areas. To estimate the impact of these additional expenses, a sensitivity analysis was conducted, in which the total investment costs were increased by 15–20% compared to the baseline values.
The findings of this analysis demonstrate that, while augmented expenditures prolong the payback period, the comprehensive electrification scenario remains the most financially viable in the long term (extending up to the year 2050). It has been demonstrated that total operating costs rise by only a few to a dozen or so percent, thereby ensuring a favorable economic balance in comparison to the combustion scenario. However, it should be noted that this is contingent on the presence of financial incentives (e.g., subsidies, tax breaks) and the extent of infrastructural support from city authorities. Consequently, the implementation of full electrification necessitates not only plans for vehicle replacement, but also a long-term investment strategy that incorporates expenditures on chargers and the modernization of the power grid.
In the context of e-commerce, delivery time represents a pivotal metric of operational efficiency. The integration of electric vehicles has the potential to enhance delivery times by eliminating the requirement for refueling and facilitating optimized route planning through advanced fleet management systems. In the scenario analysis, the impact of partial and full electrification on the reduction in delivery time between 2025 and 2050 was evaluated and compared with a business-as-usual scenario.
The BAU scenario, representing a lack of significant technological change, indicates that delivery time remains constant throughout the analysis period. In the case of partial electrification, where the share of electric vehicles ranges from 50% to 75%, a gradual reduction in delivery time by approximately 10% by 2050 is observed. Conversely, full electrification is predicted to yield a substantial enhancement in logistics efficiency, resulting in a 15% reduction in delivery time by the year 2050.
Figure 3 provides a visual representation of the projected changes in delivery time for the examined scenarios.
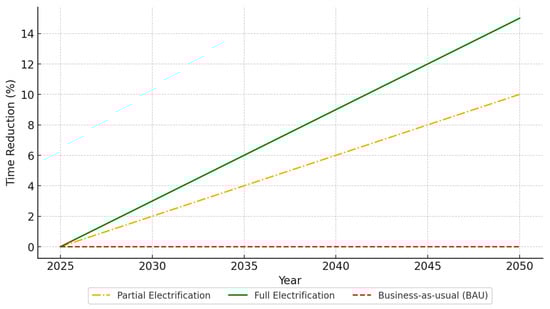
Figure 3.
Projected delivery time reduction under different electrification scenarios.
It is imperative to emphasize that the assertion pertaining to the reduction in delivery times attributable to the absence of refueling pertains to archetypal urban contexts, wherein electric vehicles can be recharged at logistics bases or during trans-shipment processes. This observation does not negate the issue of protracted charging times, particularly in scenarios where the availability of rapid charging stations is constrained. In the absence of a sufficiently developed charging infrastructure, the potential time savings can be partially counterbalanced by the necessity to meticulously schedule charging intermissions. Furthermore, the limited range of electric vehicles necessitates meticulous route planning. However, the data analyzed in this study, which are based on standard e-commerce route lengths, indicate that EVs remain effective, and the expansion of charging infrastructure could further enhance their potential for reducing delivery times.
The consumption of fossil fuels in the context of delivery transport is a pivotal factor influencing operating costs, greenhouse gas emissions, and global demand for crude oil. The implementation of electric vehicles has the potential to markedly reduce fuel consumption, thereby diminishing the transport sector’s reliance on fossil fuels and lowering operating costs.
The analysis considered the following three development scenarios:
- The first scenario is referred to as business-as-usual, and it assumes that the fleet will not be electrified, thus maintaining current annual fuel consumption;
- Partial electrification is a staged introduction of electric vehicles at a rate of 50–75%, which is predicted to reduce fuel consumption by 50% by 2050;
- Finally, the third scenario is full electrification, i.e., a complete switch to an electric vehicle fleet, which would result in zero fuel consumption by 2050.
The predicted changes in fossil fuel consumption in commercial transport between 2025 and 2050 are illustrated in Figure 4.
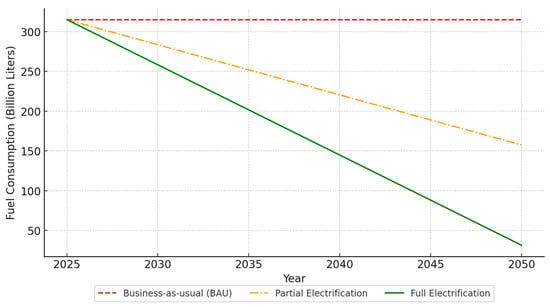
Figure 4.
Projected fuel consumption under different electrification scenarios.
The Monte Carlo simulation was utilized to ascertain the potential for cost reductions in the operation of the transport fleet consequent to its complete electrification. The analysis incorporates 1000 simulations, which encompass the variability of economic factors, energy costs, operational efficiency, and savings from reduced fossil fuel consumption.
The results of the simulation are presented in Figure 5, which shows a histogram of the reduction in operating costs in a scenario of full electrification of delivery transport.
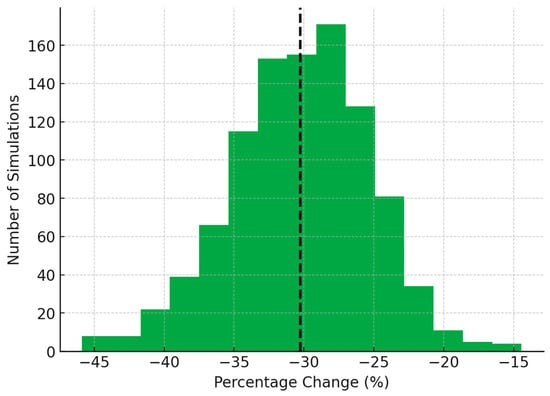
Figure 5.
Monte Carlo—full electrification operational cost.
The complete electrification of the delivery fleet has been shown to engender an average reduction in operating costs of around 30%, which is a much more significant effect compared to partial electrification. The simulation results indicate that savings range from −40% to −20%, which suggests a significant reduction in fuel and vehicle maintenance expenses. The greatest savings are achieved in regions with lower electricity costs and a well-developed charging infrastructure.
Figure 6 presents a histogram of the Monte Carlo simulation results for the reduction in delivery time in a scenario of fully electrified delivery transport.
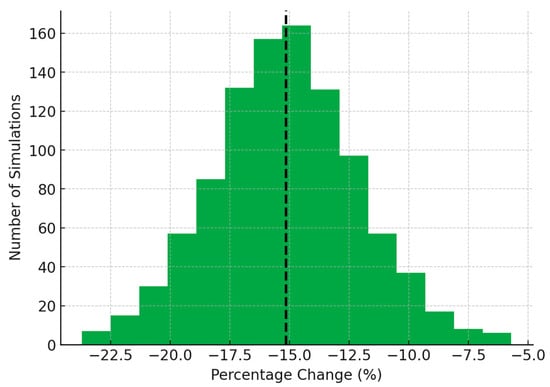
Figure 6.
Monte Carlo—full electrification delivery time.
As demonstrated in Figure 6, the implementation of full electrification has the capacity to reduce delivery times by approximately 15%, a finding that aligns with the predictions of alternative models that incorporate the reduction in refueling activities and optimized route planning. For instance, analyses derived from simulations of urban EV fleets have indicated comparable time benefits under conditions of a relatively dense charging infrastructure. In this study, a uniform point forecast was employed in conjunction with Monte Carlo simulations to distribute the 15% value across a range of results, incorporating variables such as access to charging stations, the fluctuating number of shipments, and battery performance. This methodological approach ensures transparency and circumvents oversimplification.
In a full electrification scenario, the average delivery time is reduced by around 15%, which is significantly higher than that observed in a partial electrification scenario. As demonstrated in Figure 7, the histogram shows the distribution of results, with the dominant majority of simulations falling within the range of −20% to −10%. The enhanced delivery dynamics can be attributed to a number of factors, including the optimized management of the electric fleet, the elimination of delays associated with refueling, and improved route efficiency in cities with extensive charging infrastructure.
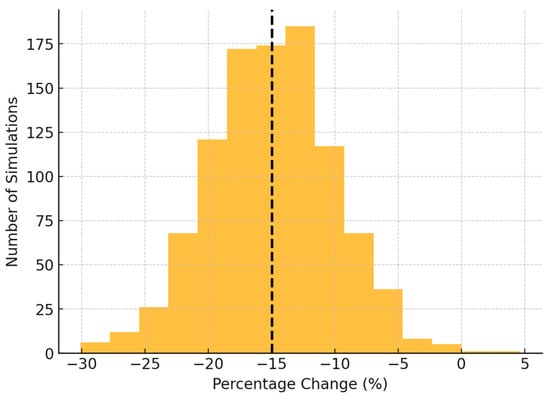
Figure 7.
Monte Carlo—partial electrification operational cost.
Figure 7 presents a histogram of Monte Carlo simulation results for the reduction in operating costs in a partial electrification scenario for delivery transport.
A thorough analysis of operating costs in a partial electrification scenario reveals an average cost reduction of approximately 15%. The histogram illustrates the simulated values, the majority of which fall within the range of −25% to −7%. The reduction achieved can be primarily attributed to the reduced fuel and maintenance costs of electric vehicles. However, the limited adoption of electric vehicles continues to incur expenses associated with the maintenance of the combustion fleet. It is noteworthy that certain simulations suggest a reduction in savings, which may be attributable to fluctuations in electricity prices and charging infrastructure costs.
A histogram is presented in Figure 8, showing the Monte Carlo simulation results for the reduction in delivery time in the partial electrification of delivery transport scenario.
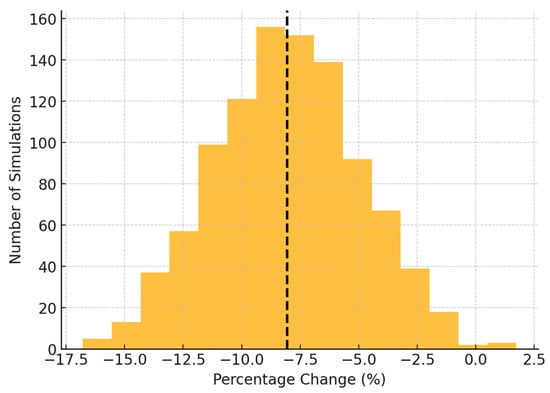
Figure 8.
Monte Carlo—partial electrification delivery time.
The Monte Carlo simulation for the partial electrification scenario indicates an average reduction in delivery time of approximately 7.5%. The histogram illustrates the distribution of 1000 simulations, where the input variables were generated according to a normal distribution. The majority of the results are concentrated within the range of −12% to −4%, suggesting a moderate impact of partial electrification on delivery time reduction. The predominance of electric vehicles facilitates route optimization and enhanced operational efficiency, though the impact is less pronounced compared to the full electrification scenario.
The credibility of the analyses is further enhanced by the Monte Carlo simulation, which captures the uncertainty surrounding the most significant parameters. Rather than providing a single point forecast, this approach yields a distribution of possible outcomes, thereby facilitating the assessment of risk and sensitivity to changes in energy costs, the pace of electrification, and other operational factors. This enhanced flexibility of the approach allows for the verification of a wide range of market conditions.
4. Discussion
The results of the scenario analysis indicate significant potential for the electrification of the delivery fleet in the e-commerce sector in the context of sustainable development, a conclusion which is in line with the general trend observed in the logistics industry, where the electrification of transport is seen as a key element of decarbonization strategies [68,69]. The analysis indicates that the electrification of the transport fleet in the e-commerce sector can play a pivotal role in reducing CO2 emissions and fossil fuel consumption. Current research suggests that road transport is responsible for a substantial proportion of greenhouse gas emissions, and the rapid growth of e-commerce is exacerbating this problem through the increasing number of last-mile deliveries and the increased mobility of delivery vehicles [7,70]. Analyses by Tang et al. [67] and Li et al. [71] emphasize that the full electrification of urban transport can reduce emissions by up to 70–80%, which is in line with the results obtained in this study for the full electrification scenario of delivery fleets.
A salient feature that differentiates the e-commerce sector from other transport sectors pertains to the distinct nature of urban logistics, characterized by high traffic volumes, short distances, and the imperative for real-time deliveries. The literature on the subject underscores that, within this context, the integration of electric vehicles not only curtails emissions, but also engenders operational optimization by diminishing delivery times. The Monte Carlo simulations conducted in this study have demonstrated that, with full electrification, there is an average reduction in delivery time of 15%, which is consistent with the findings of previous model analyses for international logistics platforms [72]. These results underscore the dual benefits of electrification, not only reducing the environmental impact, but also enhancing the operational competitiveness of companies [73].
However, the implementation of the full electrification of the delivery fleet is not without significant challenges [74]. Chief amongst these is the development of the charging infrastructure, as emphasized by both Gnann et al. [75] and Nykvist and Sprei [32]. In addition, the impact of external factors such as ambient temperature on battery performance [39] and the social barriers associated with consumer acceptance of EV technology must be given full consideration.
The findings of the present study are of considerable significance for decision makers and companies. Political support in the form of subsidies for EVs, infrastructure expansion, and consumer education has the potential to accelerate the transition [76,77]. Simultaneously, as the IEA emphasizes [78], cross-sectoral coordination is essential to avoid the fragmentation of actions.
From a political standpoint, it is imperative to implement measures that expedite the adoption of electric vehicles within the e-commerce sector. The following measures should be considered:
- The provision of subsidies and tax incentives for logistics operators and courier companies who are investing in an EV fleet;
- The expansion of the charging infrastructure in urban centers and on access routes, with public funds playing a partial role in financing;
- Regulations restricting the entry of combustion vehicles to selected urban zones, which motivates companies to replace their fleet;
- The collaboration between the public and private sectors, through public–private partnerships, is instrumental in fostering innovation in fast charging and route optimization.
The implementation of such policies has the potential to mitigate the risk of delays in the deployment of EV fleets and enhance the economic viability of infrastructure investments. In the context of a comprehensive reduction in emissions and the enhancement of air quality, regulatory measures and institutional support are identified as pivotal for the realization of the scenarios outlined in this paper by the year 2050.
The present manuscript introduces a novel scientific approach by integrating three distinct methods—scenario analysis, linear trend modeling, and Monte Carlo simulation—into a unified framework for evaluating long-term operating costs, CO2 emissions, and delivery efficiency in the e-commerce sector by the year 2050.
This manuscript’s unique emphasis on the logistical challenges faced by the e-commerce sector, characterized by the high dynamics of the last-mile delivery and escalating consumer demands, constitutes a significant added value. In contrast to previous analyses that focused mainly on public transport or long-distance fleets, this approach takes into account the reality of intensive vehicle use and the need for fast delivery.
An additional element of originality is the explicit consideration of the role of investment in the charging infrastructure as a critical success factor (H4), instead of assuming that the implementation of electric vehicles will happen automatically.
The results of this study offer practical implications for public and private decision makers, as they are not confined to theoretical modeling, but instead indicate courses of action that can facilitate the sustainable transformation of the e-commerce sector.
All analyses confirm that full electrification has a greater impact on both delivery time and a reduction in operating costs compared to the partial electrification scenario.
In order to enhance the reliability and reproducibility of the results obtained, a number of key solutions were implemented in the domain of data analysis and presentation.
Firstly, the input data were described in detail, taking into account both the time frame (2010–2024) and the procedures for cleaning and merging the information from the selected statistical databases. This eliminated ambiguities and ensured the consistency of all variables used. In particular, data from Statista and the IEA were compared with official records and each data set was converted into consistent units (liters, kilometers, etc.).
Outliers or incomplete data were removed or averaged if they were small. However, due to the scope of this study, focusing on scenario-based projections up to 2050, some finer data points (e.g., monthly breakdowns) have been aggregated to annual values, providing a balanced approach that recognizes that deeper micro-level details may be beyond the scope of this analysis.
Secondly, in order to confirm the consistency of the results obtained, a comparison was made of the forecasts obtained in the full electrification scenario with other studies, which indicated similar directions and scales of possible benefits.
Another important assumption was the linear nature of the trends, based on the gradual increase in e-commerce observed so far and the relatively stable dynamics of improvement in the efficiency of combustion transport. Should more abrupt phenomena occur in the future (for example, significant spikes in energy prices), the model can be expanded to include additional non-linear functions, a possibility that has been identified as a natural direction for further research.
5. Conclusions
The aim of this study was to evaluate the impact of the electrification of the delivery fleet in the e-commerce sector on sustainable development, with a projection of future trends up to the year 2050. To this end, a comprehensive analysis was conducted utilizing scenario analysis, predictive modeling, and Monte Carlo simulations, examining the following three distinct variants: business-as-usual, partial electrification, and full electrification. The verification of the research hypotheses was also evaluated.
The results of the analysis confirm Hypothesis H1, demonstrating that the scenario of full electrification of the delivery fleet leads to a reduction in CO2 emissions of over 75%, compared to the BAU scenario. This indicates the significant potential of electrification in reducing the impact of the e-commerce sector on climate change.
Furthermore, the results of the analysis corroborate Hypothesis H2, demonstrating that full electrification of the delivery fleet results in a reduction in operating costs of approximately 30%, compared to the BAU scenario. This is attributable to reduced electricity costs and decreased expenditure on servicing electric vehicles.
Furthermore, the analysis substantiates Hypothesis H3, indicating that the adoption of full electrification would result in a reduction in delivery time by up to 15% by the year 2050. In contrast, partial electrification would lead to an average reduction of 7–8% in delivery time. The primary factor contributing to these outcomes is the potential for optimizing routes and eliminating the requirement of refueling electric vehicles.
The analysis further demonstrates that the full electrification scenario leads to a near-total elimination of fossil fuel consumption, while the partial electrification scenario achieves a 50–60% reduction. The findings underscore the necessity for substantial investments in the charging infrastructure and the power grid to ensure the effective implementation of this transformation (Hypothesis H4).
This study provides valuable insights for e-commerce companies, policymakers, and technology providers. According to Statista’s report “Sustainability in e-commerce” [53], consumers are increasingly paying attention to sustainability aspects, including the environmental impact of deliveries. Therefore, implementing an electrification strategy for the delivery fleet can contribute to improving the company’s image and increasing customer loyalty.
This study also emphasizes the need for support from governments and international organizations in the form of regulations promoting electromobility, investment in the charging infrastructure, and the development of battery technology. According to an analysis by the IEA [79], coordinated global action is essential in order to achieve climate goals and reduce greenhouse gas emissions.
It is important to acknowledge that this study is subject to certain assumptions and forecasts, which may not align with actual outcomes. Notably, the outcomes of the Monte Carlo simulations are contingent on the probability distributions assumed for critical parameters such as energy costs, electric vehicle prices, and the rate of technological advancement.
Moreover, this study places significant emphasis on environmental and economic considerations, while making certain social aspects of the electrification of transport, such as the impact on the labor market and changes in consumer behavior, somewhat peripheral to the primary focus.
From a pragmatic standpoint, the findings of this study suggest that logistics enterprises stand to diminish expenditures by 15–30% through the comprehensive electrification of their fleets. This objective necessitates the judicious allocation of financial resources in the domain of electric vehicles, complemented by the concurrent optimization of delivery networks. Concurrently, e-commerce operators must closely monitor the development of the charging infrastructure within urban areas and endeavor to integrate fleet management systems. This will enable the full exploitation of the advantages offered by an EV fleet, including the elimination of refueling requirements and the optimization of routes.
However, the implementation of electric vehicles cannot proceed smoothly without the involvement of public decision makers. Support in the form of subsidies, tax breaks, or the creation of public–private partnerships for the construction of charging stations can significantly accelerate and facilitate the process of fleet transformation, contributing to the reduction in emissions in city centers.
In contemplating future prospects, several areas warrant further investigation. Primarily, in circumstances of dynamic shifts in energy markets or advancements in battery technology, the efficacy of non-linear models in forecasting trends may be enhanced. Secondly, a more profound examination of social success factors, such as customers’ environmental preferences or their acceptance of extended charging times, is recommended. Thirdly, with respect to the full life cycle of electric vehicles, it is recommended that a more detailed analysis of life cycle costs be conducted, including, for example, issues such as battery recycling and reuse.
By incorporating these factors into the strategic planning process, the e-commerce sector will be able to formulate a growth strategy that achieves balance between environmental requirements and operational efficiency. This strategy will enhance competitiveness and contribute to the sustainable development of the transport industry.
Funding
This research was supported by John Paul II University, grant number PB/7/2023.
Data Availability Statement
The data is available at https://www.statista.com (accessed on 10 November 2024).
Conflicts of Interest
The author declares no conflicts of interest.
References
- Turban, E.; Outland, J.; King, D.; Lee, J.K.; Liang, T.P.; Turban, D.C. Electronic Commerce 2018: A Managerial and Social Networks Perspective, 9th ed.; Springer: Berlin/Heidelberg, Germany, 2018. [Google Scholar]
- Brynjolfsson, E.; Kahin, B. (Eds.) Understanding the Digital Economy: Data, Tools, and Research, 1st ed.; MIT Press Books: Cambridge, MA, USA, 2002; Volume 1. [Google Scholar]
- Pyra, M.; Skruibyte, I.; Kaspariene, J. Development of the Polish E-Commerce Market in Comparison to Selected EU Countries. Eur. Res. Stud. J. 2024, XXVII, 571–583. [Google Scholar] [CrossRef]
- Rayport, J.F.; Jaworski, B.J. E-Commerce; McGraw-Hill/Irwin MarketspaceU: Boston, MA, USA, 2001. [Google Scholar]
- Kalakota, R.; Whinston, A.B. Frontiers of Electronic Commerce; Addison-Wesley Publishing Company: Boston, MA, USA, 1996. [Google Scholar]
- Stallings, W.; Case, T. Business Data Communications: Infrastructure, Networking and Security; Pearson: London, UK, 2021. [Google Scholar]
- Gevaers, R.; Van de Voorde, E.; Vanelslander, T. Cost Modelling and Simulation of Last-mile Characteristics in an Innovative B2C Supply Chain Environment with Implications on Urban Areas and Cities. Procedia-Soc. Behav. Sci. 2014, 125, 398–411. [Google Scholar] [CrossRef]
- Boysen, N.; Briskorn, D.; Emde, D. Last-mile distribution. Bus. Res. 2018, 11, 255–279. [Google Scholar]
- Anderson, C. The Long Tail: Why the Future of Business Is Selling Less of More; Hyperion: New York, NY, USA, 2006. [Google Scholar]
- Agatz, N.A.H.; Absi, N.; Requejo, R.D. The last mile problem: State of the art and research opportunities. Eur. J. Oper. Res. 2008, 246, 1–14. [Google Scholar]
- IPCC. Sections. In Climate Change 2023: Synthesis Report. Contribution of Working Groups I, II and III to the Sixth Assessment Report of the Intergovernmental Panel on Climate Change; Core Writing Team, Lee, H., Romero, J., Eds.; IPCC: Geneva, Switzerland, 2023; pp. 5–115. [Google Scholar]
- EEA. Air Quality in Europe—2020 Report, 9th ed.; EEA: Luxembourg, 2020. [Google Scholar]
- IEA. CO2 Emissions in 2023; IEA: Paris, France, 2024. [Google Scholar]
- Taniguchi, E.; Thompson, R.G.; Yamada, T.; van Duin, R. City Logistics: Network Modelling and Intelligent Transport Systems; Pergamon: Oxford, UK, 2001. [Google Scholar]
- Dablanc, L. Goods transport in large European cities: Difficult to organize, difficult to modernize. J. Transp. Geogr. 2007, 15, 219–226. [Google Scholar] [CrossRef]
- McKinnon, A. Green Logistics: Improving the Environmental Performance of Logistics; Kogan Page Publishers: London, UK, 2016. [Google Scholar]
- Varma, V.; Sidharth, S.; Kedia, K.; Rathi, S. The Impact of E-Commerce on Urban Freight: A Review of the European Experience. Transp. Res. Part D Transp. Environ. 2020, 85, 102413. [Google Scholar]
- Allen, J.; Browne, M.; Macharis, C. A multi-actor perspective on urban freight consolidation. J. Transp. Geogr. 2012, 24, 29–39. [Google Scholar]
- Holguín-Veras, J.; Jaller, M.; Wang, X. Urban freight: The challenges and opportunities of a complex system. Transp. Res. Part A Policy Pract. 2015, 70, 1–16. [Google Scholar]
- Patier, D.; Routhier, J.L. Urban goods movement: Key issues and trends in French cities. Cities 2008, 25, 71–80. [Google Scholar]
- Quak, H. Sustainability of urban freight transport: Retail distribution and local regulations in cities. A review. J. Transp. Geogr. 2008, 16, 439–457. [Google Scholar]
- Brown, L.R. Eco-Economy: Building an Economy for the Earth; WW Norton & Company: New York, NY, USA, 2001. [Google Scholar]
- Sperling, D.; Gordon, D. Two Billion Cars: Driving Toward Sustainability; Oxford University Press: Oxford, UK, 2009. [Google Scholar]
- McCollum, D.L.; Yang, C. Achieving deep reductions in US transport greenhouse gas emissions: Scenarios, technology options, and policy implications. Energy Policy 2009, 37, 5863–5875. [Google Scholar] [CrossRef]
- Green, R.; Staffell, I.; Green, T. Offshore Wind Power Has Lower Cost and Lower CO2 Emissions Than Nuclear Power: How Might These Findings Affect the Financing of New Nuclear Plants? Energy 2020, 121187. [Google Scholar]
- Homberg, K.; Erdemir, A.; Andersson, P. Global tribology of electric vehicles: Challenges and opportunities. Tribol. Int. 2014, 78, 303–323. [Google Scholar]
- Yang, C.; Ogden, J.M.; Sperling, D. Techno-economic analysis of battery electric vehicle deployment in China. Transp. Res. Part D Transp. Environ. 2015, 34, 27–41. [Google Scholar]
- Bauer, F.; Díaz, M.; Zhou, Y. A review of life cycle assessment of electric vehicles. Renew. Sustain. Energy Rev. 2015, 42, 1290–1303. [Google Scholar]
- Offer, G.J.; Howey, D.; Contestabile, M.; Clague, R.; Brandon, N.P. Comparative analysis of battery electric, hydrogen fuel cell and hybrid vehicles in a future sustainable road transport system. Energy Policy 2011, 39, 1939–1950. [Google Scholar] [CrossRef]
- Wolfram, P.; Lutsey, N. Comparing the Lifetime Greenhouse Gas Emissions of Electric Cars with Those of Internal Combustion Engine Cars; International Council on Clean Transportation: Washington, DC, USA, 2016. [Google Scholar]
- Richardson, D.B. Electric vehicles and the electric grid: A review of modeling approaches. Energy Policy 2013, 60, 360–372. [Google Scholar]
- Nykvist, B.; Sprei, F. Policy instruments for accelerating electric vehicle adoption—A review of global experience. Energy Policy 2018, 124, 601–609. [Google Scholar]
- Gnann, T.; Plötz, P.; Wietschel, M. Life cycle assessment of electric vehicles: A review of methodological choices and key assumptions. Transp. Res. Part D Transp. Environ. 2018, 64, 370–379. [Google Scholar]
- Jochem, P.; Babrowski, S.; Fichtner, W. External costs of electric vehicles. Transp. Res. Part D Transp. Environ. 2016, 42, 60–76. [Google Scholar] [CrossRef]
- Pelletier, S.; Jabali, O.; Laporte, G. 50th anniversary invited article: Goods distribution with electric vehicles: Review and research perspectives. Transp. Sci. 2011, 50, 3–22. [Google Scholar] [CrossRef]
- Erdoğan, S.; Miller-Hooks, E. A green vehicle routing problem. Transp. Res. Part E Logist. Transp. Rev. 2012, 48, 100–114. [Google Scholar] [CrossRef]
- Figliozzi, M.A. Vehicle routing problem for minimizing fuel consumption and emissions. Transp. Res. Part E Logist. Transp. Rev. 2010, 46, 596–616. [Google Scholar]
- Suzuki, Y. A vehicle routing model for reducing fuel consumption and emissions. Transp. Res. Part D Transp. Environ. 2011, 16, 55–58. [Google Scholar] [CrossRef]
- Larsson, J.; Andersson, J. The effect of temperature on the performance of lithium-ion batteries in electric vehicles. J. Power Sources 2020, 466, 228324. [Google Scholar]
- Sovacool, B.K. The policy drivers of energy efficiency in vehicles: A critical review. Energy Policy 2009, 37, 4267–4275. [Google Scholar]
- Wüstemann, J.; Wirth, S.; Wimmer, M. Consumer acceptance of autonomous vehicles: A systematic review. Transp. Res. Part F Traffic Psychol. Behav. 2019, 64, 465–480. [Google Scholar]
- Coffman, M.; Bernstein, P.; Wee, S. Electric vehicles revisited: A review of state policies and economic incentives to promote electric vehicle adoption. Energy Policy 2017, 107, 464–472. [Google Scholar]
- Noori, M.; Tatari, O. Sustainability assessment of plug-in hybrid electric vehicle adoption: A system dynamics approach. Energy Policy 2016, 96, 311–322. [Google Scholar]
- Carter, C.R.; Rogers, D.S. A framework of sustainable supply chain management: Moving toward new theory. Int. J. Phys. Distrib. Logist. Manag. 2008, 38, 360–387. [Google Scholar] [CrossRef]
- Dekker, R.; Bloemhof, J.; Aiello, G. Operations Research for green logistics—A review of focusing on vehicle routing and warehousing. Eur. J. Oper. Res. 2012, 219, 671–694. [Google Scholar] [CrossRef]
- Seuring, S.; Müller, M. From a literature review to a conceptual framework for sustainable supply chain management. J. Clean. Prod. 2008, 16, 1699–1710. [Google Scholar] [CrossRef]
- Linton, J.D.; Klassen, R.; Jayaraman, V. Sustainable supply chains: An introduction. J. Oper. Manag. 2007, 25, 1075–1082. [Google Scholar] [CrossRef]
- Mollenkopf, D.A.; Ozanne, L.K.; Stolze, M.; Dotson, M.J. The circular economy and marketing: An assessment and research agenda. J. Macromarketing 2019, 39, 349–371. [Google Scholar]
- Stock, J.R. Reverse Logistics Program Development; Council of Supply Chain Management Professionals: Lombard, IL, USA, 2010. [Google Scholar]
- Ashby, A.; Leat, M.; Hudson-Smith, M. Making connections: A review of supply chain management and sustainability literature. Supply Chain. Manag. Int. J. 2012, 17, 497–516. [Google Scholar] [CrossRef]
- Gonzalez-Benito, J.; Gonzalez-Benito, O. A review of determinant factors of environmental proactivity. Bus. Strategy Environ. 2006, 15, 87–101. [Google Scholar] [CrossRef]
- Lambert, D.M.; Cooper, M.C. Issues in Supply Chain Management. Ind. Mark. Manag. 2000, 29, 65–83. [Google Scholar] [CrossRef]
- Bishop, P.; Hines, A.; Collins, T. The current state of scenario development: An overview of techniques. Foresight 2007, 9, 5–25. [Google Scholar] [CrossRef]
- Montgomery, D.C.; Jennings, C.L.; Kulahci, M. Introduction to Time Series Analysis and Forecasting; John Wiley & Sons, Inc.: Hoboken, NJ, USA, 2008. [Google Scholar]
- Kroese, D.P.; Taimre, T.; Botev, Z.I. Handbook of Monte Carlo Methods; John Wiley & Sons, Inc.: Hoboken, NJ, USA, 2011. [Google Scholar]
- Statista. Sustainability in e-Commerce. Available online: https://www.statista.com/topics/8200/sustainability-in-e-commerce/#topicOverview (accessed on 10 November 2024).
- Statista. eCommerce: Market Data & Analysis. Available online: https://www.statista.com/study/42335/ecommerce-report (accessed on 10 November 2024).
- IEA. Global EV Outlook 2023; IEA: Paris, France, 2023. [Google Scholar]
- IEA. Energy Efficiency 2024; IEA: Paris, France, 2024. [Google Scholar]
- ACEA. Vehicles in Use. Europe 2023; ACEA: Brussels, Belgium, 2023. [Google Scholar]
- ACEA. Vehicles on European Roads; ACEA: Brussels, Belgium, 2024. [Google Scholar]
- EU Commission. Going Climate-Neutral by 2050; EU Commission: Luxembourg, 2019. [Google Scholar]
- EU Commission. Decarbonisation of the Transport Infrastructure Construction; EU Commission: Brussels, Belgium, 2024. [Google Scholar]
- EU Commission. Sustainable Transport Connections Between Europe and Central Asia; EU Commission: Brussels, Belgium, 2023. [Google Scholar]
- Canalys: Global EV Market. Available online: https://www.canalys.com/newsroom/global-ev-market-2024 (accessed on 11 November 2024).
- BNEF: Electric Vehicle Outlook 2024. Available online: https://about.bnef.com/electric-vehicle-outlook (accessed on 13 November 2024).
- Tang, L.; Xiong, C.; Zhang, L. Decarbonizing urban freight transport: A global review of best practices. Transp. Res. Part D Transp. Environ. 2021, 99, 103027. [Google Scholar]
- Quak, H.; Balm, S.; Posthumus, B. Evaluation of city logistics solutions with business model analysis. Procedia-Soc. Behav. Sci. 2016, 39, 265–275. [Google Scholar] [CrossRef]
- Taefi, T.T.; Kreutzfeldt, J.; Held, T.; Fink, A. Supporting the adoption of electric vehicles in urban road freight transport–A multi-criteria analysis of policy measures in Germany. Transp. Res. Part A Policy Pract. 2016, 91, 61–79. [Google Scholar] [CrossRef]
- Edwards, J.B.; McKinnon, A.C.; Cullinane, S.L. Comparative analysis of the carbon footprints of conventional and online retailing: A “last mile” perspective. Int. J. Phys. Distrib. Logist. Manag. 2010, 40, 103–123. [Google Scholar] [CrossRef]
- Li, Z.; Liang, X.; Guo, J. Electric vehicle adoption in last-mile logistics: A case study of Chinese cities. Sustain. Cities Soc. 2023, 88, 104567. [Google Scholar]
- Yang, H.; Song, Y.; Cheng, W. Operational efficiency of electric delivery vehicles in urban micro-hubs. J. Clean. Prod. 2022, 378, 134532. [Google Scholar]
- Wang, Y.; Huang, Y.; Xu, J. Monte Carlo simulation of electric vehicle routing optimization under uncertain demand. Comput. Ind. Eng. 2021, 162, 107745. [Google Scholar]
- Bauer, C.; Hofer, J.; Althaus, H.J.; Del Duce, A.; Simons, A. The environmental performance of current and future passenger vehicles: Life cycle assessment based on a novel scenario analysis framework. Appl. Energy 2015, 157, 871–883. [Google Scholar] [CrossRef]
- Gnann, T.; Plötz, P.; Funke, S.; Wietschel, M. What is the market potential of plug-in electric vehicles as commercial passenger cars? A case study from Germany. Transp. Res. Part D Transp. Environ. 2018, 37, 171–187. [Google Scholar] [CrossRef]
- Coffman, M.; Bernstein, P.; Wee, S. Electric vehicles revisited: A review of factors that affect adoption. Transp. Rev. 2017, 37, 79–93. [Google Scholar] [CrossRef]
- Sovacool, B.K. Early modes of transport in the United States: Lessons for modern energy policymakers. Policy Soc. 2009, 27, 411–427. [Google Scholar] [CrossRef]
- Noori, M.; Tatari, O. Development of an agent-based model for regional market penetration projections of electric vehicles in the United States. Energy 2016, 96, 215–230. [Google Scholar] [CrossRef]
- IEA. World Energy Outlook; IEA: Paris, France, 2023. [Google Scholar]
Disclaimer/Publisher’s Note: The statements, opinions and data contained in all publications are solely those of the individual author(s) and contributor(s) and not of MDPI and/or the editor(s). MDPI and/or the editor(s) disclaim responsibility for any injury to people or property resulting from any ideas, methods, instructions or products referred to in the content. |
© 2025 by the author. Licensee MDPI, Basel, Switzerland. This article is an open access article distributed under the terms and conditions of the Creative Commons Attribution (CC BY) license (https://creativecommons.org/licenses/by/4.0/).