Article

Modeling and Analysis of Wind Turbine Wake Vortex Evolution Due to Time-Constant Spatial Variations in Atmospheric Flow

by
Alayna Farrell
,
Fernando Ponta
* and
North Yates
Department of Mechanical and Aerospace Engineering, Michigan Technological University, Houghton, MI 49931, USA
*
Author to whom correspondence should be addressed.
Energies 2025, 18(6), 1499; https://doi.org/10.3390/en18061499
Submission received: 4 February 2025 / Revised: 13 March 2025 / Accepted: 15 March 2025 / Published: 18 March 2025
(This article belongs to the Section A3: Wind, Wave and Tidal Energy)

Abstract

:
Modern utility-scale wind turbines are evolving toward larger, lighter, and more flexible designs to meet the growing demand for renewable energy while minimizing logistical costs. However, these advancements in lightweight design result in heightened aeroelastic sensitivity, leading to complex interactions which affect the rotor’s capacity to withstand aerodynamic loading and the cascading effects that manifest in the wake’s vortex-structure evolution under variable atmospheric conditions. In this paper, we analyze the influence of stream-wise fluctuating atmospheric flow conditions on wind turbines with large, flexible rotors through simulations of the National Rotor Testbed (NRT) turbine, located at Sandia National Labs’ Scaled Wind Farm Technology (SWiFT) facility in Lubbock, Texas. The Common Ordinary Differential Equation Framework (CODEF) modeling suite is used to simulate wind turbine aeroelastic oscillatory behavior and wind farm vortex–wake interactions for a range of conditions with spatially variant atmospheric flow. CODEF solutions for turbine operation in wind conditions featuring only one parameter fluctuation are compared to wind conditions with several wind parameter variations in combination. By isolating individual inflow variations and comparing them to multi-parameter scenarios, we determine the contributions of each atmospheric factor to rotor dynamics, wake evolution, and downstream wind farm interactions. The purpose of this paper is to analyze the effects of spatial variations in atmospheric flow on the topological evolution of wind turbine vortex wakes, which constitutes a gap in the current understanding of wind turbine wake dynamics. The insights gained from this study are particularly valuable for the development of wind farm control strategies aimed at mitigating the adverse effects of wake interactions, enhancing energy capture, and improving the overall stability of wind farm operations. With these insights, we aim to contribute to the development of modeling and simulation tools to optimize utility-scale wind power plants operating in diverse atmospheric environments.

1. Introduction

As wind turbine manufacturers strive to produce utility-scale energy output at an economical rate, cost-saving material reductions are implemented in a lightweight design while also increasing their overall scale in terms of size and number. This trend of large, lightweight rotors often compromises the blade’s structural robustness, leading to unforeseen aeroelastic behaviors of the machine during operation [1,2,3,4]. These aforementioned design changes make the blade more flexible, causing the interactions between the atmospheric flow and rotor structural response to be increasingly complex, therefore making it more difficult to predict with both experimental and computational modeling techniques. Large, flexible wind turbine rotors are particularly sensitive to spatial and temporal variations in wind speed and direction, which cause aeroelastic interactions that induce dynamic loading, blade deflections, structural fatigue, and additional cascading effects in the wakes downstream of the turbine, which scientists struggle to fully understand and predict. This is due, in part, to the difficulties associated with replicating these conditions and measuring the effects in a controlled environment. These conditions are not accurately recreated to scale in wind tunnel testing, and the effects are not adequately captured by many current computational modeling techniques which employ a simplified atmospheric flow condition [5,6]. To ensure the optimal performance, enhanced reliability, and extended lifespans of these next-generation wind turbines operating under diverse environmental conditions, and to improve the predictive capabilities of current research and development tools in general, a more detailed and accurate representation of fluctuations within the wind farm flow is essential [7,8].
With the rapid evolution of the blade structure and geometry with their growth in size, previous wind tunnel experiments performed with a more classic blade type cannot be directly compared to more modern large and flexible blades. This is due to their proportional dissimilarities, the challenges in the scalability of their dynamic behaviors, and the impact these factors have on the physical phenomena being studied [9]. Similarly, there are also inherent challenges in recreating scaled-down wind tunnel flow which accurately reflects the atmospheric fluctuations naturally observed at full scale. Additionally, wind tunnel testing cannot be performed with these large turbine blades at full scale because their dimensions now surpass the capacity of the largest available facilities [10]. Consequently, these modern utility-size blades and their complex interactions with diverse atmospheric conditions are often analyzed through computational models which assess the aeroelastic behavior of wind turbines and their fluid dynamic interactions within wind farms.
The tradeoff between computational efficiency and physical accuracy in wind turbine and wind farm simulations is important to consider when selecting a modeling technique for analysis. While high-fidelity simulations such as direct numerical simulation of Navier–Stokes equations [11] are capable of providing incredibly detailed insights into aerodynamic behavior and wake dynamics for cases with complex operational conditions, they are often computationally expensive and time-consuming. To avoid these costs, simplified models offer improved computational efficiency, but they sacrifice some physical accuracy, making them suitable for control applications, early-stage design, and large-scale studies. Scientists and engineers often choose a more balanced approach which offers a compromise for modern applications, and recent developments often involve hybrid models which optimize both accuracy and computational resource usage, depending on the specific problem at hand.
Reynolds-averaged Navier–Stokes (RANS) [12,13,14,15] and large eddy simulation (LES) techniques [16,17,18,19] are quite commonly used in modern research, but they require high amounts of computational resources [20,21]. In a common solution which is more economical, Burton et al. [22] and Manwell et al. [23] employed adaptations of the blade element momentum (BEM) model where the blade’s structural and fluid flow models are coupled to reduce the computational cost of evaluations of the rotor flow and aeroelastic response. Ponta et al. [24] utilized a further adapted BEM technique as part of a more complex common ordinary differential equation framework (CODEF) with other multi-physics simulation modules to characterize and evaluate solutions for complex dynamics of large wind turbine and wind farm flow interactions with high fidelity at a computational cost which is much less than what is achieved with the LES or RANS approaches.
CODEF is an extremely valuable tool for this research thrust due to its cost-effective and accurate computational performance. We use CODEF in this study to perform a high-fidelity analysis of modern utility-scale turbine operations in spatially variant atmospheric flow conditions. More specifically, we explore how different wind velocity profiles influence the evolution of vortex wake structures as they advect downstream of the turbine and interact with changing atmospheric flow. This was investigated via a virtual model of the Sandia National Labs (SNL) National Rotor Testbed (NRT) turbine, located at the SNL Scaled Wind Farm Technology (SWiFT) facility in Lubbock, Texas [25,26,27]. The NRT blade was selected because it was designed with the intention of studying the behavior of large, flexible wind turbines while being scaled down to minimize the costs associated with testing and analysis. The NRT blade was modeled in CODEF using information provided by Kelley [28], including material specifications, constructive techniques, blade mechanical characteristics, and turbine control properties. Careful attention was given to accurately modeling the mechanical properties of the composite materials within the blade to ensure proper representation of the blade’s aeroelastic behavior during simulated operations [29,30].
The NRT rotor was simulated with several scenarios representing variant wind conditions by strategically fluctuating each atmospheric parameter—wind speed, direction, vertical shear, and veer—in coordination with the downwind distance from the turbine. These parameters were first varied independently while keeping all other parameters constant in the atmospheric flow, and then the combined effects were explored by varying multiple parameters at once. In all scenarios, the atmospheric parameters vary only in terms of space and not time. In using this approach, we explore the role of atmospheric spatial variance in the dynamics of wind turbine and wind farm flow interactions, independent of the effect of temporal atmospheric fluctuations in the wind profile.
The purpose of this paper is to analyze the effects of spatial variations in atmospheric flow on the topological evolution of wind turbine vortex wakes, which constitutes a gap in the current understanding of wind turbine wake dynamics. We present various solutions and analysis of visualizations of the wake vorticity structures within wind farm flow to identify the effects caused by stream-wise atmospheric flow fluctuations in background wind. Special attention has been directed toward elucidating the influences of different mechanisms of mutual advection in vortex dynamics as well as identifying how interactions between turbine wakes and various atmospheric flow states yield discernible changes in turbine wake vortex structures.
In Section 2, a summarized description of the CODEF simulation routines discusses the model’s theoretical basis, mathematical derivations, computational processes, and methodology of atmospheric flow characterization relating to this work. Next, Section 3 presents and discusses vortex wake solutions which exemplify phenomena evoked from various scenarios of stream-wise spatial variation of atmospheric flow characteristics. Lastly, Section 4 summarizes the work and discusses the relevant conclusions and findings.

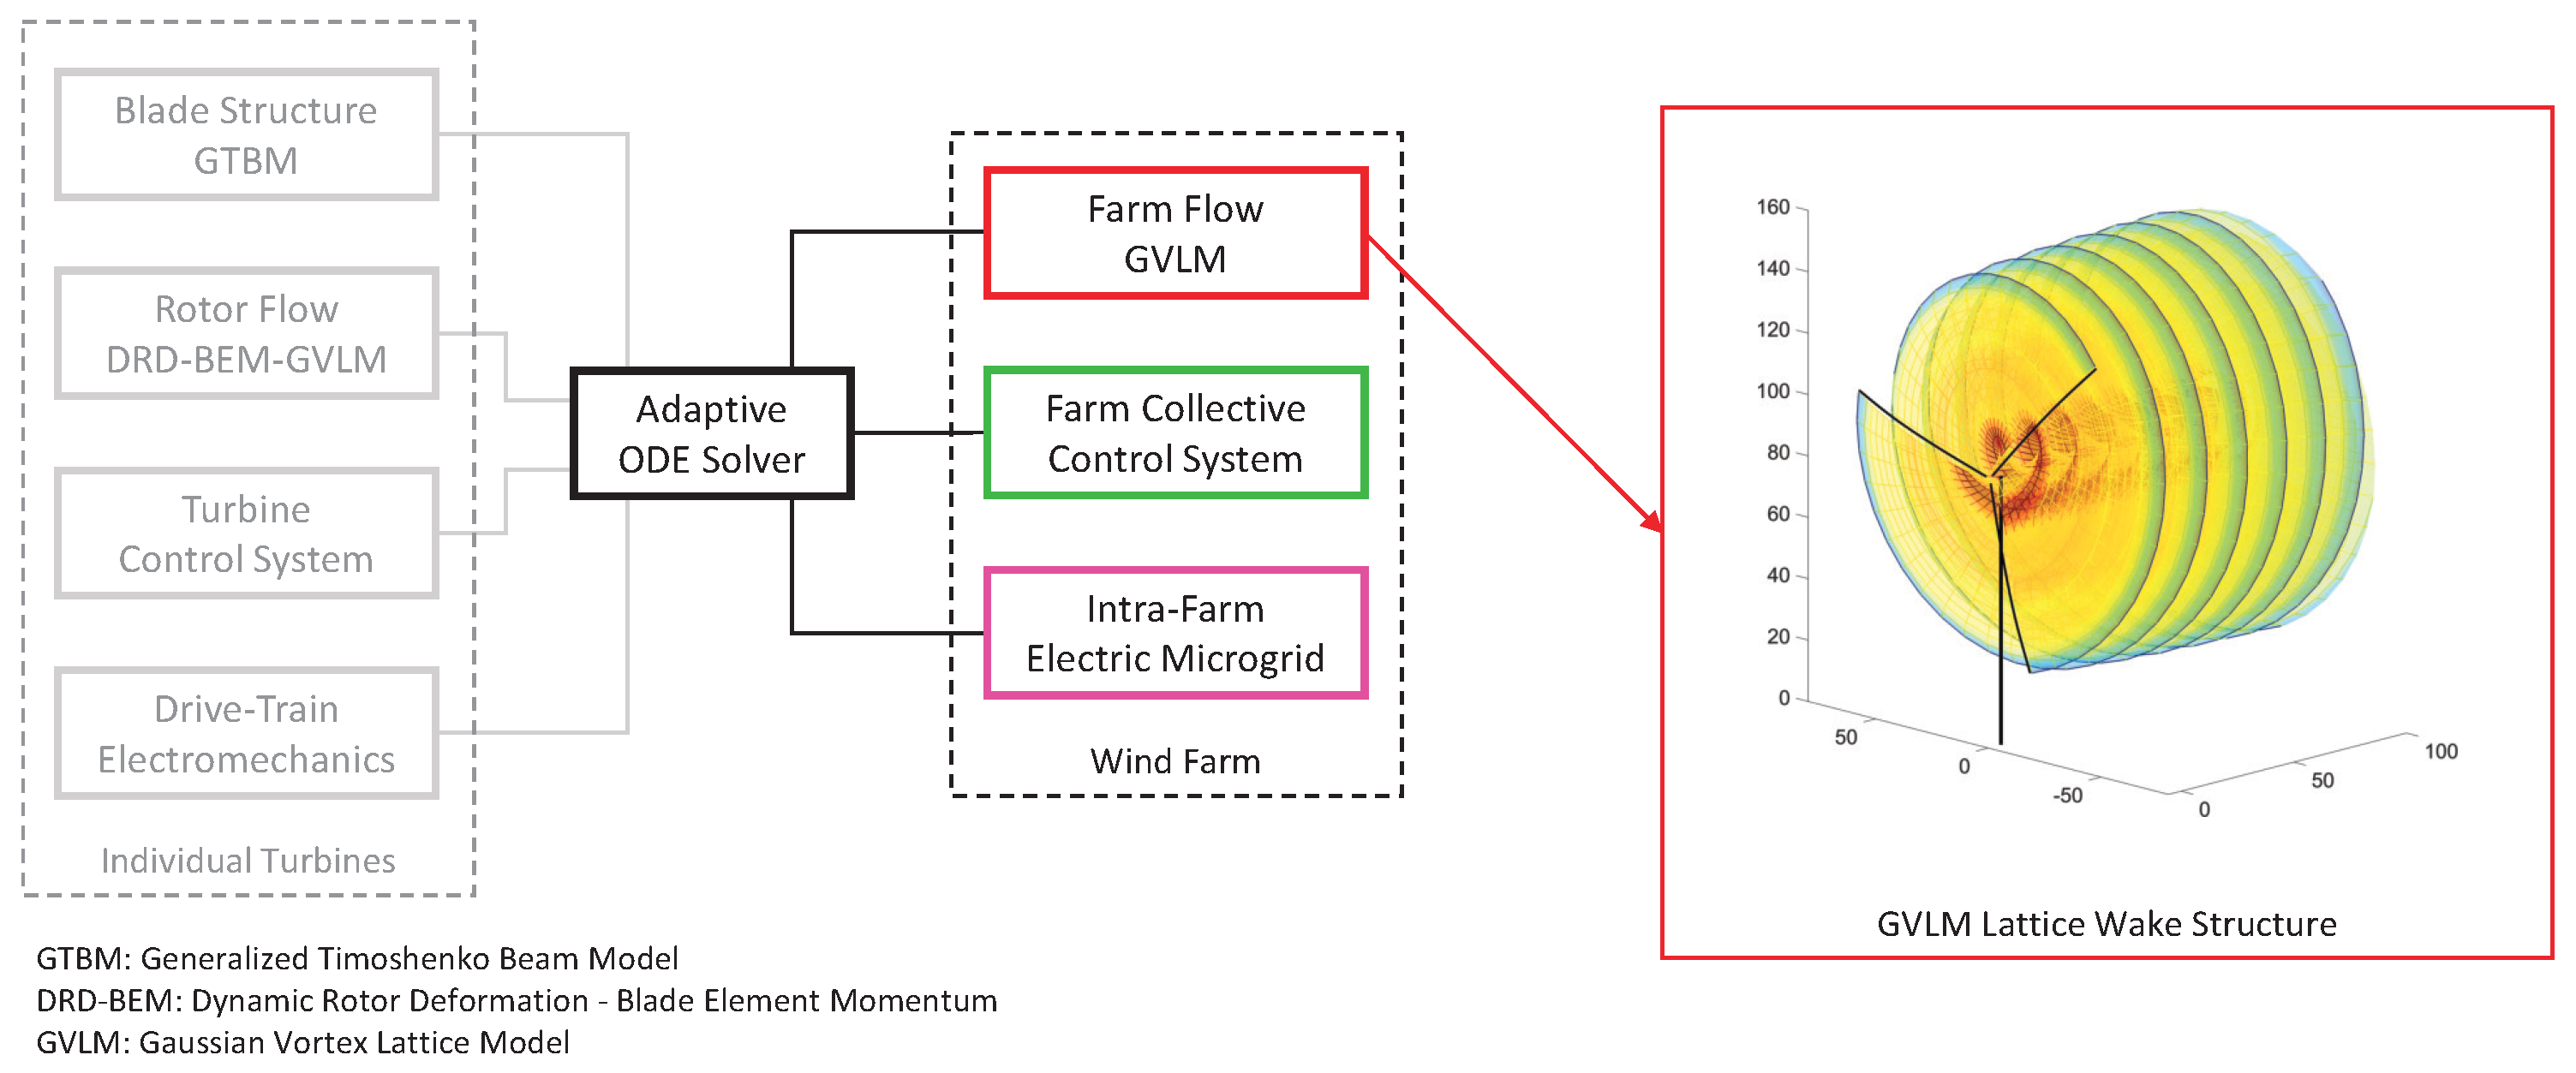
2. The CODEF Modeling Suite and the Methodology of Analysis

In this section, we give a generalized description of CODEF regarding its applications in simulating wind turbine and farm flow dynamics. In this work, we employ the capacities of CODEF to asses wind farm flow interactions and the role of mutual advection of vortex wake filaments in a spatially variant flow field.
As a cooperative framework of multi-physics modeling tools, CODEF is governed by a central ordinary differential equation (ODE) solver, which serves to unify the calculative processes of the adaptive time step iterations and minimize the truncation error as a solution is reached. As shown in Figure 1, the independent modules contain definitions of the basic principles of wind farm dynamics, such as the governing equations and boundary conditions which dictate the modeling of wind turbine and farm controls, atmospheric characterization, rotor and farm flow, operational deformations of blade structure, and more. Together, the ODE integrates the submodules collectively in a time-marching routine which efficiently evaluates an accurate solution of wind farm flow dynamics.
In addition to showing a flowchart representation of the CODEF suite and its individual modules, Figure 1 shows an example of the GVLM lattice wake structure. The color pattern used in the lattice wake depiction in this figure, as well as all vortex lattice depictions in this work, is not associated with any specific physical quantity and provided only to enhance the visual perception of the vortex lattice structure.
The subsections which follow outline the function and theoretical principles governing the CODEF submodules and how they pertain to this research. Additional details involving CODEF’s aeroelastic computational routines and validation studies can be found in the work of Ponta et al. [24].

2.1. Model for Turbine Blade Structure and Aeroelastic Response

An advanced implementation of the classic blade element momentum (BEM) model is utilized in CODEF to evaluate rotor flow dynamics and blade aeroelastic behavior. In the classic BEM method, the tubine rotor is simplified to an idealized actuator disk, and the flow across this plane is theoretically contained within a stream tube control volume, where aerodynamic forces can be computed by analyzing the change in momentum across the stream tube actuator disk. This classic BEM model is highly valuable and widely accepted but could be improved in the sense that it neglects considering temporal changes to the blade shape within the rotor during operation.
In CODEF, the adapted BEM method characterizes rotor aeroelastic behaviors in a much more robust way using the dynamic rotor deformation - blade element momentum (DRD-BEM) model. In this implementation, the structural model communicates instantaneous blade section deformation solutions to the DRD-BEM model at each time step iteration to represent real-time warping of the blades and rotor, therefore enriching the calculations of the resulting aeroelastic responses [24]. The DRD-BEM model is comprised of this adapted BEM technique fully coupled with the blade structural model, which employs a version of the generalized Timoshenko beam model (GTBM) for dimensional reduction.
The GTBM economizes the calculation of a three-dimensional blade structure to temporally variable, one-dimensional, nonlinear computations of pre-solved blade section planes along the span. Much like the classical Timshenko theory, the turbine blade is reduced to a model of a beam with equivalent stiffness through finite-element analyses of two-dimensional planes at locations along the span of the blade [31]. CODEF alters the original GTBM theory by foregoing the assumption that these span-wise planes must remain undeformed. With this modification, instantaneous blade section deformations are solved by interpolating on a two-dimensional mesh so that three-dimensional strain energy can be represented by a 6 × 6 matrix which is fully expressed in terms from the original Timoshenko theory. Thus, dimensionality of the problem is reduced, allowing the full structural properties and response of the blade to be captured with much less computational expense.
The DRD-BEM model leverages the coupled deformation modes evaluated by the GTBM to inform its assessment of rotor flow, accounting for warping of the blade shape and adjustments to the aerodynamic attitude during operation through a series of orthogonal matrix linear operators affecting coordinate transformations. The first of these coordinate transformations is performed to account for misalignments of the incoming flow relative to the hub, according to the varying yaw offset ( C Δ θ y a w ), tilt ( C θ t l t ), and angle of azimuth ( C θ a z ). This serves to align the BEM annular actuator disk with the coordinate system of the hub, facilitating the evaluation of the axial and tangential induction factors. These factors can then be used to solve for the velocity vector in the hub coordinate system, representing the wind after it is influenced by interference at the rotor.
Additional linear operators representing position changes due to cone and pitch angles are applied to the wind velocity vector to align with respect to the blade root coordinate system. Solutions for instantaneous blade warping, mechanical actions, and structural vibrations are also incorporated from the structural model at this time to alter the blade section configuration for the computation of the the final velocity vector.
From these calculations, the resulting velocity vector expresses each blade section’s angle of attack relative to the flow. Based on the lift and drag coefficients associated with this angle of attack, the total aerodynamic load can be calculated at each blade element or projected back into the hub coordinate by performing the aforementioned coordinate transformations in the opposite manner [24].
Full elucidation of this span-wise aerodynamic loading distribution enables CODEF to produce high-fidelity solutions for fluid–structure interactions in a turbine at farm scale. The reason for coupling the DRD-BEM module in the process of wake calculations is to represent the effect of blade section deformation on the aerodynamic parameters which determine the vortex shedding process, which generates the wake structure.
More information is included in the work of Ponta et al. [24] to describe the DRD-BEM formulation and full mathematical derivation, including validation testing against the results presented by Jonkman et al. [32] and Xudong et al. [33]. For extended details regarding the integrated coupling and validation testing of the GTBM structural model within the DRD-BEM method, the reader is referred to Ponta et al. [24] and Otero and Ponta [31]. For further reading on DRD-BEM’s practical applications in research, Otero and Ponta [34] examined the influence of blade section misalignments on cyclic loading of the rotor. Jalal et al. [35] reported on the oscillatory response induced by gust pulses on wind turbine blades, Menon and Ponta [36] investigated flap control actions, and Rajan and Ponta [37] studied rotor responses in high aerodynamic interference conditions.

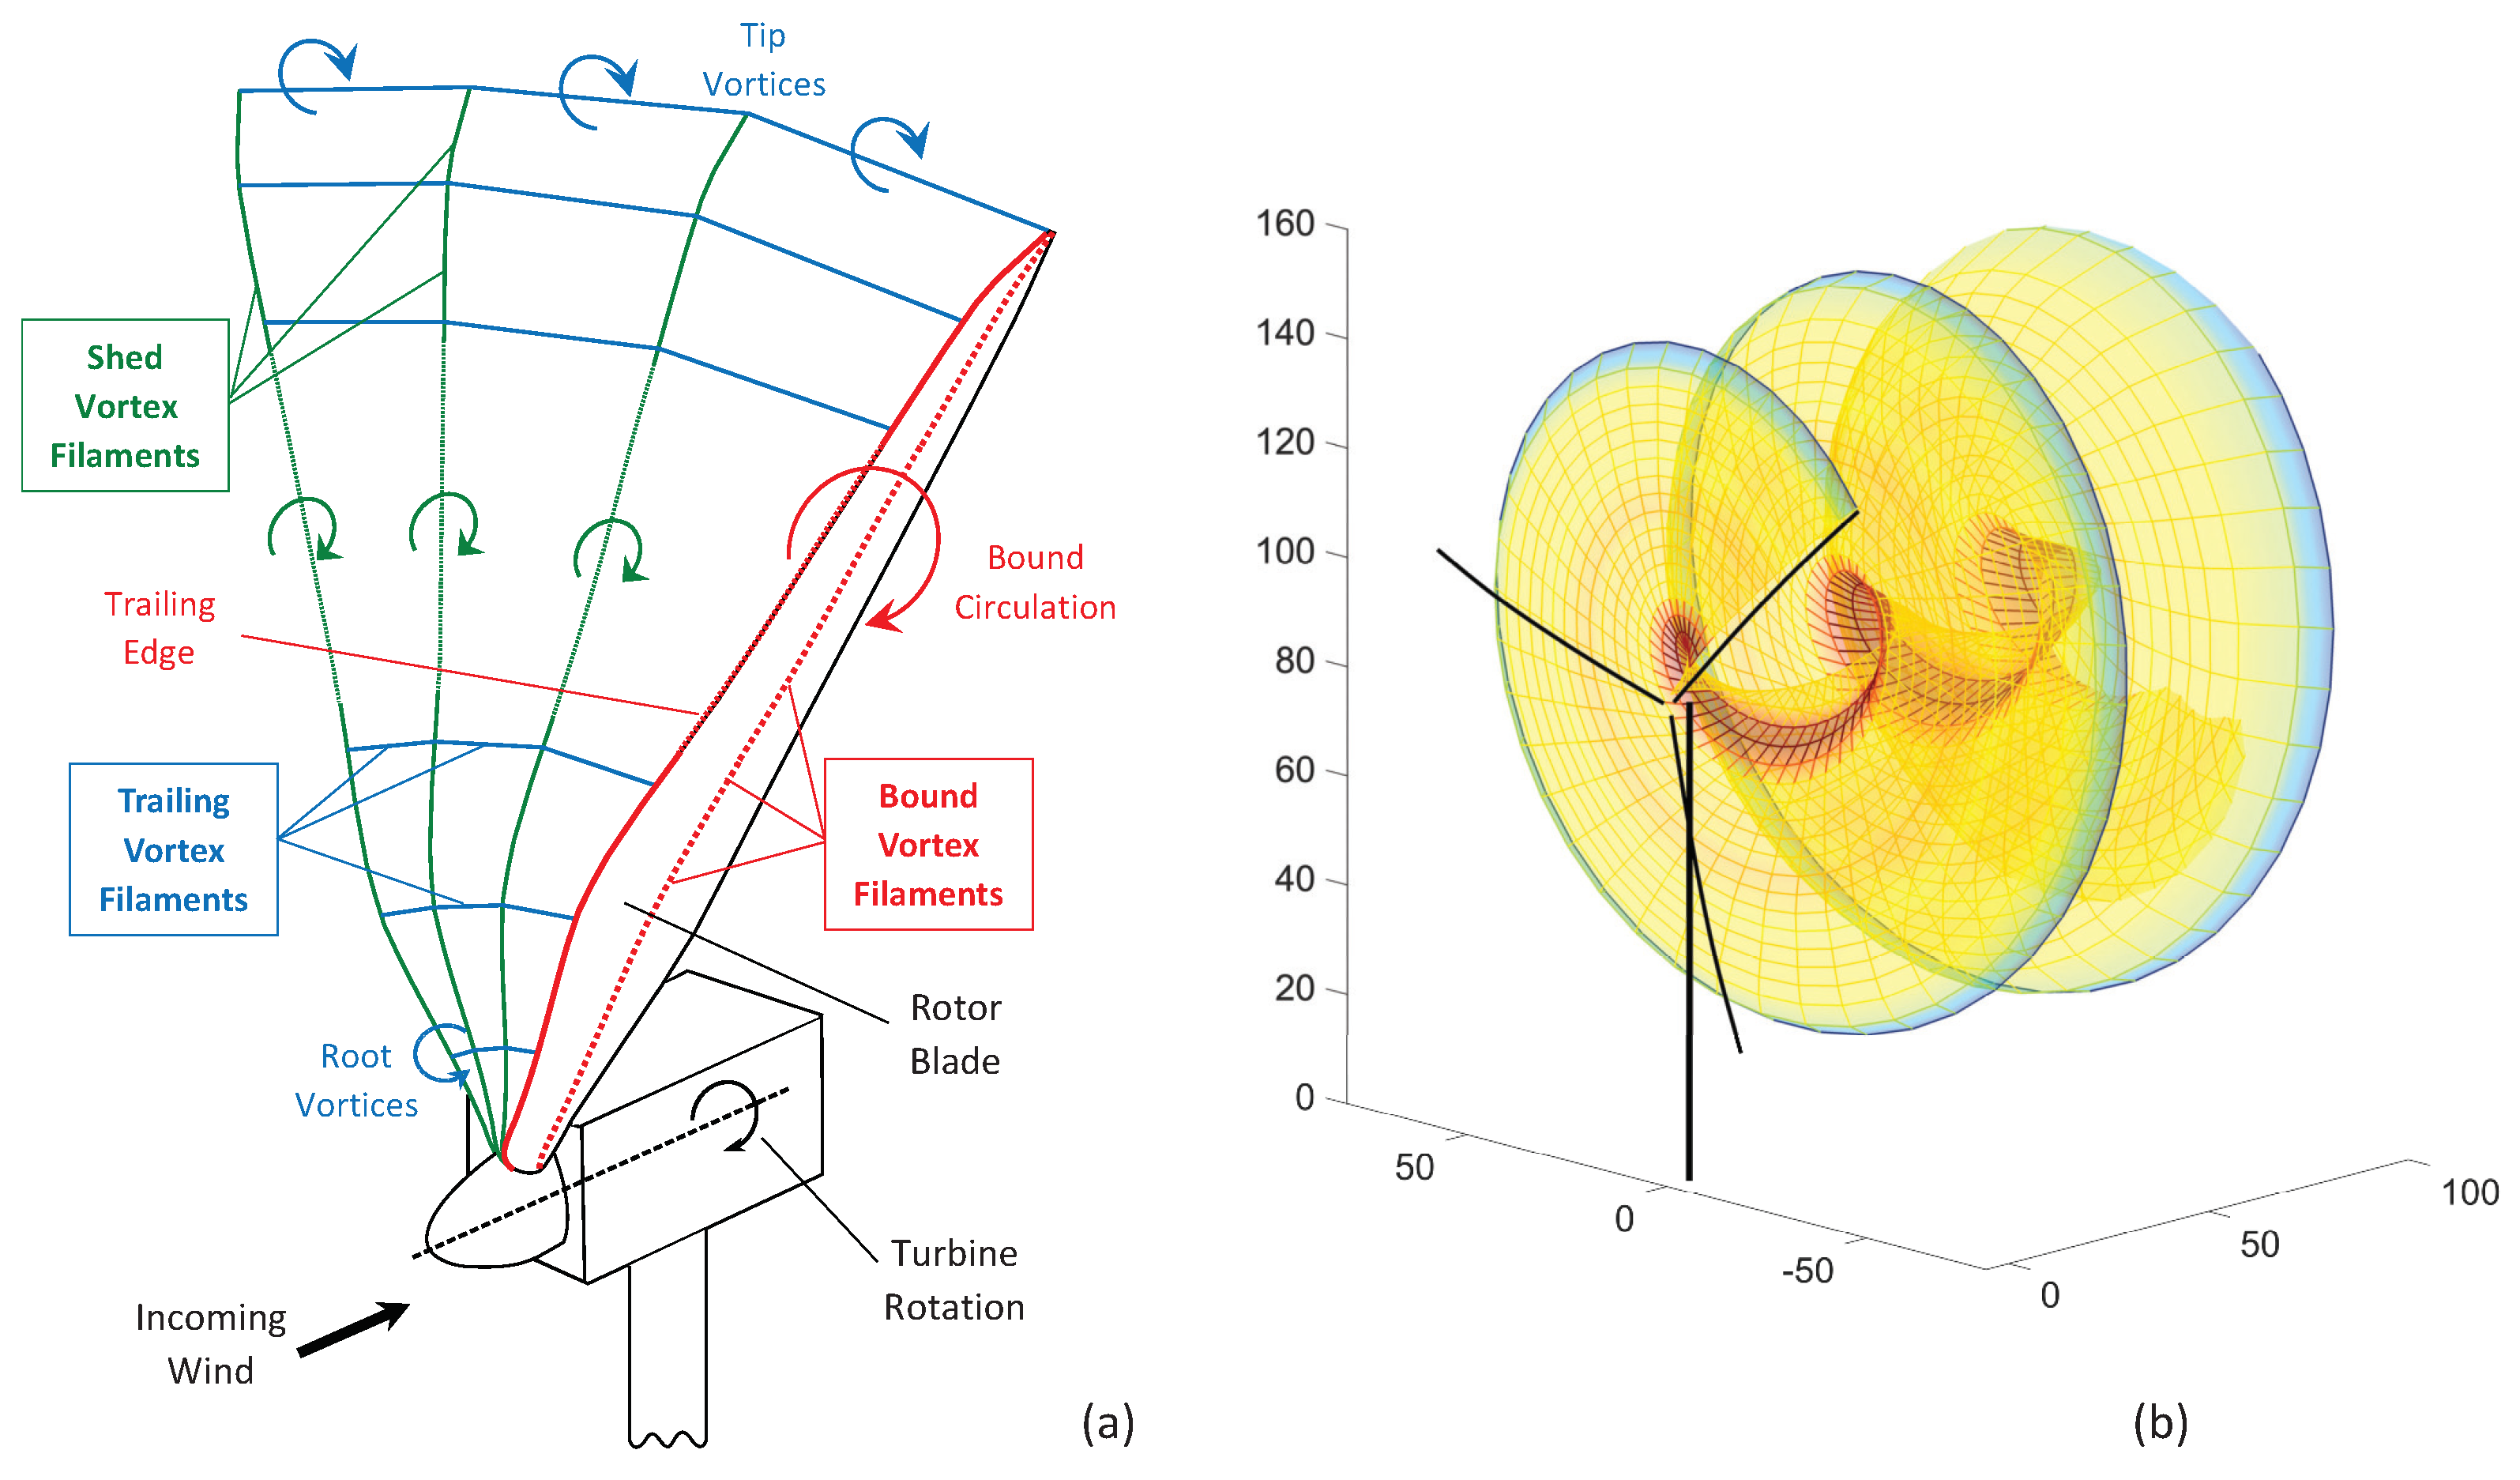
2.2. Turbine Wake Flow Model

In this work, CODEF’s Gaussian-core vortex lattice model (GVLM) is used to produce detailed solutions for wind farm vortex–wake interactions and to demonstrate the influence of spatial fluctuations on background atmospheric flow. The description of the CODEF GVLM in this section is limited to its relevance to this study in order to present a thorough overview without unnecessary complexity. The work of Baruah and Ponta [38] can be explored for a more detailed explanation of the GVLM’s theoretical foundation, analytical derivation, and additional elaboration of the iterative processes of vortex lattice generation and validation testing comparing the GVLM simulations of SNL’s SWiFT facility to LiDAR field measurements at the SWiFT site [39].
As described by Baruah and Ponta [38], this advanced vortex wake model generates high-fidelity simulations of wind farm flow dynamics while maintaining computational efficiency through the use of time-dependent aeroelastic blade responses and span-wise evaluations of circulation from the DRD-BEM model. These DRD-BEM solutions, combined with detailed characterizations of atmospheric flow, are used to compute the shedding of vortex structures at the turbine’s rotor and their subsequent advection with unique patterns of the velocity downstream of the turbine.
These vortex wake solutions are extremely valuable to this research because they help elucidate the nature of wake interactions with diverse wind farm flow conditions and how complex wind profiles may influence the formation and evolution of velocity patterns in the propagated wake.
In the following Section 2.3, and also in the work of Baruah and Ponta [38], we explain the methods of CODEF atmospheric inflow characterization in greater detail. In short, undisturbed wind farm flow is defined in three spatial dimensions in a time series with the use of four primary input parameters: wind speed, direction, vertical shear, and veer. The DRD-BEM model uses this definition of the wind velocity in the flow field domain to project the calculation of the corresponding circulation of flow relative to the rotor plane and individual blade elements.The evaluation of circulation is passed to the GVLM, which employs the Kutta-Jukowski lift theorem at the span-wise blade elements to to generate the resulting bound vortex filaments [40].
Figure 2 shows a schematic description of the process of generation of the vortex lattice associated with each one of the turbine blades, indicating how the individual filaments are arranged to form the three dimensional lattice structure, which propagates downstream of the rotor to form the turbine’s wake. In this process, each time-step iteration evaluates the vorticity strength of a finite-length bound vortex filament at the blade’s quarter chord, which corresponds to the instantaneous solution of circulation about the blade element. As iterations march in time, a new bound filament is formed at each time-step, and the bound vortex filament from the previous time step is shed at the trailing edge of the blade.
From successive iterations of the ODE solver over time, the GVLM arranges the cumulative sequence of vortex filaments to create a propagating vortex lattice. This forms a detailed representation of the wake structure, which evolves as the filaments mutually advect, interacting among themselves and with the downstream velocity patterns of the background wind.
The GVLM evaluates the position of each nodal point in the lattice, as it interacts with the surrounding flow after it is generated. The calculated distance traveled by the points in the wake structure is dependent on the varying velocity patterns of the wind farm flow, simultaneously including the effects of the mutual advection of the wake and the surrounding wind flow. The vorticity of the wake structure also influences the velocity distribution in the surrounding flow of other downwind rotors in the farm.
The velocity induced in the ambient atmosphere by the vortex wake structure is projected by applying the velocity induction law for a finite-length vortex filament [41,42]. The classic Biot–Savart approach of singularity vorticity representation is often implemented for this application, but because the nature of this simplification causes impossibly large overestimations of the induced velocity at locations close to the vortex core, the GVLM employs an improved version of this approach which utilizes finite-length vortex filaments with Gaussian distributions of the vorticity in their cores. The Gaussian-core representation, presented by Baruah and Ponta [38], does not have the issue of overestimation of the near-core velocity induction, and thus it is capable of producing more realistic projections of the velocity induced by the vortex wake in wind farm flow, as well as an improved depiction of viscous decay.
Since the GVLM models the diffusive decay of the vortex filament core, computation is substantially economized through elimination from the lattice filaments with highly diffused cores, as their impact becomes insignificant. This realistic calculation of the velocity induced by the vortex lattice structure within the background atmospheric flow enables the GVLM to accurately map downstream velocity patterns, displaying the topology of the evolved wake for the assessment of how changes in the velocity distributions in wind flow and wind fluctuations influence the wake structure and overall flow dynamics.
This study leverages GVLM solutions to analyze how the vortex wake forms and evolves under a variety of spatially fluctuating wind conditions. The results presented here use the evolved depictions of the wake’s vortex lattice structure generated from the calculated induced velocities and the background wind as a way to convey the principles which govern the vortex dynamics of the farm flow and its interactions with the atmospheric surrounding flow.
This section has been limited to essential details pertaining to the scope of this work, but further discussion on the Gaussian vortex core distributions and methods for generating vortex-filament cores can be found in the works of Ponta [43], Flór and van Heijst [44], Trieling et al. [45], Hooker [46], and Lamb [47]. Comprehensive discussions on free vortex lattice methods and vortex-filament velocity induction were also discussed in further detail by Cottet and Koumoutsako [48], Strickland et al. [42], and Karamcheti [49].
Detailed derivations, validation, and implementations of the GVLM are further elaborated upon in the works of Ponta and Jacovkis [41], Ponta [43], and Baruah and Ponta [38].

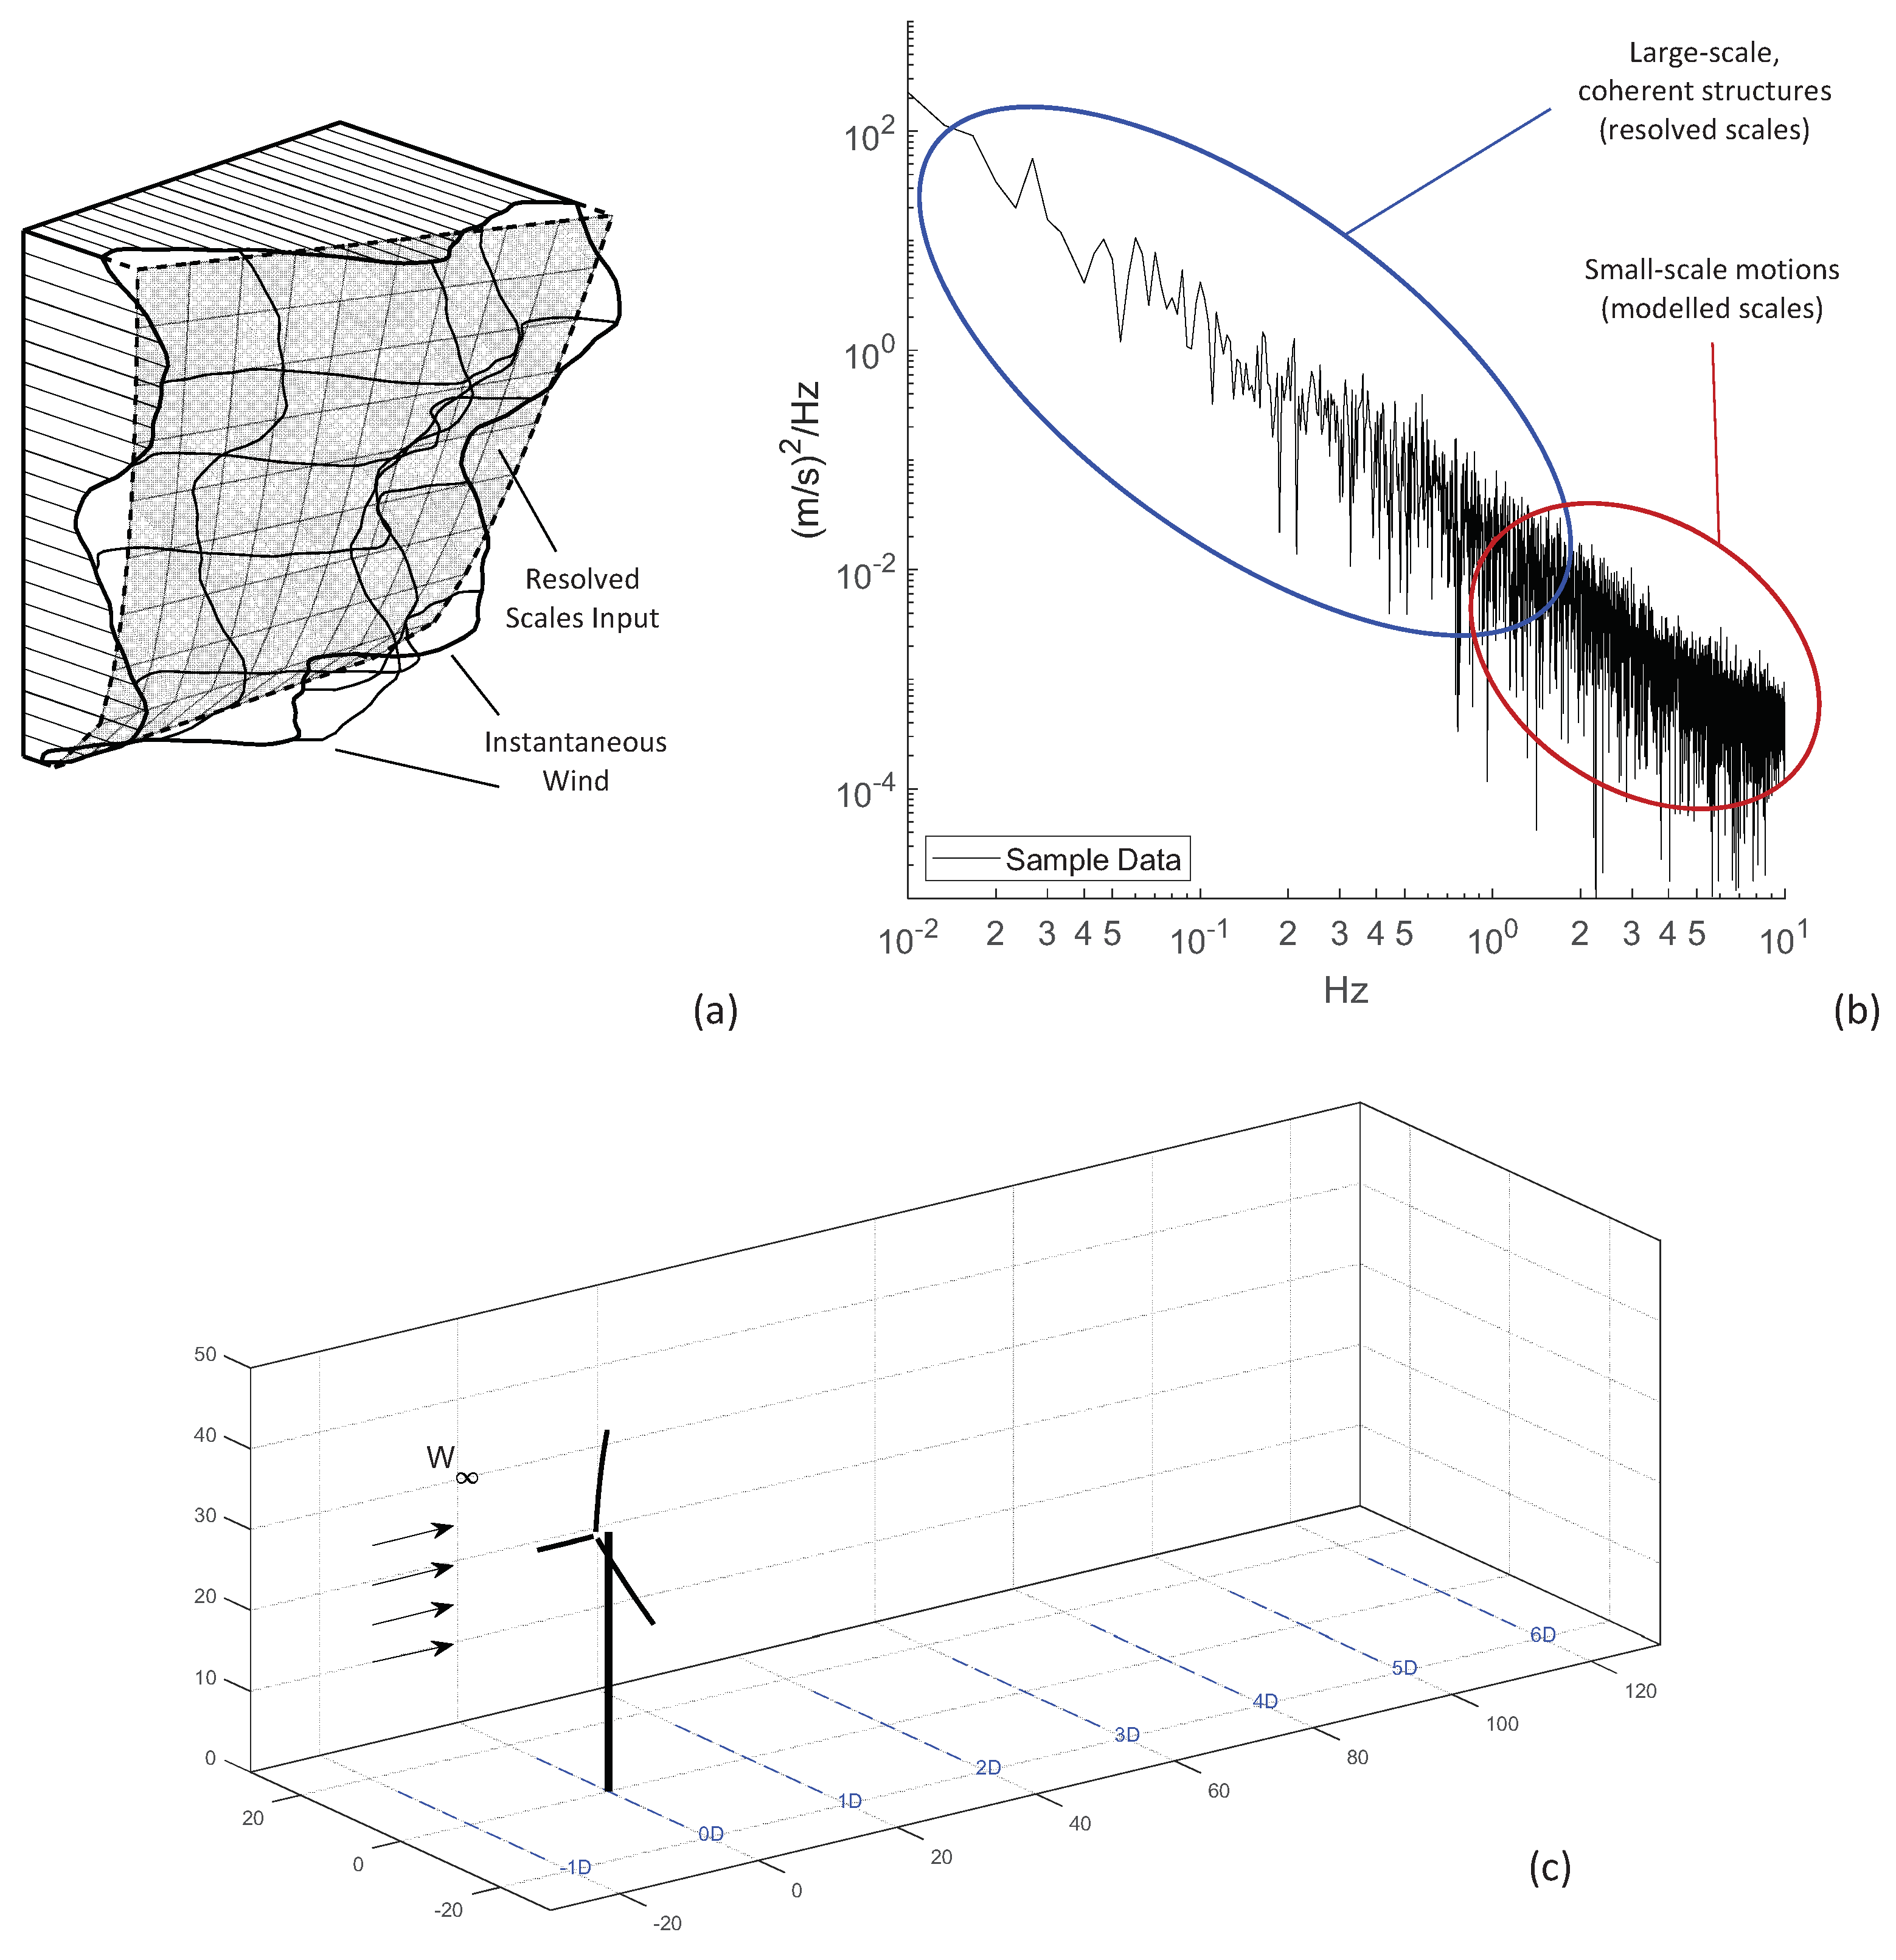
2.3. Atmospheric Flow Characterization

Patterns of velocity distribution which occur naturally in atmospheric flow commonly cause fluctuating aerodynamic loads on the rotor and dramatically influence the behavior of wake–structure interactions [50,51,52]. Thus, the capability of the model for atmospheric flow within the CODEF directly affects the merit of the solution for the wind turbine performance, vortex-wake structure, and farm flow dynamics.
State-of-the-art methods in wind turbine modeling typically characterize hub-height variables like wind speed (WS) and wind direction (WD), as well as the exponent of the power law representation of a vertical wind velocity profile ( α , usually called “vertical shear”) as field variables, frequently in a steady-in-the-average sense, and they do not typically include veer.
Previous versions of the CODEF improved upon this basic approach by including the aforementioned variables plus veer, with cross-sectional wind characteristics applied uniformly along the depth of the entire flow domain of the wind farm. Additionally, all CODEF wind field variables for both the hub height (WS and WD) and the flow’s cross-sectional plane (shear and veer) change over time according to anemometry measurements.
CODEF improvements in the current research include the added capacity of modeling variable wind distributions in the flow’s cross-sectional planes along the depth of the entire flow domain of the wind farm. This means that flow field variables change with space and time all over the three-dimensional domain of an entire farm, taking into account the propagation of distinctive, gust-like coherent structures in the atmospheric flow.
Time-varying spatial distributions of the four inflow parameter values of wind speed, wind direction, vertical wind shear α , and directional veer are defined at locations a certain height above ground (the z direction), across the span-wise width of the turbine rotor (the y direction), and a stream-wise depth perpendicular to the rotor (the x direction) to describe the characteristics of ambient atmospheric flow at each simulated time step.
These variables are well established and have been widely applied as an industry standard. The wind profile at depths in the x direction is created by taking the hub-height variables of wind speed and wind direction at a location and projecting the cross-plane parameters of vertical wind shear and directional veer in the z direction.
Since these four parameters vary over time, they must be obtained for the model by interpolating them over time from a user-defined series of values. The user inputs can be synthesized artificially to represent a hypothetical scenario of interest, or the inputs can be derived from real anemometer wind farm measurements. As these parameters relate to real wind measurements, they will include the wind speed W w i n d and wind direction θ w i n d defined at the turbine’s hub height, in addition to the directional veer θ v e e r and the wind shear exponent α . W w i n d is observed to be the speed of undisturbed wind at the turbine’s hub, which is defined in meters per second.
It is important to also note the yaw offset of the turbine θ Δ y a w , which could be obtained by subtracting the angular alignment of the rotor’s azimuthal axis from θ w i n d , where a positive θ Δ y a w value signifies a positive yaw offset. To express variation in θ w i n d in the z direction across the rotor plane, θ v e e r can be defined by evaluating the angular difference of the wind direction observed at the two vertical extremes of the rotor plane. Additionally, the gradient of W w i n d in the z direction α is defined using the power law curve, which is a well-established method for describing wind shear velocity profiles [22,23]. This expression for α is defined in Equation (1):
W ( z ) = W ( z r e f ) z z r e f α
where the subscript r e f refers to values at a reference height, which in our case is the hub height.
Spatiotemporal fluctuations occur in wind at a wide variety of scales, ranging from small, chaotic eddies to large, organized structures. At the microscale, these often manifest as small, rapid fluctuations. But, on a larger scale, these can involve more coherent vortical formations which emerge in the wake of objects such as wind turbines. Each scale plays a crucial role in determining the behavior of wind and its impact. Because of this, the CODEF GVLM models variations in the wind differently, depending on the time scale of the fluctuation.
Figure 3 shows conceptual representations of the way the CODEF models turbulent wind fluctuations. Figure 3a shows a schematic view of the mean wind profile representing the input for CODEF-resolved scales, overlaid with an instantaneous wind field which includes small-scale turbulent motions. Figure 3b displays the power spectral density for a sample of an anemometer reading at the SWiFT facility [53]. Figure 3c shows a visualization of how wind parameters are modeled in the y z plane and in the x direction, also including an example for the indication of distances downstream of a hypothetical rotor 20 m in diameter as 1D, 2D, and so on.
As referenced in Figure 3a,b, the larger-scale, coherent structures in the turbulent atmospheric flow are introduced via the user input for the resolved scales, where the four atmospheric parameters are defined with respect to time and space to quantify the spatiotemporal changes in an undisturbed flow. A mean wind y z profile is used to represent the overall characteristics of the wind and its cross-plane variation at any specific location along the x direction of the flow field. These curvilinear profiles are established at various upstream and downstream locations relative to the turbine to introduce the resolved-scale fluctuations existing in the farm flow in three dimensions.
The resolved-scale structures are distinct from smaller-scale, high-frequency variation patterns due to their powerful coherent vorticity content, which gives them the ability to resist decay longer over time. Thus, these larger vortex structures occur at a lower frequency, which can be resolved by the GVLM vortex lattice. The “resolved-scale input” in Figure 3a demonstrates the manifestation of the induced velocity patterns originating from the coherent structures and how they are introduced in the GVLM.
Conversely, smaller-scale fluctuations in shorter-term wind variations are captured in the GVLM by an equivalent turbulent diffusivity coefficient (TDC). This coefficient governs the diffusion of vorticity in the Gaussian core of vortex filaments within the wake of the vortex lattice. These small-scale fluctuations are visualized in Figure 3b, where the difference between the “instantaneous wind” and the “resolved scales input” depicts the magnitude of these small-scale fluctuations. The TDC in the GVLM is used to model the effects of such fluctuations by controlling the rate of vorticity decay in the vortex core and dissipation in the wake.
The TDC can be seen as the Gaussian vortex lattice analogue to the eddy viscosity used in the traditional sub-grid scale models in LES or RANS. In a work by Baruah and Ponta [38], the TDC was thoroughly calibrated and validated to achieve accurate representation of various levels of turbulence intensity through comparison studies of GVLM solutions to LiDAR wake velocity scans from Herges et al. [39,54]. For further reading on this subject and more information about the TDC and the GVLM representation of atmospheric flow fluctuations, the reader is referred to Baruah and Ponta [38].
The effects of the parameters defined in this section can be highly complex and dependent on the specific dynamics of particular scenarios, but they can be summarized as follows. In general, wake structures are advected depending on the speed of the surrounding atmospheric flow. Therefore, changes in wind speed can affect the width of the wake and the relative positions of the vortical structures which compose it. Similarly, under changing wind directions, the wake can shift, meander, or become unstable. With increasing shear, portions of the wake cross-section located at different elevations are advected at different velocities, producing effects on the wake structure including rising of the centerline of the wake.
Lastly, vertical wind shear causes the wake to skew, offsetting the alignment and stability of the vortex structures within. From the aformentioned primary effects, secondary effects also arise as a result of the mutual advection of vortex filaments in patterns of wind farm flow velocity which vary in depth. In the following sections of this work, CODEF solutions are presented to enable in-depth analysis of farm flow dynamics, as vortices propagate downstream in spatially varying velocity fields.

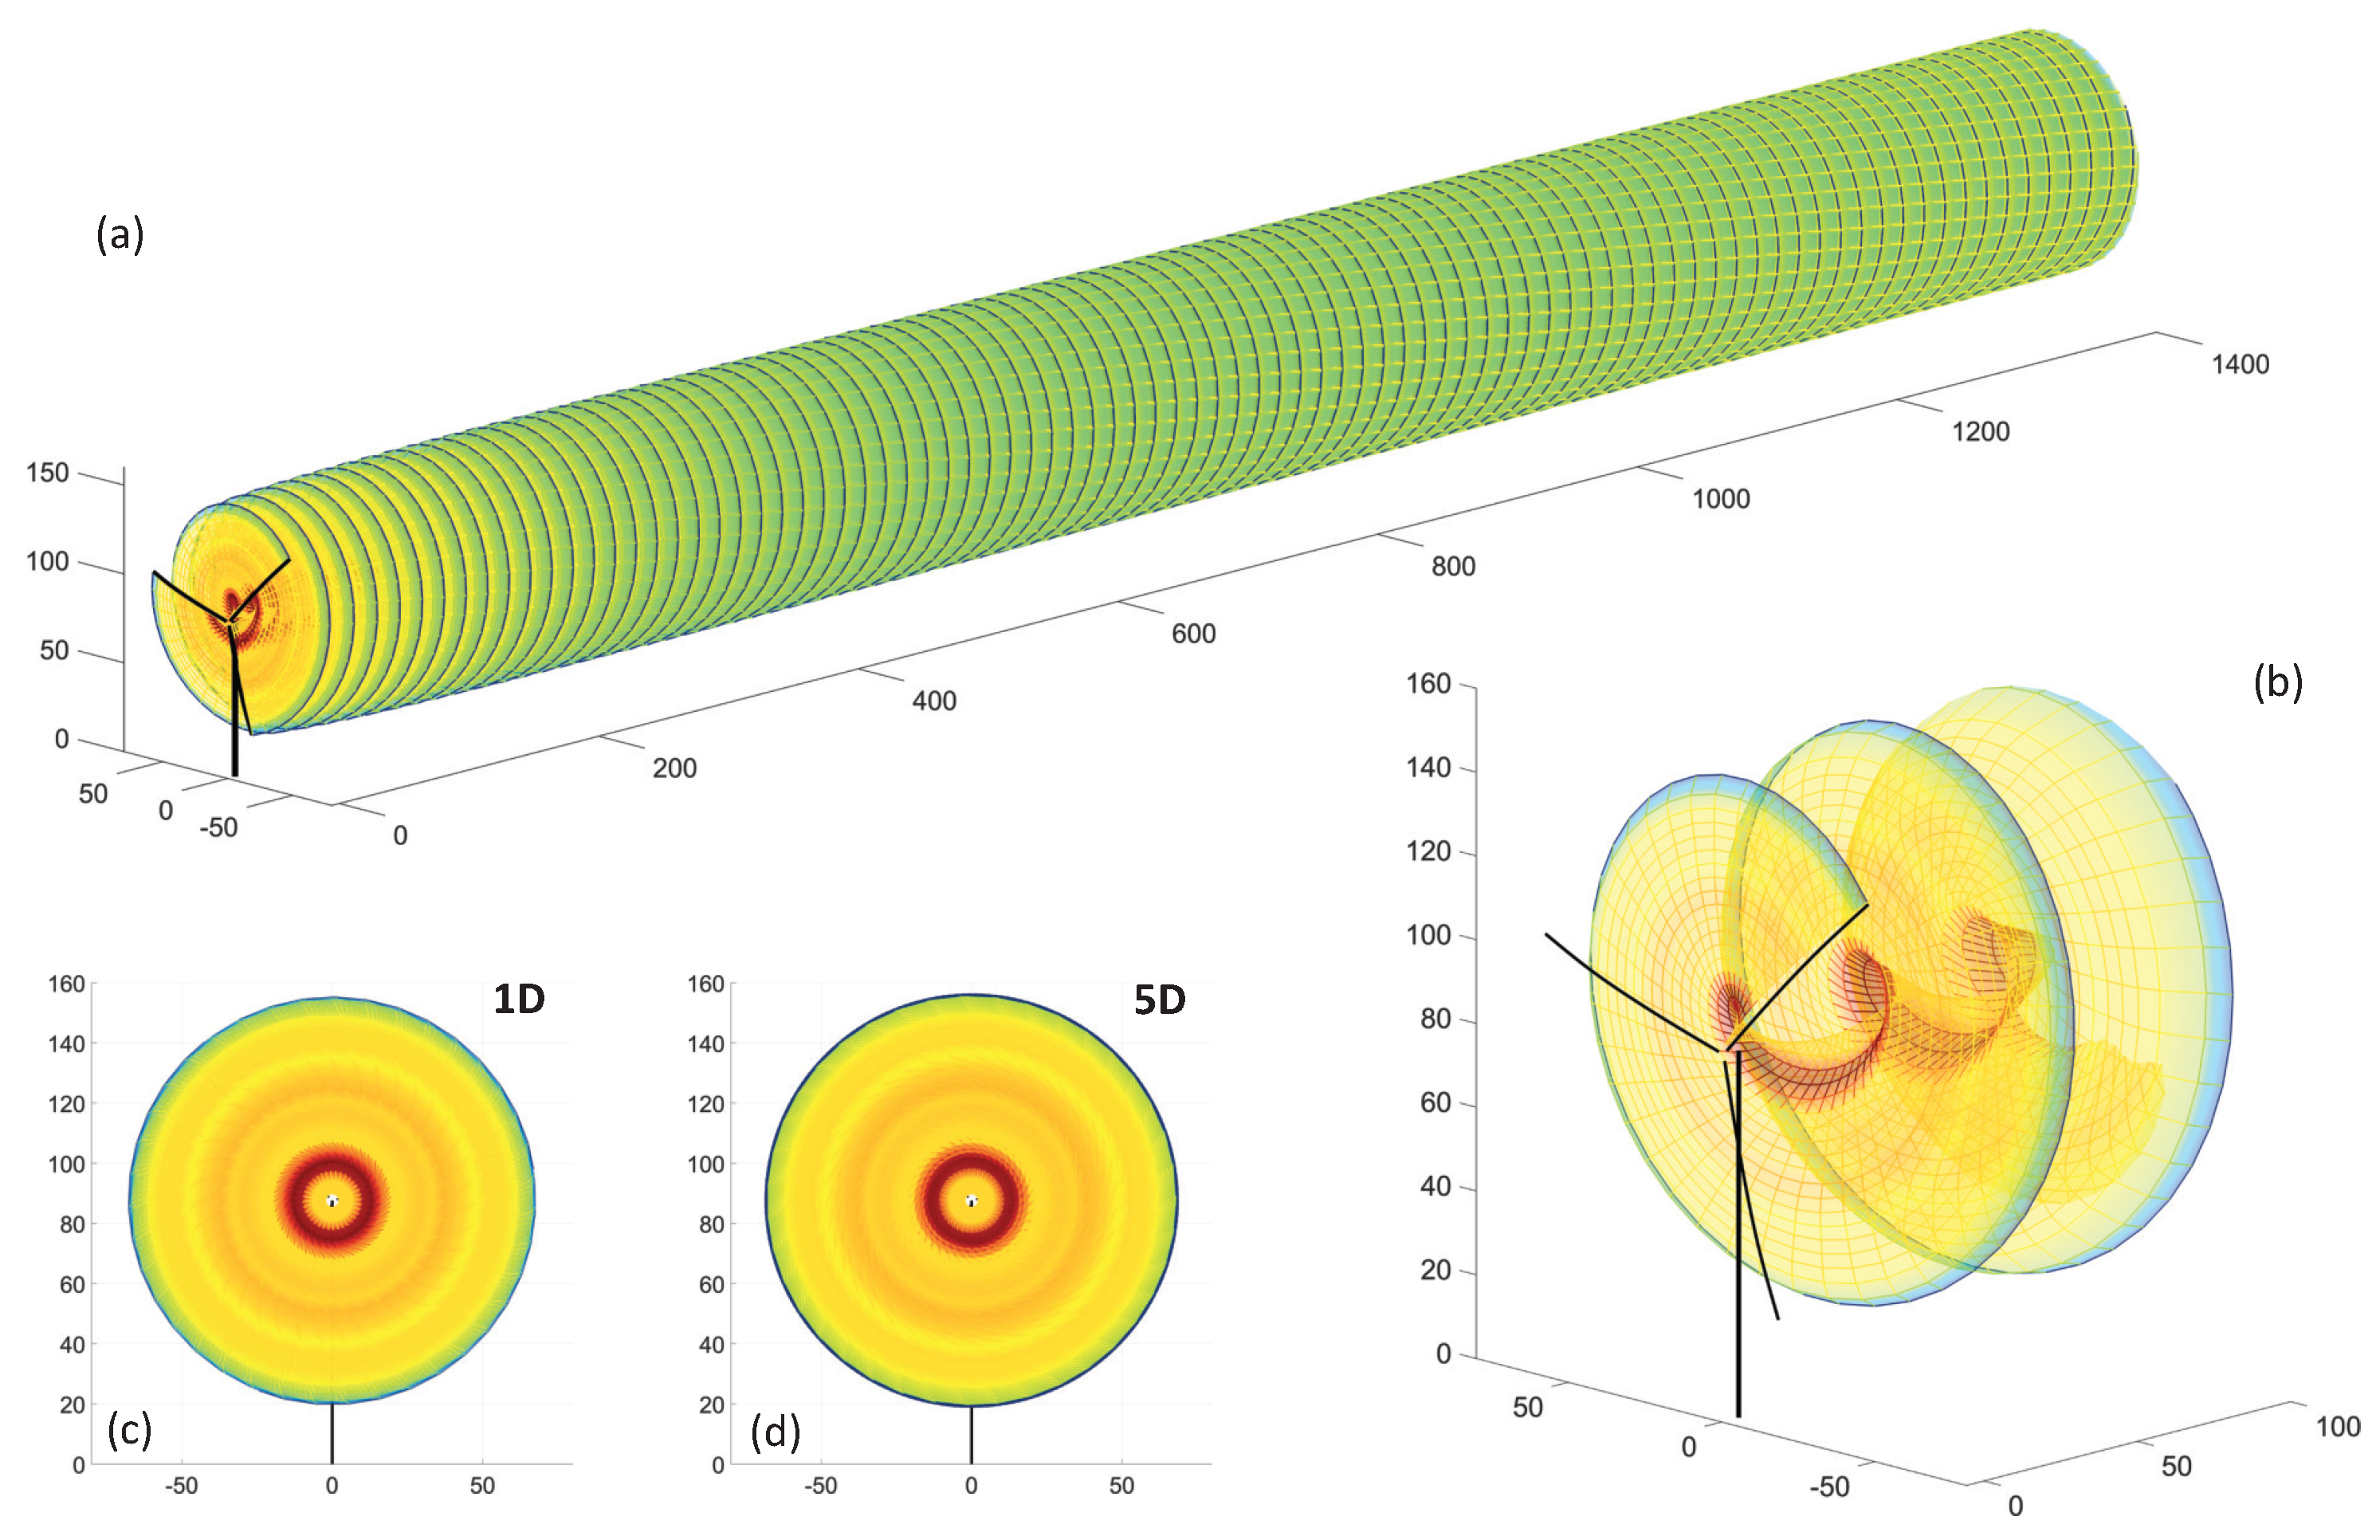
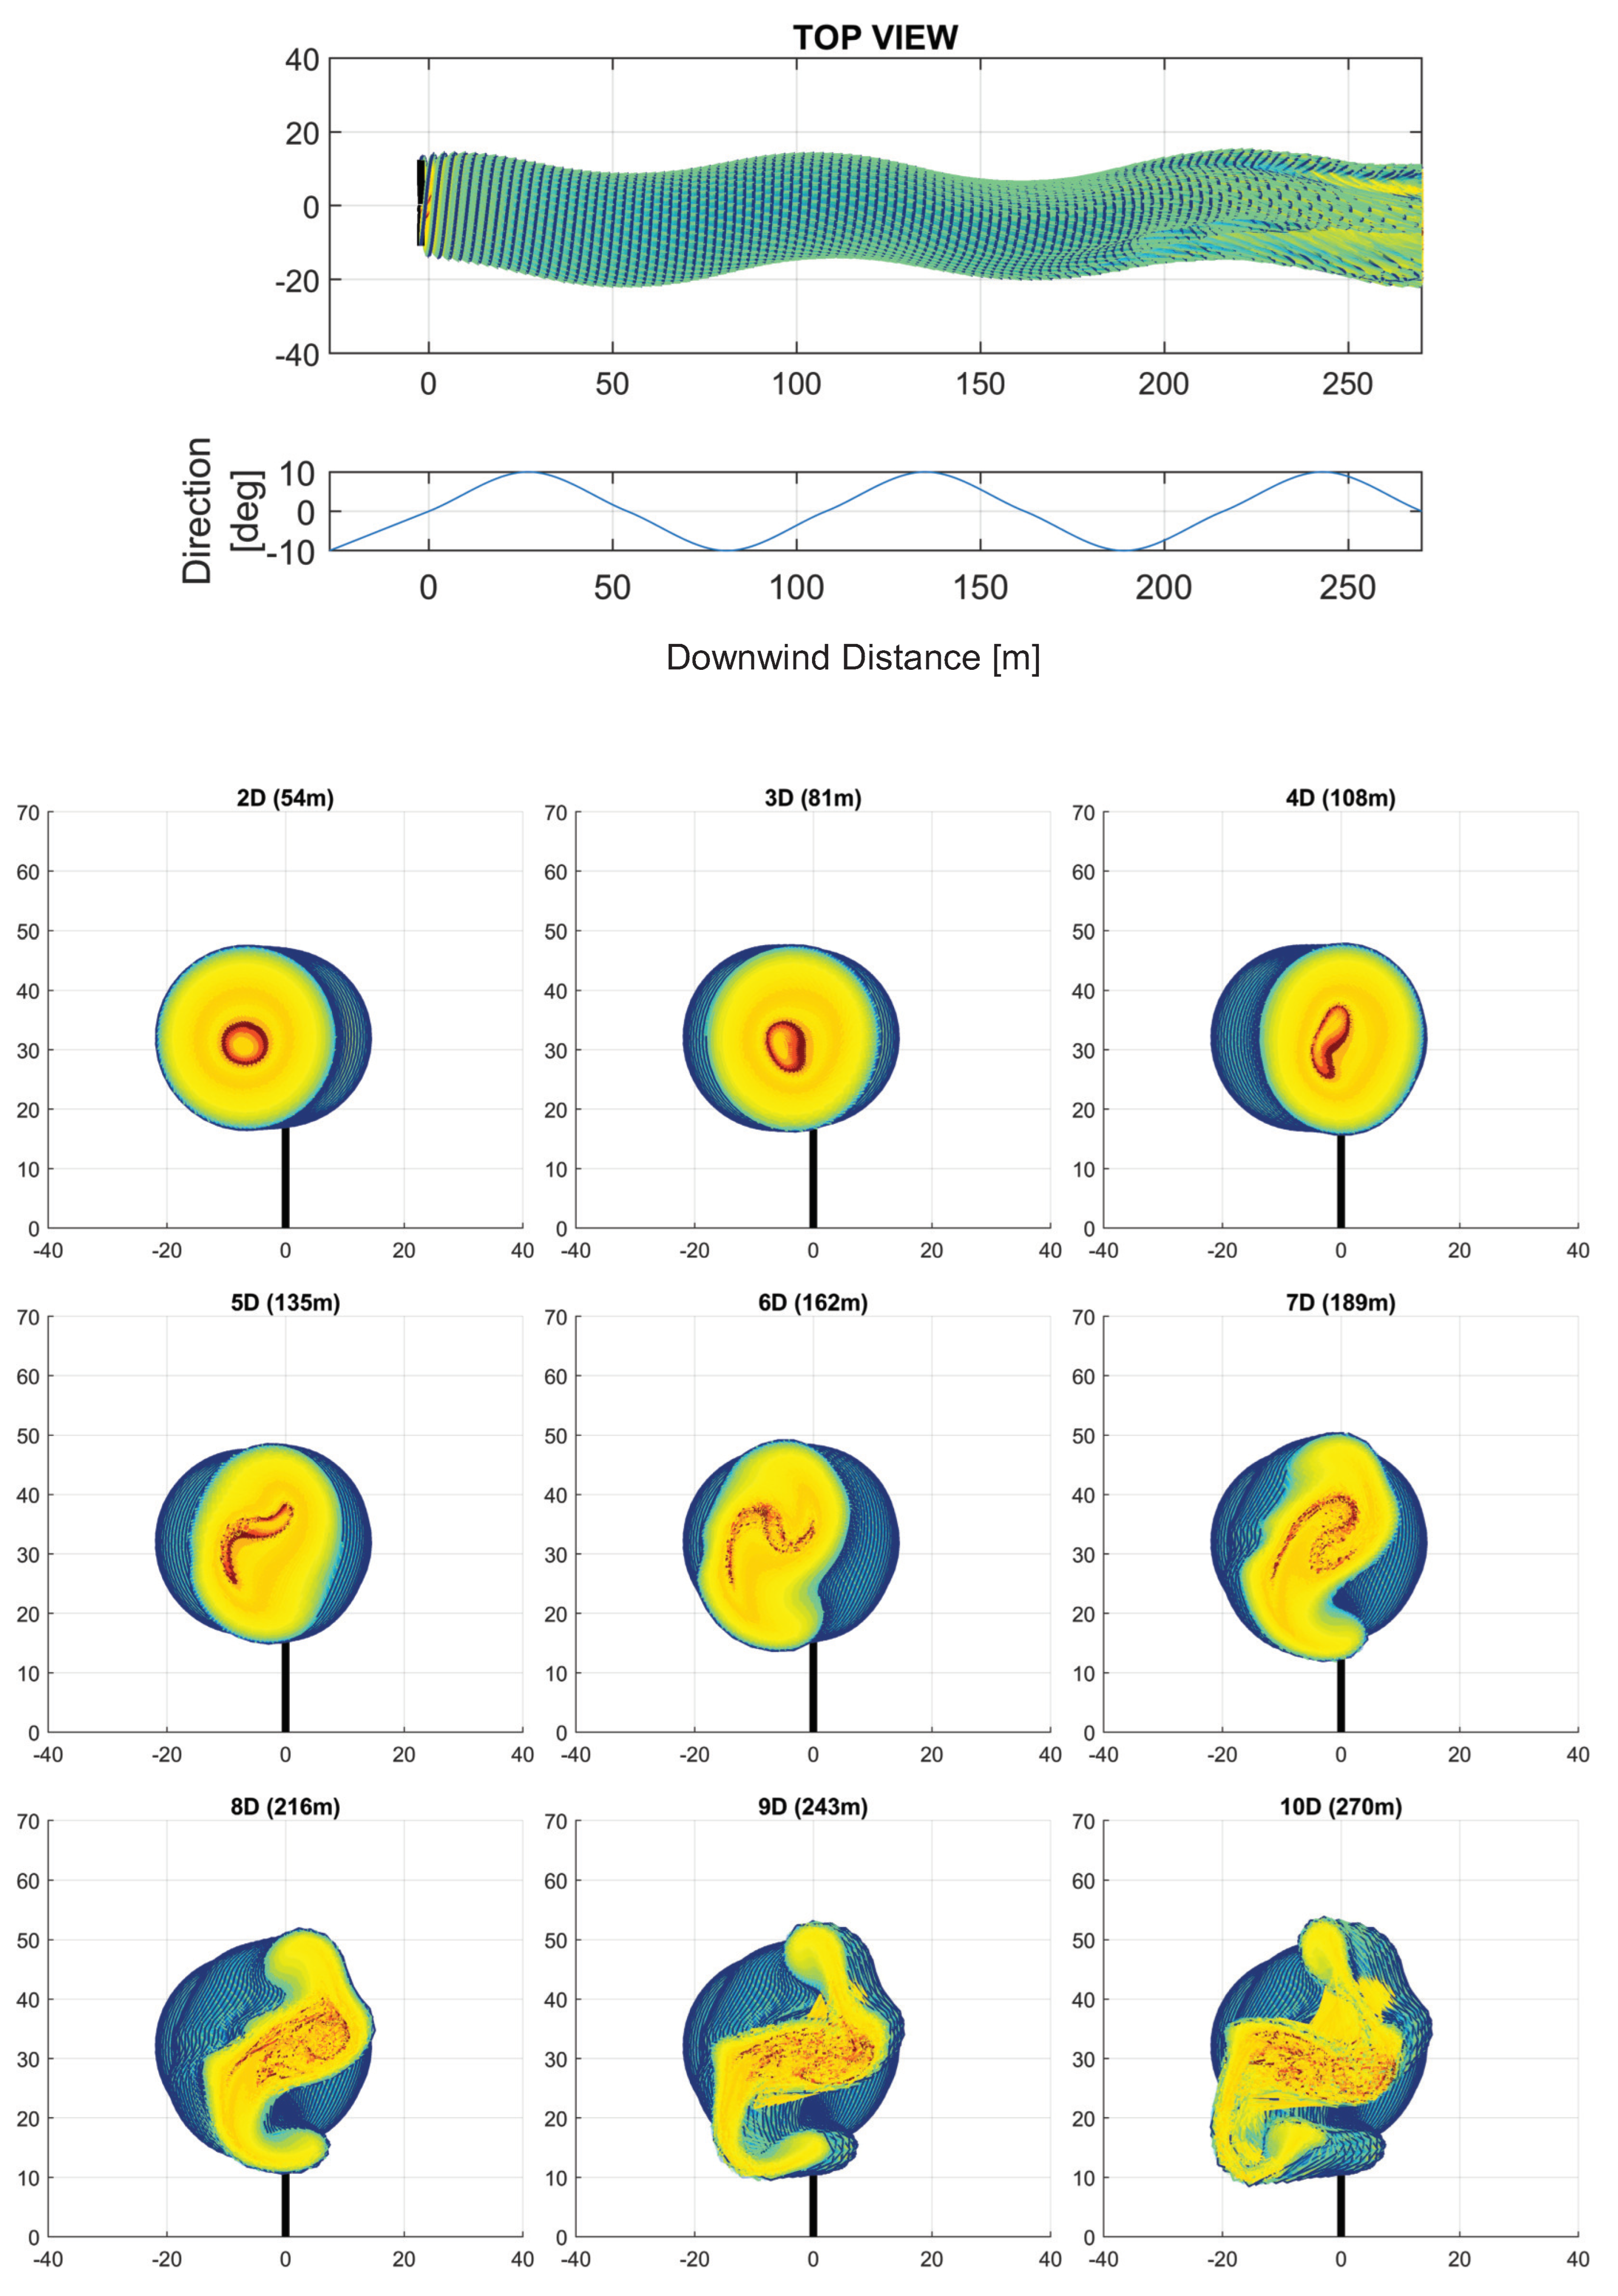
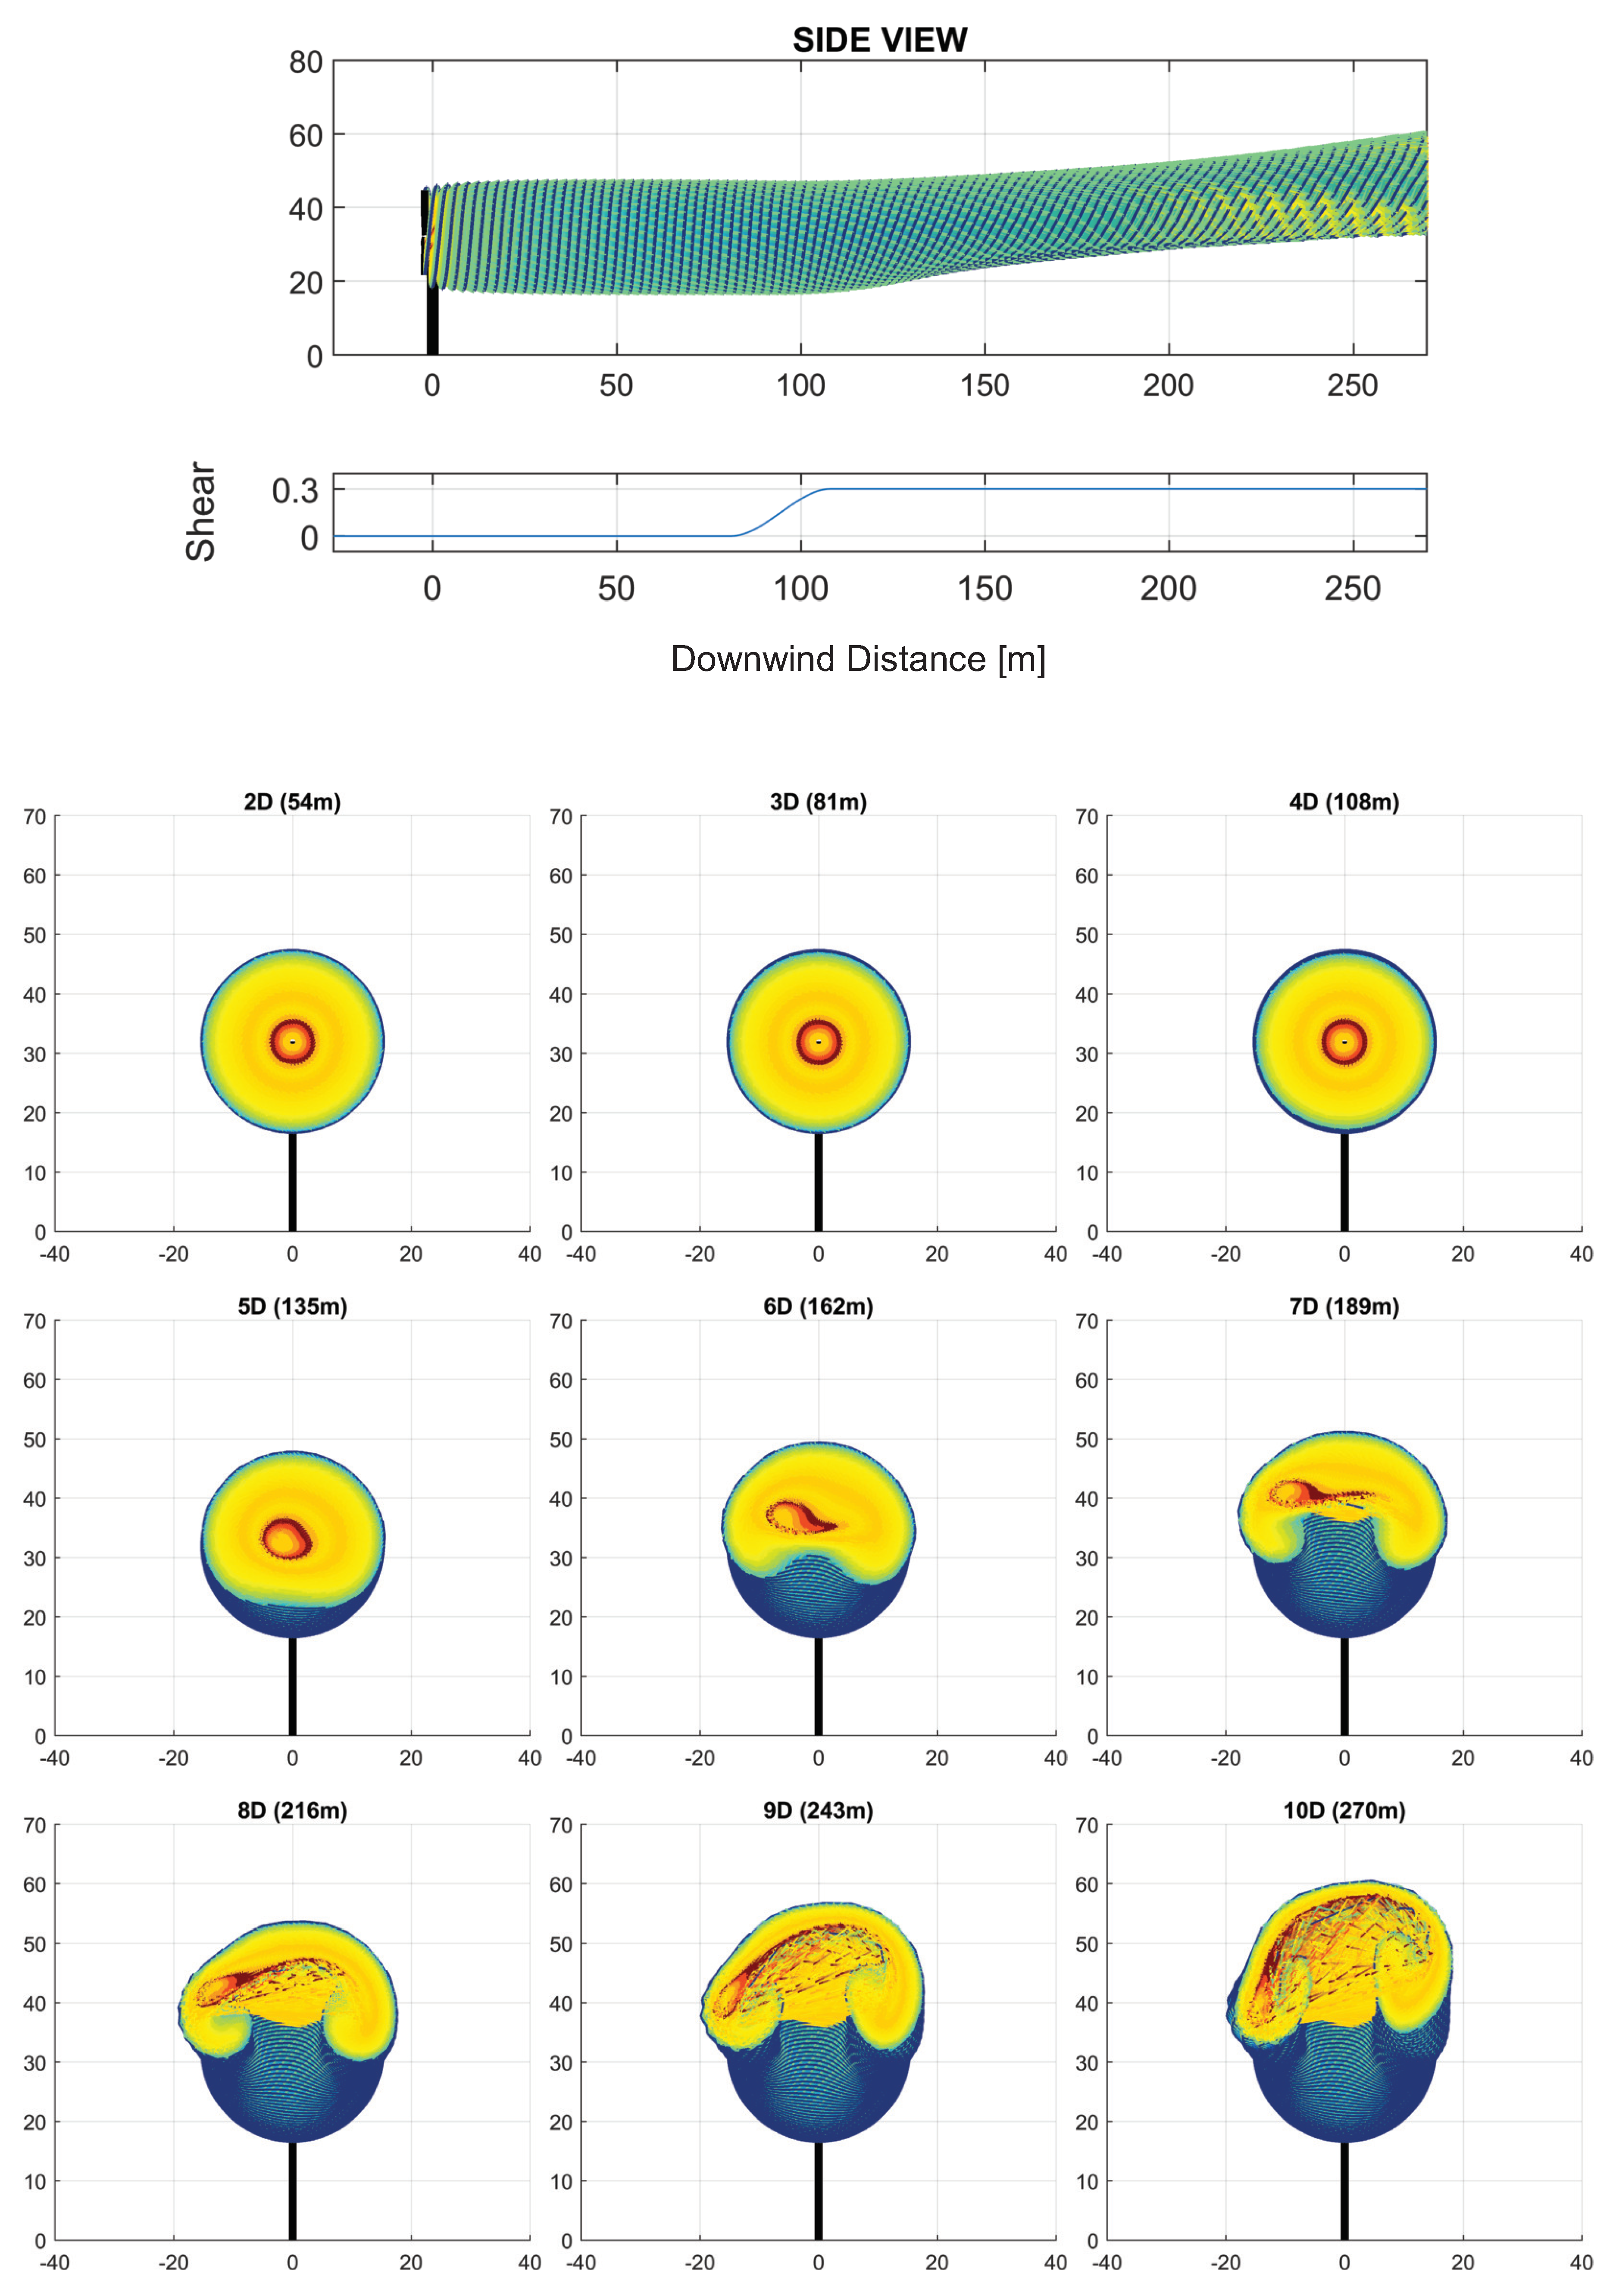
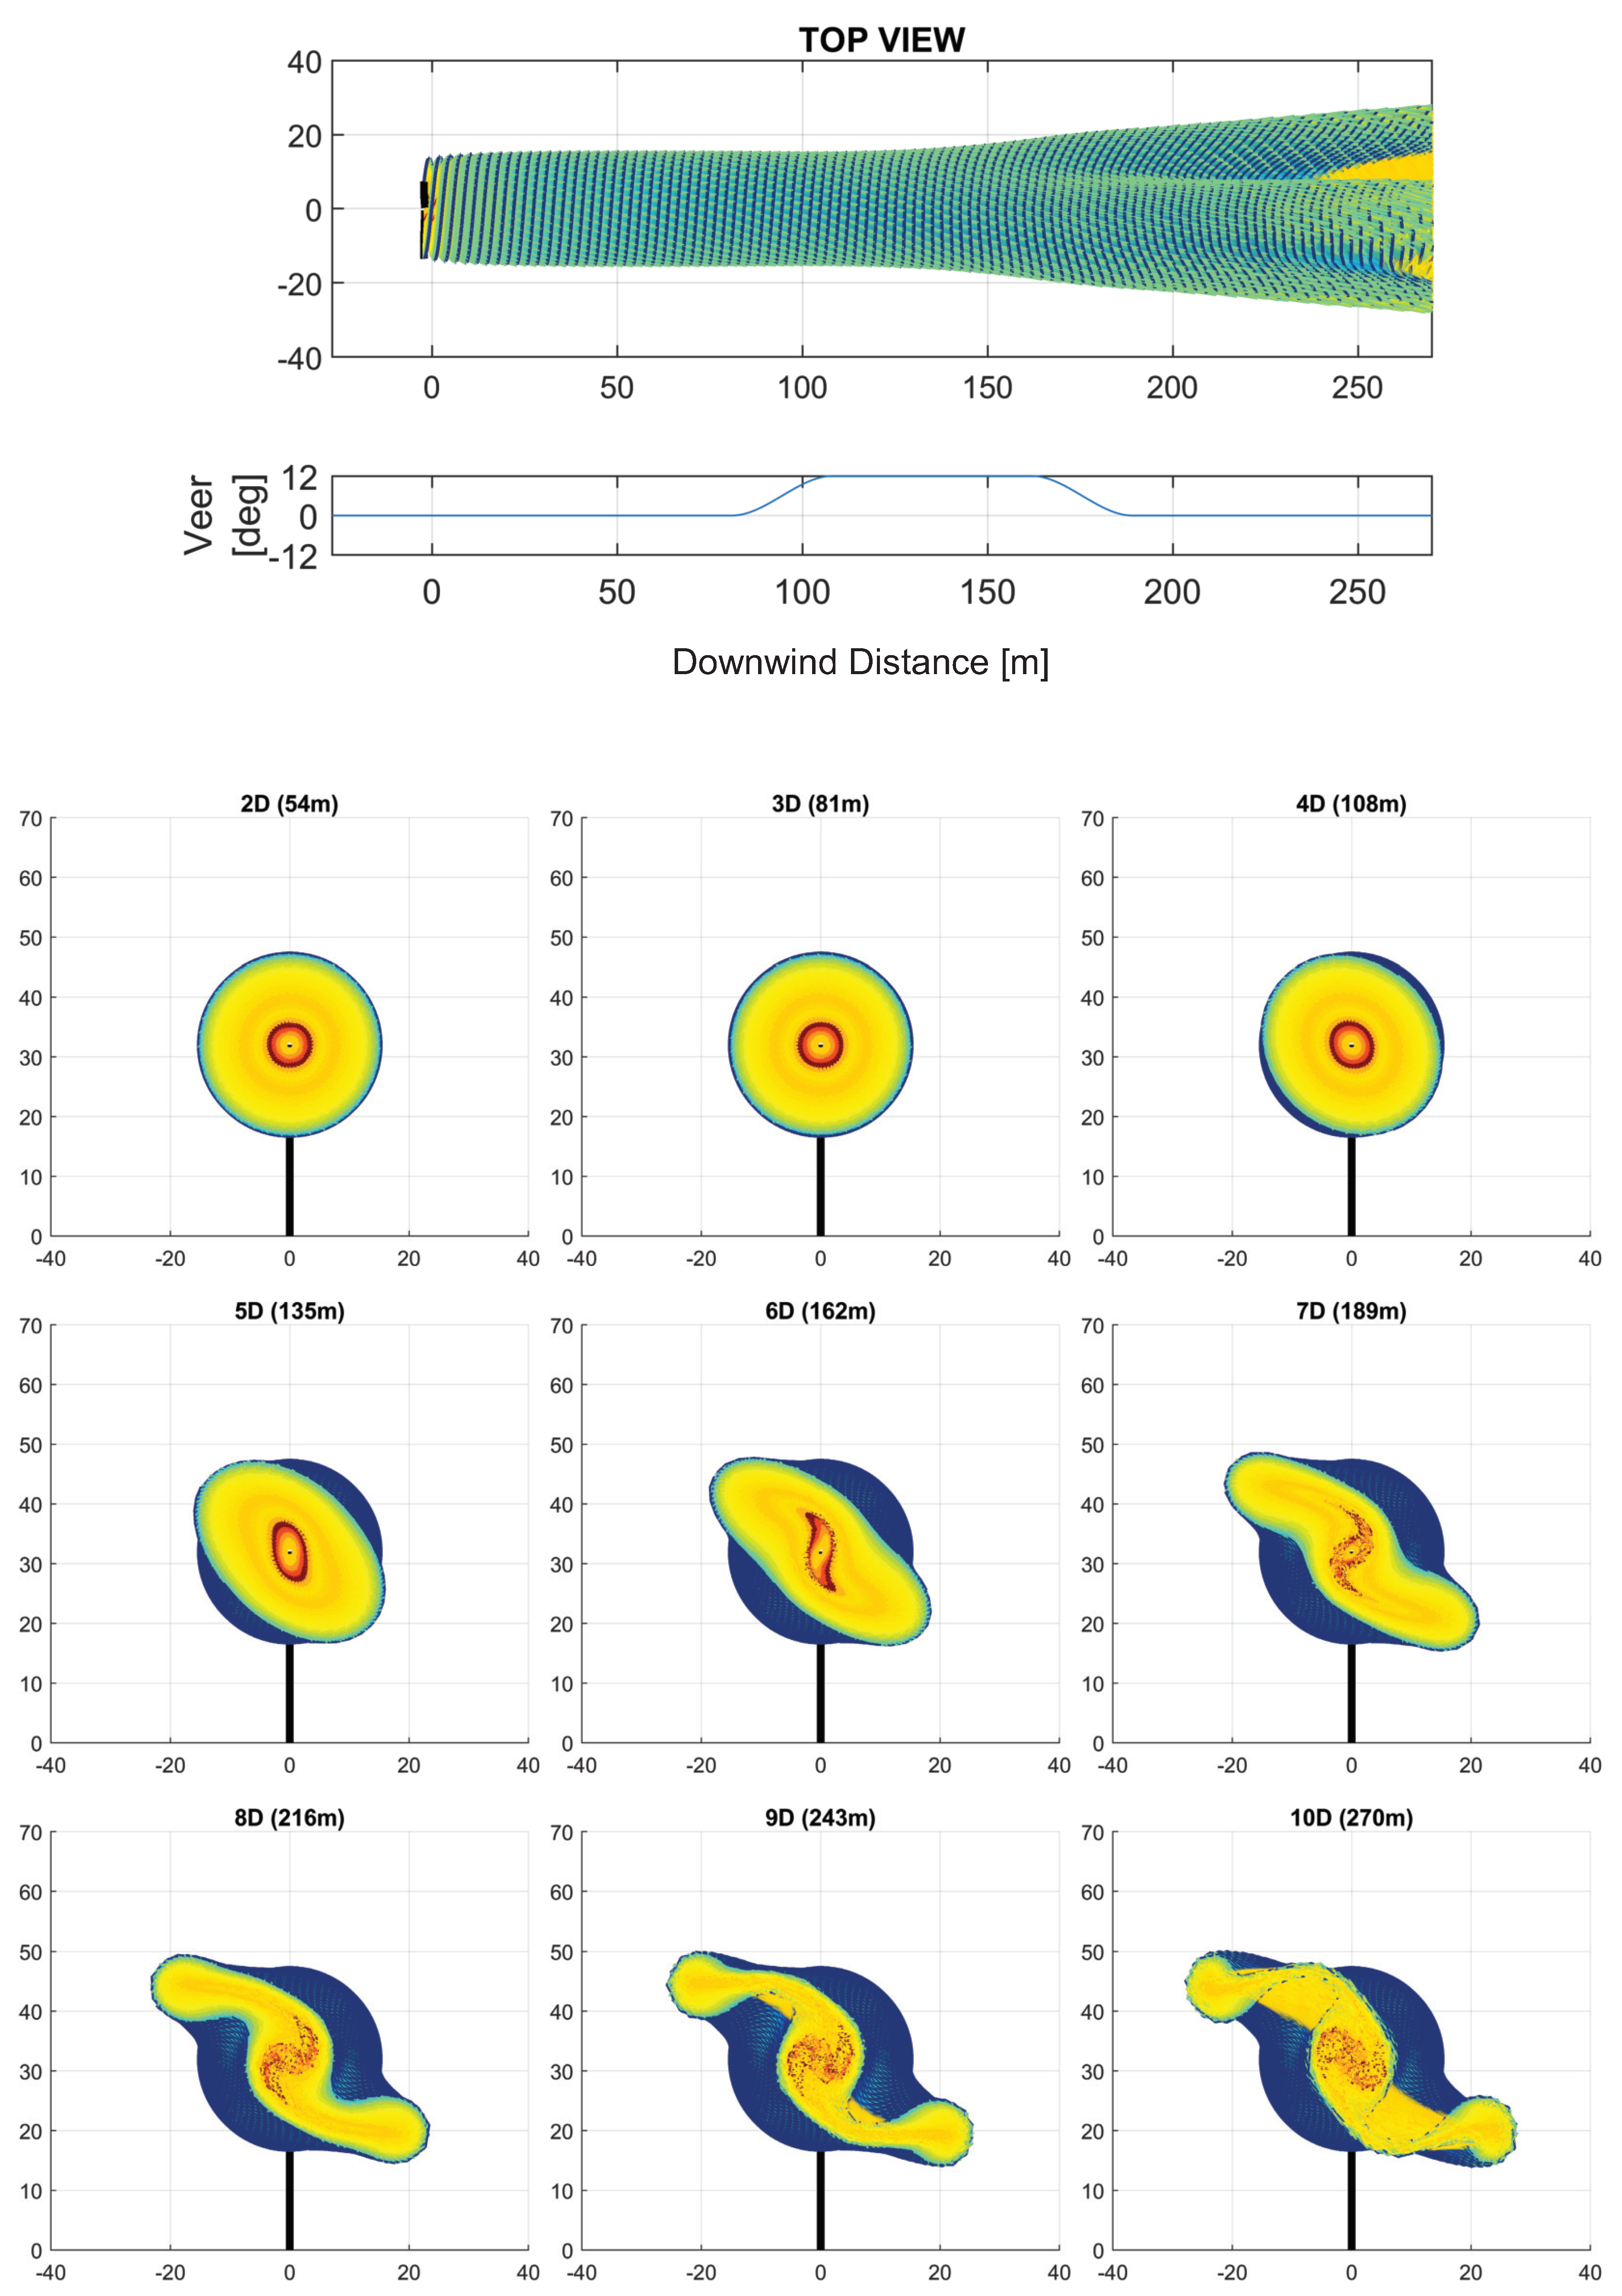
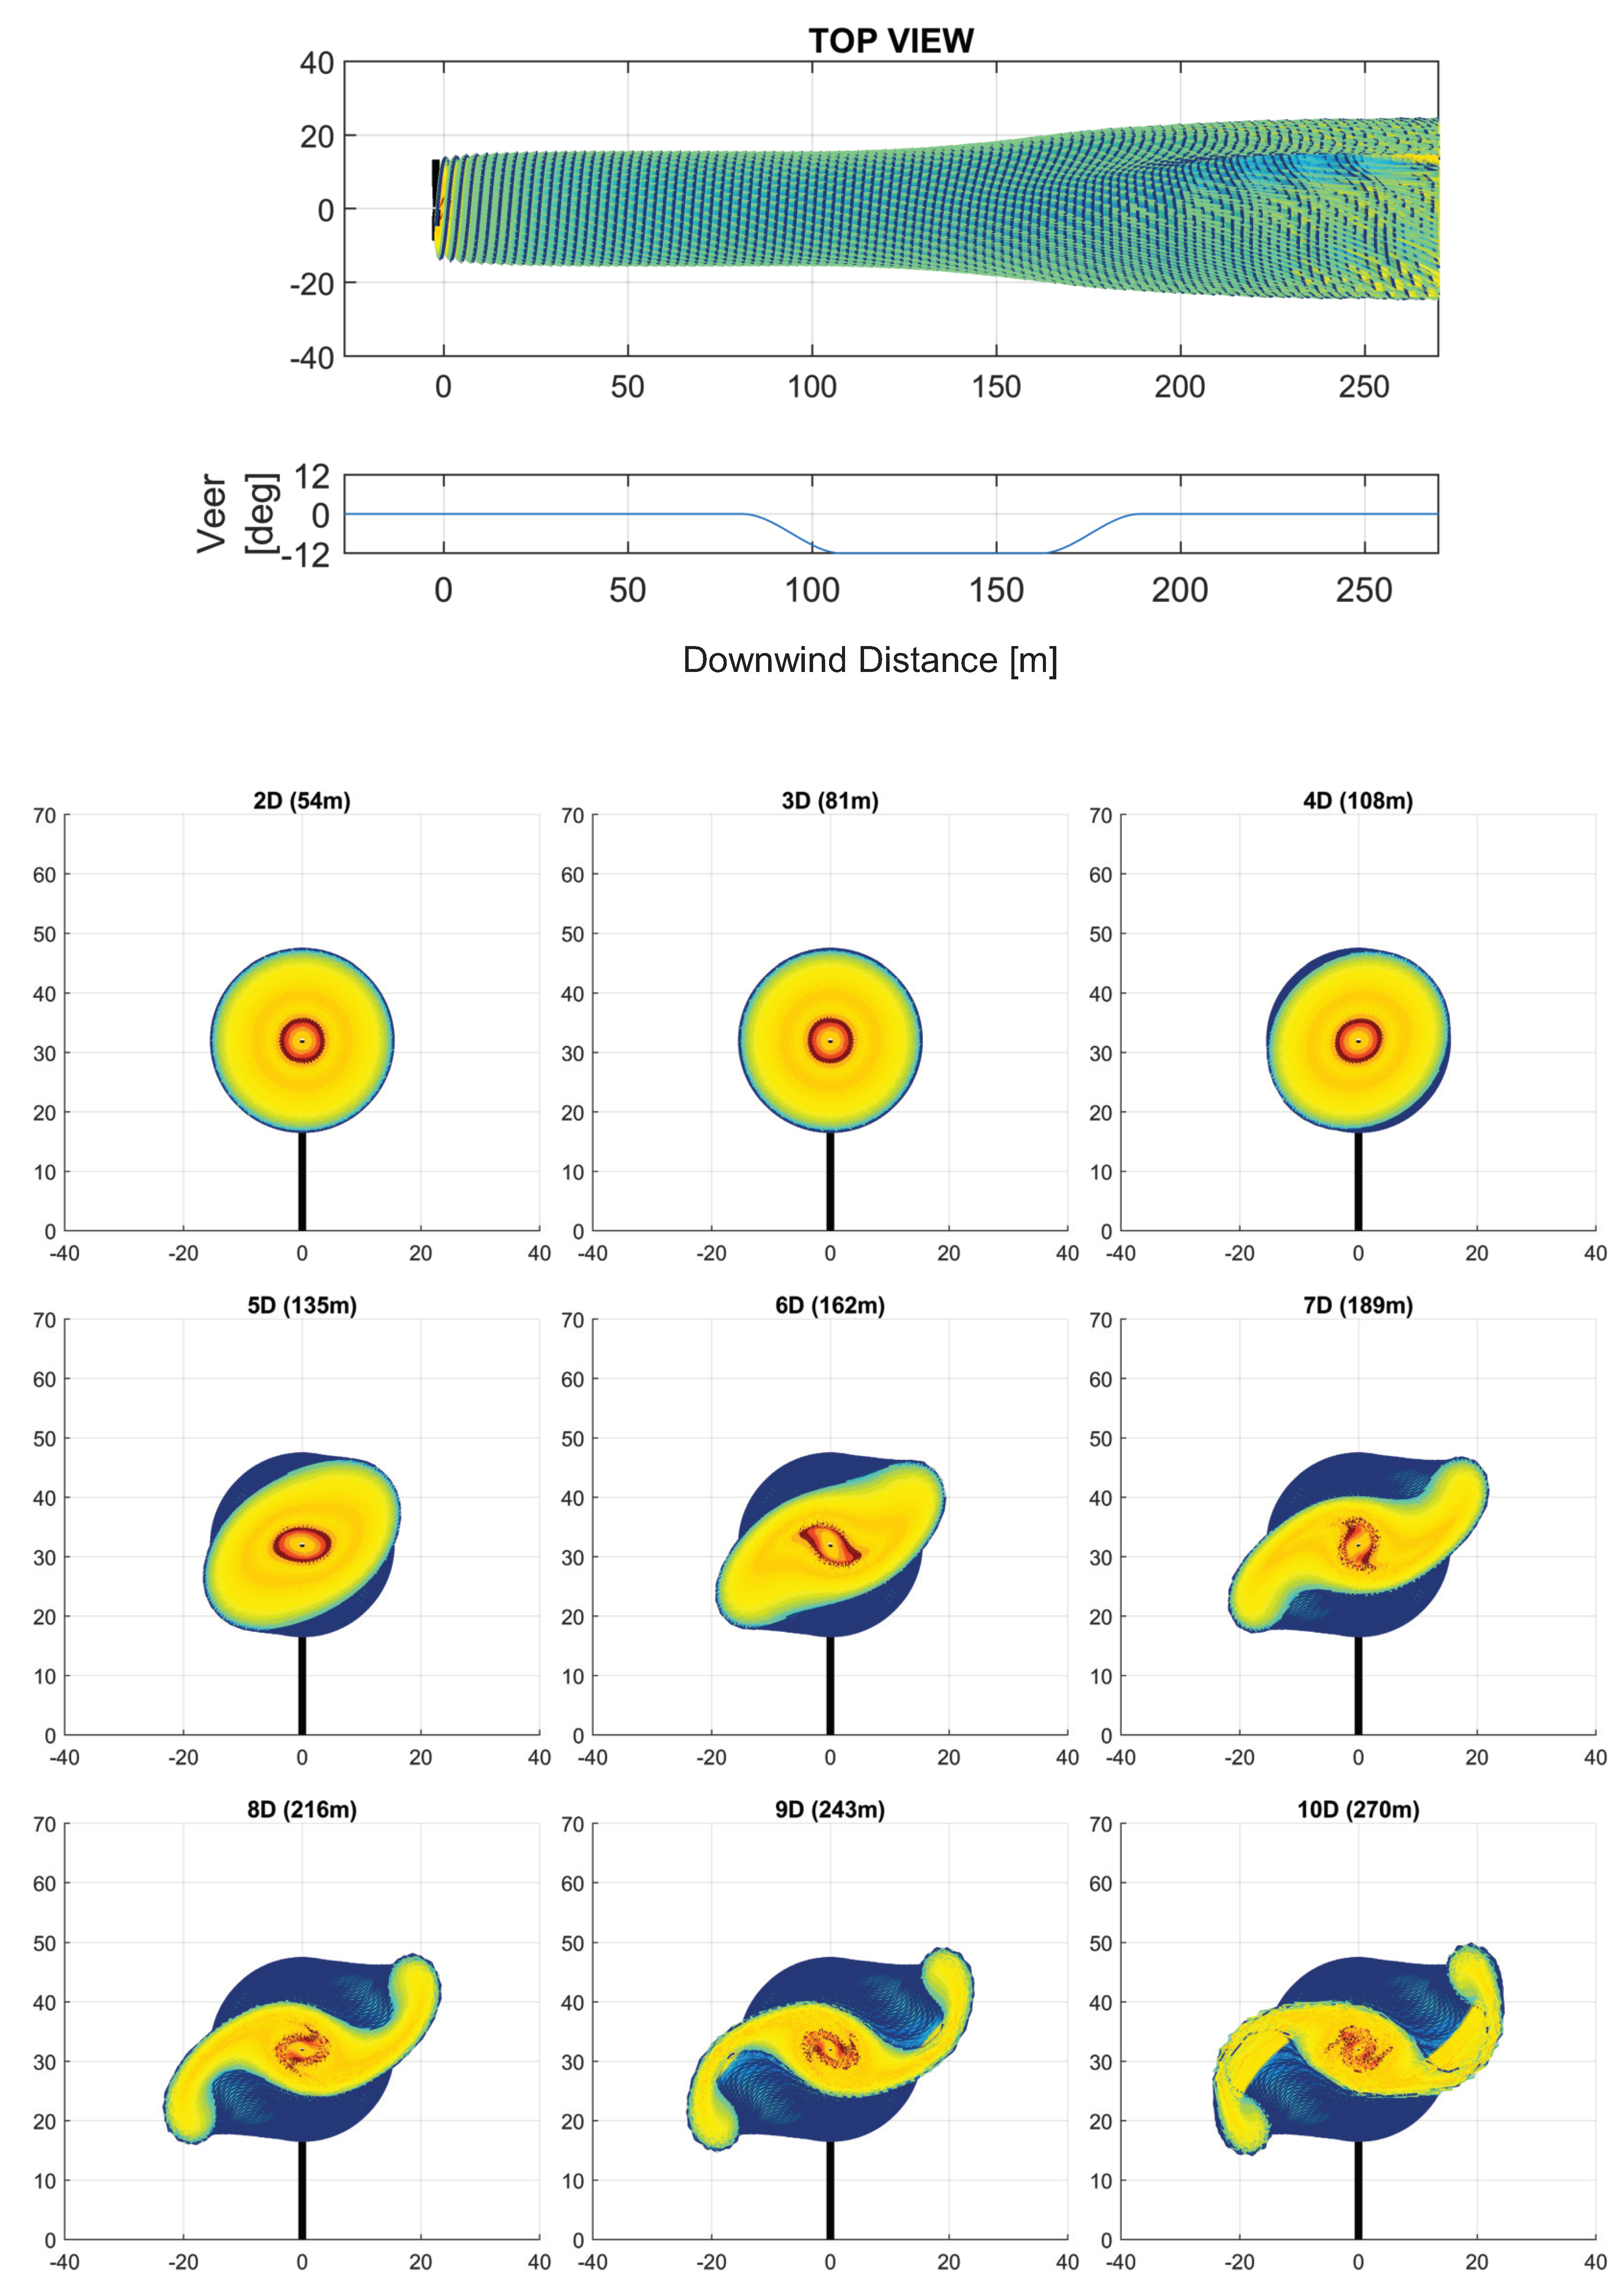
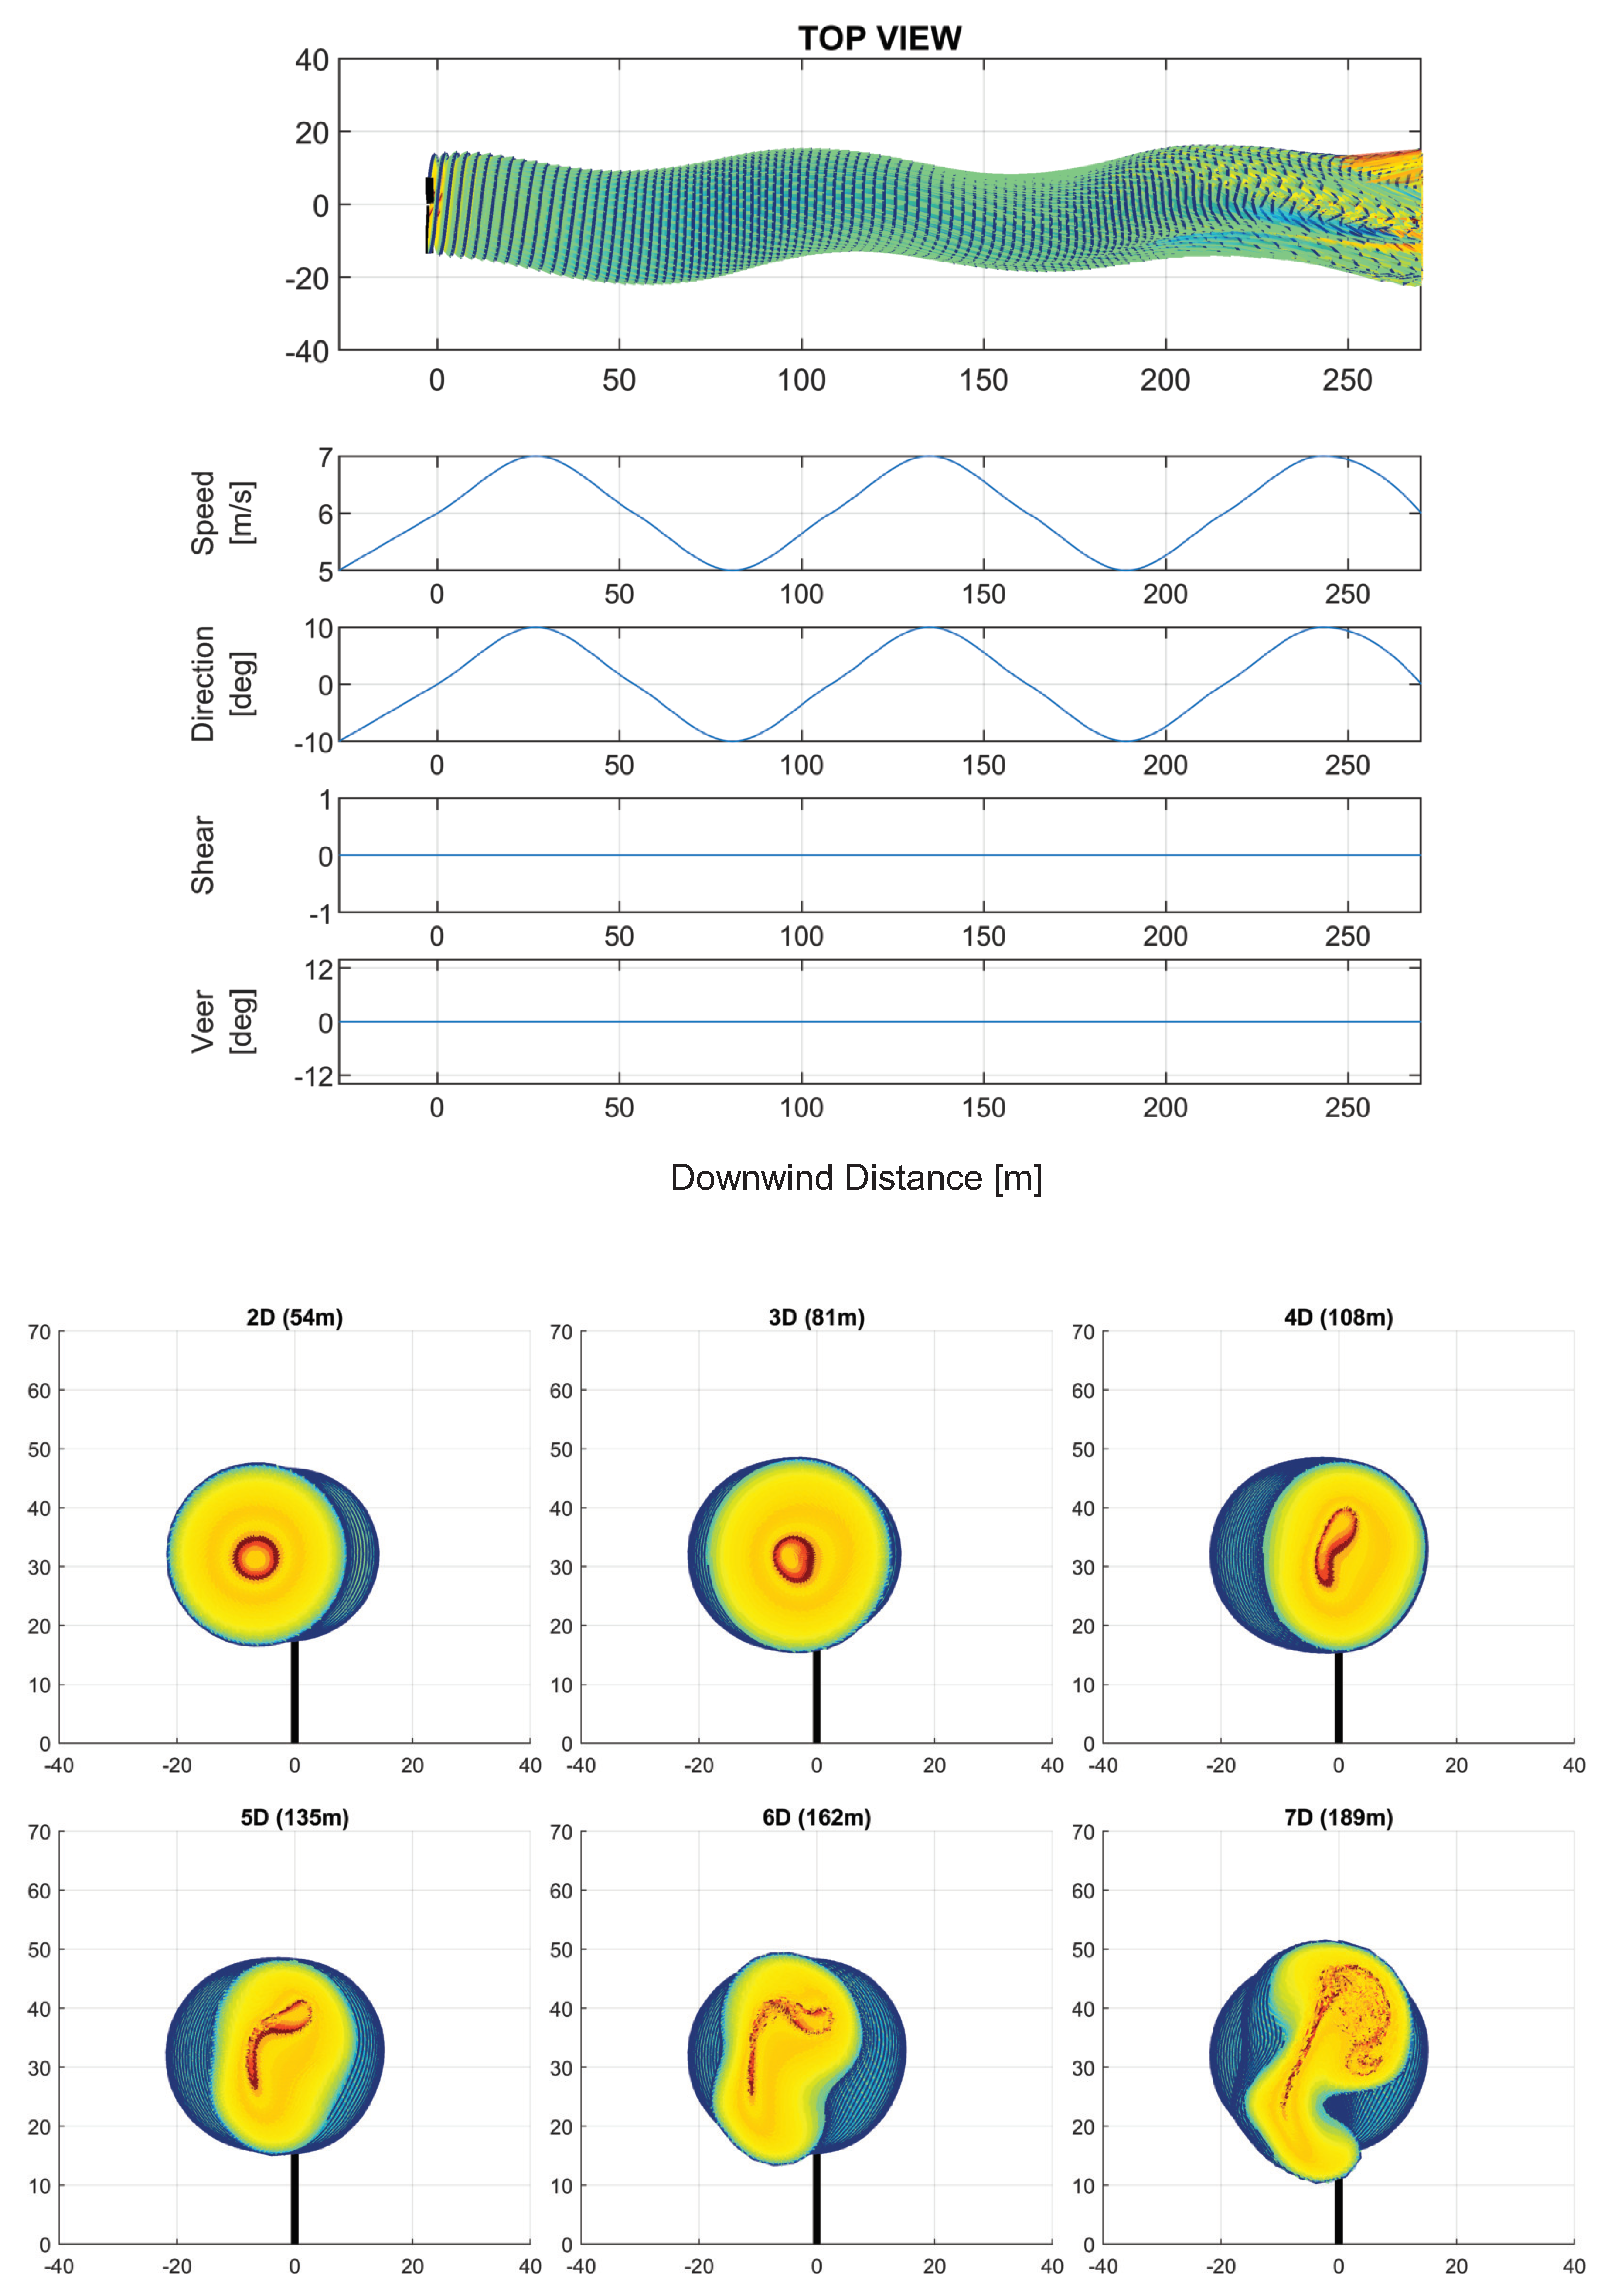
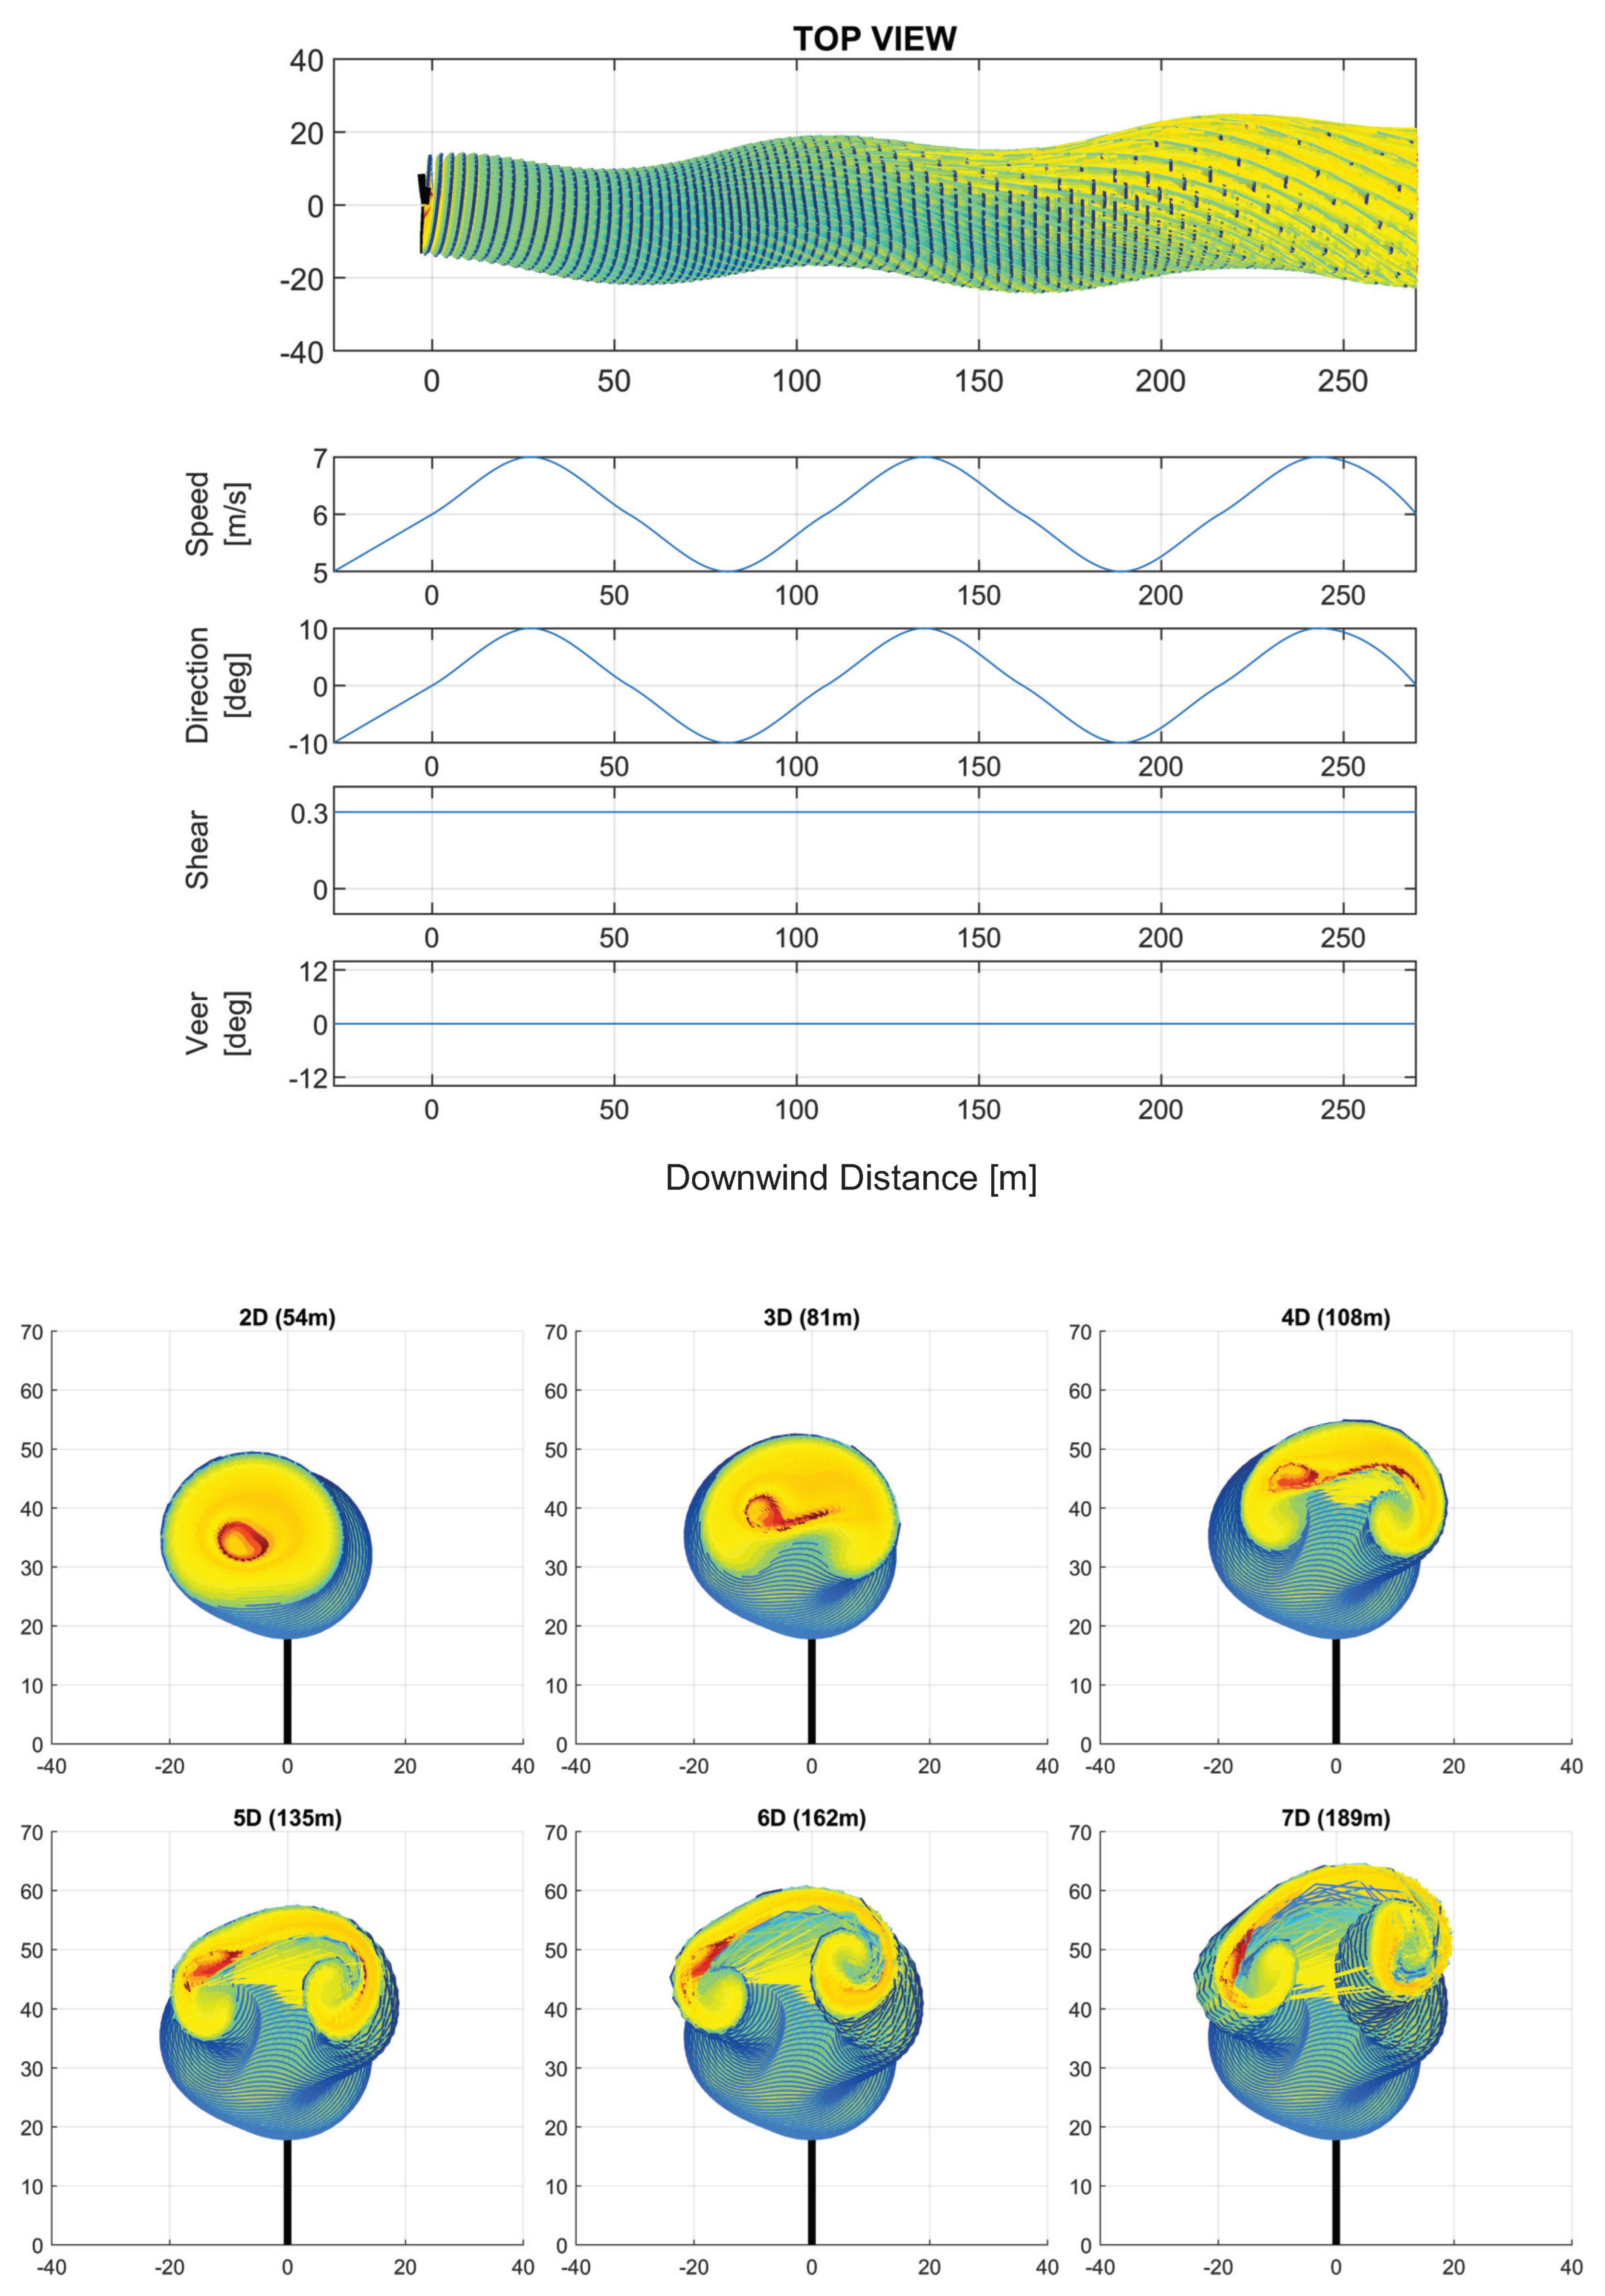
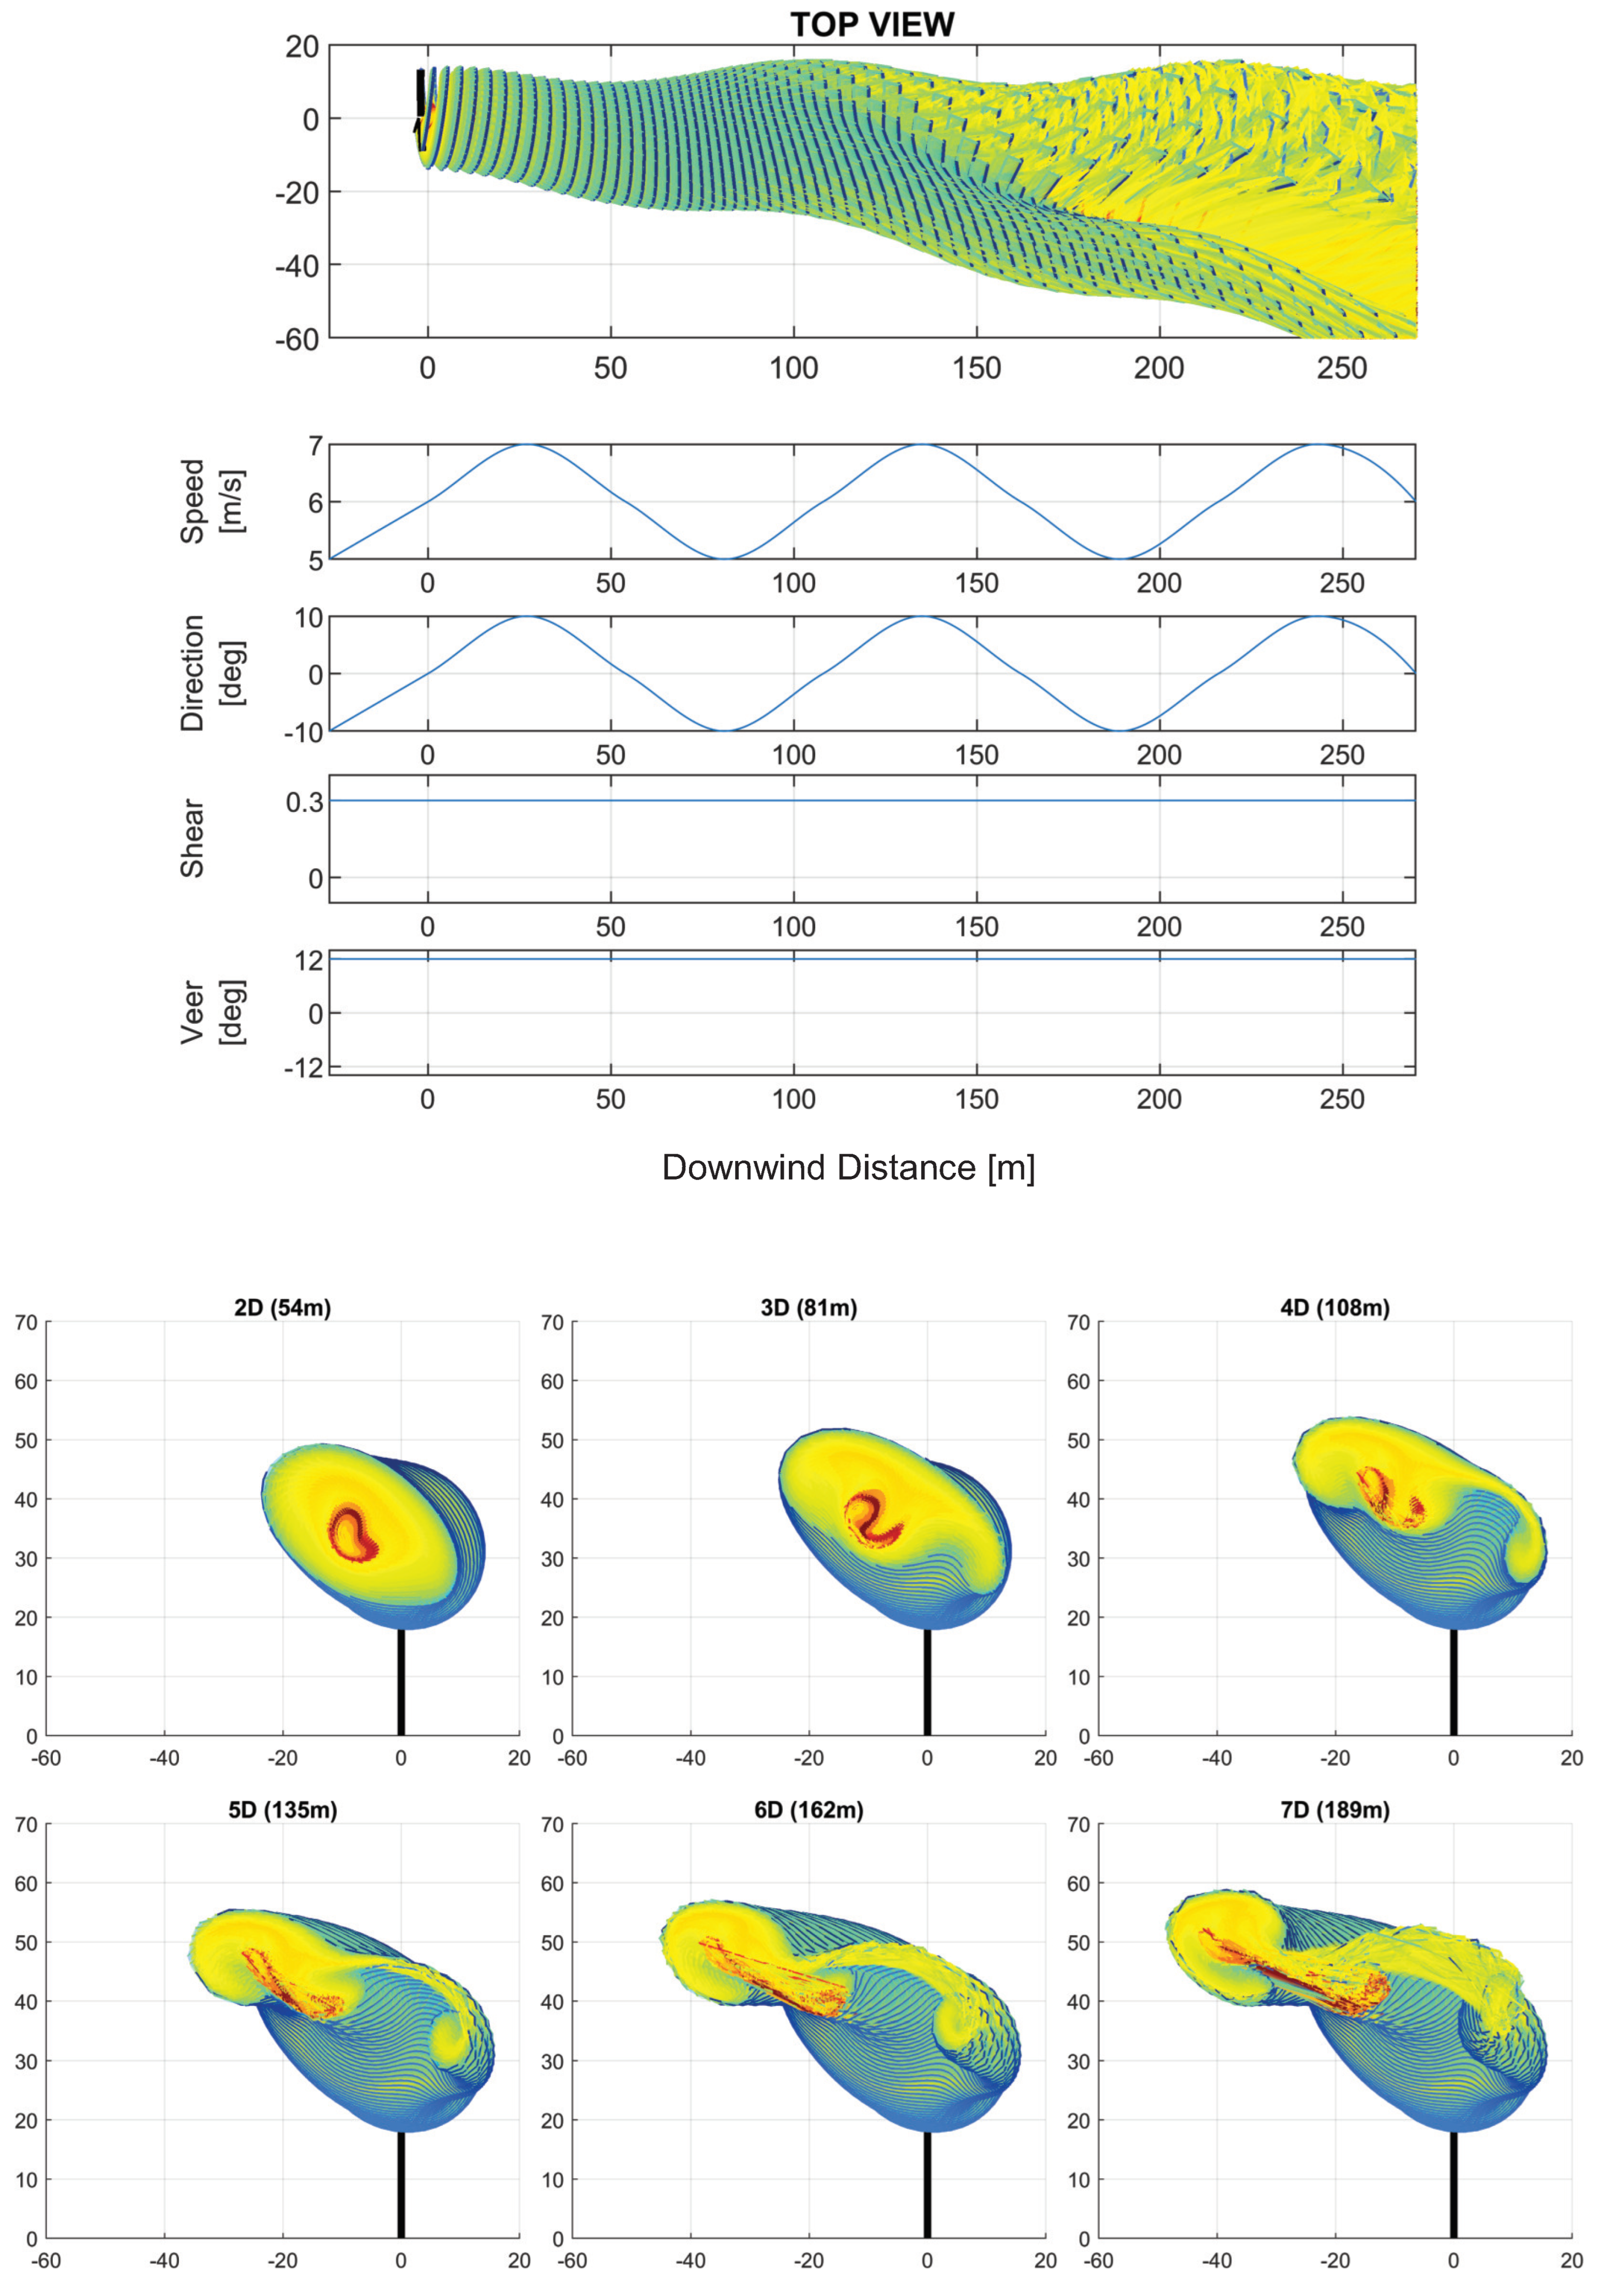
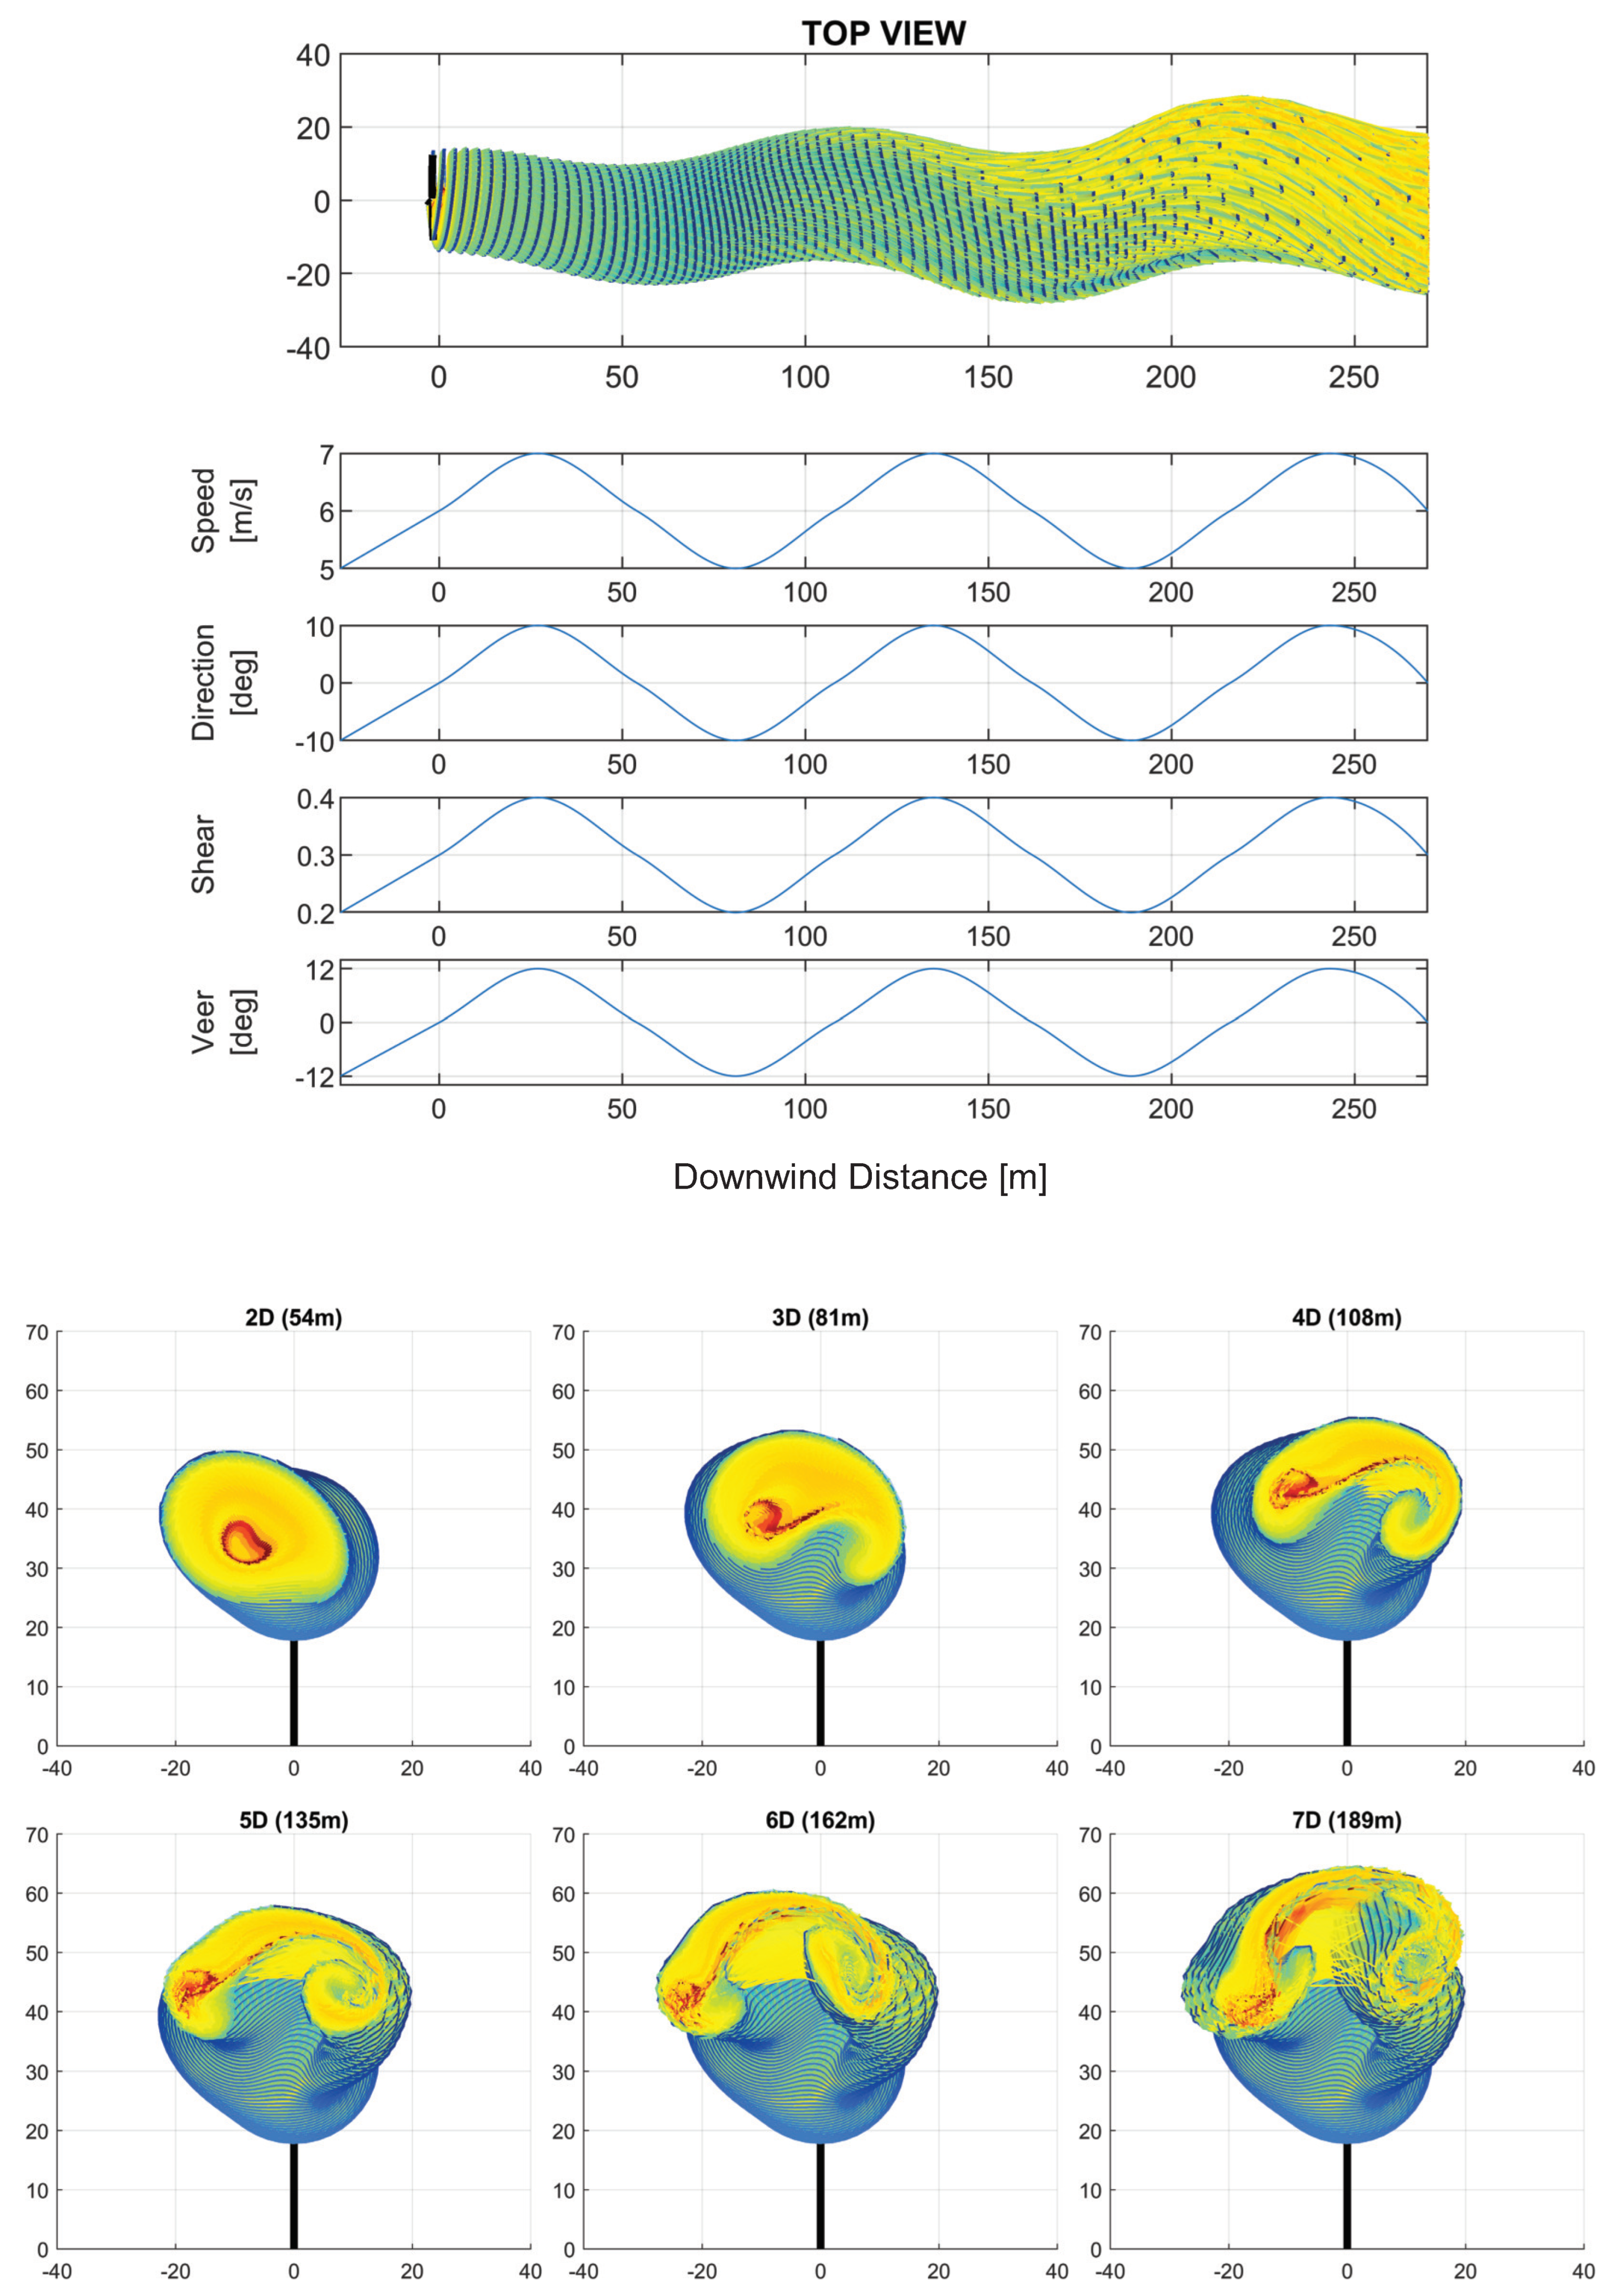
3. Analysis of the Effects of Downwind Variation in Wind Parameters on the Wake Structure

This section will discuss the typical effects which arise from the mutual advection of vortex filaments in scenarios with fluctuations in atmospheric flow.
Figure 4 displays several images of wind turbines operating in a uniform, steady-state wind flow profile, comparable to a virtualized wind tunnel. A view over 10 diameters downwind is shown, followed by a detailed view of lattice generation for an individual blade and two rear cross-cut views at 1 and 5 diameters downstream. It should be noted again that in this visualization and all subsequent vortex lattice depictions in this paper, the color pattern used in the vortex lattice depictions is not associated with any specific physical quantity but provided only to enhance the visual perception of the vortex lattice evolution and shape development.
In a scenario such as this, where a wind turbine operates in an unchanging velocity profile, the resulting wake forms in an orderly, cylindrical helicoil that trails from the blades of the turbine, which remains undisturbed in the absence of velocity perturbations. In the center of the cylinder, a wake core is surrounded by spiraling bade tip vortical structures which form uniform rotating lattices. Such a wake structure would induce a simple circular pattern of velocity deficit in cross-planes downstream of the turbine, until the intensity of the vortices is diminished through turbulent viscous diffusion.
On the other hand, in a variable wind velocity field, the wind turbine wake structure exhibits vastly different behavior in its formation and evolution. For example, if a vertical shear profile, yaw offset, or directional veer is introduced, then the orderly formation of vortex filaments is disturbed and becomes highly irregular due to interactions with uneven distributions of the velocity at the rotor, and this is further complicated by the mutual advection of the wake structure with the velocity patterns in the downstream wake. More specifically, spatial variations in wind velocity cause individual filaments in the vortex lattice structure to advect at different rates, depending on their localized positions within the varying cross-flow, which gives rise to pronounced irregularities in the relative shape and arrangement of filaments within the lattice as the structure collectively propagates downstream.
The resulting resolved-scale distortion and movement of the turbine wake structure caused by these irregular atmospheric inflow conditions is commonly referred to as wake meandering and has been further documented by numerous researchers. See the following works for additional reading on this subject: Englberger et al. [55], Abkar et al. [56], Porté-Agel et al. [57], Zong and Porté-Agel [58], Su and Bliss [59], Uchida [60], Herges, et al. [39], and Baruah and Ponta [38].
As the phenomena of wake meandering continues to manifest in the wake’s filament structure and combine with further downstream wind turbulence at varying scales, the vortex wake will sometimes undergo further evolutions which make it unrecognizable from its original form. These radical wake transformations are usually called “secondary” wake transitions. They most often occur in the far wake after cumulative effects have influenced the wake structure, and a prompt such as a change to an established pattern of vortex movement or a non-uniform wind velocity distribution triggers an eventual destabilizing event, which gives way to a recombination of vortex structures.
The emerging secondary structures are entirely distinct from the wake prior, differing from the original in shape, number, and scale. Even small shifts in localized velocity patterns have the potential to drastically alter wake evolution, either by causing the vortex core to split into smaller units of decreased strength or by allowing adjacent vortices to combine and form a larger, more powerful vortex core.
Additional research works have explored the formation of secondary vortex structures further through theoretical, numerical, and experimental observations of vortex street dynamics for bluff body wakes [61,62,63,64,65,66,67,68,69,70,71,72,73].
In the following figures contained within this section, CODEF solutions are presented for further analysis of the vortex-wake structure evolution, as they relate to individual changes in the distribution of each atmospheric parameter taken one at a time. A set of selected images is provided to illustrate and compare the impact on the rotor’s wake structure in different wind conditions, which vary only one wind parameter: the depth downwind of the turbine.
To this end, Figure 5, Figure 6, Figure 7, Figure 8 and Figure 9 show a sequence of perspective views of the GVLM’s vortex lattice mesh structure associated with each case and the corresponding downstream distribution of that parameter, each followed by nine individual cross-sectional planes showing a rear view of the wake core at downstream increments of one rotor diameter (1D) behind the turbine.
All scenarios presented had a wind speed of 6 m/s, a yaw offset of 0°, a shear exponent of zero, and a veer of 0° unless otherwise noted. The wind input parameters did not change in value over time but varied in the stream-wise x direction.
Figure 5 is the first of this series of results, showing a scenario in which all parameters were kept constant, except for a varying wind speed, which oscillated from 5 to 7 m/s in regular periods with the distance downstream.
When comparing the top view of the vortex-wake structure to the linear plot of the wind speed directly following it, it is evident that an increased velocity of atmospheric flow caused the filaments to propagate faster downstream. In regions with faster wind speeds, a narrower wake formed, and regions with slower wind speeds caused the wake to widen. In the cross-cut planes that followed, this effect could also be observed in greater detail.
Figure 6 shows the results from a scenario where all parameters were kept constant, except for a varying wind direction which oscillated from −10° to 10° periodically over the stream-wise distance. The effects of the wind direction changes were quite evident from the top view of the turbine wake, showing the trajectory of the wake meandering laterally in directions which correspond to the changing wind direction shown in the line plot directly below.
An interesting effect of mutual advection can be observed in the irregular cross-flow velocity shown in Figure 7, where a positive shear profile was introduced with a shear exponent of zero. All parameters were kept constant in the near wake, and then at 3D (81 m) downstream of the turbine rotor, the shear exponent began to gradually ramp up to 0.3 at 4D (108 m). This shift in the shear exponent is also plotted directly under the side view of the turbine wake.
As evident in the side view, the increase in the vertical shear profile led to faster advection in elevated portions of the vortex lattice. The vertical disparity in the rate of advection of the vortex filaments within the cross-sectional planes of the downstream wake caused the propagation trajectory to deflect upward and also led to a unique rolled-up “ram horn” shape forming in the wake’s cross-plane structure. The evolution of this unique structure can be viewed in detail in the cross-sectional plots that follow.
Figure 8 and Figure 9 of this series show the results of a scenario with directional veer introduced in the region from 4D to 6D downstream of the turbine. As shown in the line plot directly below the wake’s top view, the directional veer was 0° from 0D to 3D downstream, then slowly adjusted to 12° and −12°, respectively, and finally returned back to 0°. The rest of the parameters were kept constant at their assumed aforementioned values.
The effect of the mutual advection of the wake’s vortex lattice filaments in a veered cross-flow profile was especially evident when comparing the circular profiles of the wake up to 3D with the effects which began to accumulate in the downstream profiles from 4D to 10D downstream.
When comparing the shapes of the wake in Figure 8 and Figure 9 to what can be observed in Figure 6, a change in the overall wind direction with the downwind distance resulted in an altered trajectory and a slight compression of the wake profile on the y axis to create a vertically oblong shape. In the veer cases in Figure 8 and Figure 9, the gradient of the wind direction change in the z direction created a skewed wake, which was elongated in a diagonal orientation corresponding to the direction of the veer. In both the wind direction and veer cases, the elongated shape grew more unstable as the effects of uneven mutual advection within the wake accumulated downstream.
It is also interesting to note that the veer cases presented in Figure 8 and Figure 9 did not just show mirror images of wake structure evolution, although the veer input values were exact opposites in direction and magnitude. This is because the rotation of the wind turbine rotor and the turning motions of the vortex-filament lattices generated by this rotation, were either amplified or reduced by the span-wise and stream-wise velocity components of the background flow as the vortex structure propagated downstream through the varied cross-flow velocity field. Thus, the magnitude of displacement of the vortex filaments would continuously vary as they traveled to different locations within the cross-sectional plane of flow due to the relative alignment of the rotation of the wake vortex filaments compared with the direction of the localized wind velocity.

3.1. Combined Effects of Wind Parameter Spatial Variation

In this subsection, a set of selected examples is provided to illustrate the effects of the combined spatial distributions of more than one wind parameter on the turbine’s wake structure varying downwind of the turbine. To this end, Figure 10, Figure 11, Figure 12 and Figure 13 will show perspectives of the GVLM’s vortex-lattice mesh structure associated with each case and the corresponding downstream distribution of the parameters, followed by six individual cross-sectional planes showing a rear view of the downstream wake at increments of one rotor diameter up to 7D downstream of the turbine.
The following figures show the progressively cumulative effects of adding spatial variations in wind velocity to the stream-wise and cross-flow parameters. First, we combined the speed and direction followed by the progressive addition of shear and then veer to the inflow and downstream composition of the wind velocity profile. In this manner, the coupled effects of two or more parameters interacting simultaneously could be identified. This is of fundamental importance because those coupled interactions create effects which add to the individual effects of each parameter previously analyzed in Section 3.
The top view of Figure 10 shows dramatic lateral meandering due to wind direction changes, along with regions with high wind speeds exhibiting a span-wise narrowing of the wake similar to the effect independently observed in Figure 5. In the following cross-cut planes, general evolution of the wake shape seemed to take on a similar pattern to the wind direction case in Figure 6 but showed a slightly faster dissipation of the coherent structures within the wake, along with other minor differences in wake expansion and contraction due to wind speed changes.
When comparing Figure 10 to Figure 11, the latter shows a scenario with a similar wind input, but a constant shear exponent of 0.3 was added. With this shear velocity profile added to the flow profile, it exibited an extremely dominant and observable effect on the formation of secondary vortex structures in the wake. Instead of an S-shaped formation, which formed in Figure 10, the wind profile in this case adopted the characteristic “rolled-up” shape in the cross-sectional plane, and the trajectory of the wake began to rise. Although the shear appeared to have the dominant influence on this wake’s evolution, the effects of wind speed and direction changes were also evident in the lateral meandering and varying expansion of the wake.
The case presented in Figure 12 is similar to Figure 11, but it also included a spatially constant positive veer of 12°. When comparing the cross-sectional planes from these two cases, the wake in Figure 12 evolved with a similar “rolled-up” formation but was diagonally skewed due to the influence of the veer. This resulted in a much different overall shape and vorticity content distribution.
Lastly, a case which introduced stream-wise oscillations in all four parameters is shown in Figure 13. A juxtaposition of Figure 12 and Figure 13 reveals a demonstration of the different effects of stream-wise variations of the hub-height variables (wind speed and direction) versus the cross-flow variations (veer and shear). In the case of the hub-height variables, an alternating variation with the downstream distance seemed to have a more powerful effect on alteration of the self-advection of vortical structures which, as mentioned before, are responsible for the complexity of the wake’s cross-sectional patterns and the positions of their vortical sub-structures. Comparatively, a continuous distribution of the cross-sectional variables (shear and veer) seemed to show a more intense effect in the creation of secondary transitions in the wake’s vortical structures (see Figure 12). If they were applied in a variable manner (see Figure 13), then they did not exhibit such an intense observable effect, indicating that the wake could more easily recover a measure of its original, more regular order.

4. Conclusions

This work presented an analysis of wind turbine operation and flow dynamics in atmospheric conditions which feature spatially varying inflow to elucidate the ways in which wind turbine vortex structures interact with farm flow. An exemplary wind turbine of modern design was simulated in a series of spatially variant wind conditions eliciting the vortical wake formations typically created during such operational conditions in utility-scale wind farms today. Variance in each atmospheric parameter—wind speed, direction, vertical shear, and directional veer—were initially analyzed independently to determine their isolated effects.
Then, in additional testing, variances in two or more parameters were combined to provoke interactions between them for analysis. The solutions to these isolated and combined experiments showed the patterns of vortex wake structures which formed from turbine operation and mutual advection of wake vortex filaments as the wake interacted with the variant velocity patterns in the background flow. The resulting vortex wake formations provided information which elucidated how wind farm operational conditions influence the behavior of wind farm flow and how the characteristics of wind’s spatial variance will shape wakes in consistently unique ways which can be predicted.
The ability to accurately project the shape, behavior, and propagation of wakes in a wind farm becomes extremely challenging in instances where the atmospheric inflow is highly variant or complex. Thus, it is extremely valuable to identify the wake transformations which occur as a consequence of certain weather patterns.
In Section 3, which observed the effects of isolated variations for each parameter, we saw specific behaviors in the wake which were associated with fluctuations in each of the perimeters studied. By elucidating these behaviors, this information was documented to enrich the field of study related to developing models of wind turbine wakes, which enables more precise predictions of downstream velocity deficit patterns that impact the performance and efficiency of a wind farm as a whole.
With spatial variations in wind speed in the stream-wise direction, we saw a corresponding change in the diameter of the cross-sectional profile of the wake and also a change in the overall level of compression of the coils within the helical structure of the vortex lattice. In areas where the wind speed was slower, the cross-sectional profile of the wake became wider, and the coils became more compressed in the x direction.
As wind direction variations occurred in alternating directions, as demonstrated in Figure 6, a lateral meandering occurred in response to the spatial changes in wind direction, along with distortions of the wake’s original cylindrical formation. This had a progressively destabilizing effect, which caused the wake to become drastically distorted in shape in the far wake, leading to an eventual splitting of the wake’s core into several less-coherent structures which were loosely connected to each other.
In the case of a vertical shear profile, as shown in Figure 7, the faster flow in elevated portions of the wake’s cross-plane caused an uneven rate of advection of the vortex filaments, which varied with respect to the relative placement within the cross-plane velocity gradient. This led to a vertically meandering vortex-wake structure, which rose as it propagated downstream. The core of the wake also exhibited an interesting transition as it split from the original circular cross-sectional profile into two counter-rotating vortices.
In the wake structure evolution of a veer profile seen in Figure 8 and Figure 9, the cross-flow variation in wind direction caused the wake to skew diagonally, and the wake eventually destabilized as it traveled downstream, similar to the effect in the previous stream-wise wind direction case observed in Figure 6.
These two figures also demonstrate that the evolution of the wake structure occurred differently, depending on the orientation of the veer with respect to the rotation of the turbine rotor. This resulted from an uneven rate of propagation of the vortex lattice filaments as they rotated clockwise through the varied cross-flow velocity field, which either amplified or reduced according to their rate of advection, depending on the orientation of the localized velocity components in the cross-flow relative to the lattice filament rotation.
In the second portion of this study, contained in Section 3.1, cases were presented with two or more varied atmospheric parameters combined. In these cases, the effects which were previously individually observed could still be identified in the evolved wake solution, but as several sources of cross-flow and stream-wise velocity variations combined, new and unique manifestations of these transformations occurred, as the combinations of different variations in the velocity field could result in patterns of constructive and destructive interference between the fluctuating velocity patterns in the flow field.
In general, it was observed that more persistent, large-scale atmospheric cross-flow variations resulted in a more noticeable influence on wake structure evolution which led to a secondary transition, whereas smaller-scale fluctuations, especially those in stream-wise parameters, led to more minor meandering, which could be recovered from in downstream fluctuations to restore the characteristics of the previous formation of the wake.
Developing accurate and reliable wind turbine wake models requires a deep understanding of how vortex-wake structures interact with variable atmospheric wind patterns. Such knowledge is critical to enhancing the performance of individual turbines and optimizing overall wind farm efficiency.
The results of this study offer essential insights which can be applied to refine wind farm control strategies, enhance power output forecasts, improve wake modeling accuracy, and address other key aspects of wind farms’ operational challenges.
Additionally, this information can be applied to further understand the potential of wind farm wake structures to persist far downstream of the farm and affect the available energy content of wind inflow for neighboring wind farms, which is known to be dependent on atmospheric stability and turbine–wake interactions.
Future investigations in closely related research thrusts could explore efficient methods to characterize wind farm flow variations as they evolve across the modeled spatial domain over time. A notable area of interest lies in developing simplified techniques to capture the intra-farm propagation of coherent vortex structures, such as gusts or structures resulting from inter-turbine wake interactions. Investigating how these dynamics become more complex with additional turbine rows could provide valuable insights, as interactions from multiple wakes compound to add significant depth to these phenomena.

Author Contributions

Conceptualization, A.F., F.P. and N.Y.; methodology, A.F., F.P. and N.Y.; software, A.F., F.P. and N.Y.; validation, A.F., F.P. and N.Y.; formal analysis, A.F., F.P. and N.Y.; investigation, A.F., F.P. and N.Y.; resources, A.F., F.P. and N.Y.; data curation, A.F., F.P. and N.Y.; writing—original draft preparation, A.F., F.P. and N.Y.; writing—review and editing, A.F., F.P. and N.Y.; visualization, A.F., F.P. and N.Y.; supervision, F.P.; project administration, F.P.; funding acquisition, F.P. All authors have read and agreed to the published version of the manuscript.

Funding

The authors gratefully acknowledge the financial support of Sandia National Labs, USA through awards PO-2074866 and PO-2159403 and the MAE Department at Michigan Technological University.

Data Availability Statement

The original contributions presented in the study are included in this article, and further inquiries can be directed to the corresponding author.

Conflicts of Interest

The authors declare no conflicts of interest.

References

  1. Dykes, K.L.; Veers, P.S.; Lantz, E.J.; Holttinen, H.; Carlson, O.; Tuohy, A.; Sempreviva, A.M.; Clifton, A.; Rodrigo, J.S.; Berry, D.S.; et al. IEA Wind TCP: Results of IEA Wind TCP Workshop on a Grand Vision for Wind Energy Technology; Technical Report NREL/TP-5000-72437; National Renewable Energy Laboratory: Golden, CO, USA, 2019.
  2. IRENA. Global Energy Transformation: A Roadmap to 2050 (2019 Edition); Technical Report; International Renewable Energy Agency: Abu Dhabi, United Arab Emirates, 2019. [Google Scholar]
  3. TPI Composites Inc. Parametric Study for Large Wind Turbine Blades; Report SAND2002-2519; Sandia National Laboratories: Albuquerque, NM, USA, 2002.
  4. Griffin, D.A. Blade System Design Studies Volume I: Composite Technologies for Large Wind Turbine Blades; Report SAND2002-1879; Sandia National Laboratories: Albuquerque, NM, USA, 2002.
  5. Kong, C.; Bang, J.; Sugiyama, Y. Structural investigation of composite wind turbine blade considering various load cases and fatigue life. Energy 2005, 30, 2101–2114. [Google Scholar] [CrossRef]
  6. Stiesdal, H. Rotor loadings on the Bonus 450 kW turbine. J. Wind Eng. Ind. Aerodyn. 1992, 39, 303–315. [Google Scholar] [CrossRef]
  7. Veers, P.; Dykes, K.; Lantz, E.; Barth, S.; Bottasso, C.L.; Carlson, O.; Clifton, A.; Green, J.; Green, P.; Holttinen, H.; et al. Grand challenges in the science of wind energy. Science 2019, 366, eaau2027. [Google Scholar] [CrossRef]
  8. Veers, P.; Dykes, K.; Basu, S.; Bianchini, A.; Clifton, A.; Green, P.; Holttinen, H.; Kitzing, L.; Kosovic, B.; Lundquist, J.K.; et al. Grand Challenges: Wind energy research needs for a global energy transition. Wind Energy Sci. 2022, 7, 2491–2496. [Google Scholar] [CrossRef]
  9. Loth, E.; Fingersh, L.; Griffith, D.; Kaminski, M.; Qin, C. Gravo-aeroelastically scaling for extreme-scale wind turbines. In Proceedings of the 35th AIAA Applied Aerodynamics Conference, Denver, CO, USA, 5–9 June 2017. [Google Scholar]
  10. Tabor, A. Testing on the Ground Before You Fly: Wind Tunnels at NASA Ames. 2020. Available online: https://www.nasa.gov/centers-and-facilities/ames/testing-on-the-ground-before-you-fly-wind-tunnels-at-nasa-ames/ (accessed on 20 January 2024).
  11. Van Bussel, G.J. The Aerodynamics of Horizontal Axis Wind Turbine Rotors Explored with Asymptotic Expansion Methods. Ph.D. Thesis, Delft University of Technology, Delft, The Netherlands, 1995. [Google Scholar]
  12. Ekaterinaris, J.A. Numerical simulation of incompressible two-blade rotor flowfields. J. Propuls. Power 1998, 14, 367–374. [Google Scholar] [CrossRef]
  13. Duque, E.; Van Dam, C.; Hughes, S. Navier-Stokes simulations of the NREL combined experiment phase II rotor. In Proceedings of the 37th Aerospace Sciences Meeting and Exhibit, Reno, NV, USA, 11–14 January 1999; p. 37. [Google Scholar]
  14. Sorensen, N. Aerodynamic predictions for the unsteady aerodynamics experiment phase-II rotor at the National Renewable Energy Laboratory. In Proceedings of the 2000 ASME Wind Energy Symposium, Reno, NV, USA, 14–17 January 2002; p. 37. [Google Scholar]
  15. Sprague, M.A.; Geers, T.L. Legendre spectral finite elements for structural dynamics analysis. Commun. Numer. Methods Eng. 2007, 24, 1953–1965. [Google Scholar] [CrossRef]
  16. Hansen, M.; Sorensen, J.; Michelsen, J.; Sorensen, N.; Hansen, M.; Sorensen, J.; Michelsen, J.; Sorensen, N. A global Navier-Stokes rotor prediction model. In Proceedings of the 35th Aerospace Sciences Meeting and Exhibit, Reno, NV, USA, 6–10 January 1997; p. 970. [Google Scholar]
  17. Maronga, B.; Gryschka, M.; Heinze, R.; Hoffmann, F.; Kanani-Sühring, F.; Keck, M.; Ketelsen, K.; Letzel, M.O.; Sühring, M.; Raasch, S. The Parallelized Large-Eddy Simulation Model (PALM) version 4.0 for atmospheric and oceanic flows: Model formulation, recent developments, and future perspectives. Geosci. Model Dev. 2015, 8, 2515–2551. [Google Scholar] [CrossRef]
  18. Churchfield, M.; Lee, S.; Moriarty, P.; Martinez, L.; Leonardi, S.; Vijayakumar, G.; Brasseur, J. A large-eddy simulation of wind-plant aerodynamics. In Proceedings of the 50th AIAA Aerospace Sciences Meeting including the New Horizons Forum and Aerospace Exposition, Nashville, TN, USA 9–12 January 2012; p. 537. [Google Scholar]
  19. Domino, S. Sierra Low Mach Module: Nalu Theory Manual 1.0; Sandia National Laboratories: Albuquerque NM, USA, 2015.
  20. Doubrawa, P.; Quon, E.W.; Martinez-Tossas, L.A.; Shaler, K.; Debnath, M.; Hamilton, N.; Herges, T.G.; Maniaci, D.; Kelley, C.L.; Hsieh, A.S.; et al. Multimodel validation of single wakes in neutral and stratified atmospheric conditions. Wind Energy 2020, 23, 2027–2055. [Google Scholar] [CrossRef]
  21. Lignarolo, L.E.; Mehta, D.; Stevens, R.J.; Yilmaz, A.E.; van Kuik, G.; Andersen, S.J.; Meneveau, C.; Ferreira, C.J.; Ragni, D.; Meyers, J.; et al. Validation of four LES and a vortex model against stereo-PIV measurements in the near wake of an actuator disc and a wind turbine. Renew Energy 2016, 94, 510–523. [Google Scholar] [CrossRef]
  22. Burton, T.; Sharpe, D.; Jenkins, N.; Bossanyi, E. Wind Energy Handbook; Wiley: Chichester, UK, 2001. [Google Scholar]
  23. Manwell, J.F.; McGowan, J.G.; Rogers, A.L. Wind Energy Explained: Theory, Design and Application; Wiley: Chichester, UK, 2009. [Google Scholar]
  24. Ponta, F.L.; Otero, A.D.; Lago, L.I.; Rajan, A. Effects of rotor deformation in wind-turbine performance: The Dynamic Rotor Deformation Blade Element Momentum model (DRD–BEM). Renew Energy 2016, 92, 157–170. [Google Scholar] [CrossRef]
  25. Kelley, C.L.; Ennis, B.L. SWiFT Site Atmospheric Characterization; Technical Report SAND2016-0216; Sandia National Lab: Albuquerque, NM, USA, 2016.
  26. Berg, J.; Bryant, J.; LeBlanc, B.; Maniaci, D.C.; Naughton, B.; Paquette, J.A.; Resor, B.R.; White, J.; Kroeker, D. Scaled wind farm technology facility overview. In Proceedings of the 32nd ASME Wind Energy Symposium, National Harbor, MD, USA, 13–17 January 2014; p. 1088. [Google Scholar]
  27. Barone, M.F.; White, J. DOE/SNL-TTU Scaled Wind Farm Technology Facility; Technical Report SAND2011-6522; Sandia National Lab: Albuquerque, NM, USA, 2011.
  28. Kelley, C.L. Aerodynamic Design of the National Rotor Testbed; Technical Report SAND2015-8989; Sandia National Lab: Albuquerque, NM, USA, 2015.
  29. Karpenko, M.; Nugaras, J. Vibration damping characteristics of the cork-based composite material in line to frequency analysis. J. Theor. Appl. Mech. 2022, 60, 593–602. [Google Scholar] [CrossRef] [PubMed]
  30. Karpenko, M.; Stosiak, M.; Deptuła, A.; Urbanowicz, K.; Nugaras, J.; Królczyk, G.; Żak, K. Performance evaluation of extruded polystyrene foam for aerospace engineering applications using frequency analyses. Int. J. Adv. Manuf. Technol. 2023, 126, 5515–5526. [Google Scholar] [CrossRef]
  31. Otero, A.D.; Ponta, F.L. Structural Analysis of Wind-Turbine Blades by a Generalized Timoshenko Beam Model. J. Sol. Energy Eng. 2010, 132, 011015. [Google Scholar] [CrossRef]
  32. Jonkman, J.; Butterfield, S.; Musial, W.; Scott, G. Definition of a 5-MW Reference Wind Turbine for Offshore System Development; Technical Report NREL/TP-500-38060; National Renewable Energy Laboratory: Golden, CO, USA, 2009.
  33. Xudong, W.; Shen, W.Z.; Zhu, W.J.; Sorensen, J.; Jin, C. Shape optimization of wind turbine blades. Wind Energy 2009, 12, 781–803. [Google Scholar] [CrossRef]
  34. Otero, A.D.; Ponta, F.L. On the sources of cyclic loads in horizontal-axis wind turbines: The role of blade-section misalignment. Renew Energy 2018, 117, 275–286. [Google Scholar] [CrossRef]
  35. Jalal, S.; Ponta, F.; Baruah, A.; Rajan, A. Dynamic Aeroelastic Response of Stall-Controlled Wind Turbine Rotors in Turbulent Wind Conditions. Appl. Sci. 2021, 11, 6886. [Google Scholar] [CrossRef]
  36. Menon, M.; Ponta, F. Aeroelastic Response of Wind Turbine Rotors under Rapid Actuation of Flap-Based Flow Control Devices. Fluids 2022, 7, 129. [Google Scholar] [CrossRef]
  37. Rajan, A.; Ponta, F.L. A Novel Correlation Model for Horizontal Axis Wind Turbines Operating at High-Interference Flow Regimes. Energies 2019, 12, 1148. [Google Scholar] [CrossRef]
  38. Baruah, A.; Ponta, F. Analysis of Wind Turbine Wake Dynamics by a Gaussian-Core Vortex Lattice Technique. Dynamics 2024, 4, 97–118. [Google Scholar] [CrossRef]
  39. Herges, T.; Maniaci, D.C.; Naughton, B.T.; Mikkelsen, T.; Sjöholm, M. High resolution wind turbine wake measurements with a scanning lidar. J. Phys. Conf. Ser. 2017, 854, 012021. [Google Scholar] [CrossRef]
  40. Batchelor, G.K. An Introduction to Fluid Dynamics; Cambridge University Press: Cambridge, UK, 2000. [Google Scholar]
  41. Ponta, F.L.; Jacovkis, P.M. A vortex model for Darrieus turbine using finite element techniques. Renew Energy 2001, 24, 1–18. [Google Scholar] [CrossRef]
  42. Strickland, J.H.; Webster, B.T.; Nguyen, T. A Vortex Model of the Darrieus Turbine: An Analytical and Experimental Study. J. Fluids Eng. 1979, 101, 500–505. [Google Scholar] [CrossRef]
  43. Ponta, F.L. Vortex decay in the Kármán eddy street. Phys. Fluids 2010, 22, 093601. [Google Scholar] [CrossRef]
  44. Flór, J.B.; van Heijst, G.J.F. An experimental study of dipolar structures in a stratified fluid. J. Fluid Mech. 1994, 279, 101–133. [Google Scholar] [CrossRef]
  45. Trieling, R.R.; van Wesenbeeck, J.M.A.; van Heijst, G.J.F. Dipolar vortices in a strain flow. Phys. Fluids 1998, 10, 144–159. [Google Scholar] [CrossRef]
  46. Hooker, S.G. On the action of viscosity in increasing the spacing ration of a vortex street. Proc. R. Soc. 1936, A154, 67–89. [Google Scholar]
  47. Lamb, H. Hydrodynamics, 6th ed.; Cambridge University Press: Cambridge, UK, 1932. [Google Scholar]
  48. Cottet, G.H.; Koumoutsakos, P.D. Vortex Methods: Theory and Practice; Cambridge University Press: London, UK, 2000. [Google Scholar]
  49. Karamcheti, K. Principles of Ideal-Fluid Aerodynamics; Wiley: New York, NY, USA, 1966. [Google Scholar]
  50. Hau, E. Wind Turbines: Fundamentals, Technologies, Application, Economics; Springer: Berlin/Heidelberg, Germany, 2013. [Google Scholar]
  51. Trudnowski, D.; LeMieux, D. Independent pitch control using rotor position feedback for wind-shear and gravity fatigue reduction in a wind turbine. In Proceedings of the 2002 American Control Conference (IEEE Cat. No. CH37301), Anchorage, AK, USA, 8–10 May 2002; Volume 6, pp. 4335–4340. [Google Scholar]
  52. EWEA. Upwind: Design Limits and Solutions for Very Large Wind Turbines; Sixth Framework Programme; European Wind Energy Association: Brussels, Belgium, 2011. [Google Scholar]
  53. Kelley, C.; Naughton, B. Surface Meteorological Station—SWiFT Southwest—METa1—Reviewed Data. 2021. Available online: https://www.osti.gov/biblio/1349888 (accessed on 20 December 2023).
  54. Kelley, C.; Naughton, B. Lidar—DTU SpinnerLidar—Reviewed Data. 2021. Available online: https://www.osti.gov/biblio/1349890 (accessed on 20 December 2023).
  55. Englberger, A.; Lundquist, J.K.; Dörnbrack, A. Changing the rotational direction of a wind turbine under veering inflow: A parameter study. Wind Energy Sci. 2020, 5, 1623–1644. [Google Scholar] [CrossRef]
  56. Abkar, M.; Sørensen, J.N.; Porté-Agel, F. An Analytical Model for the Effect of Vertical Wind Veer on Wind Turbine Wakes. Energies 2018, 11, 1838. [Google Scholar] [CrossRef]
  57. Porté-Agel, F.; Bastankhah, M.; Shamsoddin, S. Wind-Turbine and Wind-Farm Flows: A Review. Bound.-Layer Meteorol. 2020, 174, 1–59. [Google Scholar] [CrossRef]
  58. Zong, H.; Porté-Agel, F. Experimental investigation and analytical modelling of active yaw control for wind farm power optimization. Renew Energy 2021, 170, 1228–1244. [Google Scholar] [CrossRef]
  59. Su, K.; Bliss, D. A numerical study of tilt-based wake steering using a hybrid free-wake method. Wind Energy 2020, 23, 258–273. [Google Scholar] [CrossRef]
  60. Uchida, T. Effects of Inflow Shear on Wake Characteristics of Wind-Turbines over Flat Terrain. Energies 2020, 13, 3745. [Google Scholar] [CrossRef]
  61. Williamson, C.H.K.; Prasad, A. A new mechanism for oblique wave resonance in the natural far wake. J. Fluid Mech. 1993, 256, 269–313. [Google Scholar] [CrossRef]
  62. Cimbala, J.M.; Nagib, H.M.; Roshko, A. Large structure in the far wakes of two-dimensional bluff bodies. J. Fluid Mech. 1988, 190, 265–298. [Google Scholar] [CrossRef]
  63. Taneda, S. Downstream development of the wakes behind cylinders. J. Phys. Soc. Jpn. 1959, 14, 843–848. [Google Scholar] [CrossRef]
  64. Meneghini, J.R.; Bearman, P.W. Numerical simulation of high amplitude oscillatory flow about a circular cylinder. J. Fluids Struct. 1995, 9, 435–455. [Google Scholar] [CrossRef]
  65. Inoue, O.; Yamazaki, T. Secondary vortex streets in Two-dimensional cylinder wakes. Fluid Dyn. Res. 1999, 25, 1–18. [Google Scholar] [CrossRef]
  66. Aref, H.; Siggia, E. Evolution and breakdown of a vortex street in two dimensions. J. Fluid Mech. 1981, 109, 435–463. [Google Scholar] [CrossRef]
  67. Ponta, F.L.; Aref, H. Numerical experiments on vortex shedding from an oscillating cylinder. J. Fluids Struct. 2006, 22, 327–344. [Google Scholar] [CrossRef]
  68. Matsui, T.; Okude, M. Formation of the secondary vortex street in the wake of a circular cylinder. In Proceedings of the IUTAM Symposium on Structures of Compressible Turbulent Shear Flows, Symposium, Marseille, France, 31 August–3 September 1982; Springer: Berlin/Heidelberg, Germany, 1983; pp. 156–164. [Google Scholar]
  69. Meiburg, E. On the role of subharmonic perturbations in the far wake. J. Fluid Mech. 1987, 177, 83–107. [Google Scholar] [CrossRef]
  70. Williamson, C.H.K.; Roshko, A. Vortex formation in the wake of an oscillating cylinder. J. Fluids Struct. 1988, 2, 355–381. [Google Scholar] [CrossRef]
  71. Ponta, F.L.; Aref, H. Vortex synchronization regions in shedding from an oscillating cylinder. Phys. Fluids 2005, 17, 011703. [Google Scholar] [CrossRef]
  72. Govardhan, R.; Williamson, C.H.K. Modes of vortex formation and frequency response of a freely vibrating cylinder. J. Fluid Mech. 2000, 420, 85–130. [Google Scholar] [CrossRef]
  73. Griffin, O.M.; Ramberg, S.E. The vortex street wakes of vibrating cylinders. J. Fluid Mech. 1974, 66, 553–576. [Google Scholar] [CrossRef]
Figure 1. Symbolic flowchart representation of the CODEF suite and its individual modules, with an example of the GVLM lattice wake structure. The color pattern used in the lattice wake depiction and all vortex lattice depictions in this work is not associated with any specific physical quantity and provided only to enhance the visual perception of the vortex lattice structure.
Energies 18 01499 g001
Figure 2. A schematic description of the process of generation of the vortex lattice associated with each of the turbine blades. (a) Arrangement of the individual filaments forming the three dimensional lattice structure. (b) Sample of a typical lattice propagating downstream.
Energies 18 01499 g002
Figure 3. Conceptual representations of the way the CODEF models wind fluctuations at various scales of turbulence. (a) Visualizations of the mean wind profile representing the input for CODEF-resolved scales superimposed with the instantaneous wind field, which incorporates small-scale turbulent variations. (b) A sample of the power density function for an anemometry reading obtained at the SNL-SWiFT facility, specifying the typical frequency band for the CODEF-resolved scales input, and the frequency band for smaller-scale variations modeled using the GVLM’s TDC parameter. (c): A visualization of how wind parameters are modeled in the y z plane and in the x direction, including an example for the indication of distances downstream of a rotor 20 m in diameter.
Energies 18 01499 g003
Figure 4. Vortex lattice wake structure in a uniform stream wind profile. (a) Perspective view over 10 diameters downwind. (b) Detailed view of lattice generation for an individual blade. (c,d) Rear cross-cut views at 1 and 5 diameters downstream, respectively.
Energies 18 01499 g004
Figure 5. Vortex-lattice wake structure in a wind profile with variation in wind speed with depth. Top view of the wake structure, wind speed variation with downwind distance, and cross-sectional rear views of the wake’s structure.
Energies 18 01499 g005
Figure 6. Vortex-lattice wake structure in a wind profile with variation in wind direction with depth. Top view of the wake structure, wind direction variation with downwind distance, and cross-sectional rear views of the wake’s structure.
Energies 18 01499 g006
Figure 7. Vortex-lattice wake structure in a wind profile with variation in wind shear with depth. Side view of the wake structure, wind shear variation with downwind distance, and cross-sectional rear views of the wake’s structure.
Energies 18 01499 g007
Figure 8. Vortex-lattice wake structure in a wind profile with variation in wind veer with depth (positive veer case). Top view of the wake structure, wind veer variation with downwind distance, and cross-sectional rear views of the wake’s structure.
Energies 18 01499 g008
Figure 9. Vortex-lattice wake structure in a wind profile with variation in wind veer with depth (negative veer case). Top view of the wake structure, wind veer variation with downwind distance, and cross-sectional rear views of the wake’s structure.
Energies 18 01499 g009
Figure 10. Vortex-lattice wake structure in a wind profile with variation in wind speed and direction with depth. Top view of the wake structure, wind parameter variations with downwind distance, and cross-sectional rear views of the wake’s structure.
Energies 18 01499 g010
Figure 11. Vortex-lattice wake structure in a wind profile with variation in wind speed and direction with depth, combined with a constant shear. Top view of the wake structure, wind parameter variations with downwind distance, and cross-sectional rear views of the wake’s structure.
Energies 18 01499 g011
Figure 12. Vortex-lattice wake structure in a wind profile with variation in wind speed and direction with depth, combined with a constant shear and veer. Top view of the wake structure, wind parameter variations with downwind distance, and cross-sectional rear views of the wake’s structure.
Energies 18 01499 g012
Figure 13. Vortex-lattice wake structure in a wind profile with variation in wind speed, direction, shear, and veer with depth combined. Top view of the wake structure, wind parameter variations with downwind distance, and cross-sectional rear views of the wake’s structure.
Energies 18 01499 g013
Disclaimer/Publisher’s Note: The statements, opinions and data contained in all publications are solely those of the individual author(s) and contributor(s) and not of MDPI and/or the editor(s). MDPI and/or the editor(s) disclaim responsibility for any injury to people or property resulting from any ideas, methods, instructions or products referred to in the content.

