Article

Thermal Comfort of Older People: Validation of the MPMV Model

Construction Research Centre, National Research Council Canada (NRC), 1200 Montreal Road, Building M-24, Ottawa, ON K1A 0R6, Canada
*
Author to whom correspondence should be addressed.
Energies 2025, 18(6), 1484; https://doi.org/10.3390/en18061484
Submission received: 31 January 2025 / Revised: 13 March 2025 / Accepted: 14 March 2025 / Published: 17 March 2025
(This article belongs to the Special Issue Research Trends of Thermal Comfort and Energy Efficiency in Buildings)

Abstract

:
Older people are the most vulnerable to extreme heat and cold events, and understanding their thermal comfort requirements is an important component for the design of healthy buildings. There are, however, very few predictive thermal comfort models for older populations. The aim of this paper was to validate the newly developed MPMV model for older people using thermal sensation data collected in climatic chambers and field studies in urban and rural buildings under various climate zones. Besides the six customary physical parameters governing thermal perception, the model accounts for additional factors covering heat retrieval from or heat addition to the body core and adjustment constants for regulatory sweating rate and non-shivering thermogenesis, which are important for the thermal adaptation of people in real settings. The model predictions show good agreement with measurement in climate chambers, with an overall RMSE = 0.44. Similarly, the model reproduces field measurement with a high degree of accuracy in 71% of the studies, with RMSE = 0.52. The major differences were observed in urban and rural residences during the winter of cold climates and summer of hot climates. These discrepancies could be attributed to unreported factors, such as the transient effects, misestimation of personal input data, and seasonal adaptation of residents.

1. Introduction

Thermal comfort is a fundamental human need for achieving satisfaction with built environments and plays an important role in cognitive functions, physical performance, health, and wellbeing [1,2]. Thermal comfort is essentially psychological, affected by many environmental and personal factors, such as environmental conditions, local climate, the person’s cultural background, gender, age, and factors related to physiological and health conditions [3,4,5]. Most of the current predictive thermal comfort models are designed for average-age adults with healthy thermoregulatory functions. However, these functions are weakened by age advancement and chronic health conditions. Healthy older people (age > 65 years) are known to have lower resting metabolic rates, cardiac output (blood volume), and sweating rates than young adults [6]. Furthermore, older people’s sensitivity to thermal stimuli declines with advancing age, being more pronounced under warmth than under cold, particularly at the distal body parts, making them more vulnerable to extreme heat or cold events. However, thermal sensitivity remains highly variable between subjects, and this variability increases with age, particularly if combined with chronic health conditions such as diabetes (with marked loss of sensitivity) [7]. Lower thermal sensitivity attenuates comfort perception and detection of thirst (dehydration) and therefore increases response time to induce any behavioral adaptation. In addition, due to their physical and mental frailty, older adults have limited adaptations to cope with extreme heat or cold events, thus increasing their health risk [8]. This highlights the urgent need to develop validated predictive thermal comfort models for the most vulnerable and ever-increasing older population around the world, enabling us to properly design, operate, and maintain resilient and healthy buildings that maintain comfort and protect the health and wellbeing of older occupants from the adverse effects of heat and cold, especially during climatic extreme events.
Currently, there is no universal predictive thermal comfort model for young or older people in controlled or free-running built environments under steady state conditions [9]. The currently available comfort models, developed specifically for older people or developed for young adults but applied to older people, can be categorized into three groups: (1) analytical (or semi-analytical), (2) empirically based, and (3) regression-based.
Analytical (or semi-analytical) models are based on the heat balance (including the physiological) approach or combine the heat balance approach with adaptive features to account for subject adaptations in non-controlled built environments. The body heat balance approach integrates the physiological response (metabolic energy production, skin blood flow, shivering, and sweating) of the human body with the thermal environment, and it is therefore the logical physical approach to minimize body energy expenditure and thermoregulatory actions for comfort. Better representation of this interaction is therefore crucial for model accuracy. Furthermore, subject adaptations in real environments, which change the physiological response and/or thermal environmental conditions, can be accounted for in the model. For example, heat acclimatization after long exposure to hot conditions increases tolerance to warm conditions by increasing regulatory sweating rate [10]. Models using this approach are very scarce, one of which is the popular predictive mean vote (PMV) model of Fanger [11], developed for young adults in controlled environments. The PMV model is adopted in the international comfort standards of ASHRAE -55:2023 [12] and ISO 7730:2023 [13]. Many field studies on young adults in air-conditioned and free-running buildings have identified that the PMV model has limited accuracy, particularly in the discomfort range (|PMV| > 1) [14,15]. Despite these limitations, the PMV model has been applied to older people with similar controversial conclusions. In climate chamber studies, Bae et al. [16] found that the PMV model could be used to predict actual thermal sensation votes. However, Tsuzuki and Ohfuku [17] indicated that the PMV model is not suitable for older adults who have 30% lower metabolic rates compared to young adults. Similarly, Schellen et al. [18] found that the PMV model underpredicted thermal sensation votes of older people around the neutral conditions. A similar controversial conclusion was also reached in field studies, where in most cases, the PMV model was found to overpredict thermal sensation votes of older people on the warm and cold sides in air-conditioned and free-running environments [19,20,21,22,23]. Due to these limitations, over twenty studies have attempted to improve the PMV model by including various adaptive features to address comfort in free-running buildings [24], but these models have not yet been tested for older adults. These models are based on the PMV predictions, but they are corrected using either fixed or variable adaptive constants [25,26,27] or correlation equations that modify the inputs of the PMV model [28] or provide adjustments to the comfort predictions [15]. Models that modify the input data seem the best, since they preserve the principle of the steady state heat balance approach. The models that use adaptation constants are not universal, since the adaptive constants vary with building types, seasons, and local prevailing climates. Furthermore, models that use the concept of the black box theory with feedback to account for subject adaptations [26], in our opinion, could be more suited to dynamic comfort conditions (driven by behavioral adaptation), not steady state conditions in which the feedback signal should decay to zero. A full review and assessment of these models may be found in [9,24,29]. None of these models have seen wide acceptance by scholars. However, the adaptive model (aPMV) of Yao et al. [26] has received increasing interest, particularly in comfort studies under various climate zones in Asia, and was adopted in the Chinese standard [30]. Recently, Younes et al. [31] developed a physiologically based model for older people under both transient and steady state conditions in controlled environments. For steady state conditions, the model uses the mean skin temperature, which was calculated using the multi-segment bioheat model for the elderly by Rida et al. [32]. However, the model relied on limited public domain measurement data from climate chamber studies to determine the model constants and validate its accuracy.
Empirically based comfort models are developed from extensive measurement datasets collected in real (mostly office) buildings across various locations and regional climates to address the adaptive thermal comfort of average young adults in real built environments. In these models, the neutral indoor (operative) temperature is regressed against the running mean of the outdoor temperature, thus explicitly ignoring the influence of personal and environmental factors. The popular models include the adaptive comfort models for naturally ventilated or free-running buildings of ASHRAE-55-2023 [12] and European standard EN15251:2007 [33]. A full review of these models was previously presented in [29]. However, these models have not yet been tested for older adults and are not suitable for direct comparison with the proposed model.
The vast majority of comfort models for older people are regression-based, developed from measurement data from controlled environments of climate chambers or monitored environments in field studies. In climate chamber studies, the environmental conditions and subjects’ characteristics are well controlled. Comfort models developed from such studies are therefore less prone to biases in the input data, but they remain highly limited in scope, focusing on comfort differences between older and young adults [17,34], effects of transient conditions [35,36,37], heat adaptation of the elderly in hot summers [20,38], and physiological responses to moderate or hot conditions [39,40,41]. The situation is different for the field studies, where the derived comfort models are subject to higher uncertainties in the inputs for the environmental conditions and personal data. Furthermore, many other factors can influence thermal comfort perception, such as subjects’ adaptations to local climates and building types. Field studies were conducted in various buildings classified as residences or long-term care homes in urban and rural settings. The latter have some differences that can affect occupants’ thermal perception. Urban buildings are typically better insulated, usually heated in winter and air-conditioned in summer, thus resulting in warmer indoor temperatures year round [42]. Older occupants in these buildings spend most of their time indoors. In contrast, rural buildings are leakier and less insulated, unheated or with local heating (e.g., coal stove or electrically heated blankets, etc.) in winter and predominately naturally ventilated in summer, thus resulting in cooler indoor temperatures in both the winter and summer seasons. Older occupants of these buildings spend some of their time outdoors during their daily lifestyle and may thus undergo significant temperature swings on a daily basis [42]. Older occupants in residences assume an independent lifestyle and are free to adapt to reduce heat and cold stress. On the other hand, older occupants of long-term care homes assume a dependent lifestyle, requiring continuous support from the non-resident staff of the building and having fewer opportunities to adapt to restore thermal comfort [43].
The majority of field studies were conducted in urban residences in hot and humid summers in Asia. Older occupants of these buildings use different means to adapt to high temperatures, including clothing adjustment, opening windows, portable or ceiling fans, drinking of cold water, taking showers several times a day, and turning on air conditioners [20,44]. The reported values of the neutral temperatures cover a wide range from 25.2 °C [45] or 25.5 °C [46] or 25.8–27.9 °C [8] to 27.5–28.8 °C [47] or 29 °C [48] or 30 °C [44]. Only a few studies reported a neutral temperature in winter, 23.2 °C [45]. Field studies in rural residences were also conducted in Asia in limited climate zones. Rural older residents used various means to adapt to low temperatures in cold winters or high temperatures in hot summers, including thicker clothing in winter, open windows in summer, drinking cold or hot beverages, etc. As a result, older residents reported a broad range of neutral temperatures in both seasons [49]. In the winter of cold climates, the neutral temperature ranged from as low as 8.46–10.53 °C [50] or 11.3 °C [51] or 14.4 °C [52] to as high as 16.48 °C [22] or 20.52 °C [53]. Researchers argued that older residents in these cold climates had lower expectations of higher temperatures due to the absence of central heating and thus developed a degree of adaptability to tolerate cooler conditions. However, very cold temperatures could pose a higher risk to their long-term health conditions [42]. In hot summers, older people in naturally ventilated homes reported high neutral temperatures ranging from 23.9 °C [54] to 27.52 °C [55] or 28.1 °C [56].
Field studies in long-term care homes (also known as nursing homes) have also received great interest in various locations around the globe due to the increasing aging population and growing demand for nursing homes. Thermal comfort in these buildings needs to satisfy both the older residents and the (average-age) non-resident (support) staff of the building. Older residents use limited means to adapt to low and high indoor temperatures, including clothing adjustment, personal cooling fans, and air conditioners [23,57]. Tartarini et al. [58] conducted a study in six care homes during a mild winter and summer in Australia. The observed neutral temperature was 22.9 °C in summer and 21.2 °C in winter for the older residents and 22 °C in summer for the non-residents. Baquero and Forcada [59] and Baquero et al. [19] studied five nursing homes during the summer (hot and dry) and winter (cold) of a continental climate in Spain, respectively. The results show that the neutral temperature was 25.84 °C for the residents and 23.2 °C for the non-residents in summer and 24.9 °C for the residents in winter. Similarly, Forcada et al. [60,61] conducted field studies in five nursing homes during the summer (hot and dry) and winter (mild and wet) of a Mediterranean climate in Spain. The study found that the neutral temperature was 25.3 °C (residents) and 23.9 °C (non-residents) in summer and 21.6 °C (residents) and 21.9 °C for (non-residents) in winter. In humid subtropical climates in China, the neutral temperatures for residents in the summer and winter seasons were 25.4 °C and 16.7 °C [62] and 24–27 °C and 23 °C [57], respectively. In winter, a study by Sun et al. [63] found that the neutral temperature was 21.7 °C. In hot and humid summers in China, the neutral temperature for residents was 24.6 °C [20], and those for the cold, dry winter and hot summer climate were 24.1 °C in summer and 19.4°C in winter [64].
The previously reviewed studies indicate that thermal comfort for older people still needs further extensive research on the modelling and experimental aspects. On the modelling side, a physically based model should be developed to account for not only the six customary environmental and personal factors, but also the physical and personal factors related to the adaptation and age-dependent sensitivity of older adults to heat and cold in various geographical locations and local climate conditions. These kinds of models will ultimately need high-quality experimental data (with measured or known inputs to reduce prediction bias) for their validation. To address this large research gap, a theoretical model called the Metabolic-based Predicted Mean Vote (MPMV) was recently developed to accommodate both young and older adults [65,66]. The MPMV model incorporates additional factors such as subject acclimatization to heat or cold, body dehydration, and heat exchange with the body core. The main goal of this paper is to present the details of the MPMV model for older people and validate its predictions with public domain experimental comfort data carried out in climatic chambers and real field settings.

2. Method

The MPMV model is a general theoretical comfort model developed based on the heat balance approach by accounting for body thermoregulation for evaporative sweating and non-shivering thermogenesis to address the comfort requirements of healthy young and older people in a wakeful or sleeping state under steady state conditions [65,66]. The model constants (A, B, C, D) were previously derived from high-quality public comfort datasets from climate chamber studies in which all the inputs were laboratory-measured. However, the MPMV model for older people has not been extensively benchmarked to replicate comfort data in other climate chamber studies and real field settings, which usually include high uncertainties in the input data (such as the metabolic rate and clothing insulation). This paper addresses this experimental validation of MPMV. To this end, two sets of comfort data were collected from (1) climate chamber studies and (2) real field studies around the world. A comparison between the MPMV model predictions and those from the PMV model of Fanger [11], the adaptive aPMV model of Yao et al. [26], and the elderly model of Younes et al. [31] was also made for information purposes. The following section provides a brief description of the MPMV model and outlines the experimental studies selected for the validation process.

2.1. Description of the MPMV Index for Older People

The MPMV model is described in detail in [65,66]. In the following, some details specific to older people, not included in the original publication, are presented. The formulation of the MPMV index is expressed by the following relationship:
MPMV = β ( M E W E + Q ex ) · M E W E M C + W C
where ME and WE are the metabolic rate and mechanical work (W/m2) associated with the activity of older subjects, MC and WC are, respectively, the metabolic rate and the corresponding mechanical work required to maintain a neutral comfort state (MTSV = 0) under the given environmental conditions and clothing insulation levels of subjects, Qex is the heat flux extracted from or added to the body core section (W/m2), and (β) represents a sensitivity factor, which is defined by the following empirical equation:
β = C / M E W E + Q ex D
where C and D are the model constants, equal, respectively, to 0.2925 and 0.525 for older people [65].
The formulation of Mc is expressed as follows:
M C = M bE Q exC + M N · 1 η N M bE + Q exC 1 B · CSW / 1 η C ; if   M C   M bE M bE Q exC + M N + Q exC M bE 1 A · CSH 0.58 · CSW ;                                           if   M C < M bE
where A and B are the model constants (equal to 0.6928 and 0.2914, respectively, for older people [65]), CSH and CSW are adjustment constants accounting for deviations in the non-shivering thermogenesis and evaporative sweating rate, respectively, from the average (reference) wakeful person under the state of euhydration, MbE represents the older person’s minimum (basal) metabolic rate, QexC is the external heat flux supplied to (positive value) or removed from (negative value) the body core section at the neutral comfort state, MN denotes the metabolic rate required to maintain the core and mean skin temperatures at their resting neutral values (TcN = 36.8 °C and TskN = 33.7 °C) with no active thermoregulation, and ηC and ηN are the mechanical work efficiencies related to MC and MN, respectively. MN is calculated using Equation (4) in Laouadi [65] based on the body heat loss to the environment. The work efficiencies (ηC and ηN) are usually zero, except for activities that require a work effort, such as cycling or walking on graded surfaces. For cycling activities, Equation (9) in Laouadi [66] may be used. The basal metabolic rate of older people (MbE) can either be directly measured (known input) or determined using Equation (5) in Laouadi [65] if the basal skin blood flow is known. Alternatively, MbE can be estimated as a fraction (Fb) of the basal metabolic rate of a reference young adult (Mb,r = 0.75 met) as follows:
M bE = F b · M b , r
The fraction F b is therefore a function of the morphologic characteristics of older persons (age and body weight and height). It can be estimated using suitable correlations for the basal metabolic rates across varying ages. This paper adopts the Harris–Benedict correlations, which have been demonstrated to produce the best accurate results in previous studies [67]. Using these correlations, the basal metabolic rate (Mb,r) is calculated for a reference young adult with age = 25 years, body weight = 70 kg, and body height = 1.75 m. Similarly, the basal metabolic rate of older adults (MbE) is calculated based on their given age and body weight and height. If the morphological characteristics of older adults are not known, then the calculation is performed for a reference older person. In this paper, the body weight and height of the reference older person are set equal to those of the reference young adult, but the age is fixed to 70 years.
By virtue of Equations (1)–(3), there are eight primary factors affecting whole-body thermal comfort: (1) air temperature (Ta); (2) mean radiant temperature (Tr); (3) relative humidity (RH); (4) air velocity (Va); (5 and 6) thermal and evaporative resistances of clothing; (7) metabolic rate of activity (ME); and (8) external heat intervention (Qex). Additional secondary factors include the adjustment constants for regulatory sweating and non-shivering thermogenesis (CSW, CSH). For older individuals, the main challenging factor for thermal comfort calculation is the metabolic rate of activity. The metabolic rate is usually not measured or known, and the predefined values in existing metabolic databases are established for young adults. Compared to young adults, older individuals are known to have lower metabolic rates [17,32], but these rates show a large inter-individual variability (up to 35% lower) among the older population. Similar to the basal metabolic rate (Equation (4)), for a large pool of older adults, the metabolic rate of activity can be expressed as a fraction (FE) of the metabolic rate of young adults (Ma).
M E = F E · M a
For sedentary activities for which the basal metabolic rate constitutes the major component, the fraction (FE) can be assumed to be equal to the fraction for the basal metabolic rate (FE = FbE). For activity levels with higher metabolic rates, the fraction (FE) may, however, exceed one due to lower muscle efficiency, depending on the activity type [68].
It is worth noting that the adjustment constant CSW for sweating (default value = 1) may account for inter-personal differences (lower/higher sweating rates than for an average person), person acclimatization to heat (resulting in higher sweating rates), and body hypohydration after prolonged heat exposure (resulting in lower sweating rates). Similarly, the constant CSH for non-shivering metabolic rate (default value = 1) may account for a person’s acclimatization to cold increasing the non-shivering metabolic heat production [69]. According to Equation (3), the effect of heat acclimatization (CSW > 1) on comfort perception becomes more noticeable when a heat-acclimatized person experiences thermal discomfort, particularly under cold or (to a lesser extent) hot exposure conditions (due to increased evaporative heat losses). For example, Jowkar et al. [3] experimentally found that older adults with a warmer thermal history reported cooler thermal sensations than individuals accustomed to mild or cold climates when exposed to the same environments. On the other hand, the effect of cold acclimatization (CSH > 1) on comfort perception becomes more noticeable when a cold-acclimatized person experiences thermal discomfort under hot exposure conditions, requiring internal body cooling to reach a comfort state. These observations are consistent with the experimental study of Wu et al. [70]. For fully heat-acclimatized persons, the constant CSW may take a value of 1.5 [71]. For hypohydration effects, CSW is determined by Equation (10) in Laouadi [65]. In real settings, CSW is a combination of factors influencing the sweating rate.

2.2. Climate Chamber Studies

In climatic chamber studies, subjects are exposed to well-controlled environmental conditions (Ta, Tr, RH and Va) for a fixed exposure time period, leading to steady state conditions. A group of individuals, comprising both males and females, is carefully selected to ensure they are healthy with well-known body characteristics (age, weight, height, clothing). Before experiencing the effects of the controlled environmental conditions, subjects are placed in a neutral environment (in another chamber) to stabilize their physiological response. The intent of these studies is to capture the physiological and psychological responses at the end of the exposure period (steady state conditions) by controlling or measuring all influencing factors. However, in most studies, the metabolic rate of older subjects’ activity (ME) is not measured but estimated from existing databases of metabolic rates (Ma) of various activity types in young adults. These values may not accurately represent older people, as their metabolic rate can vary significantly with age and type of activity. Similarly, the intrinsic insulation value of subjects’ clothing ( I c l ) is usually estimated based on the worn clothing garments. These two factors may introduce significant biases between the measured and predicted thermal sensation votes. In this paper, prior experimental studies were chosen so that most influencing factors were measured. In studies where the metabolic rates of older people are not measured (or given), the latter will be estimated based on the known subject activity type using Equation (5). Table 1 lists the selected climate chamber studies used for the model validation process. Additional details on the experiments are provided in the supplementary document (Supplementary Materials S1).

2.3. Field Studies

Field studies outnumber climate chamber studies, encompassing various building types in various climate zones. However, field studies are inherently more complex, as thermal comfort votes are influenced by many known and unknown factors. Furthermore, thermal comfort data in these studies are by nature transient or quasi-transient, depending on the building type and local climate. The environmental conditions of the selected building spaces are monitored before and during survey periods, but they may continuously change throughout the day or across different areas of the building. Similarly, the activity levels of occupants prior to survey periods are not controlled or monitored, and occupants may move around or occupy different spaces within the monitored building or go out of their homes for shade or sunbathing. During the preparation phase, healthy subjects are pre-selected and their average anthropometric characteristics are recorded. During the interrogative survey period, which may last 15 to 30 min, participants are asked to remain seated and quiet (in most cases) to collect their instant thermal comfort votes using right-here-right-now questionnaires. Additional information is also collected during the survey period on clothing and activity level prior to surveys to estimate the average clothing insulation values and metabolic rates. The questionnaires are usually filled out by participants, but for some frail subjects (e.g., those having vision and hearing problems), the support staff or the interviewers record their responses on their behalf. In this paper, prior field studies with known exposure conditions and detailed personal information (age, weight, height, clothing, activity type) were chosen to minimize the potential biases between the model predictions and the measured comfort data. In most of the selected studies, except if otherwise indicated, the average metabolic rate of (young) subjects in sedentary activities is assumed equal to Ma = 1.2 met, and the corresponding metabolic rate of older subjects is estimated using Equation (5) based on the given older subject characteristics. If the average age of older subjects is not given, a reference older person with an average age of 70 years is considered. Table 2 lists the inputs (average values or ranges) of the selected field studies used for the model validation process. More details on the experiments and point-by-point inputs are found in the supplementary document (Supplementary Materials S1).

2.4. Model Simulation

The experimental cases of Table 1 and Table 2 are simulated using the MPMV model. For comparison purposes, the calculations are also performed for the PMV model of Fanger [11], the physiologically based model for elders of Younes et al. [31], and the adaptive model (aPMV) of Yao et al. [26]. The Younes et al. model [31] uses the average skin temperature to predict the steady state thermal sensation votes of older people under controlled environmental conditions. The average skin temperature is calculated using Rida et al.’s multi-segment bioheat model for the elderly [32]. In this paper, the mean skin temperature is instead calculated using the two-node bioheat model for the elderly, developed by [74], by incorporating the improved sweating and shivering models of Laouadi [65]. The aPMV model is based on the predictions of the PMV model and uses two custom-fit constants to dampen the overprediction of the PMV model in the cold and hot discomfort ranges (|TSV| > 1). In this paper, no attempt has been made to calculate the model constants for each experimental study; instead, the adopted values in the Chinese thermal comfort standard (GB/T 50785-2012) [30] for residences under hot summer and cold winter climates are used (0.21 and −0.5 [9]).

3. Results

3.1. Climate Chamber Studies

Figure 1 shows a comparison between the measured thermal sensation data (x-axis) of the selected climate chamber studies (Table 1) and the predictions (y-axis) by the models of the MPMV, PMV, aPMV, and PTSV (Younes et al. [31]). Note that the calculated values of the predicted mean votes are truncated if they are out of the scale (−3 to +3). Given the fact that subjective thermal perception does not discriminate mean thermal sensation votes lying within the range of TSV ± 0.5, a model is therefore deemed accurate or acceptable if its predictions fall within the defined accuracy zone (as delineated by the upper and lower limit lines). The MPMV model predictions are well distributed around the Equal Rating line (y = x) within the accuracy zone, apart from a few outlier points. The regression slope (0.96) and regression R2 (0.9) for the whole dataset are very close to unity, indicating better model accuracy. However, the PMV model (using the metabolic rate of older people, ME, as input) produces inaccurate results across the full range of thermal sensation (−3 to +3), with the exception of a few studies. The PMV particularly overpredicts thermal sensation votes in the discomfort zone (|TSV| > 1) on both the cold and hot sides. This inaccuracy is reflected in the correlation line with a slope of 13% higher than unity and lower regression R 2 (0.8). A similar situation applies to the aPMV model. While the aPMV model slightly improves the predictions at the warm discomfort range, it worsens the predictions on the cold discomfort range. Fine-tuning the model constants would improve the prediction accuracy but would not fully resolve the inaccuracy issue in the comfort range (TSV within ±1), as evident in the data from Wang et al. [36], Panraluk and Sreshthaputra [38], and Tsuzuki and Ohfuku [17]. Similarly, the physiologically based model of Younes et al. [31] tends to underpredict thermal sensation by more than 0.7 points, with predictions closer to the Lower Limit line. Part of this inaccuracy is due to the model prediction of the mean skin temperature under steady state conditions, which may need a longer time (>1 h) than the short exposure time set in the experiments (such as the case study in Soebarto et al. [34]). The calculated root mean square errors (RMSEs) for the entire datasets are 0.44 (for MPMV), 0.77 (for PMV), 0.61 (for aPMV), and 0.86 (for PTSV).

3.2. Field Studies

Results for the field studies are grouped into three categories according to residents’ lifestyle and their behavioral thermal adaptation: (1) urban care homes, (2) urban residences, and (3) rural residences.
Figure 2 compares the measured mean thermal sensation data (x-axis) from the selected field studies (Table 2) and predictions (y-axis) by the models of the MPMV, PMV and aPMV, grouped by the prediction accuracy when most of the predictions fall within or outside the accuracy zone (TSV ± 0.5). The MPMV model predictions fall within the accuracy zone for the majority of the studies (15 out of 21), resulting in a regression line very close to the Equal Rating line (y = x). For the remaining six studies, the MPMV model fails to accurately reproduce thermal sensation votes, particularly for very old people (>88 years [47]) at the discomfort range or for some rural residences in the winter season. The PMV model produces results within the accuracy zone for 10 out of 21 studies but tends to overpredict thermal sensation, particularly at the discomfort range (|TSV| > 1) for the remaining 11 studies. The aPMV model improves the PMV predictions by reducing the overpredictions at the discomfort range for 15 out of 21 studies but again fails for the remaining 6 studies. The calculated RMSEs when most of the predictions are within the accuracy zone are 0.52 (MPMV), 0.7 (PMV), and 0.47 (aPMV).
Figure 3 shows a comparison between the field-measured thermal sensation data and the MPMV model predictions, grouped by building types. For urban care homes, the MPMV predictions are close to the measurement data, particularly in the comfort zone (|TSV| < 1) where most measurements lie. Outside the comfort zone, the model overpredicts thermal sensation, especially in the winter season (e.g., [62]). This overprediction is more likely due to factors such as underestimation of the winter clothing insulation value. For instance, Wang et al. [62] used a correlation for the ensemble clothing insulation that produced significantly lower values compared to the equations in ISO 9920:2007 [75] or the new regression model by Tang et al. [76].
For urban residences, most studies focused on the summer season, except the study of Hwang and Chen [45], which also included the winter season. Residents were assumed not to be heat-acclimatized, except in the study by Sudarsanam and Kannamma [44] set in a hot summer in India. The MPMV model accurately reproduced the experimental data of Sudprasert [48], Zhou et al. [73], and Miao et al. [46] and most of the data of Wu et al. [20] given some unknown inputs. For the study of Sudarsanam and Kannamma [44], the model slightly overpredicted thermal sensation, more for women than for men. Residents of this study adapted to heat by taking cold showers and drinking cold water, but these were not accounted for in the calculation since no explicit inputs were given. For the study of Zheng et al. [47], the model predictions were within the accuracy zone for the comfort range, but the model overpredicted thermal sensation at the discomfort range (TSV > 1), particularly for very old people (age > 88 years). Accounting for heat acclimatization of these residents will reduce this overprediction. For the Hwang and Chen [45] data, the model predictions were within the accuracy zone in the winter season but were lower for the summer season.
For rural residences, the measurement included both the winter and summer seasons. In the study by Tang et al. [55], which focused on hot and humid summers, residents were assumed to be acclimatized to heat (CSW = 1.5). Overall, the MPMV model predictions were within the accuracy zone for four out of five studies. Worthy of note is the study by Feng et al. [51] set during cold winters, which is similar to Li et al. [53], but the model predictions are significantly lower and do not match the signs of the reported field data (i.e., cold vs. warm). These discrepancies could be attributed to two main factors, among others. First, thermal sensation of subjects did not reach the steady state conditions during the survey period under such cold conditions that would trigger continuous metabolic energy production by non-shivering thermogenesis. Second, chronic cold habituation may attenuate the physiological response, further reducing thermal sensitivity to cold conditions. Further research is needed to disclose the factors influencing thermal sensation and resident adaptation in rural buildings in cold climates.

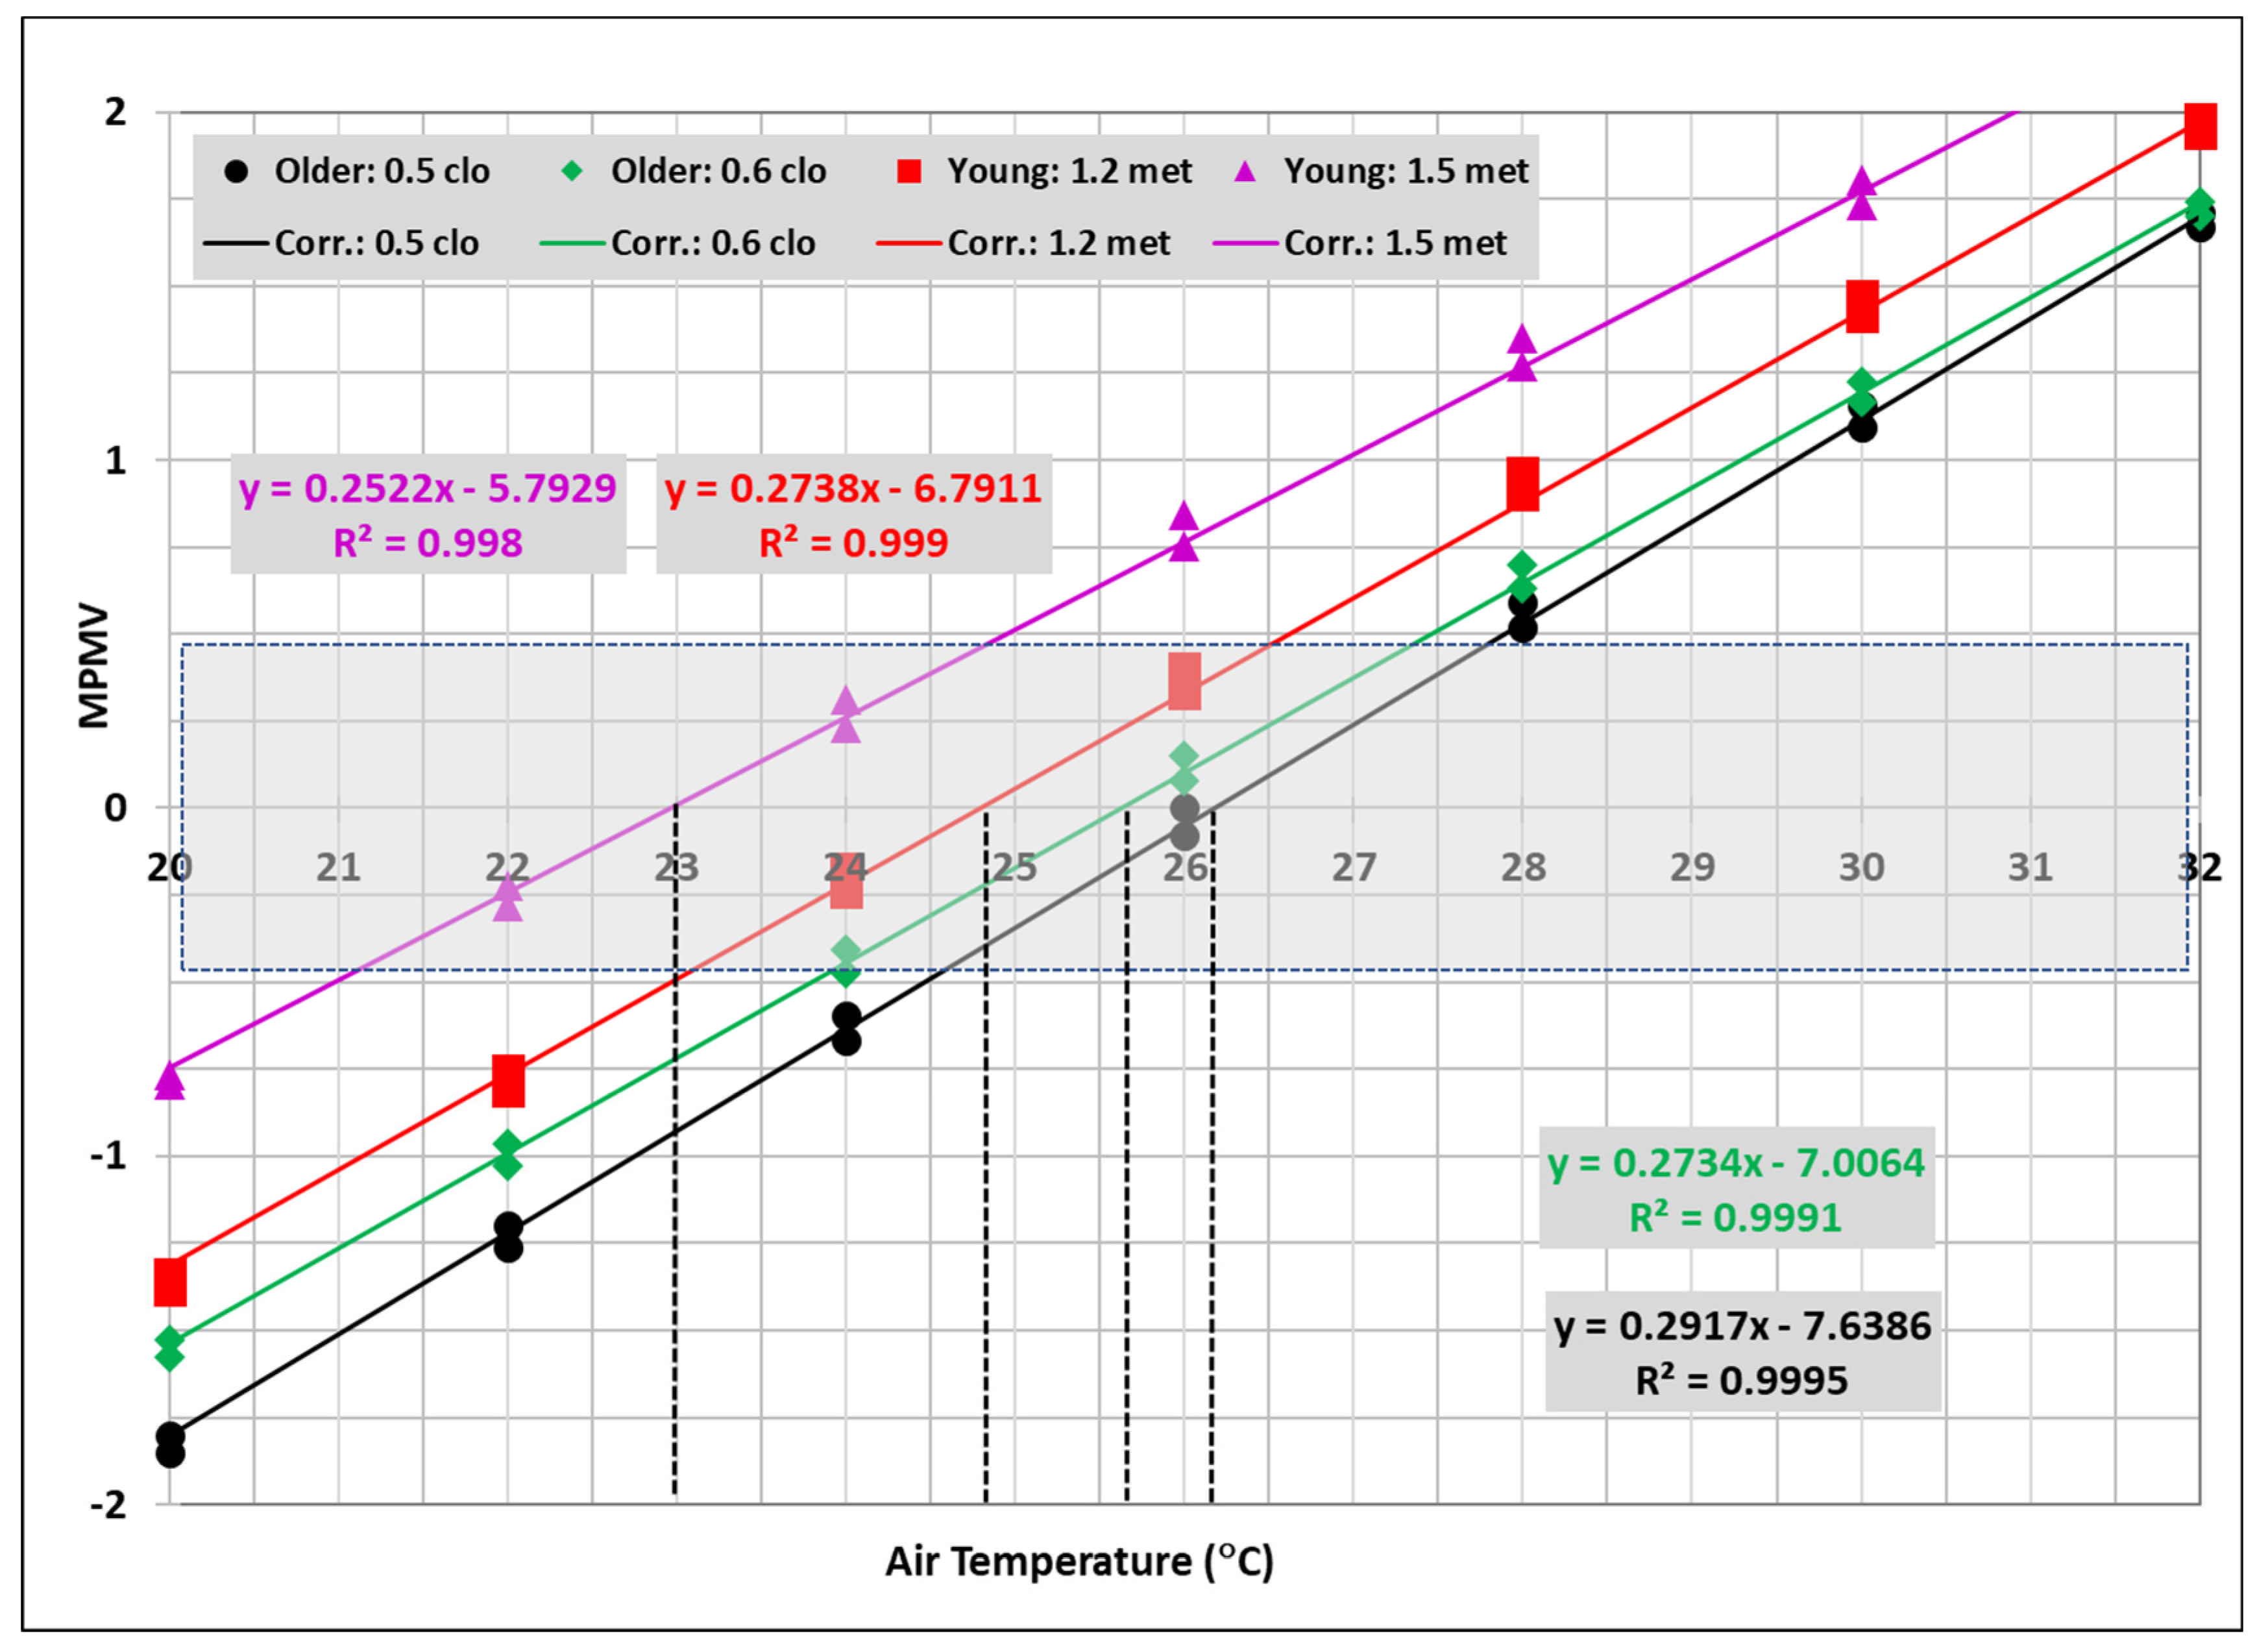
3.3. Comfort Requirements for Older People

The MPMV model is used to generate typical thermal sensation profiles for reference young (25-year-old) and older (70-year-old) individuals as a function of the air temperature in summer and winter seasons across three building types: urban care homes, urban residences, and rural residences. For urban care homes, residents (older people) are assumed to be engaged in sedentary activities (Ma = 1.2 met) with clothing insulation levels of Icl = 0.6 clo in summer and 1 clo in winter. Non-residents (younger support staff) are assumed to perform light activities (1.5 met) with Icl = 0.5 clo in summer and 1 clo in winter. For urban residences, residents (young and older people) are assumed to be engaged in a sedentary activity (1.2 met) with clothing insulation Icl = 0.5 clo (summer) and 1 clo (winter). For rural residences, both young and older people are also assumed to be engaged in sedentary activities (1.2 met), but with clothing insulation levels of Icl = 0.4 clo in summer and 1.5 clo in winter.
Figure 4 and Figure 5 show the comfort requirements for urban care homes and residences for the summer and winter seasons, respectively, and Figure 6 shows the comfort requirements for rural residences in both the summer and winter seasons. The neutral air temperatures (at MPMV = 0) and neutral comfort range (TSV within ±0.5) derived from these figures are shown in Table 3, alongside the neutral air temperature data from field studies. The calculated neutral air temperatures align well with several field studies, except for rural residences in winter, which require further research and more case studies.

4. Discussion

The MPMV model accounts, in addition to the six customary physical parameters, for factors that are particularly relevant in real-world field settings, such as external heat retrieval from or addition to the body core (e.g., drinking of cold or hot beverages) and variations in individual thermoregulatory systems deviating from the average. Different thermoregulatory responses are modeled using adjustment constants for sweating (SCW) and non-shivering thermogenesis (CSH). These constants account for the effects of individual differences, heat acclimatization, and hypohydration on sweating rate, as well as cold acclimatization on non-shivering thermogenesis. However, the main challenge to predict thermal sensation of older people is the estimation of their metabolic rate of activity. Older people present high inter-individual variability in metabolic rates, varying from no change to 35% lower than young adults [17,40]. This variability is not always clearly attributed to the aging effect, or it is not detected in small samples of subjects (e.g., lower than 50 older adults). Furthermore, the challenge is complicated by limited data, as published compendiums on metabolic rates primarily focus on activities by young adults [77,78].
In this paper, the metabolic rate of older people was estimated as a fraction of the metabolic rate of young adults. This fraction is generally a fixed input, but for a large population of individuals performing sedentary light activities (<1.5 met), it is estimated as the ratio of the basal metabolic rate of older to young adults using existing correlations. As a result, comfort requirements for small samples of older people are expected to be between the comfort requirements for young adults (representing cases of no change in metabolic rates) and comfort requirements calculated for a large group of older subjects (representing cases of average reduction in metabolic rates).
Predictions of the MPMV model align very well with the experimental data in controlled environments of climate chambers (Figure 2, with an overall RMSE = 0.44), given some uncertainties in the input parameters, such as the metabolic rate. On the other hand, the PMV model results in inaccuracies (with RMSE = 0.77), particularly in the discomfort range (|TSV| > 1) and for older subjects having significantly lower metabolic rates than young adults (e.g., as shown in [17]). The predictions of the aPMV model with fixed adaptive constants for controlled environments are worse than the PMV predictions, as reflected in the regression line (slope = 0.66; R2 = 0.82). The model constants will therefore need adjustments to improve predictions in air-conditioned buildings.
Similarly, the MPMV model reproduces field measurement data with a high degree of accuracy, with an RMSE of 0.52 in 71% of the cases across urban and rural buildings in diverse climate zones, despite the presence of many unknown input parameters in the field settings. The major differences were found in residences in the winter seasons of cold climates and the summer seasons of hot climates (Figure 3). The physical factors contributing to these lower prediction accuracies can be grouped as follows:
  • Transient effects. Field comfort data are reported for average indoor conditions (time or space or both) and activity level of residents during survey periods. However, field environmental conditions are not controlled and may vary throughout the day or across different spaces in a building. Similarly, residents may undertake different activity levels and move between spaces before surveys, depending on building type. Physiological and psychological responses to these transient effects may never reach (or need longer times to reach) the steady state conditions, particularly under cold exposure, thus resulting in body heat storage, which in turn will alter thermal sensation.
  • Misestimation of subject data. Subject data include ensemble clothing insulation and metabolic rate of activity. In field studies, clothing information is collected during survey periods, and their overall insulation values are estimated using various existing correlations. For single-layer clothing, such as that used in summers (Icl < 1 clo), insulation value is easier to estimate, but multilayer clothing, such as that used in cold winters (Icl > 1 clo), poses challenges. For example, Wang et al. [62] used a formula that can result in a 25% lower insulation value than the ISO 9920:2007 [75] formula for winter clothing. Recently, Tang et al. (2022) [76] showed that the mean absolute error (MAE) in estimating the ensemble clothing insulation using the ISO 9920:2007 [75] formula may reach 0.31 clo for multilayer clothing with Icl > 1.5 clo.
  • Similarly, metabolic rate of subjects during survey periods is challenging to determine due to many uncontrolled factors. First, metabolic rate is affected by prior changes in subject activity levels whose effects would require up to ten minutes to vanish [79]. Second, food intake prior to survey periods can increase metabolic rate (diet-induced thermogenesis) by 10 to 15% [80]). Third, drinking more than 0.5 L of cold water could increase metabolic rate (water-induced thermogenesis) by up to 25 to 30% [81,82].
  • Effects of the mean radiant temperature (Tr). Most of the field studies (Table 2) did not provide detailed inputs of Tr in parallel with the air temperature, and therefore, Tr had to be assumed to be equal to the air temperature. This assumption may, however, result in significant differences in the computed thermal sensation votes. For example, increasing or decreasing Tr by more than 3 °C from the air temperature would result in more than ±0.45 units of difference in thermal sensation votes.
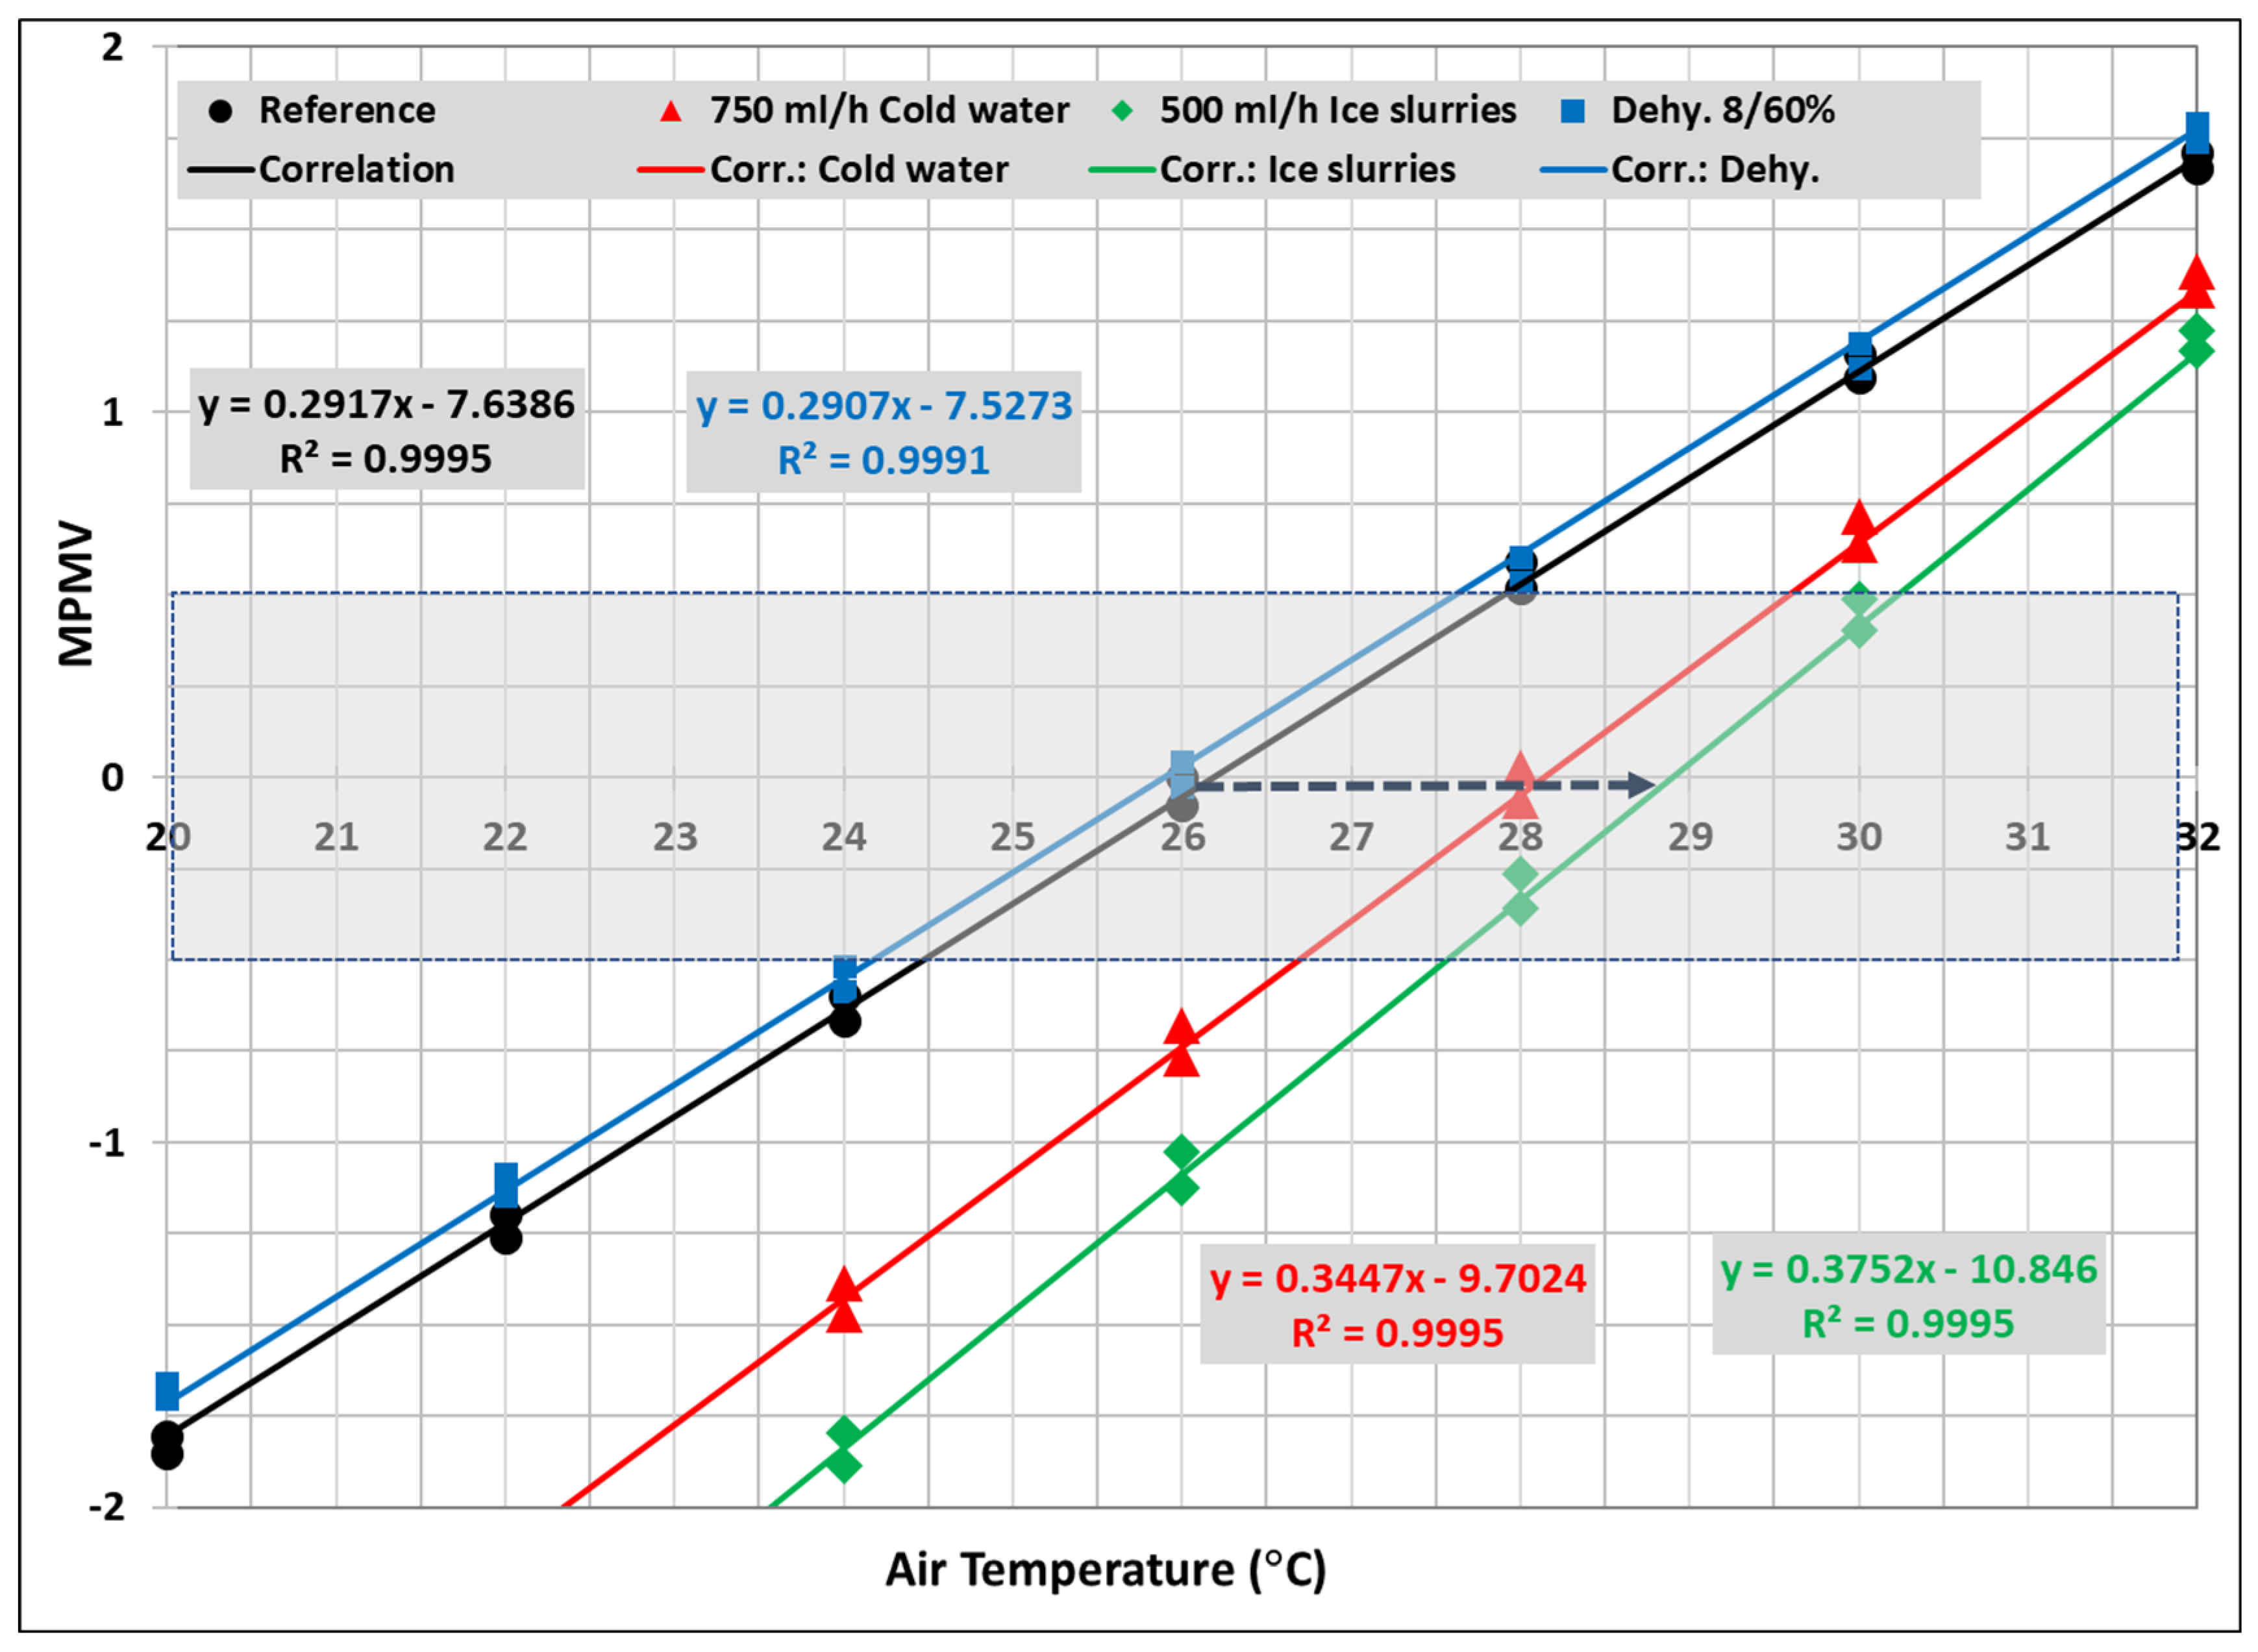
  • Effect of Qex. Heat removal from or addition to the body core affects the physiological response and therefore thermal sensation. Heat removal or addition by ingesting cold or hot drinks was reported as one of the effective adaptations means to reduce heat stress and thermal discomfort [22,44,56,83]. Figure 7 shows how thermal sensation of urban older residents is affected by ingesting cold water (750 mL/h at 5 °C, energy equivalent to −15 W/m2) and ice slurries (500 mL/h with ice packing factor of 70%, energy equivalent to −21 W/m2). Drinking cold water or ice slurries may increase the neutral comfort temperature by 2.1 to 2.9 °C and reduce thermal sensation by 0.5 to 1.1 units under indoor temperatures up to 32 °C. Similar results were observed in the experimental study by Wang et al. [84].
  • Body dehydration. Body dehydration (or hypohydration) occurs from prolonged exposure to hot conditions with inadequate replacement of body water loss by sweating. Dehydration reduces sweating rate [85] and therefore increases thermal discomfort. Figure 7 shows how body dehydration up to 8% of body weight, combined with a rehydration rate of 60%, reduces the neutral temperature by 0.3 °C but increases thermal sensation by 0.1. Although these changes seem minor, combination of body dehydration with other factors affecting sweating rates can significantly alter psychological responses.
  • Seasonal heat and cold acclimatization. Repeated or intermittent exposure to hot (summer) or cold (winter) indoor or outdoor temperatures over several days increases acclimatization, enabling subjects to tolerate warmer or cooler conditions [86,87]. However, it is difficult to report such information for every subject during the survey periods, which extend over a long period of time (weeks or months). Furthermore, it remains unclear whether individuals spending most of their time indoors can fully acclimatize to heat in summer.
  • Psychological factors. The design of thermal comfort questionnaires usually does not include factors related to subject psychology, such as mood state, stress, depression, etc., despite their potential impact on thermal perception [88].

Limitations

The following limitations of the study are noted:
  • The MPMV model was developed using a limited experimental dataset of high quality with known inputs, focusing on older people with average ages from 65 to 72 years (mean value 70 years) [66]. The model requires further improvement to address very old people (age > 70 years), who could have lower thermal sensitivity compared to younger older adults.
  • The MPMV model predictions are based on the assumed metabolic rate for a large population of older individuals (FE in Equation (5)), where the effect of age is noticeable. Caution should therefore be exercised in applying the results to individuals or smaller samples of older subjects.
  • Most of the collected field studies were carried out in different building types and climate zones in Asia, where comfort scale semantics were translated from English to local languages. Therefore, differences in climate, cultural background, and the interpretations of the translated comfort scale semantics could have affected thermal sensation data [89].

5. Conclusions

This paper validated the newly developed MPMV comfort model for older people using third-party (public) experimental data from studies conducted under controlled environments in climatic chambers, as well as monitored environments in field studies in various building types and climate zones worldwide. For information purposes, the study also included a comparison between the present model, the PMV model, the physiologically based model of Younes et al. for controlled indoor environments in buildings, and the adaptive model (aPMV) of Yao et al. for free-running buildings.
The MPMV model predictions demonstrated good agreement with the measured thermal sensation data in controlled environments of climate chambers, with an overall RMSE of 0.44. By comparison, the PMV model, the aPMV model, and the physiologically based model of Younes et al. produced less accurate results relative to the measured data, with RMSEs of 0.77, 0.61, and 0.86, respectively.
Similarly, the MPMV model reproduced field measurement data with a high degree of accuracy, with an RMSE of 0.52 in 71% of the cases in urban and rural buildings in various climate zones. The largest discrepancies in residences were observed during the winter season in cold climates and the summer in hot climates. These differences could be attributed to numerous unreported factors in field studies, such as the transient effects, misestimation of subject data (e.g., clothing insulation and metabolic rates), and seasonal adaptation of residents to local climates.
Similar to its predictions in climate chamber studies, the PMV model reproduced field measurement data with a better accuracy in 47% of the cases, with an RMSE of 0.7, but tended to overpredict thermal sensation in the discomfort range. The aPMV model reduced this PMV overprediction and produced better results in 71% of the cases, with an RMSE of 0.47, but failed to improve the PMV predictions in the other field studies.

Suggested Future Research

Thermal comfort studies conducted in real-world field settings need proper guidelines to standardize experimental processes to minimize the secondary effects of uncontrolled or unknown factors affecting the steady state thermal perception. These guidelines should build on those developed for climate chamber studies by Lei et al. [90] and incorporate additional considerations. For example, the guidelines should achieve the following: (1) include provisions to eliminate the transient effects by standardizing survey time periods and isolating personal environment and subject-specific conditions; (2) avoid the diurnal effects by separating the experimental data collected in the morning from the ones collected in the afternoons; (3) avoid collecting survey data around meal times (e.g., morning breakfast, lunch); and (4) gather additional information on factors such as subject dehydration and rehydration, food intake, acclimatization to heat or cold, psychological conditions, and any other relevant factors affecting thermal perception.
The study of thermal comfort of older people remains in its infancy and requires further investigations in both controlled and field environments. Future studies should cover a range of subject activity levels across various geographical locations, building types, and climate zones to enhance understanding of the thermal comfort requirements of this large segment of the population, improving model prediction accuracy.

Supplementary Materials

The following supporting information can be downloaded at https://www.mdpi.com/article/10.3390/en18061484/s1.

Author Contributions

Conceptualization, A.L. and M.S.; methodology, A.L.; formal analysis, A.L., Z.J. and M.S; data curation, M.S.; writing—original draft preparation, A.L. and M.S.; writing—review and editing, A.L., M.S. and Z.J.; supervision, A.L.; project administration, A.L.; funding acquisition, A.L. All authors have read and agreed to the published version of the manuscript.

Funding

This research was funded by Infrastructure Canada through the Climate Resilient Built Environment (CRBE) Initiative (NRC Project Number: A1-020366).

Data Availability Statement

The comfort data collected from public sources and used in this study are available through the supplied supplement. Other private data are available on request from the corresponding author. The data require permissions from the project clients and NRC for public use.

Conflicts of Interest

The authors declare no conflicts of interest.

Nomenclature

SymbolMeaning
aPMVAdaptive predicted mean vote from [12]
CSHAdjustment constant for non-shivering thermogenesis
CSWAdjustment constant for regulatory sweating
FbERatio of basal metabolic rate of older to young adults
FERatio of metabolic rate of older to young adults
IClIntrinsic insulation value of clothing (clo)
MPMVMetabolic-based predicted mean vote from [63]
MaMetabolic rate of activity of young adult (W/m2 or met)
MbEBasal metabolic rate of an older adult (W/m2 or met)
Mb,rBasal metabolic rate of a reference young adult (W/m2 or met)
MCMetabolic rate required to maintain a neutral comfort state (W/m2 or met)
MEMetabolic rate of an older adult (W/m2 or met)
MNMetabolic rate required to maintain a neutral comfort state at rest with no thermoregulatory controls (W/m2 or met)
PMVPredictive mean vote
PTSVPhysiologically based thermal sensation vote
QexHeat flux extracted from or added to the body core section (W/m2)
QexCHeat flux extracted from or added to the body core section at the neutral comfort state (W/m2)
RHRelative humidity (%)
RMSERoot mean square error
TSVThermal sensation vote
TaAir temperature (°C)
TcNNeutral core temperature at rest (°C)
TrMean radiant temperature (°C)
TskNNeutral mean skin temperature at rest (°C)
VaAbsolute air velocity around body (m/s)
WEMechanical work performed by older adults (W/m2)
ηCMechanical work efficiency related to Mc
ηNMechanical work efficiency related to MN
βSensitivity factor for MPMV (Equation (2))

References

  1. Xie, J.; Li, H.; Li, C.; Zhang, J.; Luo, M. Review on Occupant-Centric Thermal Comfort Sensing, Predicting, and Controlling. Energy Build. 2020, 226, 110392. [Google Scholar] [CrossRef]
  2. Zhou, S.; Li, B.; Du, C.; Liu, H.; Wu, Y.; Hodder, S.; Chen, M.; Kosonen, R.; Ming, R.; Ouyang, L.; et al. Opportunities and Challenges of Using Thermal Comfort Models for Building Design and Operation for the Elderly: A Literature Review. Renew. Sustain. Energy Rev. 2023, 183, 113504. [Google Scholar] [CrossRef]
  3. Jowkar, M.; de Dear, R.; Brusey, J. Influence of Long-Term Thermal History on Thermal Comfort and Preference. Energy Build. 2020, 210, 109685. [Google Scholar] [CrossRef]
  4. Childs, C.; Elliott, J.; Khatab, K.; Hampshaw, S.; Fowler-Davis, S.; Willmott, J.R.; Ali, A. Thermal Sensation in Older People with and without Dementia Living in Residential Care: New Assessment Approaches to Thermal Comfort Using Infrared Thermography. Int. J. Environ. Res. Public. Health 2020, 17, 6932. [Google Scholar] [CrossRef]
  5. Brager, G.S.; de Dear, R.J. Historical and Cultural Influences on Comfort Expectations. In Buildings, Culture and Environment; Wiley: Hoboken, NJ, USA, 2003; pp. 177–201. [Google Scholar]
  6. Sacher, G.A. Energy Metabolism and Thermoregulation in Old Age; No. CONF-790112-2; Argonne National Lab.: Lemont, IL, USA, 1979. [Google Scholar]
  7. Van Someren, E.J.W. Age-Related Changes in Thermoreception and Thermoregulation. In Handbook of the Biology of Aging; Elsevier: Amsterdam, The Netherlands, 2011; pp. 463–478. [Google Scholar]
  8. Zhou, H.; Yu, W.; Zhao, K.; Shan, H.; Zhou, S.; Wei, S.; Ouyang, L. Thermal Demand Characteristics of Elderly People with Varying Levels of Frailty in Residential Buildings during the Summer. J. Build. Eng. 2024, 84, 108654. [Google Scholar] [CrossRef]
  9. Yao, R.; Zhang, S.; Du, C.; Schweiker, M.; Hodder, S.; Olesen, B.W.; Toftum, J.; Romana d’Ambrosio, F.; Gebhardt, H.; Zhou, S.; et al. Evolution and Performance Analysis of Adaptive Thermal Comfort Models—A Comprehensive Literature Review. Build Environ. 2022, 217, 109020. [Google Scholar] [CrossRef]
  10. Tyler, C.J.; Reeve, T.; Sieh, N.; Cheung, S.S. Effects of Heat Adaptation on Physiology, Perception, and Exercise Performance in the Heat: An Updated Meta-Analysis. J. Sci. Sport Exerc. 2024, 6, 195–217. [Google Scholar] [CrossRef]
  11. Fanger, P.O. Thermal Comfort: Analysis and Applications in Environmental Engineering; Danish Technical Press: Vanloese, Denmark, 1970. [Google Scholar]
  12. ANSI/ASHRAE Standard 55-2023; Thermal Environmental Conditions for Human Occupancy. American Society of Heating Refrigerating and Air Conditioning Engineers: Atlanta, GA, USA, 2023.
  13. ISO 7730:2023; Ergonomics of the Thermal Environment—Analytical Determination and Interpretation of Thermal Comfort Using Calculation of the PMV and PPD Indices and Local Thermal Comfort Criteria. The International Organization for Standardization (ISO): Geneva, Switzerland, 2023.
  14. Cheung, T.; Schiavon, S.; Parkinson, T.; Li, P.; Brager, G. Analysis of the Accuracy on PMV—PPD Model Using the ASHRAE Global Thermal Comfort Database II. Build Environ. 2019, 153, 205–217. [Google Scholar] [CrossRef]
  15. Humphreys, M.A.; Fergus Nicol, J. The Validity of ISO-PMV for Predicting Comfort Votes in Every-Day Thermal Environments. Energy Build. 2002, 34, 667–684. [Google Scholar] [CrossRef]
  16. Bae, C.; Lee, H.; Chun, C. Predicting Indoor Thermal Sensation for the Elderly in Welfare Centres in Korea Using Local Skin Temperatures. Indoor Built Environ. 2017, 26, 1155–1167. [Google Scholar] [CrossRef]
  17. Tsuzuki, K.; Ohfuku, T. Thermal Sensation and Thermoregulation in Elderly Compared to Young People in Japanese Winter Season. In Proceedings of the Indoor Air Conference, Monterey, CA, USA, 30 June–5 July 2002. [Google Scholar]
  18. Schellen, L.; van Marken Lichtenbelt, W.; Loomans, M.G.L.C.; Frijns, A.; Toftum, J.; deWit, M. Thermal Comfort, Physiological Responses and Performance of Elderly during Exposure to a Moderate Temperature Drift. In Proceedings of the 9th International Conference and Exhibition on Healthy Buildings, Syracuse, NY, USA, 13–17 September 2009. [Google Scholar]
  19. Baquero, M.T.; Vergés, R.; Gaspar, K.; Forcada, N. A Field Investigation of the Thermal Comfort of Older Adults in Cold Winter Climates. Indoor Air 2023, 2023, 9185216. [Google Scholar] [CrossRef]
  20. Wu, Y.; Liu, H.; Li, B.; Kosonen, R.; Kong, D.; Zhou, S.; Yao, R. Thermal Adaptation of the Elderly during Summer in a Hot Humid Area: Psychological, Behavioral, and Physiological Responses. Energy Build. 2019, 203, 109450. [Google Scholar] [CrossRef]
  21. Tejedor, B.; Casals, M.; Gangolells, M.; Macarulla, M.; Forcada, N. Human Comfort Modelling for Elderly People by Infrared Thermography: Evaluating the Thermoregulation System Responses in an Indoor Environment during Winter. Build Environ. 2020, 186, 107354. [Google Scholar] [CrossRef]
  22. Shao, T.; Jin, H. A Field Investigation on the Winter Thermal Comfort of Residents in Rural Houses at Different Latitudes of Northeast Severe Cold Regions, China. J. Build. Eng. 2020, 328, 101476. [Google Scholar] [CrossRef]
  23. Tartarini, F.; Cooper, P.; Fleming, R. Thermal Perceptions, Preferences and Adaptive Behaviours of Occupants of Nursing Homes. Build Environ. 2018, 132, 57–69. [Google Scholar] [CrossRef]
  24. Li, H.; Hu, H.; Wu, Z.; Kong, X.; Fan, M. Modified Predicted Mean Vote Models for Human Thermal Comfort: An ASHRAE Database-Based Evaluation. Renew. Sustain. Energy Rev. 2025, 209, 115042. [Google Scholar] [CrossRef]
  25. Fanger, P.O.; Toftum, J. Extension of the PMV Model to Non-Air-Conditioned Buildings in Warm Climates. Energy Build. 2002, 34, 533–536. [Google Scholar] [CrossRef]
  26. Yao, R.; Li, B.; Liu, J. A Theoretical Adaptive Model of Thermal Comfort—Adaptive Predicted Mean Vote (APMV). Build Environ. 2009, 44, 2089–2096. [Google Scholar] [CrossRef]
  27. Lamberti, G.; Contrada, F.; Kindinis, A.; Leccese, F.; Salvadori, G. Developing a New Adaptive Heat Balance Model to Enhance Thermal Comfort Predictions and Reduce Energy Consumption. Energy Build. 2024, 321, 114663. [Google Scholar] [CrossRef]
  28. Schweiker, M.; Wagner, A. A Framework for an Adaptive Thermal Heat Balance Model (ATHB). Build Environ. 2015, 94, 252–262. [Google Scholar] [CrossRef]
  29. de Dear, R.; Xiong, J.; Kim, J.; Cao, B. A Review of Adaptive Thermal Comfort Research since 1998. Energy Build. 2020, 214, 109893. [Google Scholar] [CrossRef]
  30. GB/T 50785-2012; Evaluation Standard for Indoor Thermal Environment in Civil Buildings. Ministry of Housing and Urban-Rural Development (MOHURD) and the General Administration of Quality Supervision, Inspection and Quarantine (GAQSIQ) of the People’s Republic of China: Beijing, China, 2012; Chinese Standard.
  31. Younes, J.; Chen, M.; Ghali, K.; Kosonen, R.; Melikov, A.K.; Ghaddar, N. A Thermal Sensation Model for Elderly under Steady and Transient Uniform Conditions. Build Environ. 2023, 227, 109797. [Google Scholar] [CrossRef]
  32. Rida, M.; Ghaddar, N.; Ghali, K.; Hoballah, J. Elderly Bioheat Modeling: Changes in Physiology, Thermoregulation, and Blood Flow Circulation. Int. J. Biometeorol. 2014, 58, 1825–1843. [Google Scholar] [CrossRef]
  33. EN15251:2006; Indoor Environmental Input Parameters for Design and Assessment of Energy Performance of Buildings Addressing Indoor Air Quality, Thermal Environment, Lighting and Acoustics. CEN: Brussels, Belgium, 2006.
  34. Soebarto, V.; Zhang, H.; Schiavon, S. A Thermal Comfort Environmental Chamber Study of Older and Younger People. Build Environ. 2019, 155, 1–14. [Google Scholar] [CrossRef]
  35. Zhou, S.; Li, B.; Du, C.; Yao, R.; Ouyang, L.; Zhou, H.; Kosonen, R.; Melikov, A.K.; Shang, L.; Liu, H. Developing Thermal Prediction Models for the Elderly under Temperature Step Changes. Build Environ. 2023, 245, 110902. [Google Scholar] [CrossRef]
  36. Wang, Z.; Yu, H.; Jiao, Y.; Chu, X.; Luo, M. Chinese Older People’s Subjective and Physiological Responses to Moderate Cold and Warm Temperature Steps. Build Environ. 2019, 149, 526–536. [Google Scholar] [CrossRef]
  37. Schellen, L.; van Marken Lichtenbelt, W.D.; Loomans, M.G.L.C.; Toftum, J.; de Wit, M.H. Differences between Young Adults and Elderly in Thermal Comfort, Productivity, and Thermal Physiology in Response to a Moderate Temperature Drift and a Steady-State Condition. Indoor Air 2010, 20, 273–283. [Google Scholar] [CrossRef]
  38. Panraluk, C.; Sreshthaputra, A. Developing Guidelines for Thermal Comfort and Energy Saving during Hot Season of Multipurpose Senior Centers in Thailand. Sustainability 2020, 12, 170. [Google Scholar] [CrossRef]
  39. Xiong, J.; Ma, T.; Lian, Z.; de Dear, R. Perceptual and Physiological Responses of Elderly Subjects to Moderate Temperatures. Build Environ. 2019, 156, 117–122. [Google Scholar] [CrossRef]
  40. Stapleton, J.M.; Larose, J.; Simpson, C.; Flouris, A.D.; Sigal, R.J.; Kenny, G.P. Do Older Adults Experience Greater Thermal Strain during Heat Waves? Appl. Physiol. Nutr. Metab. 2014, 39, 292–298. [Google Scholar] [CrossRef]
  41. Chen, M.; Farahani, A.V.; Kilpeläinen, S.; Kosonen, R.; Younes, J.; Ghaddar, N.; Ghali, K.; Melikov, A.K. Thermal Comfort Chamber Study of Nordic Elderly People with Local Cooling Devices in Warm Conditions. Build Environ. 2023, 235, 110213. [Google Scholar] [CrossRef]
  42. Fan, G.; Xie, J.; Yoshino, H.; Yanagi, U.; Hasegawa, K.; Wang, C.; Zhang, X.; Liu, J. Investigation of Indoor Thermal Environment in the Homes with Elderly People during Heating Season in Beijing, China. Build Environ. 2017, 126, 288–303. [Google Scholar] [CrossRef]
  43. Neira-Zambrano, K.; Trebilcock-Kelly, M.; Briede-Westermeyer, J.C. Older Adults’ Thermal Comfort in Nursing Homes: Exploratory Research in Three Case Studies. Sustainability 2023, 15, 3002. [Google Scholar] [CrossRef]
  44. Sudarsanam, N.; Kannamma, D. Investigation of Summertime Thermal Comfort at the Residences of Elderly People in the Warm and Humid Climate of India. Energy Build. 2023, 291, 113151. [Google Scholar] [CrossRef]
  45. Hwang, R.L.; Chen, C.P. Field Study on Behaviors and Adaptation of Elderly People and Their Thermal Comfort Requirements in Residential Environments. Indoor Air 2010, 20, 235–245. [Google Scholar] [CrossRef]
  46. Miao, Y.; Chau, K.W.; Lau, S.S.Y.; Ye, T. A Novel Thermal Comfort Model Modified by Time Scale and Habitual Trajectory. Renew. Sustain. Energy Rev. 2025, 207, 114903. [Google Scholar] [CrossRef]
  47. Zheng, G.; Wei, C.; Li, K. Determining the Summer Indoor Design Parameters for Pensioners’ Buildings Based on the Thermal Requirements of Elderly People at Different Ages. Energy 2022, 258, 124854. [Google Scholar] [CrossRef]
  48. Sudprasert, S. Study of Thermal Comfort and the Adaptive Behaviors of the Elderly in Naturally Ventilated Houses. Int. J. Build. Urban Inter. Landsc. Technol. 2020, 16, 73–82. [Google Scholar] [CrossRef]
  49. Zhang, J.; Lu, J.; Deng, W.; Beccarelli, P.; Lun, I.Y.F. Thermal Comfort Investigation of Rural Houses in China: A Review. Build. Environ. 2023, 235, 110208. [Google Scholar] [CrossRef]
  50. Ji, T.; Zhang, T.; Fukuda, H. Thermal Comfort Research on the Rural Elderly in the Guanzhong Region: A Comparative Analysis Based on Age Stratification of Residential Environments. Sustainability 2024, 16, 6101. [Google Scholar] [CrossRef]
  51. Feng, R.; Zheng, W.; Wang, Y.; Shao, T.; Wang, X.; Zhang, J.; Fang, Y.; Dong, C. Thermal Responses of the Elderly in Naturally Ventilated Dwelling Houses during Winter in Rural Xi’an, China. In Proceedings of the E3S Web of Conferences, EDP Sciences, Izmir, Turkey, 9 July 2024; Volume 546. [Google Scholar]
  52. Zhang, T.; Duan, Y.; Jiao, Z.; Ye, X.; Hu, Q.; Fukuda, H.; Gao, W. Towards Improving Rural Living Environment for Chinese Cold Region Based on Investigation of Thermal Environment and Space Usage Status. Buildings 2022, 12, 2139. [Google Scholar] [CrossRef]
  53. Li, H.; Xu, G.; Chen, J.; Duan, J. Investigating the Adaptive Thermal Comfort of the Elderly in Rural Mutual Aid Homes in Central Inner Mongolia. Sustainability 2022, 14, 6802. [Google Scholar] [CrossRef]
  54. Zheng, W.; Feng, R.; Wang, Y.; Shao, T.; Chow, D.; Zhang, L. Fundamental Research on Sustainable Building Design for the Rural Elderly: A Field Study of Various Subjective Responses to Thermal Environments and Comfort Demands during Summer in Xi’an, China. Sustainability 2024, 16, 7778. [Google Scholar] [CrossRef]
  55. Tang, H.; Gao, Y.; Tan, S.; Guo, Y.; Gao, W. Field Investigation on Adaptive Thermal Comfort in Rural Dwellings: A Case Study in Linyi (China) during Summer. Buildings 2024, 14, 1429. [Google Scholar] [CrossRef]
  56. Zhang, J.; Lu, J.; Deng, W.; Beccarelli, P.; Lun, I.Y.F. Investigation of Thermal Comfort and Preferred Temperatures among Rural Elderly in Weihai, China: Considering Metabolic Rate Effects. J. Build. Eng. 2024, 97, 110940. [Google Scholar] [CrossRef]
  57. Tao, Y.; Gou, Z.; Yu, Z.; Fu, J.; Chen, X. The Challenge of Creating Age-Friendly Indoor Environments in a High-Density City: Case Study of Hong Kong’s Care and Attention Homes. J. Build. Eng. 2020, 30, 101280. [Google Scholar] [CrossRef]
  58. Tartarini, F.; Cooper, P.; Fleming, R. Thermal Environment and Thermal Sensations of Occupants of Nursing Homes: A Field Study. Procedia Eng. 2017, 180, 373–382. [Google Scholar] [CrossRef]
  59. Baquero, M.T.; Forcada, N. Thermal Comfort of Older People during Summer in the Continental Mediterranean Climate. J. Build. Eng. 2022, 54, 104680. [Google Scholar] [CrossRef]
  60. Forcada, N.; Gangolells, M.; Casals, M.; Tejedor, B.; Macarulla, M.; Gaspar, K. Summer Thermal Comfort in Nursing Homes in the Mediterranean Climate. Energy Build. 2020, 229, 110442. [Google Scholar] [CrossRef]
  61. Forcada, N.; Gangolells, M.; Casals, M.; Tejedor, B.; Macarulla, M.; Gaspar, K. Field Study on Thermal Comfort in Nursing Homes in Heated Environments. Energy Build. 2021, 244, 111032. [Google Scholar] [CrossRef]
  62. Wang, Z.; Yu, H.; Jiao, Y.; Wei, Q.; Chu, X. A Field Study of Thermal Sensation and Neutrality in Free-Running Aged-Care Homes in Shanghai. Energy Build. 2018, 158, 1523–1532. [Google Scholar] [CrossRef]
  63. Sun, N.; Ding, X.; Bi, J.; Cui, Y. Field Study on Winter Thermal Comfort of Occupants of Nursing Homes in Shandong Province, China. Buildings 2024, 14, 2881. [Google Scholar] [CrossRef]
  64. Zheng, W.; Shao, T.; Lin, Y.; Wang, Y.; Dong, C.; Liu, J. A Field Study on Seasonal Adaptive Thermal Comfort of the Elderly in Nursing Homes in Xi’an, China. Build Environ. 2022, 208, 108623. [Google Scholar] [CrossRef]
  65. Laouadi, A. Physiological Indicators of Thermal Comfort: A Comprehensive Approach Using the Metabolic-Based Predicted Mean Vote Index. Buildings 2024, 14, 3861. [Google Scholar] [CrossRef]
  66. Laouadi, A. A New General Formulation for the PMV Thermal Comfort Index. Buildings 2022, 12, 1572. [Google Scholar] [CrossRef]
  67. Melzer, K.; Laurie Karsegard, V.; Genton, L.; Kossovsky, M.P.; Kayser, B.; Pichard, C. Comparison of Equations for Estimating Resting Metabolic Rate in Healthy Subjects over 70 Years of Age. Clin. Nutr. 2007, 26, 498–505. [Google Scholar] [CrossRef]
  68. Aslan, D.H.; Collette, J.M.; Ortega, J.D. Bicycling Exercise Helps Maintain a Youthful Metabolic Cost of Walking in Older Adults. J. Aging Phys. Act. 2021, 29, 36–42. [Google Scholar] [CrossRef]
  69. Nishimura, T.; Motoi, M.; Egashira, Y.; Choi, D.; Aoyagi, K.; Watanuki, S. Seasonal Variation of Non-Shivering Thermogenesis (NST) during Mild Cold Exposure. J. Physiol. Anthr. 2015, 34, 11. [Google Scholar] [CrossRef]
  70. Wu, Y.; Liu, H.; Chen, B.; Li, B.; Kosonen, R.; Jokisalo, J.; Chen, T. Effect of Long-Term Thermal History on Physiological Acclimatization and Prediction of Thermal Sensation in Typical Winter Conditions. Build Environ. 2020, 179, 106936. [Google Scholar] [CrossRef]
  71. Chinevere, T.D.; Kenefick, R.W.; Cheuvront, S.N.; Lukaski, H.C.; Sawka, M.N. Effect of Heat Acclimation on Sweat Minerals. Med. Sci. Sports Exerc. 2008, 40, 886–891. [Google Scholar] [CrossRef]
  72. Jin, Y.; Wang, F.; Payne, S.R.; Weller, R.B. A Comparison of the Effect of Indoor Thermal and Humidity Condition on Young and Older Adults’ Comfort and Skin Condition in Winter. Indoor Built Environ. 2022, 31, 759–776. [Google Scholar] [CrossRef]
  73. Zhou, H.; Yu, W.; Zhao, K.; Shan, H.; Zhou, S.; Zhang, Y.; Wang, H.; Wei, S. Adaptative Thermal Comfort Analysis in the Elderly Based on Fried Frailty Classification in Residential Buildings during Summer. Build Environ. 2024, 252, 111262. [Google Scholar] [CrossRef]
  74. Ji, L.; Laouadi, A.; Wang, L.; Lacasse, M.A. Development of a Bioheat Model for Older People under Hot and Cold Exposures. Build. Simul. 2022, 15, 1815–1829. [Google Scholar] [CrossRef]
  75. ISO 9920:2007; Ergonomics of the Thermal Environment—Estimation of Thermal Insulation and Water Vapour Resistance of a Clothing Ensemble. The International Organization for Standardization (ISO): Geneva, Switzerland, 2007.
  76. Tang, Y.; Su, Z.; Yu, H.; Zhang, K.; Li, C.; Ye, H. A Database of Clothing Overall and Local Insulation and Prediction Models for Estimating Ensembles’ Insulation. Build Environ. 2022, 207, 108418. [Google Scholar] [CrossRef]
  77. Hall, K.S.; Morey, M.C.; Dutta, C.; Manini, T.M.; Weltman, A.L.; Nelson, M.E.; Morgan, A.L.; Senior, J.G.; Seyffarth, C.; Buchner, D.M. Activity-Related Energy Expenditure in Older Adults. Med. Sci. Sports Exerc. 2014, 46, 2335–2340. [Google Scholar] [CrossRef]
  78. Ainsworth, B.E.; Haskell, W.L.; Whitt, M.C.; Irwin, M.L.; Swartz, A.M.; Strath, S.J.; O’Brien, W.L.; Bassett, D.R., Jr.; Schmitz, K.H.; Emplaincourt, P.O.; et al. Compendium of Physical Activities: An Update of Activity Codes and MET Intensities. Med. Sci. Sports Exerc. 2000, 32, S498–S516. [Google Scholar] [CrossRef]
  79. Kenny, G.P.; Webb, P.; Ducharme, M.B.; Reardon, F.D.; Jay, O. Calorimetric Measurement of Postexercise Net Heat Loss and Residual Body Heat Storage. Med. Sci. Sports Exerc. 2008, 40, 1629–1636. [Google Scholar] [CrossRef]
  80. Bo, S.; Fadda, M.; Fedele, D.; Pellegrini, M.; Ghigo, E.; Pellegrini, N. A Critical Review on the Role of Food and Nutrition in the Energy Balance. Nutrients 2020, 12, 1161. [Google Scholar] [CrossRef]
  81. Boschmann, M.; Steiniger, J.; Hille, U.; Tank, J.; Adams, F.; Sharma, A.M.; Klaus, S.; Luft, F.C.; Jordan, J. Water-Induced Thermogenesis. J. Clin. Endocrinol. Metab. 2003, 88, 6015–6019. [Google Scholar] [CrossRef]
  82. Dubnov-Raz, G.; Constantini, N.W.; Yariv, H.; Nice, S.; Shapira, N. Influence of Water Drinking on Resting Energy Expenditure in Overweight Children. Int. J. Obes. 2011, 35, 1295–1300. [Google Scholar] [CrossRef]
  83. Wang, Z.; Cao, B.; Lin, B.; Zhu, Y. Investigation of Thermal Comfort and Behavioral Adjustments of Older People in Residential Environments in Beijing. Energy Build. 2020, 217, 110001. [Google Scholar] [CrossRef]
  84. Wang, F.; Tang, Y.; Ke, Y.; Zheng, Q.; Lei, T.-H. Ice Slurry Ingestion for Enhanced Occupant Thermal Comfort in Warm/Hot Indoor Environments: A Comparative Study with an Energy-Efficient Desk Fan. Build Environ. 2024, 253, 111350. [Google Scholar] [CrossRef]
  85. Montain, S.J.; Latzka, W.A.; Sawka, M.N. Control of Thermoregulatory Sweating Is Altered by Hydration Level and Exercise Intensity. J. Appl. Physiol. 1995, 79, 1434–1439. [Google Scholar] [CrossRef]
  86. Notley, S.R.; Meade, R.D.; Akerman, A.P.; Poirier, M.P.; Boulay, P.; Sigal, R.J.; Flouris, A.D.; Kenny, G.P. Evidence for Age-related Differences in Heat Acclimatisation Responsiveness. Exp. Physiol. 2020, 105, 1491–1499. [Google Scholar] [CrossRef] [PubMed]
  87. Castellani, J.W.; Young, A.J. Human Physiological Responses to Cold Exposure: Acute Responses and Acclimatization to Prolonged Exposure. Auton. Neurosci. 2016, 196, 63–74. [Google Scholar] [CrossRef]
  88. Furkan Özbey, M.; Turhan, C. Investigating the Relationship Between Thermal Comfort and Human Psychology: A Review. J. Build. Des. Environ. 2024, 3, 35255. [Google Scholar] [CrossRef]
  89. Schweiker, M.; André, M.; Al-Atrash, F.; Al-Khatri, H.; Alprianti, R.R.; Alsaad, H.; Amin, R.; Ampatzi, E.; Arsano, A.Y.; Azar, E.; et al. Evaluating Assumptions of Scales for Subjective Assessment of Thermal Environments—Do Laypersons Perceive Them the Way, We Researchers Believe? Energy Build. 2020, 211, 109761. [Google Scholar] [CrossRef]
  90. Lei, T.-H.; Lan, L.; Wang, F. Indoor Thermal Comfort Research Using Human Participants: Guidelines and a Checklist for Experimental Design. J. Therm. Biol. 2023, 113, 103506. [Google Scholar] [CrossRef]
Figure 1. Comparison between the measured mean thermal sensation votes (TSVs) in climate chambers with predictions by the models of the MPMV, PMV, aPMV, and PTSV [17,20,34,35,36,37,38,39,40,41].
Energies 18 01484 g001aEnergies 18 01484 g001b
Figure 2. Comparison between the field-measured thermal sensation votes (TSVs) with predictions by the models of MPMV, PMV, and aPMV grouped by the prediction accuracy. Note that prediction values outside the sensation scale (−3 to +3) are truncated [16,19,20,44,45,46,47,48,51,53,54,55,56,57,60,61,62,63,64,72,73].
Energies 18 01484 g002aEnergies 18 01484 g002b
Figure 3. Comparison between the field-measured thermal sensation votes (TSVs) with the MPMV model predictions, grouped by building types [16,19,20,44,45,46,47,48,51,53,54,55,56,57,60,61,62,63,64,72,73].
Energies 18 01484 g003aEnergies 18 01484 g003b
Figure 4. Typical profiles of summer thermal sensation of young and older people versus air temperature for urban residences and care homes (RH = 60%, Va ≤ 0.2 m/s). Note the shaded area represents the neutral comfort zone (within ±0.5).
Energies 18 01484 g004
Figure 5. Typical profiles of winter thermal sensation of young and older people versus air temperature for urban residences and care homes (RH = 40%, Va ≤ 0.2 m/s).
Energies 18 01484 g005
Figure 6. Typical profiles of summer and winter thermal sensation of young and older people versus air temperature for rural residences (Summer: RH = 60%, Va = 0.3. Winter: RH = 40%, Va = 0.2).
Energies 18 01484 g006
Figure 7. Effects of cold drinks and body dehydration on thermal sensation of older occupants of urban residences (Ma = 1.2 met, Tr = Ta, RH = 40%, Va ≤ 0.2). The arrow line indicates the increase in the comfort air temperature due to cold drink ingestion. The shaded area indicates the neutral comfort zone (within ±0.5).
Energies 18 01484 g007
Table 1. Selected climate chamber studies.
StudyNumber of
Subjects
Mean Age (y)Ta (°C)Tr (°C)RH (%)Va (m/s)Icl (clo)Ma (met)ME (met)
[17]10972.4 23–31Ta600.20.6310.7
[37]87021.5–24NA ***400.211.2NA **
[38]33 *65.8521–2918.5-31.545, 60, 740.1, 0.51, 1.510.511.15NA
[39]167021–31Ta49–690.10.551 NA
[34]2269.7420, 25Ta400.10.72, 1.061.2 NA
[36]1867.421–32NA580.150.51 NA
[41]2670.826–33NA38–620.10.51 NA
[35]2466.625–34NA50, 600.10.341 NA
[40]126536.5NA20, 600.250.11 0.95
[20]86518, 34NA50 0.1 0.51NA
* Subjects are assumed acclimatized to heat (CSW = 1.5). ** NA means the data was not available or measured. *** Tr was assumed equal to Ta if not available or measured.
Table 2. Inputs (average values or ranges) of the selected field studies.
StudyBuildingNumber of
Subjects
SeasonAge (y)Ta (°C)Tr (°C)RH (%)Va
(m/s)
Icl (clo) Ma (met)
[56]Rural residences11Winter, spring, summer, fall716–34NA *60–710.20.23–2.251.2
[72]Urban care homes11Spring7720–28NA31–350.050.9, 1.61.2
[45]Urban residences87Winter, summer7113.3–32.5NA67.50.10.3–1.41
[62]Urban care homes342, 330, 368Winter, summer, mid-season846–33NA50–650–0.20.42–1.531.2
[16]Urban care homes294Winter, and fall7520–28NA63.30.10.71.2
[64]Urban care homes81, 76, 56Winter, summer, and mid-season70–7410–36NA39–560–0.20.33–1.561.2
[57]Urban care homes213, 181Winter, summer7921–27NA60, 650.1–0.40.7, 11.2
[19]Urban care homes49Winter7522–26NA20–460.10.8–1.41.2
[44]Urban residences740Summer *6928–34NA601.50.44, 0.821.1
[73]Urban residences394Summer7324.7–33.625-33.756.60.1–0.70.2–0.441.2
[63]Urban care homes728Winter7816.6–25NA280.11–1.461.2
[55]Rural residences97Summer **70 ***27–34NA600.3 0.391.2
[48]Urban residences30Summer6729–35NA50 0.20.331.2
[51]Rural residences161Winter695–16NA53.40–0.451.4–1.61.2
[47]Urban residences29Summer67, 81, 9221–40NA62.80.10.461.2
[46]Urban residences15Summer7223–32NA74.20.020.521.2
[61]Urban care homes737Winter8721–25NA47.20.220.92 1.15
[60]Urban care homes476Summer8523–28NA61.80.060.57–0.621.18
[54]Rural residences230Summer6923–37NA27–840.20.4–0.541.29
[20]Urban care homes and residences119,
333
Summer7722–36NA66.20.130.3–0.361.2
[53]Rural residences187Winter65, 70, 8715–24NA39.820.021.24–1.51.2
* NA means not available or measured. In this case, Tr was assumed equal to Ta. ** Subjects are assumed acclimatized to heat (CSW = 1.5). *** Age is not given and is thus assumed equal to the reference older person.
Table 3. Seasonal neutral air temperatures Tn (°C) and neutral comfort range for older people in various building types. Note data between () are for young adults if different from the older adults.
Building Type → Urban Care HomesUrban ResidencesRural Residences
Season SummerWinterSummerWinterSummerWinter
Tr = Ta
RH = 60%
Va ≤ 0.2 m/s
Icl = 0.6 (0.5) clo
Ma = 1.2 (1.5) met
Tr = Ta
RH = 40%
Va ≤ 0.2 m/s
Icl = 1 clo
Ma = 1.2 (1.5) met
Tr = Ta
RH = 60%
Va ≤ 0.2 m/s
Icl = 0.5 clo
Ma = 1.2 met
Tr = Ta
RH = 40%
Va ≤ 0.2 m/s
Icl = 1 clo
Ma = 1.2 met
Tr = Ta
RH = 60%
Va = 0.3 m/s
Icl = 0.4 clo
Ma = 1.2 met
Tr = Ta
RH = 40%
Va = 0.2 m/s
Icl = 1.5 clo
Ma = 1.2 met
This study (Tn and range)25.6 (23)24 (19.5)26.2 (24.8)24 (22)27.2 (26)21.5 (19)
23.8–27.4
(21–25)
21.6–26.3
(16.8–22.2)
24.5–27.9
(23–26.6)
21.6–26.3
(19.6–24.5)
25.7–28.7
(24.5–27.6)
18.6–24.5
(16–22.2)
Field
studies
25.4 [62]
24.1 [64]
25.7 [57]
25.3 (23.9) [60]
25.0 [20]
16.6 [62]
24.1 [16]
19.3 [64]
23.7 [57]
26.7 [19]
22.0 (20.7) [63] 21.6 (21.9) [61]
25.2 [45]
26.5 [73]
29.6 [44]
29.0 [48]
26.8 [47]
25.5 [46]
22.2 [20]
25.8, 26.9, 27.9 [8]
23.2 [45]28.1 [56]
27.4 (27.2) [55]
24.0 [54]
14.8 [56]
11.2 [51]
20.2 [53]
Disclaimer/Publisher’s Note: The statements, opinions and data contained in all publications are solely those of the individual author(s) and contributor(s) and not of MDPI and/or the editor(s). MDPI and/or the editor(s) disclaim responsibility for any injury to people or property resulting from any ideas, methods, instructions or products referred to in the content.

