Abstract
Phasor measurement units (PMUs) are being installed at an unprecedented rate on power systems, offering unique situation awareness capability. This paper presents a graph learning-based method for detecting and locating anomalies using PMU data. In this method, the graph learning technique is used to characterize the spatiotemporal relationship of distributed PMU data by constructing a spatiotemporal graph. Then, graph analysis is used to detect and locate anomalies by evaluating the global connectivity of spatiotemporal graphs at different times and the local connectivity of nodes in the relevant spatiotemporal graphs. The proposed method was verified using the IEEE-39 bus system and realistic PMU data. The method accurately identifies anomalies with an accuracy of 97% with a precision and recall of 80% and 100%, respectively. The results show the superiority and robustness of the proposed method as a powerful tool for detecting and locating anomalies using PMU data.
1. Introduction
The recent advancements in sensor technology and the availability of many sensors have unprecedentedly increased the situational awareness of power systems [1]. In particular, the phasor measurement unit (PMU) has been beneficial in capturing the rapidly changing power systems states in real time with high data rates. The PMU device collects time-synchronized phasor, frequency, and rate of change in frequency estimates measured at different spatial locations, which are then communicated to the phasor data collector [2]. Data reporting rates are typically 30 to 60 records per second and may be higher. In contrast, current supervisory control and data acquisition (SCADA) systems often report data every four to six seconds—over a hundred times slower than PMUs [3]. Hence, these high-resolution data are vital to assessing the health of the power system and can provide insights not provided by the supervisory control and data acquisition (SCADA) data. The installation of phasor measurement units (PMUs) is rapidly expanding across the United States, leading to a significant increase in the volume of the collected synchrophasor measurement data [4,5]. As a result, detecting and locating anomalies by identifying unusual samples or data streams inconsistent with the rest of the PMU data can be particularly challenging. For system-level anomaly detection and localization, the availability of real-time, spatially distributed system operation data of high accuracy is vital, leading to enhancement in situational awareness, early detection of faults and abnormalities in the power system, and improvement in the power system resilience.
By leveraging these PMU data, anomaly detection and localization become important as the anomalies in various data could be transformed into important actionable information across multiple application domains [6]. The complexity of modeling the spatial and temporal dependencies within the PMU data for anomaly detection and localization in high-resolution PMU data can be a challenging task. Additionally, many electric utilities do not provide spatial information on the PMUs, further complicating the anomaly detection and localization process. From a data structure perspective, spatial (location) and temporal (time) correlations must be considered when analyzing the system states that the PMUs provide. This raises several open questions like what the spatiotemporal relationships within the data are, how can these spatiotemporal relationships be quantified or measured to detect and locate anomalies, and what is the relationship between spatiotemporal correlations and the anomaly detected at different substations with different voltage levels. Traditional model-based methods face challenges in modeling such complex systems, making it difficult to address these questions effectively with high accuracy [7].
Recent works have focused primarily on statistical, physics-based, or data-driven anomaly detection and localization approaches. However, specific distributional assumptions often limit these methods, requiring predefined thresholds and topological information to effectively distinguish anomalies from normal operational conditions [8,9,10,11,12]. Furthermore, these methods rely largely on labeled datasets for anomaly detection tasks. In [8], the authors proposed an ensemble learning algorithm combining three unsupervised methods, namely Isolation Forest, Kmeans, and Local outlier probability (LoOP) for anomaly detection and classification. The authors in [9] utilized realistic synchrophasor data along with the topology and component location information for event detection, classification, and location by combining statistic, clustering, and Maximum Likelihood Criterion (MLE)-based anomaly detection, density-based spatial clustering of applications with noise (DBSCAN) for event detection and physics-based rule for event classification. A study in [10] proposed a hierarchical architecture for monitoring the grid and establishing a set of rules that are proposed for the analysis and fusion of microphasor measurement unit (μPMU) sensor measurements. In [11], the authors proposed a data-driven event detection method, namely the Hidden Structure Semi-Supervised Machine (HS3M), for the purpose of event type identification by incorporating information from partly labeled data and unlabeled data and conducting multiple kernel clustering to increase detection performance. In [12], statistical and clustering-based anomaly detectors were proposed and validated using the real event datasets from distribution PMUs connected with the simulated Bronzeville Community Microgrid (BCM) network. In [13], a graph learning-based method was proposed for anomaly detection by using individual PMU data in the temporal domain. Analyzing the spatiotemporal relationship between PMU data is crucial for detecting anomalies [14]. However, these existing methods do not consider the spatiotemporal interdependence across distributed PMU data since they assume that independent data samples of the measurement devices, which may not be valid in realistic power systems.
To consider spatiotemporal interdependence across multiple PMUs, we propose a method for detecting and locating anomalies using PMU-based spatiotemporal analysis based on graph learning. The major contributions of this paper can be summarized as follows:
- A graph learning algorithm is used to capture the spatiotemporal relationship of streaming PMU data via spatiotemporal graphs.
- Graph-based metrics are proposed for anomaly detection and localization via spatiotemporal graph analysis from two levels: from the global level, the global connectivity of spatiotemporal graphs is evaluated for detecting whether there exists an anomaly in a power system; from the local level, the local connectivity of nodes in the relevant spatiotemporal graph is evaluated for anomaly localization.
- A spatiotemporal, graph-based framework is proposed for efficiently detecting and locating anomaly by considering spatiotemporal interdependence across multiple PMUs to support the decision-making of grid operators.
2. Materials and Methods
This paper presents a method for detecting and locating anomalies by leveraging graph learning to analyze the spatiotemporal relationship of distributed phasor measurement unit (PMU) data. As illustrated in Figure 1, the spatiotemporal graph of distributed PMU data will be generated by graph learning technique to reflect the underlying spatiotemporal relationship in a power system. Then, the global connectivity of different spatiotemporal graphs will be compared to identify the relevant spatiotemporal graph and detect the anomalies in the power system. Next, the locations of these anomalies are further identified by comparing the local connectivity of nodes in the relevant spatiotemporal graph.
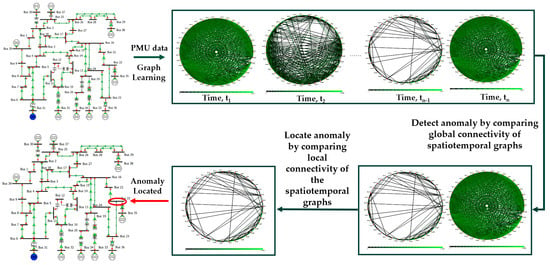
Figure 1.
Illustration of the proposed method.
2.1. Graph Learning
Emerging graph learning techniques enable effective anomaly detection and localization in high-resolution streaming PMU data. Here, graph learning is used to construct the spatiotemporal graph to characterize the spatiotemporal correlation of the voltage data from PMUs. It is assumed that each bus in a power system is equipped with a PMU, voltage magnitude at each bus can be obtained at a given time. We will use distributed PMU data and the graph learning technique to generate a weighted graph that can characterize the similarity in voltage between each pair of buses in a power system at a given time instant. In this weighted graph, each node represents a bus, and the weight on the edge connecting a pair of buses represents how similar it is between a pair of buses in terms of their voltages. That is, a pair of buses have similar voltages if they are close to each other; otherwise, they have different voltages. The similarity is the correlation of voltage data. To this end, graph learning is used to estimate the generalized graph Laplacian matrix from PMU data. The following optimization problem can be formulated by minimizing the Lagrangian function for the PMU data, i.e., solving the parameters of a multivariate Gaussian model that best approximates the data. A set of Lagrange multipliers and a Lagrangian function to achieve optimality conditions can be represented [15]:
subject to
where K = S + H, S is the data statistics obtained from the signal data, H is the regularization matrix, M is the matrix of Lagrange multipliers associated with the constraints, logdet(·) means the natural logarithm of a determinant, Tr (·) is the trace operator, and A is the connectivity matrix. The rows/columns of and its inverse = are updated repeatedly until convergence is achieved by using the matrix inversion lemma as follows:
where P is the permutation matrix used to arrange updated and fixed elements in block partitions. The submatrix represents the unchanged elements, while vector and scalar (i.e., = ) are the u-th row/columns of , representing the updated elements, and is solved from partitions of updated as follows:
To update the diagonal elements of , a scalar value v is added to the , and C is updated as follows:
where is the vector with entries that are zero and one for its i-th entry. Taking the derivative of (1) with respect to and equating it to zero, and solving instances of the subproblem based on the optimality conditions, the u-th row/column of (i.e., ) can be rewritten as follows:
where vectors, , , and , and scalars, , , and , are obtained by partitioning , K, and M such that , , and = 0. The optimal update for the u-th row/column of (i.e., ) corresponds to the solution of the following quadratic program:
The optimization problem (7) can be simplified by eliminating its equality constraints determined by A (i.e., au) as follows:
where
so that is the vector with elements that are selected from the original variable vector based on the index set S [15]. The complete and detailed derivation can be found in Appendix A.
The pseudocode in Algorithm 1 is shown to solve the desired generalized graph Laplacian matrix. It iteratively updates each row/column of the estimated generalized graph Laplacian matrix and its estimated inverse matrix by solving the optimization problem in (8).
| Algorithm 1: Graph Laplacian Estimation | |||||
| Input: Sample statistic S, connectivity matrix A, regularization matrix H, target Laplacian set and tolerance ε Output: and | |||||
| 1: | Set K = S + H | ||||
| 2: | Initialize | ||||
| 3: | repeat | ||||
| 4: | Set | ||||
| 5: | for u = 1 to n do | ||||
| 6: | Partition , , and A as in (3) for u | ||||
| 7: | Update | ||||
| 8: | Solve (8) for with, and S in (9) | ||||
| 9: | Update and using the solution from above: | ||||
| 10: | Update , and : | ||||
| 11: | Rearrange and using P for u as in (3) | ||||
| 12: | end for | ||||
| 13: | until criterion (, ) ≤ ε | ||||
| 14: | return and = | ||||
2.2. Graph Learning-Based Spatiotemporal Analysis for Detecting and Locating Anomalies
Since the constructed spatiotemporal graph characterizes the similarity in voltage between each pair of buses in a power system at a given time, we will leverage this spatiotemporal graph to identify anomalies in a power system based on the changes in the similarity change in this graph under different times. It is assumed that the similarity in voltage between all pairs of buses changes after an anomaly occurs in a power system. This assumption will be validated in Section 3. Thus, we identify the potential anomalies in a power system in two steps: first, we will detect if there are anomalies in a power system; if so, then we will locate the anomalies in the system. For anomaly detection, we will evaluate the overall changes in voltage similarity among all buses in the spatiotemporal graph at different times; for locating anomalies, we will evaluate the local similarity change in voltage at individual buses. In particular, by using distributed PMU data and the graph learning technique, the spatial relationship between different nodes at a given time can be represented by a weighted, undirected graph G = {V, E, W}, where V (dim{V} = NV) is the set of vertices (or nodes) and each vertex can be identified by index i; E (dim{E} = NE) is the set of edges (or links); an edge denoted by lij represents a connection between vertices i and j; and W is the set of weight wij on an edge between vertices i and j. Voltage magnitude |Vi|, i = 1,…, NV, at each bus can be obtained at a given time. The spatial graph will change with time t, so the spatiotemporal graph can be constructed by time-varying magnitude |Vi(t)|, i = 1,…, Nv and t = 1,…T.
The spatiotemporal graphs at different times can be used to detect and locate the anomalies in the power system. To detect whether or not a power system has anomalies, we compare the global connectivity (i.e., the overall similarity of bus voltages) of the spatiotemporal graphs at different times. The global connectivity of a spatial graph can be quantified by the Fiedler value (i.e., the second smallest eigenvalue λ2) of the generalized graph Laplacian matrix [16,17,18]. A larger λ2 indicates that the entire graph has strong connectivity as all nodes are well-connected. Conversely, a smaller λ2 means that the entire graph has weak connectivity, as there may be weakly connected nodes due to the occurrence of anomalies. λ2 can be evaluated based on the estimated graph Laplacian matrix as
where λj, j = 1,..., NV, is a nonnegative eigenvalue and has a boundary between 0 and n, i.e., 0 ≤ λj≤ n [17]; x is a set of eigenvectors.
After the anomalies are detected in the system, the locations of these anomalies can be identified by comparing the local connectivity of each node (i.e., the local similarity of bus voltages) in the relevant spatiotemporal graph. The local connectivity of each node can be quantified by the weighted degree of a node. A node i with a higher degree ki indicates that node i has strong connectivity. On the other hand, a node i with a lower degree ki means that node i has weak connectivity as there may be weak connections to the other nodes due to the occurrence of anomalies. The weighted degree ki of node i is the sum of weights wij on the edges connected to the following node:
The weighted degree ki of node i can be evaluated based on the estimated graph Laplacian matrix Since diagonal element of this matrix represents the sum of weights on each edge connected to node i in a spatial graph at a given time. The weighted degree ki can be calculated by (i.e.,
3. Results
In this section, the proposed method is first demonstrated on the IEEE 39-bus system and then validated using realistic PMU data.
3.1. IEEE 39-Bus System
The performance of our developed method is shown in the IEEE 39-bus, 10-machine New England system, as shown in Figure 2. Detailed modeling parameters for the test system can be obtained from [19]. Figure 3a shows the time-domain trajectories of voltage magnitudes at 39 buses in this system with an anomaly event, which is simulated by applying a three-phase fault at Bus 19 at time t = 1 s and then clearing it at t = 1.05 s. The time-domain trajectories known as power-system features are used for creating spatiotemporal graphs by the graph learning technique, as described in Section 2.1. Figure 3b,c,d show the spatiotemporal graphs created at three time segments: Segment 1 is related to the one before the occurrence of this anomaly event, Segment 2 is related to the one during the occurrence of this anomaly event, and Segment 3 is related to the one after the clearing of this anomaly event. Each time segment spans approximately 0.1 s.
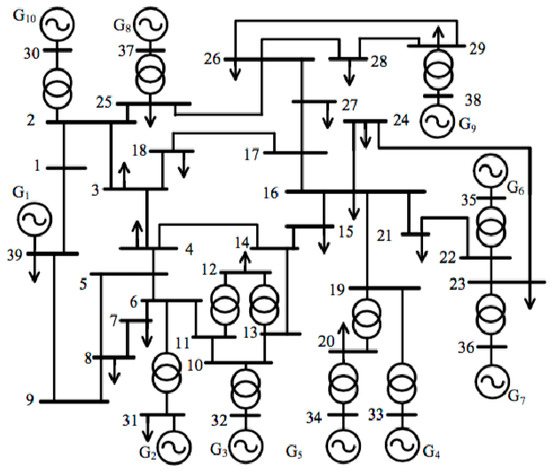
Figure 2.
IEEE 39-bus system.
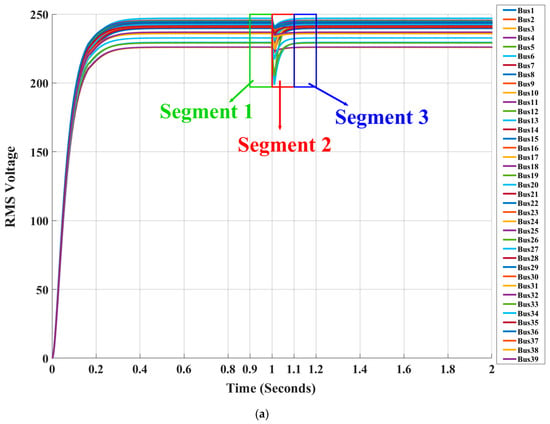
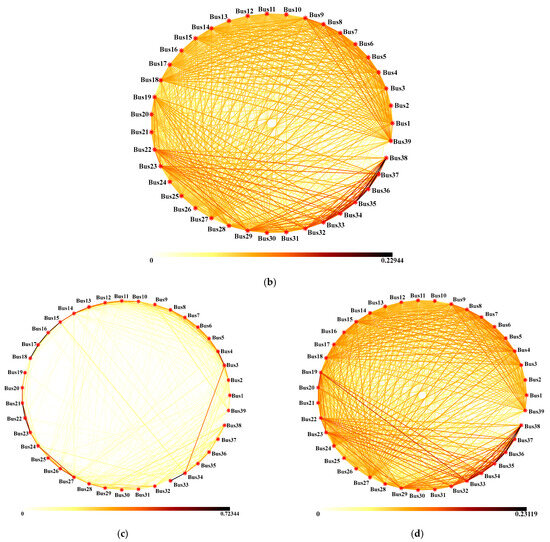
Figure 3.
The spatiotemporal graphs under three time segments created based on the time-domain trajectories of voltage magnitudes of all buses in the IEEE 39-bus system: (a) time-domain trajectories of voltage magnitudes of all buses in the IEEE 39-bus system; (b) before the occurrence of anomaly event under Segment 1; (c) during the occurrence of anomaly event under Segment 2; (d) after the clearing of anomaly event under Segment 3.
The global connectivity of each spatiotemporal graph is evaluated using the Fiedler value (i.e., λ2) in (10). The evaluation results are shown in Table 1.

Table 1.
Fiedler values of spatiotemporal graphs under Segments 1, 2, and 3.
After the anomaly is detected from the spatiotemporal graph under Segment 2, this anomaly can be further located by comparing the local connectivity of each node in this spatiotemporal graph. The local connectivity of each node is quantified by the weighted degree ki of a node in (11). Table 2 presents the ki of all nodes ranked in ascending order.

Table 2.
Weighted degree of all nodes in the spatiotemporal graph under Segment 2.
3.2. Performance of the Proposed Method
The proposed method is compared with another method for anomaly detection and locating based on graph learning in [13], where the anomaly is detected and located by using individual PMU data in the temporal domain without considering the spatiotemporal interdependence among multiple distributed PMUs. Based on the empirical three-sigma rule [20], the 1.5 sigma rule was used to obtain thresholds for both methods. Anomalies are detected if the weighted degree ki metric and the anomaly scores are less than the threshold. Table 3 presents the comparison results of these two methods in terms of accuracy, recall, and precision. The accuracy measures the performance of the methods to correctly classify anomalies and normal voltage data. The precision measures how well the methods detect anomalies that are actual anomalies, and the recall measures the performance of the methods to correctly identify all actual anomalies without missing any. Larger accuracy, recall, or precision mean a better performance of the detection method. It can be observed from Table 3 that the proposed method has much better accuracy, recall, and precision than the one in [13]. This observation verifies that the proposed method is more accurate for anomaly detection and locating using PMU data.

Table 3.
Performance metrics of the proposed Method.
3.3. Realistic PMU Data
The efficacy of our developed method is validated using realistic PMU data from a transmission system where the distributed PMU devices collect the synchrophasor voltage data with a 30 Hz sampling rate. In this paper, each PMU data point spans approximately 10 s for each time segment, with a total of 160 s being analyzed. The proposed method is used to detect and locate different anomaly events that occur at different transmission substation locations. Figure 4a, Figure 5a, and Figure 6a show the global connectivity quantified by Fiedler values (i.e., λ2) for the spatiotemporal graphs under each time segment in the system based on the different voltage levels. These spatiotemporal graphs are created using the graph learning technique as described in Section 2.1 and the time-domain trajectories of voltage magnitudes at 30 buses in the system. Figure 4b, Figure 5b, and Figure 6b show the local connectivity losses of each bus quantified by using the normalized weighted node degree in (14) for each spatiotemporal graph under the given time segment in the system.
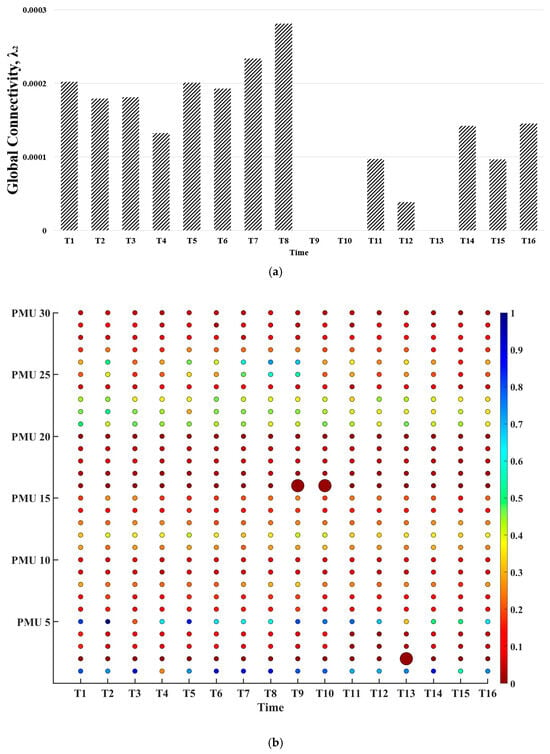
Figure 4.
Fault at different PMU locations in the 161 KV transmission substation system: (a) Global connectivity losses of voltage magnitudes (b) Local connectivity losses of voltage magnitudes.
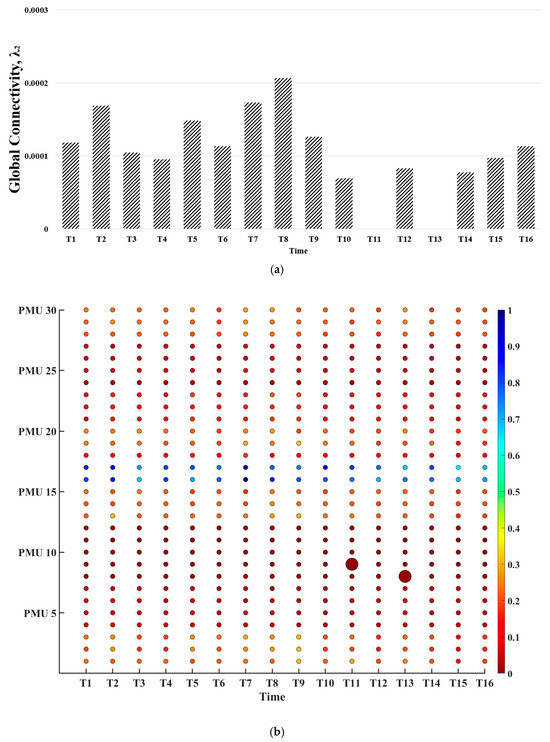
Figure 5.
Fault at different PMU locations in the 138 KV transmission substation system: (a) Global connectivity losses of voltage magnitudes (b) Local connectivity losses of voltage magnitudes.
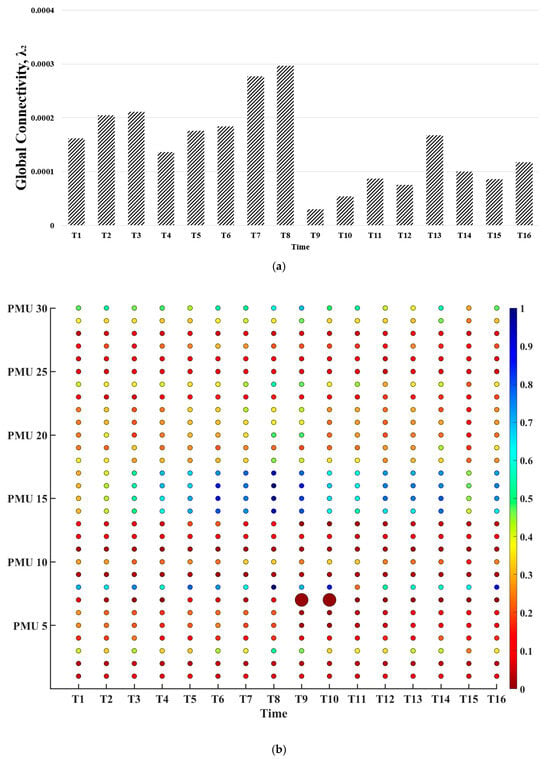
Figure 6.
Fault at different PMU locations in the 69 KV transmission substation system: (a) Global connectivity losses of voltage magnitudes (b) Local connectivity losses of voltage magnitudes.
A node i with a lower degree indicates that node i loses much more connectivity with other nodes and is much more severely impacted due to the occurrence of an anomaly event. In Figure 4b, Figure 5b, and Figure 6b, a node with a deep red color and large bubble size indicates that this node loses much more connectivity to the remaining nodes in the system due to the occurrence of an anomaly event; on the other hand, a node with blue color and a small bubble size indicates that this node has strong connectivity to the other nodes in the system.
4. Discussion
It can be observed from Figure 3 that the global connectivity of the spatiotemporal graph under Segment 2 is significantly different from those of spatiotemporal graphs under Segments 1 and 3 due to the occurrence of the anomaly. It can be seen from Table 1 that the spatiotemporal graph under Segment 2 has the lowest value of λ2 among these three spatiotemporal graphs. Thus, the accuracy of detecting anomalies using the proposed method can be validated. It can also be seen from Table 2 that bus 19 has the lowest ki among all buses. Thus, the location of this anomaly occurs at bus 19. The results verify that the proposed method for locating anomaly is accurate. Table 3 illustrates the quantitative performance of the proposed method, where each metric offers a unique evaluation of the effectiveness of the proposed method. The accuracy measures the degree to which the model distinguishes between anomalies and normal signals. Precision quantifies the proportion of the detected anomalies that are actually anomalies, minimizing false positives, and the recall measures how well the model detects actual anomalies without missing any. Ultimately, Table 3 shows that the proposed method outperforms the previous method in accuracy, precision, and recall.
The results of Figure 4, Figure 5 and Figure 6 verify the robustness of the proposed method with realistic PMU data at three voltage levels. For example, Figure 4a shows the global connectivity losses of voltage magnitudes with faults at different PMU locations at 161 kV voltage level. It can be observed from this figure that the global connectivity of the spatiotemporal graph under segments T9, T10, or T13 is significantly different from those under other time segments. This indicates there are disturbances in the system under segments T9, T10, and T13. As seen in Figure 4b, PMU 16 during time segments T9 and T10 and PMU 2 during time segment T13 has a deeper red color and larger bubble size than other PMU locations, so the local connectivity losses of voltage magnitudes of PMU 16 during time segments T9 and T10 and PMU 2 during time segment T13 are much higher than others at the remaining PMU locations. Thus, there are disturbances in the system at PMU 16 during time segments T9 and T10 and PMU 2 during time segment T13. Similar results can be observed from realistic PMU data at 138 kV and 69 kV voltage levels, which are shown in Figure 5 and Figure 6. These results validate that the proposed method accurately detects and locates anomaly events in realistic PMU data.
5. Conclusions
This paper presents a novel method for anomaly detection and localization using graph learning for the spatiotemporal analysis of distributed PMU data. The graph learning was used to estimate the generalized graph Laplacian (GGL) matrix characterizing the spatiotemporal relationship of distributed PMU data. The global connectivity of different spatiotemporal graphs was first compared to identify the anomalies in the relevant spatiotemporal graph, and then the local connectivity of nodes in the spatiotemporal graph was compared to locate the anomalies in a power system. The efficacy of the proposed method was validated on the IEEE 39-bus system. It showed that the proposed method outperforms with an accuracy of 97% and a precision and recall of 80% and 100%, respectively. Furthermore, the proposed method was verified on realistic PMU data obtained from a 161 kV transmission substation and across other voltage level substations. To validate the robustness of the proposed method, it was observed that at the 161 kV substation, anomalies are located at two PMU locations (PMUs 16 and 2) with high local connectivity losses. Also, anomalies were detected and located under different time segments in the 138 KV and 69 KV substations. This method can help grid operators visualize the spatiotemporal relationship of distributed PMU data to support decision-making. Further studies can include an investigation of the proposed method to detect anomalies caused by dynamic system events such as oscillation, renewable energy integration, and cyber-attacks.
Author Contributions
Conceptualization, O.A. and D.W.; methodology, O.A. and D.W.; software, O.A.; validation, O.A. and D.W.; formal analysis, O.A.; investigation, O.A.; resources, D.W.; data curation, O.A. and D.W.; writing—original draft preparation, O.A.; writing—review and editing, D.W.; visualization, O.A.; supervision, D.W.; project administration, D.W.; funding acquisition, D.W. All authors have read and agreed to the published version of the manuscript.
Funding
The authors express their gratitude for the funding provided to support this study from the National Science Foundation (NSF) EPSCoR RII Track-2 Program under grant number OIA-2119691. The findings and opinions expressed in this article are those of the authors only and do not necessarily reflect the views of the sponsors.
Data Availability Statement
The data presented in this study is available upon request from the corresponding author. The data are not publicly available due to privacy.
Conflicts of Interest
The authors declare no conflicts of interest. The funders had no role in the design of the study; in the collection, analyses, or interpretation of data; in the writing of the manuscript; or in the decision to publish the results.
Appendix A
For the purpose of graph learning, the optimization problem is formulated by minimizing the Lagrangian function for the PMU data, i.e., solving for the parameters of a multivariate Gaussian model that best approximates the data as follows:
subject to
where S is the data statistics obtained from the signal data, H is the regularization matrix, M is the matrix of Lagrange multipliers associated with the constraints, logdet(·) means the natural logarithm of a determinant, Tr (·) is the trace operator, which is linear and A is the connectivity matrix. We can write the objective function as
where K = S + H.
To estimate an n × n graph Laplacian matrix while satisfying the Laplacian constraints, the rows/columns of and its inverse = are updated repeatedly until convergence is achieved by using the matrix inversion lemma,
where P is the permutation matrix used to arrange updated and fixed elements in block partitions. The submatrix represents the unchanged elements while vector and scalar (i.e., = ) are the u-th row/columns of , representing the updated elements. Based on the block partition in (2), is calculated using updated and , for unchanged as follows:
where is solved from partitions of updated as,
To update the diagonal elements of , a scalar value v is added to the , and C is updated as:
where is the vector whose entries are zero, and one for its i-th entry. Then, the Lagrangian duality theory is applied to achieve optimality conditions by introducing a set of Lagrange multipliers (i.e., dual variables) and a Lagrangian function. The Lagrangian function becomes
For the optimization problem in (1), M = M1 + M2, with multiplier matrices, M1 and M2, whose entries are
for i, j = 1,…, n and where and are the Lagrange multipliers associated with inequality and equality constraints, respectively. Taking the derivative of (1) with respect to and equating it to zero, the optimality condition becomes,
and solving instances of the subproblem based on the optimality conditions, the u-th row/column of (i.e., ) can be rewritten as:
where vectors, , and , and scalars, , and , are obtained by partitioning , K, and M such that , and = 0. Using the relations in (6) and (7), (15) becomes
Based on the relations in (13) and (15) the optimality condition for the u-th column of (i.e., ) include
where and are obtained by partitioning and A as in (4), respectively, and the optimality conditions on follow from (11) and (12). Based on the above optimality conditions, in (14) and (18), the optimal update for the u-th row/column of (i.e., ) corresponds to the solution of the following quadratic program:
Simplifying (19) by eliminating its equality constraints determined by A (i.e., au) and formulating its equivalent as the following nonnegative quadratic program, whose solution satisfies the optimality conditions in (18),
where
so that is the vector whose elements are selected from the original variable vector based on the index set S.
References
- North America Synchrophasor Initiatives. Time Synchronization Electric Power System. Available online: https://www.naspi.org/sites/default/files/reference_documents/tstf_electric_power_system_report_pnnl_26331_march_2017_0.pdf (accessed on 19 August 2024).
- Joshi, P.M.; Verma, H.K. Synchrophasor measurement applications and optimal PMU placement: A review. Electr. Power Syst. Res. 2021, 19, 107428. [Google Scholar] [CrossRef]
- North America Synchrophasor Initiatives. Synchrophasor Technology Fact Sheet. Available online: https://www.naspi.org/sites/default/files/reference_documents/33.pdf?fileID=1326 (accessed on 19 August 2024).
- U.S. Department of Energy. Smart Grid Investment Grant Program-Progress Report [Online]. Available online: https://www.energy.gov/sites/prod/files/2017/01/f34/Final%20SGIG%20Report%20-%202016-12-20_clean.pdf (accessed on 19 August 2024).
- Aminifar, F.; Fotuhi-Firuzabad, M.; Safdarian, A.; Davoudi, A.; Shahidehpour, M. Synchrophasor Measurement Technology in Power Systems: Panorama and State-of-the-Art. IEEE Access 2014, 2, 1607–1628. [Google Scholar] [CrossRef]
- Yen, S.W.; Morris, S.; Ezra, M.A.G.; Huat, T.J. Effect of smart meter data collection frequency in an early detection of shorter-duration voltage anomalies in smart grids. Int. J. Electr. Power Energy Syst. 2019, 109, 1–8. [Google Scholar] [CrossRef]
- Song, L.; Li, X.; Zhu, S.; Choy, Y. Cascade ensemble learning for multi-level reliability evaluation. Aerosp. Sci. Technol. 2024, 148, 109101. [Google Scholar] [CrossRef]
- Khaledian, E.; Pandey, S.; Kundu, P.; Srivastava, A.K. Real-time synchrophasor data anomaly detection and classification using isolation forest, kmeans, and loop. IEEE Trans. Smart Grid 2021, 12, 2378–2388. [Google Scholar] [CrossRef]
- Pandey, S.; Srivastava, A.K.; Amidan, B.G. A real-time event detection, classification, and localization using synchrophasor data. IEEE Trans. Power Syst. 2020, 35, 4421–4431. [Google Scholar] [CrossRef]
- Jamei, M.; Scaglione, A.; Roberts, C.; Stewart, E.; Peisert, S.; McParland, C.; McEachern, A. Anomaly Detection Using Optimally Placed μPMU Sensors in Distribution Grids. IEEE Trans. Power Syst. 2018, 33, 3611–3623. [Google Scholar] [CrossRef]
- Zhou, Y.; Arghandeh, R.; Konstantakopoulos, I.; Abdullah, S.; Spanos, C.J. Data-driven event detection with partial knowledge: A hidden structure semi-supervised learning method. In Proceedings of the 2016 American Control Conference (ACC), Boston, MA, USA, 6–8 July 2016. [Google Scholar] [CrossRef]
- Gholami, A.; Qin, C.; Pannala, S.; Srivastava, A.K.; Rahmatian, F.; Sharma, R. D-PMU Data Generation and Anomaly Detection Using Statistical and Clustering Techniques. In Proceedings of the 2022 10th Workshop on Modelling and Simulation of Cyber-Physical Energy Systems (MSCPES), Milan, Italy, 3 May 2022. [Google Scholar] [CrossRef]
- Cui, M.; Wang, J.; Florita, A.R.; Zhang, Y. Generalized Graph Laplacian Based Anomaly Detection for Spatiotemporal MicroPMU Data. IEEE Trans. Power Syst. 2019, 34, 3960–3963. [Google Scholar] [CrossRef]
- Simeunović, J.; Schubnel, B.; Alet, P.-J.; Carrillo, R.E. Spatio-Temporal Graph Neural Networks for Multi-Site PV Power Forecasting. IEEE Trans. Sustain. Energy 2022, 13, 1210–1220. [Google Scholar] [CrossRef]
- Egilmez, H.E.; Pavez, E.; Ortega, A. Graph learning from data under structural and Laplacian constraints. IEEE J. Sel. Top. Signal Process. 2017, 11, 825–841. [Google Scholar] [CrossRef]
- Huang, S.; Coulombe, S.; Hitti, Y.; Rabbany, R.; Rabusseau, G. Laplacian change point detection for single and multi-view dynamic graphs. ACM Trans. Knowl. Discov. Data 2024, 18, 1–32. [Google Scholar] [CrossRef]
- Zhang, C.; Zhang, L.; Chen, N. Spectral network approach for multi-channel profile data analysis with applications in advanced manufacturing. In Proceedings of the 2017 IEEE International Conference on Industrial Engineering and Engineering Management (IEEM), Singapore, 10–13 December 2017. [Google Scholar] [CrossRef]
- Pirani, M.; Sundaram, S. On the Smallest Eigenvalue of Grounded Laplacian Matrices. IEEE Trans. Autom. Control 2016, 61, 509–514. [Google Scholar] [CrossRef]
- IEEE 39-Bus System (PSCAD). Available online: https://www.pscad.com/knowledge-base/download/ieee_39_bus_technical_note.pdf (accessed on 10 September 2024).
- Pukelsheim, F. The Three Sigma Rule. Am. Stat. 1994, 48, 88–91. [Google Scholar] [CrossRef]
Disclaimer/Publisher’s Note: The statements, opinions and data contained in all publications are solely those of the individual author(s) and contributor(s) and not of MDPI and/or the editor(s). MDPI and/or the editor(s) disclaim responsibility for any injury to people or property resulting from any ideas, methods, instructions or products referred to in the content. |
© 2025 by the authors. Licensee MDPI, Basel, Switzerland. This article is an open access article distributed under the terms and conditions of the Creative Commons Attribution (CC BY) license (https://creativecommons.org/licenses/by/4.0/).