Article

Comparative Analysis of Catenary and TLP Mooring Systems on the Wave Power Efficiency for a Dual-Chamber OWC Wave Energy Converter

by
Dimitrios N. Konispoliatis
* and
Anargyros S. Mavrakos
School of Naval Architecture and Marine Engineering, National Technical University of Athens, 157 73 Athens, Greece
*
Author to whom correspondence should be addressed.
Energies 2025, 18(6), 1473; https://doi.org/10.3390/en18061473
Submission received: 5 February 2025 / Revised: 13 March 2025 / Accepted: 15 March 2025 / Published: 17 March 2025
(This article belongs to the Section A3: Wind, Wave and Tidal Energy)

Abstract

:
The primary challenge in the design of offshore oscillating water column (OWC) devices lies in maintaining structural integrity throughout their operational lifespan while functioning in challenging environmental conditions. Simultaneously, it is vital for these devices to demonstrate efficiency in wave power absorption across a range of environmental scenarios pertinent to the selected installation site. The present manuscript seeks to compare two distinct mooring types for a dual-chamber OWC device to enhance its wave power efficiency. To accomplish this objective, an analysis of wave power absorption efficiency will be conducted on both a catenary mooring system and a tension-leg platform (TLP) mooring arrangement, thereby identifying the most suitable configuration. The study elucidates how OWC mooring characteristics influence wave power absorption efficiency. While the catenary mooring system exhibits two distinct resonant wave frequencies, resulting in enhanced wave power absorption at those frequencies, the TLP mooring system demonstrates superior overall wave power absorption efficiency across a broader range of wave frequencies, thus showcasing its greater potential for wave energy conversion under diverse environmental conditions.

1. Introduction

As global energy demand intensifies and the impacts of climate change become more severe, the necessity for clean energy solutions is critical. The EU’s Offshore Renewable Energy Strategy aims to accelerate this transition, targeting 1 GW by 2030, meaning EU ocean energy capacity must more than double in five years [1]. Dedicated discussions on ocean energy between European, national, and regional authorities are expected to identify many new cooperation opportunities. Wave and tidal energy can deliver 1 GW by 2030 and 100 GW by 2050, equivalent to 10% of Europe’s electricity consumption today. With almost 45% of Europe’s citizens living in coastal regions, ocean energy can be readily delivered where it is needed [2]. Ocean energy devices emerge as promising solutions supporting and stabilizing grids that integrate variable renewable energy sources [3].
A considerable number of publications addressing both past and current research on floating oscillating water column (OWC) devices underscore a preference for this methodology of ocean energy conversion. This inclination is attributed to the OWC’s straightforward operation, structural integrity, ease of maintenance, and versatility [4]. The OWC converter harnesses wave energy by utilizing the motion of the water’s free surface as a piston, which consequently produces an airflow that activates an air turbine linked to a generator [5]. In the present manuscript, the impact strategy takes advantage of theoretical formulations to address key challenges in the wave energy sector. By focusing on optimizing design processes, this work is striving to enhance the overall wave power efficiency of moored OWCs in the open sea.
Station-keeping systems are critical for floating OWC devices, as they manage the movement and orientation of the converters in response to environmental forces, including waves, currents, and wind [6]. Unlike conventional floating offshore installations, OWCs are specifically deployed in areas characterized by high wave energy density. Given that survivability is a primary concern, the mooring system is engineered to endure the most severe storm conditions anticipated during its design life at the designated deployment site [7]. This requirement for survivability has been demonstrated to significantly influence the cost of the mooring systems and, consequently, the overall project expenses [8].
As early as 2000, Johanning et al. [9,10,11] conducted studies on appropriate mooring arrangements and the dynamic response of a mooring line for the station keeping of a wave energy converter (WEC). Subsequently, Vijayakrishna Rapaka et al. [12] investigated the behavior of a moored multi-resonant OWC device, which combined the principles of a floating breakwater and a WEC. In 2010, Elwood et al. [13] detailed the design and construction phases, as well as the ocean testing of a taut-moored dual-body WEC incorporating a linear power takeoff mechanism. Xu et al. [14] presented a review of representative WEC projects, emphasizing the mooring system design procedure and introducing various mooring systems and materials. This analysis concluded that elastic synthetic rope and hybrid mooring systems hold significant potential for application in WEC mooring systems. Luo et al. [15] and Wang et al. [16], in their respective studies, focused on a heave-only OWC model, demonstrating that the appropriate selection of a spring-damper system was beneficial for achieving dual peak efficiencies and for broadening the efficient frequency bandwidth. Imai et al. [17] conducted wave tank experiments on a moored backward bent duct buoy (BBDB), examining the internal wave height and the motion of the converter resulting from wave impact. They concluded that the phase of the internal wave height is closely aligned with the motion of the converter. More recently, Guo et al. [18] introduced a fully coupled model for a BBDB, which integrates significant transient nonlinear interactions among ocean waves, the motion of the BBDB hull, the mooring system, the oscillation of the internal water column, aerodynamics, turbine rotation, and the damping effects of the generator. Cerveira et al. [19] conducted an analysis on the effects of the mooring system on the dynamics of an arbitrarily shaped WEC and its efficiency. Krivtsov and Linfoot [20] performed experiments on OWC arrays to elucidate the effects of converter-sea interactions on the mooring system, ranging from scale-down tests in a laboratory setting to full-scale evaluations in the open sea. Their findings indicated that the mooring loads in the primary mooring line were doubled under severe wave conditions for both configurations when compared to an isolated moored OWC. Recently, Fong Lee et al. [21] proposed an engineering approach for the design of mooring systems for floating offshore combined wind and wave energy systems. They concluded that WECs contribute wave-induced damping to the platform motion, which reduces responses in the mooring lines, prolongs their fatigue life, and minimizes fluctuations in power production from the wind turbines.
Concerning the tension-leg platform (TLP) OWC converter, a numerical and experimental hydrodynamic assessment of a 1:50 scale model of a moored OWC device was reported in [22,23]. This converter was designed as a tension-leg structure featuring four vertical mooring lines. The study demonstrated that the power efficiency of the device enhanced as it approached the pumping resonance, in contrast to a fully restrained OWC, which was ascribed to the surge motion of the converter. In terms of damage survivability, it was concluded that a single failure in the mooring system increased the maximum tension by 1.55 times the intact tension, while a damaged mooring system could result in an overestimation of the maximum tension by more than 20% when compared to the tensions experienced under irregular wave conditions. A model testing campaign for a tension-leg floating OWC subjected to both unidirectional regular and irregular wave conditions was documented in [24]. The results indicated that the hydrodynamic efficiency of the device was negatively affected by the model’s motion, suggesting that motion responses should be considered when evaluating output efficiency. Wu et al. [25] assessed the nonlinear motion and mooring line response of a 1:25 scale model of a moored OWC under regular wave conditions. This study examined different mooring materials, including chains, nylon ropes, and iron chains, emphasizing notable nonlinear effects on the heave motions of the converter and the shock loads on the mooring line, especially with the nylon rope. It was also determined that power takeoff (PTO) damping had a minimal effect on the movements of the OWC, while mooring tensions were sensitive to changes in the lengths of the mooring lines. Furthermore, the impact of mooring system stiffness on the hydrodynamic performance of floating OWCs was investigated through numerical simulations in [26]. A two-dimensional wave tank was developed to numerically model the hydrodynamics of an OWC allowed to float only in the sway or heave directions. The analysis indicated that hydrodynamic efficiency reached its maximum at the lowest ratio of the system’s natural frequency to the wave frequency, examined for a surging converter, while the maximum efficiency for a heaving OWC was attained at the highest ratio of the natural frequency to the wave frequency. Furthermore, the study demonstrated that this ratio had a notably stronger impact on the hydraulic efficiency of a heaving converter, resulting in the generation of higher vortices compared to a surging OWC, which exhibited weaker vortices.
Research concerning the impact of mooring on the efficiency of a spar buoy OWC has been documented extensively in the literature. Correia da Fonseca et al. [27] conducted an investigation on a spar buoy OWC converter, deployed either in isolation or arranged in a triangular array. This study focused on the experimental assessment of the dynamics, energy extraction, and performance of the mooring system for a scaled-down OWC model. Giorgi et al. [28] built upon [27], analyzing the effects of varying specific characteristics of the spar buoy mooring system. Specifically, the masses of the float and clump weight were modified to improve the power conversion efficiency of the converter. A nonlinear numerical Froude–Krylov model was created, incorporating nonlinear kinematics and a six-degrees-of-freedom formulation for the drag forces. The results indicated that as the line pretension values decreased, both the mean drift and peak loads increased; however, these changes did not influence power efficiency. The performance of the spar buoy OWC in a wave channel was discussed in [29], based on a developed time-domain model grounded in linear hydrodynamics, taking into account mean drift forces, viscous drag effects, and air compressibility in the chamber. This study built upon the research presented in [27], which examined the spar buoy with motion restricted solely to the heave direction. In contrast, the experimental and numerical simulations outlined in [30] involved connecting the converter to the wave channel using two three-segment lines, each featuring an attached float and clump weight. The results from regular wave tests demonstrated a generally strong correlation between numerical and experimental findings, revealing suboptimal performance of the converter at periods near half of the roll/pitch natural periods. Irregular wave tests showed good agreement for the converter’s heave motion and pressure difference; however, discrepancies in surge and pitch results were noted and attributed to the occurrence of roll/pitch parametric resonance. In 2020, an array of spar buoy OWCs, incorporating interbody mooring connections to reduce the number of mooring lines, was examined [31]. The findings indicated that the average heave response amplitude of the array decreased by approximately 6.8% at the peak frequency when an inter-body mooring system was included. Additionally, Touzon et al. [32] developed frequency domain modeling for the motions and rotations of the converter, which was compared with equivalent time domain simulations, highlighting its limitations. Howey et al. [33] discovered that interlinking a network of spar buoy OWCs with moorings could increase the annual energy extracted in comparison to a single-moored spar buoy OWC.
The hydrodynamic performance of a box-type moored OWC was assessed using both numerical and experimental approaches. In particular, the numerical model developed in [34] was validated against experimental data collected from a wave basin test campaign that utilized a 1:36 scale model. The results showed that wave direction significantly influenced sway, roll, and yaw motions but had minimal effects on heave and pitch motions. Additionally, due to the higher tensions in the mooring lines at the front of the converter, it is suggested that a heavier chain be used for the forward lines and a lighter chain for the rear lines during the design process. This analysis was further enhanced in [35], where three different mooring configurations were tested: a tension-leg, a taut mooring line, and a catenary mooring line. The results indicated that surge and pitch motions exhibited an inverse relationship with the capture width ratio, with the taut mooring line configuration displaying superior performance, followed by the tension-leg and catenary mooring line configurations.
The mooring system of a dual-chamber OWC device was experimentally investigated in [36,37,38]. A series of 1:50 model tests were conducted to analyze the motion responses and energy harvesting performance of the converter, employing three flexible mooring systems in both regular and irregular wave conditions. The rain flow counting technique, a spectral method, and the non-Gaussian behavior of the mooring line were utilized to assess fatigue damage.
This research directly addresses the significant challenge of designing offshore OWC devices with optimal geometric characteristics to ensure efficient wave power absorption across diverse mooring systems. Dual-chamber OWCs, recognized in the literature for their superior wave power efficiency compared to single-chamber converters, have garnered considerable attention. However, a comprehensive analysis comparing the impact of different mooring systems on converter performance remains lacking. This manuscript aims to provide valuable guidance and evaluation of the hydrodynamic power efficiency of a cylindrical coaxial dual-chamber OWC, as well as valuable insights for improving the design and optimization of mooring systems for future oscillating water column wave energy converters, enhancing their efficiency and overall energy yield. Toward this goal, the following research questions are addressed: (a) How do the hydrodynamic characteristics of a dual-chamber OWC converter influence wave power absorption efficiency? (2) What are the optimal mooring system parameters for maximizing wave energy capture under diverse environmental conditions? (3) How do the dynamic interactions between the mooring system and the OWC converter affect overall system performance? To answer these research questions, a comprehensive theoretical analysis has been conducted to investigate the effects of various mooring systems on wave power efficiency, specifically examining the motion behavior of the OWC converter under regular waves of varying periods. A detailed theoretical model, whose accuracy has been validated in previous studies by the authors [39,40,41], is employed to analyze the hydrodynamic and wave power performance of a moored converter under two distinct mooring configurations: a catenary system (representing a soft mooring line) and a tension-leg platform (TLP) system (representing a significantly stiffer mooring line). This comparative analysis reveals the superior efficiency of the TLP mooring system across a broader range of wave frequencies compared to a catenary mooring system, offering valuable guidance for optimizing OWC wave power capture efficiency across various deployment sites. This outcome provides valuable design guidance and a quantitative evaluation of the hydrodynamic power efficiency of a dual-chamber OWC with differing mooring configurations.
The remainder of the manuscript is organized as follows: Section 2 outlines the methods and materials employed, including the hydrodynamic forces and moments, air volume flow coefficients, and the system of motion and air pressure equations, as well as the mooring coefficients. In Section 3, the theoretical formulation is validated against the outcomes of commercial numerical software (ANSYS AQWA R21). In Section 4, the differences between a catenary mooring system and a TLP configuration are presented and discussed, with results derived from numerical simulations. Finally, the conclusions of this study are presented in Section 5.

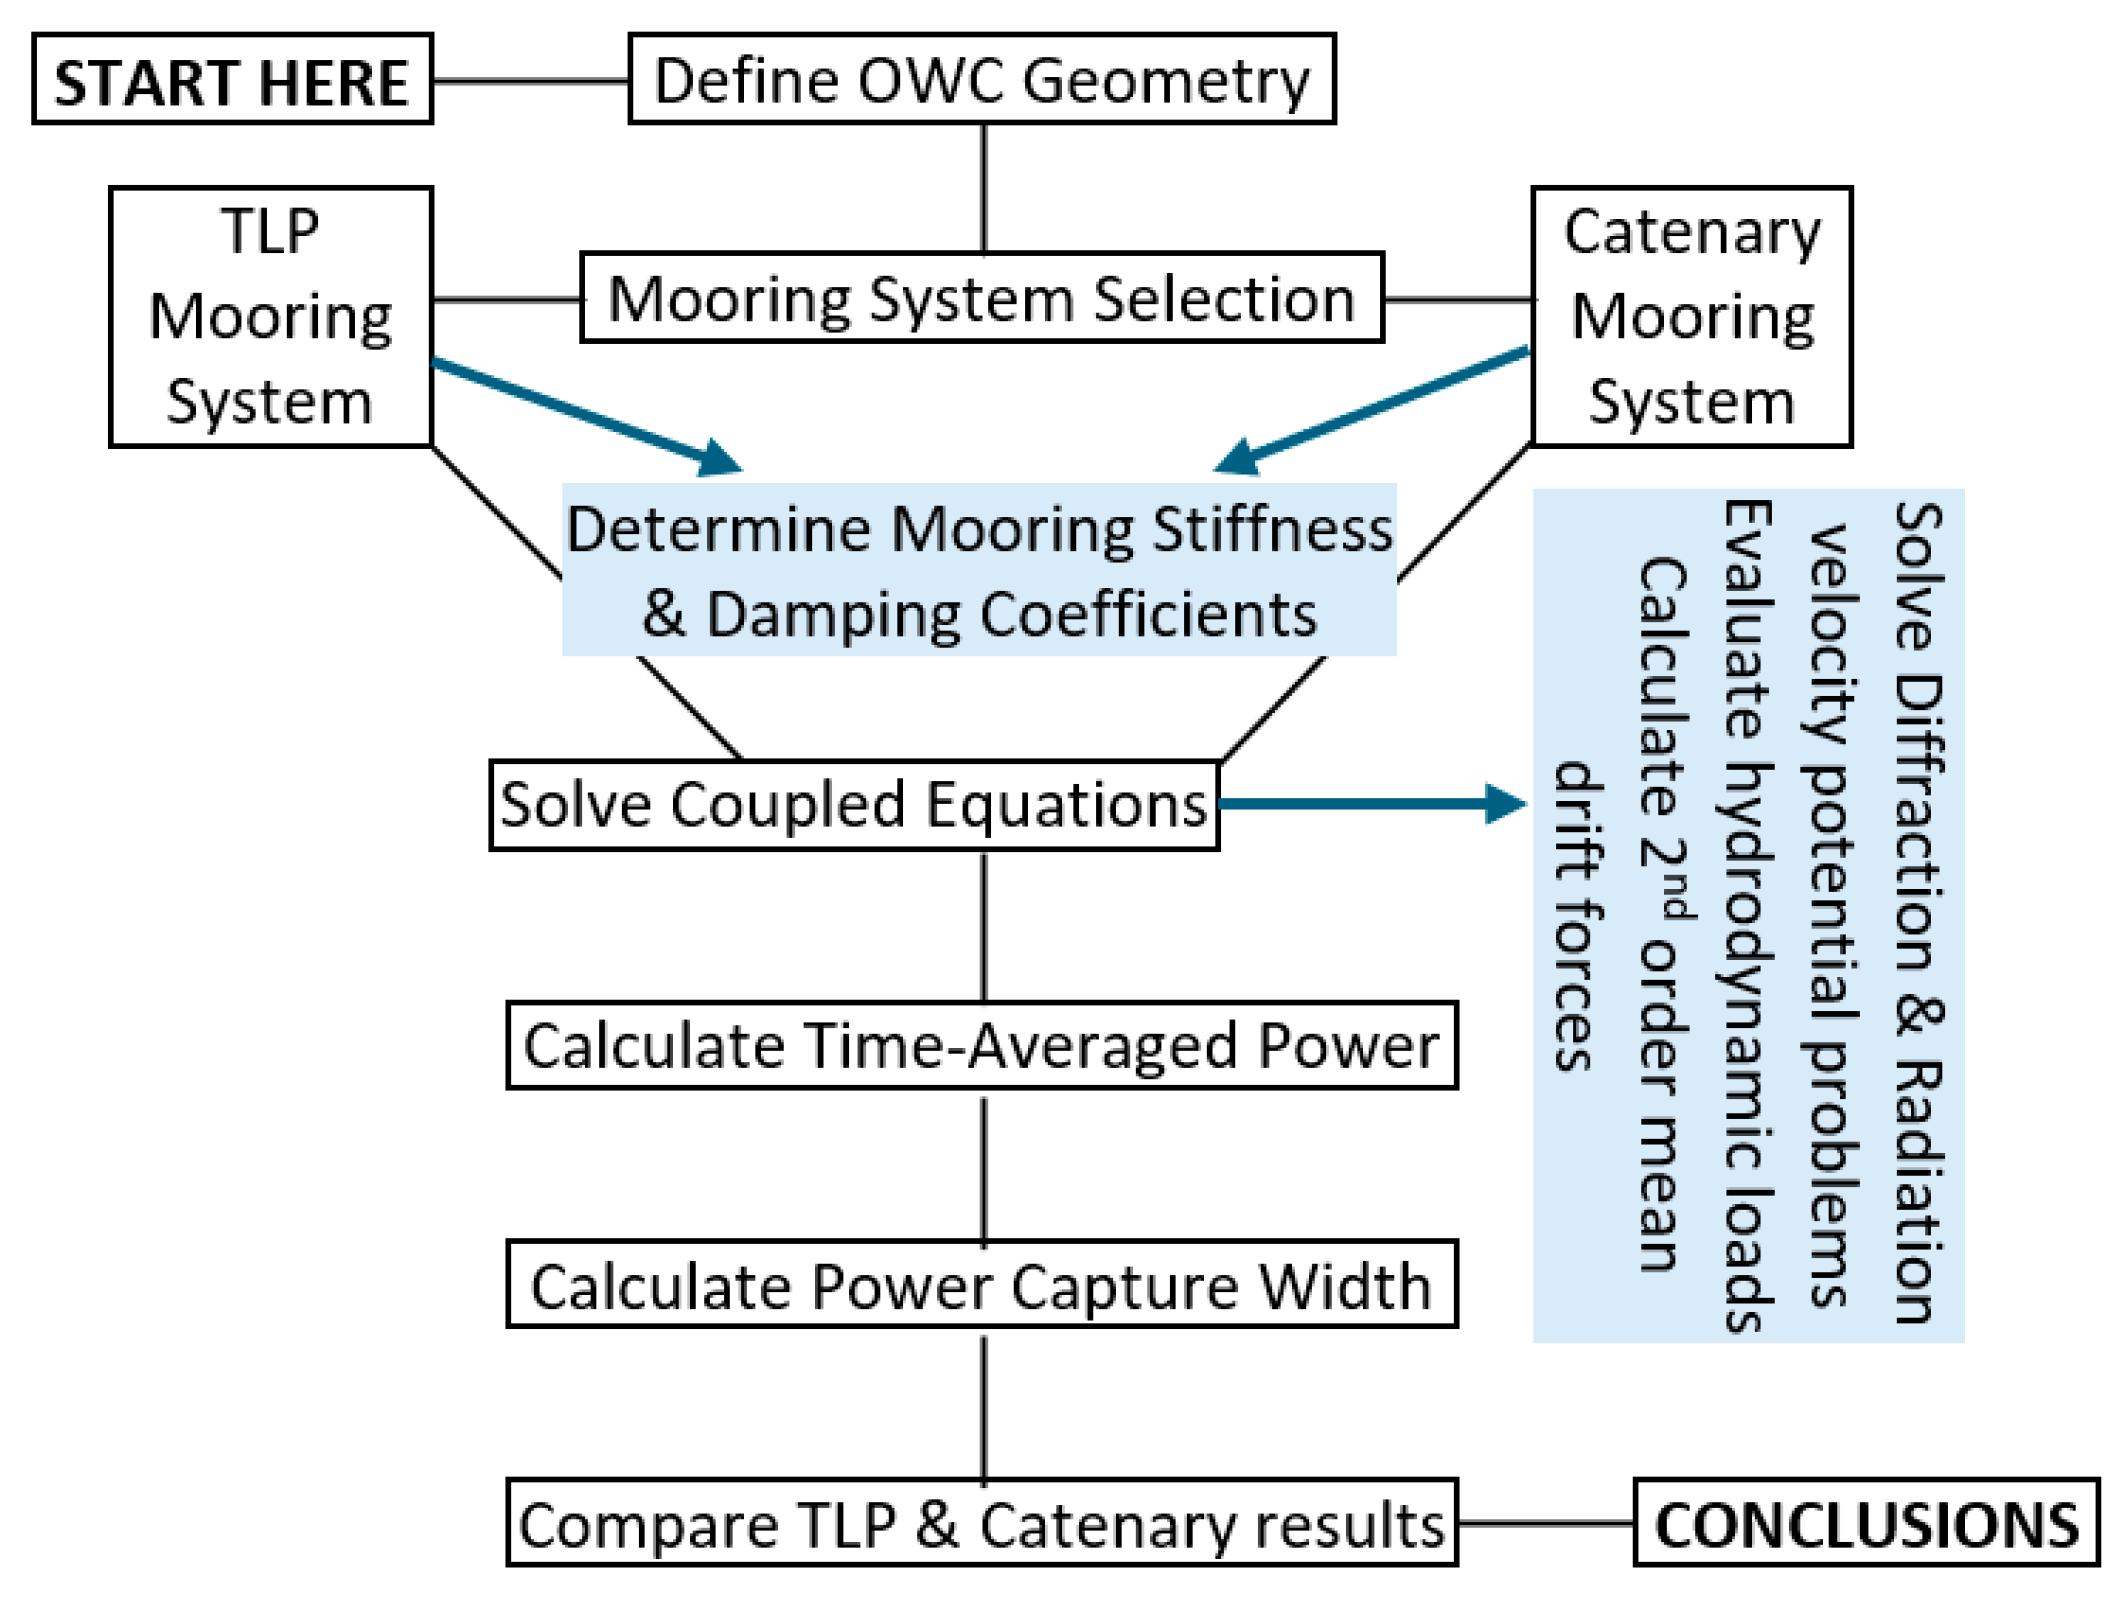
2. Methods and Materials

2.1. Hydrodynamic Analysis

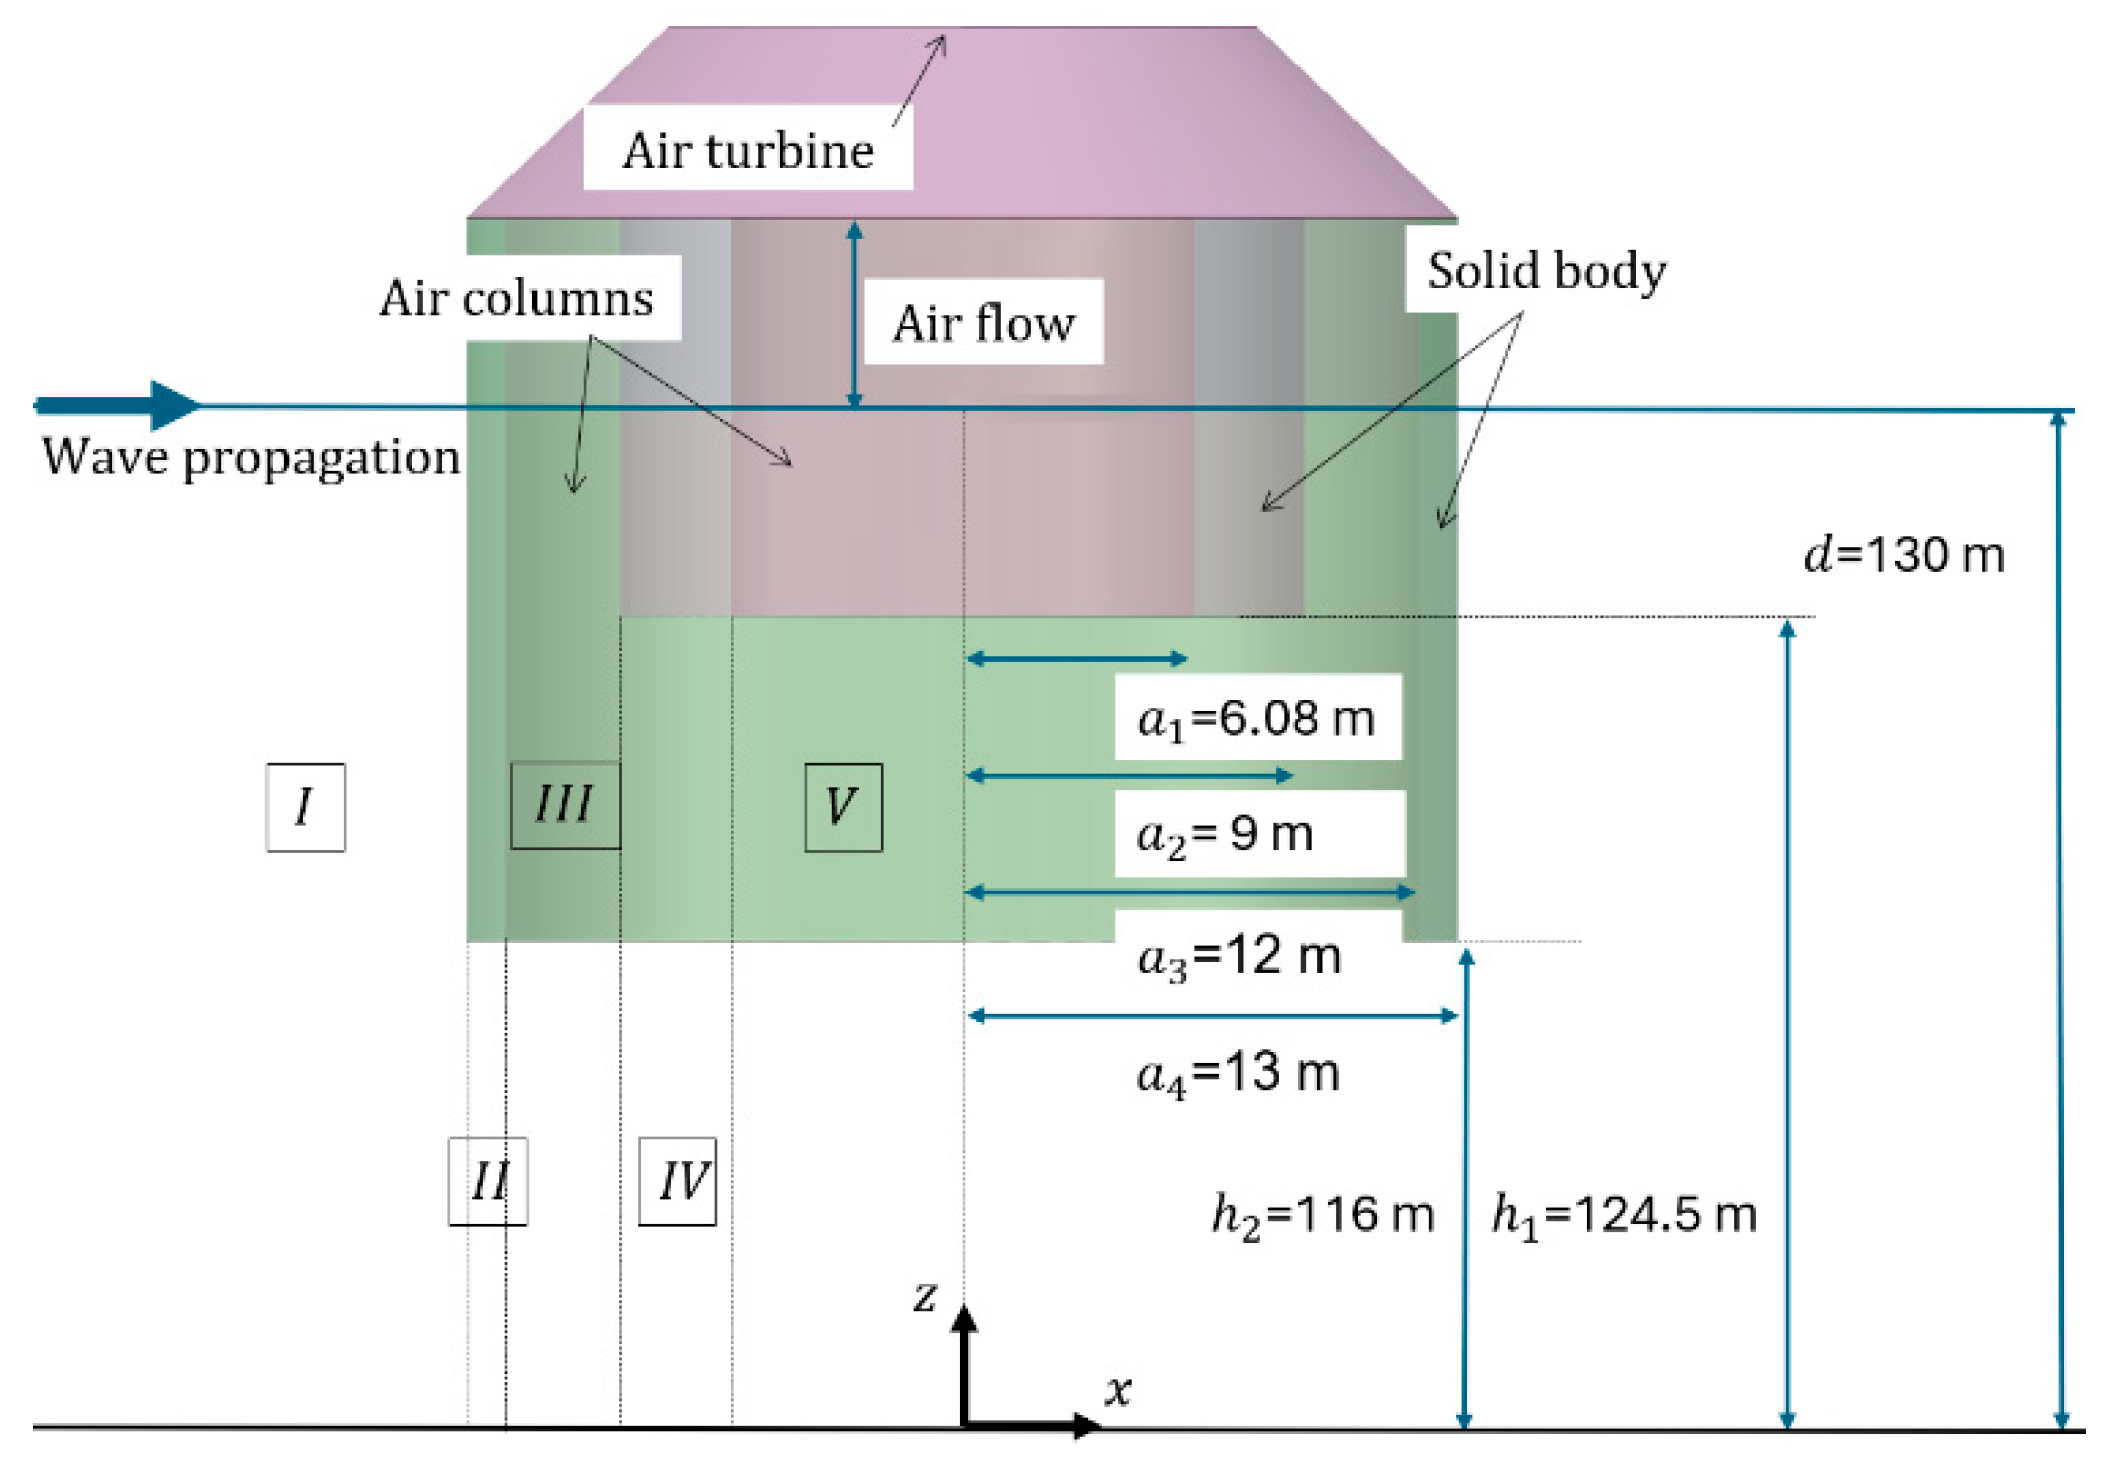
2.1.1. Description of the OWC Converter

A dual-chamber OWC device, made up of two coaxial, free surface-piercing toroidal cylinders with vertical symmetry axes, is situated in a body of water with a constant depth. The geometric specifications of the converter were determined in [39]. Specifically, the inner toroidal body is characterized by a radius of a 2 = 9   m , while the radius of the internal water surface is a 1 = 6.083   m . The distance from the base of the converter to the seabed is designated as h 1 and is considered to be h 1 = 124.5   m . Also, the radius of the outer toroidal body and its distance from the seabed are designated as a 4 = 13   m and h 2 = 116   m , respectively. The radius of the annular water area between the two solids is assumed to be a 3 = 12   m .  Table 1 provides a summary of the principal geometric characteristics of the OWC under consideration. Additionally, Figure 1 and Figure 2 schematically illustrate the examined dual-chamber OWC.
This study’s theoretical analysis solves the diffraction, motion-radiation, and pressure-radiation problems to determine hydrodynamic loads on the OWC converter and air volume flow through the inner turbine. This is augmented by quasi-static and dynamic mooring analyses to formulate the converter’s equation of motion. Subsequently, wave power efficiency and capture width are evaluated, highlighting the mooring type’s influence on device efficiency. Figure 3 provides a flowchart summarizing this analytical approach, which is detailed in the following sections.
The OWC device is influenced by monochromatic incident waves with a frequency ω and a linear amplitude H / 2 . In response to these regular waves, the converter demonstrates three degrees of freedom, consisting of two translational motions (surge ξ 1 , heave ξ 3 ) and one rotational motion (pitch ξ 5 ). It should be noted that the movements of both the converter and the surrounding fluid are considered to be small, allowing for the use of linear diffraction and radiation theory. A cylindrical coordinate system r , θ , z is established on the seabed and oriented vertically, corresponding with the converter’s vertical axis. Viscous effects are neglected, and the fluid is assumed to be incompressible.
To address the diffraction, pressure- and motion-radiation problems, the method of matched axisymmetric eigenfunction expansions is employed. Particularly, the flow field surrounding the converter is divided into coaxial ring-shaped fluid regions, designated as I , I I , I I I , I V , and V (see Figure 1 and Figure 2). Corresponding series representations of the fluid’s velocity potential are formulated within these regions. The velocity potential forms [42,43],
Φ r , θ , z ; t = R e φ r , θ , z e i ω t =                = R e φ D r , θ , z + p 0 φ p r , θ , z + j = 1,3 , 5 ξ ˙ j 0 φ j r , θ , z e i ω t
In Equation (1), φ D denotes the diffraction potential for the converter located within the wave field, with the air duct at the top of the oscillating columns exposed to the atmosphere. This means the pressure in the chambers equals atmospheric pressure. Additionally, φ p represents the pressure-radiation potential arising from the oscillating air pressure head P i n = R e [ p 0 e i ω t ] within the converter’s oscillating chambers when it is fixed in otherwise calm water. The term φ j refers to the motion-radiation potential produced by the forced motion of the converter in the j th mode of motion with a unit velocity amplitude and the air duct open to the atmosphere. Here, ξ ˙ j 0 indicates the complex velocity amplitude of the converter’s motion in the j th direction, expressed as ξ ˙ j = R e [ ξ ˙ j 0 e i ω t ] .
The diffraction, motion- and pressure-radiation velocity potentials can be written as
φ D r , θ , z = i ω H 2 m = 0 ε m i m Ψ D m l r , z c o s ( m θ )
φ p r , θ , z = 1 i ω ρ m = 0 Ψ p m l r , z c o s m θ
φ j r , θ , z = m = 0 Ψ j m l r , z c o s m θ ,    j = 1 , 3 , 5
In Equation (3), the term ρ stands for the water density. In Equations (2)–(4), Ψ D m l , Ψ j m l , and Ψ p m l represent the primary unknown functions of the problem. In the latter, the first subscript—specifically D , j , p —indicates the corresponding boundary problem (i.e., diffraction, motion-radiation, and pressure-radiation), while the second subscript signifies the numbering of the considered m values. Additionally, the superscript l designates the respective coaxial ring-shaped fluid region surrounding the OWC (i.e., I , I I , I I I , I V , and V ).
The fluid flow induced by the forced oscillation of the dual-chamber converter in still water conditions displays symmetry with respect to the plane θ = 0 and antisymmetry regarding θ = π / 2 for the surge and pitch motions. In contrast, the heave motion exhibits symmetry about both these planes. Additionally, in the context of the pressure-radiation problem, it is important to highlight that the forcing of the internal free surface is independent of θ , as the air pressure can be regarded as spatially uniform across the oscillating chambers. This assumption is valid due to the low frequency of sea waves and the relatively small kinetic energy of air per unit volume [40,41,42,43,44]. As a result, only the m = 1 angular mode is considered for the surge- and pitch-radiation problems, while m = 0 is taken into account for the heave motion- and pressure-radiation problems.
The velocity potentials φ l , where l = D , j , p , are required to satisfy the Laplace equation within the entire fluid domain. They must also adhere to the free surface boundary condition at both the inner and outer regions, the seabed boundary condition, the kinematic conditions associated with the mean wetted surface of the converter, and the radiation condition at distances away from the converter. Furthermore, the unknown functions represented by the velocity potentials, φ l ,   l = D , j , p and their derivatives φ l r ,   l = D , j , p , must exhibit continuity at the vertical boundaries of adjacent fluid regions [39].
The solution procedure employed in this study utilizes the method of separation of variables. Consequently, suitable representations of Ψ l m l , l = D , j , p ;   l = I , , V are derived in each fluid domain l in terms of eigenfunctions. These representations are carefully selected to ensure compliance with the kinetic boundary condition at the horizontal walls of the converter, the seabed boundary condition, the linearized boundary condition at the sea surface, and the radiation condition at infinity. The methodologies for addressing the diffraction and motion-radiation problems related to a coaxial moonpool floater have been comprehensively documented in prior literature [40,41,42,45]. Additionally, the pressure-radiation problem for a dual-chamber OWC has been explored in [39]. Therefore, these topics will not be elaborated upon further in this work.

2.1.2. Air Volume Flow

The volume flow rate, Q t , which varies with time and is produced by the oscillating internal water surfaces, is denoted as follows [43,44]:
Q t = R e q e i ω t = R e S i l u z l d S i l e i ω t
In Equation (5), u z l signifies the water surface vertical velocity in regions l =   I I I and V , while S i l indicates the water surface cross-sectional area in the same regions.
A Wells-type air turbine is presumed to be situated at the top of the air chamber within the converter and is represented by a pneumatic admittance Λ . This specific type of air turbine is chosen to establish a linear relationship between the total volume flow rate q and the internal air pressure p 0 , thereby facilitating the following [44]:
q = Λ p 0
Following Falcao [46], the pneumatic admittance Λ can be expressed as a function of the turbine rotor diameter D , the turbine blades rotational speed Ω , the static air density ρ 0 a , the converter’s air chamber volume V 0 , the velocity of sound in air c a , and an empirical coefficient K , which is dependent on the design, the setup, and the number of turbines.
Λ = K D Ω ρ 0 a i ω V 0 c a 2 ρ 0 a
Building upon Equation (1), it is beneficial to decompose the total volume flow rate q into three distinct components: q D related to diffraction, q R related to motion-dependent factors, and q p pertaining to pressure-dependent radiation problems, as expressed below:
q = q D + q p p 0 + q R ξ ˙ 30
In this analysis, it is presumed that the pressure within the chamber is uniformly distributed. As a result, only the pumping mode for m = 0 affects the volumetric oscillations when determining the pressure-dependent volume flow rate q p . This assumption also applies to the diffraction volume flow q D . Additionally, it is important to highlight that the horizontal motions associated with surge and pitch modes in a vertical axisymmetric OWC, such as the one under consideration, do not influence the air volume in the chambers. Consequently, the only factor that impacts the volume flow rate is the heave velocity potential.
In this study, the air compressibility within the chamber is disregarded. Consequently, the pneumatic admittance Λ is treated as a real number. Its value is defined to be equal to the optimal coefficient Λ of the examined converter while being restrained to the wave impact, as outlined in the work of Evans and Porter [44].

2.1.3. Hydrodynamic Forces

The hydrodynamic forces acting on the OWC device can be divided into three components corresponding to diffraction, motion-dependent factors, and pressure-dependent radiation effects. In particular, the exciting forces and moments produced by the diffraction analysis are assessed as follows:
f j e x c = i ω ρ S φ D n j d A ,    j = 1 , , 6
In Equation (9), n j is the j th element of the generalized unit normal vector directed outwards into the fluid domain, and S is the converter’s wetted surface.
The motion-radiation forces and moments, denoted as f i , j h y d , acting on the converter in the i th direction as a result of its forced oscillation in the j th direction, can be expressed as follows:
f i , j h y d = i ω ρ ξ ˙ j 0 S φ j n j d A = ( ω 2 a i j + i ω b i j ) ξ j 0 ,   i , j = 1 , , 6
In Equation (10), a i j , b i j are the hydrodynamic mass and damping coefficients, respectively.
The pressure-radiation forces resulting from the internal air pressure within the oscillating chambers are determined by
f j p r e = i ω ρ p 0 S φ p n j d A ,   j = 3
The mean drift forces, which are derived from the first-order velocity potential Φ (refer to Equation (1)), constitute additional hydrodynamic forces on the converter. The forces are classified as second-order forces and are comparatively small in magnitude relative to their first-order oscillatory counterparts. However, despite their negligible impact on the first-order motions of the oscillatory body, they may induce significant deviations from the body’s mean position in scenarios lacking hydrostatic restoring forces [47,48]. The literature presents two fundamentally distinct approaches for evaluating mean drift wave forces. The initial method, rooted in the conservation of momentum principle, links the forces exerted on the body to those on the external control surfaces, along with the variations in fluid momentum between the body and these surfaces [49]. The alternative method involves directly integrating the fluid pressure over the wetted surface of the body [50,51,52].
Following the direct integration method, the vector of the mean drift forces equals to [50,51,52].
F ( 2 ) ¯ = 1 2 ρ g W L ζ r 2 ¯ n d l + M R X g ¨ S 1 2 ρ Φ 2 ¯ n d S + S ρ X Φ t ¯ n d S 1 2 ρ g A W L [ X 5 2 + X 4 2 ] ¯ X G 3 0 d
In Equation (12), the time average is indicated by bars. In this context, ρ represents the water density; g denotes the acceleration due to gravity; ζ r signifies the first-order relative wave elevation in relation to the transposed static water line W L on the converter. Additionally, n indicates the unit normal vector directed outward from the OWC. Moreover, in Equation (12), M refers to the generalized mass matrix, R denotes the rotational transformation matrix, and X g ¨ represents the first-order translational accelerations of the converter’s center of gravity. Furthermore, S is the wetted surface area of the body, and X is the vector of first-order translations of a point on the wetted surface of the OWC, which can be represented as a combination of the translational motions of the converter’s center of gravity and the associated rotations around it. Lastly, X 4 and X 5 correspond to the first-order roll and pitch motions with respect to the center of gravity, while X G 3 0 represents the vertical distance from the center of gravity.
Furthermore, utilizing the momentum conservation principle, the expression of the mean drift forces equals to [47,48].
F ( 2 ) ¯ = ρ S R Φ t ¯ + 1 2 Φ . Φ ¯ + g z n Φ n Φ ¯ d S k ρ S B Φ t ¯ + 1 2 Φ . Φ ¯ d S          k ρ g S F S S 0 z n z d S
In Equation (13), S 0 is the converter’s mean wetted surface. S B is the surface of the sea bottom; S F S is the free surface, which is bounded by S 0 and a stationary vertical control surface S R that surrounds the OWC. Furthermore, k stands for the unit vector in z-axis, whereas n z is the z -component of the unit normal vector.

2.1.4. Equilibrium Equations—Absorbed Wave Power

The equations of motion for the multi-degrees-of-freedom system, expressed in the frequency domain, are formulated as follows:
j = 1,3 , 5 ω 2 m k j + a k j i ω b k j + b k j m + c k j + c k j m ξ j 0 = f k e x c + δ k , 3 f k p r e + δ k , 3 f k m p ,   k = 1,3 , 5
In Equation (14), m k j and c k j are components of the mass- and stiffness-matrices of the converter, respectively; a k j , b k j are the added mass and damping coefficients, respectively (refer to Equation (10)); f k e x c are the exciting forces and moments acting on the converter (refer to Equation (9)); f j p r e are the pressure hydrodynamic forces on the OWC (refer to Equation (11)). Also, ξ j 0 ( j = 1 , 3 , 5 ) is the motion amplitude component of the OWC, and δ k , 3 is the Kronecker symbol, i.e., δ k , 3 = 0 ,   k 3 ;   δ k , 3 = 1 ,   k = 3 . The term f k m p represents the force exerted on the horizontal wall of the OWC chamber as a result of the internal air pressure. It is expressed as follows:
f k m p = S i p 0 ,   k = 3
In Equation (15), S i denotes the cross-sectional area of the inner water surface within the device.
The terms c k j m ,   b k j m in Equation (14) represent the mooring stiffness and the mooring line damping elements from the mooring matrices. These coefficients are detailed in Section 3.
To solve Equation (14), which consists of a system of three equations with four unknowns, namely ξ j 0 ( j = 1 ,   3 ,   5 ) and p 0 , the system of equations is augmented with the volume flow equation. Consequently, it follows that
q D = ( Λ q p ) p 0 q R ξ ˙ 30 + S i ξ ˙ 30
In Equation (16), the terms q D ,   q R ,   q p are introduced in Equation (8), whereas the term S i ξ ˙ 30 represents the relative displacement between the internal free surface and the motion of the device.
The time-averaged power absorbed by the OWC is determined by [53],
P o u t = 1 2 R e [ Λ p 0 2 ]
In Equation (17), Λ is the pneumatic admittance of the air turbine.

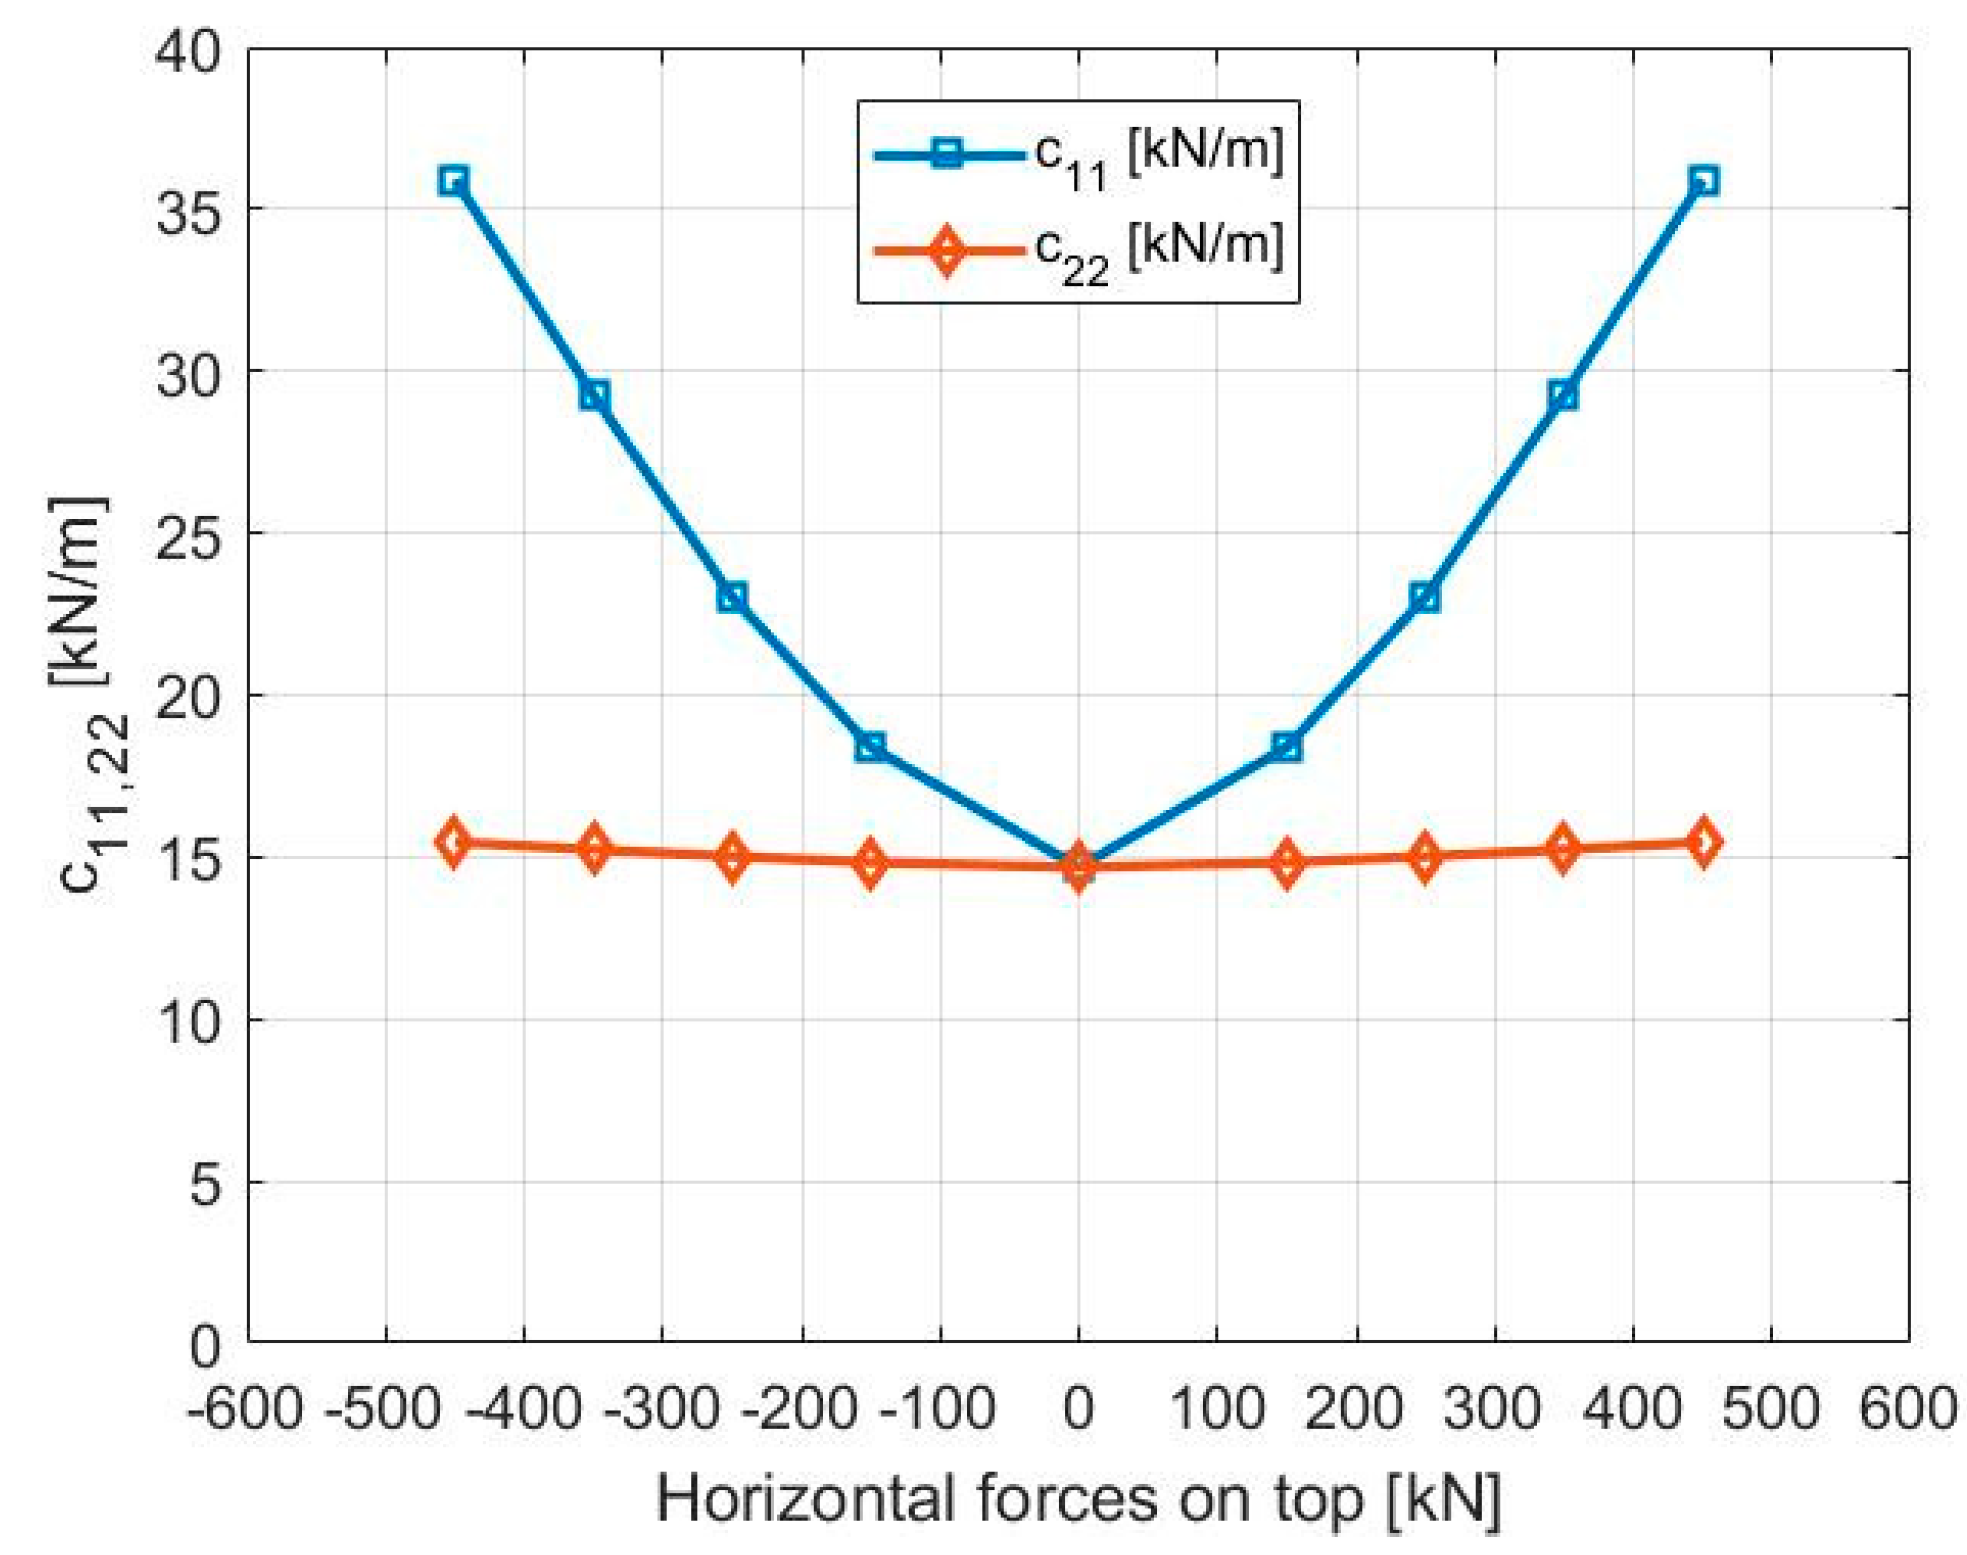
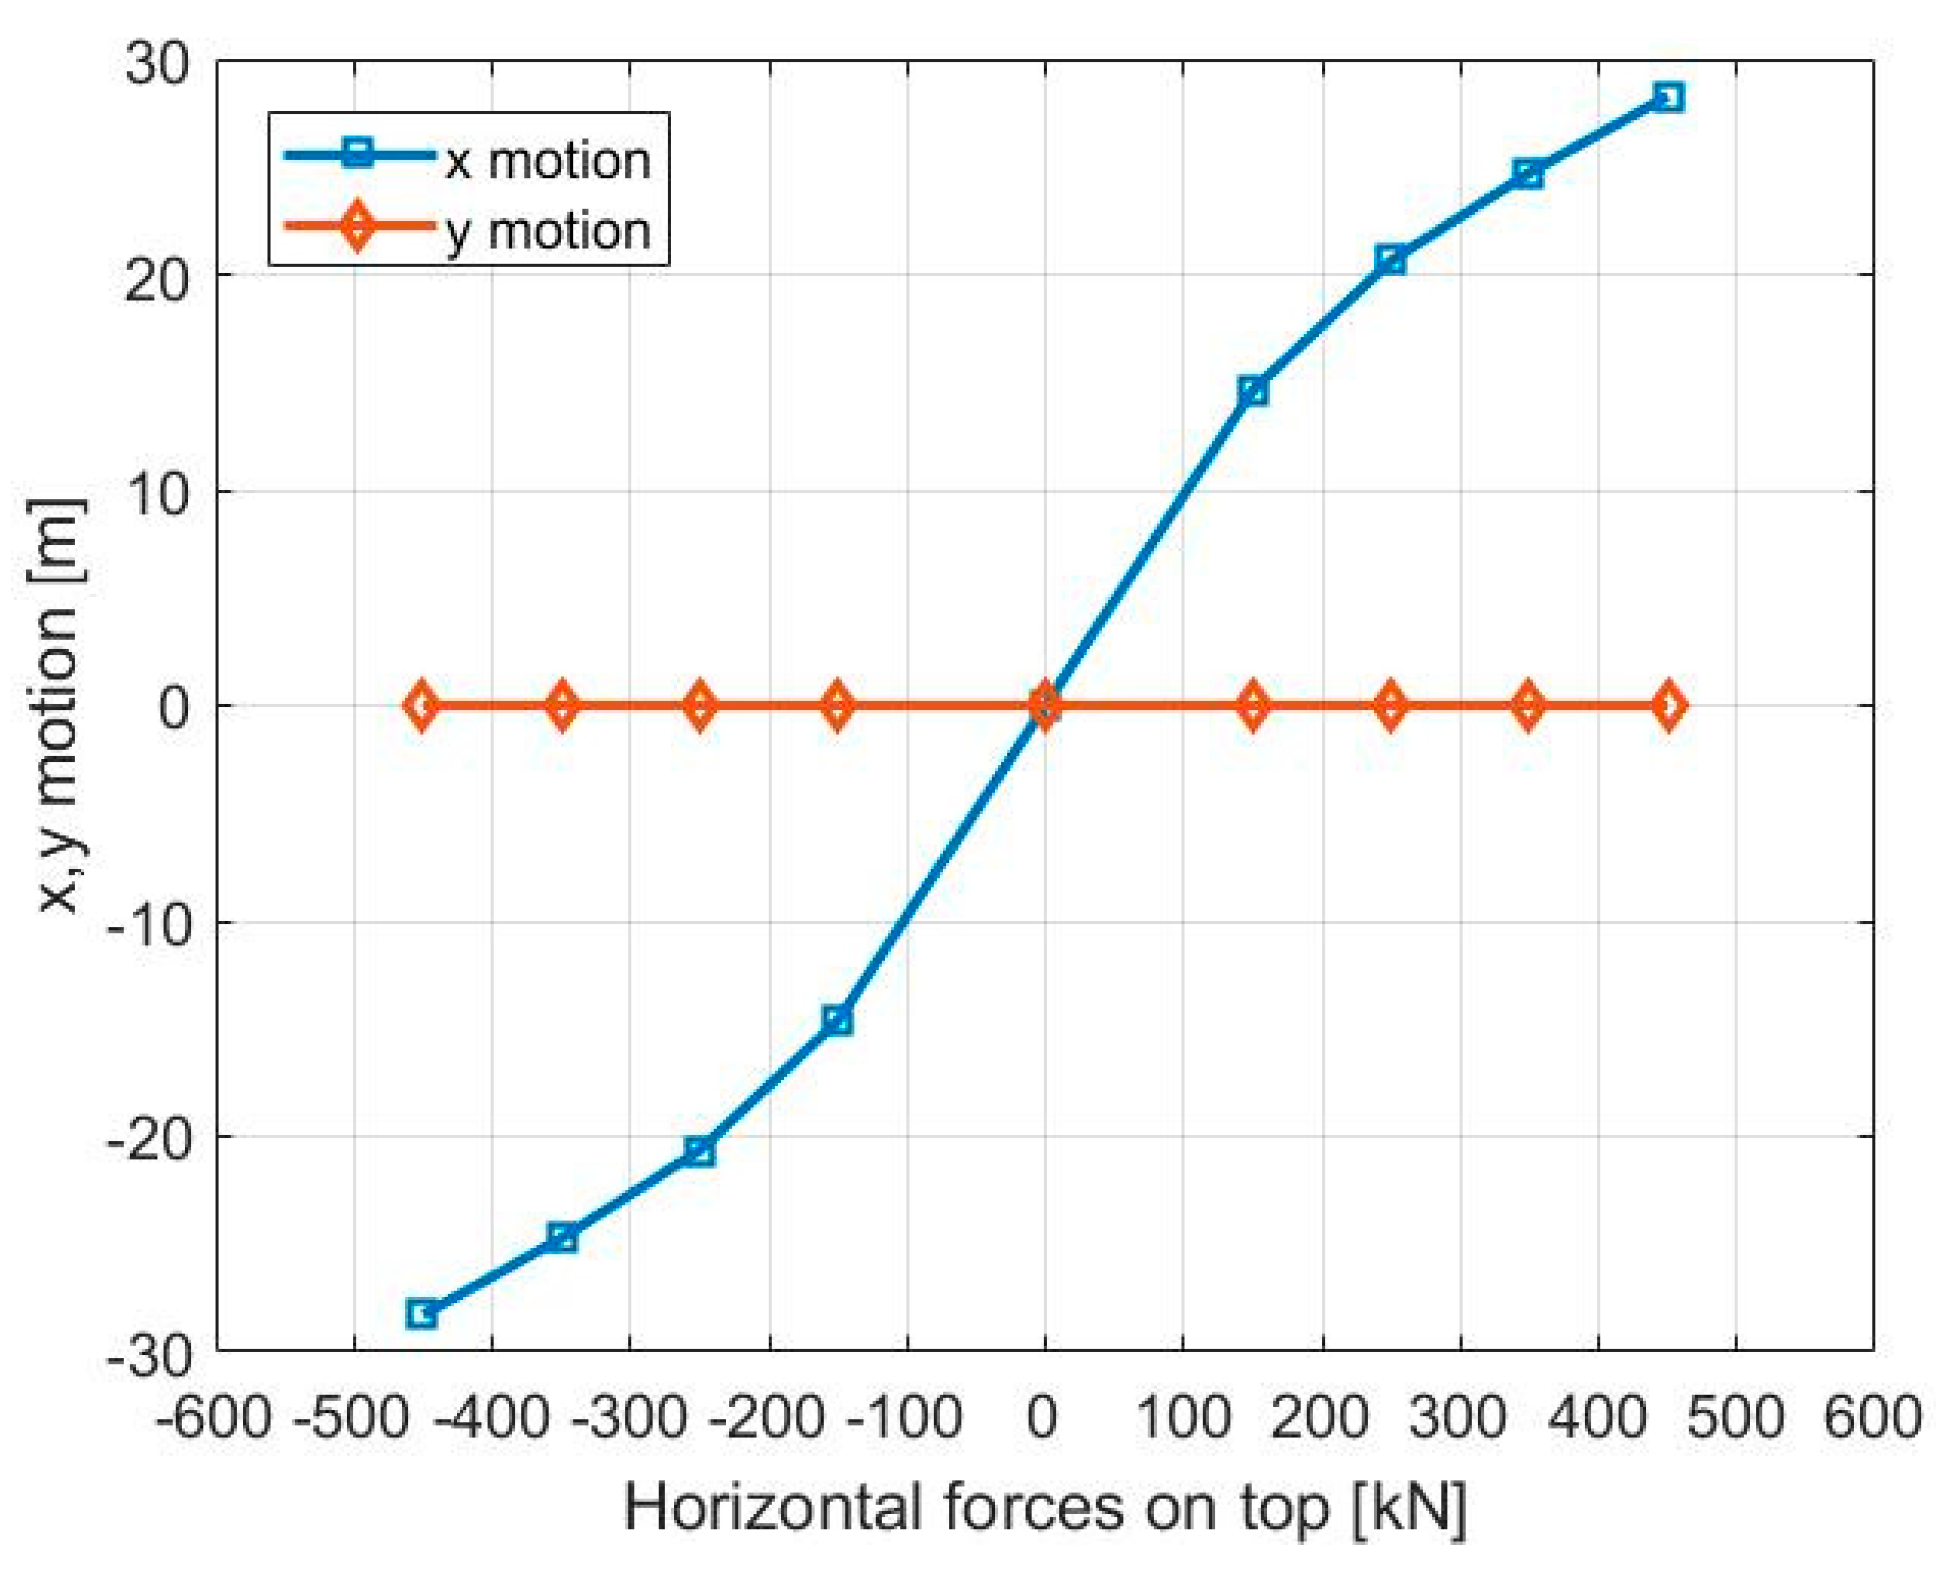
2.2. Mooring Coefficients

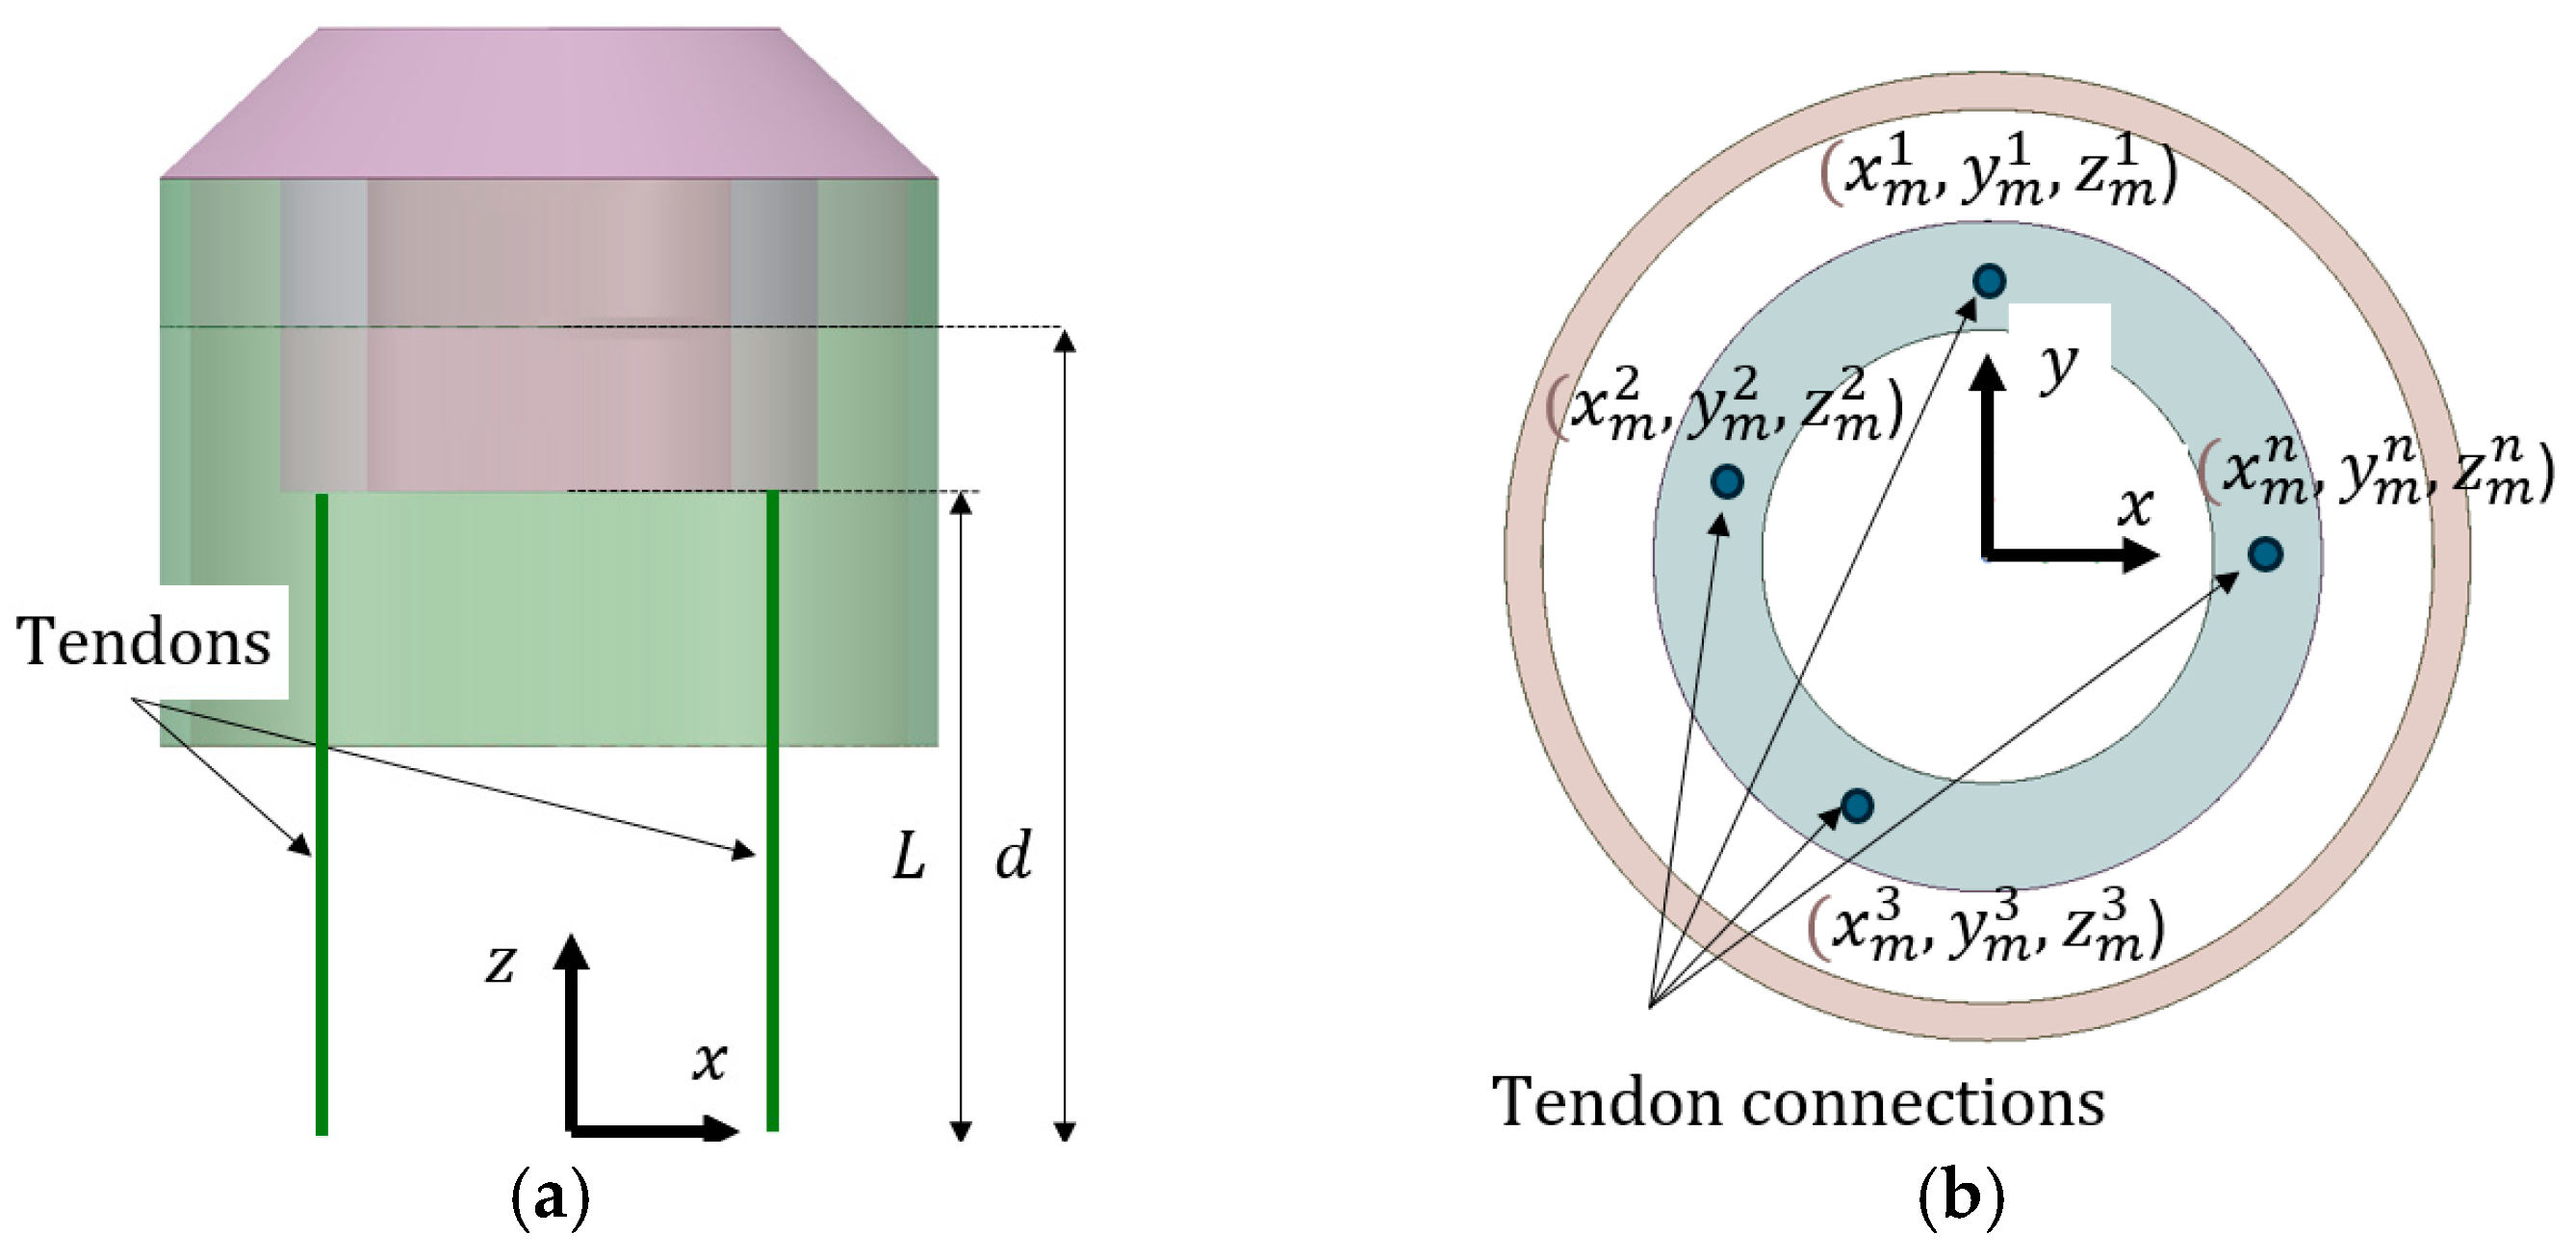
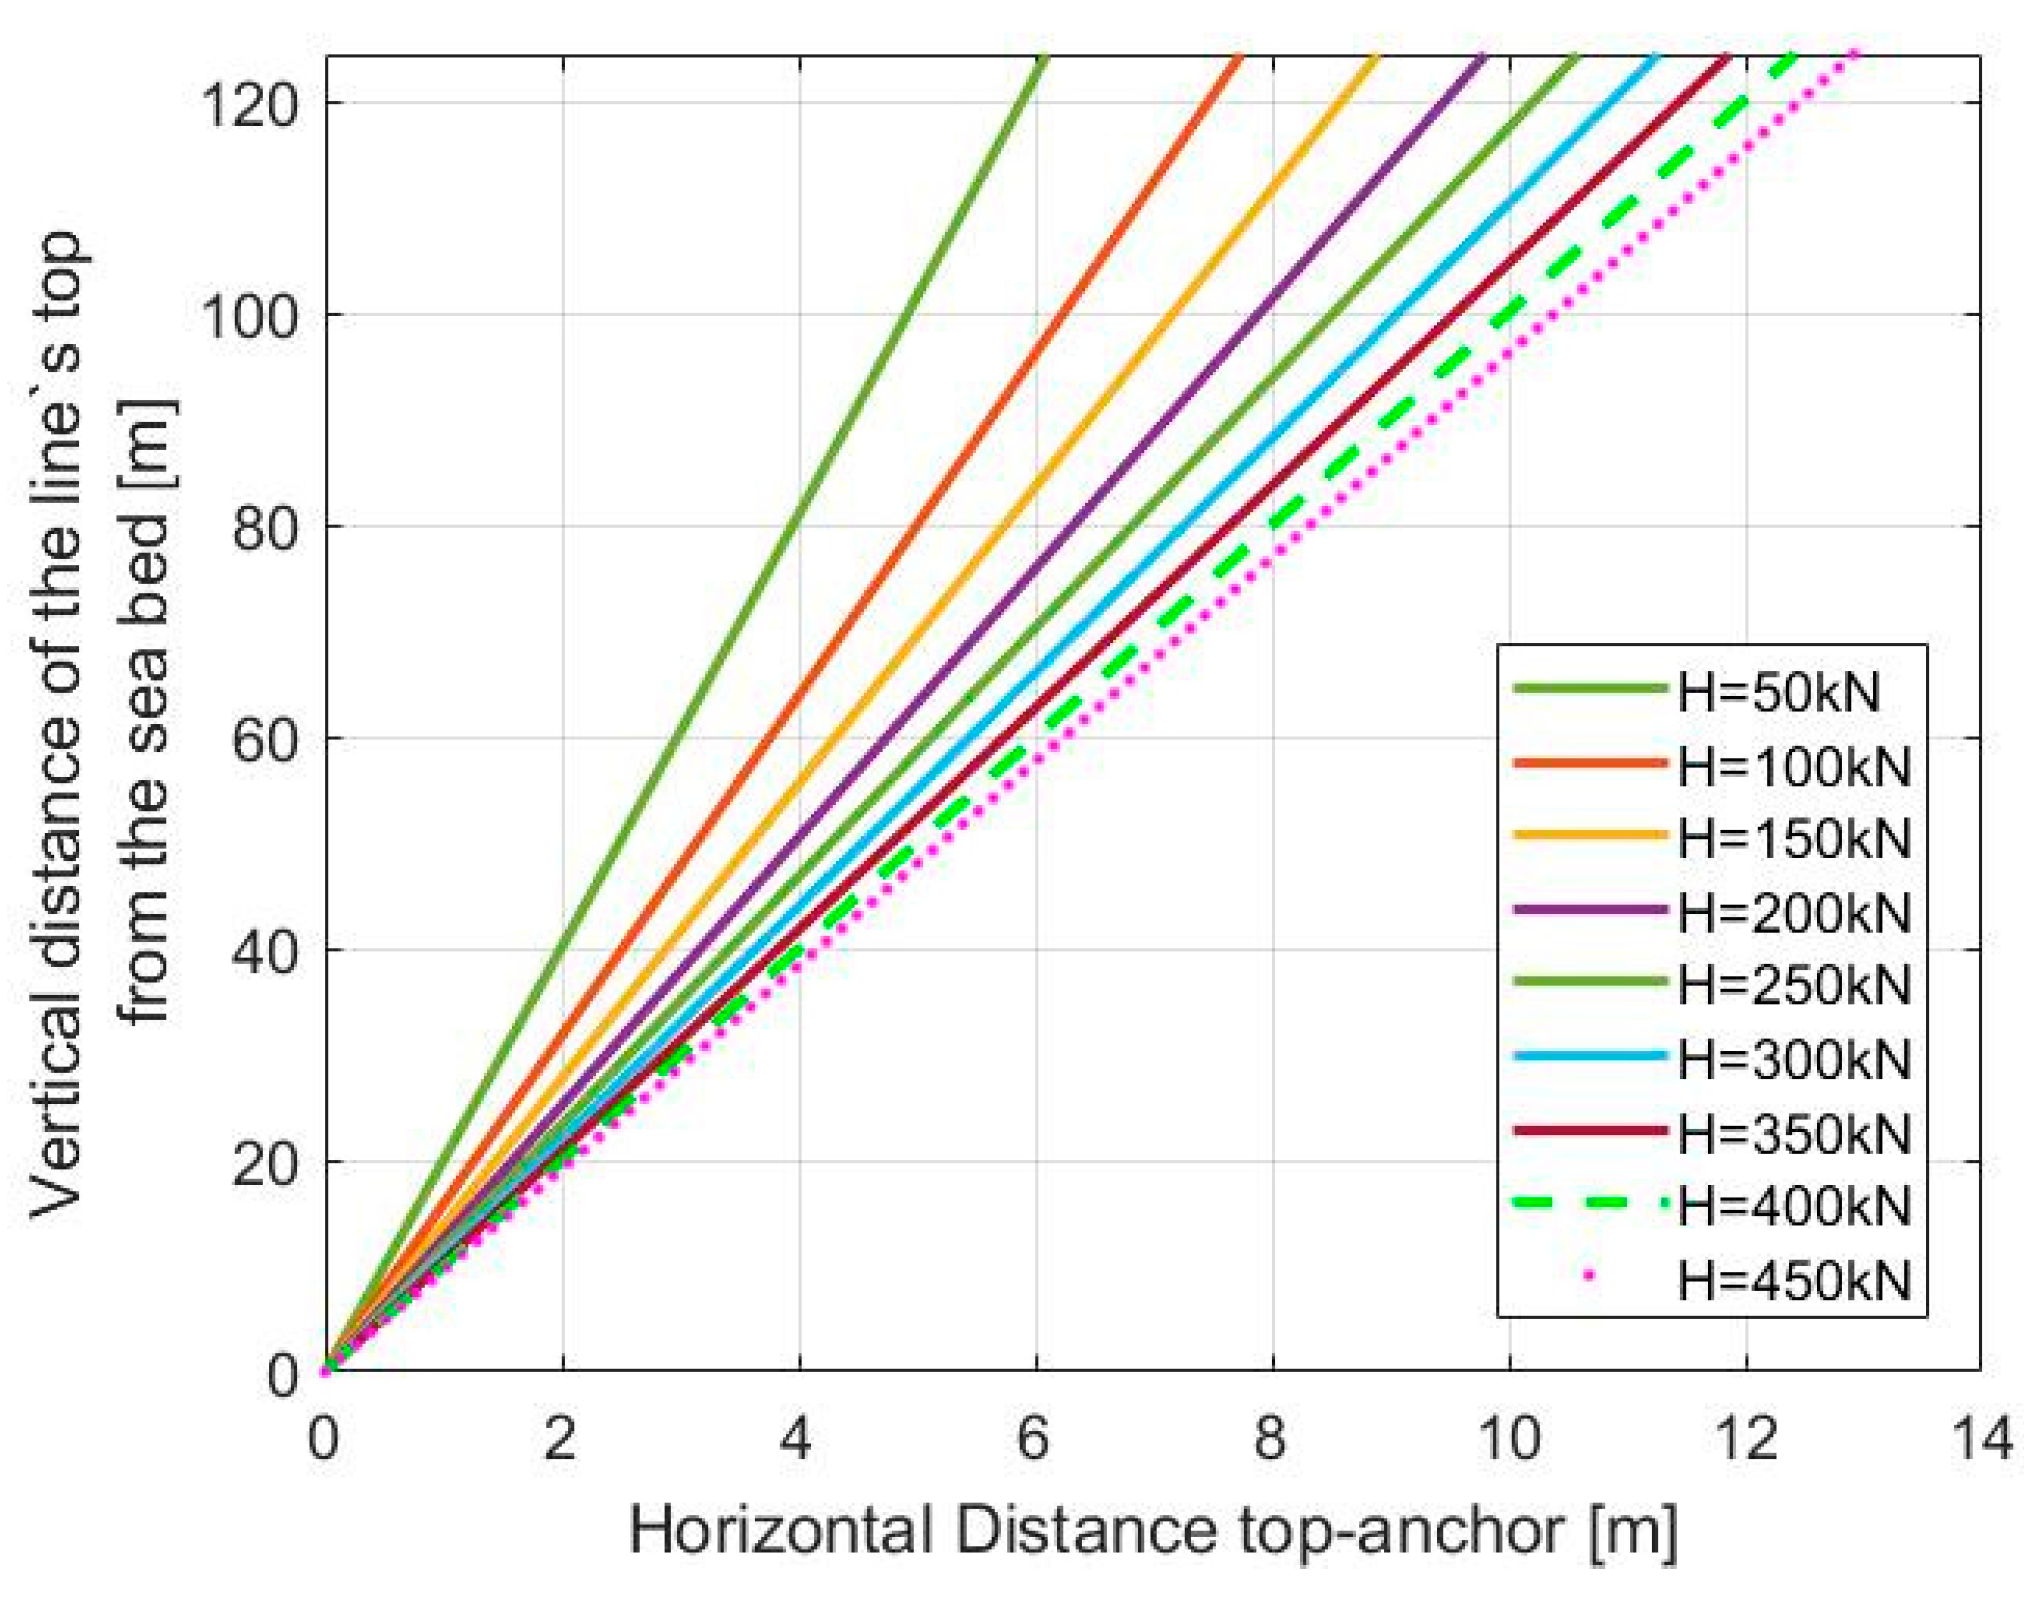
2.2.1. Tension-Leg Mooring System

The mooring system represents a crucial module in the effective absorption of wave energy by the OWC device. In the current subchapter, a TLP-type mooring system is employed. This system comprises of M tethers connected to the base of the interior coaxial cylindrical body of the OWC device (see Figure 4). The significant tension within the tension legs restricts the mean horizontal displacements to a minor percentage of the water depth, i.e., up to 5%. Furthermore, given the tendon’s high axial stiffness, the heave motions are considered negligible.
The mooring forces applied to the converter in the k th direction are determined by
f k m = c k j m ξ j 0 ,   i , k = 1 , , 6
In Equation (18), ξ j 0 stands for the component of the OWC motion in the j th direction relative to the converter’s reference point of motion, and c k j m are the mooring line stiffness coefficients, components of the 6 × 6 mooring stiffness matrix. Here, b k j m = 0 . These coefficients are evaluated by [54],
c i i m = n = 1 M c i i m , n ,   i = 1 , , 6
where
c 11 m , n = c 22 m , n = T n L ,         c 33 m , n = E A L
c 44 m , n = E I x x L T n z n ,         c 55 m , n = E I y y L T n z n
c 66 m , n = T n L ( x m n 2 + y m n 2 )
Here, M stands for the number of mooring tendons. In addition, in Equations (20)–(22), the term T n ,   n = 1 , , M denotes the pretension forces on the n mooring tendon. L is the tendon’s unstretched length; I x x ,   I y y are the converter’s moments of inertia about x and y axis, respectively. Also, x m n , y m n , z m n ,   n = 1 , , M denote the coordinates of the connection point of the n th tendon with the fairlead, measured from the converter’s reference point of motion. The other terms of the mooring line stiffness coefficients, c k j m , are provided in Appendix A.

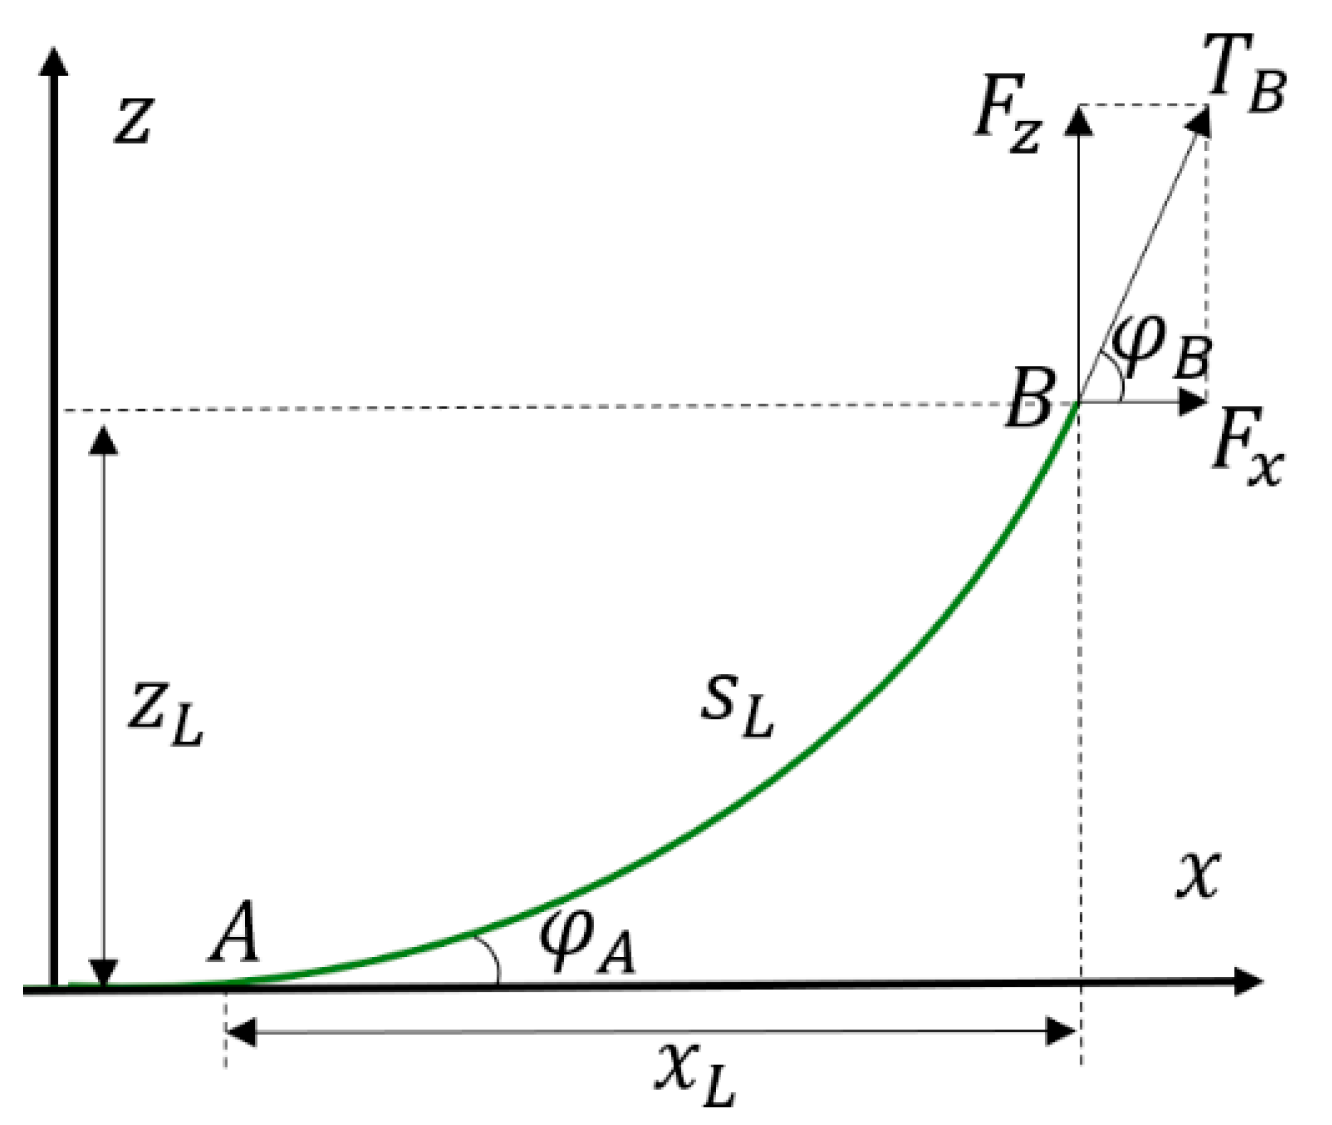
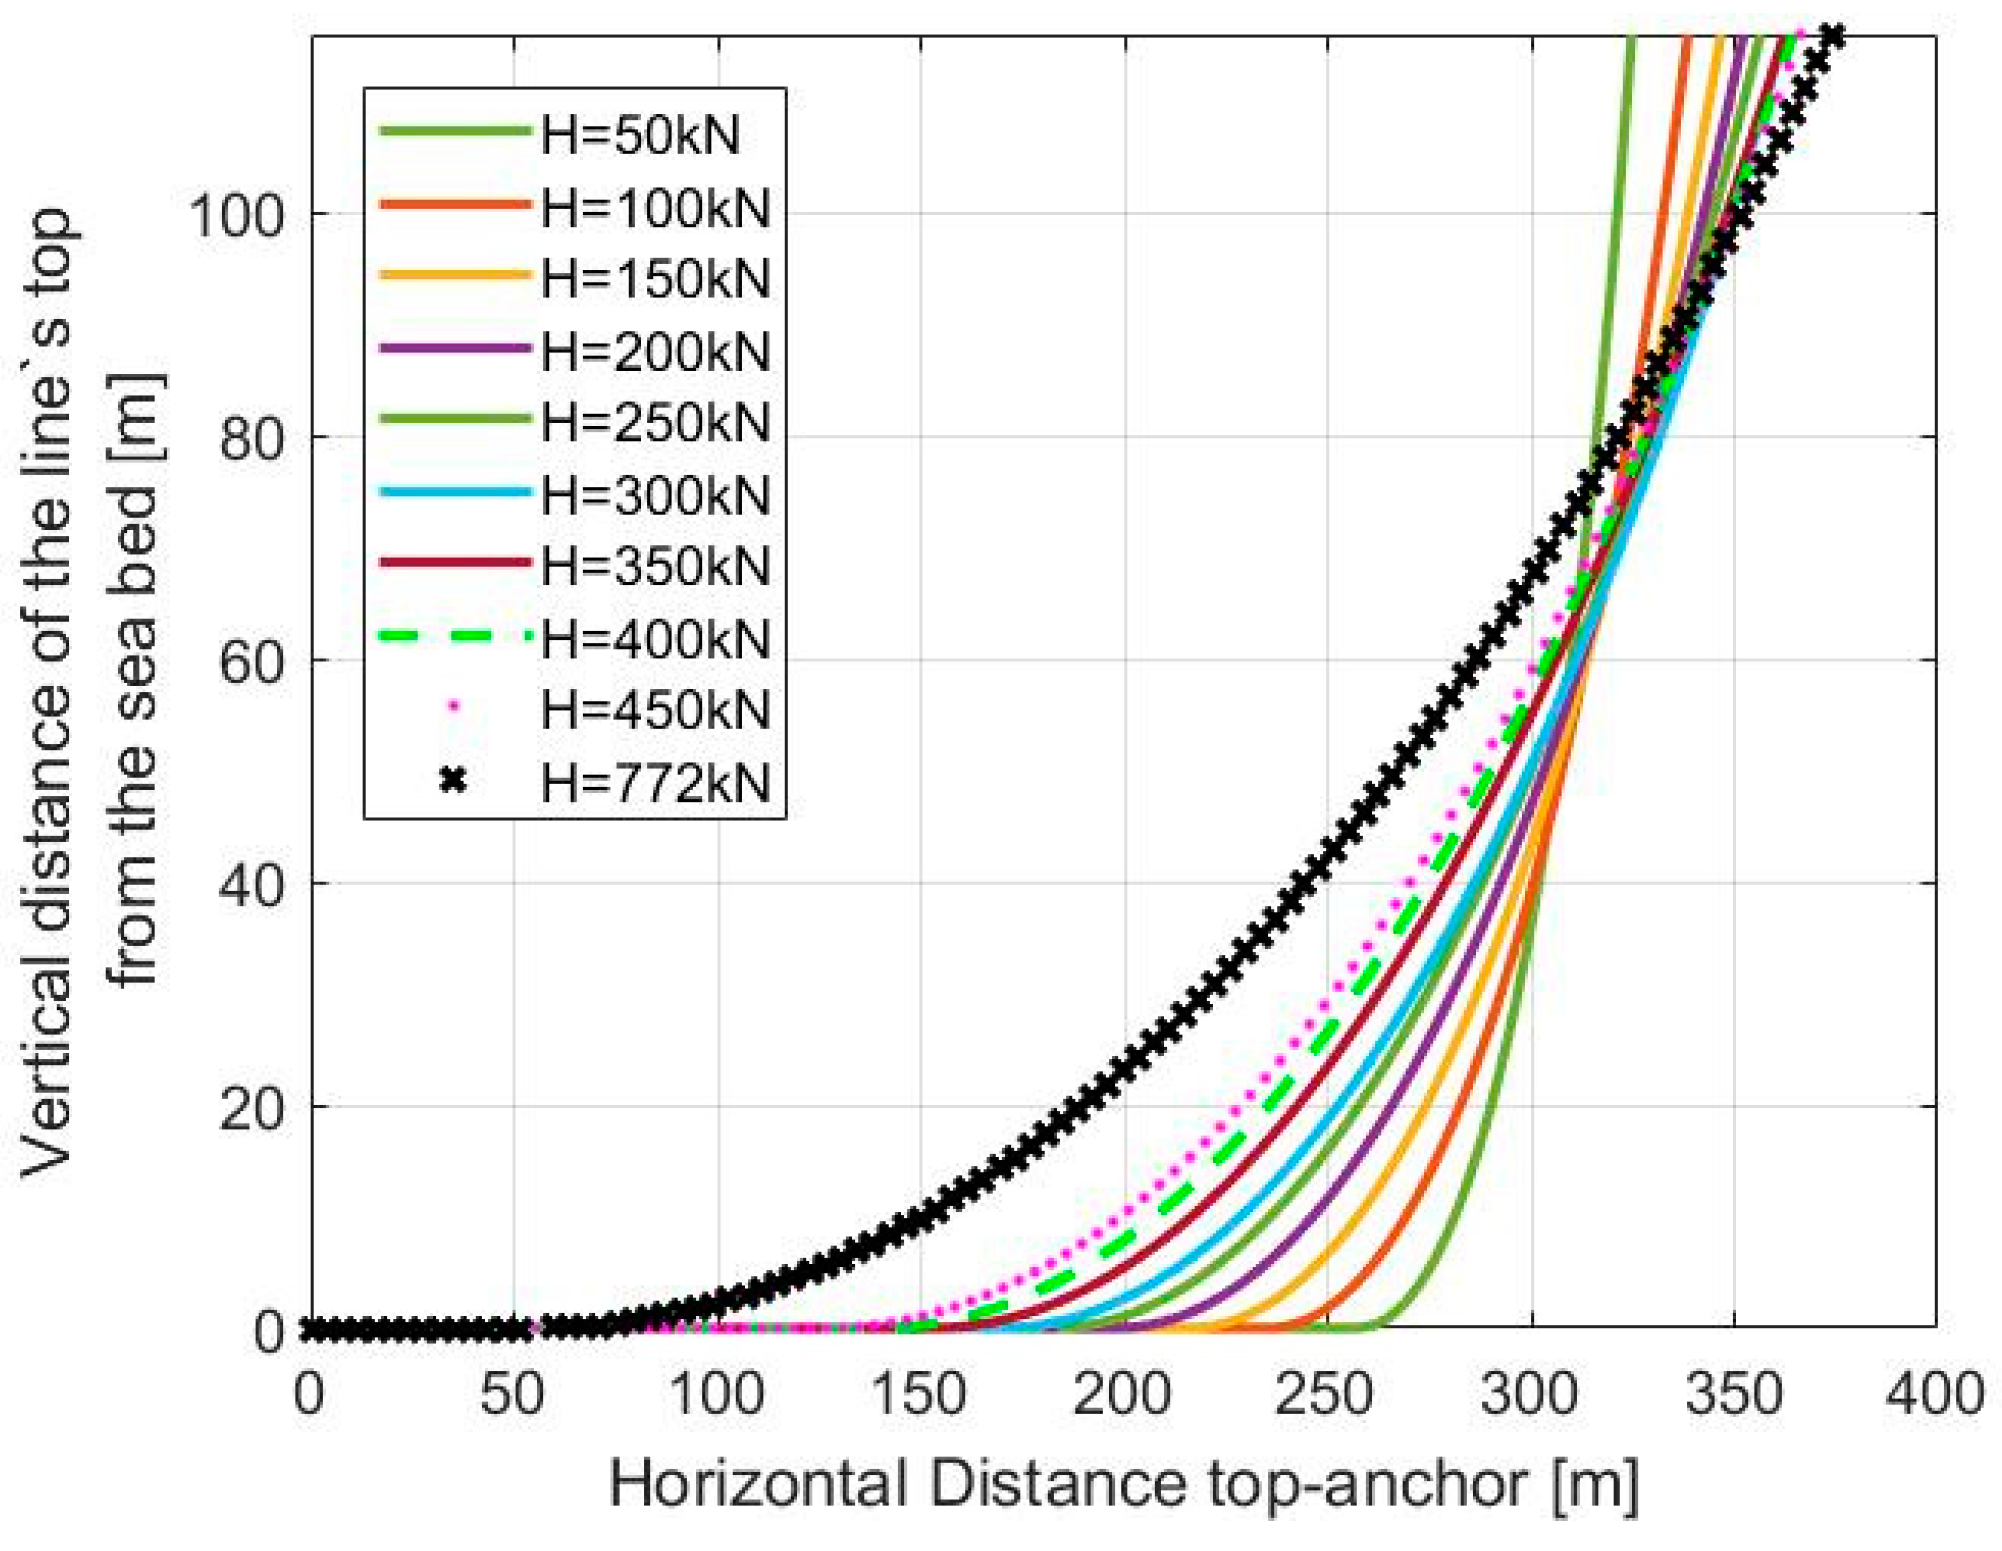
2.2.2. Catenary Mooring System

In this subsection, a catenary mooring system composed of M lines is proposed to secure the OWC converter. Due to the influence of gravity, the mooring lines extending between the converter and the seabed will exhibit the characteristic shape of a freely hanging line (see Figure 5). The catenary is suspended horizontally at the seabed and generates a restoring force on the motions of the OWC primarily through its weight.
The elements under consideration are classified as steel chains or steel wires, characterized by an unstretched length L , a diameter d m , and an elasticity modulus E . The global coordinate system of the mooring cable ( x , y , z ) is defined at the point where the vertical axis of symmetry of the body intersects with the undisturbed free surface (see Figure 6a). The position vector r represents the location of the n th line’s fairlead in relation to the coordinate system’s origin, while α n , n = 1 , , M (see Figure 6b) designates the orientation angle of the n th line within the horizontal plane. Furthermore, there exist M local coordinate systems ( x m n , y m n , z m n ) , n = 1 , , M positioned at the junctions connecting the moorings to the body. It is worthwhile to note that the angle is determined by the positive x -axis and x m n through a counterclockwise rotation of the x -axis until it aligns with the positive axis of x m n (refer to Figure 6b).
The mooring forces exerted on the converter in the k th direction are determined by
f k m = ( c k j m + i ω b k j m ) ξ j 0 ,         i , k = 1 , , 6
In Equation (23), c k j m represents the overall restoring mooring stiffness that is applied to the converter, while b k j m denotes the total mooring lines’ damping. To assess these coefficients, it is necessary to appropriately extend the established quasi-static approximation, which is grounded in the static analysis of each line and enables the estimation of the mooring stiffness exerted on the floating structure at zero excitation frequency by incorporating the dynamic behavior of the line.
Specifically, the restoring mooring stiffness matrix of each line n = 1 , , M , in relation to the line’s coordinate system’s origin, can be expressed as
c ¯ 11 m , n = w s i n h ε ε sinh ε + 2 ( 1 cosh ε )
c ¯ 13 m , n = c ¯ 31 m , n = w ( c o s h ε 1 ) ε sinh ε + 2 ( 1 cosh ε )
c ¯ 33 m , n = w ( ε c o s h ε s i n h ε ) ε sinh ε + 2 ( 1 cosh ε )
c ¯ 22 m , n = F x x L
In Equations (24)–(27), the term w stands for the weight per length of the mooring line, whereas ε is determined by the following equation:
ε = w x L + F z s L 0 w F x
In Equations (27) and (28), F x and F z represent the horizontal and vertical components of the tension forces at the line’s upper extremity, x L denotes the horizontal projection of the suspended mooring line, while s L 0 signifies the length of the suspended mooring line under pretension conditions. Specifically, it holds
x L = F x w s i n h 1 F z F x s i n h 1 F z w s L F x + F x s L E A
In Equation (29), s L is the length of the suspended line at any loaded condition, while A is the cross-sectional area of the mooring line.
Further information regarding the total restoring mooring stiffness, expressed at the converter’s reference point of motion, is provided in Appendix B.
The motion of the converter within the fluid medium facilitates energy dissipation, providing the moored OWC with an additional form of damping, referred to as mooring damping, which results from the drag and viscous forces exerted on the mooring lines. The dynamic tension F l j d at the top of the line related to the sinusoidal movements of the upper end, characterized by an amplitude A j , can be expressed as
F i j d A j = c ¯ m , i j + i b ¯ m , i j , i , j = 1 , , 6
In Equation (30), c ¯ m , i j and b ¯ m , i j are dependent on frequency and excitation amplitude, representing the real and imaginary components of F l j d A j . It should be noted that these coefficients are expressed in relation to the coordinates of the attaching point of each line with the fairlead.
To determine the overall frequency-dependent restoring stiffnesses of the mooring system, c k j m , and the corresponding total damping components, b k j m , as seen in Equation (23). When only quasi-static considerations are taken into account, then c k j m is equivalent to c i j m , as referred to in Equation (A10) in Appendix B. In case when the dynamics of the mooring lines are incorporated, then c k j m equals to c ¯ m , i j in Equation (30). In the latter scenario, the additional terms b k j m is represented as b ¯ m , i j / ω when expressed within the converter’s reference point of motion.
The process of coupling the mooring models with the hydrodynamic formulation was previously described in [55], specifically concerning a floating breakwater. This methodology is now extended to encompass a dual-chamber OWC. Primarily, the responses/rotation ξ j 0 of the converter are assessed as if it were floating without any mooring limitations, specifically considering zero values for the b k j m and c k j m terms, which are then incorporated into the dynamic model of the mooring system. Consequently, the dynamic tensions are computed based on the specific parameters of the body’s motions. Following this, the values of b k j m and c k j m are introduced into the hydrodynamic analysis, leading to the determination of new ξ j 0 values, denoted as ξ j 0 ( 2 ) . This iterative process continues until the differences between the newly computed ξ j 0 ( N ) values and the previously determined ξ j 0 ( N 1 ) values fall below a specified convergence threshold,
ξ j 0 ( N ) ξ j 0 ( N 1 ) < ε
where Ν represents the iteration-cycle number and the value of ε is contingent upon the desired accuracy of the solution applied. This parameter must be carefully chosen to balance computational efficiency with the precision required for the specific application, ensuring the iterative process converges effectively while meeting the established accuracy criteria.
Equation (31) ensures that the coupling achieves a stable solution that accurately reflects the interactions between the moorings and the hydrodynamic responses of the dual-chamber converter. The iterative process is essential for refining the coupling until the hydrodynamic effects and mooring dynamics are harmoniously integrated, resulting in a comprehensive analysis of the system’s behavior under various operational conditions.

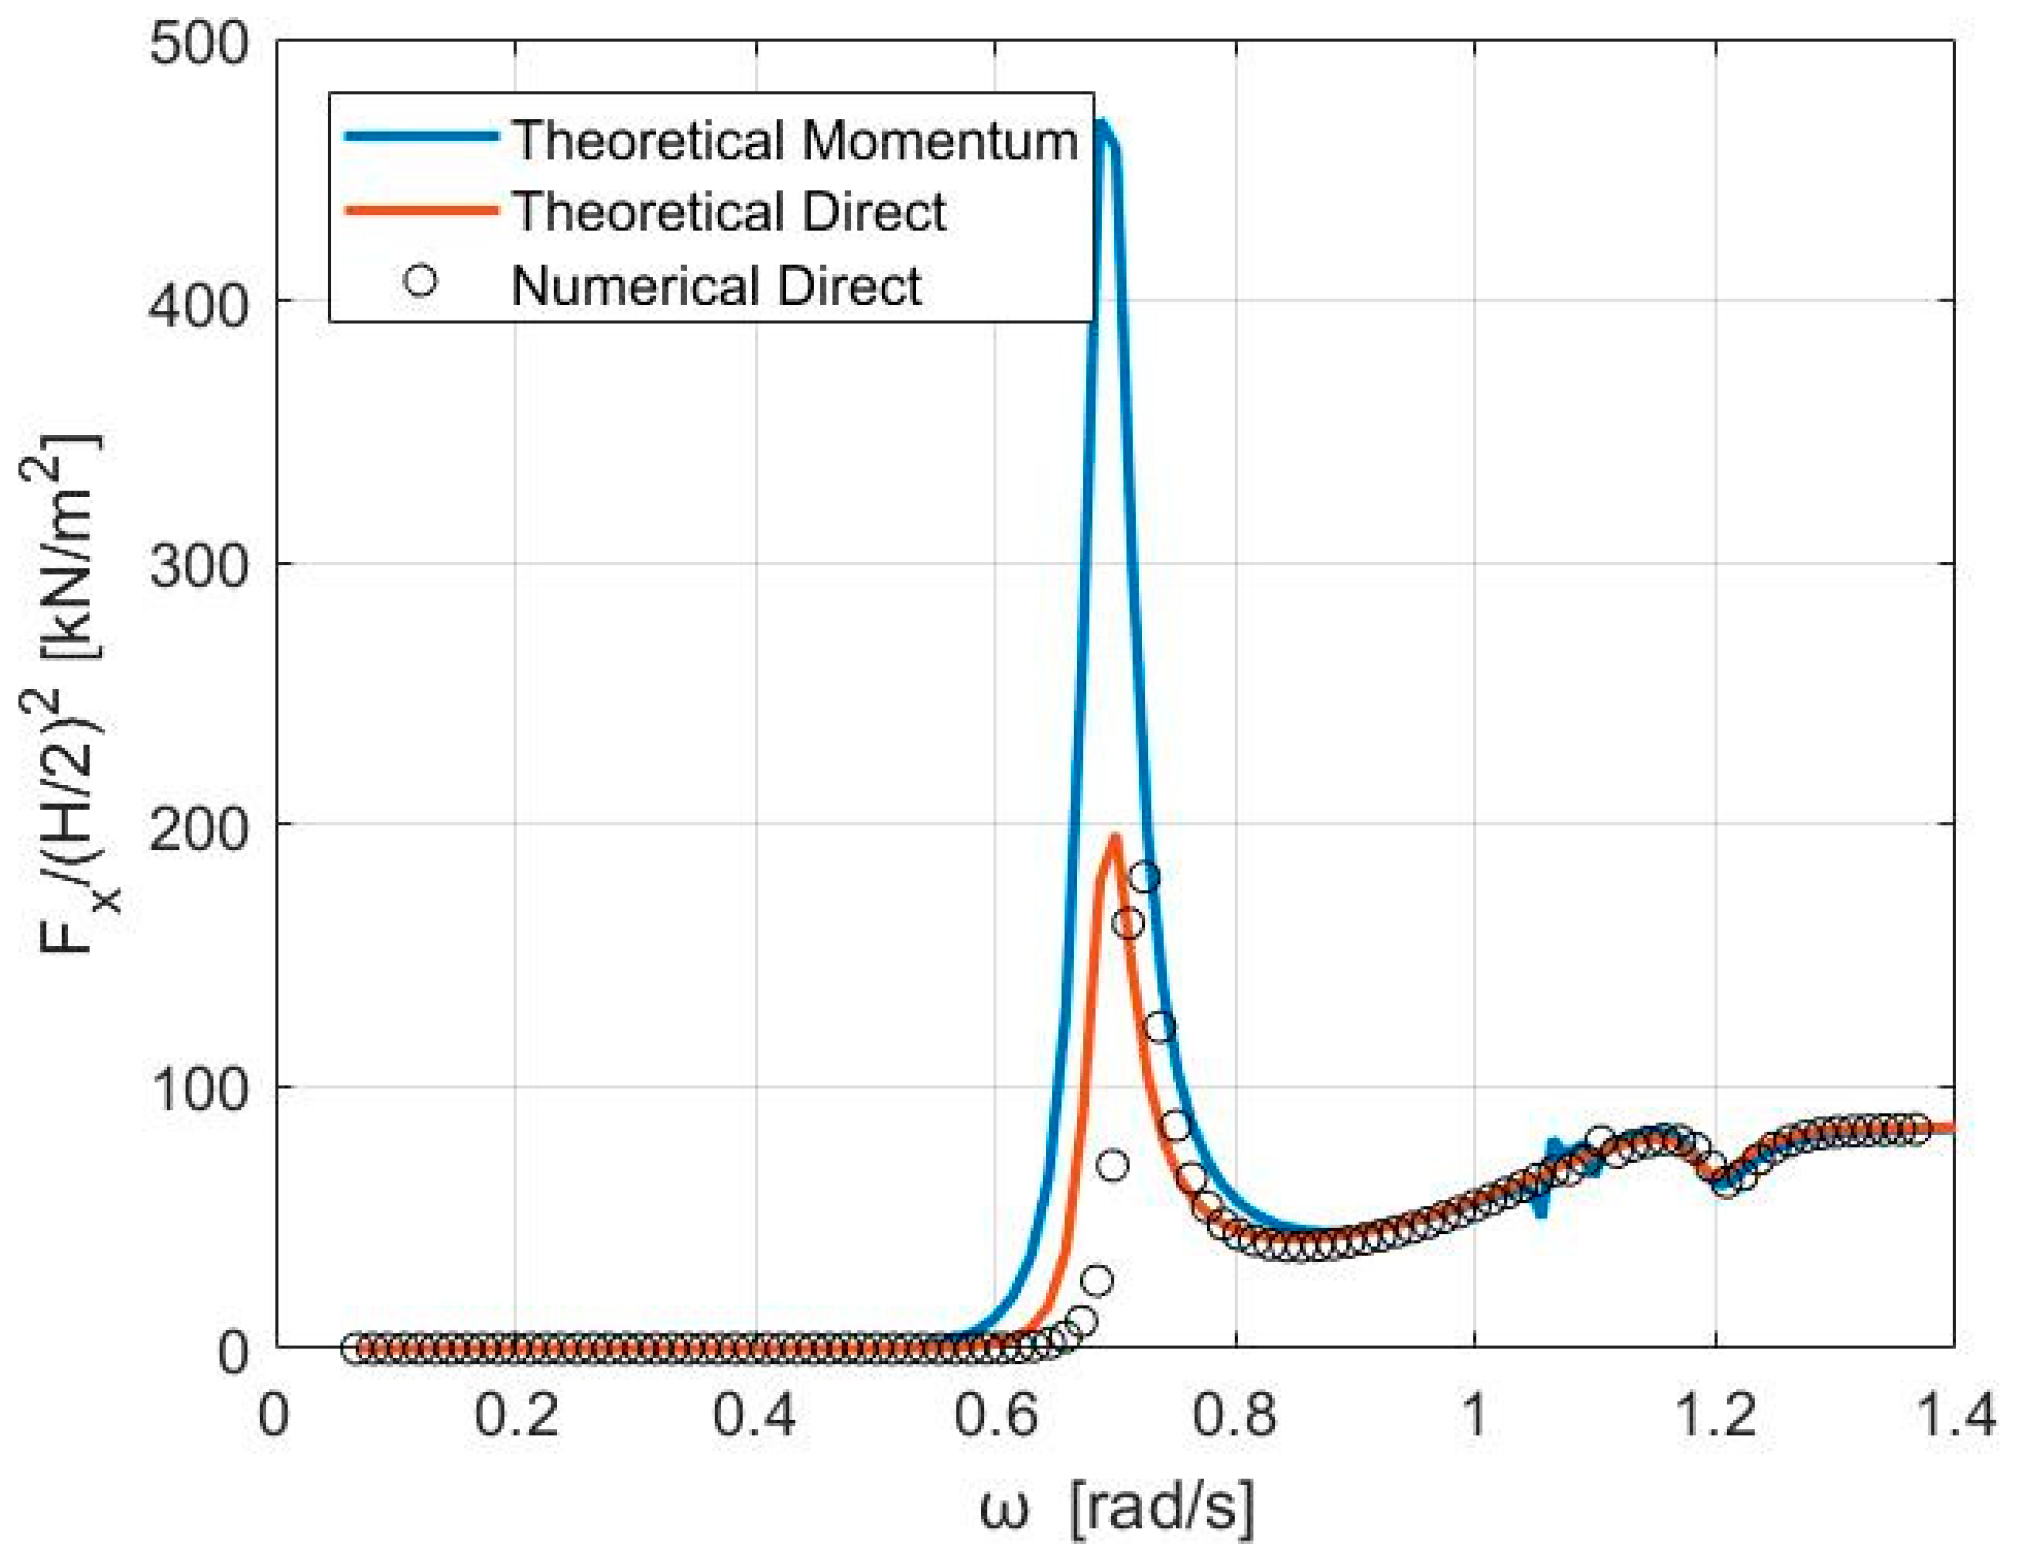
3. Results Validation

This section validates the theoretical formulation by comparing its results with those obtained from the commercial software ANSYS AQWA (R21). ANSYS AQWA, which is part of the ANSYS Mechanical Enterprise suite, utilizes potential flow theory for diffraction and radiation analyses [56]. Numerical simulations conducted with ANSYS AQWA, using 31,296 elements, required approximately three minutes of computational time per wave frequency, whereas the FORTRAN-based theoretical formulation completed the task in less than one second. The accuracy of the theoretical model in predicting diffraction and radiation phenomena—including exciting forces and moments acting on the dual-chamber OWC and its hydrodynamic characteristics—has been previously validated in [39]. Figure 7 illustrates a comparison of the horizontal mean drift forces calculated through both momentum conservation and direct pressure integration methods with those obtained from ANSYS AQWA. Similarly, Figure 8 illustrates a comparison of the motions of the freely floating dual-chamber OWC. It is noteworthy that, in all analyses presented herein for comparison purposes, the internal chamber air pressure is assumed to be equal to atmospheric pressure. The exceptional agreement observed in these comparisons demonstrates that the theoretical analysis accurately predicts the diffraction and radiation flow fields surrounding the dual-chamber OWC. It should be noted that some discrepancies between the theoretical and numerical results in the neighborhood of the resonant frequency of the heave motion (refer to Figure 8b) may be considered negligible, a trend that has been observed in [41]. Concerning the differentiation in the horizontal drift forces between the two theoretical formulations (refer to Figure 7, these variations can be attributed to the differing methodologies employed.

4. Numerical Simulations

The aim of this chapter is to perform a comparative analysis of two mooring configurations: the catenary mooring system and the TLP mooring system. This comparison is primarily focused on their efficiency in maximizing the absorbed wave energy by the OWC device. To ensure a consistent evaluation, the following design specifications have been applied to both mooring systems:
Maximum horizontal design load: The maximum horizontal design load is defined as the sum of the mean surge drift force due to waves F D ; the mean wind thrust F T ; and the mean surge drag force due to waves F D R . The latter are determined using Equations (32) and (33) as follows [57]:
F T = 1 2 ρ a i r A C Τ V 2
F D R = 2 3 π ρ C D ( 2 a 4 ) ω p 2 ζ α 3
Here, ρ a i r is the density of air. C T is the thrust coefficient, considered equal to 0.8 in this study; V is the rated wind speed. A represents the device’s swept area (i.e., π a 4 2 , refer to Figure 1). Also, C D is the drag coefficient, taken as C D = 1 ;   ρ is the water density. ζ α is the significant wave amplitude and ω p = 2 π / Τ p , where Τ p is the wave peak period. The environmental parameters, ζ α ,   Τ p and V , are based on the 50-year contour conditions for a specific location in Italian waters at coordinates 37.30° N, 12.69° E [58]. Specifically, it holds ζ α = 3.75   m , Τ p = 11.9   s , and V = 21.52   m / s . Consequently, the maximum horizontal design load is calculated to be 450 kN.
Number of mooring lines: Each mooring configuration utilizes a comparable number of mooring lines, specifically four lines.
Ratio of the maximum tension to the MBL: The maximum tension in the mooring lines remains below 0.3 of their minimum breaking load (MBL).
Installation location: The OWC converter is proposed for installation in Italian waters, located at coordinates 37.30° N, 12.69° E [58]. The selected location corresponds to a water depth of approximately 130 m.

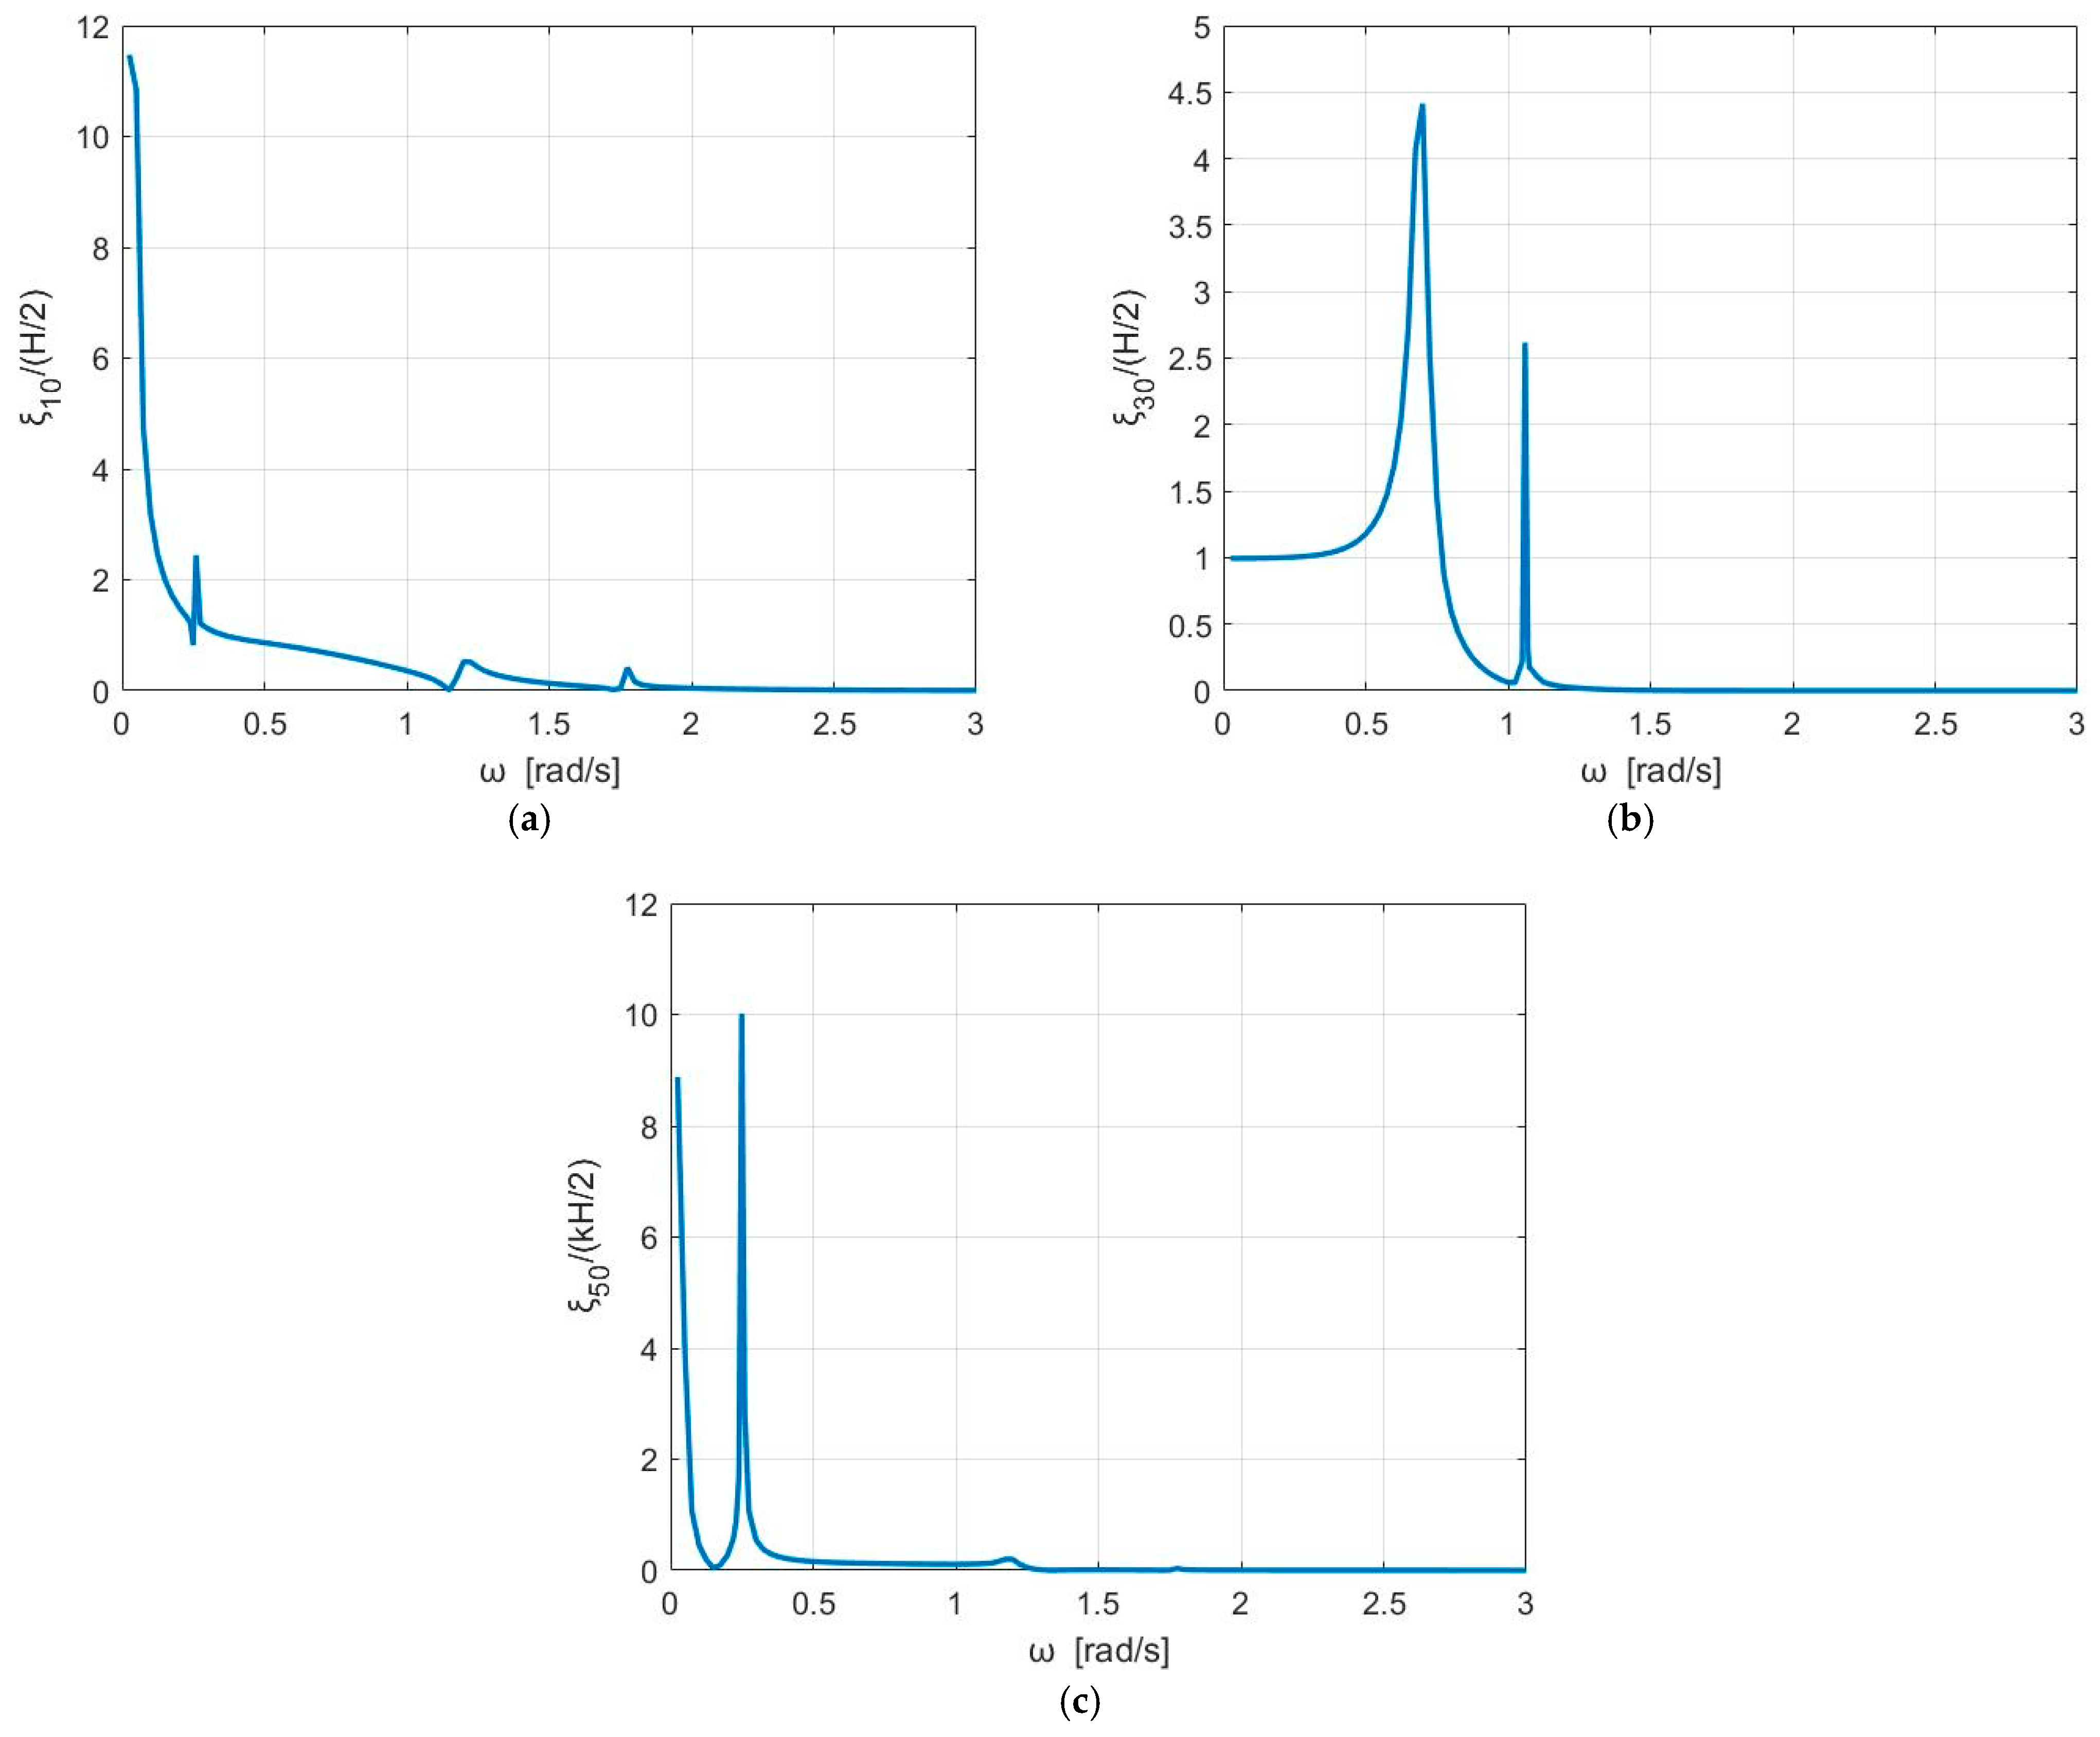
4.1. Mooring Case: Catenary

In this subchapter, the analyzed dual-chamber OWC device is secured using a symmetrically arranged system of four catenary mooring lines, which is comprised of Studless R3 chain. The mass of the line in air is 199.0 kg/m, while its weight in water is 1697.13 N/m, corresponding to a mass of 173.0 kg/m when submerged in water. The axial stiffness of the lines is established at 854 MN, and the minimum breaking load is noted to be 8028 kN. Additionally, the nominal diameter of the lines measures 100 mm, and the unstressed length of each line is 400 m. The angle formed by each line in the x , y plane with respect to the x axis is π/2, while the angle between the line and the seabed remains 0, for applied load at the top of the line lower or equal to 450 kN. For the initial analysis, the mooring lines are considered to be subjected solely to pretension loads. Table 2 provides a summary of the mooring characteristics of each line.
Figure 9 presents an analysis of a single line within the steel chain mooring system. This figure specifically illustrates the total force acting on the line’s top, as well as its horizontal and vertical components at the fairleads, in relation to varying horizontal displacements of the chain’s upper end from its equilibrium position at a designated pretension level, i.e., T = 297 kN. Furthermore, Figure 10 depicts the configuration of the mooring line under different values of tension forces applied to its upper end.
Figure 9 illustrates that the horizontal, vertical, and total forces acting on the line at the fairlead location fluctuate within a range of [−13 m, 27 m] from its equilibrium position under a designated pretension level of T = 297 kN. Moreover, as shown in Figure 10, an increase in the horizontal force at the top of the line corresponds to an increase in the suspended line length. Additionally, considering a maximum horizontal design load of 450 kN at the top of the line, Figure 10 demonstrates that the segment of the line lying on the seabed constitutes 30.5% of the total mooring line length. This proportion exceeds the minimum typical threshold of 10–15%.
A quasi-static analysis is formulated for the multi-leg configuration, consisting of four steel chain mooring lines attached to the base of the OWC converter (refer to Figure 6). The system’s stiffness coefficients in response to horizontal excitation of the converter are presented in the following figures. Specifically, Figure 11 illustrates the c 11 m and c 22 m stiffness coefficients for various horizontal forces acting on the converter. Figure 12 depicts the horizontal excursion in the x- and y-directions under varying horizontal forces applied to the OWC.
Figure 11 indicates that the c 11 m stiffness coefficient does not exhibit a linear variation. In contrast, the c 22 m stiffness coefficient demonstrates a more linear variation. Regarding Figure 12, it is observed that the horizontal excursion in the x-direction reaches higher values compared to the corresponding excursion in the y-direction. Additionally, it is noted that the mean (quasi-static) maximum offset under intact conditions of the OWC is x m e a n = 28.3 m when subjected to the maximum mean horizontal design load of ±450 kN.
Figure 13 presents the stiffness coefficient c 55 m resulting from the exciting moment in yaw, while Figure 14 illustrates the rotation of the converter under various exciting moments in yaw. It can be observed from Figure 13 that the variation of c 55 m follows a more linear pattern compared to c 11 m (as shown in Figure 11). Additionally, Figure 14 demonstrates that the mean rotation angle of the converter under different yaw exciting moments varies within the range of [2 deg, 37 deg]. Notably, the rotation angle ϕ_rotation reaches its maximum value of 37 deg for a yaw-exciting moment of 4500 kN m.
The characteristic offset x c of the examined OWC is taken as the larger values of [54],
x c = x L F M + x W F S + x m e a n
x c = x L F S + x W F M + x m e a n
where x m e a n is the mean (quasi-static) maximum offset under intact conditions (i.e., x m e a n = 28.3 m). x L F M and x L F S are the most probable maximum- and significant-low frequency motions of the upper point of the mooring line, respectively, whereas, x W F M ,   x W F S are the most probable maximum- and significant-wave frequency motion, respectively.
From the solution of Equations (14) and (16), the motions of the OWC are determined. Figure 15 depicts the horizontal, ξ 10 / ( H / 2 ) , and vertical, ξ 30 / ( H / 2 ) , motions and the horizontal rotations, ξ 50 / ( k H / 2 ) , of the converter. The results are standardized by the wave amplitude H / 2 and the wave number k .
Starting with the surge motion ξ 10 / ( H / 2 ) , it is evident (refer to Figure 15) that it achieves a peak at ω = 0.25 rad/s. This peak can be attributed to the mooring restoring stiffness, which establishes a resonance condition in the surge motion at this wave frequency. Furthermore, the surge exciting force is observed to reach 0 at ω = 1.175 rad/s. At this wave frequency, the value of k α is 1.83, which is in the vicinity of the wave number, which nullifies the derivative of the Bessel function of first kind, i.e., J 1 ( k α ) , associated with sloshing phenomena.
The heave motion ξ 30 / ( H / 2 ) (refer to Figure 15b) begins its variation from unity as ω approaches 0. Additionally, the natural frequency of the heave motion is prominently depicted in the figure, corresponding to the resonant peak at ω = 1.05 rad/s. Figure 15c illustrates the converter’s pitch motion. In this representation, the mooring resonance at ω = 0.25 rad/s is evident, along with the negligible influence of the sloshing phenomena on ξ 50 / ( k H / 2 ) .
Figure 16 illustrates the mean drift forces acting on the OWC at the surge direction as derived from two methodologies: the momentum principle and the direct integration method. The figure displays the mean drift forces experienced by both the moored converter and the OWC that is restrained from wave impact. It is evident that there is a strong agreement between the two methodologies for the floating case. Any discrepancies observed between the methodologies in the vicinity of the peak values of F x ( 2 ) ¯ are considered negligible. Furthermore, in the restrained case, it is apparent that the horizontal forces predicted by both methods are in excellent agreement with one another.
The most probable maximum- and significant-wave frequency surge motions are derived by the results of Figure 15 applying Jonswap spectrum S ( ω | H s , T p ) for a significant wave height H s = 7.5   m and a peak period Τ p = 11.9   s [59]. Specifically, the wave frequency surge motions x W F are evaluated by
x W F = 0 ξ 10 H / 2 2 S ( ω | H s , T p ) d ω
In addition, the most probable maximum- and significant-low frequency motions of the upper point of the mooring line are derived by the mean square value of the surge motion [60].
σ x 2 = 0 S F ( μ ) c 11 m ( m 11 + a 11 ) μ 2 2 + b 11 2 μ 2 d μ
In Equation (37), the expression b 11 stands for the hydrodynamic damping coefficient in surge due to forced oscillation of the device in surge direction. The term c 11 m denotes the mooring restoring coefficient in surge; the sum ( m 11 + a 11 ) stands for the sum of the mass of the converter with the hydrodynamic added mass in surge direction due to forced oscillation of the device in surge direction. Also, S F ( μ ) is the spectral density of the low-frequency horizontal drift force, whereas μ is the wave frequency [61].
Concluding the characteristic offset x c of the examined OWC, as determined from Equations (34) and (35), is calculated to be 35.19 m. Under this condition, the maximum tension force T m a x at the connection point between the top of the line 1 and the base of the converter assumes that the line’s x m 1 coordinate is in line with the global x coordinate and that the wave is traveling from the negative to the positive x axis (see Figure 17). It is noted that T m a x = 968.536 k N . This corresponds to a ratio of T m a x / M B L = 0.12 . Additionally, the angle formed between the top of the most heavily loaded line and the horizontal is φ B = 37.16 deg, while the length of the line that is suspended equals 51.5 m. Consequently, the segment of the line lying on the seabed constitutes 12.87% of the total mooring line length.
The quasi-static analysis employed is subsequently extended to incorporate the dynamic behavior of the mooring lines. Accordingly, the dynamic mooring damping and restoring coefficients were computed and incorporated into Equation (14). Figure 18 illustrates the dynamic tensions T d at the top of the mooring line for sinusoidal motions of its upper end, characterized by tangential amplitudes A = 1.0 ,   2.0 ,   3.0 ,   4.0 ,   5.0 m. The results presented in Figure 18 clearly indicate that the mooring line’s upper end motion amplitude (i.e., the attachment point of each mooring line to the OWC converter) significantly influences the dynamic tensions at this location. Specifically, the dynamic tensions exhibit proportional behavior with respect to the amplitude A and the examined wave frequency range.
Figure 19 illustrates the impact of both dynamic mooring damping and mooring restoring coefficients on the motions of the converter. The dynamic mooring restoring coefficients and the dynamic damping coefficients terms are considered in the solution of Equations (14) and (16) for the determination of the OWC’s motions. In the subsequent iterative process, ε = 10 10 (refer to Equation (31)) is assumed.
In the context of surge motions (see Figure 19a), the dynamic stiffness of the mooring lines, along with the consideration of mooring damping, results in a slight reduction in values when compared to the non-dynamic case (refer to Figure 15) at low wave frequencies, specifically for ω < 0.2 rad/s. Moreover, ξ 10 / ( H / 2 ) generally mirrors the pattern observed in the quasi-static scenario. Regarding heave motions, Figure 19b illustrates that the dynamic properties of the mooring lines have little impact on the vertical displacements of the body, as ξ 30 / ( H / 2 ) from the quasi-static analysis yields results comparable to those obtained in the dynamic case. However, it is noteworthy that the peak values of heave motion in the dynamic analysis are lower than those in the quasi-static analysis. The variation of ξ 50 / ( k H / 2 ) is presented in Figure 19c. A modest decrease in pitch motions is also noted, attributed to the substantial coupling between horizontal motions and rotations, which results in a pattern for ξ 50 / ( k H / 2 ) that resembles that of ξ 10 / ( H / 2 ) .
The averaged power absorbed over time by the OWC, as described in Equation (17), is illustrated in Figure 20. It is evident that the values of P o u t / ( H / 2 ) 2 are predominantly influenced by two resonant wave frequencies (i.e., ω = 0.7 and 1.06 rad/s), around which the absorbed power reaches significant levels. Conversely, outside this range of wave frequencies (i.e., for ω < 0.7 and ω > 1.06 ), the OWC device demonstrates negligible wave power absorption.

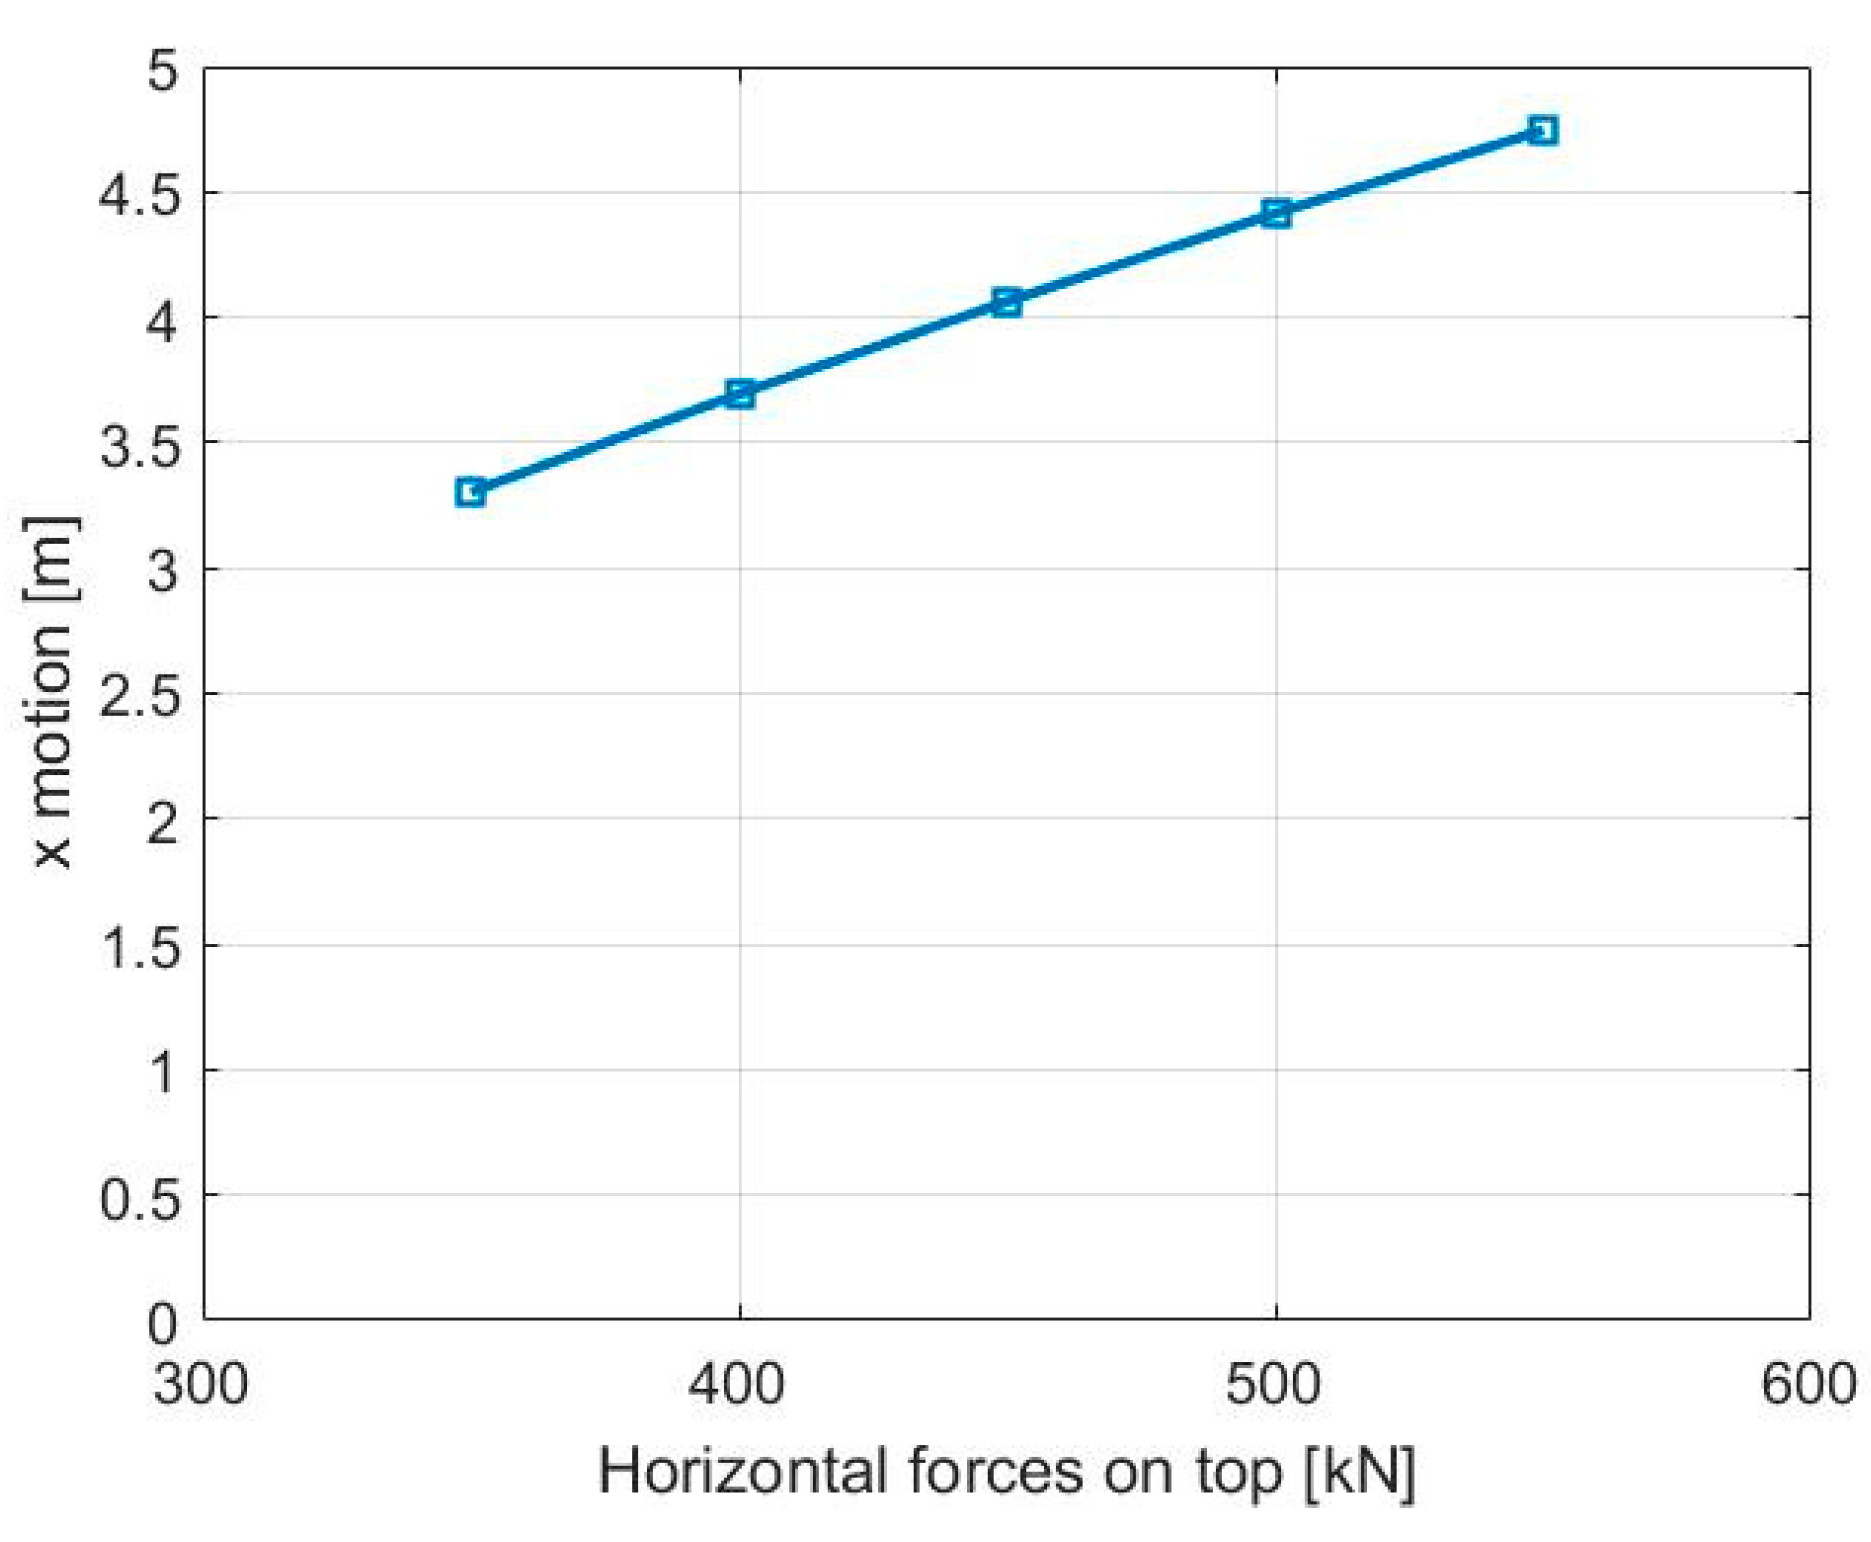
4.2. Mooring Case: TLP

In this subchapter, the analyzed dual-chamber OWC device is secured with a TLP mooring system. Based on the aforementioned design considerations (see Section 4), the maximum horizontal design load is defined as 450 kN, whereas the peak tension in the mooring lines remains below 0.3 of their minimum breaking load. The mooring system is encompassed of four tethers of steel spiral rope of class 1640, arranged symmetrically as shown in Figure 21.
To determine the mooring line characteristics, we apply the following design considerations [57]. Specifically, the surge natural period should be longer than 25   s ; thus, the total mooring stiffness c 11 m < 622   k N / m (refer to Equation (14)) and the heave and pitch natural periods must be less than 3.5 s, i.e., c 33 m > 5523   k N / m , to prevent first-order wave excitations. Also, to restrict the angle at the tendon connectors, the mean horizontal offset of the converter is considered not to exceed 5% of the water depth. Finally, the tendon cross-sectional area must be adequate to ensure a safety factor of at least two (SF = 2) against yielding under-tensile loads up to twice the initial pretension.
Following the above design considerations, the specifications of the TLP mooring system are presented in Table 3.
Figure 22 depicts the configuration of a single TLP mooring line under different values of horizontal forces applied to its upper end. It is evident that an increase in the horizontal force at the top of the line corresponds to an increase in the elongated line length, as well as to a decrease of the mooring line angle formed by the TLP line and the seabed.
Figure 23 depicts the c 11 m and c 22 m stiffness coefficients for various horizontal forces acting on the converter, based on the quasi-static analysis, whereas Figure 24 illustrates the horizontal excursion in the x-direction under varying horizontal forces applied to the OWC when moored with a TLP mooring system. It is visible (refer to Figure 23) that the c 11 m ,   c 22 m stiffness coefficients exhibit a linear variation. Also, it is observed from Figure 24 that the mean horizontal offset in the x-direction is x m e a n = 4.06 m when subjected to the maximum mean horizontal design load of 450 kN. This result adheres to the stipulation that the mean horizontal displacement of the converter must not go beyond 5% of the water depth. Additionally, Figure 25 presents the stiffness coefficient c 55 m resulting from the exciting forces in surge, demonstrating a linear trend similar to that observed in c 11 m ,   c 22 m .
From the solution of Equations (14) and (15), the motions of the OWC are determined. Figure 26 depicts the horizontal, ξ 10 / ( H / 2 ) , and the horizontal rotations, ξ 50 / ( k H / 2 ) , of the converter. The results are shown in a non-dimensional format, normalized by the wave amplitude H / 2 and the wave number k . The converter’s vertical motion is not illustrated in the figure since it appears negligible values due to the high pretension value applied on each line.
Beginning with the surge motion ξ 10 / ( H / 2 ) , it is apparent (refer to Figure 26a) that it reaches a peak at ω = 0.1 rad/s. This maximization can be attributed to the mooring restoring stiffness, which resonates with the horizontal motion at ω approximately equal to ω = 0.1 rad/s. Additionally, the wave frequency at which the cancellation of surge motions occurs is also relevant in this context, as observed in the catenary mooring line configuration. In comparison to the surge motions of the catenary-moored converter (see Figure 15), it can be seen that the TLP mooring system somewhat restricts the surge motions of the device, particularly at lower wave frequencies, specifically for ω < 0.1 rad/s. Furthermore, Figure 26b illustrates the pitch motion of the converter, wherein the mooring resonance at ω = 0.1 rad/s is evident, mirroring the surge motion.
Utilizing the analysis applied in the catenary mooring system configuration, the characteristic offset, denoted as x c , of the examined OWC, is calculated to be 9.5 m, as determined from Equations (34) and (35). Under this condition, the maximum tension force T m a x at the junction between the top of line 2 and the base of the converter (refer to Figure 19) is T m a x = 1637.94   k N , assuming the wave propagates from the negative to the positive x-axis. This corresponds to a ratio of T m a x M B L = 0.279 , which remains below the threshold of 0.3.
Figure 27 presents the averaged power absorbed over time by the OWC (refer to Equation (17)). It is illustrated that the values of P o u t / ( H / 2 ) 2 are primarily influenced by the resonant wave frequency at ω = 0.7 rad/s, around which the absorbed power reaches substantial levels. It is noteworthy to mention that the second resonant frequency ω = 1.06 rad/s observed in the catenary mooring configuration is not illustrated in the context of the TLP mooring configuration. Moreover, although the OWC device exhibits minimal wave power absorption for ω > 1.06 rad/s, similar to the effectiveness of the catenary mooring system, it is noteworthy that for ω < 0.7 rad/s, the values of P o u t / ( H / 2 ) 2 achieve non-negligible levels.
Figure 28 illustrates the power capture width from the OWC for the two mooring methods. The power capture width L p c is determined from the ratio of the time-averaged absorbed power to the mean power per crest width of a monochromatic wave. Specifically, it is expressed as follows:
L p c = P o u t P w
In Equation (38), P o u t denotes the time-averaged absorbed power (introduced in Equation (17)), a 4 is the outer radius of the converter, and P w represents the average wave power per unit width of the wave crest, which equals
P w = ρ g 2 H 2 2 C g
Here, C g stands for the group velocity.
Figure 28 demonstrates that the power capture width of the converter, when secured with a TLP mooring system, attains significantly higher values compared to those observed with a catenary mooring line. It is noteworthy that, although the catenary mooring system exhibits a second resonant frequency of ω = 1.06 rad/s, which enhances the capture efficiency of the device in the vicinity of this wave frequency compared to the TLP configuration, the TLP arrangement generally proves to be more efficient in absorbing wave power across a wider spectrum of wave frequencies.
The comparative analysis reveals the TLP mooring system’s superior wave power absorption efficiency across a broader frequency range compared to the catenary system. The TLP system exhibits a higher average power output, which stems from the TLP’s superior capacity to restrain OWC motion, particularly heave. The findings directly address the study’s objective by quantifying the performance difference between the two mooring types. These results highlight the significant impact of mooring system selection on OWC performance and overall energy yield.

5. Conclusions

This research introduces a comparative analysis of two distinct mooring systems—catenary and TLP—for a dual-chamber oscillating water column energy converter. The primary objective was to determine the influence of mooring system characteristics on the device’s wave power absorption efficiency across a range of environmental conditions. A comprehensive numerical model, incorporating hydrodynamic forces, mooring line dynamics, and air pressure interactions, was developed and validated. This model considers the coupled motion with three degrees of freedom of the OWC (surge, heave, and pitch) and the dynamic response of the mooring lines, explicitly accounting for the nonlinear interactions between the OWC motion and mooring tensions.
The analysis reveals distinct dynamic responses for each mooring configuration. Numerical simulations of the catenary mooring system indicate a primary resonance peak in horizontal motion at approximately ω = 0.25 rad/s, attributable to the relatively low stiffness of the mooring lines. A secondary resonance peak in heave motion is observed near ω = 1.05 rad/s, primarily driven by the inherent hydrodynamic characteristics of the OWC device. Incorporating the dynamic effects of the mooring system results in a reduction of the horizontal motions and rotations; however, vertical motion remains largely unaffected.
In contrast, the TLP mooring system, with its substantially higher stiffness, shows a diminished surge response at low frequencies. The dominant resonance in surge shifts to a lower frequency, around ω = 0.1 rad/s, primarily influenced by the TLP’s enhanced mooring stiffness. This results in a shift of the peak power absorption to a different frequency regime in comparison to the catenary system. Furthermore, the vertical motion exhibits negligible values because of the high axial stiffness of the mooring system.
The comparative analysis demonstrates the significant influence of the mooring system on the converter’s hydrodynamic performance and wave energy absorption efficiency. While the catenary mooring system shows larger peak power absorption around the heave resonance frequency, the TLP system exhibits improved performance at lower frequencies, largely due to reduced heave motion. This difference in performance highlights the tradeoffs associated with mooring system selection and its direct impact on the OWC’s operational efficiency and overall energy yield. The choice between these systems should be carefully considered based on the specific site conditions, wave climate, and the desired operational characteristics of the OWC. Further research could focus on exploring alternative mooring configurations and optimizing mooring parameters for maximizing wave energy extraction across various environmental conditions. The findings of this study provide meaningful insights for improving the design and optimization of mooring systems for future OWC deployments.

Author Contributions

Conceptualization, D.N.K. and A.S.M.; methodology, D.N.K.; software, D.N.K. and A.S.M.; validation, D.N.K.; formal analysis, D.N.K.; investigation, D.N.K.; resources, D.N.K. and A.S.M.; data curation, D.N.K.; writing—original draft preparation, D.N.K.; writing—review and editing, A.S.M.; visualization, D.N.K.; supervision, D.N.K.; project administration, D.N.K.; funding acquisition, D.N.K. All authors have read and agreed to the published version of the manuscript.

Funding

The research was funded by the Hellenic Foundation for Research and Innovation under the action: Basic Research Financing (Horizontal Support for All Sciences), National Recovery and Resilience Plan (Greece 2.0). Project Number: 015681, ETHOS: Novel Type Offshore Floating Wave Energy Converter for Efficient Power Absorption.

Data Availability Statement

The data supporting the reported results can be provided to the reader upon reasonable request.

Conflicts of Interest

The author declares that he has no known competing financial interests or personal relationships that could have appeared to influence the work reported in this manuscript.

Appendix A

The other terms of the mooring line stiffness coefficients c k j m are shown in the following equations. Specifically,
c i j m = n = 1 M c i j m , n ,   i , j = 1 , , 6
where,
c 12 m , n = c 13 m , n = c 31 m , n = c 23 m , n = c 32 m , n = c 21 m , n = 0
c 14 m , n = c 63 m , n = c 36 m , n = c 25 m , n = c 52 m , n = c 41 m , n = 0
c 15 m , n = c 11 m , n z m n = c 51 m , n ,     c 24 m , n = c 22 m , n z m n = c 42 m , n
c 16 m , n = c 11 m , n y m n = c 61 m , n ,     c 34 m , n = c 33 m , n y m n = c 43 m , n
c 26 m , n = c 22 m , n x m n = c 62 m , n ,     c 35 m , n = c 33 m , n x m n = c 53 m , n
c 54 m , n = c 33 m , n x m n y m n = c 45 m , n  
c 64 m , n = c 22 m , n x m n z m n = c 46 m , n
c 56 m = c 11 m z m n y m n = c 65 m
Here, x m n , y m n , z m n ,   n = 1 , , M represent the coordinates of the attachment point of the n th tendon with the fairlead, measured from the converter’s reference point of motions.

Appendix B

The components c i j m of the restoring mooring stiffness matrix [ c m ] regarding the reference point of motion of the converter can be represented by the restoring mooring stiffness matrix [ c ¯ m , n ], with elements c ¯ i j m , n , i , j = 1 , , 6 , of each line n = 1 , , M . Specifically, it holds
c m = i = 1 M [ c m , n ]
where
c m , n = λ n T c ¯ m , n λ n
and
λ n = c o s a n s i n a n 0 s i n a n c o s a n 0 0 0 1 ,    n = 1 , , M
c ¯ m , n = c ¯ 11 m , n 0 c ¯ 13 m , n 0 c ¯ 22 m , n 0 c ¯ 31 m , n 0 c ¯ 33 m , n , i , j = 1,2 , 3
Here, a n ,   n = 1 , , M is the angle of the n th line in the horizontal plane.
The matrix λ n T is the transpose of λ n ,   n = 1 , , M
Consequently, it holds
c 11 m , n = c ¯ 11 m , n ( c o s a n ) 2 + c ¯ 22 m , n ( s i n a n ) 2
c 22 m , n = c ¯ 11 m , n ( s i n a n ) 2 + c ¯ 22 m , n ( c o s a n ) 2
c 12 m , n = c ¯ 11 m , n ( c o s a n s i n a n ) c ¯ 22 m , n ( c o s a n s i n a n )
c 13 m , n = c ¯ 13 m , n c o s a n ,    c 23 m , n = c ¯ 13 m , n s i n a n
c 21 m , n = c 12 m , n
c 33 m , n = c ¯ 33 m , n ,   c 32 m = c 23 m ,    c 31 m , n = c 13 m , n
The remaining terms are
c 41 m , n = c 31 m , n y m n c 21 m , n z m n
c 51 m , n = c 11 m , n z m n c 31 m , n x m n
c 61 m , n = c 21 m , n x m n c 11 m , n y m n
c 42 m , n = c 32 m , n y m n c 22 m , n z m n
c 52 m , n = c 21 m , n z m n c 32 m , n x m n
c 62 m , n = c 21 m , n y m n + c 22 m , n x m n
c 43 m , n = c 32 m , n z m n + c 33 m , n y m n
c 53 m , n = c 31 m , n z m n c 33 m , n x m n
c 63 m , n = c 31 m , n y m n + c 32 m , n x m n
and
c 44 m , n = c 33 m , n y m n 2 2 c 32 m , n y m n z m n + c 22 m , n z m n 2
c 55 m , n = c 11 m , n z m n 2 + c 33 m , n x m n 2 2 c 31 m , n x m n z m n
c 66 m , n = c 22 m , n x m n 2 2 c 21 m , n x m n y m n + c 11 m , n y m n 2
c 54 m , n = c 31 m , n y m n z m n c 33 m , n x m n y m n + c 32 m , n x m n z m n c 21 m , n z m n 2
c 64 m , n = c 32 m , n x m n y m n c 22 m , n x m n z m n c 31 m , n y m n 2 + c 21 m , n y m n z m n
c 65 m , n = c 21 m , n x m n z m n c 11 m , n y m n z m n + c 31 m , n x m n y m n c 32 m , n x m n 2

References

  1. State of the Energy Union Report 2024 Shows EU Progress to Ensure Secure, Competitive and Affordable Energy for All. Available online: https://ec.europa.eu/commission/presscorner/api/files/document/print/en/ip_24_4581/IP_24_4581_EN.pdf (accessed on 1 March 2025).
  2. Collombert, R.; Cagney, D. Last Stop to 2025. A 2022 Action Plan to deliver on the Offshore Strategy’s Ocean Energy Target. 2022 Ocean Energy Europe. Available online: https://www.etipocean.eu/knowledge_hub/last-stop-to-2025-a-2022-action-plan-to-deliver-on-the-offshore-strategys-ocean-energy-target/ (accessed on 1 March 2025).
  3. IRENA. Innovation Outlook: Ocean Energy Technologies; International Renewable Energy Agency: Abu Dhabi, United Arab Emirates, 2020. [Google Scholar]
  4. Ding, J.; Pang, S.; Chen, Z. Optimization of the chamber of OWC to improve hydrodynamic performance. Ocean Eng. 2023, 287, 115782. [Google Scholar] [CrossRef]
  5. Heath, T.V. A review of oscillating water columns. Philos. Trans. R. Soc. 2012, 370, 235–245. [Google Scholar] [CrossRef]
  6. Davidson, J.; Ringwood, J.V. Mathematical Modelling of Mooring Systems for Wave Energy Converters—A Review. Energies 2017, 10, 666. [Google Scholar] [CrossRef]
  7. Kisacik, D.; Stratigaki, V.; Wu, M.; Cappietti, L.; Simonetti, I.; Troch, P.; Crespo, A.; Altomare, C.; Domínguez, J.; Hall, M.; et al. Efficiency and Survivability of a Floating Oscillating Water Column Wave Energy Converter Moored to the Seabed: An Overview of the EsflOWC MaRINET2 Database. Water 2020, 12, 992. [Google Scholar] [CrossRef]
  8. Harris, R.E.; Johanning, L.; Wolfram, J. Mooring systems for wave energy converters: A review of design issues and choices. In Proceedings of the 3rd International Conference on Marine Renewable Energy, Blyth, UK, 7–9 July 2004; pp. 180–189. [Google Scholar]
  9. Johanning, L.; Smith, G.H.; Wolfram, J. Towards design standards for WEC moorings. In Proceedings of the 6th European Wave and Tidal Energy Conference, EWTEC, Glasgow, UK, 29 August–2 September 2005. [Google Scholar]
  10. Johanning, L.; Wolfram, J. Challenging tasks on moorings for floating WECs. In Proceedings of the International Symposium on Fluid Machinery for Wave and Tidal Energy: State of the Art and New Developments, IMechE 2005, London, UK, 19 October 2005. [Google Scholar]
  11. Johanning, L.; Smith, G.H.; Wolfram, J. Measurements of static and dynamic mooring line damping and their importance for floating WEC devices. Ocean Eng. 2007, 34, 1918–1934. [Google Scholar] [CrossRef]
  12. Vijayakrishna Rapaka, E.; Natarajan, R.; Neelamani, S. Experimental investigation on the dynamic response of a moored wave energy device under regular sea waves. Ocean Eng. 2004, 31, 725–743. [Google Scholar] [CrossRef]
  13. Elwood, D.; Yim, S.C.; Prudell, J.; Stillinger, C.; Jouanne, A.; Brekken, T.; Brown, A.; Paasch, R. Design, construction, and ocean testing of a taut-moored dual-body wave energy converter with a linear generator power take-off. Renew. Energy 2010, 35, 348–354. [Google Scholar] [CrossRef]
  14. Xu, S.; Wang, S.; Guedes Soares, C. Review of mooring design for floating wave energy converters. Renew. Sustain. Energy Rev. 2019, 111, 595–621. [Google Scholar] [CrossRef]
  15. Luo, Y.; Wang, Z.; Peng, G.; Xiao, Y.; Zhai, L.; Liu, X.; Zhang, Q. Numerical simulation of a heave-only floating OWC (oscillating water column) device. Energy 2014, 76, 799–806. [Google Scholar] [CrossRef]
  16. Wang, C.; Zhang, Y.; Deng, Z. Hydrodynamic performance of a heaving oscillating water column device restrained by a spring-damper system. Renew. Energy 2022, 187, 331–346. [Google Scholar] [CrossRef]
  17. Imai, Y.; Toyota, K.; Nagata, S.; Setoguchi, T.; Takao, M. An experimental study on generating efficicncy of a wave energy converter “Backward Bent Duct Buoy”. In Proceedings of the 9th European Wave and Tidal Energy Conference, EWTEC, Southampton, UK, 5–9 September 2011. [Google Scholar]
  18. Guo, P.; Zhang, Y.; Chen, W.; Wang, C. Fully coupled simulation of dynamic characteristics of a backward bent duct buoy oscillating water column wave energy converter. Energy 2024, 294, 130870. [Google Scholar] [CrossRef]
  19. Cerveira, F.; Fonseca, N.; Pascoal, R. Mooring system influence on the efficiency of wave energy converters. Int. J. Mar. Energy 2013, 3–4, 65–81. [Google Scholar] [CrossRef]
  20. Krivtsov, V.; Linfoot, B. Basin testing of wave energy converters in Trondheim: Investigation of mooring loads and implications for wider research. J. Mar. Sci. Eng. 2014, 2, 326–335. [Google Scholar] [CrossRef]
  21. Fong Lee, C.; Fjermedal, S.; Chen Ong, M. Design and analysis of taut mooring systems for a combined floating offshore wind and wave energy system at intermediate water depth. Ocean Eng. 2024, 312, 119174. [Google Scholar]
  22. Elhanafi, A.; Macfarlane, G.; Fleming, A.; Leong, Z. Experimental and numerical investigations on the hydrodynamic performance of a floating-moored oscillating water column wave energy converter. Appl. Energy 2017, 205, 369–390. [Google Scholar] [CrossRef]
  23. Elhanafi, A.; Macfarlane, G.; Fleming, A.; Leong, Z. Experimental and numerical investigations on the intact and damage survivability of a floating-moored oscillating water column device. Appl. Ocean Res. 2017, 68, 276–292. [Google Scholar] [CrossRef]
  24. Singh, U.; Abdussamie, N.; Hore, J. Hydrodynamic performance of a floating offshore OWC wave energy converter: An experimental study. Renew. Sustain. Energy Rev. 2020, 117, 109501. [Google Scholar] [CrossRef]
  25. Wu, M.; Stratigaki, V.; Troch, P.; Altomare, C.; Verbrugghe, T.; Crespo, A.; Cappietti, L.; Hall, M.; Gomez-Gesteira, M. Experimental study of a moored floating oscillating water column wave-energy converter and of a moored cubic box. Energies 2019, 12, 1834. [Google Scholar] [CrossRef]
  26. Mia, R.M.; Zhao, M.; Wu, H.; Dhamelia, V.; Hu, P. Hydrodynamic performance of a floating offshore oscillating water column wave energy converter. J. Mar. Sci. Eng. 2022, 10, 1551. [Google Scholar] [CrossRef]
  27. Correia da Fonseca, F.X.; Gomes, R.P.F.; Henriques, J.C.C.; Gato, L.M.C.; Falcao, A.F.O. Model testing of an oscillating water column spar-buoy wave energy converter isolated and in array: Motions and mooring forces. Energy 2016, 112, 1207–1218. [Google Scholar] [CrossRef]
  28. Giorgi, G.; Gomes, R.P.F.; Bracco, G.; Mattiazzo, G. The effect of mooring line parameters in inducing parametric resonance on the Spar-Buoy oscillating water column wave energy converter. J. Mar. Sci. Eng. 2020, 8, 29. [Google Scholar] [CrossRef]
  29. Gomes, R.P.F.; Henriques, J.C.C.; Gato, L.M.C.; Falcao, A.F.O. Wave power extraction of a heaving floating oscillating water column in a wave channel. Renew. Energy 2016, 99, 1262–1275. [Google Scholar] [CrossRef]
  30. Gomes, R.P.F.; Henriques, J.C.C.; Gato, L.M.C.; Falcao, A.F.O. Time-domain simulation of a slack-moored floating oscillating water column and validation with physical model tests. Renew. Energy 2020, 149, 165–180. [Google Scholar] [CrossRef]
  31. Oikonomou, C.L.G.; Gomes, R.P.F.; Gato, L.M.C.; Falcao, A.F.O. On the dynamics of an array of spar-buoy oscillating water column devices with inter-body mooring connections. Renew. Energy 2020, 148, 309–325. [Google Scholar] [CrossRef]
  32. Touzon, I.; Nava, V.; Gao, Z.; Petuya, V. Frequency domain modelling of a coupled system of floating structure and mooring lines: An application to a wave energy converter. Ocean Eng. 2021, 220, 108498. [Google Scholar] [CrossRef]
  33. Howey, B.; Collins, K.; Hann, M.; Iglesias, G.; Gomes, R.; Henriques, J.; Gato, L.M.C.; Greaves, D. Compact floating wave energy converter arrays: Inter-device mooring connectivity and performance. Appl. Ocean Res. 2021, 115, 102820. [Google Scholar] [CrossRef]
  34. Pols, A.; Gubesch, E.; Abdussamie, N.; Penesis, I.; Chin, C. Mooring analysis of a floating OWC wave energy converter. J. Mar. Sci. Eng. 2021, 9, 228. [Google Scholar] [CrossRef]
  35. Gubesch, E.; Abdussamie, N.; Penesis, I.; Chin, C. Effects of mooring configurations on the hydrodynamic performance of a floating offshore oscillating water column wave energy converter. Renew. Sustain. Energy Rev. 2022, 166, 112643. [Google Scholar] [CrossRef]
  36. Xu, S.; Rezanejad, K.; Gadelho, J.F.M.; Wang, S.; Guedes Soares, C. Experimental investigation on a dual chamber floating oscillating water column moored by flexible mooring systems. Ocean Eng. 2020, 216, 108083. [Google Scholar] [CrossRef]
  37. Gadelho, J.; Rezanejad, K.; Xu, S.; Hinostroza, M.; Guedes Soares, C. Experimental study on the motions of a dual chamber floating oscillating water column device. Renew. Energy 2021, 170, 1257–1274. [Google Scholar] [CrossRef]
  38. Xu, S.; Rezanejad, K.; Gadelho, J.F.M.; Guedes Soares, C. Influence of the power take-off damping of a dual chamber floating oscillating water column on the mooring fatigue damage. Ocean Eng. 2022, 249, 110832. [Google Scholar] [CrossRef]
  39. Konispoliatis, D.N. Hydrodynamic analysis of a dual chamber floating oscillating water column device. Appl. Ocean Res. 2025, 154, 104340. [Google Scholar] [CrossRef]
  40. Mavrakos, A.S.; Konispoliatis, D.N.; Ntouras, D.G.; Papadakis, G.P.; Mavrakos, S.A. Hydrodynamics of moonpool-type floaters: A theoretical and a CFD formulation. Energies 2022, 15, 570. [Google Scholar] [CrossRef]
  41. Mavrakos, A.S.; Konispoliatis, D.N.; Ntouras, D.G.; Papadakis, G.P.; Mavrakos, S.A. Hydrodynamic coefficients in heave of a moonpool-type floater using theoretical, numerical and CFD methodologies. Ocean Eng. 2023, 279, 114519. [Google Scholar] [CrossRef]
  42. Kokkinowrachos, K.; Thanos, I.; Zibell, H.G. Hydrodynamic analysis of some wave energy conversion systems. In Proceedings of the OCEANS’87 Conference, Halifax, NS, Canada, 28 September–1 October 1987; pp. 566–574. [Google Scholar]
  43. Falnes, J. Ocean Waves and Oscillating Systems; Cambridge University Press: Cambridge, UK, 2002. [Google Scholar]
  44. Evans, D.V.; Porter, R. Efficient calculator of hydrodynamic properties of OWC-type devices. J. Offshore Mech. Arct. Eng. 1997, 119, 210–218. [Google Scholar] [CrossRef]
  45. Mavrakos, A.S.; Konispoliatis, D.N.; Mavrakos, S.A. Hydrodynamic analysis of two coaxial moonpool floaters using theoretical methodologies. J. Mar. Sci. Eng. 2023, 11, 99. [Google Scholar] [CrossRef]
  46. Falcao, A.F.O. Stohastic modelling of OWC wave power plant performance. Appl. Ocean Res. 2002, 24, 59–71. [Google Scholar] [CrossRef]
  47. Mavrakos, S. The vertical drift force and pitch moment on axisymmetric bodies in regular waves. Appl. Ocean Res. 1988, 10, 207–218. [Google Scholar] [CrossRef]
  48. Sclavounos, P.D. The vertical wave drift force on floating bodies. In Proceedings of the 2nd International Workshop on Water Waves and Floating Bodies, Bristol, UK, 16–19 March 1987. [Google Scholar]
  49. Molin, B. On second-order motion and vertical drift forces for three-dimensional bodies in regular waves. In Proceedings of the International Workshop on Ship and Platform Motion, Berkeley, CA, USA, 26–28 October 1983. [Google Scholar]
  50. Papanikolaou, A.; Zaraphonitis, G. On the improved method for the evaluation of second-order motions and loads on 3D floating bodies in waves. J. Schiffstechnik 1987, 34, 170–211. [Google Scholar]
  51. Shao, Y.L. Numerical analysis of second-order mean wave forces by a stabilized higher order boundary element method. In Proceedings of the 37th International Conference on Ocean, Offshore and Arctic Engineering, Madrid, Spain, 17–22 July 2018. [Google Scholar]
  52. Konispoliatis, D.N.; Mavrakos, S.A. Mean drift wave forces on arrays of bodies surrounded by thin porous surfaces. J. Mar. Sci. Eng. 2023, 11, 1269. [Google Scholar] [CrossRef]
  53. Martins-Rivas, H.; Mei, C.C. Wave power extraction from an oscillating water column at the tip of a breakwater. J. Fluid Mech. 2009, 626, 395–414. [Google Scholar] [CrossRef]
  54. Senjanovic, I.; Hadzic, N.; Tomic, M. On the linear stiffness of tension leg platforms. Sustain. Marit. Transp. Exploit. Sea Resour. 2011, 108, 1081–1088. [Google Scholar]
  55. Loukogeorgaki, E.; Angelidis, D. Stiffness of mooring lines and performance of floating breakwater in three dimensions. Appl. Ocean Res. 2005, 27, 187–208. [Google Scholar] [CrossRef]
  56. ANSYS AQWA Theory Manual; ANSYS Inc.: Canonsburg, PA, USA,, 2015.
  57. Bachynski, E.E.; Moan, T. Design considerations for tension leg platform wind turbines. Mar. Struct. 2012, 29, 89–114. [Google Scholar] [CrossRef]
  58. Konispoliatis, D.N.; Katsaounis, G.M.; Manolas, D.I.; Soukissian, T.H.; Polyzos, S.; Mazarakos, T.P.; Voutsinas, S.G.; Mavrakos, S.A. REFOS: A renewable energy multi-purpose floating offshore system. Energies 2021, 14, 3126. [Google Scholar] [CrossRef]
  59. DNVGL-OS-E301; Position Mooring. Det Norske Veritas: Høvik, Norway, 2018.
  60. Faltinsen, O.M. Sea Loads on Ships and Offshore Structures; Cambridge University Press: Cambridge, UK, 1990. [Google Scholar]
  61. Pinkster, J.A. Low-frequency phenomena associated with vessels moored at sea. Soc. Pet. Eng. 1975, 15, 487–494. [Google Scholar] [CrossRef]
Figure 1. Schematic representation (x-z plane) of the examined dual-chamber OWC.
Energies 18 01473 g001
Figure 2. Schematic representation (x-y plane) of the examined dual chamber OWC.
Energies 18 01473 g002
Figure 3. Flowchart illustrating the analytical methodology.
Energies 18 01473 g003
Figure 4. Depiction of the examined TLP-type mooring system: (a) x-z plane, (b) x-y plane.
Energies 18 01473 g004
Figure 5. Two-dimensional schematic of a typical catenary mooring system.
Energies 18 01473 g005
Figure 6. Depiction of the n th mooring line connection and global coordinate system orientation: (a) x-z plane, (b) x-y plane.
Energies 18 01473 g006
Figure 7. Horizontal mean drift forces utilizing both momentum and direct pressure integration principle for the free-floating OWC. The theoretical results are compared with those from ANSYS AQWA.
Energies 18 01473 g007
Figure 8. Motions and rotations of the free-floating OWC against the wave frequency: (a) horizontal motion ξ 10 / ( H / 2 ) , (b) vertical motion ξ 30 / ( H / 2 ) , (c) horizontal rotation ξ 50 / ( k H / 2 ) . The theoretical results are compared with those from ANSYS AQWA.
Energies 18 01473 g008
Figure 9. Horizontal, vertical, and total force at the line’s top against horizontal displacement from equilibrium. Tension at equilibrium 297 kN.
Energies 18 01473 g009
Figure 10. Shape of the mooring line under various tensions at its upper end.
Energies 18 01473 g010
Figure 11. Stiffness coefficients c 11 m , c 22 m for various values of horizontal forces on top of the line in x-direction for a catenary mooring system.
Energies 18 01473 g011
Figure 12. Horizontal excursion in x- and y-directions for various horizontal forces on top of the line in x-direction.
Energies 18 01473 g012
Figure 13. Stiffness coefficients c 55 m for various values of exciting moments in yaw for a catenary mooring system.
Energies 18 01473 g013
Figure 14. Rotation of the converter for various values of exciting moments in yaw.
Energies 18 01473 g014
Figure 15. Motions and rotations of the converter against the wave frequency: (a) horizontal motion ξ 10 / ( H / 2 ) , (b) vertical motion ξ 30 / ( H / 2 ) , (c) horizontal rotation ξ 50 / ( k H / 2 ) .
Energies 18 01473 g015
Figure 16. Mean drift force on the OWC converter at the surge direction: (a) moored OWC device, (b) fixed-in-the-waves OWC device.
Energies 18 01473 g016
Figure 17. Two-dimensional depiction of the analyzed symmetric mooring configuration, consisting of four identical mooring lines.
Energies 18 01473 g017
Figure 18. Variation in dynamic tension at the mooring line’s upper termination point as a function of ω for various horizontal motion amplitudes A .
Energies 18 01473 g018
Figure 19. Motions and rotations of the converter against the wave frequency derived by the dynamic analysis: (a) horizontal motion ξ 10 / ( H / 2 ) , (b) vertical motion ξ 30 / ( H / 2 ) , (c) horizontal rotation ξ 50 / ( k H / 2 ) .
Energies 18 01473 g019
Figure 20. Averaged power absorbed over time by the OWC against the wave frequency for a catenary mooring system.
Energies 18 01473 g020
Figure 21. Two-dimensional depiction of the analyzed symmetric TLP mooring configuration, consisting of four identical lines.
Energies 18 01473 g021
Figure 22. Shape of the TLP mooring line under various horizontal forces at its upper end.
Energies 18 01473 g022
Figure 23. Stiffness coefficients c 11 m ,   c 22 m for various values of horizontal forces on top of the line in x-direction for a TLP mooring system.
Energies 18 01473 g023
Figure 24. Horizontal excursion in x-direction for various horizontal forces on top of the line in x-direction.
Energies 18 01473 g024
Figure 25. Stiffness coefficients c 55 m for various values of exciting moments in yaw for a TLP mooring system.
Energies 18 01473 g025
Figure 26. Motions and rotations of the converter against the wave frequency: (a) horizontal motion ξ 10 / ( H / 2 ) , (b) horizontal rotation ξ 50 / ( k H / 2 ) .
Energies 18 01473 g026
Figure 27. Averaged power absorbed over time by the OWC against the wave frequency for a TLP mooring system.
Energies 18 01473 g027
Figure 28. Power capture width from the OWC for the two mooring methods against the wave frequency.
Energies 18 01473 g028
Table 1. Floating cylindrical body geometry.
Depth of the outer pontoon below seawater level (SWL)14 m
Depth of the inner pontoon below SWL 5.5 m
Elevation of the oscillating chamber above SWL5 m
Outer radius of outer pontoon13 m
Inner radius of outer pontoon12 m
Outer radius of inner pontoon9 m
Inner radius of inner pontoon6.08 m
Water depth130 m
Table 2. Mooring line properties.
Mass in air per line199.0 kg/m
Mass in water per line173.0 kg/m
Axial stiffness per line854.0 MN
Minimum breaking load per line8028 kN
Nominal diameter100 mm
Unstretched length per line400 m
Pretension at the top of the line297 kN
Maximum horizontal design load450 kN
Table 3. TLP mooring properties.
Mass in air per line48.8 kg/m
Mass in water per line42.3 kg/m
Axial stiffness per line8.02E8 N
Minimum breaking load per line9147 kN
Nominal diameter0.1 m
Unstretched length per line124.5 m
Pretension at the top of the line3006 kN
Disclaimer/Publisher’s Note: The statements, opinions and data contained in all publications are solely those of the individual author(s) and contributor(s) and not of MDPI and/or the editor(s). MDPI and/or the editor(s) disclaim responsibility for any injury to people or property resulting from any ideas, methods, instructions or products referred to in the content.

