Article

Physicochemical Properties and Low-Temperature Sulfur Fixation Patterns of Fly Ash from a Biomass Power Plant

1
Huaneng Jiaxiang Power Generation Co., Ltd., Jining 272059, China
2
National Engineering Laboratory for Reducing Emissions from Coal Combustion, Engineering Research Center of Environmental Thermal Technology of Ministry of Education, Shandong Key Laboratory of Green Thermal Power and Carbon Reduction, School of Nuclear Science, Energy and Power Engineering, Shandong University, Jinan 250061, China
*
Author to whom correspondence should be addressed.
Energies 2025, 18(6), 1466; https://doi.org/10.3390/en18061466
Submission received: 18 January 2025 / Revised: 5 March 2025 / Accepted: 10 March 2025 / Published: 17 March 2025
(This article belongs to the Section B: Energy and Environment)

Abstract

Biomass power plants generate a vast amount of biomass ash (BA) and release sulfur dioxide (SO2) and other pollutants. In this study, a new idea of flue gas desulfurization (FGD) using BA was proposed for biomass power plants. The physicochemical properties, surface morphology, and microstructure of fly ash generated by a typical biomass power plant in the Shandong area of China were characterized using X-ray fluorescence spectrometry (XRF), X-ray diffraction (XRD), thermogravimetric analysis (TGA), scanning electron microscopy (SEM), and energy dispersive X-ray spectroscopy (EDS). The results indicated that the BA contained alkaline-providing metal oxides, including alkali metal oxides (K2O at 7.57% and Na2O at 1.47%) and alkaline earth metal oxides (CaO at 10.52% and MgO at 4.52%). SiO2 constituted the primary crystalline phase, while KCl, CaCO3, and CaSiO3 phases were also identified. BA has diverse morphological characteristics, including irregular angular/acicular, spherical, and flocculent-shaped particles, among which the flocculent-shaped particles were mainly the calcium oxide (CaO)-containing composite of alkaline earth metal oxides and quartz. The potential of BA to absorb SO2 is attributable to CaO and other alkaline substances. The desulfurization experiment indicated that humidified BA allows for an effective FGD process that generates flaky crystalline solids of calcium sulfate (CaSO4). Therefore, this method utilizes the alkalinity of BA for FGD in biomass power plants.

1. Introduction

Biomass is a resource-rich renewable energy that is expected to mitigate current energy and environmental issues facing humankind [1]. Direct combustion is one of the main technical approaches for large-scale and efficient utilization of biomass for power generation [2,3]. According to the statistics released by the National Energy Administration, the installed capacity of biomass power generation in China has reached 46 thousand MW by 2024. Although biomass is a clean fuel, it still contains S and N elements. The S content in biomass generally ranges from 0.01% to 0.25%, and is released as SO2 during combustion. A study on biomass power plants showed that [4] the highest concentration of SO2 in flue gas exceeded 200 mg/Nm3, making it difficult to meet the ultra-clean pollutant emissions requirement (SO2 ≤ 35 mg/m3; NOx ≤ 50 mg/m3). Hence, desulfurization and denitrification devices need to be installed in biomass power plants to control the emission of SO2 and NOx.
Large-scale installations of biomass power plants also lead to the generation of BA in large quantities [5] with complex compositions and diverse morphologies. The ash is rich in K, Ca, Mg, Na, and other elements [6,7]. Some of its advantages include high porosity, high water absorption capacity, and comprehensive nutrient elements [8,9]. The major applications of BA include soil improvement [10], fertilizers [11], cement additives [12], etc. [13].
BA is alkaline with pH values ranging from 11 to 13 [14,15,16]. A previous study [17] showed that humidified BA plays a role in carbon fixation by effectively absorbing carbon dioxide (CO2). Due to its alkali metal-rich properties, the sulfur fixation of BA during combustion has also been studied extensively. Studies [18,19] have shown that the alkali metals in BA play a role in sulfur fixation during combustion, thereby reducing the emission of SO2. The rate of sulfur fixation decreases with increasing combustion temperature to the lowest level at 820 °C. The co-firing of biomass and coal is also capable of reducing the emission of SO2 in flue gas to a certain extent [20,21]. The high-temperature sulfur fixation of BA results in a low desulfurization efficiency that is unable to meet the requirements of ultra-clean emissions due to the restriction by gas–solid reactions. In the field of FGD, Dahlan et al. [22,23] carried out fixed-bed experiments using hydrated BA and found that the reactive species was generated during the hydration of rice husk ash, and CaO. Lau et al. [24] investigated the simultaneous removal of SO2 and NO using rice husk ash sorbent doped with copper and found that the optimal temperature was 100 °C. Despite the growing interest in desulfurization technologies, there has been little research on the direct use of BA generated by biomass power plants so far.
In this study, a new technical approach was proposed to remove SO2 generated by biomass power plants at low temperatures using BA, resulting in an ultra-clean flue gas emission from biomass power plants. As an in-situ byproduct, BA eliminates limestone procurement in conventional wet scrubbing and simultaneously reduces material sourcing and storage expenses. This approach is able to effectively reduce the SO2 emission from biomass power plants at a low level of investment and operating cost. First, the physicochemical properties and surface morphology of fly ash sampled from a typical biomass power plant in the Shandong area were comprehensively analyzed using X-ray diffraction (XRD), X-ray fluorescence spectrometry (XRF), thermogravimetric analysis (TGA), scanning electron microscopy (SEM), and energy dispersive X-ray spectroscopy (EDS). Second, based on those analyses, the SO2-absorption characteristic of BA was studied via a fixed-bed experiment, and the resulting products were analyzed in order to speculate on the mechanism of BA in removing SO2.

2. Sampling and Testing of BA

2.1. Sampling of BA

The biomass fly ash samples used in this study were collected from a biomass power plant located in the northwest region of the Shandong Province, which is a prominent area for food processing and commercial cotton plantations and is very rich in biomass resources. The biomass power plant burned cotton stalks, wheat straw, corn stalks, and forestry biomass (mainly stalks of poplar and willow trees) in a vibrating grate at combustion temperatures between 700 and 900 °C. In order to ensure combustion stability, all biomass types were mixed prior to combustion at the proportion shown in Table 1. The fly ash samples were collected multiple times from the hoppers of the power plants’ baghouse dust collection system under 100% load-stable operating conditions.

2.2. Testing of BA

The compositions of BA were analyzed using the PW4400 X-ray Fluorescence (XRF) Spectrometer (Thermo Electron Corporation, Waltham, MA, USA). The thermal behavior was characterized via TGA/DSC1/1600HT Thermogravimetric Ana-lyzer (Mettler-Toledo Inc., Küsnacht, Switzerland). The micro-crystalline structure of the BA was examined under the Rigaku D/max 2550 VB/PC X-ray Diffraction (XRD) Analyzer (Ricoh Co., Ltd., Tokyo, Japan). SEM and EDS analyses were performed under the Shimadzu EPMA-1600 Electron Probe X-ray Microanalyzer and energy dispersive X-ray spectrometer (Shimadzu Corp., Kyoto, Japan), respectively.

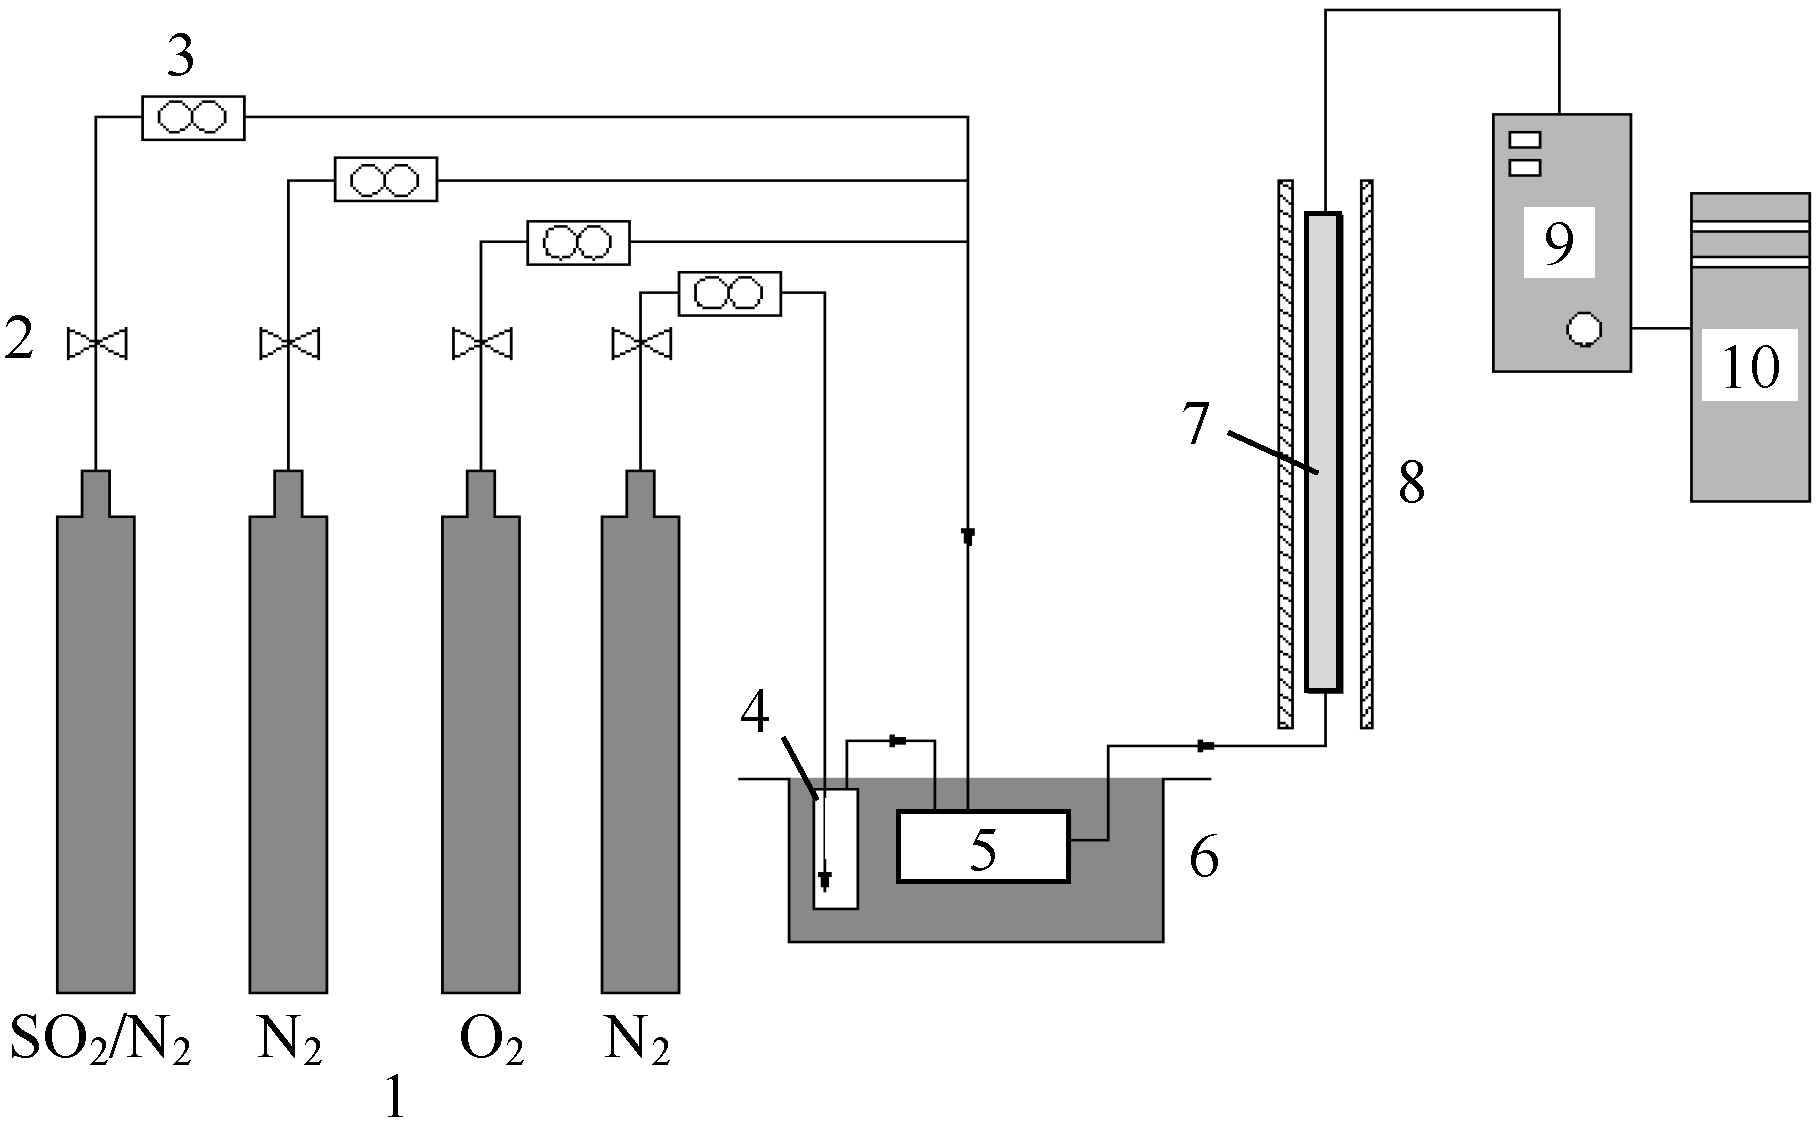
2.3. Experimental Device for Examining the Absorption of SO2 by BA

The desulfurization capability of BA was tested at constant temperature in a fixed-bed reactor and the experimental system is shown in Figure 1. The compositions of N2, O2, SO2, and H2O were adjusted to simulate typical flue gas of biomass power plants. In this study, the total gas flow rate was set to 1 L/min, containing 200 ppmv SO2, 8% O2, 0–10% H2O, and balanced N2. CO2 was excluded from the gas mixture to isolate the sulfation reaction without carbonate interference. N2, O2, and SO2 were supplied from gas cylinders, and their flow rates were controlled using mass flow controllers. Meanwhile, H2O was carried by purging N2 through a constant-temperature water bath maintained at 55 °C, wherein the amount of H2O supplied was regulated by the N2 flow rate. The evenly mixed gas was channeled into the reactor from the outlet of the gas mixer to the inlet of the reactor through a channel heated with an electric heater to avoid the condensation of water vapor.
The fixed-bed reactor is made of a glass tube with a 15 mm inner diameter and 500 mm height. A borosilicate sand core was placed 250 mm from the bottom of the reactor to hold the reactants (2 g BA per experiment). The reactor was installed with an external electric heating device programmed to accurately control its temperature within ±1 °C deviation across the range of 60–90 °C. The composition of flue gas generated by the reactor outlet was determined using the Gasmet 4400 Fourier transform infrared spectroscopy (FTIR) Gas Analyzer (Vantaa, Finland).

3. Analysis of the Physicochemical Properties of BA

3.1. Chemical Compositions of Biomass Analyzed by XRF and XRD

Table 2 shows the oxide compositions in BA. It can be seen that the BA mainly consisted of inorganic compounds containing various elements, such as Si, Ca, Al, K, Fe, Mg, and Na. Among them, SiO2 had the highest content of 54.89%, followed by CaO (10.52%), Al2O3 (9.93%), K2O (7.57%), Fe2O3 (5.76%), and MgO (4.52%), as well as a minor amount of oxides of S, P, Na, Ti, and Cl. The high SiO2 content stemmed from both intrinsic silicon in the biomass and inevitably introduced soil impurities during fuel collection and processing stages.
The BA was subjected to XRD analysis for determining its crystalline phase, and the results are shown in Figure 2. The characteristic peaks corresponding to quartz (observed at 20.8°, 26.6°, and 50.1°) were the most prominent, and those of other substances exhibited less intensity, indicating that the main crystalline phase in BA was SiO2. Additionally, the phases of KCl (40.5°, 50.1°), CaCO3 (29.4°), and CaSiO3 (29.4°, 34.3°) were detected.
When considered together, the XRF and XRD analyses showed that the main elemental composition of the BA included Si, Ca, Al, K, Fe, and Mg. Among them, Si mainly existed in the form of SiO2, with a portion of SiO2 reacting with CaO at high temperatures to form CaSiO3. Ca existed in the forms of CaCO3 and CaO, with a portion additionally present as CaSiO3. Since water-soluble alkali metals prefer to react with chlorine (Cl) [17], K mainly existed in the form of KCl while the rest existed in the form of potassium sulfate (K2SO4).

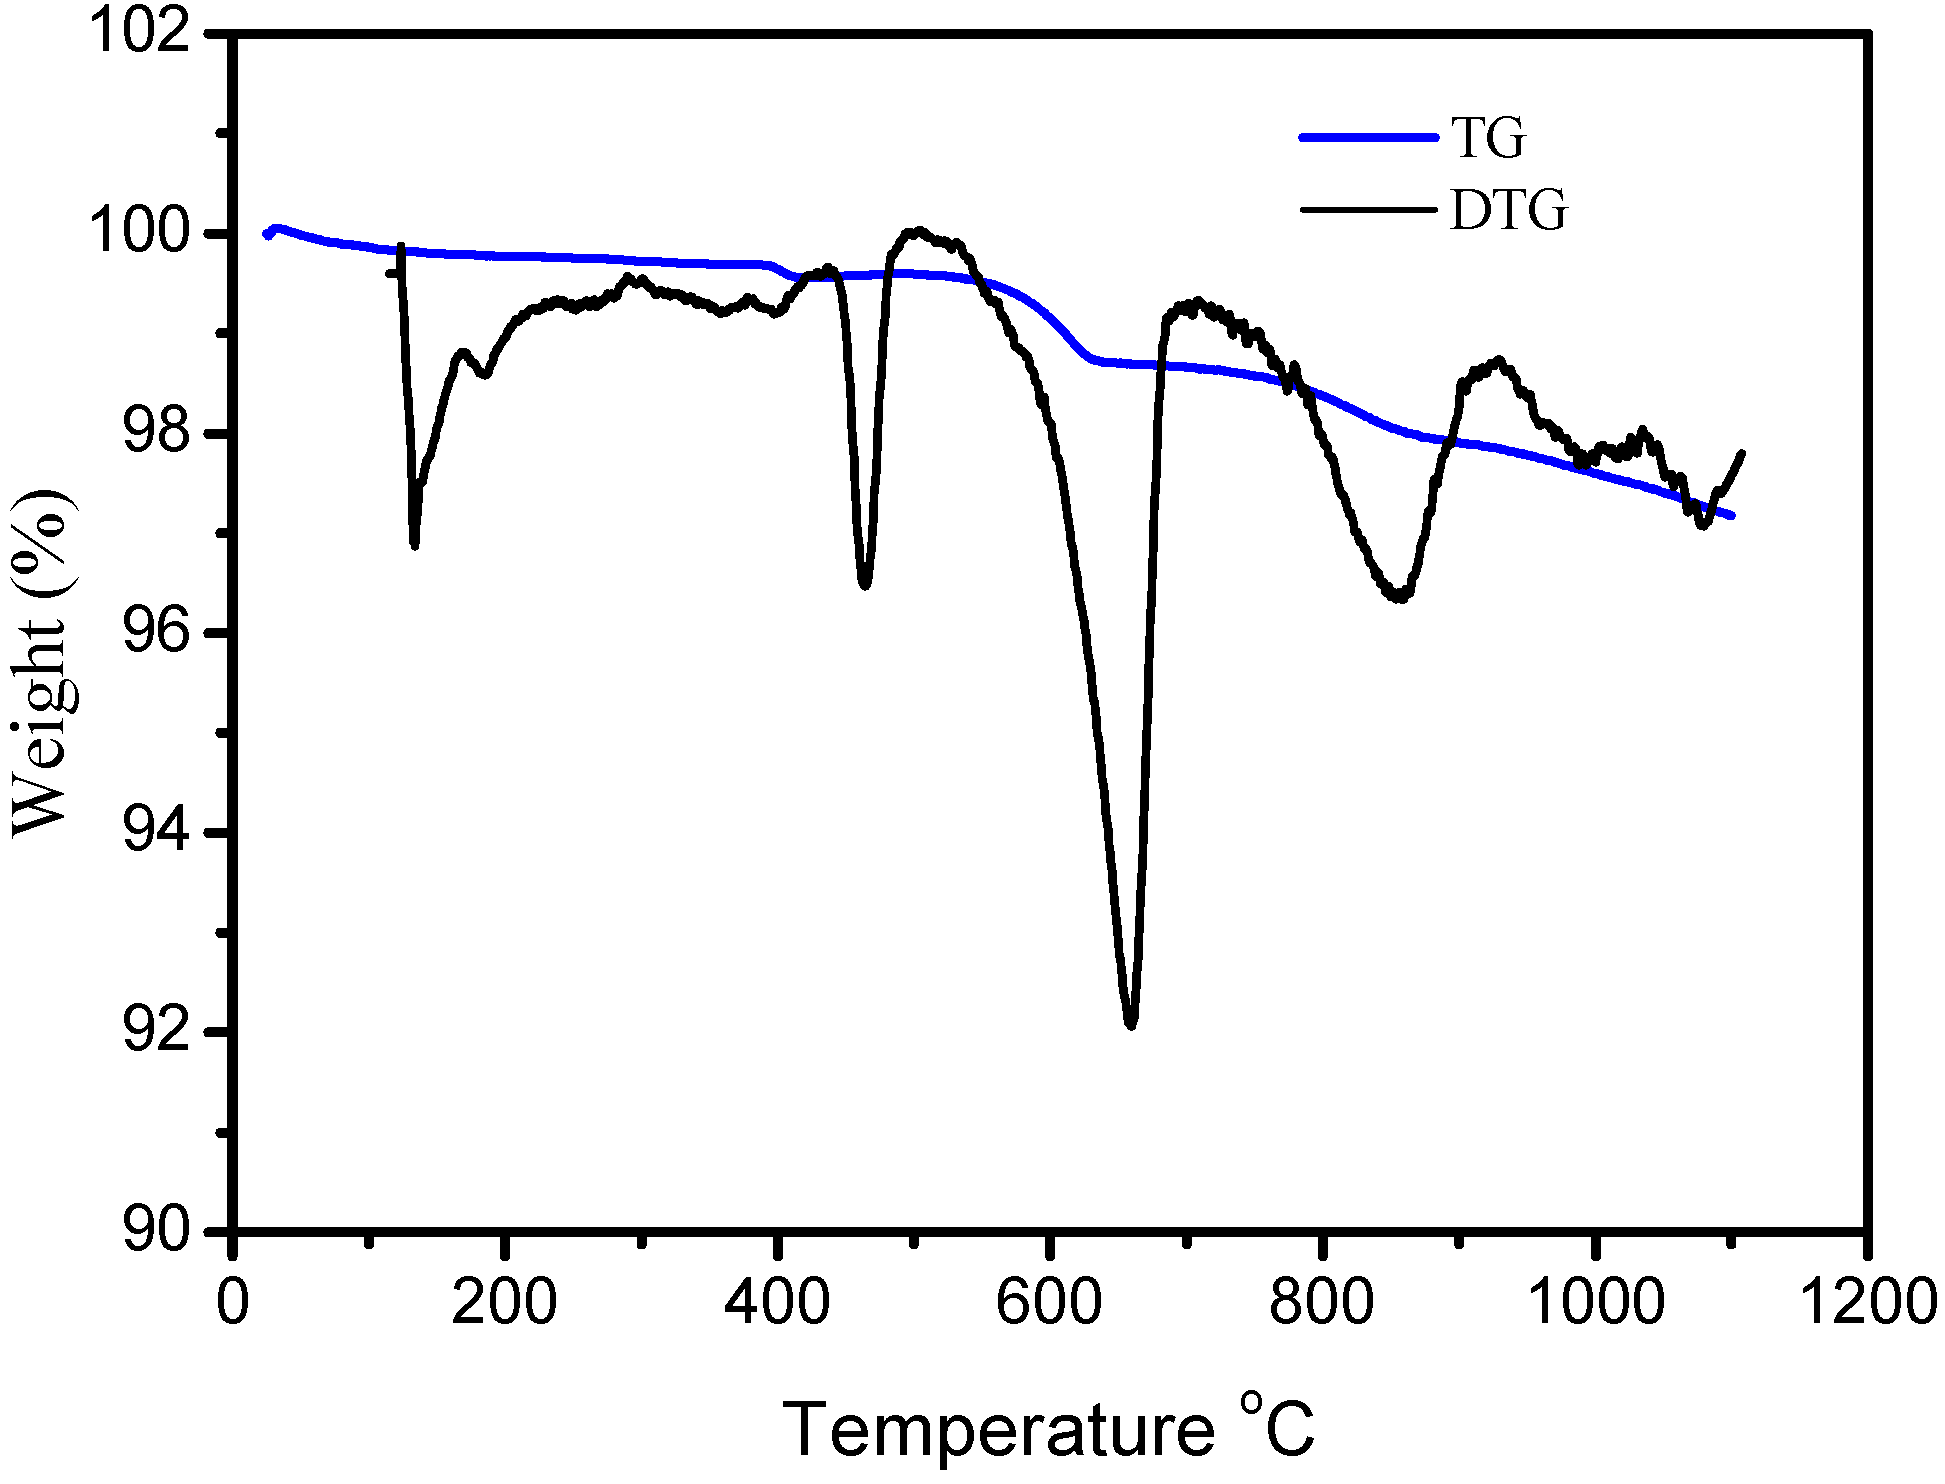
3.2. Thermogravimetric Analysis of BA

The mass loss curve of BA in Figure 3 shows that the BA has a lower mass loss with a total mass loss of 2.9%, indicating that the BA generated via a high-temperature combustion has a very stable chemical composition. The mass loss behavior can be roughly divided into four stages. From room temperature to 400 °C, the weight loss was mainly caused by the removal of water [25], where a small amount of free moisture evaporated below 100 °C, and residual bound water was removed up to 400 °C with the peak occurred at around 120 °C. At 400–600 °C, magnesium carbonate decomposition occurred [26]. The significant mass loss peak at 600–700 °C was mainly due to the gasification of KCl [27]. At temperatures over 700 °C, calcium carbonates present in the BA decomposed to release CO2, including poorly crystalline CaCO3 and highly crystalline CaCO3 (i.e., calcite) [28].

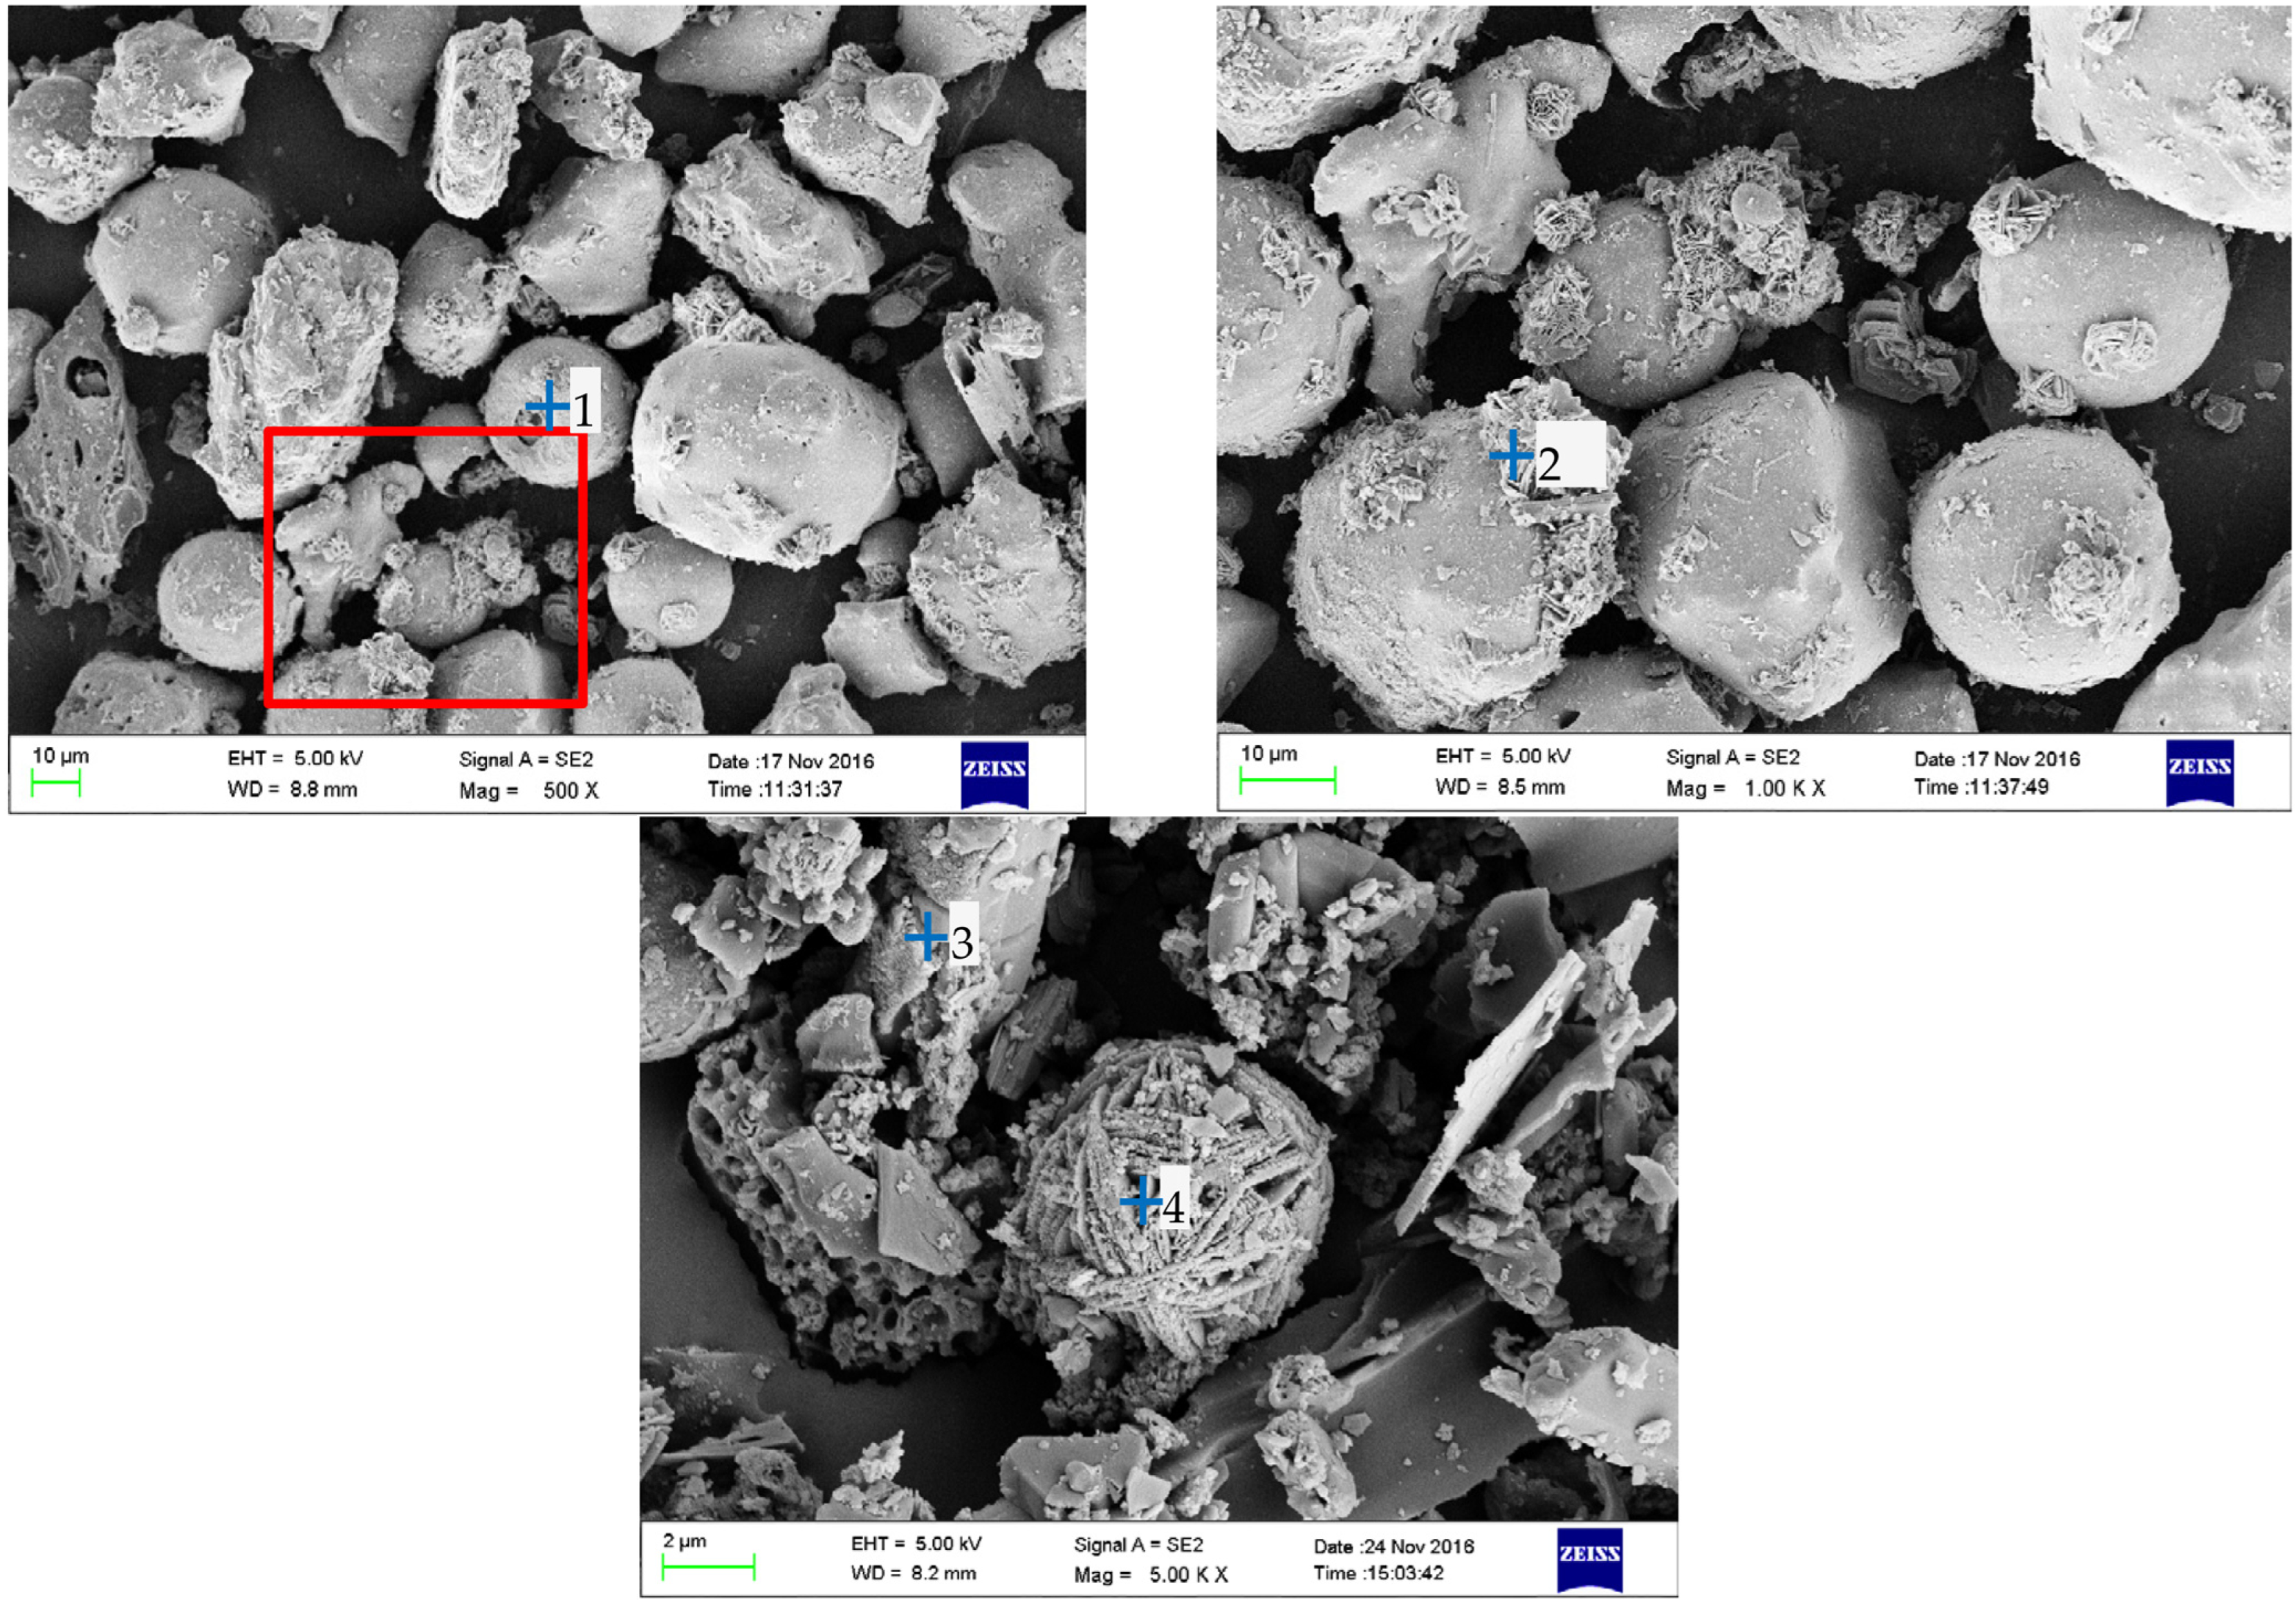
3.3. Microstructural Characteristics of the BA Particles

Figure 4 shows SEM micrographs of the BA, and Table 3 presents the EDS analysis results of the three positions labeled in Figure 4. The SEM micrographs showed that the BA was a heterogeneous material with diverse morphological characteristics. The particle sizes ranged from several micrometers to hundreds of micrometers. Some particles had smoother surfaces, while others exhibited rough textures. Based on morphology, the particles were further classified into irregular angular/acicular, spherical, and flocculent-shaped particles. Due to substantial differences in composition and combustion conditions, the morphology and particle size of BA varied significantly. Some studies [3,29,30] observed ash morphologies similar to those in this study.

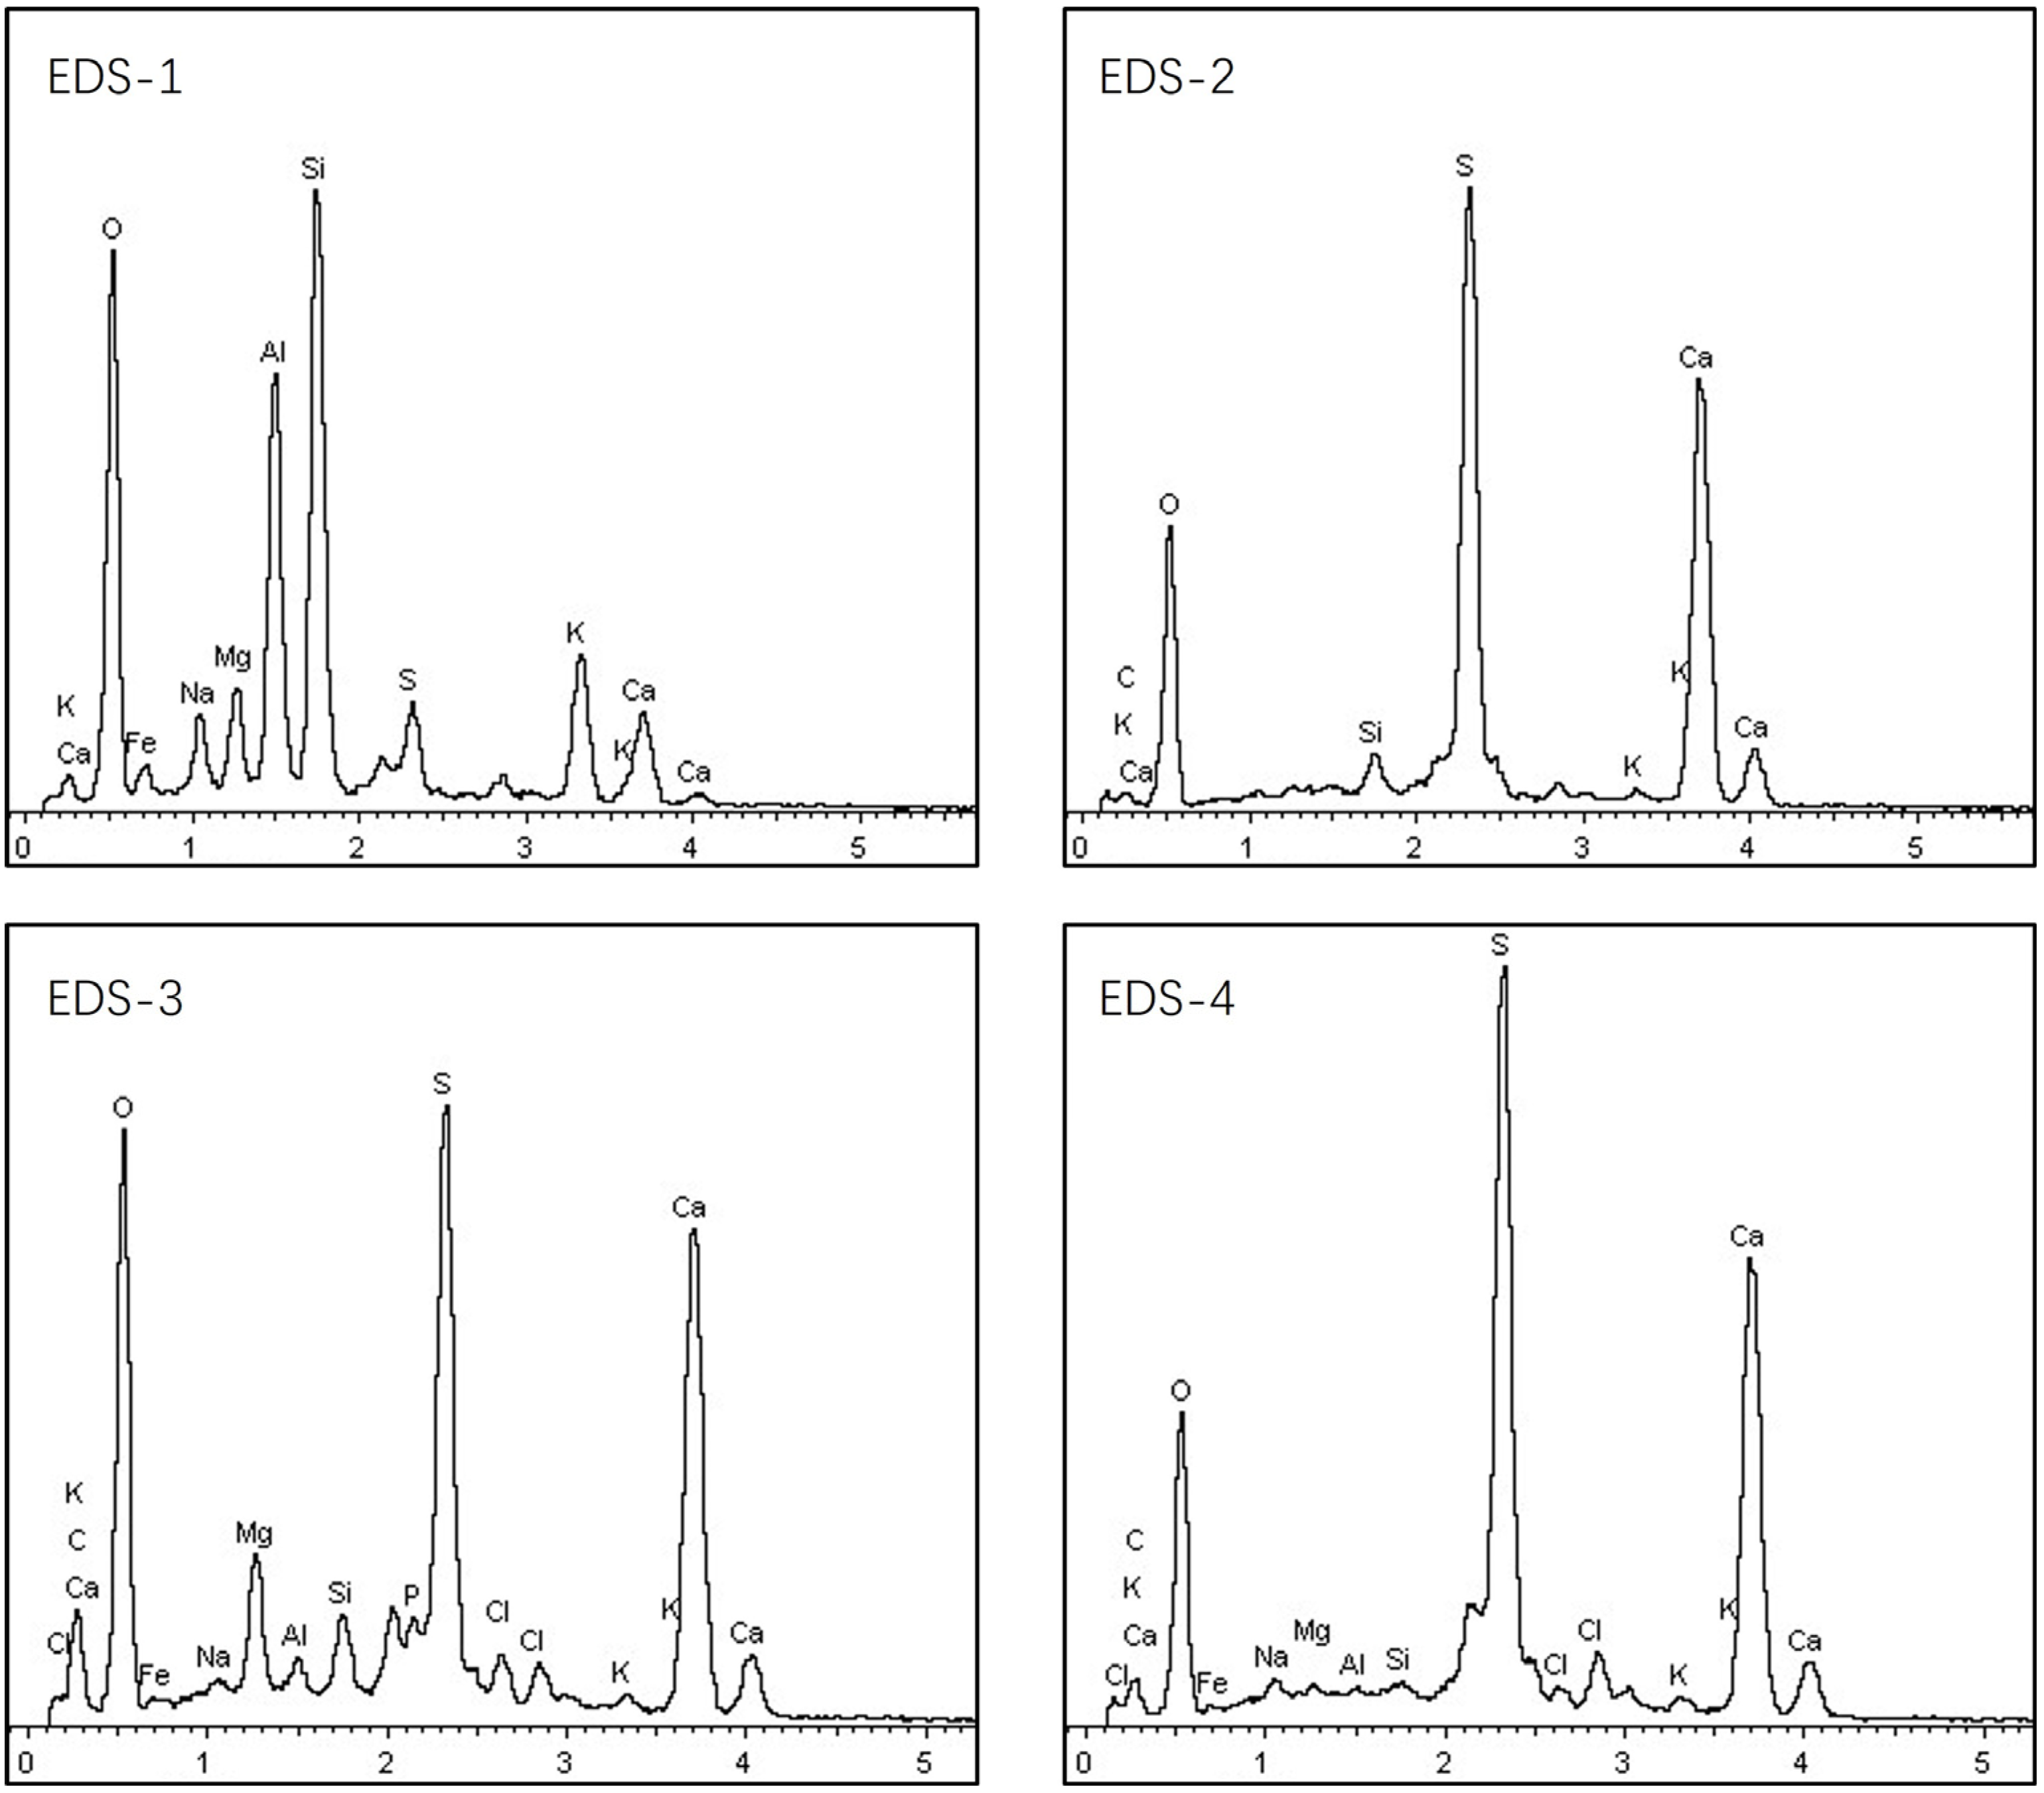
3.4. Biomass Particle Surface Analysis Using EDS

(1)
EDS analysis of angular particles
Figure 5 shows the EDS spectrograms of the three positions, and the values of the corresponding element contents are shown in Table 3. In the EDS spectrogram of angular particles (EDS-1), significant Si and O peaks were observed, along with a minor Ca peak, while no detectable peaks corresponding to K, Cl, Al, or other elements were identified, indicating that the material had a relatively uniform composition. Its surface elements included Si, O, and Ca, of which Si and O constituted 31.91% and 67.74% of atomic percentages, respectively. They mainly existed in the form of SiO2, which was the most abundant substance in BA. Hence, angular/acicular particles in the BA mainly consisted of SiO2 with a minute amount of CaO on their surface.
(2)
EDS analysis of spherical particles
The EDS spectrogram of the spherical particle (EDS-2) showed dominant peaks corresponding to elements Si, Al, O, and K, as well as trace elements such as Ca, Cl, Na, Mg, and Fe. The theoretical oxygen content for a pure SiO2-Al2O3-K2O system (55.9%) closely aligns with the measured value (58.66%), indicating the mineral phases were primarily composed of SiO2, Al2O3, and K2O when expressed as their oxide forms. The morphological characteristics of spherical particles were similar to that of floating beads generated by coal-fired boilers. During the combustion of biomass, alkaline substances, such as K, Ca, and Na, are capable of reducing the melting points of SiO2 and Al2O3, as well as forming co-doped compounds with them [30]. Therefore, spherical particles were the composite of oxides (such as Si, Ca, K, Mg, Na, and Al) generated by the high-temperature combustion of biomass. They mainly consisted of SiO2 and Al2O3 in the form of glassy aluminum silicate.
(3)
Flocculent-shaped particles
The flocculent-shaped particles (EDS-3) were products characteristic of biomass combustion with a relatively complex composition. The EDS spectrogram of EDS-3 showed that the major peaks were attributed to Ca, Si, and O, whereas the relatively smaller peaks were attributed to K, Cl, S, Mg, Na, and Fe. CaO in fly ash tends to react with other minerals, forming CaSiO3 and esperite. Thus, the main components were minerals of CaO and SiO2 with a loose flocculent-shaped structure [3,31]. The flocculent-shaped particles had a large amount of CaO with the potential to absorb SO2.

4. SO2-Absorbing Property of the BA

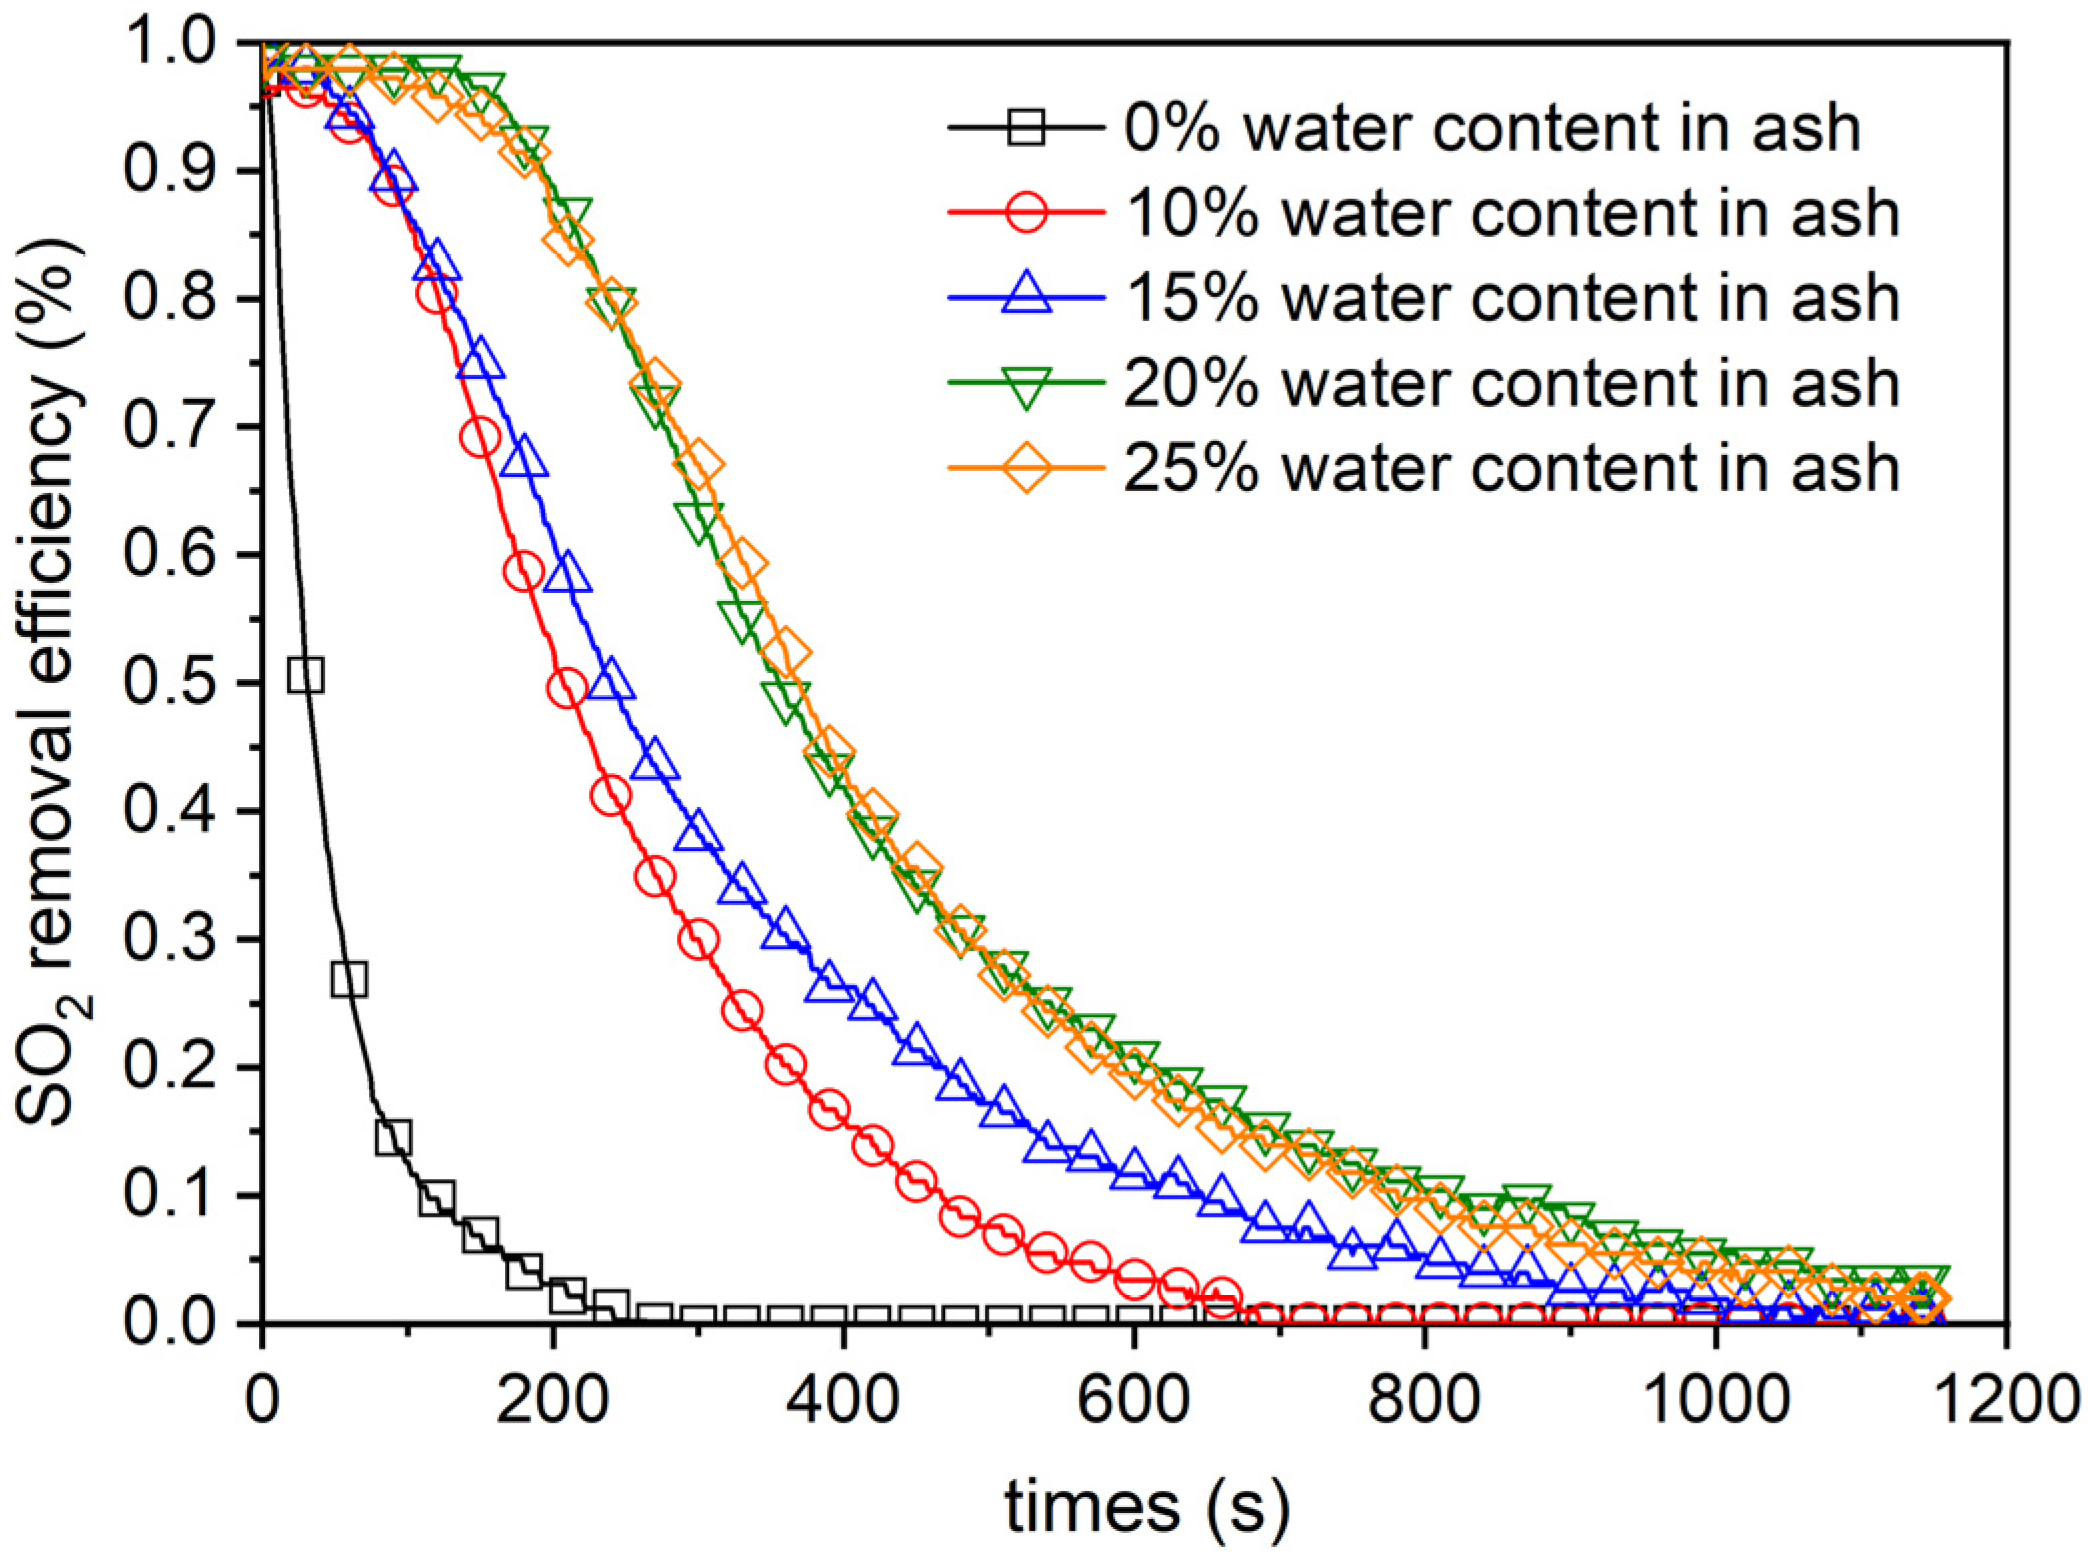
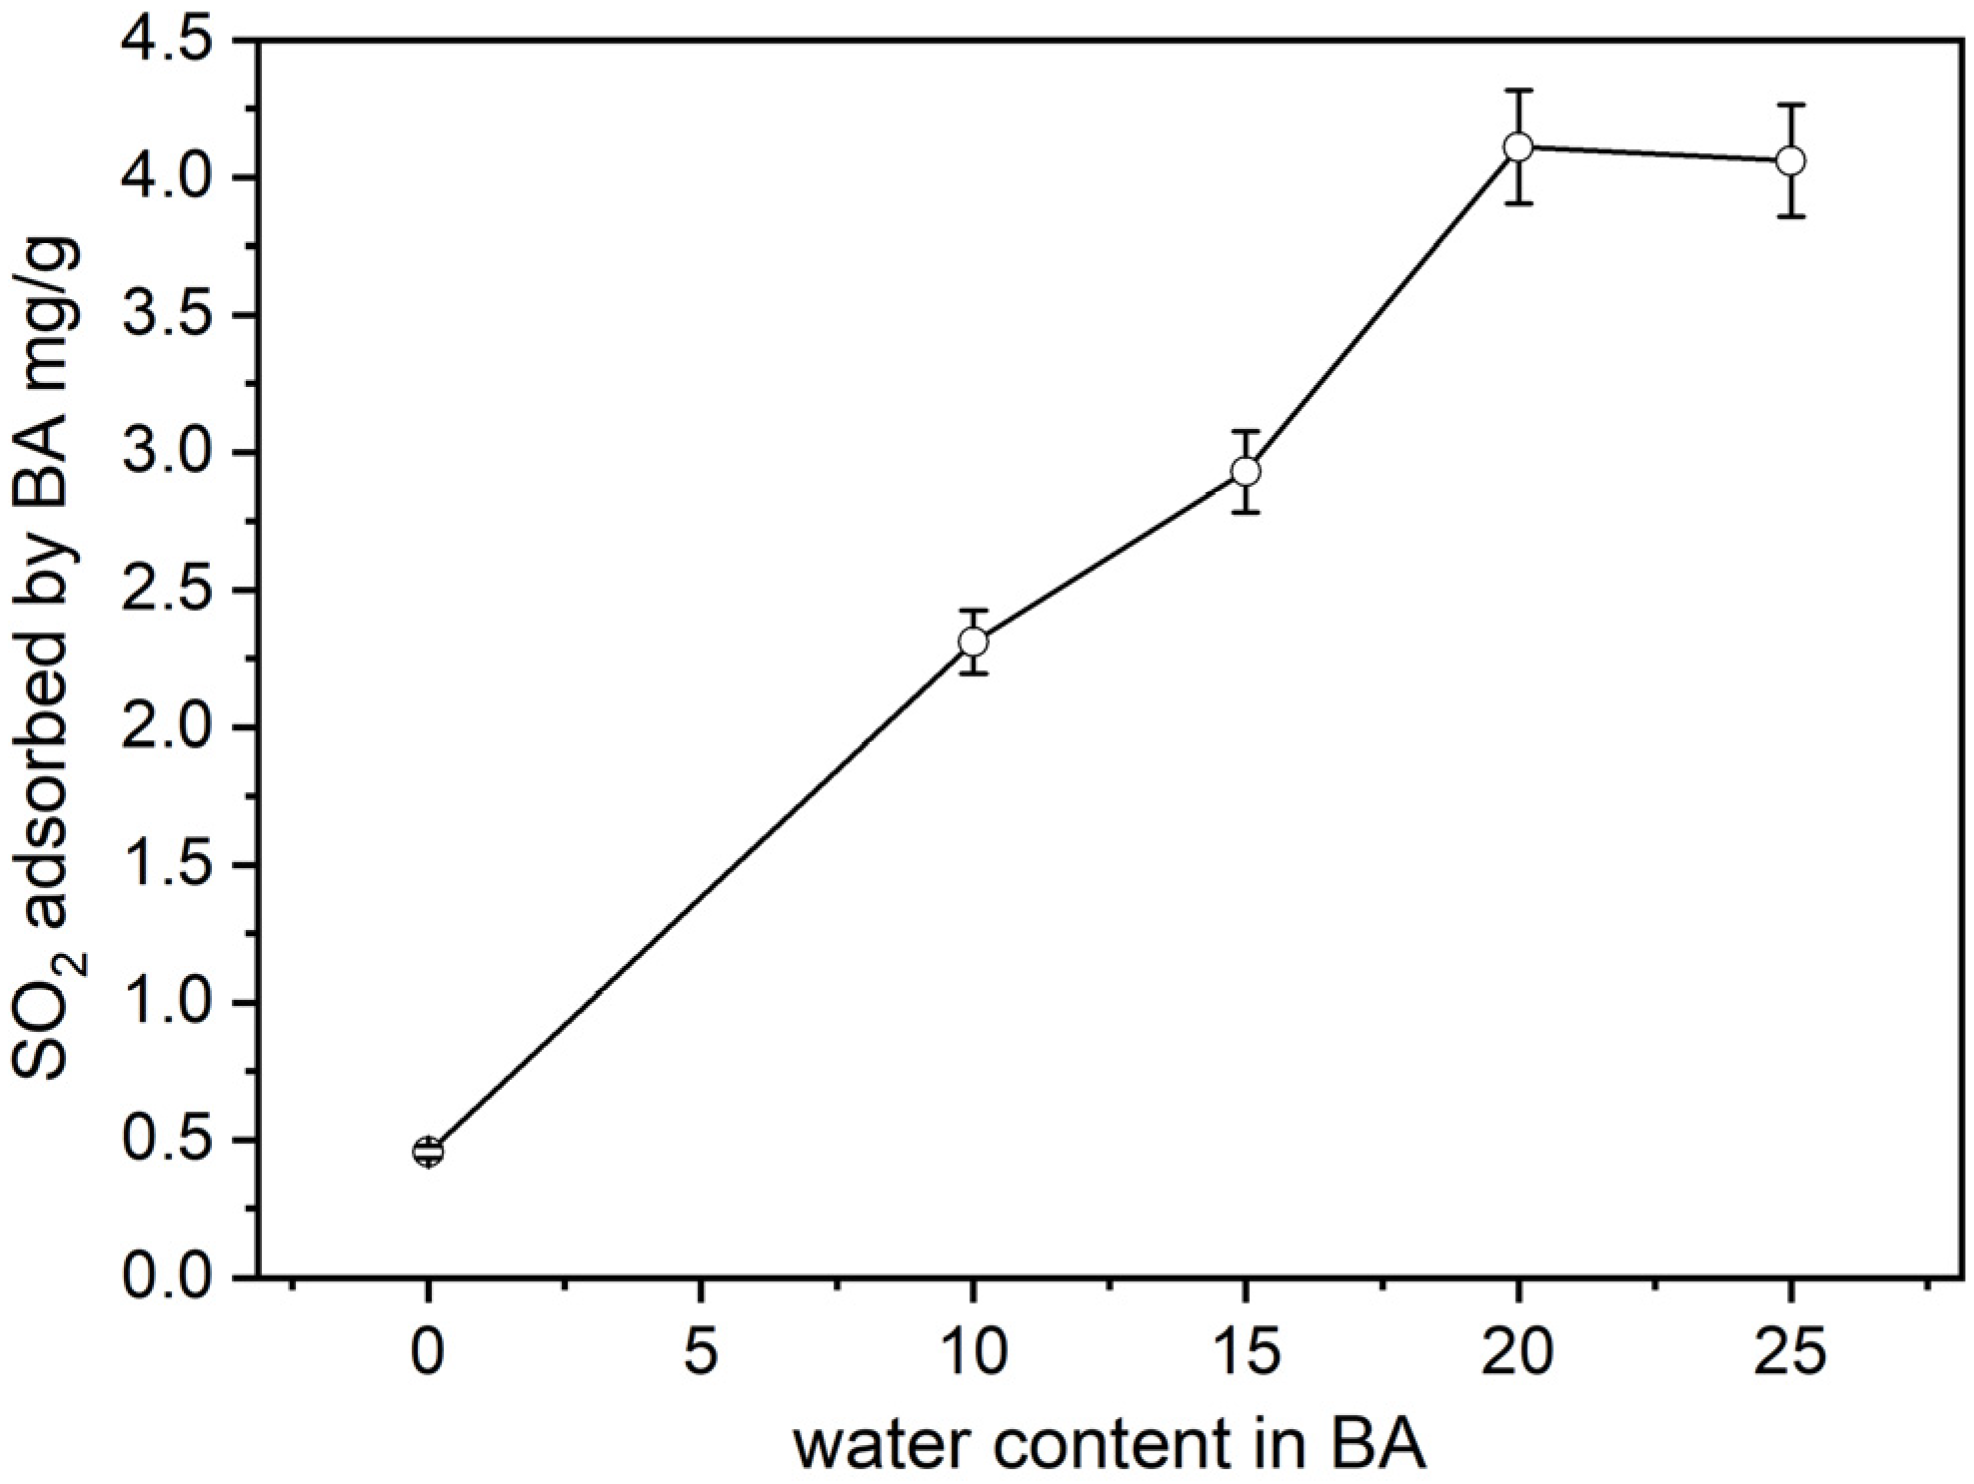
4.1. Effect of Water Content in the BA

The effects of varying the proportion of water blended with BA on the SO2 removal efficiency are demonstrated in Figure 6. It can be found that dry BA has a very low desulfurization efficiency, which rapidly attenuated over time. The blending of BA with water significantly improved its SO2 removal efficiency, indicating that water plays an important role in mediating the process of desulfurization. The desulfurization efficiency improved significantly with increasing proportion of water blended; however, the desulfurization efficiency did not improve significantly once the proportion of water reached 25%. The effect of water content in the BA on SO2 uptakes is shown in Figure 7. The dry BA absorbed a relatively small amount of 0.456 mg/g SO2. Blending with water significantly increased the SO2 absorption capacity. When the water content reached 20%, the absorbed SO2 reached 4.11 mg/g, which was 9.0 times that of dry BA. Due to the significant differences in operating conditions, ash composition, particle size, and other factors, large variations might exist in the amount of SO2 absorption. Lau et al. [32] reported that 11.10–13.50 mg/g SO2 was absorbed by rice husk ash impregnated with copper for simultaneous removal of SO2 and NO. The results indicated the potential of BA produced by biomass power plants for desulfurization.
Under the dry condition, the reaction between BA and SO2 was a slow chemical reaction with a low desulfurization efficiency due to the restriction by the gas–solid reaction. The addition of water accelerated the reaction by humidifying and activating the BA to improve the dissolution of SO2. A water film layer that formed on the surface of BA particles shifted the reaction to a gas–liquid mechanism. In this water layer, SO2 first dissolved and hydrolyzed to form H+, HSO3, and SO32− ions, which rapidly reacted with Ca2+ leached from BA under humid conditions to precipitate as sulfates (CaSO3/CaSO4) [33]. This ionic pathway bypassed the slow solid-state diffusion limitations inherent in dry gas–solid reactions, thereby accelerating sulfation kinetics. With the increase in the amount of water added, the proportion of humidified and activated BA increased with a greater capability to absorb SO2. However, excessive water addition thickened the liquid film, increasing diffusion resistance for SO2 from the gas phase to the liquid–solid interface (governed by Henry’s law), thereby shifting the rate-limiting step back to gas-phase mass transfer [34].

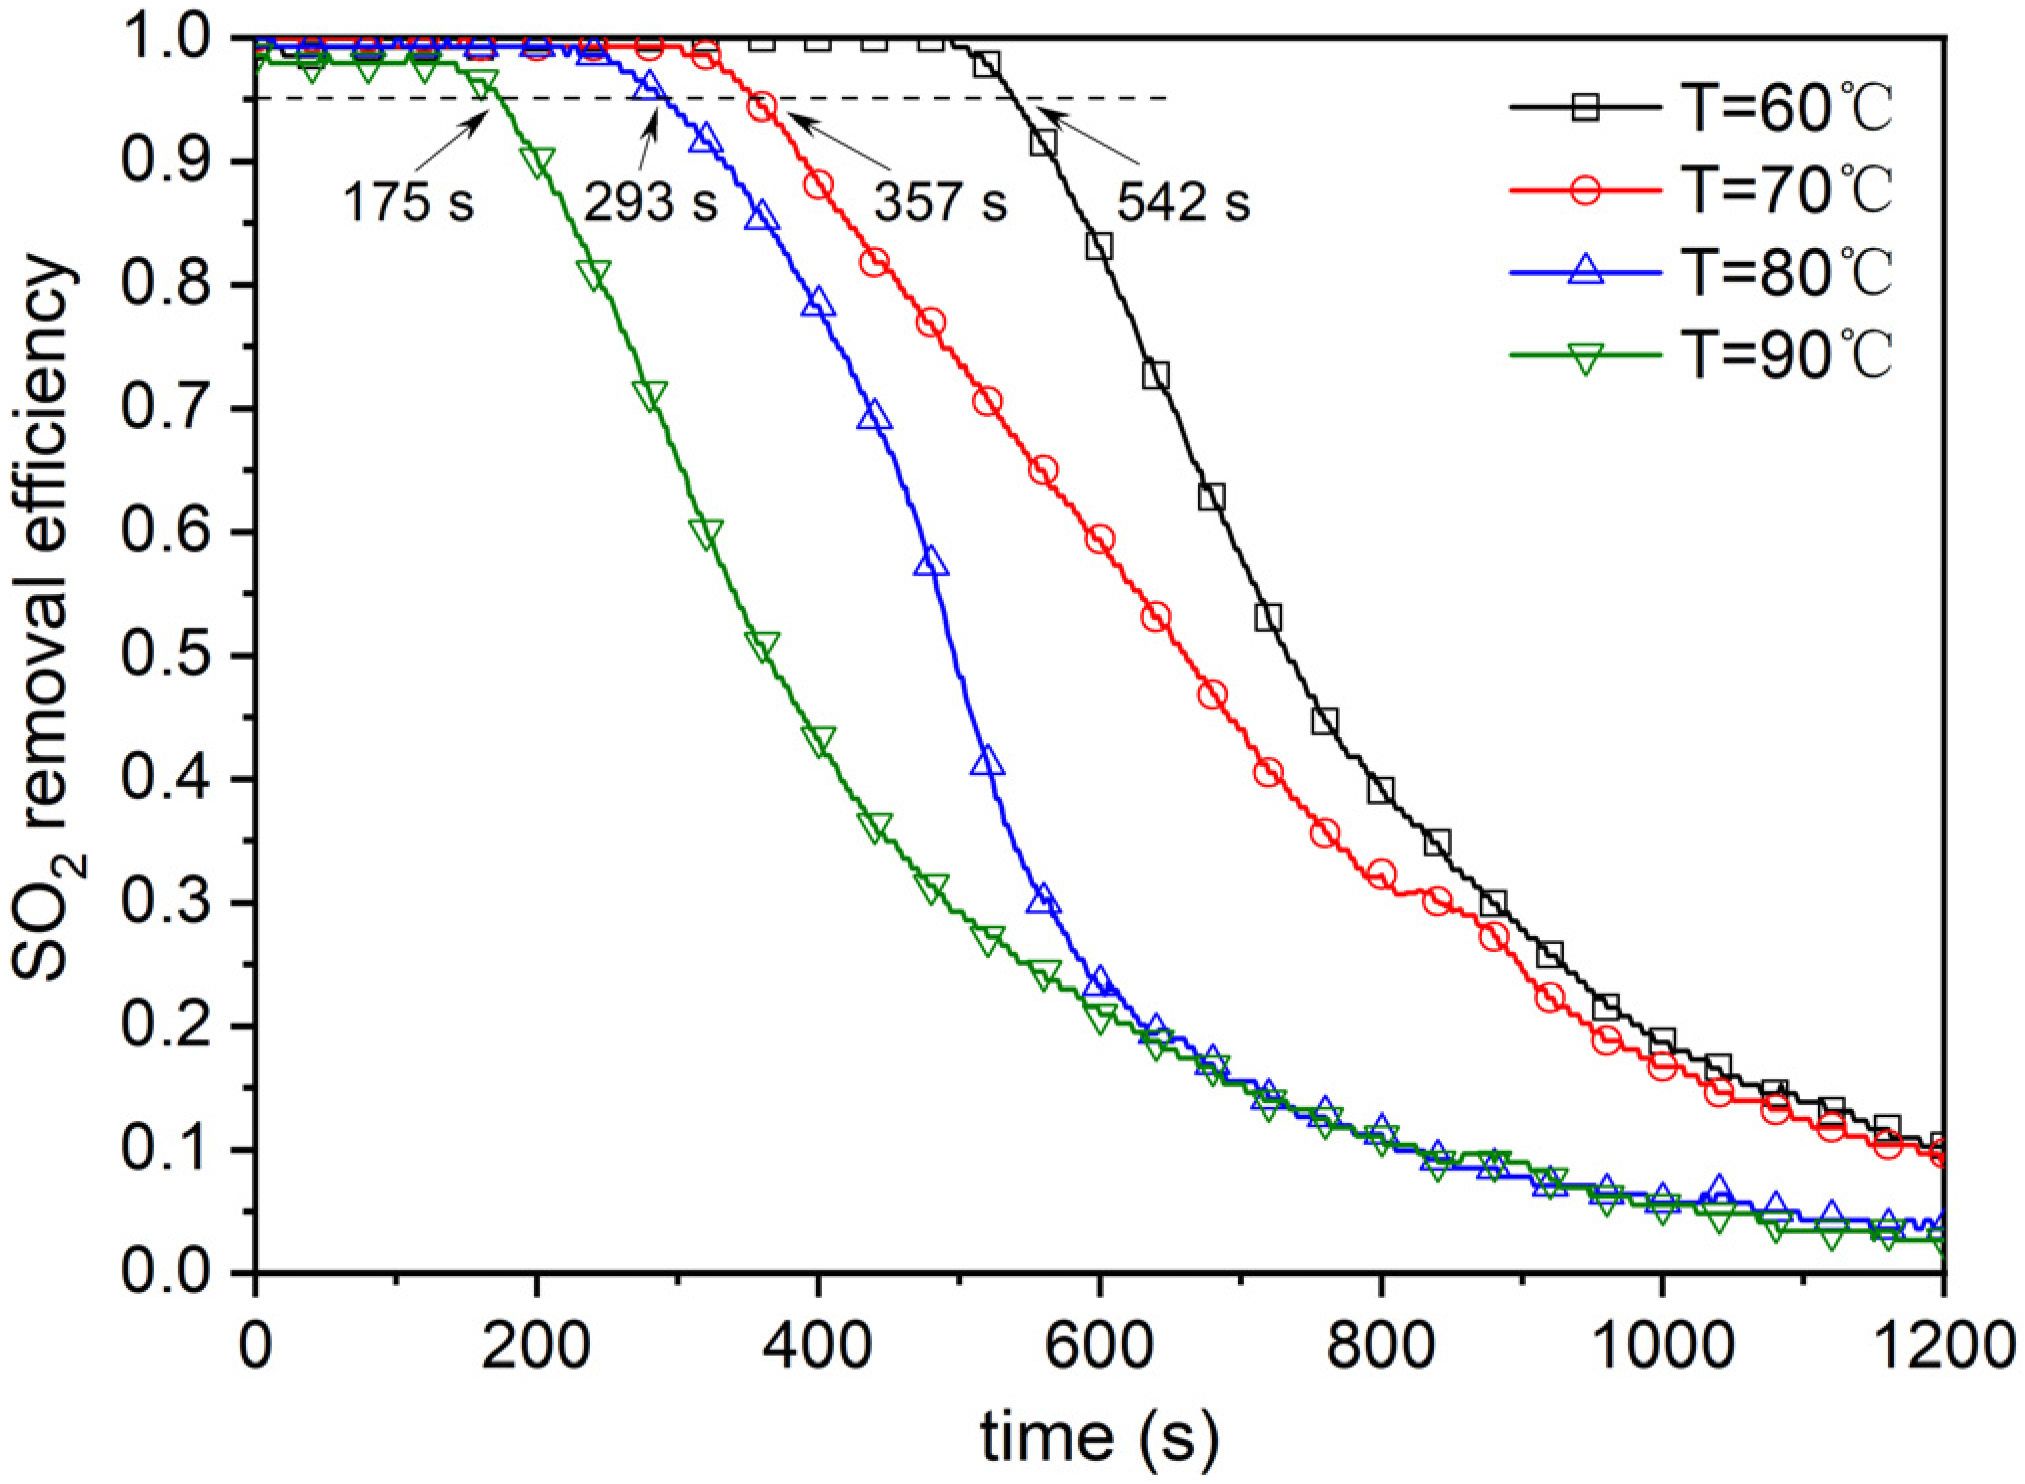
4.2. Effect of Reaction Temperature

Reaction temperature is an important factor affecting the dry and semi-dry desulfurization processes. Figure 8 shows that both the rate and efficiency of desulfurization elevated with decreasing reaction temperatures. At 90 °C, the breakthrough point (with an efficiency of 0.95) occurred at 175 s. When the temperature dropped to 60 °C, the breakthrough time was prolonged to 542 s, which was 3.1 times longer. The dissolution and hydrolysis of SO2 and neutralization reactions are all exothermic processes, which means a decrease in temperature promotes their progression. Moreover, when the moisture content in flue gas remained constant, the relative humidity of flue gas increased with decreasing reaction temperatures. There was a tendency for more vapor to transfer to the ash surface with the increase in relative humidity [22]. The water in BA evaporated more slowly at lower temperatures. As a result, the ionic reaction in the water film on the surface of BA particles lasted longer. Therefore, the desulfurization effect was improved as temperature decreased.

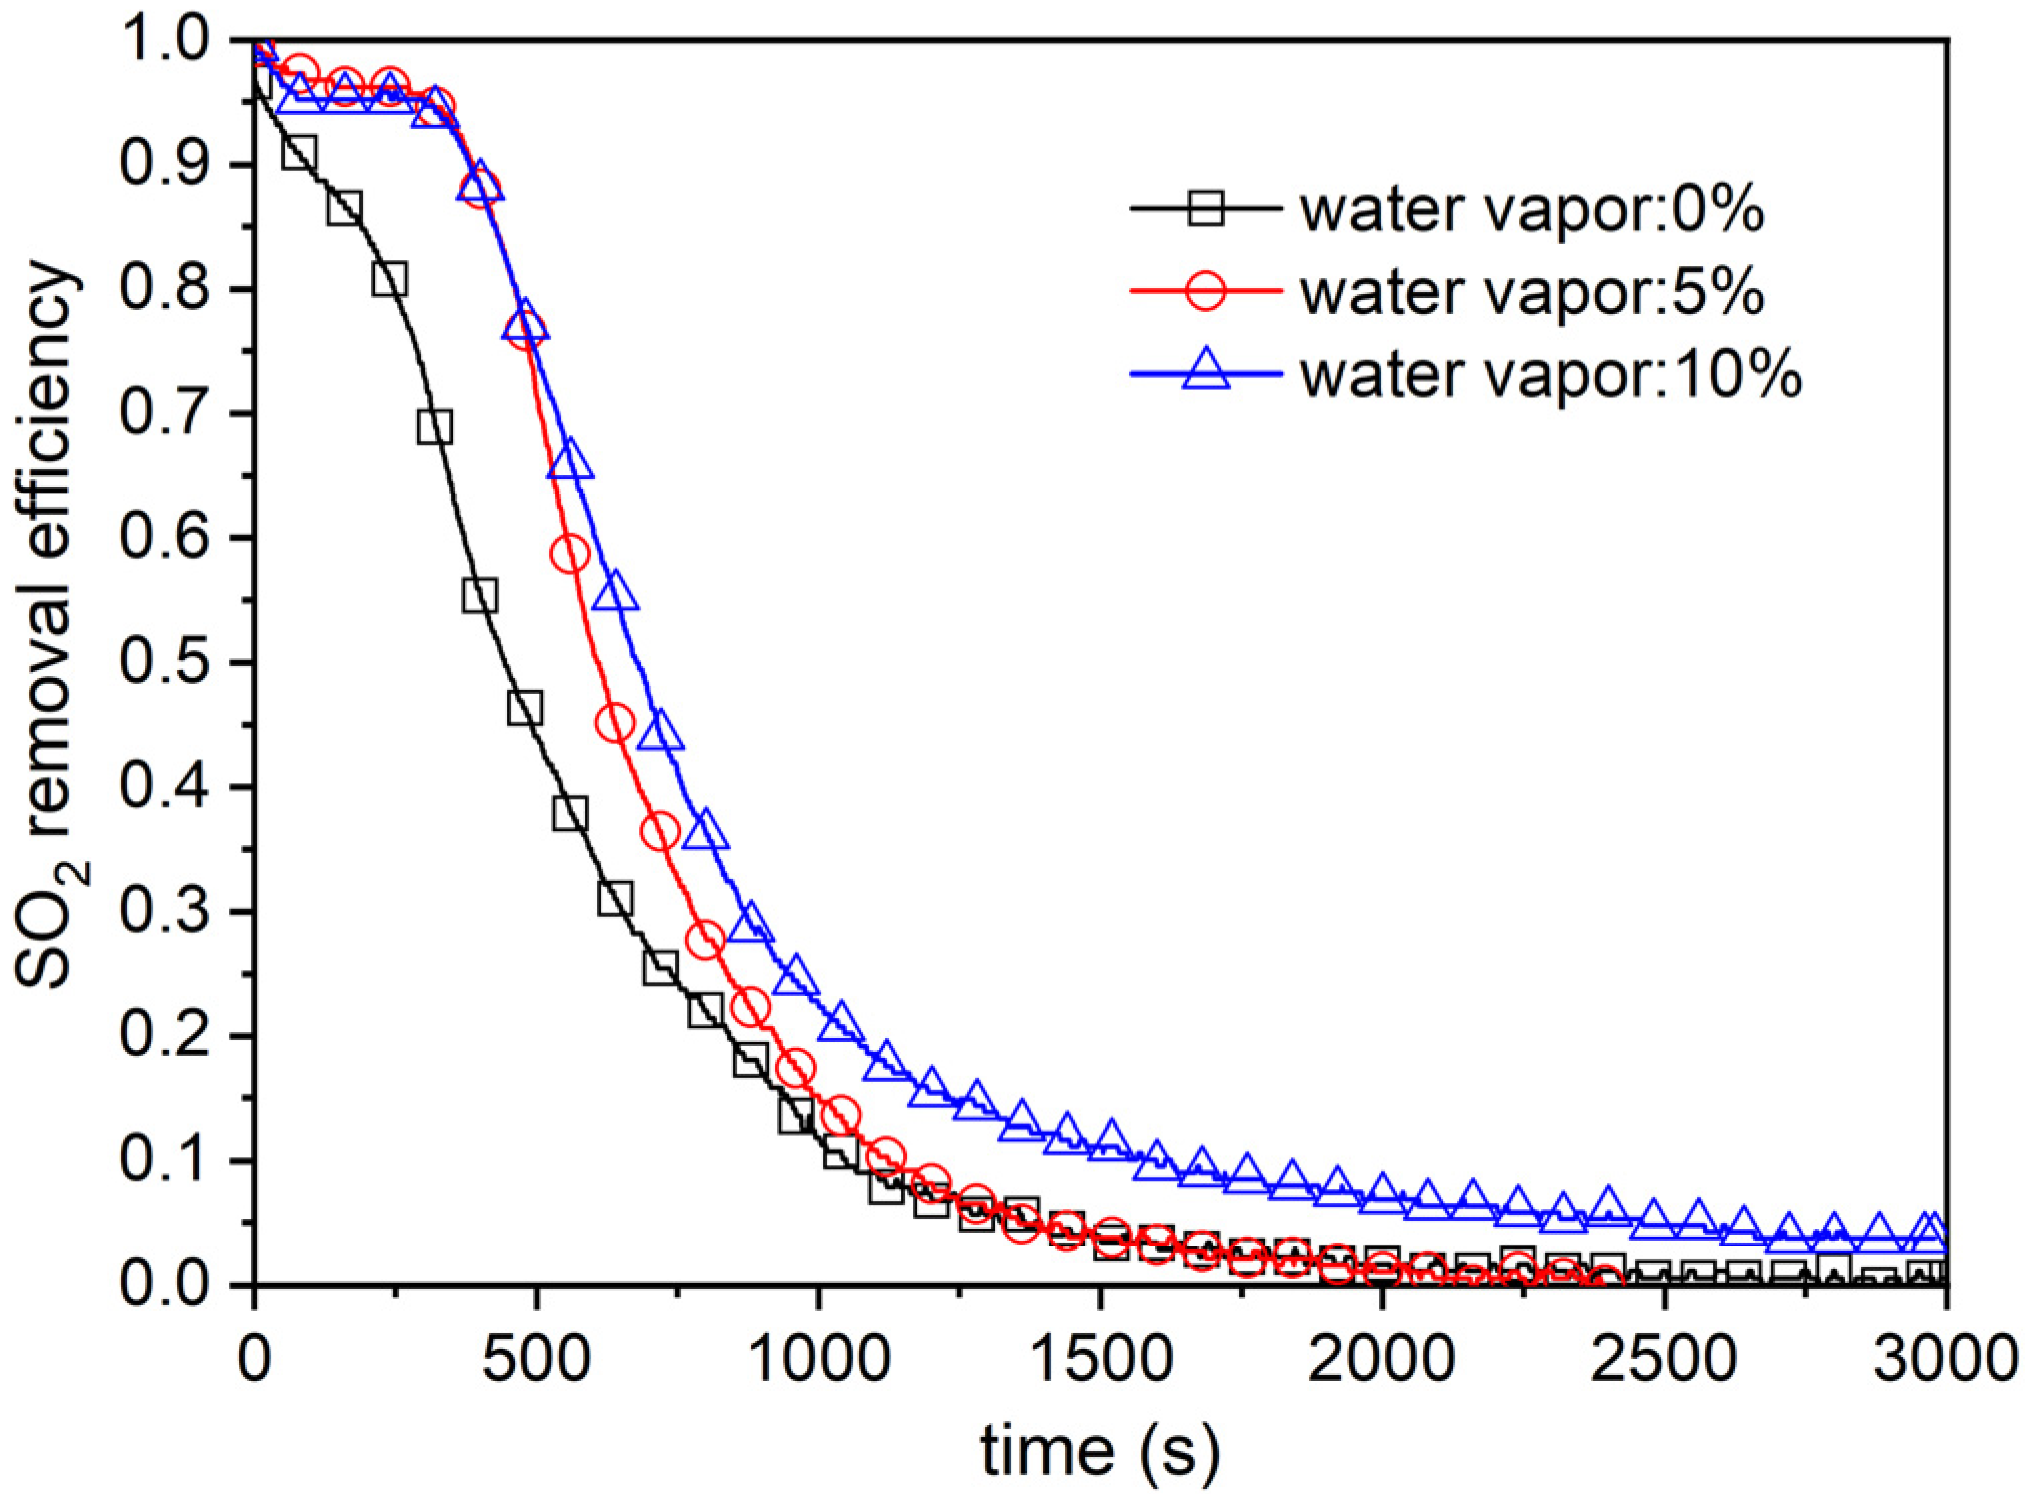
4.3. Effect of Moisture Content in Flue Gas

The effect of moisture content in flue gas on desulfurization is shown in Figure 9. When the flue gas temperature remained constant, the relative humidity increased with increasing moisture content in the flue gas, which elevated the rate and efficiency of desulfurization. In addition, at the reaction temperature of 80 °C, the water content and reaction rate of BA decreased gradually over time due to the drying effect of unsaturated flue gas on BA under the experimental conditions. However, the evaporation rate of water from BA reduced as the moisture content in flue gas increased, thereby attenuating the reduction of desulfurization rates. Therefore, the desulfurization efficiency increased with increasing flue gas moisture content.

5. Characteristic Analysis of the Desulfurized BA

5.1. Chemical Composition Analyses of the Desulfurized BA Using XRF and XRD

The desulfurized BA resulted from the reaction between BA with flue gas. The XRF result of desulfurized BA is shown in Table 4. Compared with Table 2, the SO3 content increased significantly from 1.6% to 9.14%. Since the measured content was a relative content, not an absolute content, the relatively small increases or decreases of content data do not represent the actual increase or decrease of substances. Nevertheless, the 5.7-fold increase in SO3, which was larger than the change rates of other components, indicated that BA absorbed a certain amount of SO2 and thus played a role in sulfur fixation. Elements such as K, Na, and Cl might partially dissolve as ions in water and be taken away by wet flue gas, resulting in decreases in their contents. The elevations of CaO, Al2O3, Fe2O3, and other components derived from mass loss of other components, not absolute increase.
Figure 10 shows the XRD patterns of the BA after desulfurization. Compared with the pre-desulfurization XRD results (Figure 2), SiO2 and KCl remained detectable, whereas CaCO3 and CaSiO3 phases vanished. Notably, CaSO4 was newly identified. The results demonstrated that Ca-containing substances participated in the desulfurization process, resulting in the formation of CaSO4 as the primary desulfurization product.

5.2. SEM and EDS Analyses

SEM micrographs and EDS spectrograms of the desulfurized BA are shown in Figure 11 and Figure 12, respectively, while the EDS result is shown in Table 5. The results showed that the surface morphology of desulfurized BA did not alter a large amount in the presence of irregular angular/acicular, spherical, and sintered-shaped particles, given that there were no significant flocculent-shaped particles. The addition of water humidified and activated the BA in the process of desulfurization. Angular, spherical, and sintered-shaped particles retained their original surface morphology due to their rigid textures. The presence of water on the surface of loose flocculent-shaped particles enhanced SO2 capture through gas–liquid reactions. After the reaction, flaky crystalline solids appeared on the particle surfaces and interparticle spaces. The humidification process also contributed to the transformation of flocculent CaO-rich particles into flaky sulfated products, due to the dissolution–recrystallization mechanism during the reaction. The EDS results (EDS-2, 3, and 4) showed that those crystalline solids have higher contents of S and Ca elements, and the atomic ratio of S to Ca elements was close to 1:1. Meantime, the flaky crystalline structure exhibited a morphology consistent with CaSO4. The results suggested that the sulfated products consist primarily of CaSO4.
Combining all results of XRF, XRD, SEM, and EDS analyses, the flocculent CaO-rich particles in BA served as the main SO2-absorbing material. Facilitated by the water, SO2 reacted with Ca-containing substances to form CaSO3, which was then oxidized to CaSO4 in the simulated flue gas containing 8% O2. This method shares the same desulfurization principle as wet desulfurization [35], does not affect the reusability of BA, and causes no additional adverse environmental impacts.

6. Conclusions

Under the stringent requirement of ultra-clean flue gas emission, this study explored the feasibility of employing BA as a low-cost sorbent for low-temperature FGD in biomass power plants.
BA exhibited a heterogeneous composition, containing alkali metal oxides (K2O at 7.57% and Na2O at 1.47%) and alkaline earth metal oxides (CaO at 10.52% and MgO at 4.52%). SiO2 constituted the primary crystalline phase, while KCl, CaCO3, and CaSiO3 phases were also identified. BA showed diverse morphological characteristics, including irregular angular/acicular, spherical, and flocculent-shaped particles, among which flocculent-shaped particles rich in CaO were identified as the primary active components for SO2 absorption.
The results of fixed-bed experiments showed that blending BA with water significantly improved SO2 removal efficiency, attributed to a water film formed on BA particles, turning the gas–solid reaction into an ionic one. When water content reached 20%, the SO2 absorption capacity was 9.0 times that of dry BA. However, further increasing the water content to 25% diminished this improvement, as gas diffusion through the thickened liquid film became the limiting factor. Decreasing the reaction temperature or increasing the moisture content in flue gas enhanced the desulfurization efficiency. XRF analysis showed a significant increase in SO3 content of desulfurized BA from 1.6% to 9.14%. XRD patterns and EDS analysis indicated that CaSO4 was the dominant product. Combined with SEM images, it was observed that CaSO4 crystallites formed on particle surfaces and interparticle spaces, while flocculent-shaped CaO-rich particles were consumed during the reaction.
This work repurposed BA, a waste byproduct, into a functional sorbent. Future work should focus on scaling up reactor designs, evaluating long-term stability under industrial flue gas conditions, and conducting a comprehensive cost/benefit analysis comparing BA utilization with conventional desulfurization methods.

Author Contributions

Formal analysis, J.Z. (Jie Zhou); Investigation, A.W.; Resources, B.Z.; Data curation, P.Z.; Writing—original draft, J.Z. (Jun Zhang); Writing—review & editing, L.Z. All authors have read and agreed to the published version of the manuscript.

Funding

This study was supported by the Natural Science Foundation of Shandong Province (grant number ZR2022ME176) and the Huaneng Group Headquarters Technology Project (grant number HNKJ22-H35).

Data Availability Statement

The original contributions presented in the study are included in the article, further inquiries can be directed to the corresponding author.

Conflicts of Interest

Authors Jun Zhang, Peng Zhang, Jie Zhou and Bo Zhao were employed by the company Huaneng Jiaxiang Power Generation Co., Ltd. The remaining authors declare that the research was conducted in the absence of any commercial or financial relationships that could be construed as a potential conflict of interest.

References

  1. Cornea, T.M.; Dima, M. Biomass energy—A way towards asustainable future. Environ. Eng. Manag. J. 2010, 9, 1341–1345. [Google Scholar] [CrossRef]
  2. De La Grée, G.D.; Florea, M.V.A.; Keulen, A.; Brouwers, H.J.H. Contaminated biomass fly ashes—Characterization and treatment optimization for reuse as building materials. Waste Manag. 2016, 49, 96–109. [Google Scholar] [CrossRef] [PubMed]
  3. Tarelho, L.A.C.; Teixeira, E.R.; Silva, D.F.R.; Modolo, R.C.E.; Labrincha, J.A.; Rocha, F.J.F.T. Characteristics of distinct ash flows in a biomass thermal power plant with bubbling fluidised bed combustor. Energy 2015, 90, 387–402. [Google Scholar] [CrossRef]
  4. Lin, W.; Song, W. Power Production from biomass in Denmark. J. Fuel Chem. Technol. 2005, 33, 650–655. [Google Scholar]
  5. Vassilev, S.V.; Baxter, D.; Andersen, L.K.; Vassileva, C.G. An overview of the composition and application of biomass ash.: Part 2. Potential utilisation, technological and ecological advantages and challenges. Fuel 2013, 105, 19–39. [Google Scholar] [CrossRef]
  6. Chindaprasirt, P.; Jaturapitakkul, C.; Chalee, W.; Rattanasak, U. Comparative study on the characteristics of fly ash and bottom ash geopolymers. Waste Manag. 2009, 29, 539–543. [Google Scholar] [CrossRef]
  7. Baxter, L.L.; Miles, T.R.; Miles, T.R., Jr.; Jenkins, B.M.; Milne, T.; Dayton, D.; Bryers, R.W.; Oden, L.L. The behavior of inorganicmaterial in biomass fired power boilers: Field and laboratoryexperiences. Fuel Process. Technol. 1998, 54, 47–78. [Google Scholar] [CrossRef]
  8. Girón, R.P.; Ruiz, B.; Fuente, E.; Gil, R.R.; Suárez-Ruiz, I. Properties of fly ash from forest biomass combustion. Fuel 2013, 114, 71–77. [Google Scholar] [CrossRef]
  9. Vassilev, S.V.; Baxter, D.; Andersen, L.K.; Vassileva, C.G.; Morgan, T.J. An overview of the organic and inorganic phase composition of biomass. Fuel 2012, 94, 1–33. [Google Scholar] [CrossRef]
  10. RenYong, S.; JiuYu, L.; Jun, J.; Mehmood, K.; Yuan, L.; RenKou, X.; Wei, Q. Characteristics of biomass ashes from different materials and their ameliorative effects on acid soils. J. Environ. Sci. 2017, 55, 294–302. [Google Scholar]
  11. Dahl, O.; Nurmesniemi, H.; Poykio, R.; Watkins, G. Heavy metal concentrations in bottom ash and fly ash fractions from a large-sized (246 MW) fluidized bed boiler with respect to their Finnish forest fertilizer limit values. Fuel Process. Technol. 2010, 91, 1634–1639. [Google Scholar] [CrossRef]
  12. Zhang, Z.; Han, Z.; Sheng, C. Feasibility evaluation of biomass fly ashes from power station using as fertilizer. Trans. Chin. Soc. Agric. Eng. 2016, 32, 200–205. [Google Scholar]
  13. Teixeira, E.R.; Mateus, R.; Camões, A.F.; Bragança, L.; Branco, F.G. Comparative environmental life-cycle analysis of concretes using biomass and coal fly ashes as partial cement replacement material. J. Clean. Prod. 2016, 112, 2221–2230. [Google Scholar] [CrossRef]
  14. Obernberger, I.; Supancic, K. Possibilities of ash utilisation from biomass combustion plants. In Proceedings of the 17th European Biomass Conference & Exhibition, Hamburg, Germany, 29 June–3 July 2009. [Google Scholar]
  15. Odzijewicz, J.I.; Wołejko, E.; Wydro, U.; Wasil, M.; Jabłońska-Trypuć, A. Utilization of Ashes from Biomass Combustion. Energies 2022, 15, 9653. [Google Scholar] [CrossRef]
  16. Dahl, O.; Nurmesniemi, H.; Poykio, R.; Watkins, G. Comparison of the characteristics of bottom ash and fly ash from a medium-size (32 MW) municipal district heating plant incinerating forest residues and peat in a fluidized-bed boiler. Fuel Process. Technol. 2009, 90, 871–878. [Google Scholar] [CrossRef]
  17. Wang, W.; Zheng, Y.; Liu, X.; Wang, P. Characterization of Typical Biomass Ashes and Study on Their Potential of CO2 Fixation. Energy Fuels 2012, 26, 6047–6052. [Google Scholar] [CrossRef]
  18. Demirbas, A. Combustion characteristics of different biomass fuels. Prog. Energy Combust. Sci. 2004, 30, 219–230. [Google Scholar] [CrossRef]
  19. Qi, J.; Han, K.; Wang, Q.; Gao, J. Carbonization of biomass: Effect of additives on alkali metals residue, SO2 and NO emission of chars during combustion. Energy 2017, 130, 560–569. [Google Scholar] [CrossRef]
  20. Zhang, Z.; Zeng, Q.; Hao, R.; He, H.; Yang, F.; Mao, X.; Mao, Y.; Zhao, P. Combustion behavior, emission characteristics of SO2, SO3 and NO, and in situ control of SO2 and NO during the cocombustion of anthracite and dried sawdust sludge. Sci. Total Environ. 2019, 646, 716–726. [Google Scholar] [CrossRef]
  21. Rokni, E.; Ren, X.; Panahi, A.; Levendis, Y.A. Emissions of SO2, NOx, CO2, and HCl from Co-firing of coals with raw and torrefied biomass fuels. Fuel 2018, 211, 363–374. [Google Scholar] [CrossRef]
  22. Dahlan, I.; Lee, K.T.; Kamaruddin, A.H.; Mohamed, A.R. Rice Husk Ash/Calcium Oxide/Ceria Sorbent for Simultaneous Removal of Sulfur Dioxide and Nitric Oxide from Flue Gas at Low Temperature. Environ. Eng. Sci. 2009, 26, 1257–1265. [Google Scholar] [CrossRef]
  23. Dahlan, I.; Lee, K.T.; Kamaruddin, A.H.; Mohamed, A.R. Sorption of SO2 and NO from simulated flue gas over rice husk ash (RHA)/CaO/CeO2 sorbent: Evaluation of deactivation kinetic parameters. J. Hazard. Mater. 2011, 185, 1609–1613. [Google Scholar] [CrossRef] [PubMed]
  24. Lau, L.C.; Lee, K.T.; Mohamed, A.R. Effect of operating conditions towards simultaneous removal of SO2 and NO using copper modified rice husk ash: Role as sorbent and catalyst. J. Environ. Chem. Eng. 2013, 1, 755–761. [Google Scholar] [CrossRef]
  25. Jia, G.; Wang, Y.; Yang, F.; Ma, Z. Preparation of CFB fly ash/sewage sludge ceramsite and the morphological transformation and release properties of sulfur. Constr. Build. Mater. 2023, 373, 130864. [Google Scholar] [CrossRef]
  26. Khan, N.; Dollimore, D.; Alexander, K.; Wilburn, F.W. The origin of the exothermic peak in the thermal decomposition of basic magnesium carbonate. Thermochim. Acta 2001, 367–368, 321–333. [Google Scholar] [CrossRef]
  27. Johansen, J.M.; Jakobsen, J.G.; Frandsen, F.J.; Glarborg, P. Release of K, Cl, and S during Pyrolysis and Combustion of High-Chlorine Biomass. Energy Fuels 2011, 25, 4961–4971. [Google Scholar] [CrossRef]
  28. Benassi, L.; Dalipi, R.; Consigli, V.; Pasquali, M.; Borgese, L.; Depero, L.E.; Clegg, F.; Bingham, P.A.; Bontempi, E. Integrated management of ash from industrial and domestic combustion: A new sustainable approach for reducing greenhouse gas emissions from energy conversion. Environ. Sci. Pollut. Res. 2017, 24, 14834–14846. [Google Scholar] [CrossRef]
  29. Saraber, A. Co-combustion and its impact on fly ash quality: Pilot-scale experiments. Fuel Process. Technol. 2012, 104, 105–114. [Google Scholar] [CrossRef]
  30. Kutchko, B.G.; Kim, A.G. Fly ash characterization by SEM-EDS. Fuel 2006, 85, 2537–2544. [Google Scholar] [CrossRef]
  31. Öhman, M.; Nordin, A.; Skrifvars, B.J.; Backman, R.; Hupa, M. Bed agglomeration char-acteristics during fluidized bed combustion of biomassfuels. Energy Fuels 2000, 14, 169–178. [Google Scholar] [CrossRef]
  32. Lau, L.C.; Lee, K.T.; Mohamed, A.R. Rice husk ash sorbent doped with copper for simultaneous removal of SO2 and NO: Optimization study. J. Hazard. Mater. 2010, 183, 738–745. [Google Scholar] [CrossRef] [PubMed]
  33. Hill, F.F.; Zank, J. Flue gas desulphurization by spray dry absorption. Chem. Eng. Process. Process Intensif. 2000, 39, 45–52. [Google Scholar] [CrossRef]
  34. Zhou, Z.; Lu, J.; Ma, X. SO3/sulfuric acid mist removal in simulated flue gas: Multi-factor study based on two-film theory mass transfer process. Fuel 2024, 357, 129698. [Google Scholar] [CrossRef]
  35. Liu, P.; Yang, S.; Wang, H. Slurry Droplet Dynamics and Absorption Reaction Characteristics in Industrial-Scale Wet Flue Gas Desulfurization Reactor. Ind. Eng. Chem. Res. 2024, 63, 17705–17722. [Google Scholar] [CrossRef]
Figure 1. Schematic diagram of the experimental system. 1—cylinders; 2—valve; 3—mass flow controller; 4—water; 5—gas mixer; 6—water bath; 7—reactor; 8—electric heating device; 9—FT-IR gas analyzer; 10—data collection system.
Energies 18 01466 g001
Figure 2. XRD patterns of the BA.
Energies 18 01466 g002
Figure 3. Thermogravimetric (TG) and derivative thermogravimetric (DTG) curves of the BA.
Energies 18 01466 g003
Figure 4. SEM micrographs of the BA. (a) SEM micrographs of the BA, and (b) enlarged view of the designated area (The blue numbers represent EDS testing sites).
Energies 18 01466 g004
Figure 5. EDS spectrograms of the BA.
Energies 18 01466 g005
Figure 6. Effect of water content on the desulfurization efficiency (total flow rate: 1 L/min, SO2: 200 ppmv, O2: 8%, moisture in flue gas: 10%, temperature: 90 °C, BA mass: 2 g).
Energies 18 01466 g006
Figure 7. Effect of water content on mass of SO2 absorption.
Energies 18 01466 g007
Figure 8. Effect of reaction temperature on the desulfurization efficiency (total flow rate: 1 L/min, SO2: 200 ppmv, O2: 8%, moisture in flue gas: 10%, BA mass: 2 g, water content: 20%).
Energies 18 01466 g008
Figure 9. Effect of moisture content in the flue gas on the desulfurization efficiency (total flow rate: 1 L/min, SO2: 200 ppmv, O2: 8%, temperature: 80 °C, BA mass: 2 g, water content: 20%).
Energies 18 01466 g009
Figure 10. XRD patterns of the desulfurized BA.
Energies 18 01466 g010
Figure 11. SEM micrographs of the desulfurized BA (The blue numbers represent EDS testing sites).
Energies 18 01466 g011
Figure 12. EDS spectrograms of the desulfurized BA.
Energies 18 01466 g012
Table 1. Proportions of different biomass types.
TypeCotton StalksCorn StalksWheat StrawsForestry Stalks
Proportion30%25%15%30%
Table 2. XRF chemical composition analysis of BA before desulfurization.
ComponentSiO2CaOAl2O3K2OFe2O3MgOSO3P2O5Na2OClTiO2OthersTotal
Content54.8910.529.937.575.764.521.61.541.471.180.6930.327100
Table 3. EDS analysis of the BA (atomic percentage, %).
SampleCONaMgAlSiSClKCaFeTotal
EDS-1067.7400031.910000.350100
EDS-2058.661.811.8811.1717.9900.356.320.591.23100
EDS-31.0760.830.650.661.349.920.321.721.6321.40.46100
Table 4. XRF chemical composition analysis of BA after desulfurization.
ComponentSiO2CaOAl2O3K2OFe2O3MgOSO3P2O5Na2OClTiO2OthersTotal
Content47.0712.5812.896.47.432.049.140.850.320.2180.8220.24100
Table 5. Chemical compositions of BA analyzed using EDS (atomic percentage, %).
SampleCONaMgAlSiPSClKCaFeTotal
EDS-1062.472.212.318.1913.5502.0604.242.872.1100
EDS-20.3764.870000.96016.7300.3216.750100
EDS-31.5668.910.292.670.461.280.8310.21.250.311.950.3100
EDS-40.6662.840.70.180.160.23017.440.920.4116.310.15100
Disclaimer/Publisher’s Note: The statements, opinions and data contained in all publications are solely those of the individual author(s) and contributor(s) and not of MDPI and/or the editor(s). MDPI and/or the editor(s) disclaim responsibility for any injury to people or property resulting from any ideas, methods, instructions or products referred to in the content.

