Article

Experimental Study on the Organic Rankine Cycle for the Recovery of the Periodic Waste Heat Source

Department of Mechanical Engineering, Taiyuan Institute of Technology, Taiyuan 030008, China
*
Author to whom correspondence should be addressed.
Energies 2025, 18(6), 1458; https://doi.org/10.3390/en18061458
Submission received: 7 February 2025 / Revised: 4 March 2025 / Accepted: 14 March 2025 / Published: 17 March 2025
(This article belongs to the Section J: Thermal Management)

Abstract

:
The traditional oil radiator is substituted with the organic Rankine cycle for the recovery of the abundant waste heat in the hydraulic system to improve the overall system efficiency. A prototype of the proposed system is developed to analyze both steady-state and dynamic performance. The effects of oil flow rate and connected load on system performance are studied under steady-state conditions. When the electrical load increases from 60 W to 320 W, the output power of the generator rises from nearly 42 W to 85 W, with the expander–generator efficiency between 15% and 35%. The dynamic experiment is conducted to analyze the variation characteristics of the system performance under the periodic variations in the oil flow. With the oil flow rate changes in the range of 40~80 L/min, the evaporator experiences an oil pressure drop ranging from 3.6 kPa to 18.6 kPa, while the heat transfer rate varies from approximately 2 kW to 5 kW. The influence of different flow frequencies on pressure drop and heat transfer of heat exchangers is also analyzed. The experimental findings can guide the control of operating parameters and enhance the system’s performance.

1. Introduction

The hydraulic transmission system is widely used because of its high power density, easy-to-realize stepless speed regulation, and flexible arrangement. The cooling system, responsible for regulating hydraulic oil temperature, would cause energy consumption equivalent to 5~10% of the installed power [1]. Considering the limiting oil temperature in industrial and mobile applications is about 60 °C and 90 °C, respectively. The organic Rankine cycle (ORC) [2], thermoelectric generation [3], and Kalina cycle [4] are the commonly used low-temperature power generation technologies. Among them, the organic Rankine cycle was suggested to recycle waste heat from the hydraulic system [5]. By the application of ORC, not only can the additional energy consumption of traditional cooling be eliminated, but also a portion of new energy can be generated, which can be used to support the operation of auxiliary components. Through the scheme, the overall energy efficiency of the hydraulic system would be improved, and energy consumption and carbon dioxide emissions could be reduced.
Over the last decades, numerous studies have been performed on ORC applied in solar energy, geothermal water sources, engine exhaust, industrial waste heat, and biomass energy [6,7,8]. The research directions involve the optimization of working fluids [9], system optimization [10], modeling approaches [11], operating characteristics [12], and control methods [13], etc., providing a wealth of experience for the theory and application of ORC systems. The common denominator is that heat sources tend to change dynamically, which is also the case in this study. Therefore, the influence of law and dynamic characteristics of ORC system operating parameters are the focus of attention. Dynamic simulation and experiment testing are commonly used to carry out research [14,15]. Through the dynamic characteristic experiment, the change law of system performance and the response characteristic of operating parameters under different disturbances could be studied [16]. While the dynamic simulation can aid in developing control strategies to enhance the system performance by analyzing dynamic response characteristics [17].
The ORC system’s performance is influenced by the flow rates and temperatures of the cold and hot sources, as well as the flow rate of the working fluid. If the system is working in off-grid/island mode, the load change will also cause the variation in system operation [18]. While with an increase in working fluid flow rate, the system’s thermal efficiency increases [19], but the rate of power consumed by the pump also grows [20]. The thermal efficiency and the net output power significantly rise as the heat source temperature increases [21].
In the ORC system’s operation, cold and heat sources frequently change dynamically, with significant fluctuations in the temperature and flow rate of the heat source [22,23]. Li, S. et al. [24] investigated the effects of solar radiation variations on the dynamic performance of the system. It was concluded that the capacity of thermal energy storage has a clear impact on the efficiency and stability of the system. Fu, B.-R. et al. [25] conducted a dynamic testing of the ORC system to explore the dynamic behavior of the net output power under the continued variation in the heat source temperature. Zhang, Q. et al. analyzed the dynamic behaviors of a biomass-fired organic Rankine cycle [26]. The results showed that, under the condition without a control strategy, the degree of superheat is significantly affected by the temperature of the heat source, and its variation range reaches 8.4 K. Adopting an appropriate control method can effectively improve the average thermal efficiency and output power [27].
Meanwhile, the ORC system has a limited ability to balance the disturbance caused by the external parameters [28]. Zhang, Y. et al. studied the effects of the external load on each component of the ORC system [29]. The experimental results indicated that the external load has a crucial influence on the performance of the expander, but it has no relation to the operation of the heat exchanger. Excessive load changes may cause the system to fail to work properly [30]. Therefore, it is imperative to adopt an appropriate control strategy to ensure that the power generation is not excessively sensitive to variations in the heat/cold source and external load parameters [31]. The development of such a control strategy necessitates a comprehensive understanding of both the steady-state and dynamic behaviors of the ORC system.
Although a number of experimental and simulation studies of ORC have been reported, its dynamic behavior under rapid periodic fluctuation of heat source flow is rarely investigated. In the hydraulic equipment, the hydraulic oil flow is constantly changing with the operation of the machine. Hence, the application of ORC techniques in the hydraulic machinery has many special characteristics, such as large heat source flow fluctuation and relatively low temperature. It is necessary to carry out further research according to the specific application.
A small-scale experimental bench was set up to examine how operating parameters affect the steady-state and dynamic operating characteristics of the ORC system. The steady-state research aims to determine how various operating parameters affect performance characteristics and their interrelationships. While the dynamic research examines the system’s operational state across various frequency conditions.

2. Testing of Experimental Prototype

In this section, the working principle of the experiment bench and the testing processes would be explained.

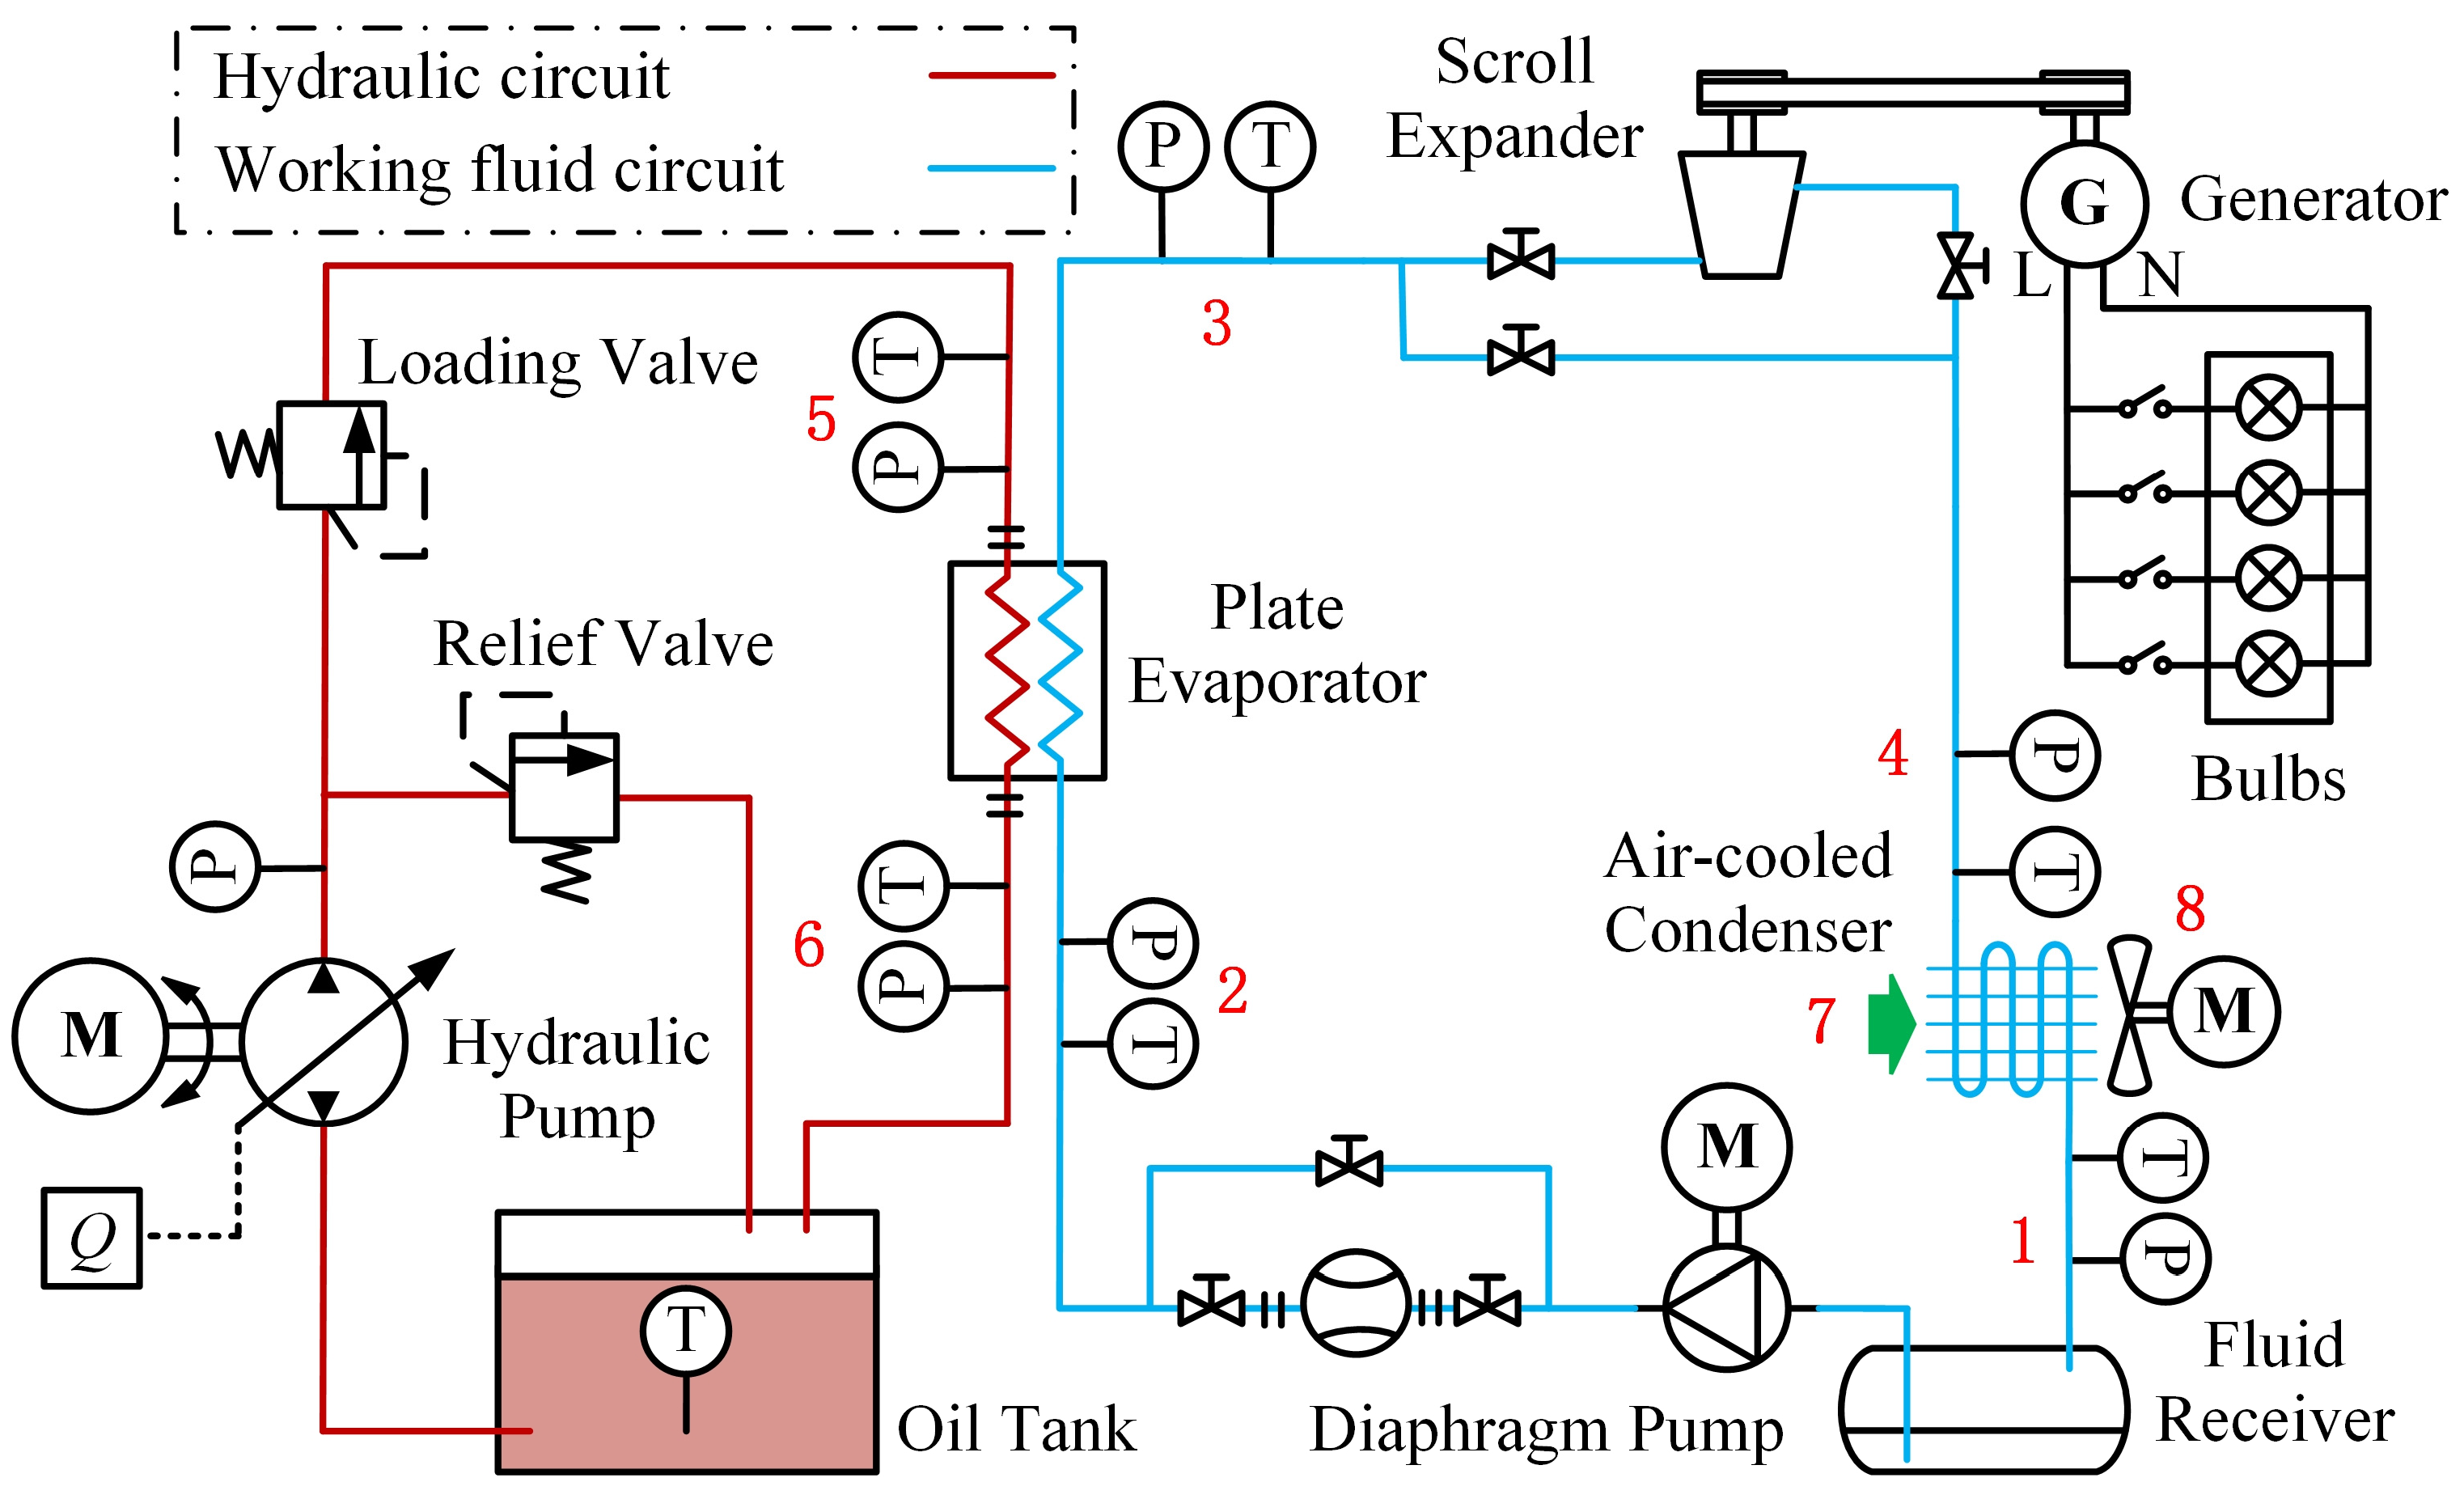
2.1. Experimental System

The heat source of the ORC system adopts a typical hydraulic power unit, and the hydraulic oil flow is controlled by a variable pump. The configuration and the key components of the experimental prototype are illustrated in Figure 1, and the flow directions of the media are indicated by arrows of different colors.
The experimental system primarily consists of a hydraulic circuit and a working fluid circuit, as depicted in Figure 2. A fully closed-loop electronically variable displacement pump is implemented in the hydraulic circuit. Then, the accurate regulation of the flow rate could be carried out. An overflow valve serves as the load in the hydraulic system. Then, the adjustment of the valve’s pressure could effectively manage the oil temperature. The hydraulic oil’s thermal energy is transferred to the working fluid via the plate evaporator and subsequently converted into mechanical energy by the scroll expander. Afterward, the mechanical energy is then converted into electricity by the generator and consumed by the light bulbs.
The working fluid circuit primarily includes a plate evaporator, a tube-fin air-cooled condenser, a diaphragm metering pump, and a scroll expander modified from a compressor. And R123 (CF3CHCl2) is chosen as the working fluid due to its low evaporating pressure and relatively high output power under the specified operating conditions. The hydraulic oil’s heat energy is transferred to the working fluid through the plate evaporator and subsequently converted into mechanical energy by the scroll expander. Afterward, the mechanical energy is then converted into electricity by the single-phase permanent magnet generator and consumed by the light bulbs. Table 1 presents the primary parameters of the test system’s key components. The overall size of the evaporator is 111 × 525 × 125 mm, the thickness of the plate is 0.35 mm, and the gap of the plate is 1.81. The number of tube rows of the condenser is 32 × 6, the overall size is 1250 × 800 × 120 mm, and the fin density is 50 pieces/dm.

2.2. Experiment Measuring Process

In the measuring system, a DS1103 from dSPACE company (Paderborn, Germany) is employed to monitor and record the flow rate, pressure, temperature, and other parameters of hydraulic oil and working fluid in real-time, and the sampling time is 0.1 s. The main parameters of the sensors applied in the measuring system are shown in Table 2. Measuring accuracy was ensured and enhanced through the following approaches: performing sensor calibration and verification prior to testing, utilizing twisted-pair shielded cables with grounded metal housings for signal transmission to mitigate electromagnetic interference, and other environmental control measures. Then, the phase state and specific enthalpy at each point in the system can be determined by assessing the pressure and temperature of the working fluid. And then, the enthalpy flow is determined by multiplying the specific enthalpy with the flow rate. During the experiment, the ambient temperature was recorded as 18 ± 1 °C, while the oil temperature at the evaporator inlet was consistently maintained at 80 °C.
The entire testing process can be categorized into steady-state and dynamic experiments. During the steady-state experiment, the hydraulic oil flow rate and connected load were employed as the input variables. The system performance and the operating parameters were observed by adjusting just one of the variables without changing the others. Once the system’s operating parameters stabilized, maintain this state for over 300 s and record the data. After removing the abnormal values, the average of the data of each state was taken as the experimental result. The oil flow rate varied at 50 L/min, 60 L/min, 70 L/min, and 80 L/min. The power variation of the electrical load was 60 W, 120 W, 220 W, and 320 W, respectively.
As to the dynamic experiment, the experimental prototype worked in the condition with periodic oscillation in the oil flow rate to simulate the variation in the return oil flow rate under the typical cycle of hydraulic equipment. Thus, the influence law of the periodic variation in oil flow rate on the system operation could be summarized, which lays the foundation for the optimization and control of the system for the future study. The displacement of the working fluid pump remained constant during the test. Before each set of experiments, the power of the connected load and the oil flow rate were maintained at 120 W and 60 L/min, respectively. When the evaporating pressure and temperature tend to stabilize, adjust the oil flow rate to a sinusoidal change in the form of Equation (1). The frequency f is set to 1/200, 1/100, 1/50, and 1/25.
q oil = 40 + 20 sin 2 π f τ .

3. Computational Model and Data Processing

In the experimental system, there are three kinds of flowing media: hydraulic oil, working fluid R123, and air. The temperature-dependent physical properties of hydraulic oil and air can be expressed as temperature-related functions, and the working fluid’s physical parameters can be determined by searching the REFPROP 9.0. Then, the required parameters are calculated from the measurements to assess the system’s performance.

3.1. Physical Properties of Hydraulic Oil and Air

The medium of the hydraulic system is L-HM46 hydraulic oil. The parameters that have a great influence on the heat exchange are density, dynamic viscosity, and specific heat capacity. They can be expressed as functions of pressure and temperature. Because the influence of pressure is relatively small, and the oil pressure on both sides of the evaporator also changes little, only the influence of temperature is taken into account. With the unit of temperature in Celsius, the properties can be expressed as follows:
The specific heat capacity of the hydraulic oil is as follows:
c p , oil = 1940 + 3.4 T oil .
As for the air, the density and the specific heat capacity are considered. They are set as constant due to the small change in the temperature. The density is 1.29 kg/m3, while the specific heat capacity is 1005 J/kg·K.

3.2. System Performance

The heat transfer rates of the evaporator and condenser can be determined by
Q ˙ evap = m ˙ wf h 3 h 2 = m ˙ oil ( c p , oil , 5 T 5 c p , oil , 6 T 6 ) = Q ˙ cool ,
Q ˙ cond = m ˙ wf h 4 h 1 = m ˙ air c p , air ( T 8 T 7 ) .
The mass flow rates of oil and air could be obtained by multiplying the density and the volume flow rate, which is more easily measured for the fluid.
The power consumption of the working fluid pump is denoted by
W wp = m ˙ wf h 2 h 1 .
The power consumption of the diaphragm pump and cooling fan is calculated based on their respective efficiencies. The cooling fan’s power can be represented as follows:
W fan = Δ p air q air / η fan .
The expander’s output power is described as follows:
W exp = m ˙ wf h 3 h 4 .
The expander–generator efficiency can be expressed as follows:
η exp , gen = W gen W exp
The system generation efficiency and ideal thermal efficiency can be calculated from
η gen = W gen Q ˙ evap ,
η th , ideal = W exp W wp W fan Q evap .

3.3. Data Processing

Data processing is necessary to obtain the real usable information due to the noise and error existing in the signal collected. The outliers are removed according to the 3σ principle in the first step. The purpose of steady-state data processing is to obtain the mean value of each stable point. Thus, the evaluation index of system performance could be calculated. The goal of transient data processing is to highlight the change process of operating parameters through filtering.

3.3.1. Steady-State Data Processing

All the steady-state points were divided into groups, and the mean value of the direct measurements can be evaluated. The specific enthalpy is calculated from the equation of state according to pressure and temperature. Then, the heat flow rate, power, and efficiency can be evaluated. These results are indirect measurements, and the uncertainty and error can be obtained by
Δ Y = i = 1 n Y X i 2 Δ X i 2 .
According to the error synthesis method, the measurement errors of each parameter are calculated. The relative error of the system thermal efficiency is at its maximum, which is ±6.07%, followed by the expander output power, which is ±2.04%. The measurement errors of the heat transfer power of the evaporator and condenser are ±1.35% and ±1.57%, respectively. The errors of both direct and indirect measurement parameters are within the allowable range, and the measurement data are available.

3.3.2. Dynamic Data Processing

The method of wavelet denoising is utilized to preprocess the dynamic data, thus obtaining the transient performance. Wavelet denoising can remove noise signals while keeping the basic waveform features unchanged.
The filtering effect can be evaluated by the signal-to-noise ratio (SNR) and root mean square error (RMSE) between the filtered and original signals. Given the original signal x(n) and the filtered signal x’(n), the SNR is defined as follows:
SNR = 10 log n x 2 n n x n x n 2 .
The RMSE between the original signal and the filtered signal can be estimated from
RMSE = 1 n n x n x n 2 .

4. Results and Discussion

The results will be discussed separately from the perspectives of steady-state and dynamic experiments, thus exploring the energy characteristics and working characteristics of the ORC in the waste heat recovery of hydraulic systems.

4.1. Steady-State Experiment

Through the steady-state experiment, the graphing method and correlation coefficient analysis are adopted to investigate the operating performance of the system and operating parameters influenced by the oil flow rate and the generator’s electrical load.

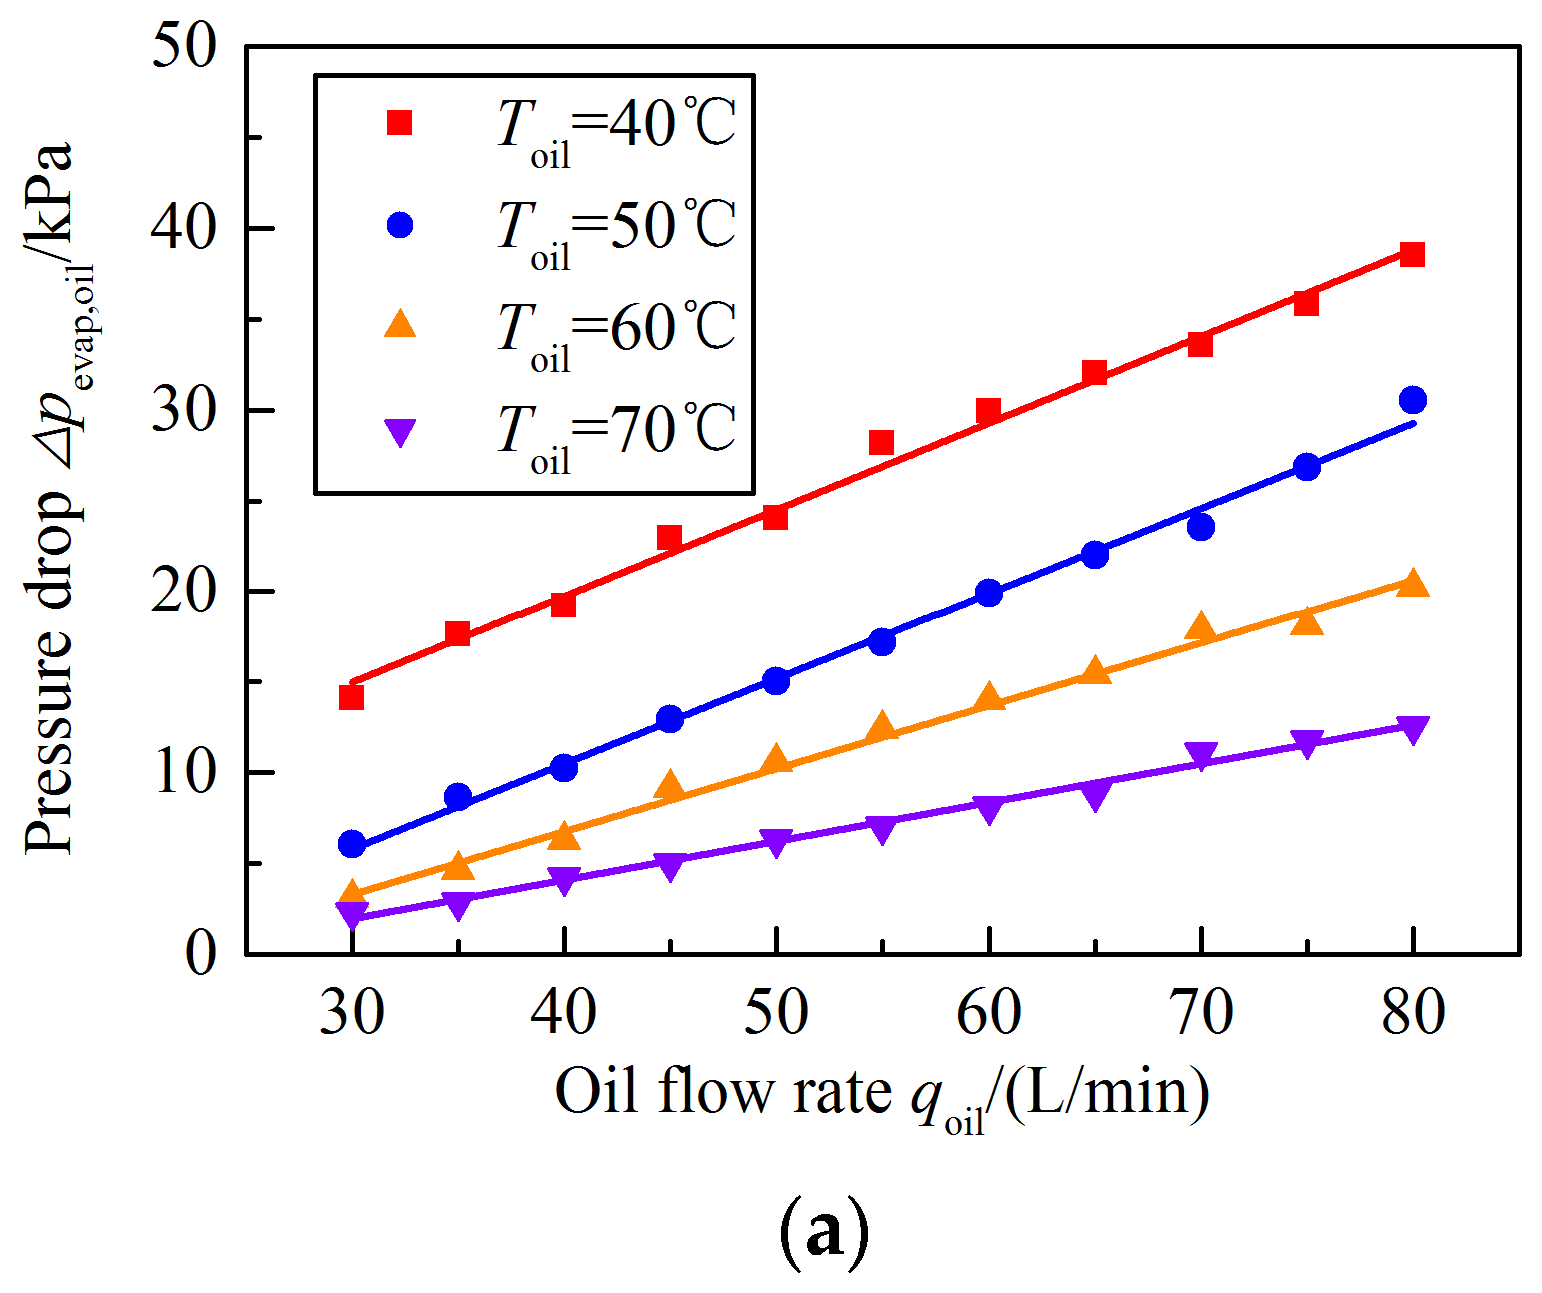
4.1.1. Pressure Drop Characteristics

When the organic Rankine cycle is applied to recover the waste heat of the hydraulic system, the original oil cooler is substituted with the evaporator in the oil return circuit. This may have a certain influence on the oil return back pressure of the hydraulic system. While the oil back pressure would affect the energy efficiency of the hydraulic system, it is necessary to evaluate the pressure drop property of the oil in the evaporator.
The expression of pressure difference in the heat exchanger can be described as follows:
Δ p = f f 4 L D h ρ u 2 2 .
In addition to the structure of the heat exchanger, flow rate, density, and viscosity all affect the pressure drop in the heat exchanger. According to Equations (1) and (2), the temperature of the hydraulic oil has a significant influence on the properties, especially the viscosity. The general pressure drop in the heat exchanger can be corrected according to the density viscosity, and then the measured data are corrected to general results. The density and viscosity correction are applied in the flow rate and pressure drop and can be expressed as follows:
q std = q act ρ act μ std ρ std μ act ,
Δ p std = Δ p act ρ act ρ std μ std μ act 2 .
The general relationship between pressure drop and flow rate in the heat exchanger is obtained with the correction to a standard temperature of 40 °C. Thus, it can be conducted to analyze the performance of operating conditions and physical dimensions outside the testing conditions. The testing was performed under isothermal conditions.
The pressure drop at different flow rates was measured at different temperatures, and the results are demonstrated in Figure 3. The measured data are displayed in Figure 3a; it can be found that the pressure drop grows with the increase in oil flow and the decrease in temperature. The maximum pressure drop is 13 kPa at the oil temperature of 70 °C. With the increase in temperature, the decrease in pressure drop becomes smaller. The corrected data are exhibited in Figure 3b. According to the fitting results, the functional relation can be described as follows:
Δ p s t d = 0.002378 × q std 2 + 0.2053 × q std + 4.858 .
Because the viscosity of oil varies greatly with temperature, the corrected data are denser at the low flow rate and sparse at the high flow rate. Hence, the fitting function is more accurate when applied to the high-temperature oil.

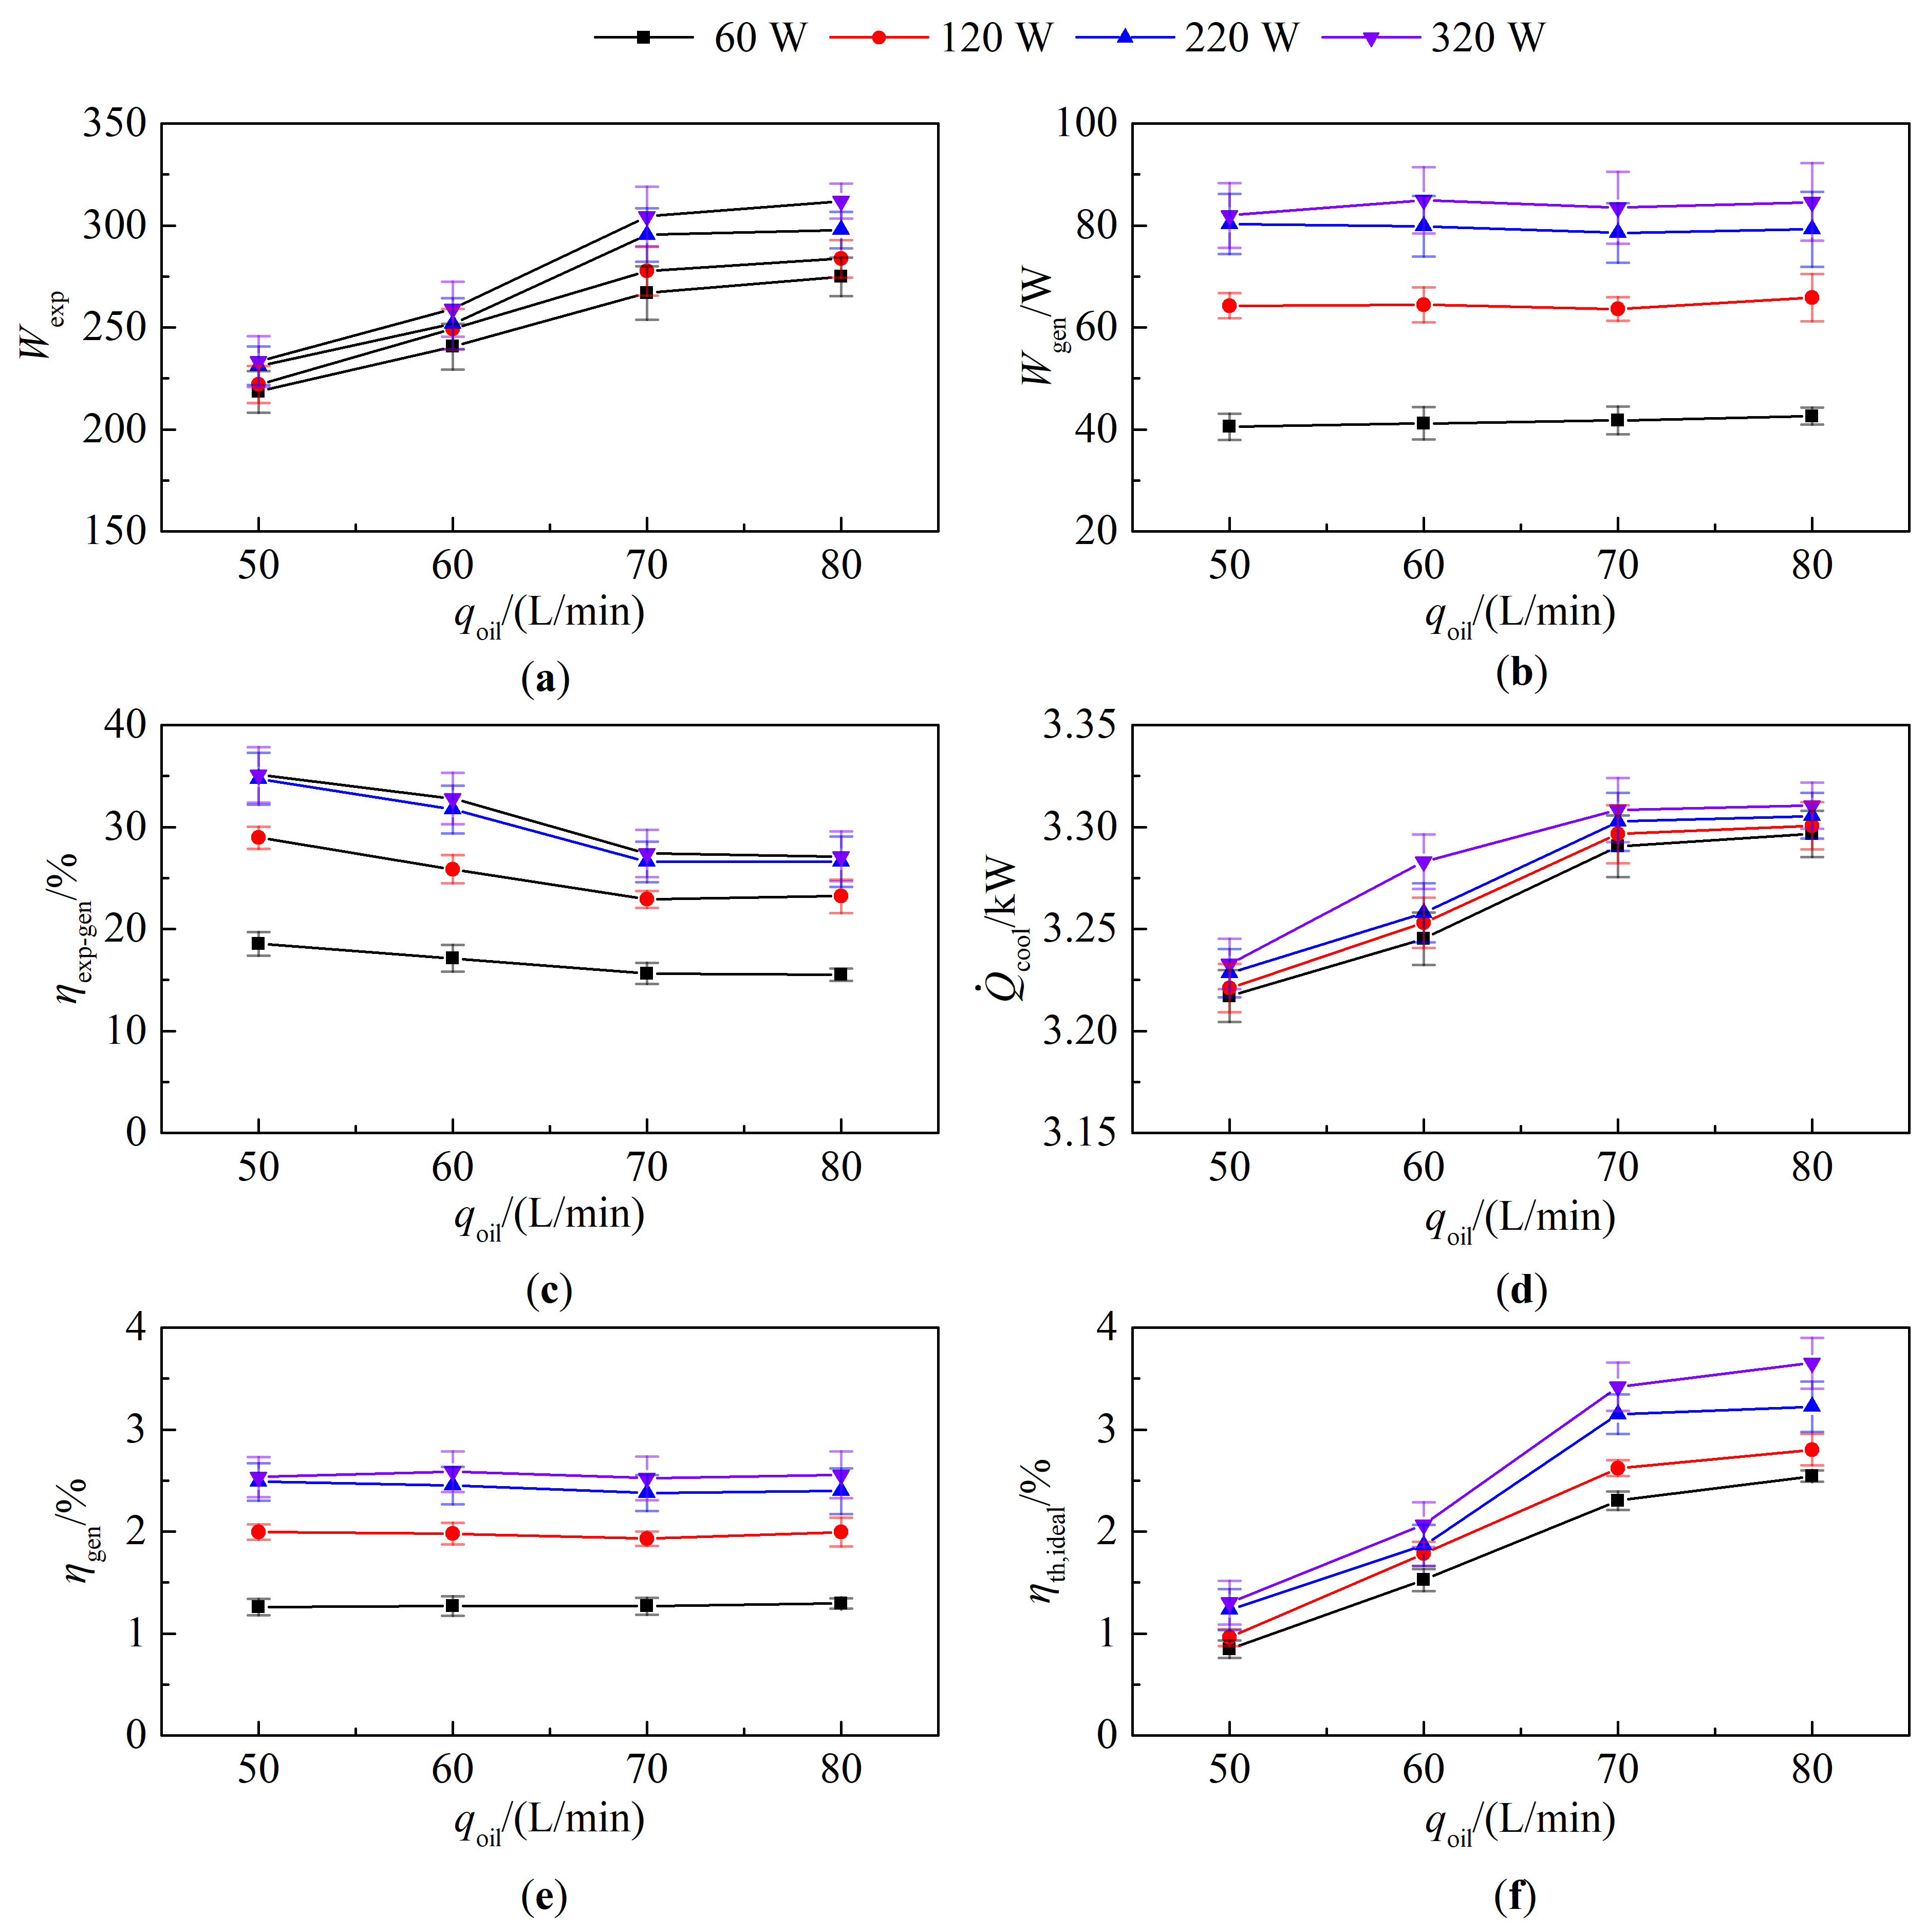
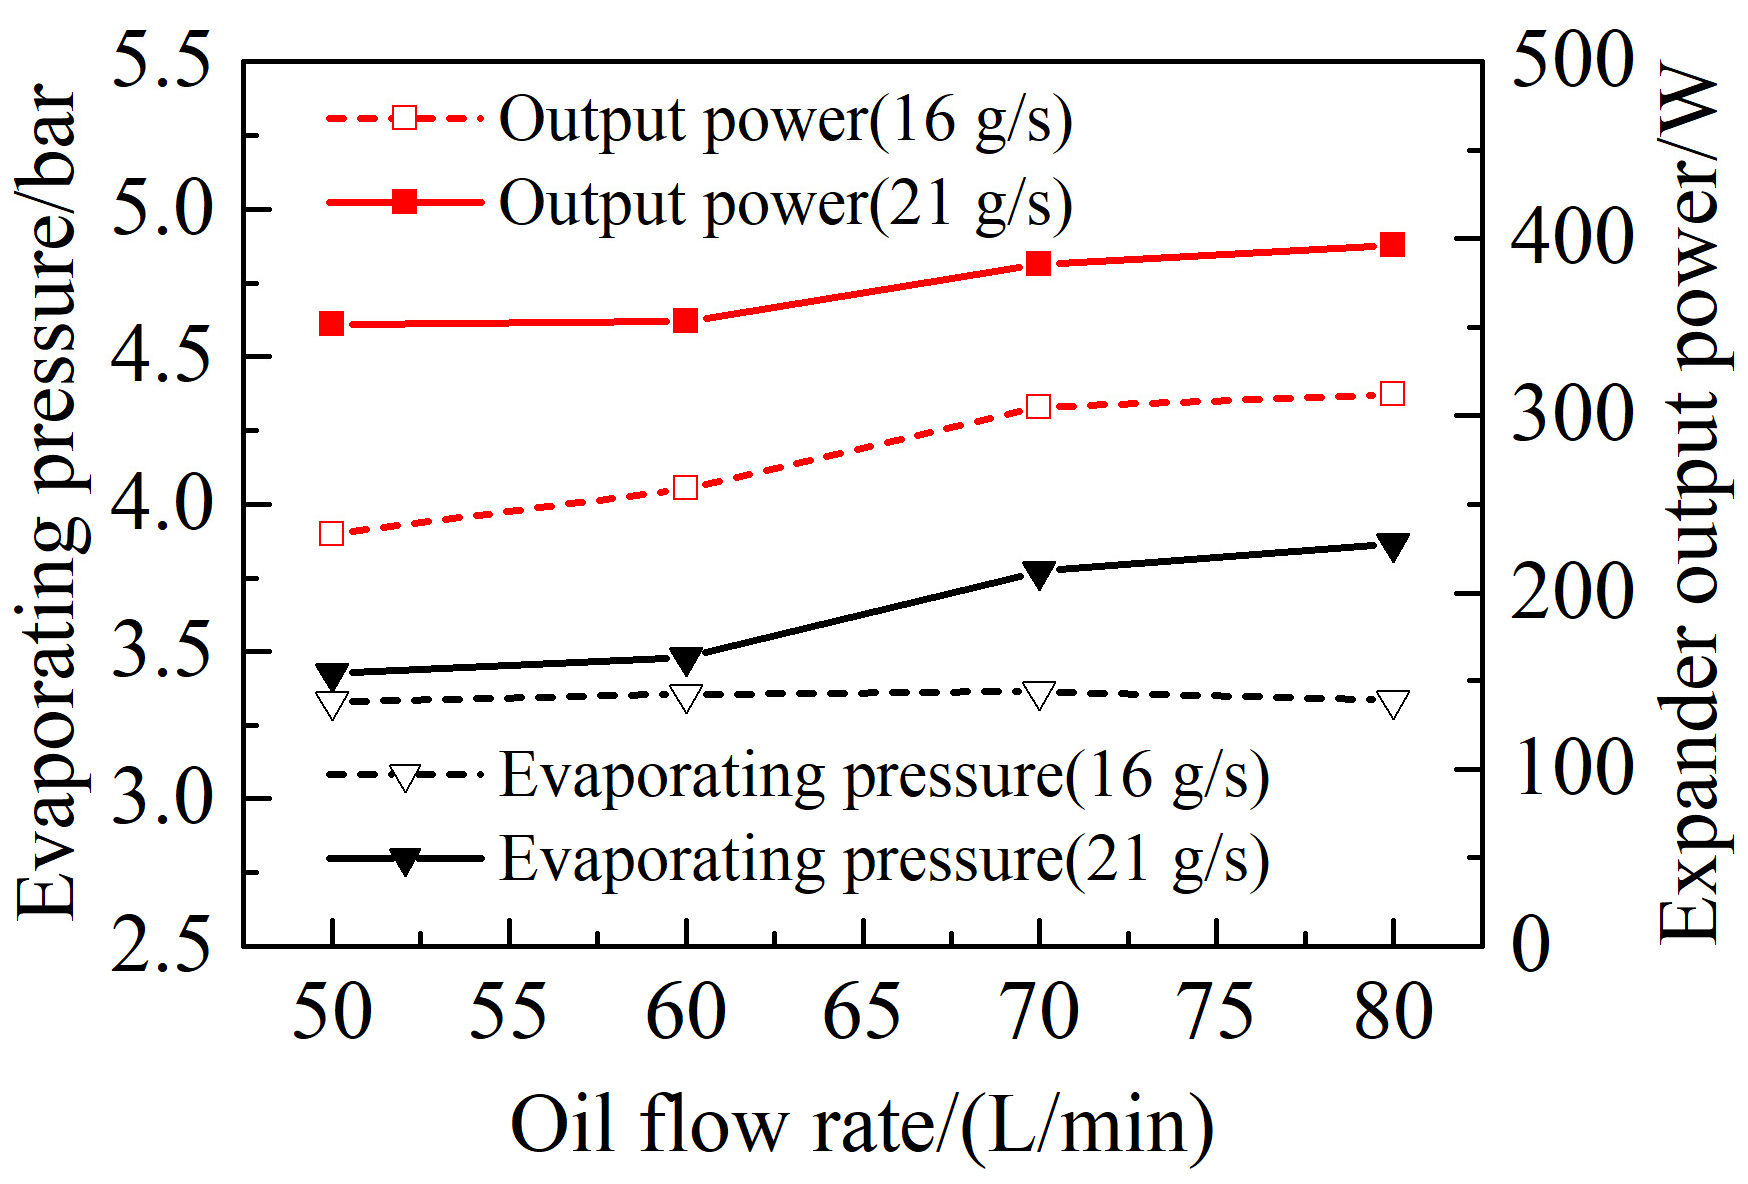
4.1.2. Steady-State Performance of ORC

The steady-state performance of the system, considering the impact of the oil flow rate and the electrical load, is conducted. The results are indicated in Figure 4.
As depicted in Figure 4d,f, there is a progressive enhancement in the expander’s output power, the cooling capacity, and the system’s thermal efficiency in response to the increment of both the oil flow rate and connected electrical load. Upon analysis of Figure 4b, it is observed that the oil flow rate has little effect on the generator output power. With the connected load increase, the generator output power improves, but the growth rate decreases. Comparing Figure 4b,e, the variation in power generation efficiency is consistent with the output power of the generator. When the connected load is improved from 60 W to 320 W, the generator output power rises from nearly 42 W to 85 W in Figure 4b, and the expander power rises from 218 W to 312 W in Figure 4a. Thus, the expander–generator efficiency is in the range of 15~35%, which is a low value and still has the enhanced space in Figure 4c. Basically, the error of all parameters is within 10%, and the largest error is the ideal thermal efficiency, whose maximum error point is 2.07 ± 0.22%.
A direct connection between the expander and the generator instead of the belt transmission and a more efficient generator could improve the generator output power. When the oil flow rate is 80 L/min, and the connected load is 320 W, the expander output power and cooling power are 312 W and 3.31 kW, respectively. At the same time, the system’s ideal thermal efficiency reaches the maximum, which is 3.65%. The thermodynamic performance of the system also demonstrates a pronounced correlation with the mass flow rate of the working fluid. As illustrated in Figure 5, progressive augmentation of the working fluid mass flow rate from 16 g/s to 21 g/s under a constant oil flow rate of 80 L/min induces a measurable escalation in both evaporation pressure and expander output power. Specifically, the evaporation pressure elevates from 3.33 bar to 3.87 bar, while the expander power output exhibits a concomitant increase from 312 W to 396 W. It should be pointed out that this result is contingent upon the current measurement range. A more general conclusion requires a broader range and more data points for testing to further validate. Because of the lack of measurements, the power consumption in the fan and the diaphragm pump is calculated according to their operating efficiency. The actual power consumption may be greater, especially for the diaphragm pump, whose maximum efficiency is about 50% in the ORC of a kW scale [32]. Thus, the actual system efficiency may be smaller than the provided results.
At the same time, we should also consider the limitations of ORC application in the recovery of waste heat of hydraulic systems. The most important ones should be the increased installation space required and the increase in equipment cost. For the issue of installation space, when applied on mobile hydraulic equipment, we can refer to the layout of on-board air conditioning systems and distribute the ORC components in places with space. While applied to fixed industrial hydraulic equipment, it can be integrated and designed into a cabinet for convenient connection. As for the increase in equipment cost, the cost can be gradually recovered through energy savings and reduced energy consumption. The comprehensive energy-saving effect of the waste heat recovery in the hydraulic system is still significant.

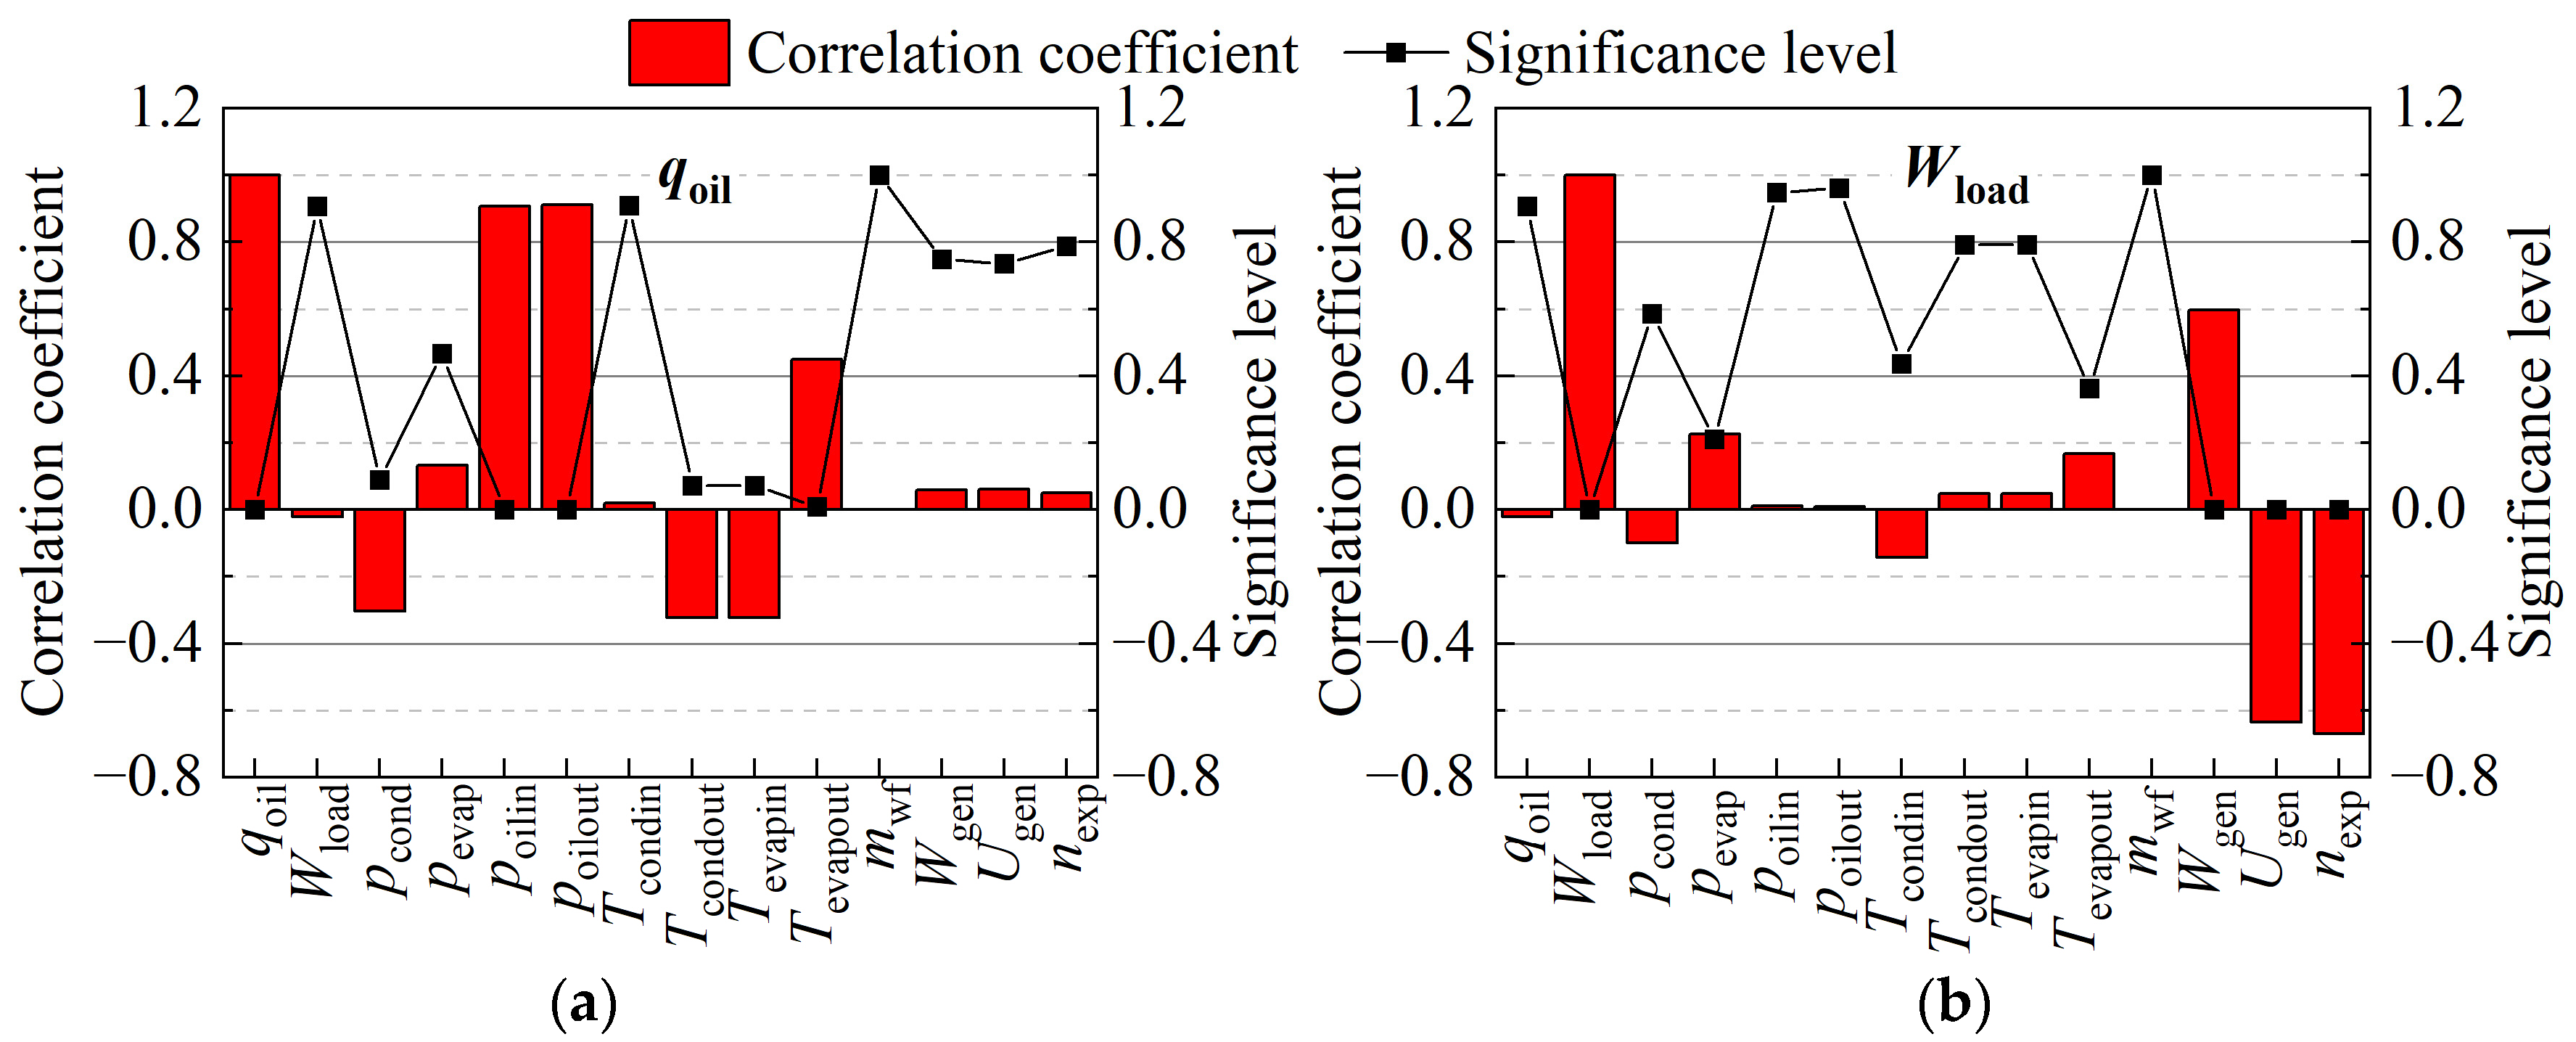
4.1.3. Correlation Analysis

The interaction law of system operating parameters is the foundation of system optimization design and control strategy development [33]. Therefore, the correlation was also analyzed according to the steady-state test results. The Spearman correlation coefficient is used because the experimental data does not meet the normal distribution, and it can be described as follows:
ρ cor = 1 6 i = 1 n d i 2 n n 2 1 ,
where n is the sample size, and di2 = (Xi − Yi)2, where (Xi − Yi) is the rank order of the two variables.
The correlation coefficient and significance of the measured parameters are shown in Figure 6. And the significant statistical difference between the two variables is judged according to the value on the right axis. When the correlation coefficients are in the range of 0.5 and 1, the parameters are considered strong correlations.
Therefore, the results demonstrate that the poilin (ρcor = 0.91) and poilout (ρcor = 0.91) are the parameters that are strongly correlated with oil flow rate, and the Wgen (ρcor = 0.59), Ugen (ρcor = 0.64), and nexp (ρcor = 0.67) are strongly correlated with connected load. According to Equations (13) and (16), the oil pressure drop results from the frictional resistance, which is directly related to the flow rate. Thus, a significant linear correlation exists between the oil flow rate and the pressure at the inlet and outlet on the oil side. This is also consistent with the result shown in Figure 3. As to the connected load, it affects the ORC system more obviously. This can be understood and analyzed in combination with the influence law of load variation shown in Figure 5. An increase in the connected load raises the expander’s torque and reduces its speed. It leads to higher evaporating pressure and enhances the expander’s output power. As the revolution speed of the generator did not reach the rated point in the test, the voltage of the generator would change with the revolution speed. Therefore, the expander revolution speed and the generator voltage are negatively correlated with the connected load, while the power generation is positively correlated with the connected load.
Ashwni et al. [34] conducted a sensitivity analysis of the components and discovered that both the condenser and evaporator exerted a substantial influence on the ORC system performance. This method is mainly suitable for theoretical analysis in the design stage. In another study, Dang, H. et al. [35] mentioned that the sensitivity of mass and mass flow should be considered. However, the sensitivity analysis among key parameters was not incorporated in the study. This method offers a framework for analyzing the influence among the ORC parameters and quantifies the correlation degree, aiding in system operation optimization.
Owing to the restricted experimental data, the correlation between these two parameters, namely the heat source temperature and the working fluid flow rate, and other operational parameters was not investigated. And the correlation analysis is mainly applicable to researching the correlation among directly measured parameters. Therefore, to explore the correlation between parameter variations and indirect parameters, such as heat transfer and thermal efficiency, which are indicator parameters for evaluating system performance, new approaches need to be explored.

4.2. Dynamic Experiment

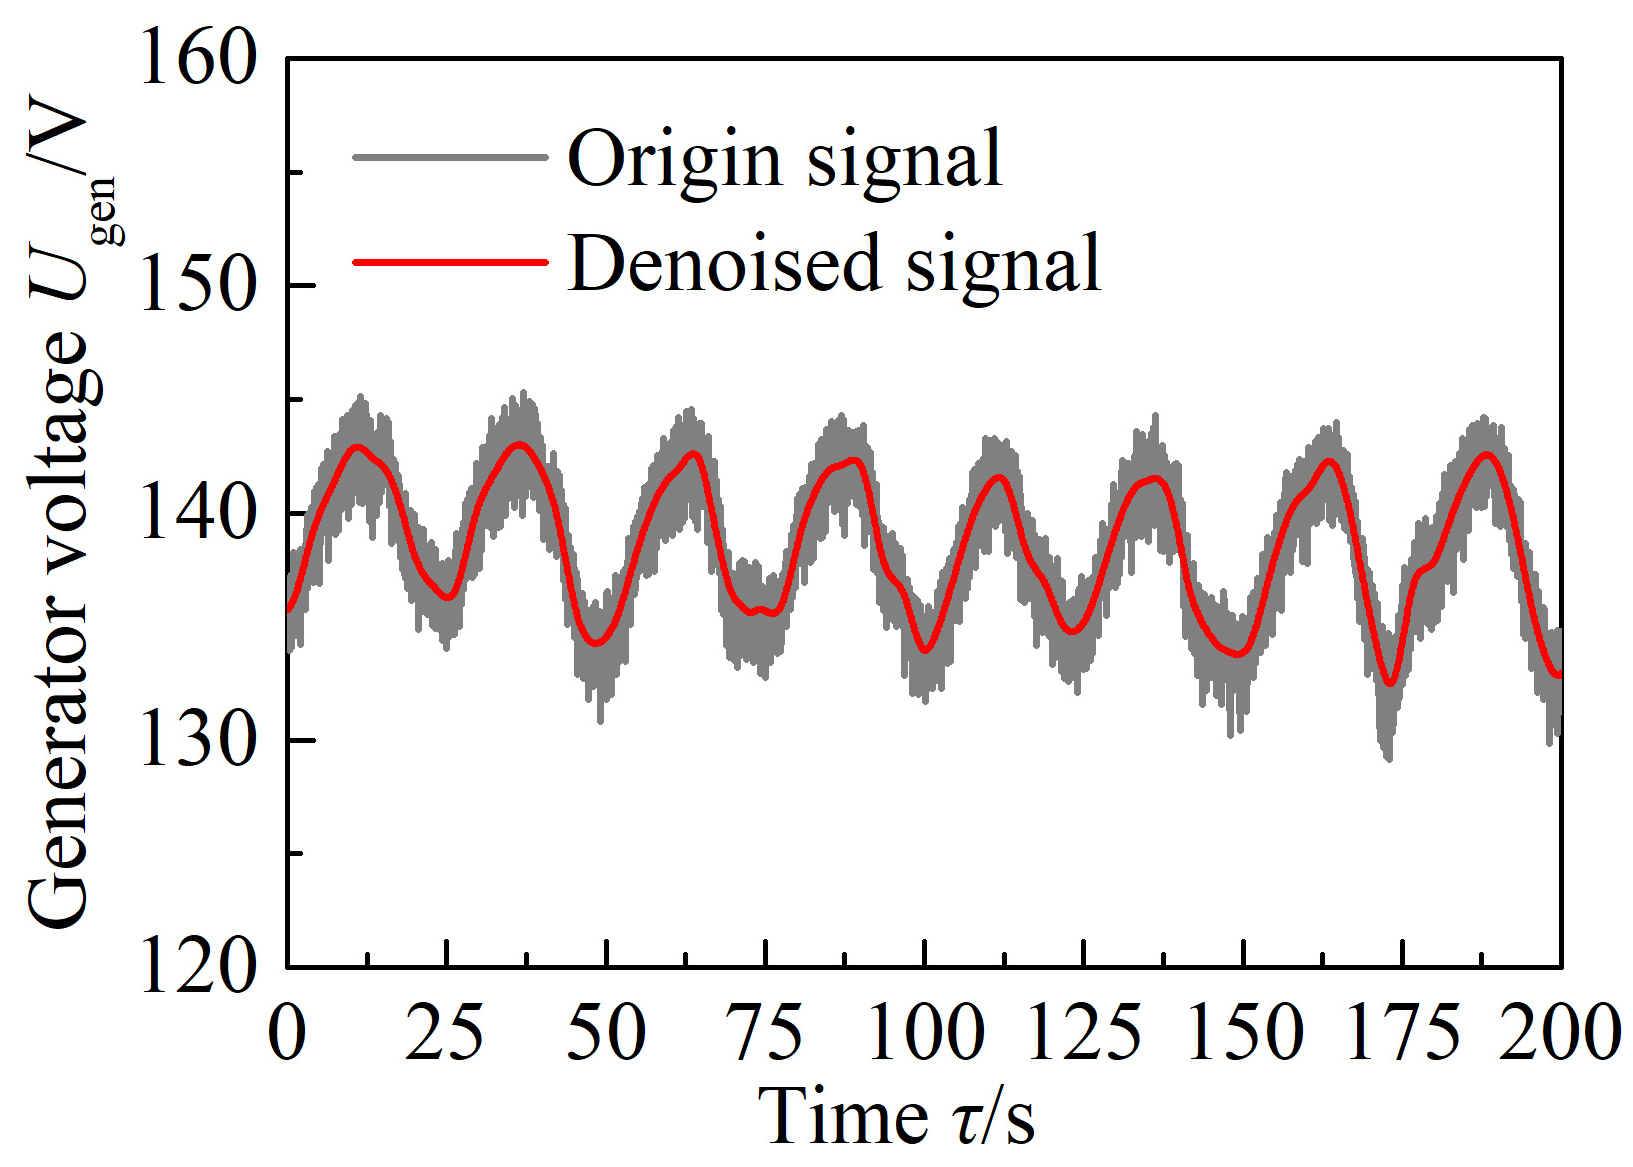
4.2.1. Signal Processing Results

The SNR and RMSE of the collected transient signals are evaluated after the processing of wavelet denoising, and the results are displayed in Figure 7. In general, a better filtering effect can be obtained with higher SNR and smaller RMSE. As can be seen from the figure, they are little influenced by the frequency of changes in the hydraulic oil flow rate. Moreover, the SNR and RMSE of the working fluid mass flow rate are the smallest, which are 20.5 and 0.0025, respectively. The RMSE of the revolution speed of the expander is the largest, which is 1.79. The results demonstrate the good filtering effect of all signals, and the filtered signal is close to the original signal. Figure 8 exhibits the comparison of generator voltage data before and after filtering at the flow rate frequency of 1/25 Hz. After filtering, the curve trends of the signals are kept, and the change rule becomes clearer.
DFT (Discrete Fourier Transform) is carried out on the filtered signal by using the FFT (Fast Fourier Transform). The constant segment is extracted, as well as the amplitude and phase consistent with the flow rate frequency, to form the sinusoidal signal, which can be expressed as follows:
y = A c + A s sin 2 π f τ φ .
Moreover, the response amplitude and speed of various parameters are different in the dynamic process. The condensing pressure and temperature exhibit a relatively slow response speed [28]. The ratio of the amplitude at the corresponding frequency to the constant section is calculated as Rrv = As/Ac to evaluate the fluctuation amplitude of each variable. The results are displayed in Figure 9. Comparing the relative fluctuation amplitude of each parameter, the one with larger value changes obviously can be utilized for the next step. Since the variations in voltage and power of the generator are similar, only the voltage is taken into account. As a result, poilin, poilout, Ugen, nexp, and pevap are selected for analysis.

4.2.2. Effect on the Evaporator

The oil pressure drop in the evaporator will have a certain influence on the back pressure of the hydraulic system. The pressure drop can be calculated from poilin and poilout, which have a strong linear correlation with the oil flow rate. The experimental pressure drop is compared with the calculated value; the results are illustrated in Figure 10. The pressure drop changes synchronously with the flow rate, and the calculated results are greater than the experimental results. The pressure drop ranges from 3.6 kPa to 18.6 kPa as the oil flow rate fluctuates between 40 L/min and 80 L/min. As the changing frequency of the oil flow rate increases, the amplitude of the measured pressure drop becomes larger and aligns more closely with the calculated results. The corrected function of pressure drop works well in the periodic fluctuations at higher frequencies.
The heat flow rate in the evaporator is important for both ORC and hydraulic systems. It is not only the heat absorbed in the ORC system but also the cooling power for the hydraulic system. According to the measurement data, the heat flow rates at the working fluid side and the hydraulic oil side in the evaporator were calculated, respectively. And the results of heat flow in the evaporator are depicted in Figure 11.
With the fluctuation of the oil flow rate, the cooling power at the hydraulic oil side fluctuates with the same frequency as the fluctuation of the hydraulic oil flow, and its variation range is about 2 kW to 5 kW. While the heat transfer rate at the working fluid side changes slightly. It is related to their calculated method. As shown in Equation (3), the heat energy of the working fluid is calculated by the multiplication of mass flow rate and enthalpy. The enthalpy value is obtained by the measured temperature and pressure. The response of temperature and flow rate is relatively slow, resulting in a small change in heat flow on the working fluid side. Meanwhile, a long computing chain and measurement errors may lead to inaccurate dynamic results. Therefore, the dynamic characteristics of the heat transfer at the evaporator still need to be further studied through more experimental testing and simulation analysis.

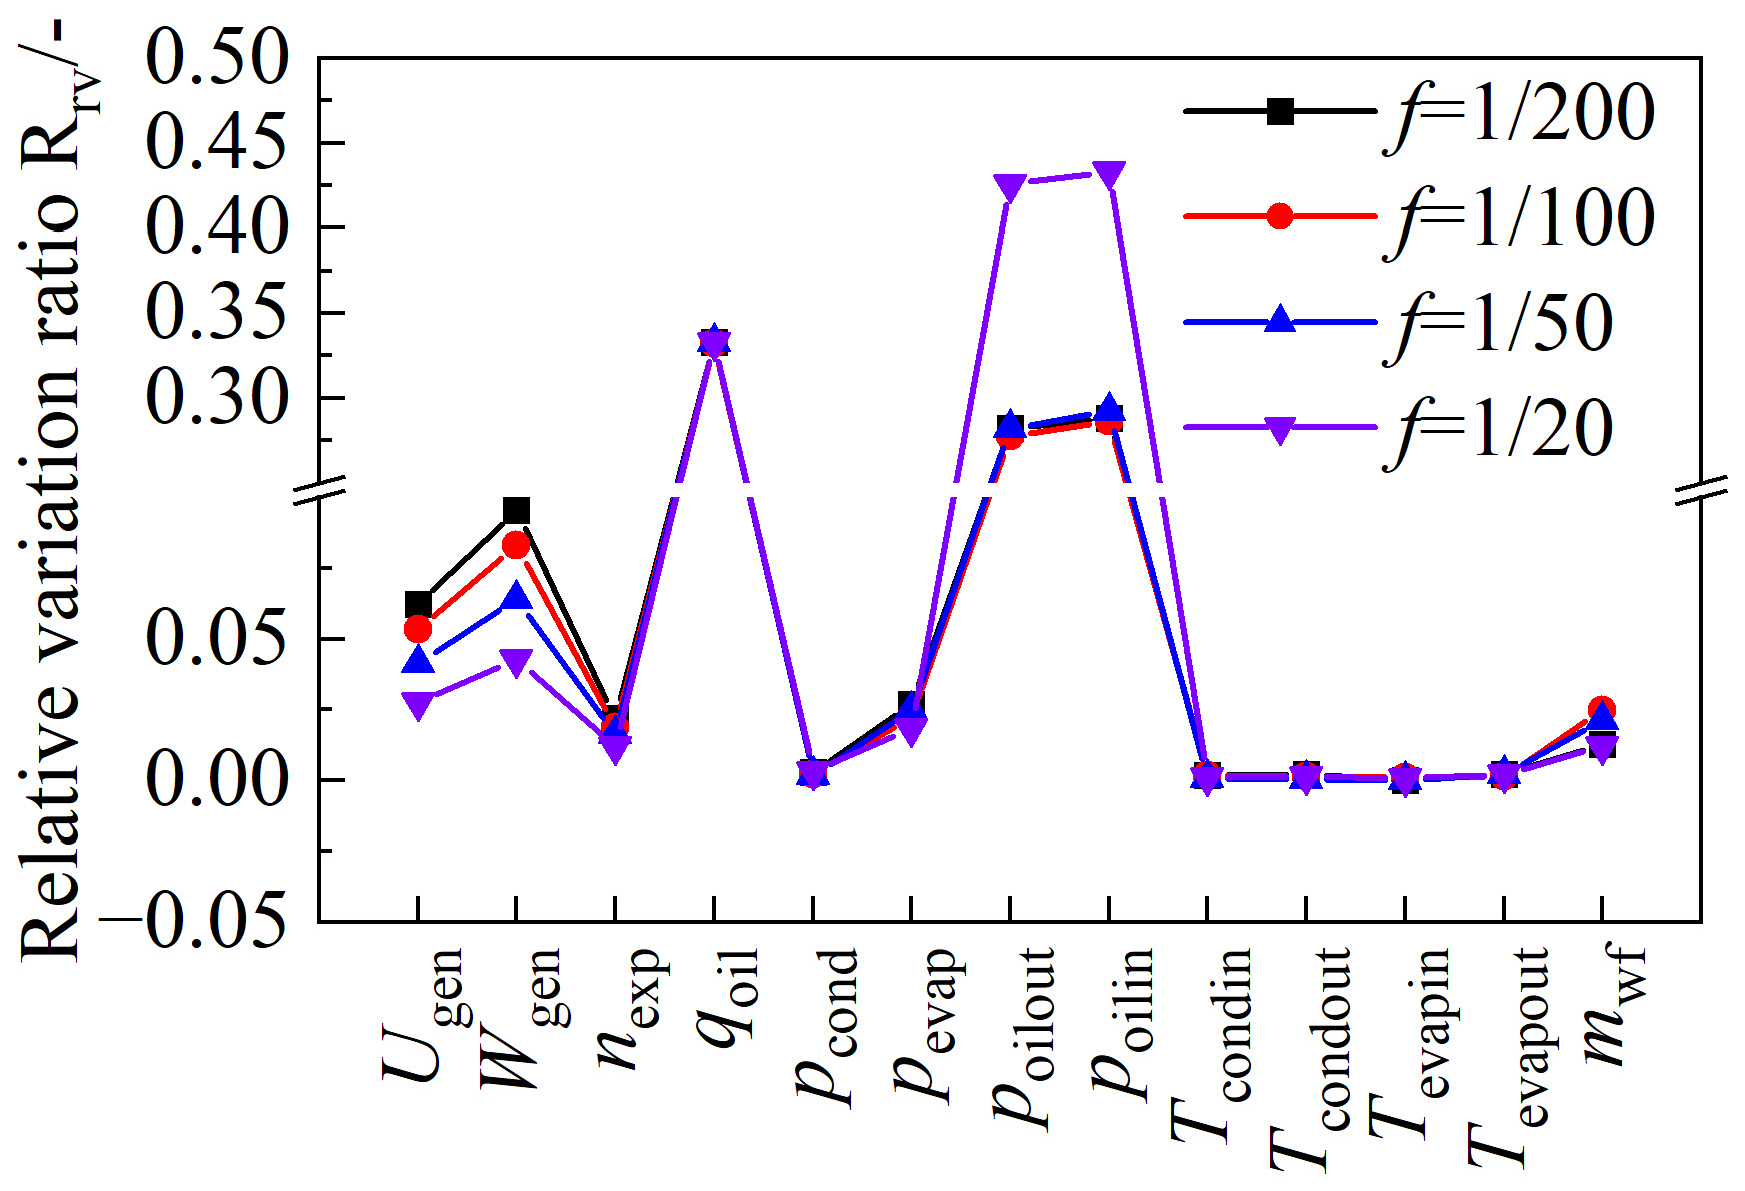
4.2.3. Response of the Operating Parameters

Taking the working condition with the frequency f = 1/25 Hz as an example, the variations in filtered signals are depicted in Figure 12. According to the results in Figure 12, the evaporating pressure pevap, the generator voltage Ugen, and the expander revolution speed nexp display periodic variation with relatively large amplitude. Using the oil flow rate as a reference, the delay time of other parameters can be calculated. Compared with the oil flow rate, the fluctuation cycle of each parameter is consistent with it, but with less amplitude. The ratios of relative variation of evaporating pressure, expander revolution speed, and generator voltage are 1.82% (0.058 bar), 1.20% (12.23 rpm), and 2.76% (3.82 V), respectively. The corresponding delay times are 5.81 s, 6.07 s, and 6.17 s, respectively. This result agrees with the theoretical analysis. According to the causal relationship, the change in oil flow rate will firstly lead to the variation in evaporating pressure, then result in the change in expander revolution speed, and finally vary the generator voltage.
Table 3 provides the delay time of each parameter under different frequencies. As the frequency of oil flow rate decreases, the delay time of the other parameters increases gradually. When the oil flow rate frequency is 1/200 Hz, the delay time of evaporating pressure, expander revolution speed, and generator voltage is 8.34 s, 14.11 s, and 18.22 s, respectively. It suffers from the limitations associated with the sensors’ measurement error and response speed. However, it can still be concluded that the delay time of the parameters of the ORC system should be considered in the control system development.
Ping, X. et al. [36] investigated the hysteresis time of the ORC system applied in the waste heat recovery of the internal combustion engine. The hysteresis time increases with fluctuations in both vehicle and idle speed. However, the hysteresis time caused by the change in the waste heat, which is the direct parameter, should also be discussed. While analysis of the dynamic performance of the ORC is conducted within the hydraulic system application, the findings and methodologies can actually be extended to other types of waste heat recovery systems. This paper may provide insight into the ORC system with periodic variation in the flow rate of the heat source.

5. Conclusions

The ORC system is promised to reduce the energy consumption in the cooling process of the hydraulic system. It can cool the hot oil while generating useful power. An experimental prototype is established, and experimental investigations are carried out. Therefore, the effects of the operating parameters on the static and dynamic performance of the ORC system are summarized as follows:
  • The influence of hydraulic oil flow rate and connected load on the performance of the ORC system is studied through qualitative and quantitative analysis. When the connected load is improved from 60 W to 320 W, the generator output power raises from nearly 42 W to 85 W, and the expander power raises from 218 W to 312 W.
  • Based on the correlation analysis, the Wgen (ρcor = 0.59), Ugen (ρcor = 0.64), and nexp (ρcor = 0.67) are strongly correlated with the connected load.
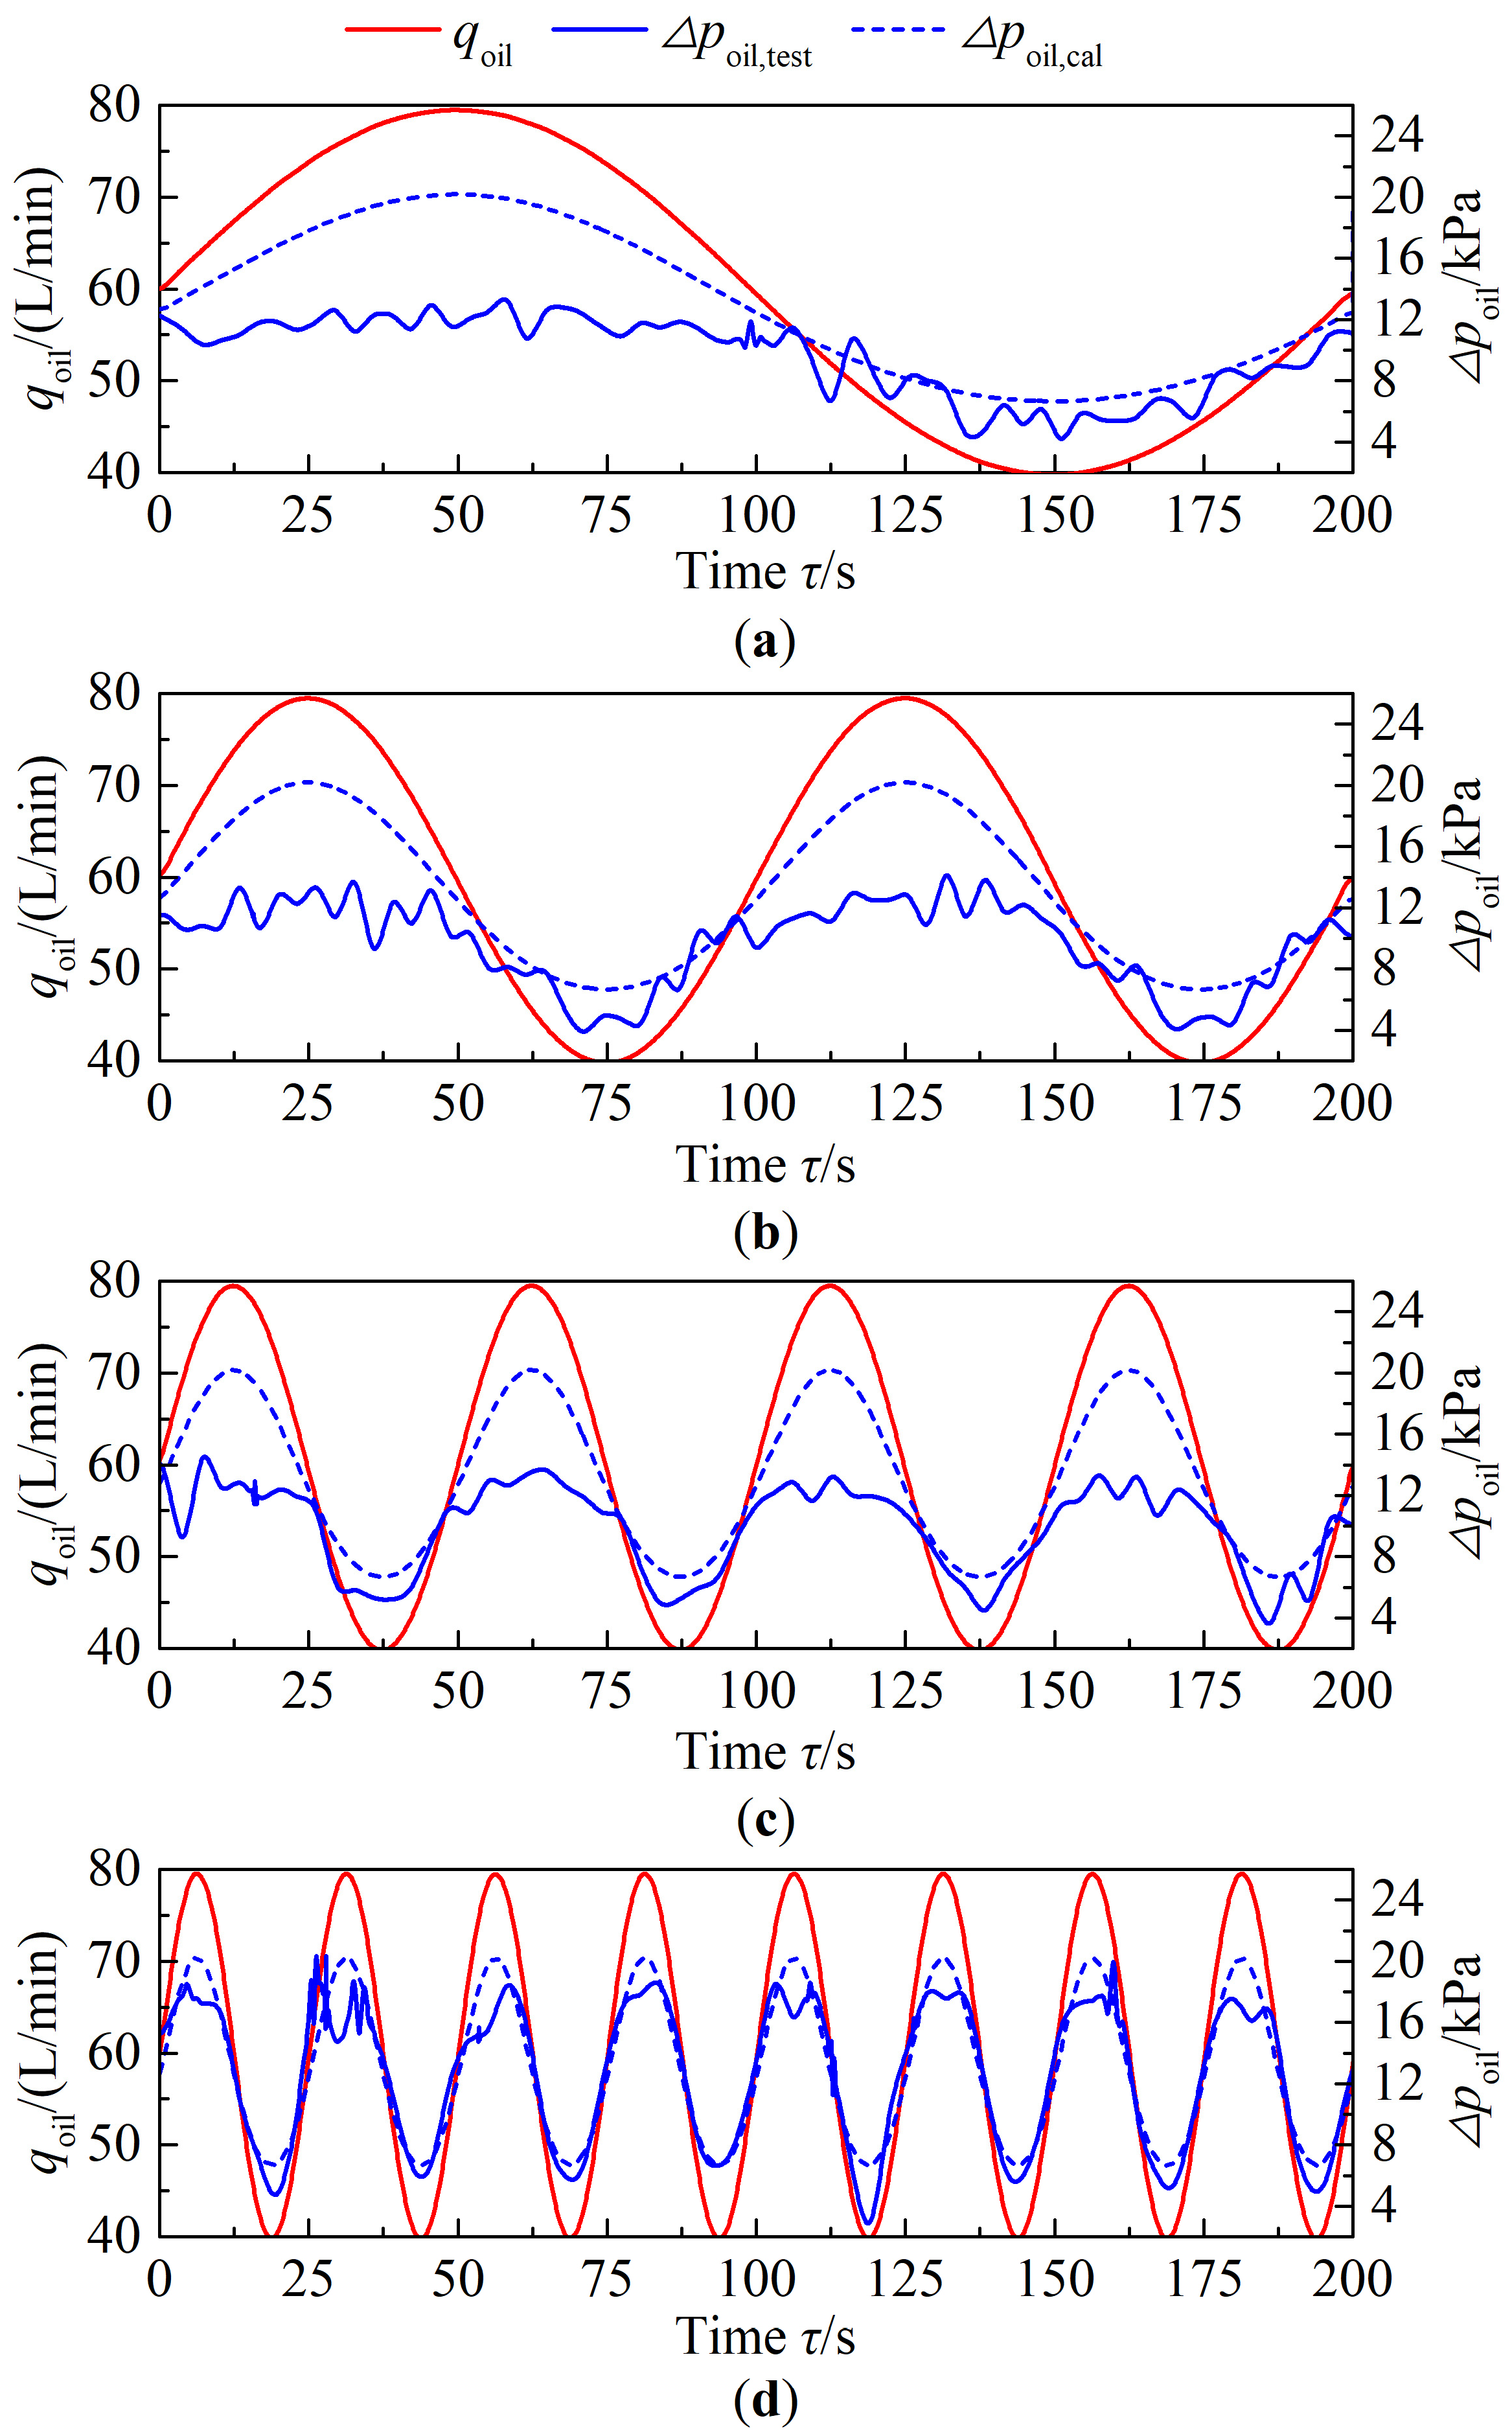
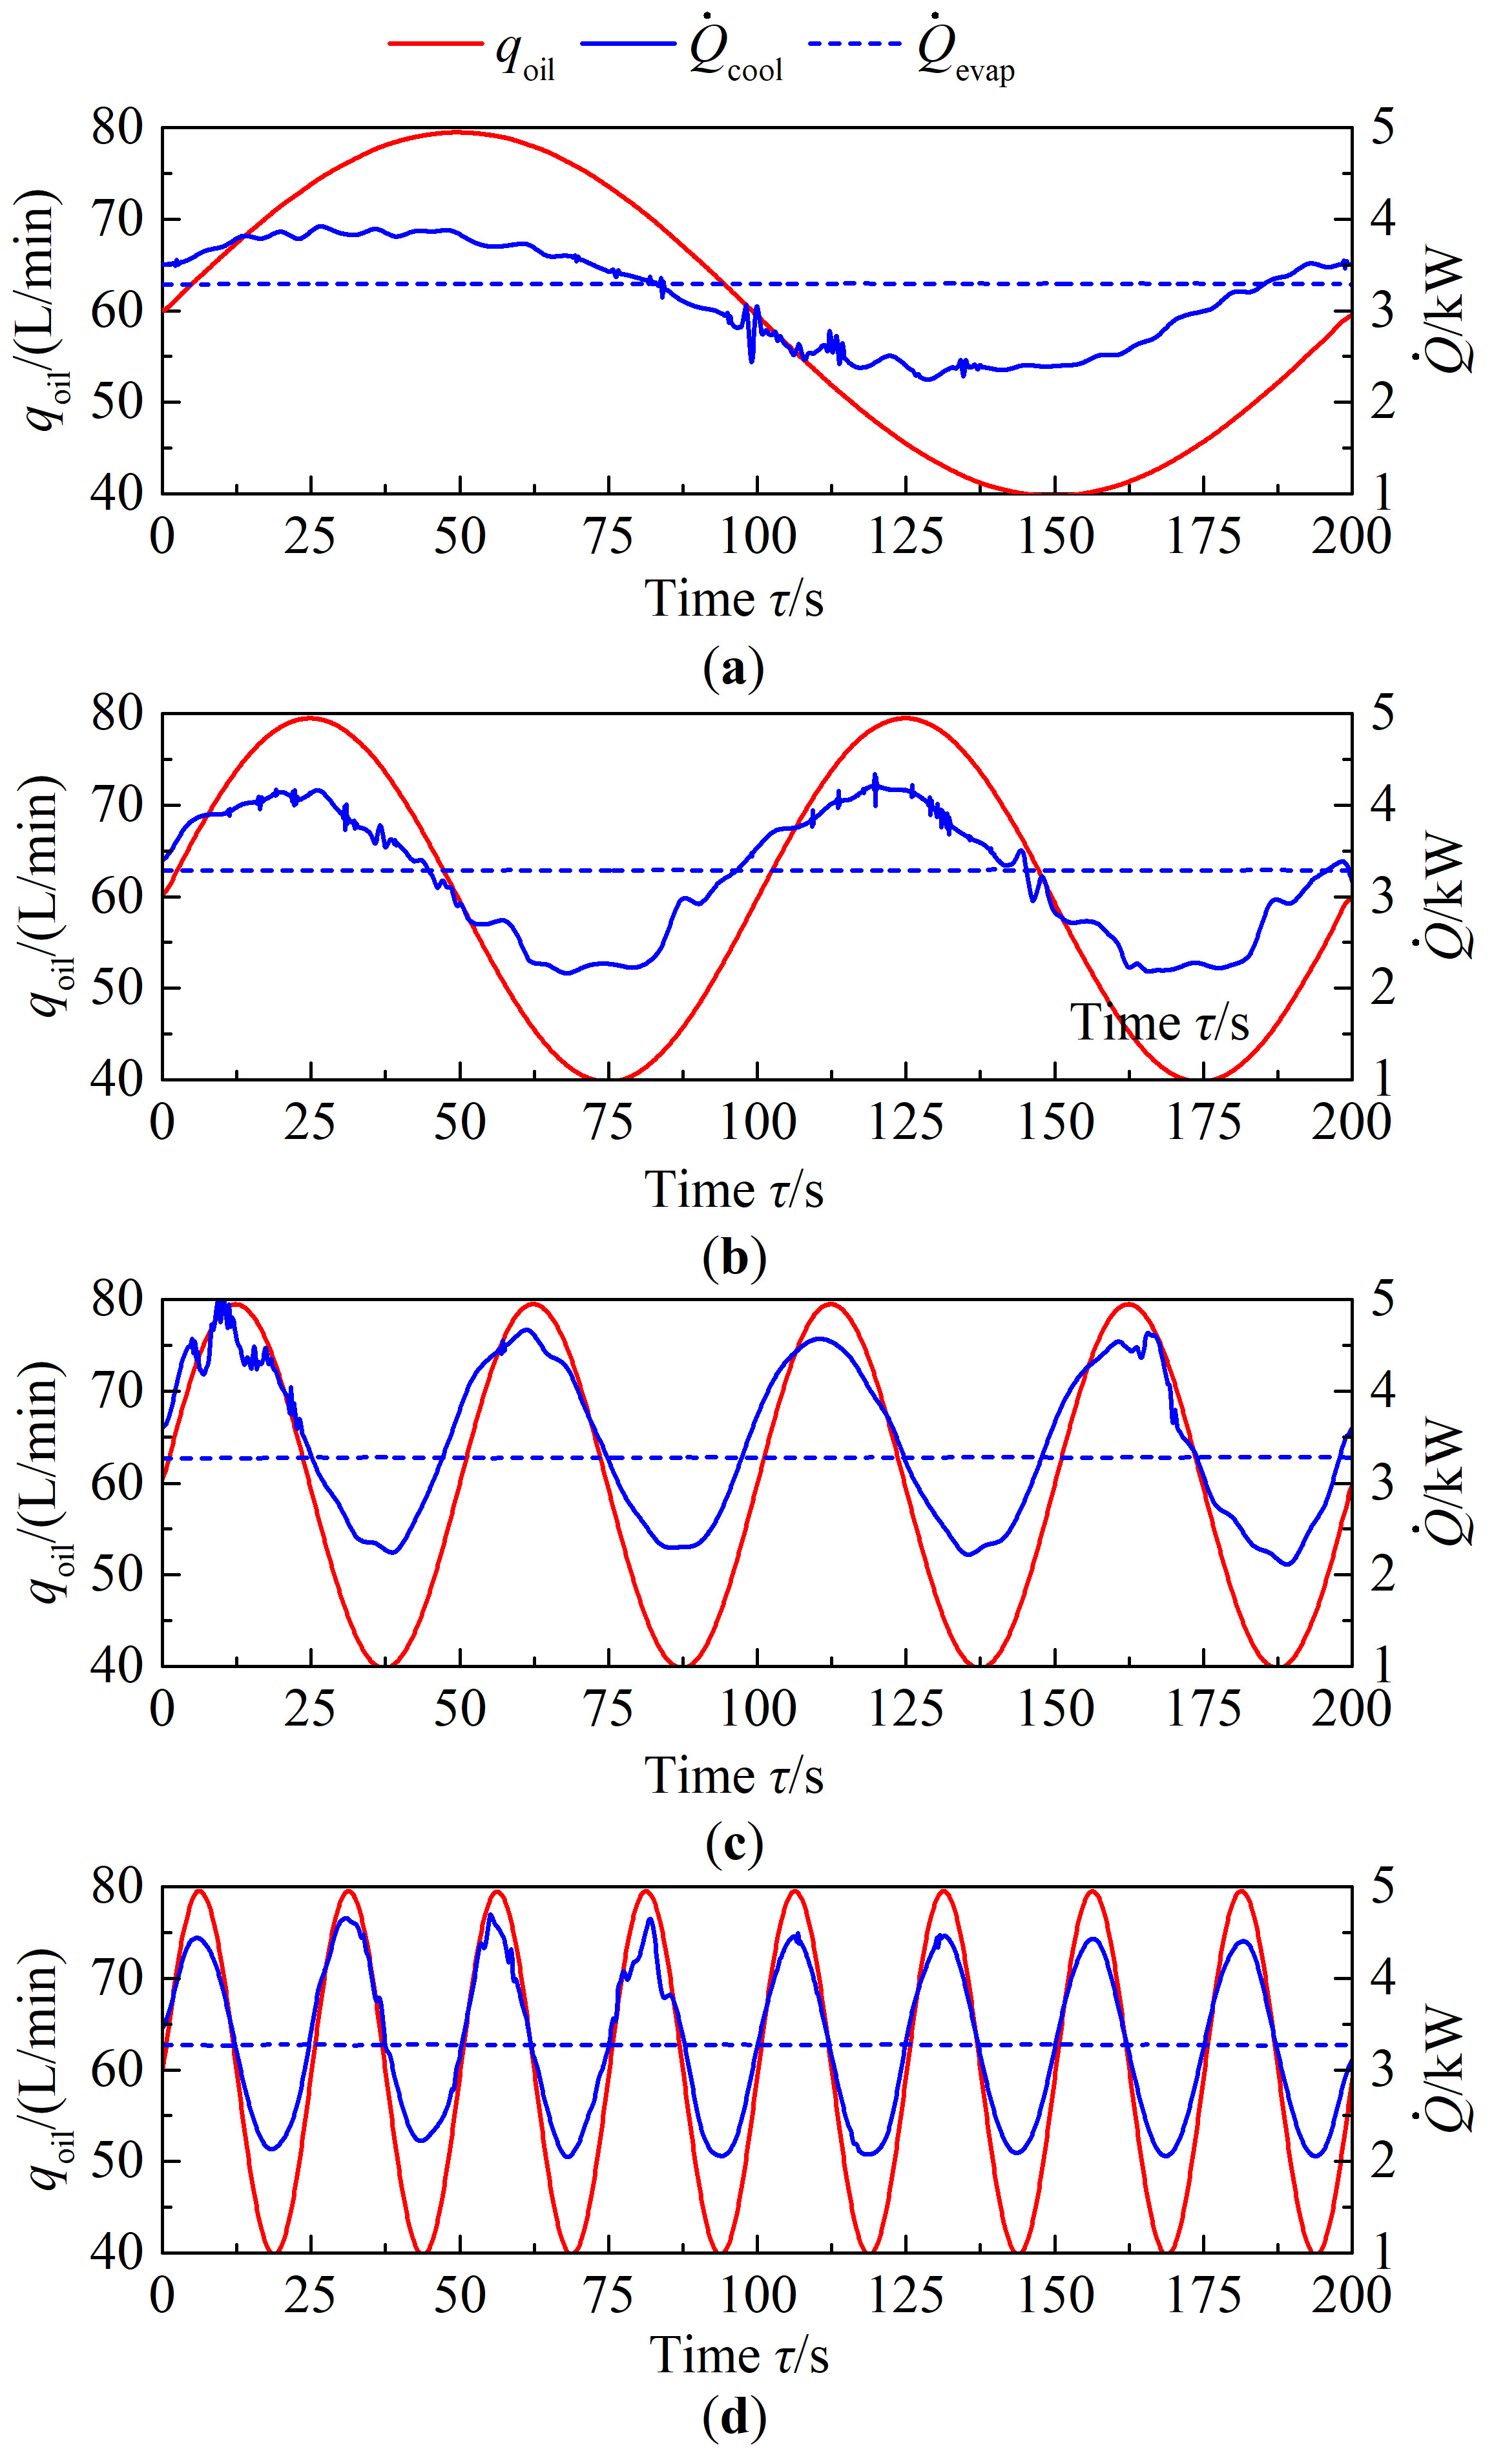
  • Through the dynamic experiment, the variation rule of the operating parameters when the oil flow rate changes periodically. As the oil flow rate changes in the range of 40~80 L/min, the oil pressure drop in the evaporator varies on a scale of 3.6~18.6 kPa, and the evaporator heat transfer rate changes between about 2~5 kW.
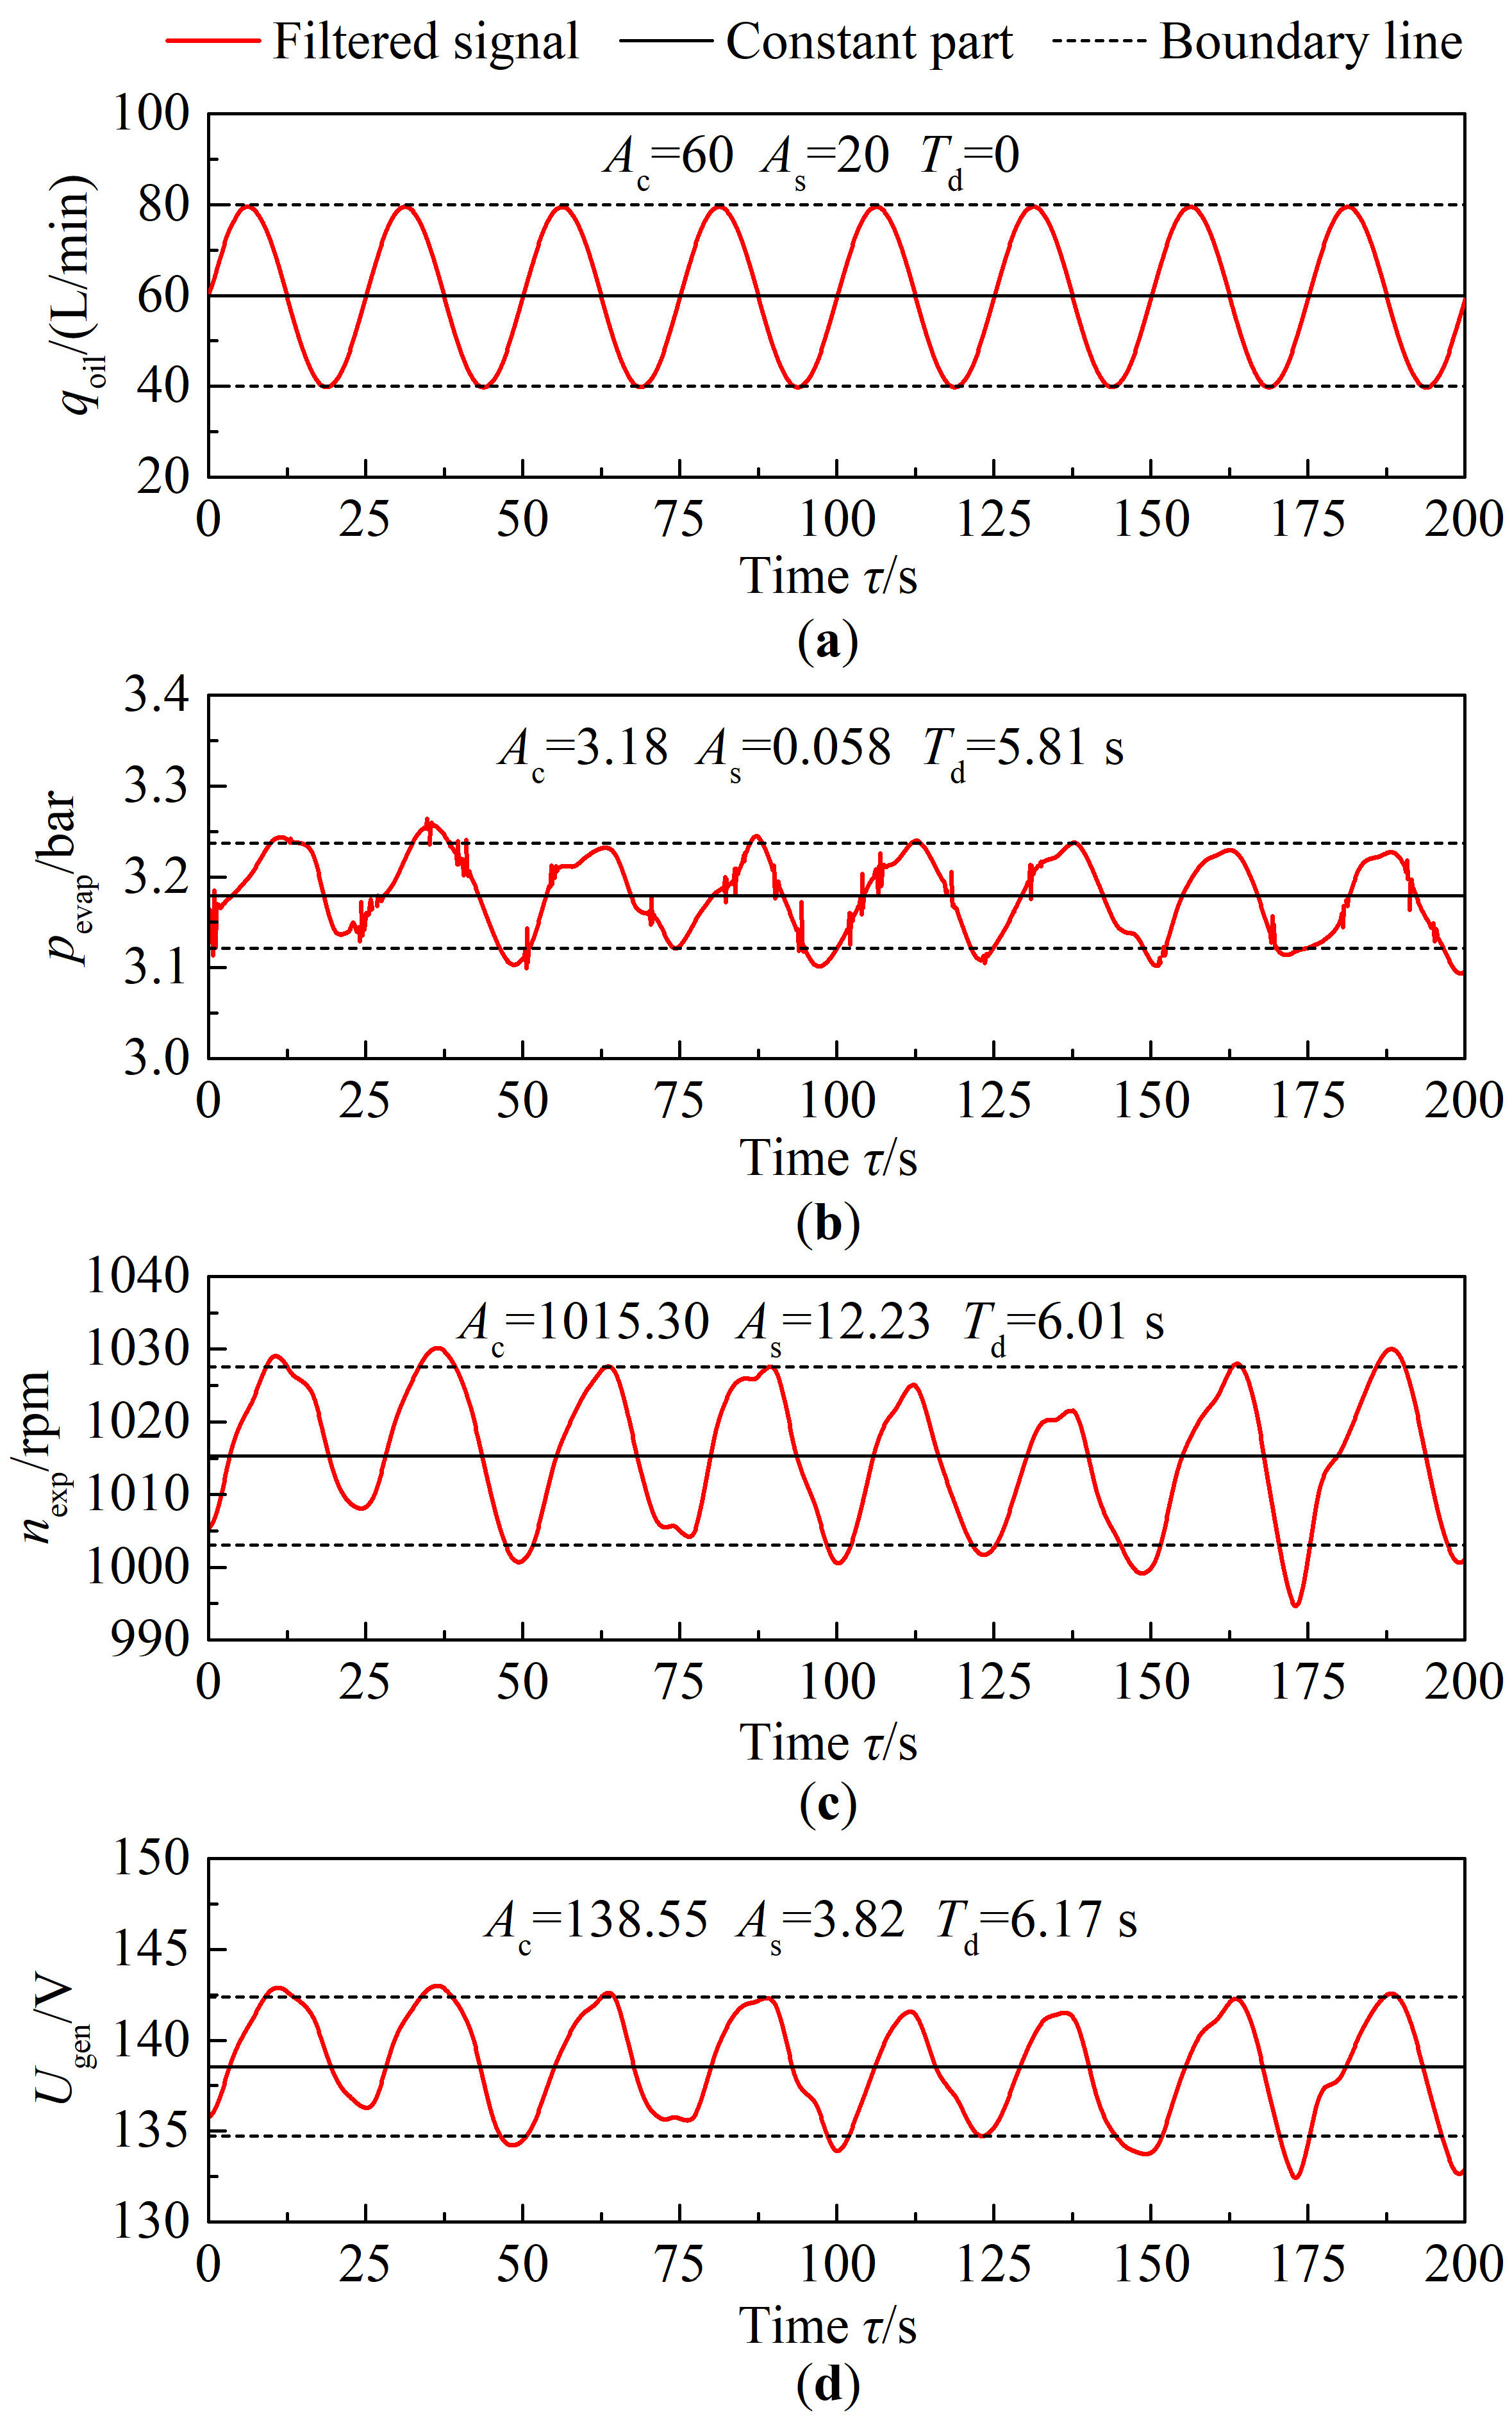
  • When the change frequency of the oil flow rate is 1/25 Hz, the ratios of relative variation of evaporating pressure, expander revolution speed, and generator voltage are 1.82% (0.058 bar), 1.20% (12.23 rpm), and 2.76% (3.82 V), respectively.
The results could be used for the modeling and calibration of the dynamic simulation for the ORC system. Then, the appropriate control strategies for the ORC systems with periodically fluctuating heat sources can be developed and validated. Thus, a comprehensive solution for the ORC system in the waste heat recovery of the hydraulic system is presented, aiming to enhance the energy-saving effect in the hydraulic oil cooling process.

Author Contributions

Conceptualization, Z.G.; methodology, Y.S.; software, P.W.; validation, Z.G. and Y.S.; formal analysis, P.W.; investigation, Y.S.; resources, Z.G.; data curation, Z.G.; writing—original draft preparation, Z.G; writing—review and editing, P.W.; visualization, Y.S.; supervision, P.W.; project administration, Z.G.; funding acquisition, Z.G. All authors have read and agreed to the published version of the manuscript.

Funding

This research was funded by the National Natural Science Foundation of China (No. 52405069), the Fundamental Research Program of Shanxi Province (No. 202203021222282), and the Scientific and Technological Innovation Programs of Higher Education Institutions in Shanxi (No. 2022L522).

Data Availability Statement

The original contributions presented in this study are included in the article Further inquiries can be directed to the corresponding author(s).

Conflicts of Interest

The authors declare no conflicts of interest.

Abbreviations

The following abbreviations are used in this manuscript:
Nomenclature
ρdensity (kg/m3)
Ttemperature (°C, K)
cpisobaric specific heat capacity (J/kg·K)
Q ˙ heat transfer rate (W)
qflow rate (m3/s)
Wpower produced or consumed (W)
hspecific enthalpy (kJ/kg)
mmass flow rate (kg/s)
ppressure (Pa)
ΔTtemperature difference (K)
ηefficiency (-)
Uvoltage (V)
nrevolution speed (rpm)
τtime (s)
Aamplitude
ffrequency (Hz)
Rratio (-)
Subscript
oilhydraulic oil
ininput
outoutput
coolcooling for hydraulic system
condcondenser
airambient air
expexpander
wpworking fluid pump
ththermal
corcorrelation
gengenerator
rvratio of the relative amplitude
oilinoil at the input
oiloutoil at the output
calcalculation
Acronyms
ORCorganic Rankine cycle
SNRsignal-to-noise ratio
RMSEroot mean square error
FFTFast Fourier Transform
DFTDiscrete Fourier Transform

References

  1. An, K.; Kang, H.; An, Y.; Park, J.; Lee, J. Methodology of Excavator System Energy Flow-Down. Energies 2020, 13, 951. [Google Scholar] [CrossRef]
  2. Moradi, R.; Cioccolanti, L. Modelling Approaches of Micro and Small-Scale Organic Rankine Cycle Systems: A Critical Review. Appl. Therm. Eng. 2024, 236, 121505. [Google Scholar] [CrossRef]
  3. Kondratiev, V.V.; Sysoev, I.A.; Kolosov, A.D.; Galishnikova, V.V.; Gladkikh, V.A.; Karlina, A.I.; Karlina, Y.I. Development and Testing of the Thermoelectric Thermal Energy Conversion Device in the Conditions of Existing Aluminum Production. Materials 2022, 15, 8526. [Google Scholar] [CrossRef]
  4. Meftahpour, H.; Saray, R.K.; Aghaei, A.T.; Bahlouli, K. Comprehensive Analysis of Energy, Exergy, Economic, and Environmental Aspects in Implementing the Kalina Cycle for Waste Heat Recovery from a Gas Turbine Cycle Coupled with a Steam Generator. Energy 2024, 290, 130094. [Google Scholar] [CrossRef]
  5. Gu, Z.; Zhang, X.; Dong, Z.; Quan, L. A Solution to the Cooling and Preheating of Hydraulic System by Organic Rankine Cycle with Heat Pump. Energy Convers. Manag. 2019, 180, 94–105. [Google Scholar] [CrossRef]
  6. Rahbar, K.; Mahmoud, S.; Al-Dadah, R.K.; Moazami, N.; Mirhadizadeh, S.A. Review of Organic Rankine Cycle for Small-Scale Applications. Energy Convers. Manag. 2017, 134, 135–155. [Google Scholar] [CrossRef]
  7. Maksimov, I.; Kindra, V.; Vegera, A.; Rogalev, A.; Rogalev, N. Thermodynamic Analysis and Optimization of Power Cycles for Waste Heat Recovery. Energies 2024, 17, 6375. [Google Scholar] [CrossRef]
  8. Daniarta, S.; Nemś, M.; Kolasiński, P. A Review on Thermal Energy Storage Applicable for Low- and Medium-Temperature Organic Rankine Cycle. Energy 2023, 278, 127931. [Google Scholar] [CrossRef]
  9. Valencia-Ochoa, G.; Duarte-Forero, J.; Mendoza-Casseres, D. Multi-Objective Optimization of the Energy, Exergy, and Environmental Performance of a Hybrid Solar–Biomass Combined Brayton/Organic Rankine Cycle. Energies 2025, 18, 203. [Google Scholar] [CrossRef]
  10. Hu, Z.; Wu, W.; Si, Y. Optimization of Organic Rankine Cycle for Hot Dry Rock Power System: A Stackelberg Game Approach. Energies 2024, 17, 5151. [Google Scholar] [CrossRef]
  11. Wilberforce, T.; Muhammad, I. Dynamic Modelling and Analysis of Organic Rankine Cycle Power Units for the Recovery of Waste Heat from 110kW Proton Exchange Membrane Fuel Cell System. Int. J. Thermofluids 2023, 17, 100280. [Google Scholar] [CrossRef]
  12. Ling, J.; Chen, X. Energy and Economic Analysis of a New Combination Cascade Waste Heat Recovery System of a Waste-to-Energy Plant. Energies 2024, 17, 5196. [Google Scholar] [CrossRef]
  13. Zhao, R.; Zhang, H.; Song, S.; Tian, Y.; Yang, Y.; Liu, Y. Integrated Simulation and Control Strategy of the Diesel Engine–Organic Rankine Cycle (ORC) Combined System. Energy Convers. Manag. 2018, 156, 639–654. [Google Scholar] [CrossRef]
  14. Wang, Y.; Wang, J.; Cheng, Z.; Sun, Q.; Zhao, P.; Dai, Y. Dynamic Performance of an Organic Rankine Cycle System with a Dynamic Turbine Model: A Comparison Study. Appl. Therm. Eng. 2020, 181, 115940. [Google Scholar] [CrossRef]
  15. Xu, B.; Rathod, D.; Kulkarni, S.; Yebi, A.; Filipi, Z.; Onori, S.; Hoffman, M. Transient Dynamic Modeling and Validation of an Organic Rankine Cycle Waste Heat Recovery System for Heavy Duty Diesel Engine Applications. Appl. Energy 2017, 205, 260–279. [Google Scholar] [CrossRef]
  16. Wang, Z.; Zhang, S.; Xia, X.; Zhao, Y.; Yi, Q.; Zhang, X. Experimental Study on Dynamic Characteristics of Organic Rankine Cycle Coupled Vapor Compression Refrigeration System with a Zeotropic Mixture. Energy 2024, 307, 132736. [Google Scholar] [CrossRef]
  17. Wu, J.; Liang, Y.; Sun, Z.; Zhu, Y.; Ye, J.; Lu, J. Dynamic Analysis and Control Strategy of ORC Coupled Ejector Expansion Refrigeration Cycle Driven by Geothermal Water. J. Clean. Prod. 2024, 445, 141309. [Google Scholar] [CrossRef]
  18. Zhang, H.-H.; Xi, H.; He, Y.-L.; Zhang, Y.-W.; Ning, B. Experimental Study of the Organic Rankine Cycle under Different Heat and Cooling Conditions. Energy 2019, 180, 678–688. [Google Scholar] [CrossRef]
  19. Shao, L.; Zhu, J.; Meng, X.; Wei, X.; Ma, X. Experimental Study of an Organic Rankine Cycle System with Radial Inflow Turbine and R123. Appl. Therm. Eng. 2017, 124, 940–947. [Google Scholar] [CrossRef]
  20. Muhammad, U.; Imran, M.; Lee, D.H.; Park, B.S. Design and Experimental Investigation of a 1kW Organic Rankine Cycle System Using R245fa as Working Fluid for Low-Grade Waste Heat Recovery from Steam. Energy Convers. Manag. 2015, 103, 1089–1100. [Google Scholar] [CrossRef]
  21. Pesyridis, A.; Asif, M.S.; Mehranfar, S.; Mahmoudzadeh Andwari, A.; Gharehghani, A.; Megaritis, T. Design of the Organic Rankine Cycle for High-Efficiency Diesel Engines in Marine Applications. Energies 2023, 16, 4374. [Google Scholar] [CrossRef]
  22. Bai, M.; Zhang, Y.; Deng, S.; Zhao, L.; Zhao, R.; Lu, Y. An Experimental Study on Operation Characteristics of the Organic Rankine Cycle System under the Single-and Multiple-Variables Regulation. Sustain. Energy Technol. Assess. 2020, 41, 100785. [Google Scholar] [CrossRef]
  23. Ni, J.; Zhao, L.; Zhang, Z.; Zhang, Y.; Zhang, J.; Deng, S.; Ma, M. Dynamic Performance Investigation of Organic Rankine Cycle Driven by Solar Energy under Cloudy Condition. Energy 2018, 147, 122–141. [Google Scholar] [CrossRef]
  24. Li, S.; Ma, H.; Li, W. Dynamic Performance Analysis of Solar Organic Rankine Cycle with Thermal Energy Storage. Appl. Therm. Eng. 2018, 129, 155–164. [Google Scholar] [CrossRef]
  25. Fu, B.-R.; Lee, Y.-R.; Hsieh, J.-C. Design, Construction, and Preliminary Results of a 250-kW Organic Rankine Cycle System. Appl. Therm. Eng. 2015, 80, 339–346. [Google Scholar] [CrossRef]
  26. Zhang, Q.; Feng, Y.-Q.; Xu, K.-J.; Liang, H.-J.; Liu, Z.-N.; Zhao, C.-Y.; Wang, Y.-Z.; Sapin, P.; Markides, C.N. Dynamic Behaviour and Performance Evaluation of a Biomass-Fired Organic Rankine Cycle Combined Heat and Power (ORC-CHP) System under Different Control Strategies. Appl. Therm. Eng. 2024, 248, 123236. [Google Scholar] [CrossRef]
  27. Zhang, W.; Wang, E.; Meng, F.; Zhang, F.; Zhao, C. Closed-Loop PI Control of an Organic Rankine Cycle for Engine Exhaust Heat Recovery. Energies 2020, 13, 3817. [Google Scholar] [CrossRef]
  28. Han, Y.; Zhang, Y.; Zuo, T.; Chen, R.; Xu, Y. Experimental Study and Energy Loss Analysis of an R245fa Organic Rankine Cycle Prototype System with a Radial Piston Expander. Appl. Therm. Eng. 2020, 169, 114939. [Google Scholar] [CrossRef]
  29. Zhang, Y.; Tsai, Y.-C.; Ren, X.; Tuo, Z.; Wang, W.; Gong, L.; Hung, T.-C. Experimental Study of the External Load Characteristics on a Micro-Scale Organic Rankine Cycle System. Energy 2024, 306, 132453. [Google Scholar] [CrossRef]
  30. Liu, C.; Wang, S.; Zhang, C.; Li, Q.; Xu, X.; Huo, E. Experimental Study of Micro-Scale Organic Rankine Cycle System Based on Scroll Expander. Energy 2019, 188, 115930. [Google Scholar] [CrossRef]
  31. Cao, S.; Xu, J.; Miao, Z.; Liu, X.; Zhang, M.; Xie, X.; Li, Z.; Zhao, X.; Tang, G. Steady and Transient Operation of an Organic Rankine Cycle Power System. Renew. Energy 2019, 133, 284–294. [Google Scholar] [CrossRef]
  32. Xu, B.; Rathod, D.; Yebi, A.; Filipi, Z.; Onori, S.; Hoffman, M. A Comprehensive Review of Organic Rankine Cycle Waste Heat Recovery Systems in Heavy-Duty Diesel Engine Applications. Renew. Sustain. Energy Rev. 2019, 107, 145–170. [Google Scholar] [CrossRef]
  33. Wang, C.; Yang, F.; Zhang, H.; Zhao, R.; Xu, Y. Energy Recovery Efficiency Analysis of Organic Rankine Cycle System in Vehicle Engine under Different Road Conditions. Energy Convers. Manag. 2020, 223, 113317. [Google Scholar] [CrossRef]
  34. Ashwni; Sherwani, A.F.; Tiwari, D.; Kumar, A. Sensitivity Analysis and Multi-Objective Optimization of Organic Rankine Cycle Integrated with Vapor Compression Refrigeration System. Energy Sources Recovery Util. Environ. Eff. 2021, 43, 1–13. [Google Scholar] [CrossRef]
  35. Dang, H.; Han, Y.; Liu, J.; Tan, M.; Wang, X. Feasibility Analysis and Performance Characteristic Investigation of Thermal Energy Storage System Based on Organic Rankine Cycle for Engine Exhaust Temperature Modulation. Energy Sources Recovery Util. Environ. Eff. 2024, 46, 53–74. [Google Scholar] [CrossRef]
  36. Ping, X.; Yang, F.; Zhang, H.; Xing, C.; Wang, C.; Zhang, W.; Wang, Y. Energy, Economic and Environmental Dynamic Response Characteristics of Organic Rankine Cycle (ORC) System under Different Driving Cycles. Energy 2022, 246, 123438. [Google Scholar] [CrossRef]
Figure 1. Picture of the experimental prototype and the key components.
Energies 18 01458 g001
Figure 2. Schematic diagram of the experiment system (The numbers represent the status points at corresponding positions).
Energies 18 01458 g002
Figure 3. The relationship between hydraulic drop and flow rate of the oil in the evaporator: (a) measured data; (b) corrected results.
Energies 18 01458 g003aEnergies 18 01458 g003b
Figure 4. The influence of oil flow and electrical load on system steady-state performance: (a) expander output power; (b) generator output power; (c) expander–generator efficiency; (d) cooling capacity; (e) power generation efficiency; (f) ideal thermal efficiency.
Energies 18 01458 g004
Figure 5. The influence of working fluid flow rate on ORC system performance.
Energies 18 01458 g005
Figure 6. Correlation coefficient and significance of the measured parameters: (a) the related variable is oil flow rate qoil; (b) the related variable is connected load Wload.
Energies 18 01458 g006
Figure 7. SNR and RMSE of the processed signals.
Energies 18 01458 g007
Figure 8. Filtering effect of generator voltage.
Energies 18 01458 g008
Figure 9. The relative variation ratio of the filtered signal.
Energies 18 01458 g009
Figure 10. Variation of pressure drop at different frequency of oil flow rate: (a) f = 1/200; (b) f = 1/100; (c) f = 1/50; (d) f = 1/25.
Energies 18 01458 g010
Figure 11. Variation of heat flow rate transferred in the evaporator: (a) f = 1/200; (b) f = 1/100; (c) f = 1/50; (d) f = 1/25.
Energies 18 01458 g011
Figure 12. Variation of ORC system parameters with f = 1/25 Hz in oil flow rate: (a) hydraulic oil flow rate; (b) evaporating pressure; (c) expander revolution speed; (d) generator voltage.
Energies 18 01458 g012
Table 1. Primary parameters of key components.
ComponentParametersStructure
Hydraulic pumpDisplacement 71 mL/r, pressure 280 barAxial piston pump
Loading valveFlow rate 200 L/min, pressure 250 barOverflow valve
EvaporatorCounterflow, area 3 m2Plate type
CondenserCrossflow, area 120 m2Tub-finned
Working fluid pumpFlow rate 800 L/h, pressure 18 barDiaphragm metering pump
ExpanderSweeping displacement 106 mL/rScroll type
Table 2. Main parameters of applied sensors.
ParametersType of SensorsManufacturerRangeAccuracy
Working fluid temperatureT type thermocoupleOMEGA (Norwalk, CT, USA)−20~150 °C0.4%
Hydraulic oil temperaturePT100HYDAC (Hamburg, Germany)−25~100 °C0.8%
Hydraulic oil pressureRelative pressureHYDAC (Hamburg, Germany)0~10 bar0.25%
Working fluid pressureAbsolute pressureHYDAC(Hamburg, Germany)0~30 bar/0~16 bar0.25%
Working fluid mass flow rateCoriolis sensorXi’an Dongfeng (Xi’an, China)0.04~0.4 t/h0.15%
Electric powerPower meterYOKOGAWA (Tokyo, Japan)0~3000 W0.02%
Air velocityAir flowmeterUNI-T (Dongguan, China)0.3~45 m/s3%
Rotational speedPhotoelectric tachometerUNI-T (Dongguan, China)10~99,999 rpm0.4%
Table 3. Delay time of each parameter under different flow frequencies.
τdf = 1/200 Hzf = 1/100 Hzf = 1/50 Hzf = 1/25 Hz
pevap8.346.857.035.81
nexp14.1110.78.446.01
Ugen18.2212.219.056.17
Disclaimer/Publisher’s Note: The statements, opinions and data contained in all publications are solely those of the individual author(s) and contributor(s) and not of MDPI and/or the editor(s). MDPI and/or the editor(s) disclaim responsibility for any injury to people or property resulting from any ideas, methods, instructions or products referred to in the content.

