

Evolutionary Game-Based Regulatory Strategy Optimization for Information Transmission Prices in Integrated Energy Systems


Abstract
1. Introduction
- We formulate a model for information transmission price regulation that positions communication network operators as independent third parties, incorporating their interactions with energy system managers. By separating these roles, we emphasize the diversity and interactivity of the participants within the IES.
- We employ evolutionary game theory and incorporate the assumption of bounded rationality to realistically simulate the strategic interactions between different market entities. By introducing the concept of information transmission pricing, we provide a novel perspective for optimizing regulatory strategies within the IES. This approach facilitates more refined and dynamic regulatory practices, thereby enhancing the efficiency and adaptability of regulatory mechanisms
- We develop the degree of asset utilization as a criterion in the process of defining effective assets, moving beyond a sole reliance on asset relevance. This innovative approach can, to a certain extent, mitigate excessive investment by communication network service providers, thereby preventing information transmission prices from escalating to excessive levels.
2. System Formulation
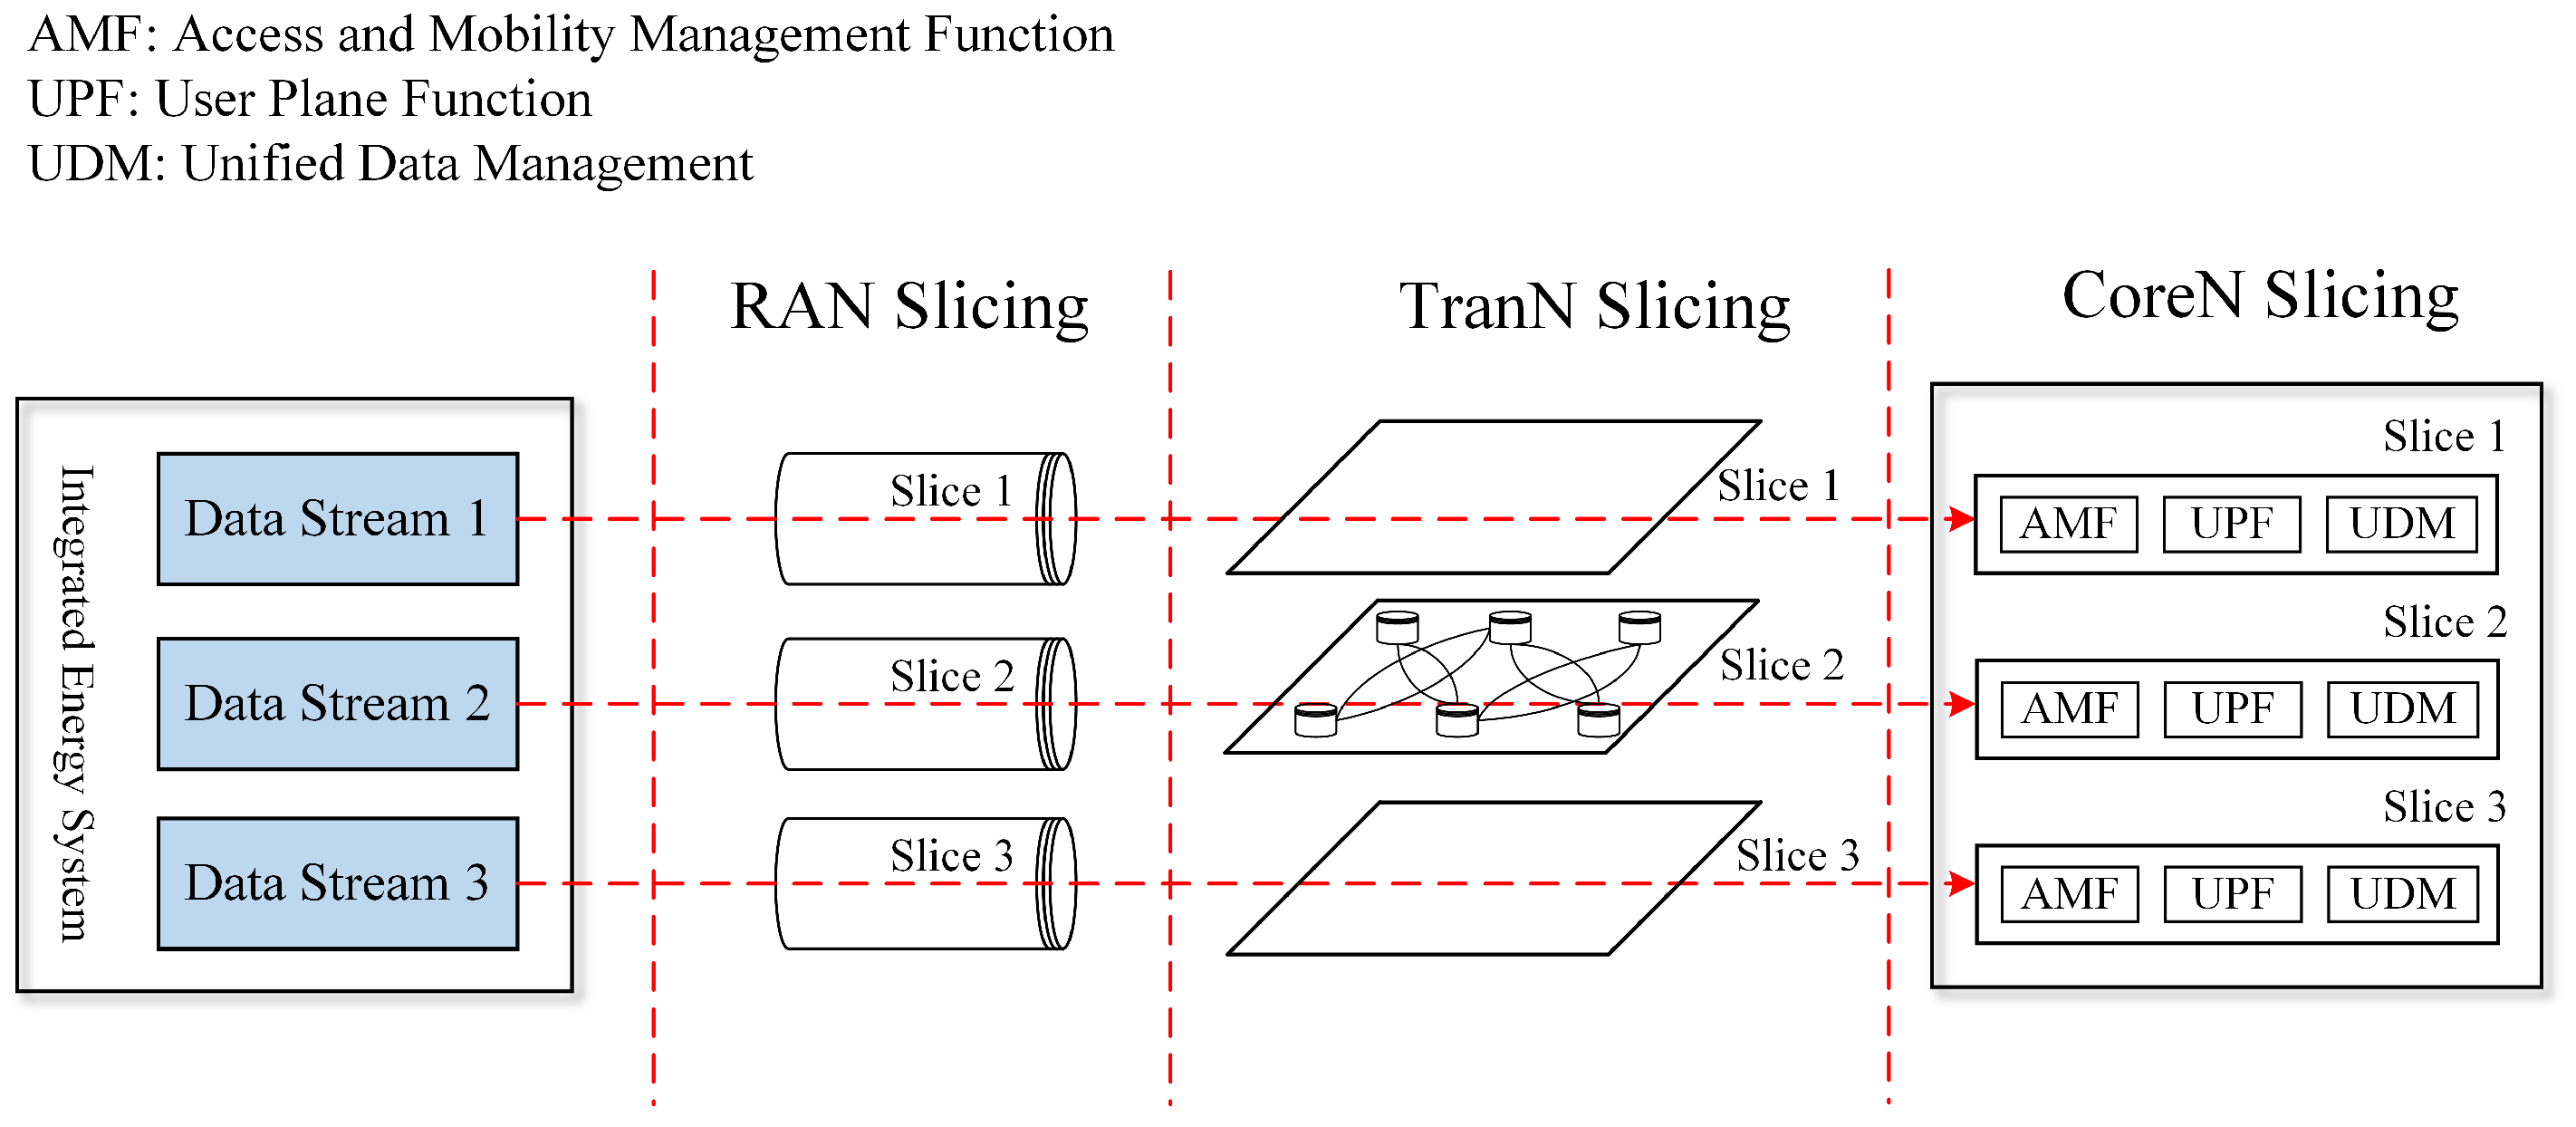
2.1. 5G-and-Beyond Network Slicing Framework
2.2. Problem Description and Model Hypothesis
- When the CNO makes rational investments, the revenue-generating fixed assets are represented as , while the operational and maintenance expenses are denoted as , and the equipment depreciation costs are expressed as . The allowed rate of return established by the IESM is denoted as . Regardless of whether the IESM employs a strict or lenient regulatory strategy, the actual revenue generated by the CNO is equal to the permitted revenue, both of which are expressed as .
- Let denote the ratio of the CNO’s redundant assets to its rational investment assets, implying that the total fixed assets related to communication network owned by the CNO amount to . Under a strict regulatory strategy implemented by the IESM, the proportion of redundant assets that can be classified as revenue-generating fixed assets is limited to . Consequently, the operational and maintenance expenses, as well as the depreciation costs associated with the productive redundant assets, are designated as and , respectively. The cost of the remaining non-performing assets incurred by the CNO is denoted by . In this context, the actual revenue of the CNO is represented as . Conversely, when the IESM adopts a lenient regulatory policy, all investments related to information transmission are considered as revenue-generating fixed assets for the CNO, resulting in actual revenue being equal to permitted revenue, both represented by .
- When the IESM adopts a strict regulatory strategy, and the CNO engages in rational investment, the reputation acquired by the IESM is denoted as , with the associated costs incurred by the IESM being denoted as . In contrast, under a lenient regulatory policy, the costs incurred are represented by , where and both are greater than zero.
- When the CNO engages in rational investments, the asset utilization rate is high, which leads to an efficient allocation of information transmission costs, resulting in social welfare denoted as . Conversely, under lenient regulation, the CNO’s excessive investments inflate information transmission costs, thereby causing a loss in social welfare denoted as . Under strict regulation conditions, the social welfare loss arising from the operator’s excessive investments is represented by , where .
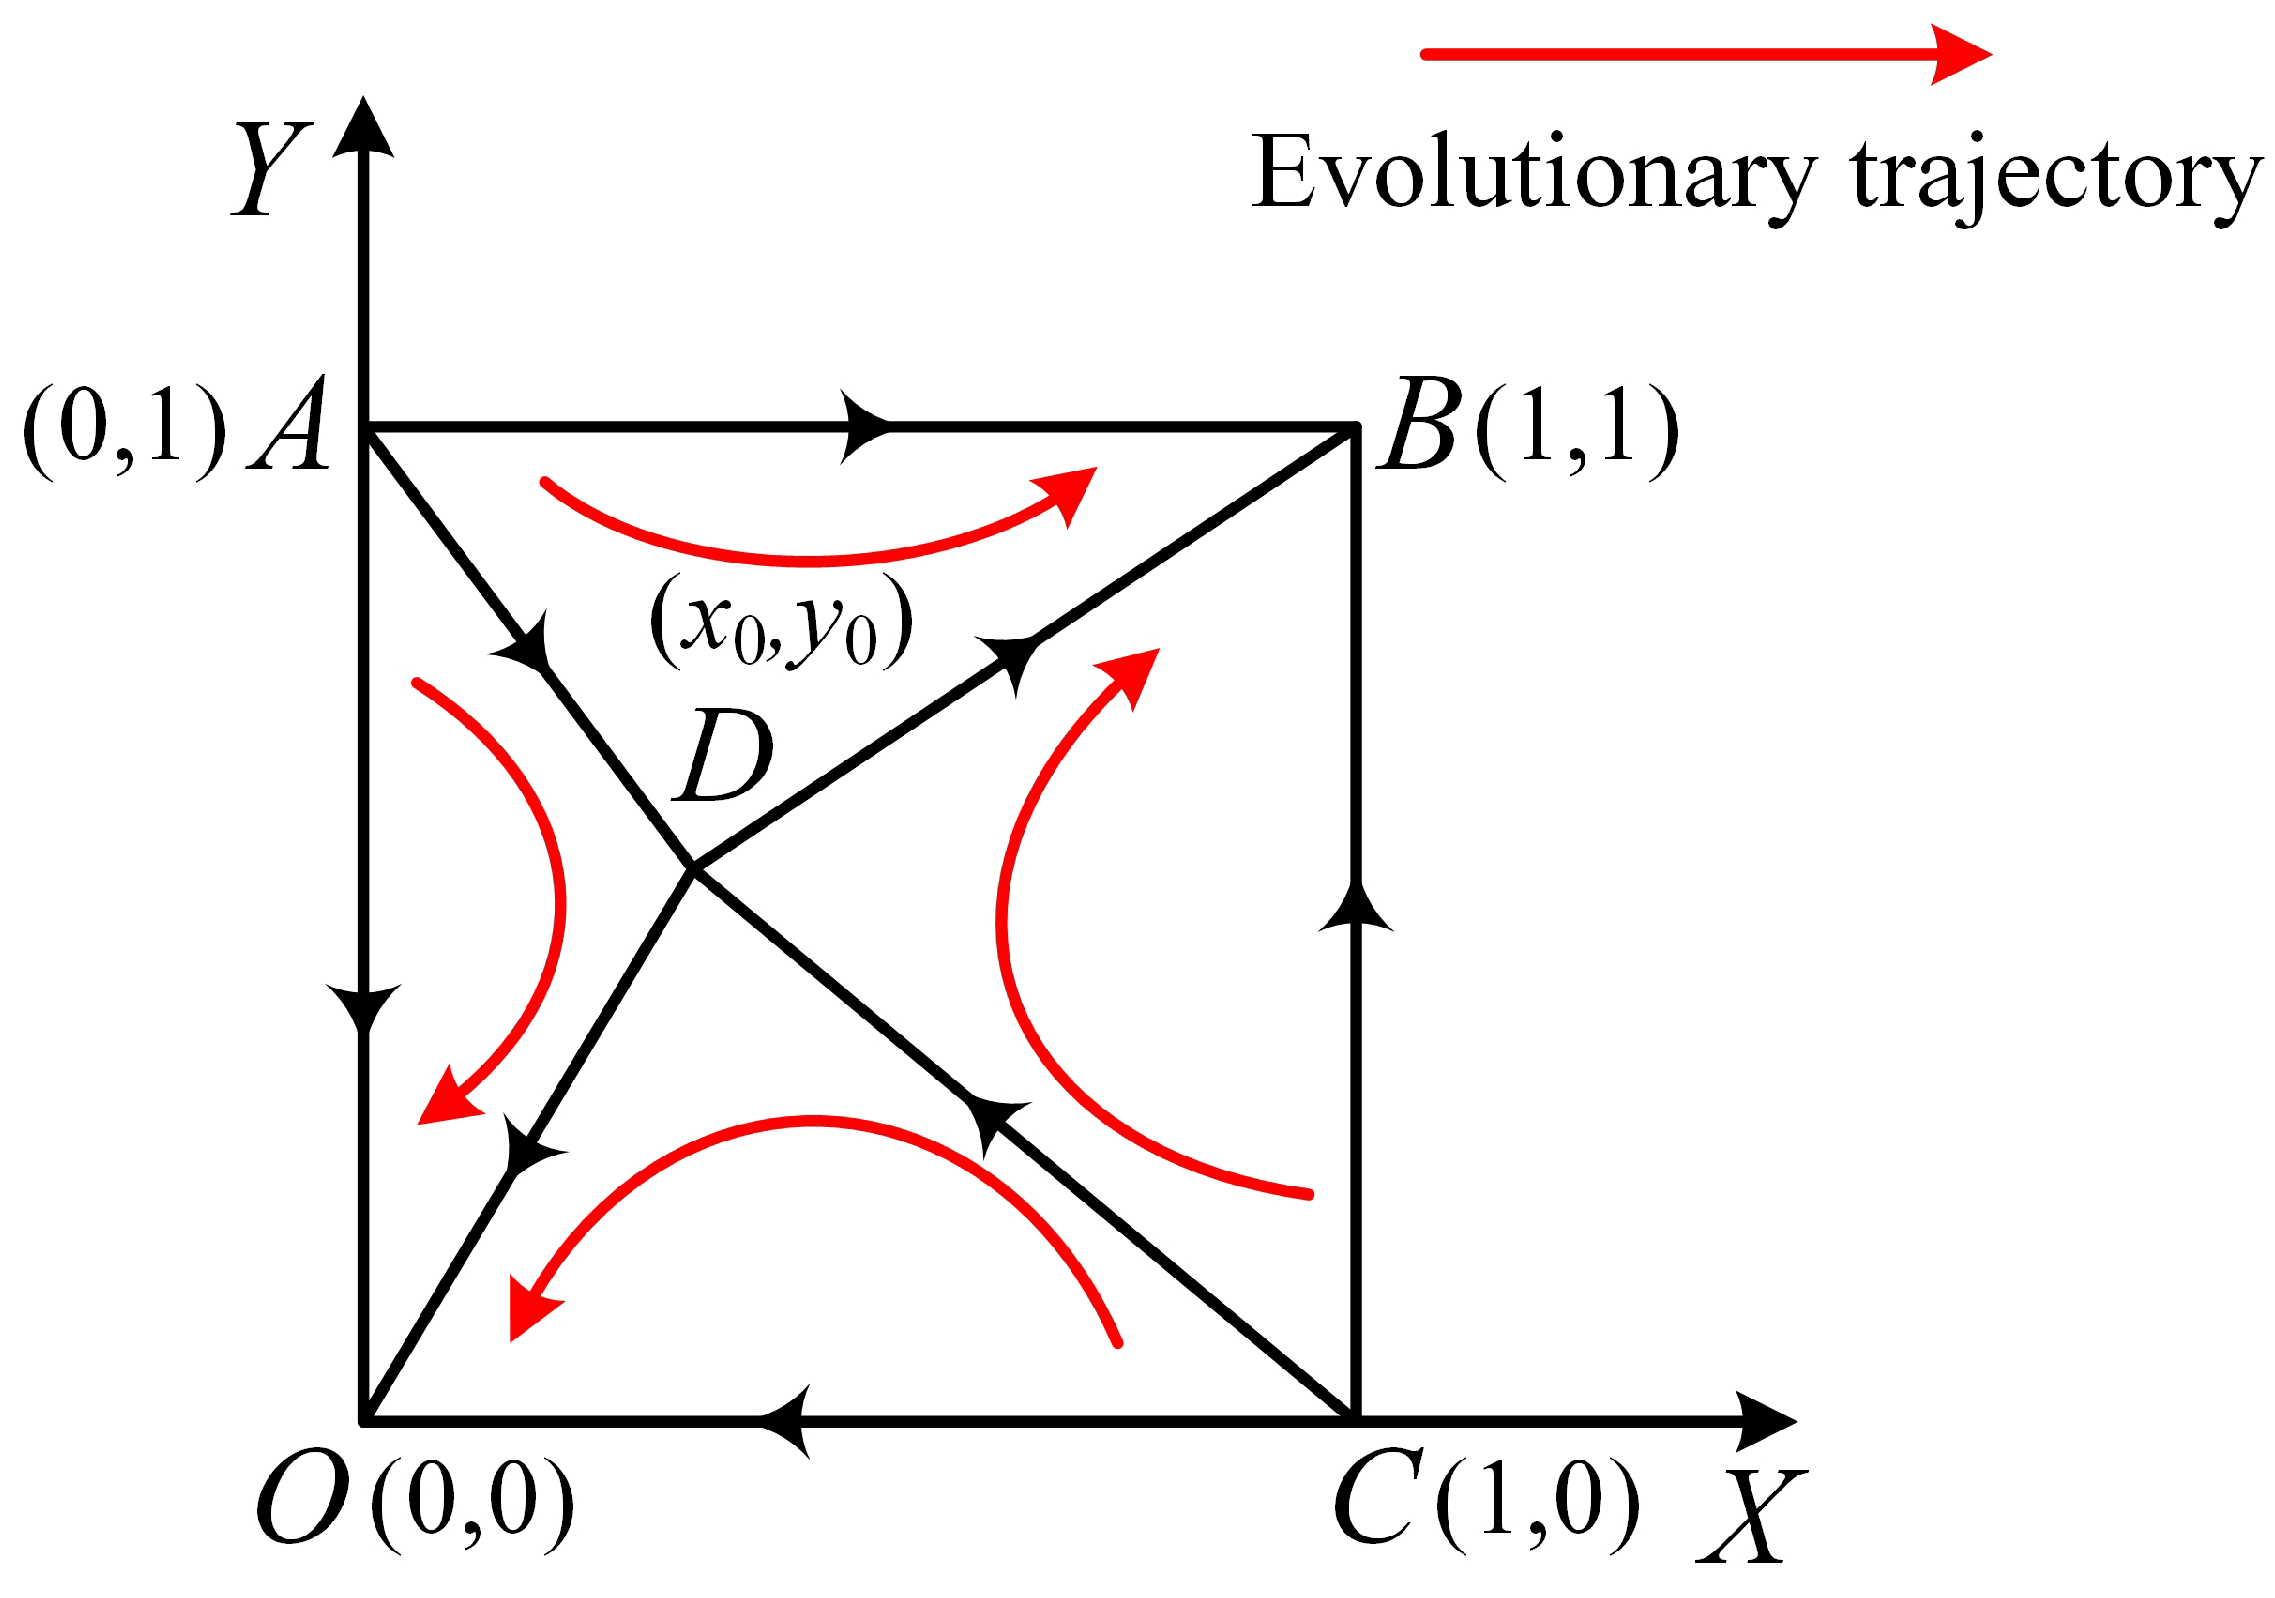
2.3. Evolutionary Game Strategy Analysis
3. Analysis of Evolutionary Equilibrium
3.1. Determination of Equilibrium Points
3.2. Equilibrium Analysis
- Under the lenient regulatory strategies implemented by the IESM, the difference in net revenues when the CNO opts for rational investment as opposed to excessive investment is denoted by , given that , it follows that ;
- When the IESM implements a strict regulatory strategy, the difference in net revenues between the CNO’s rational investment and excessive investment strategies is denoted as ;
- When the CNO adopts an excessive investment strategy, the difference in net revenues between the IESM’s strict and lenient regulatory strategies is denoted as ;
- When the CNO employs a rational investment strategy, the difference in net revenues between the IESM’s strict and lenient regulatory policies is denoted by .
4. Case Study
4.1. Simulations Based on Case 8
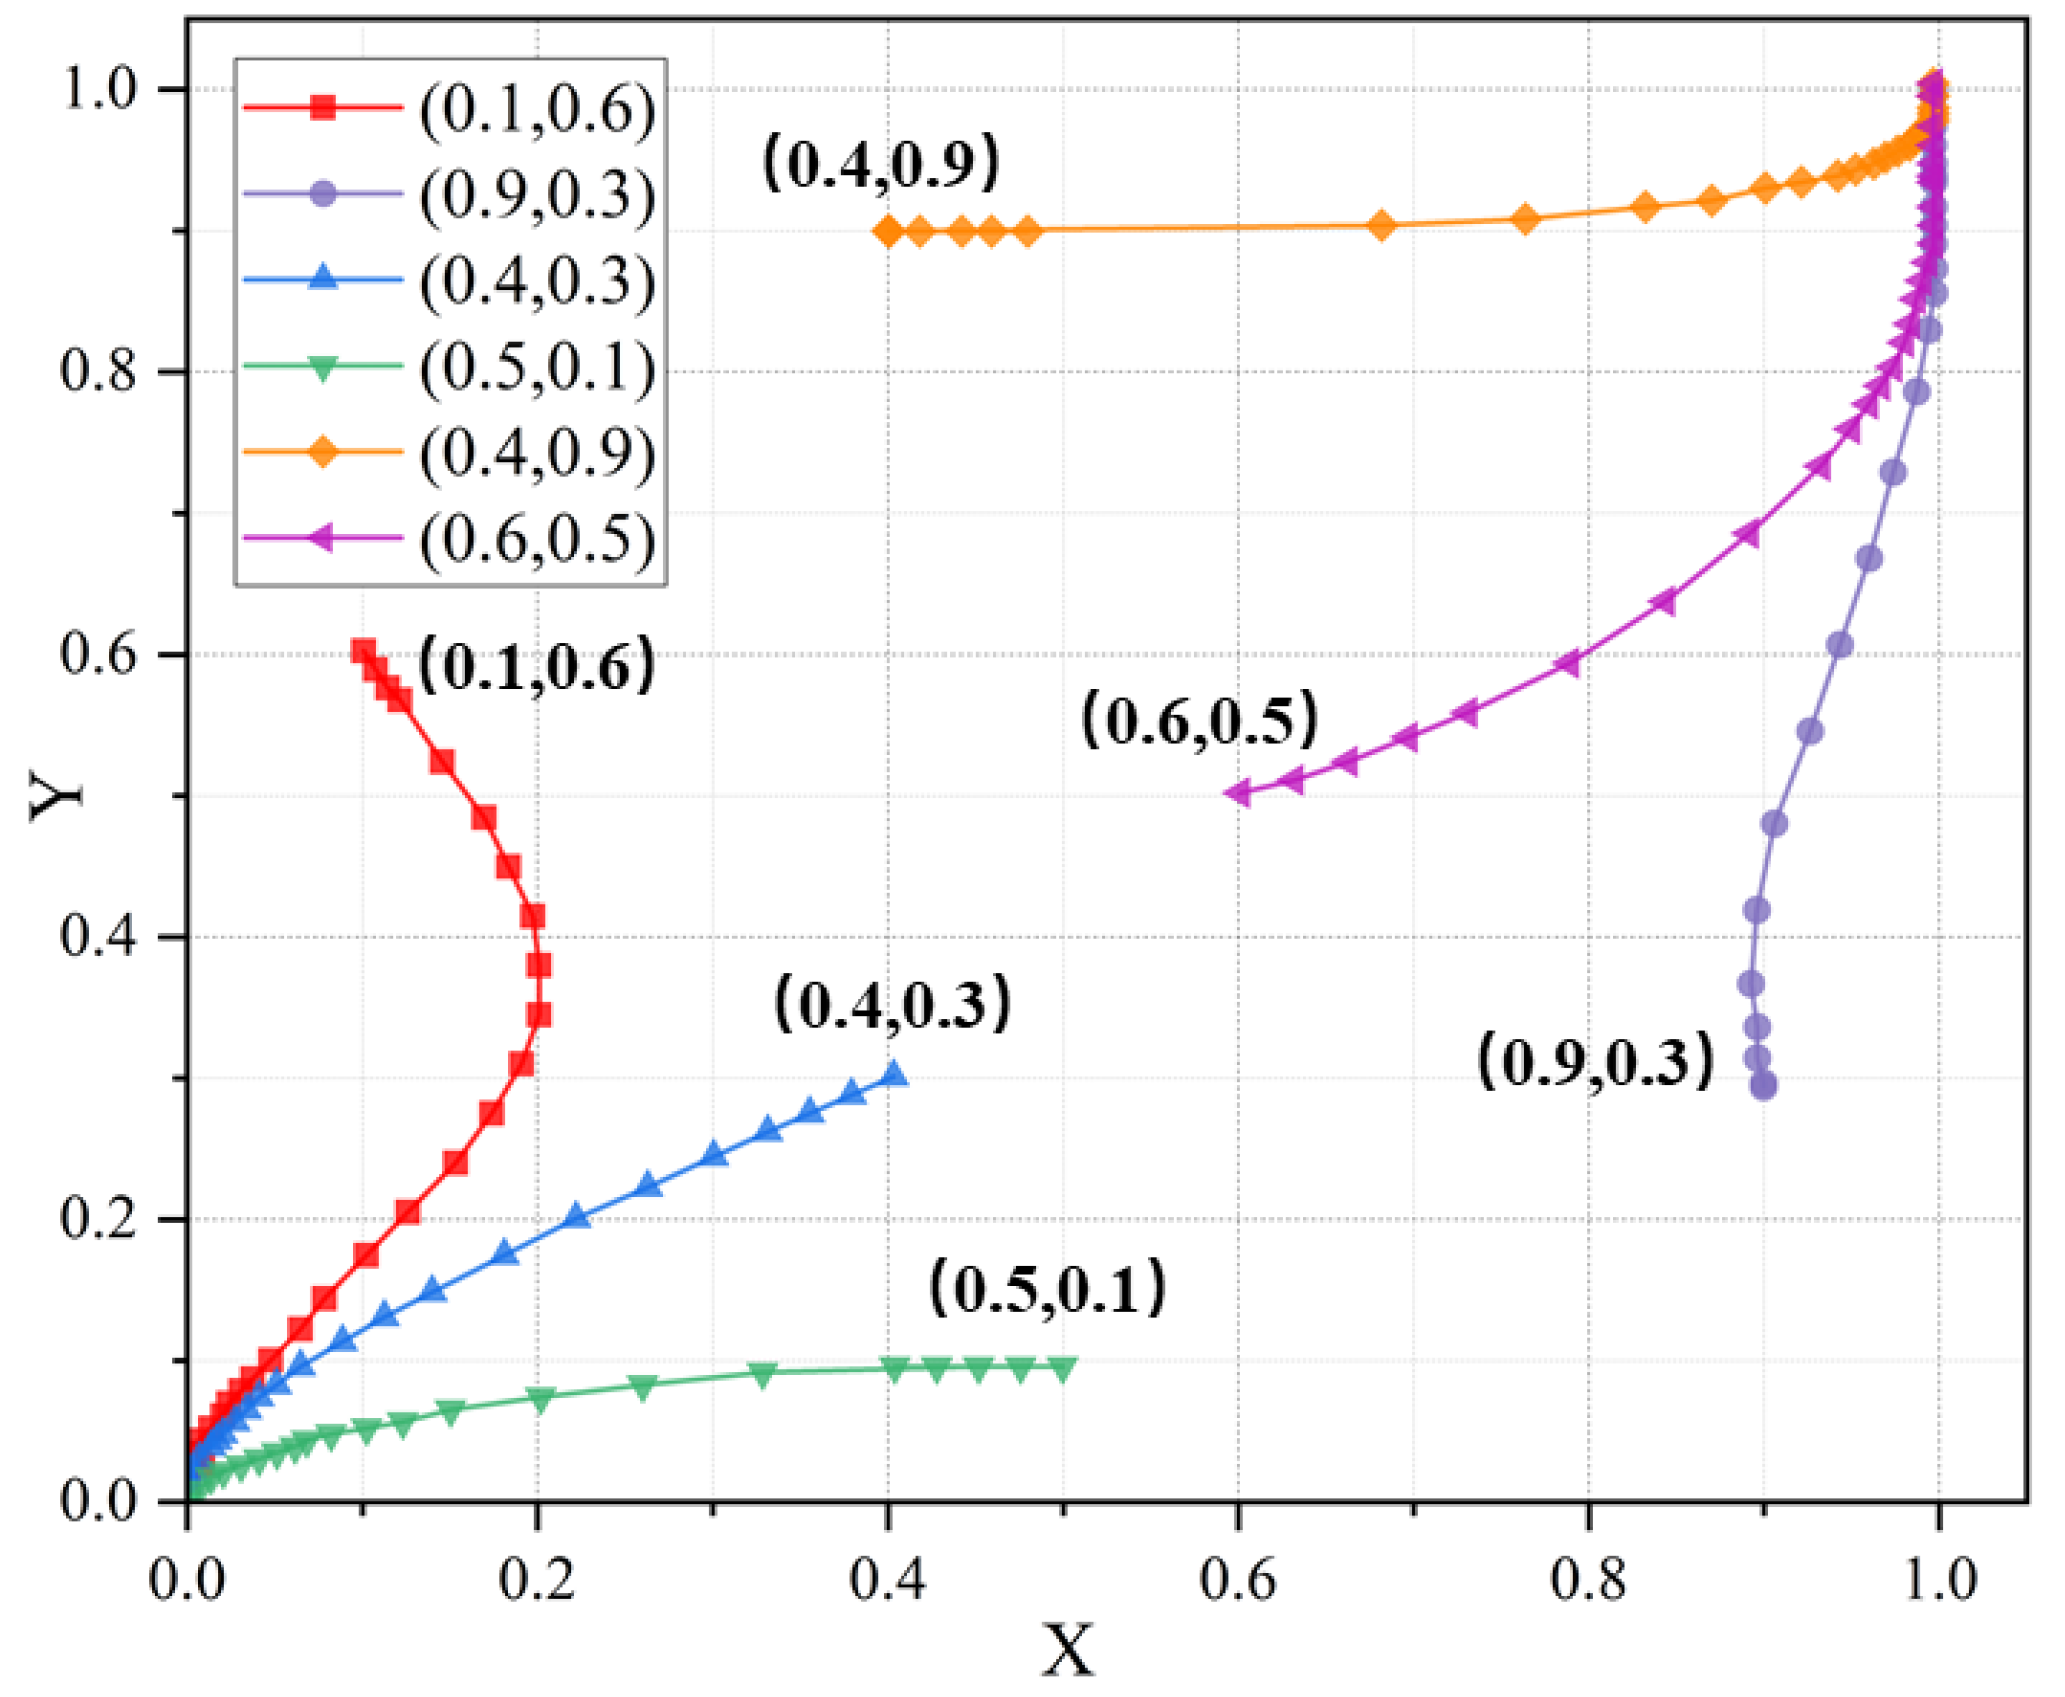
4.1.1. The Dynamic Impact of Initial Strategy Values on Evolutionary Results
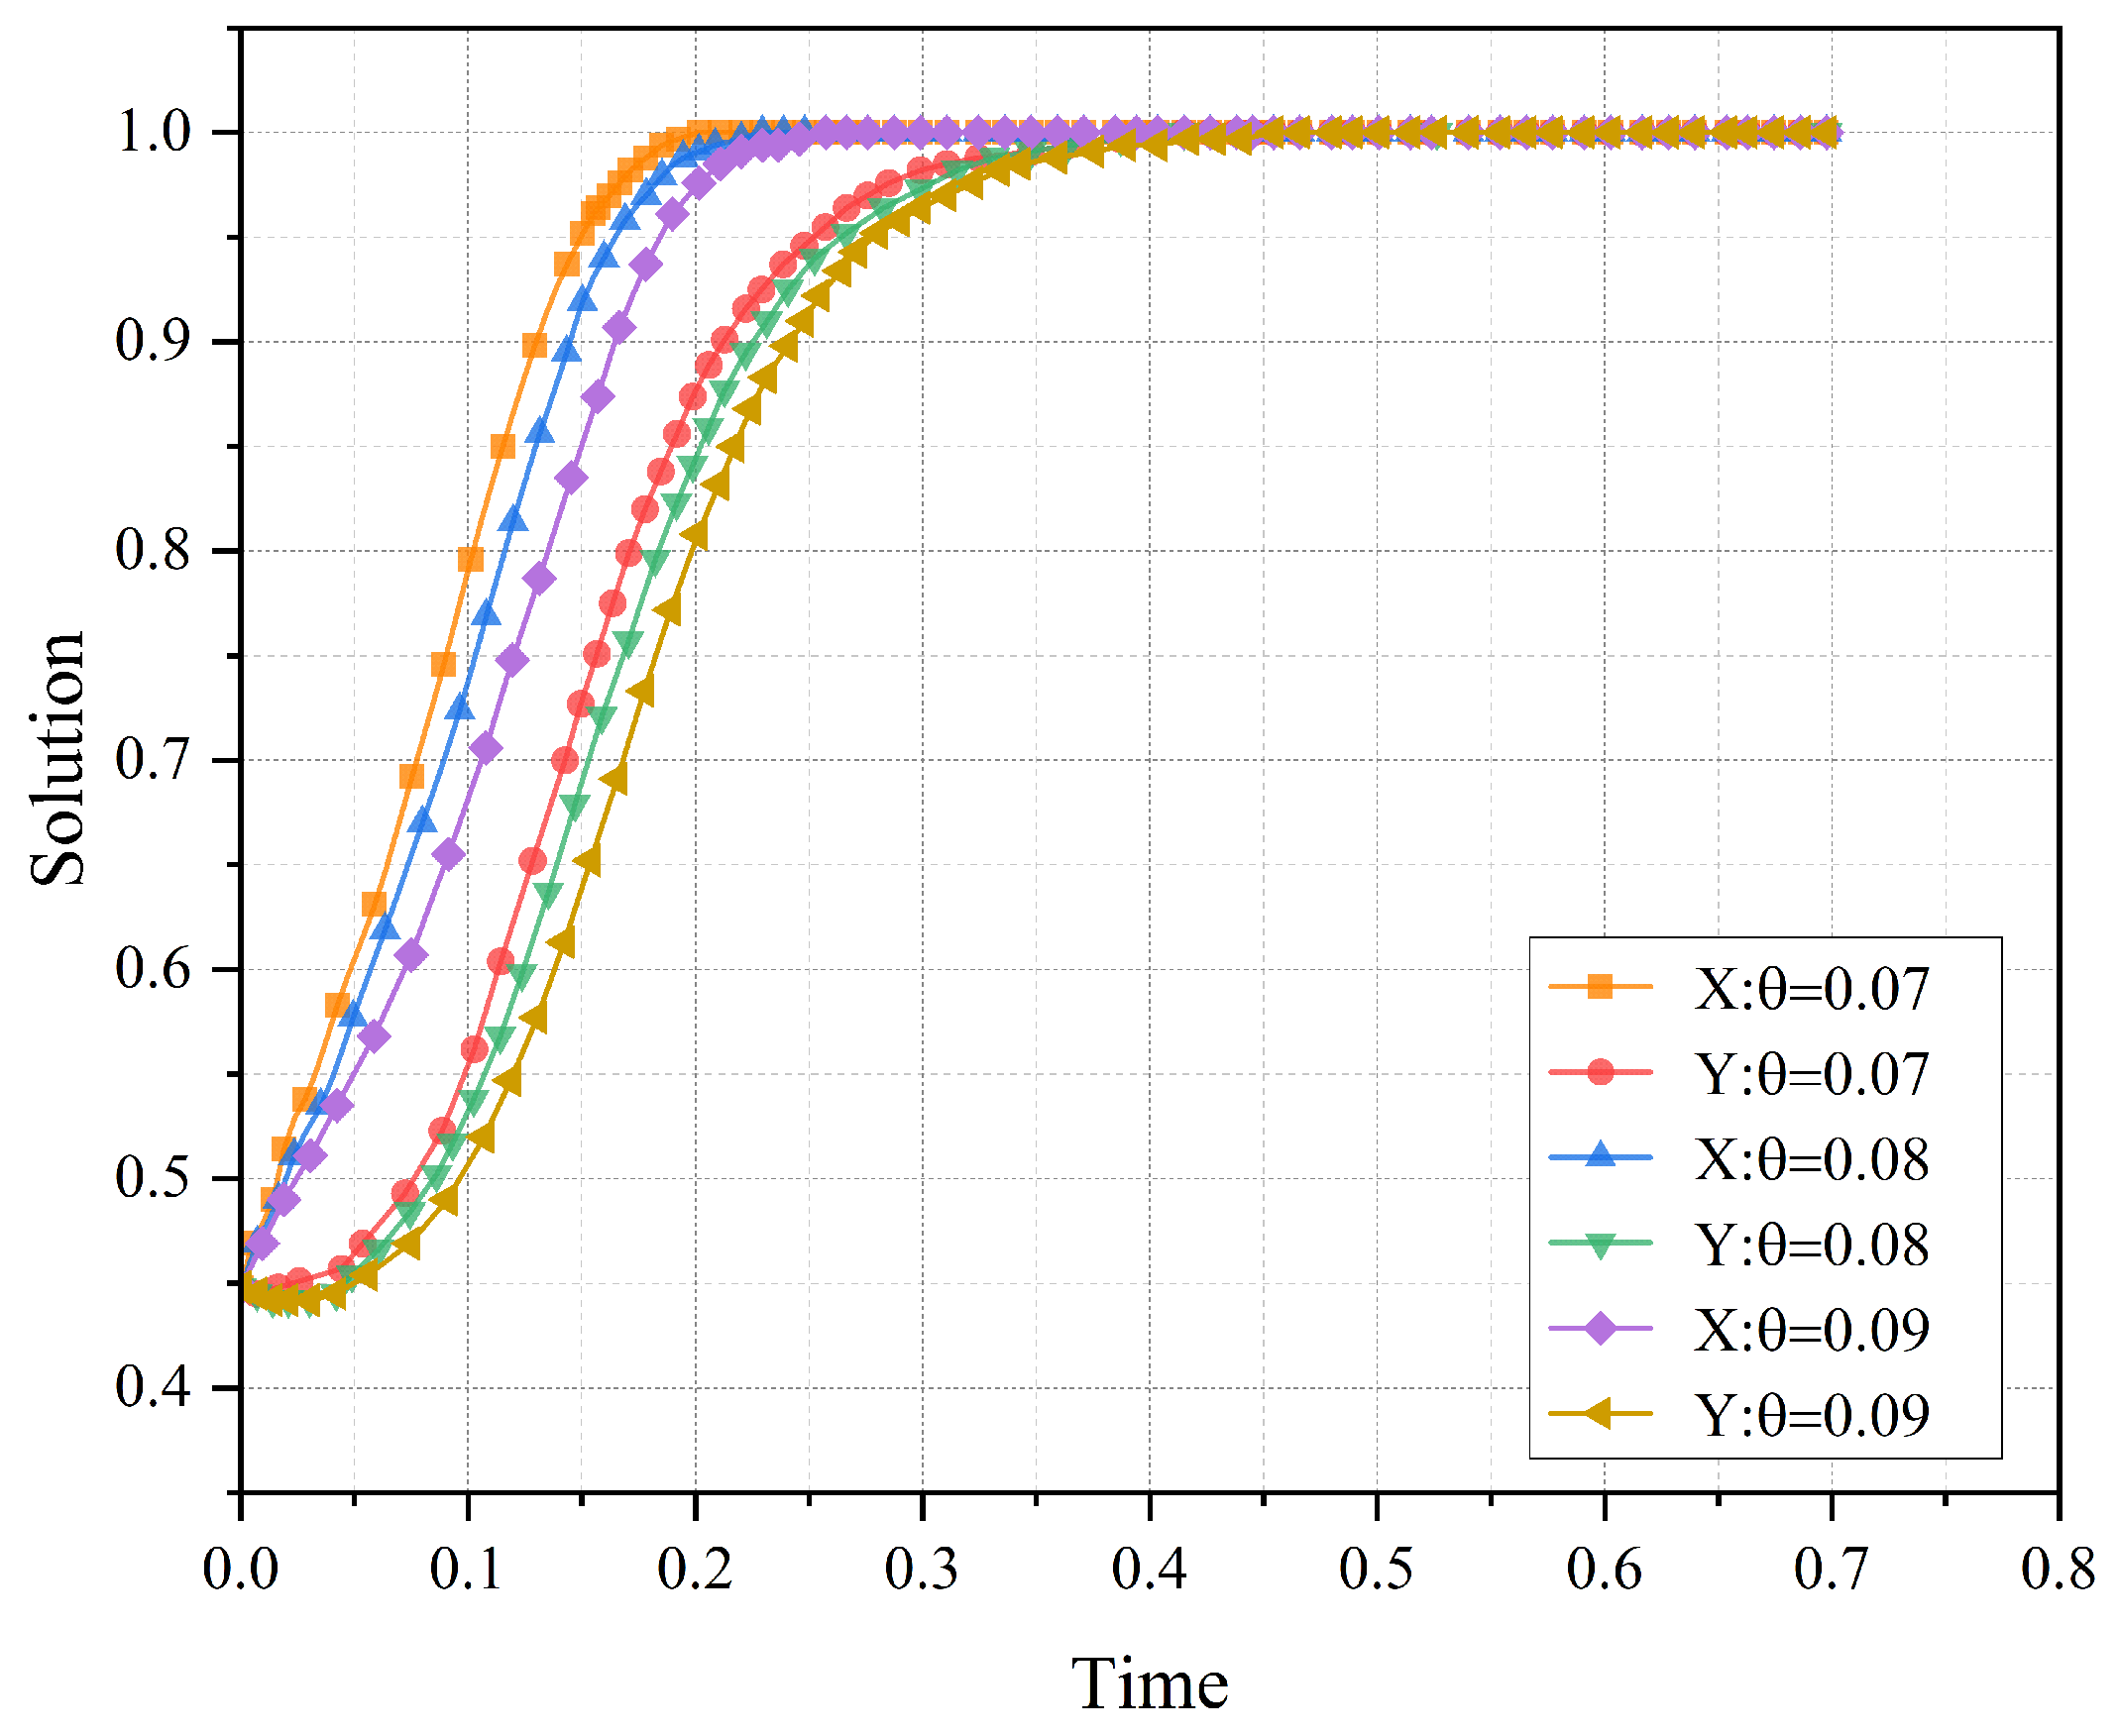
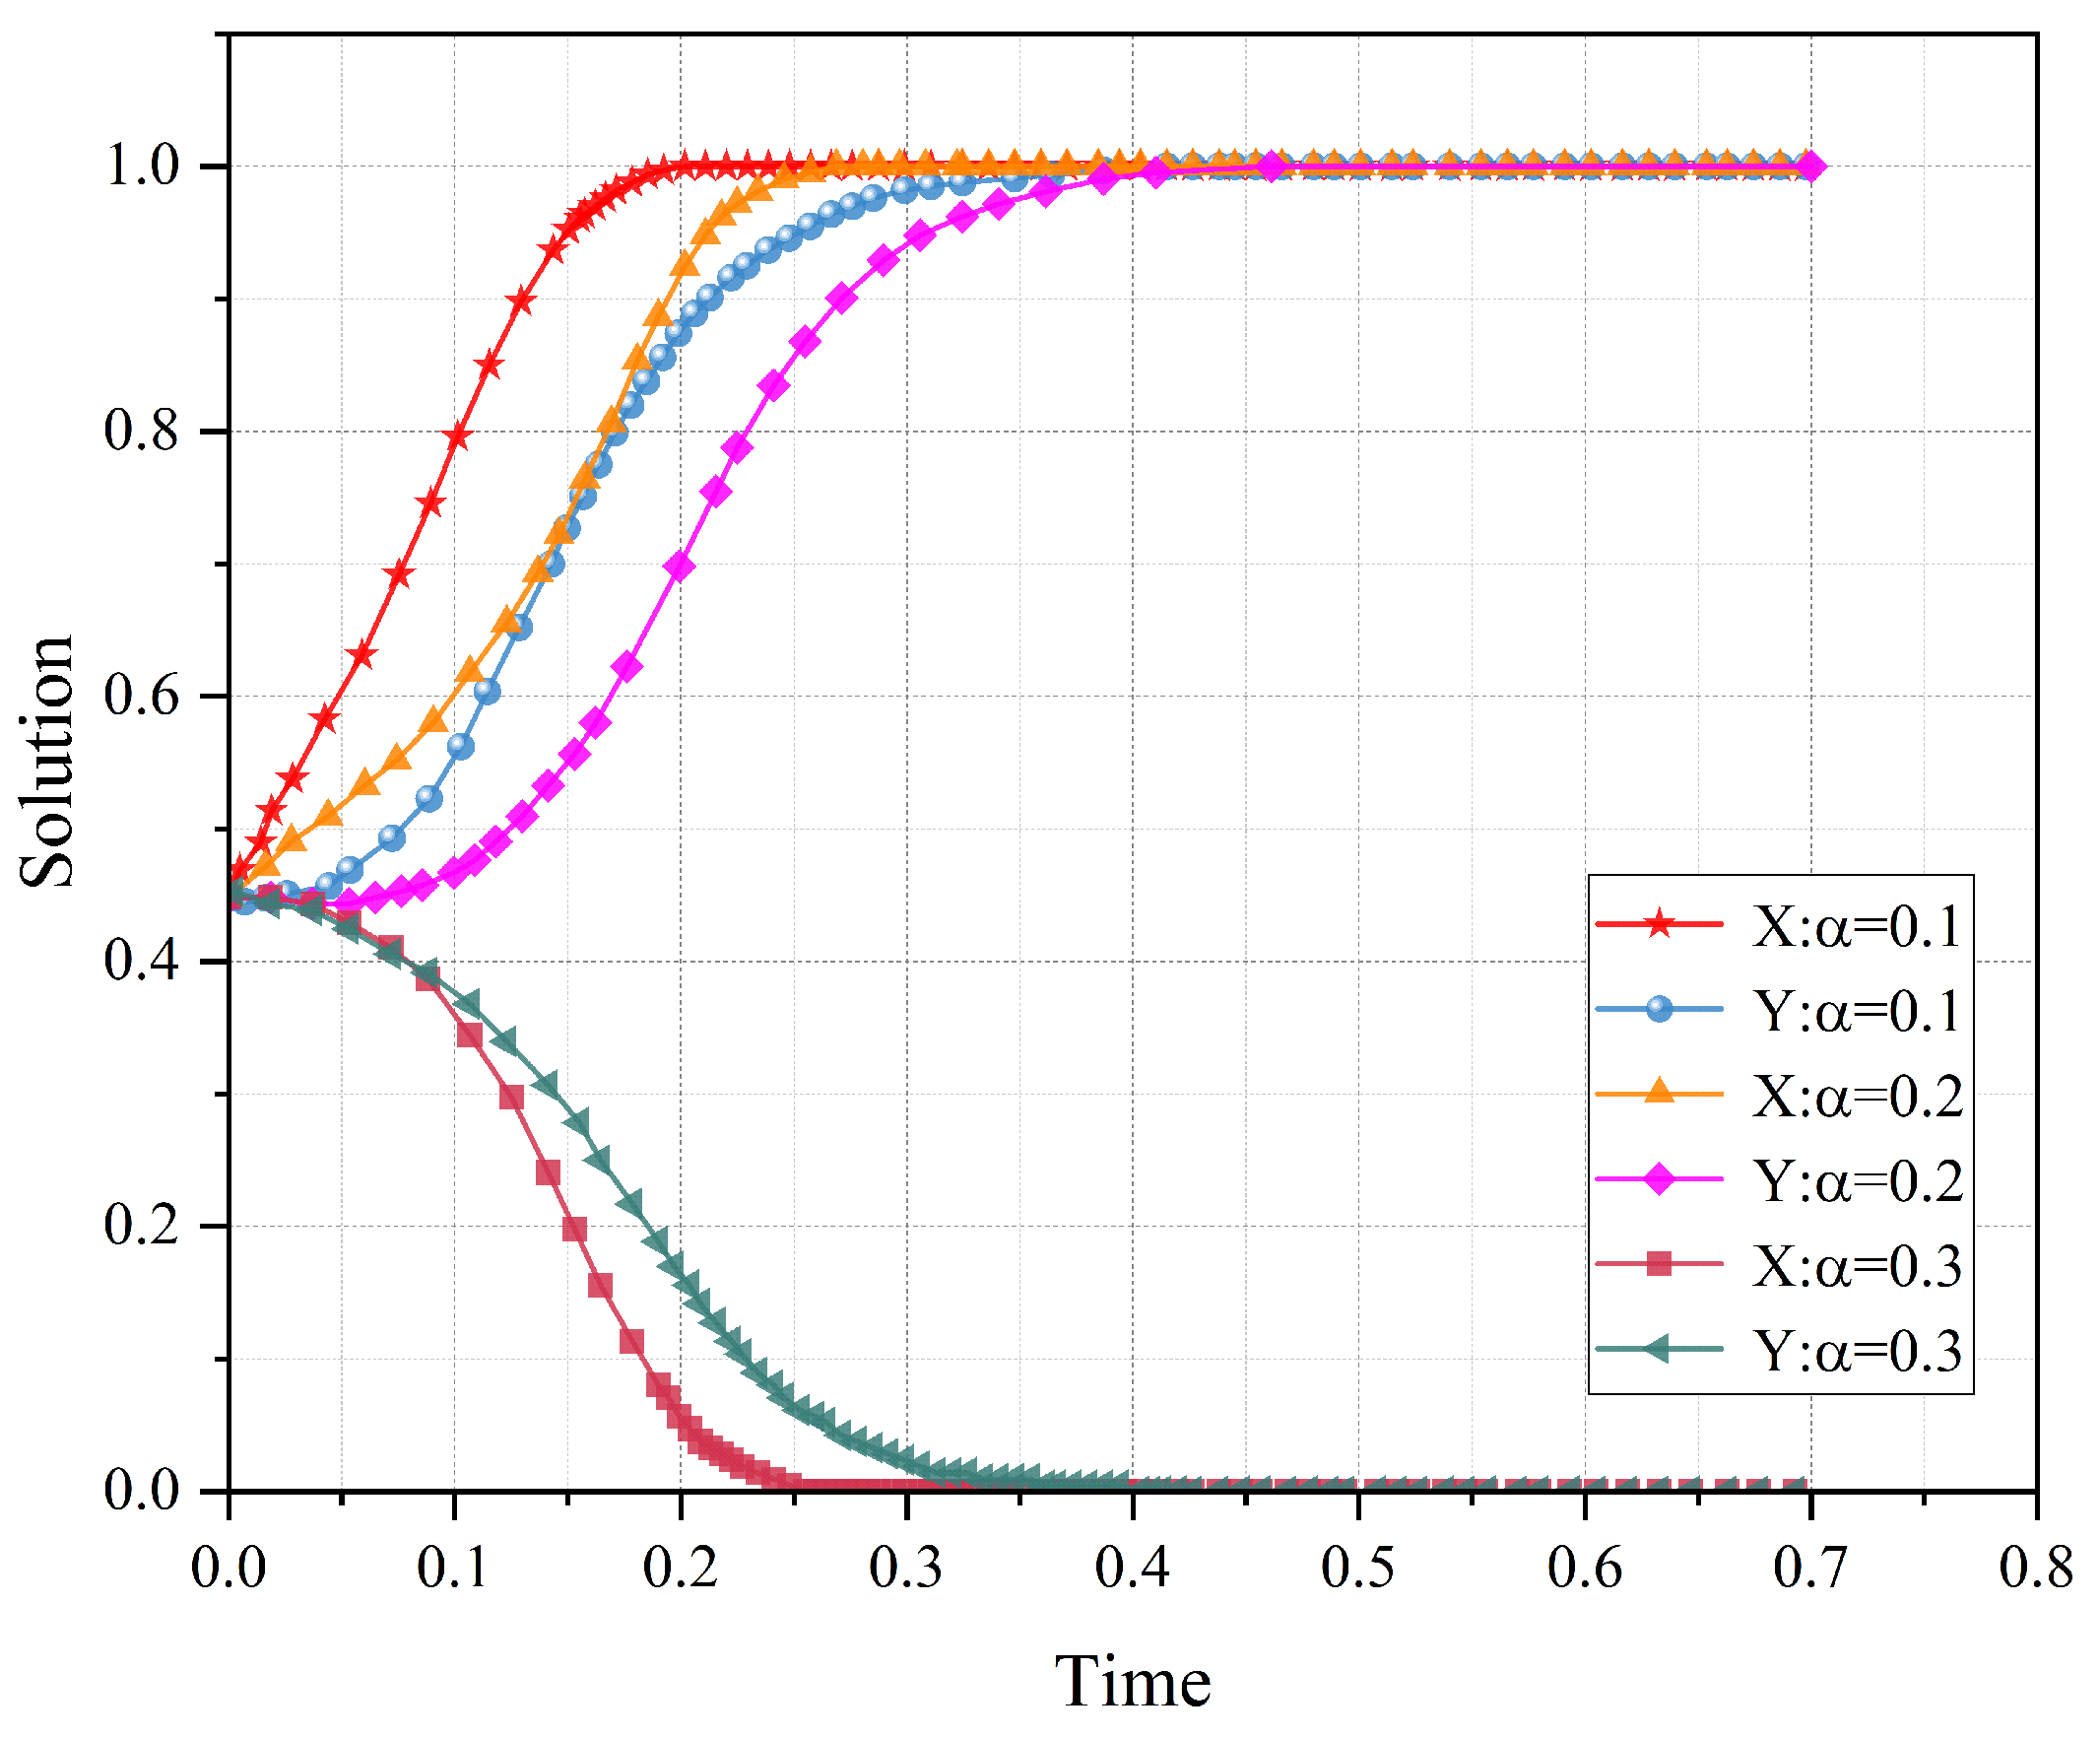
4.1.2. The Impact of Parameter on Evolutionary Results
4.1.3. The Impact of Allowed Rate of Return on Evolutionary Outcomes
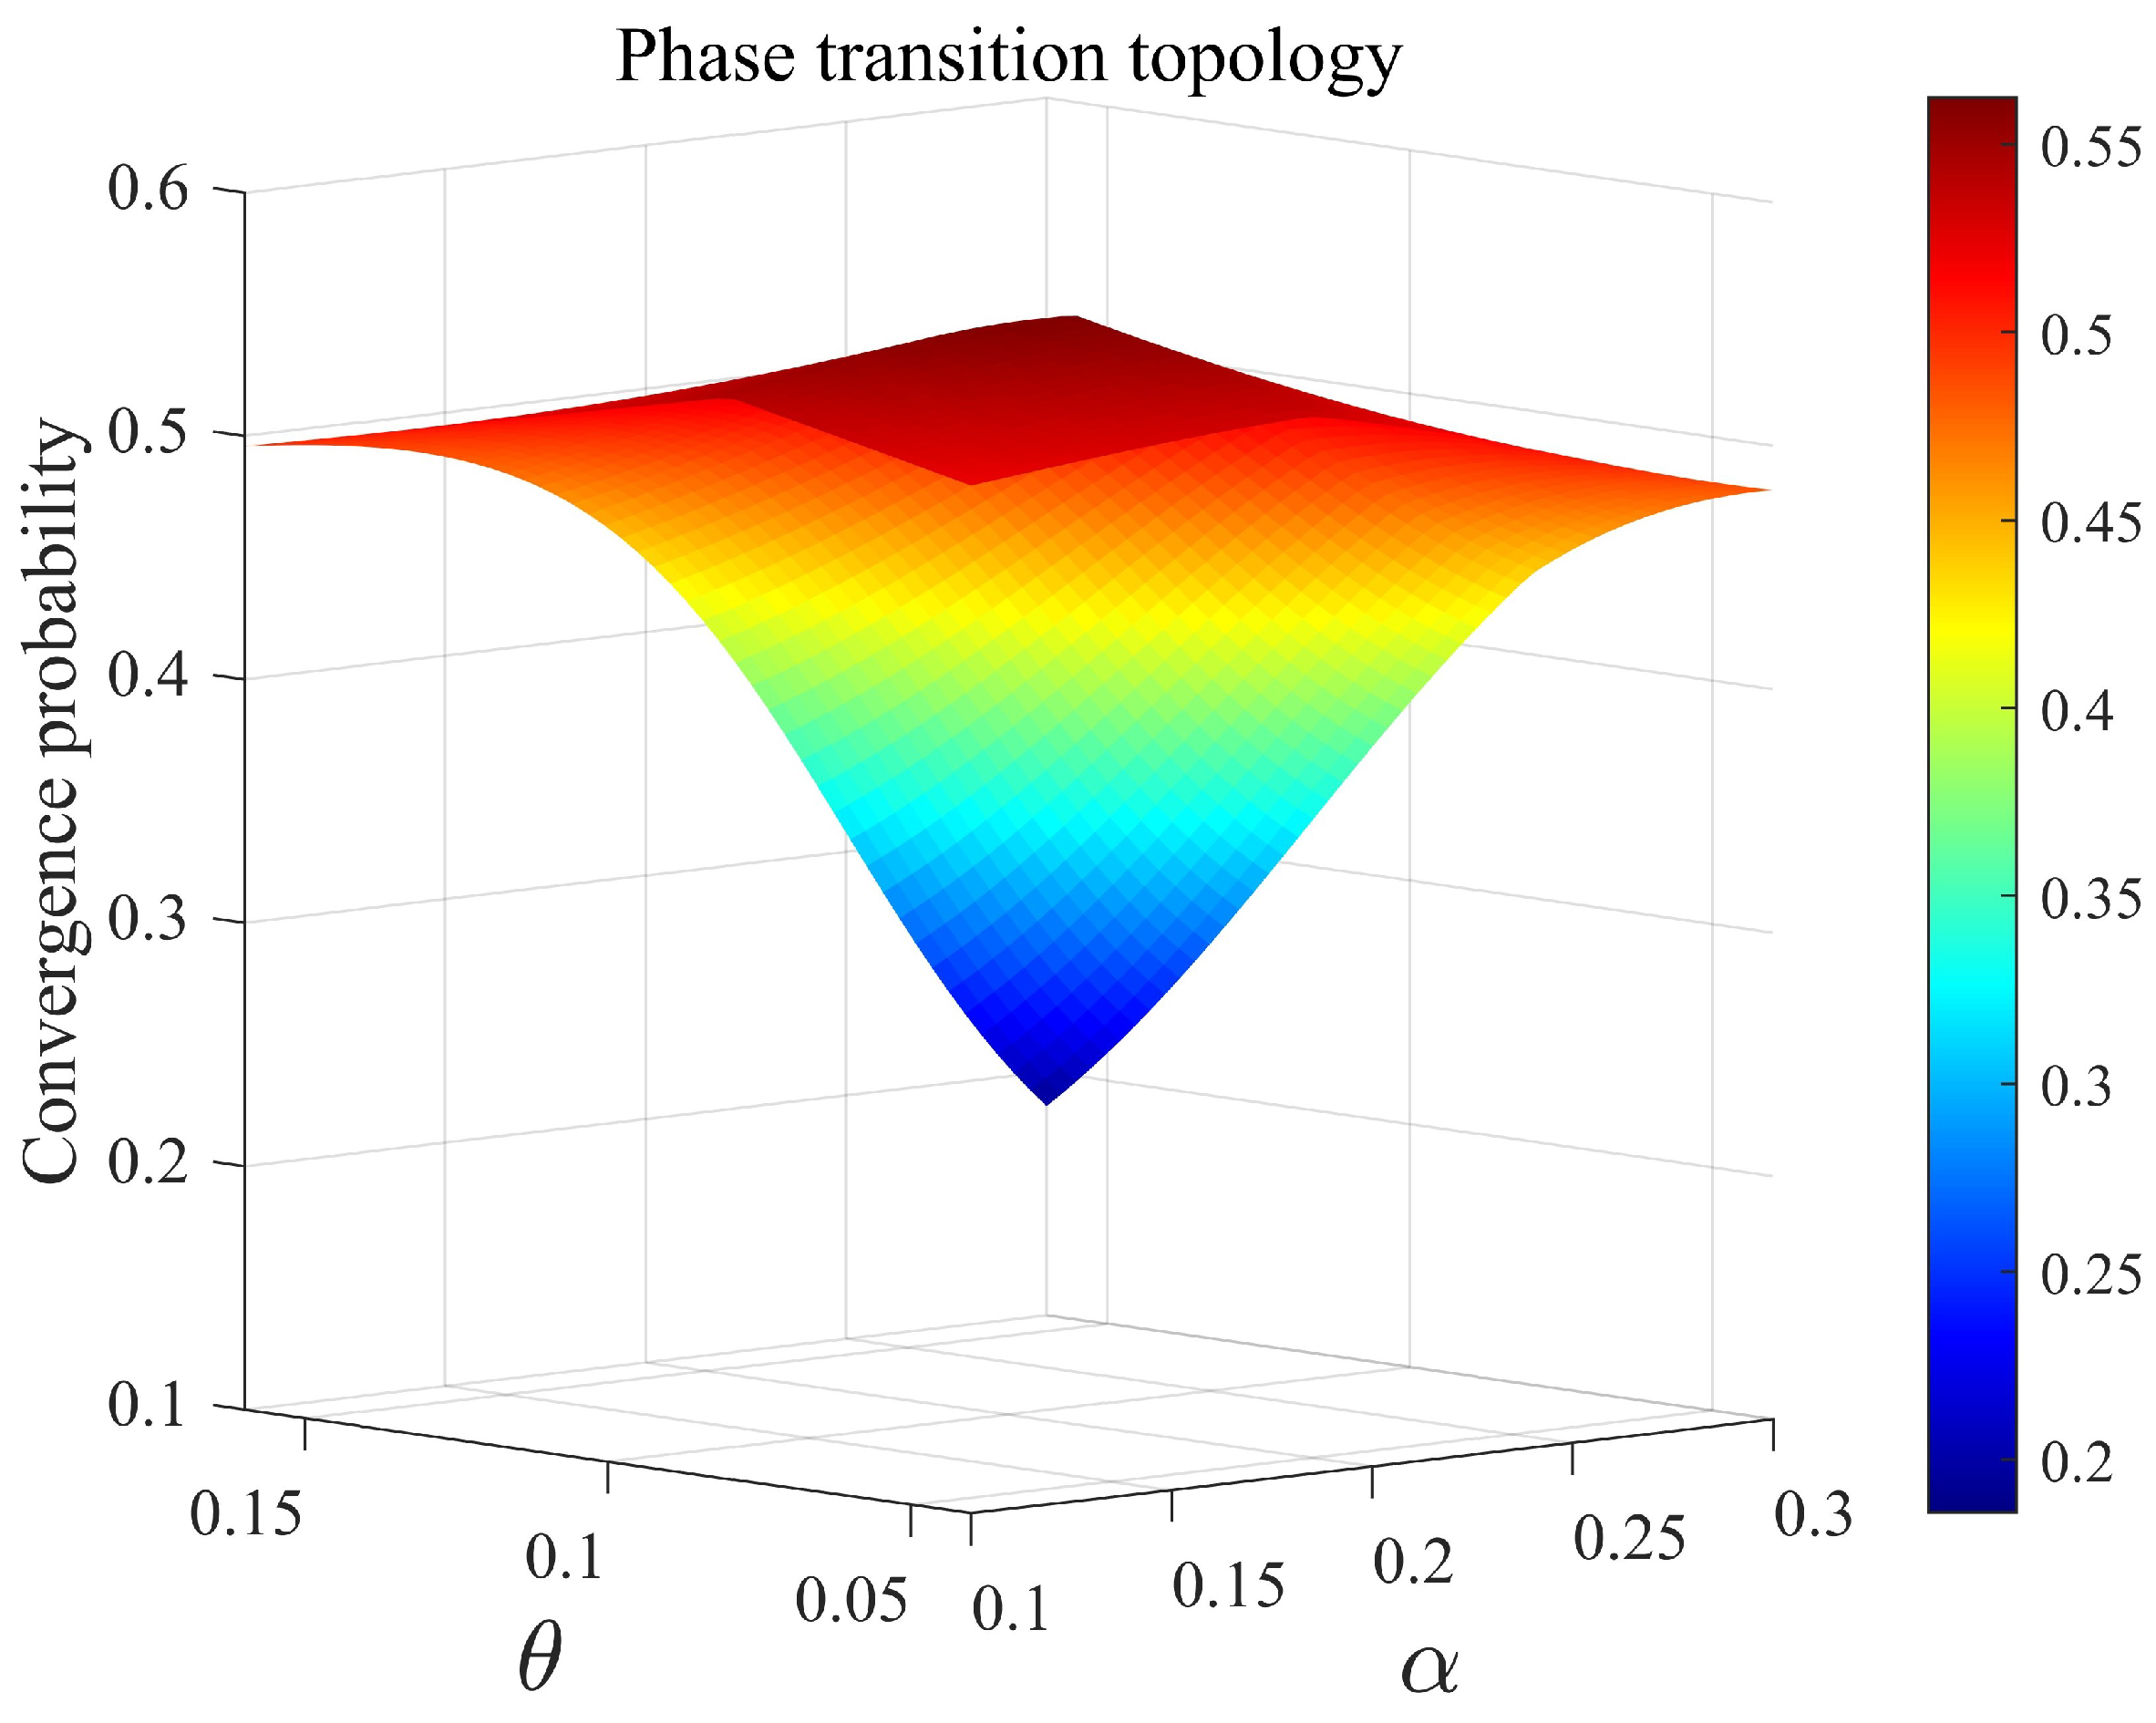
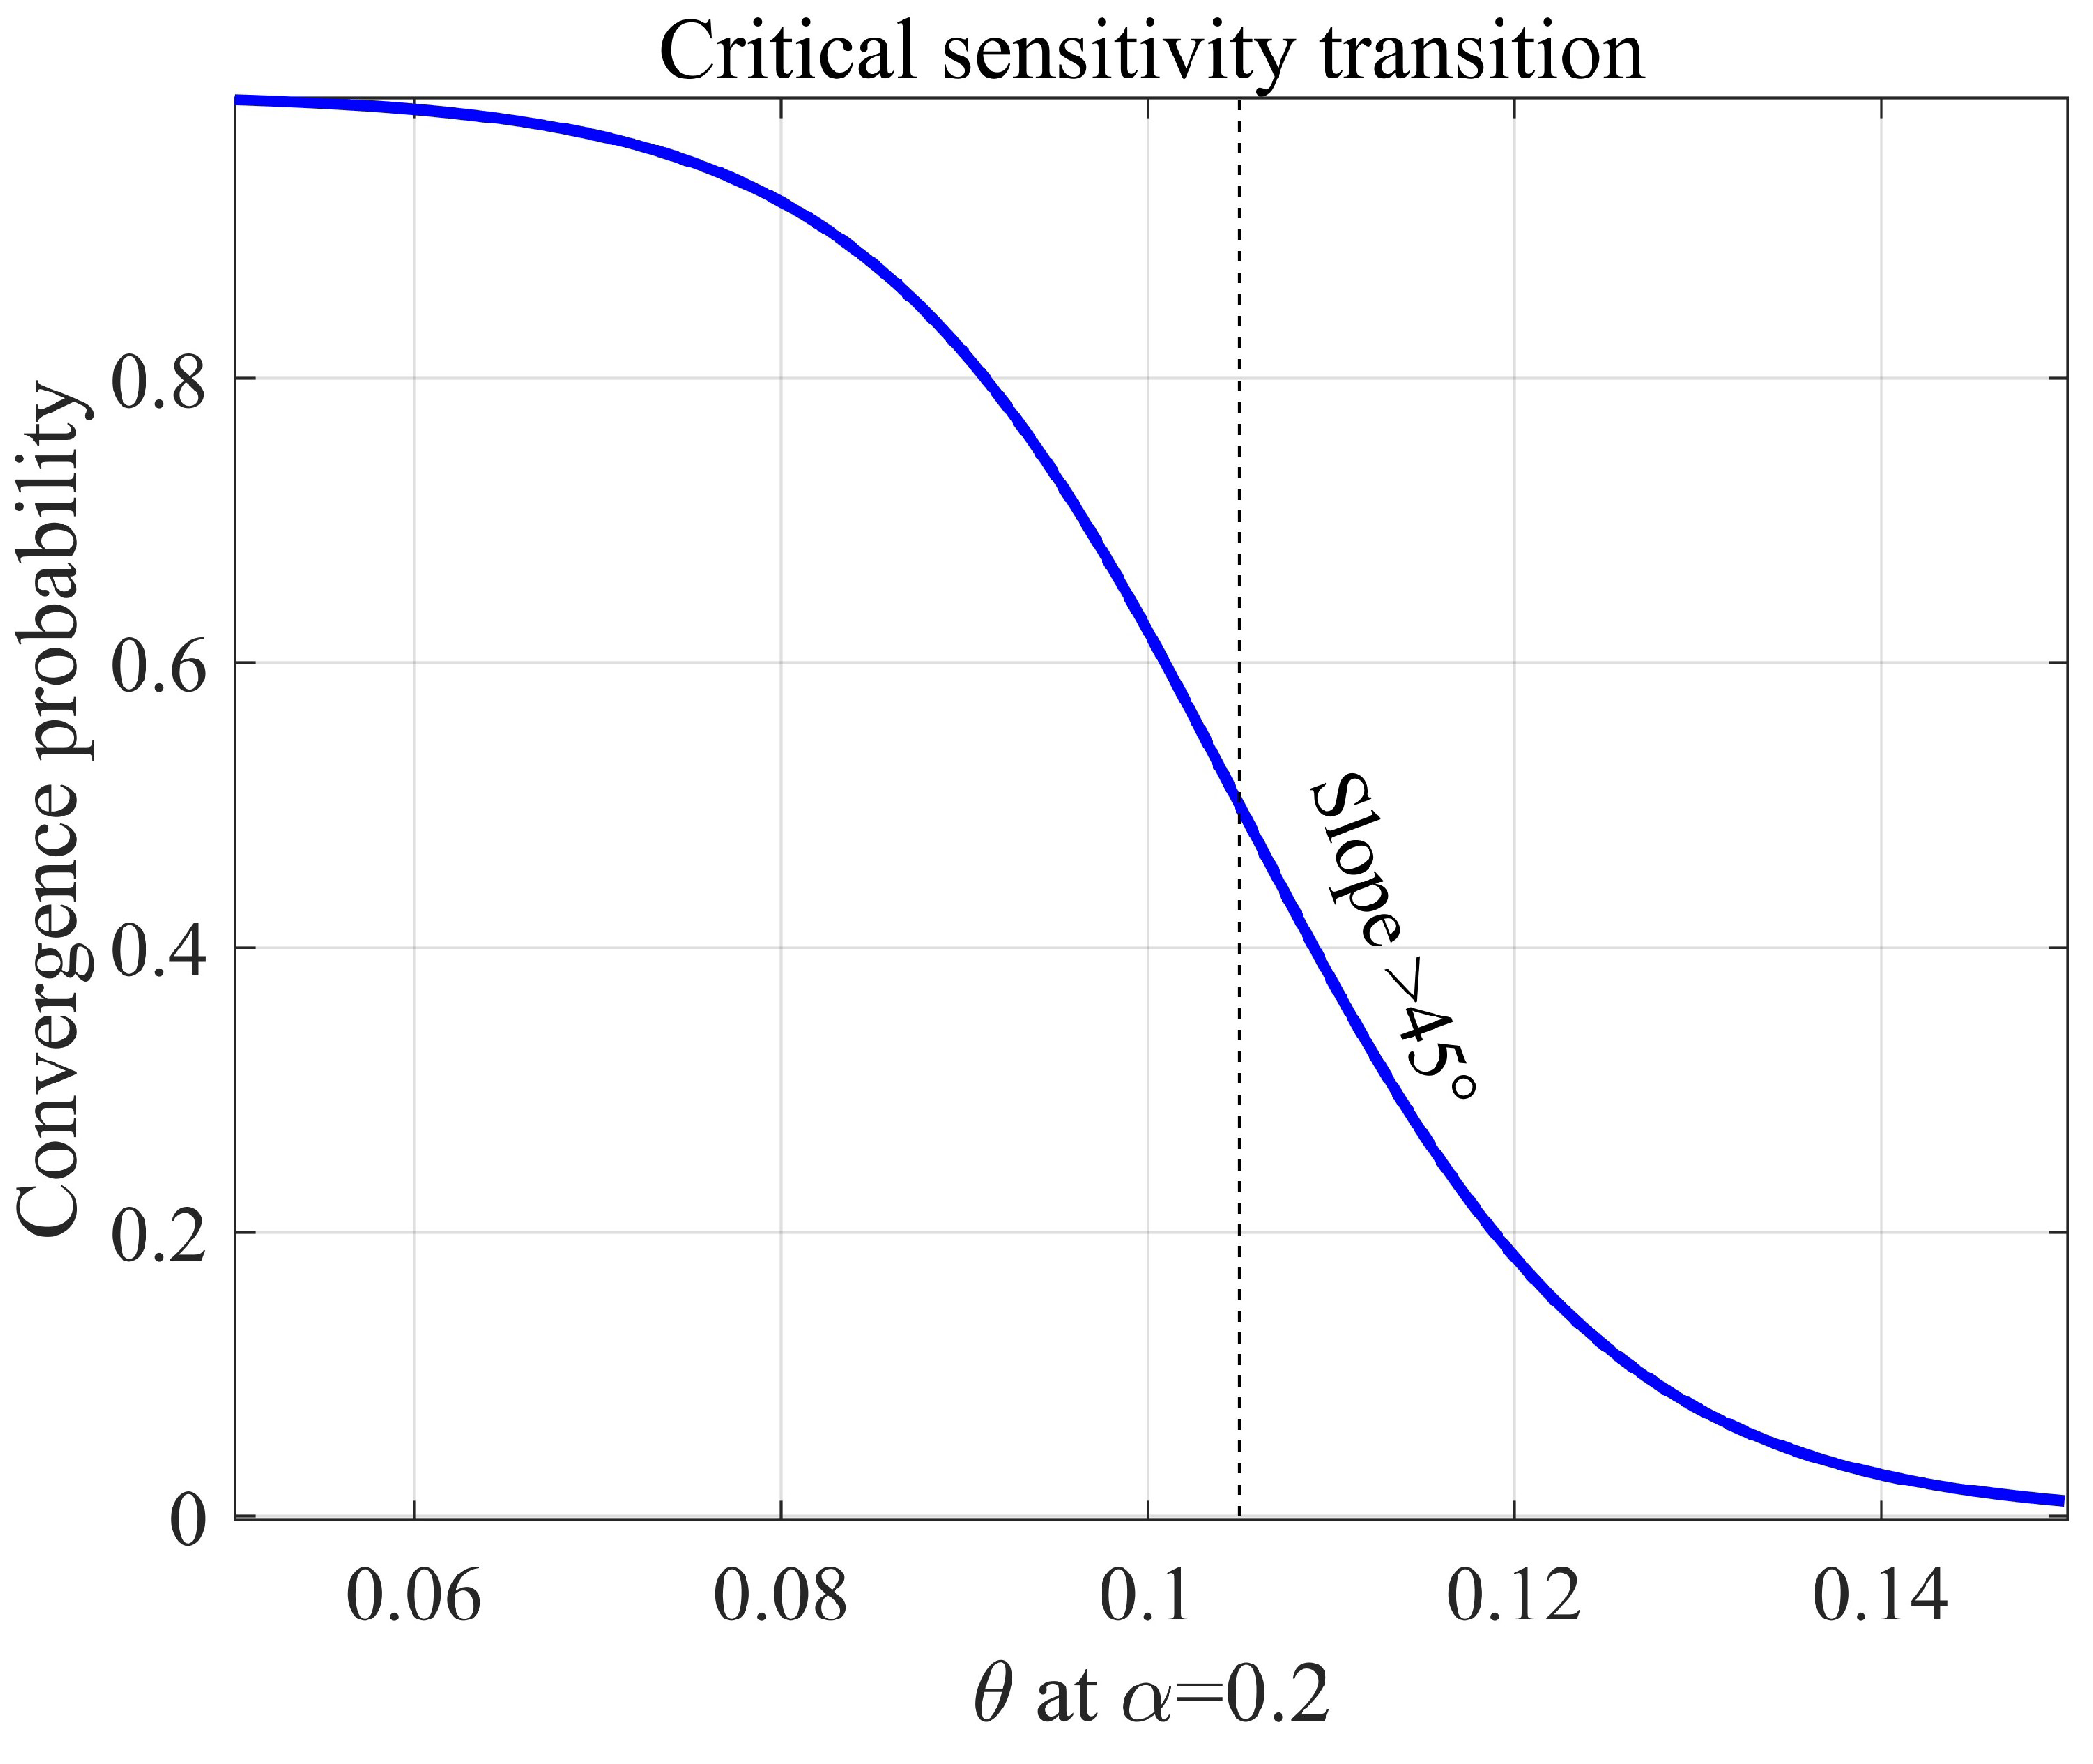
4.1.4. Multi-Parameter Co-Evolution and Critical Analysis of Phase Transitions
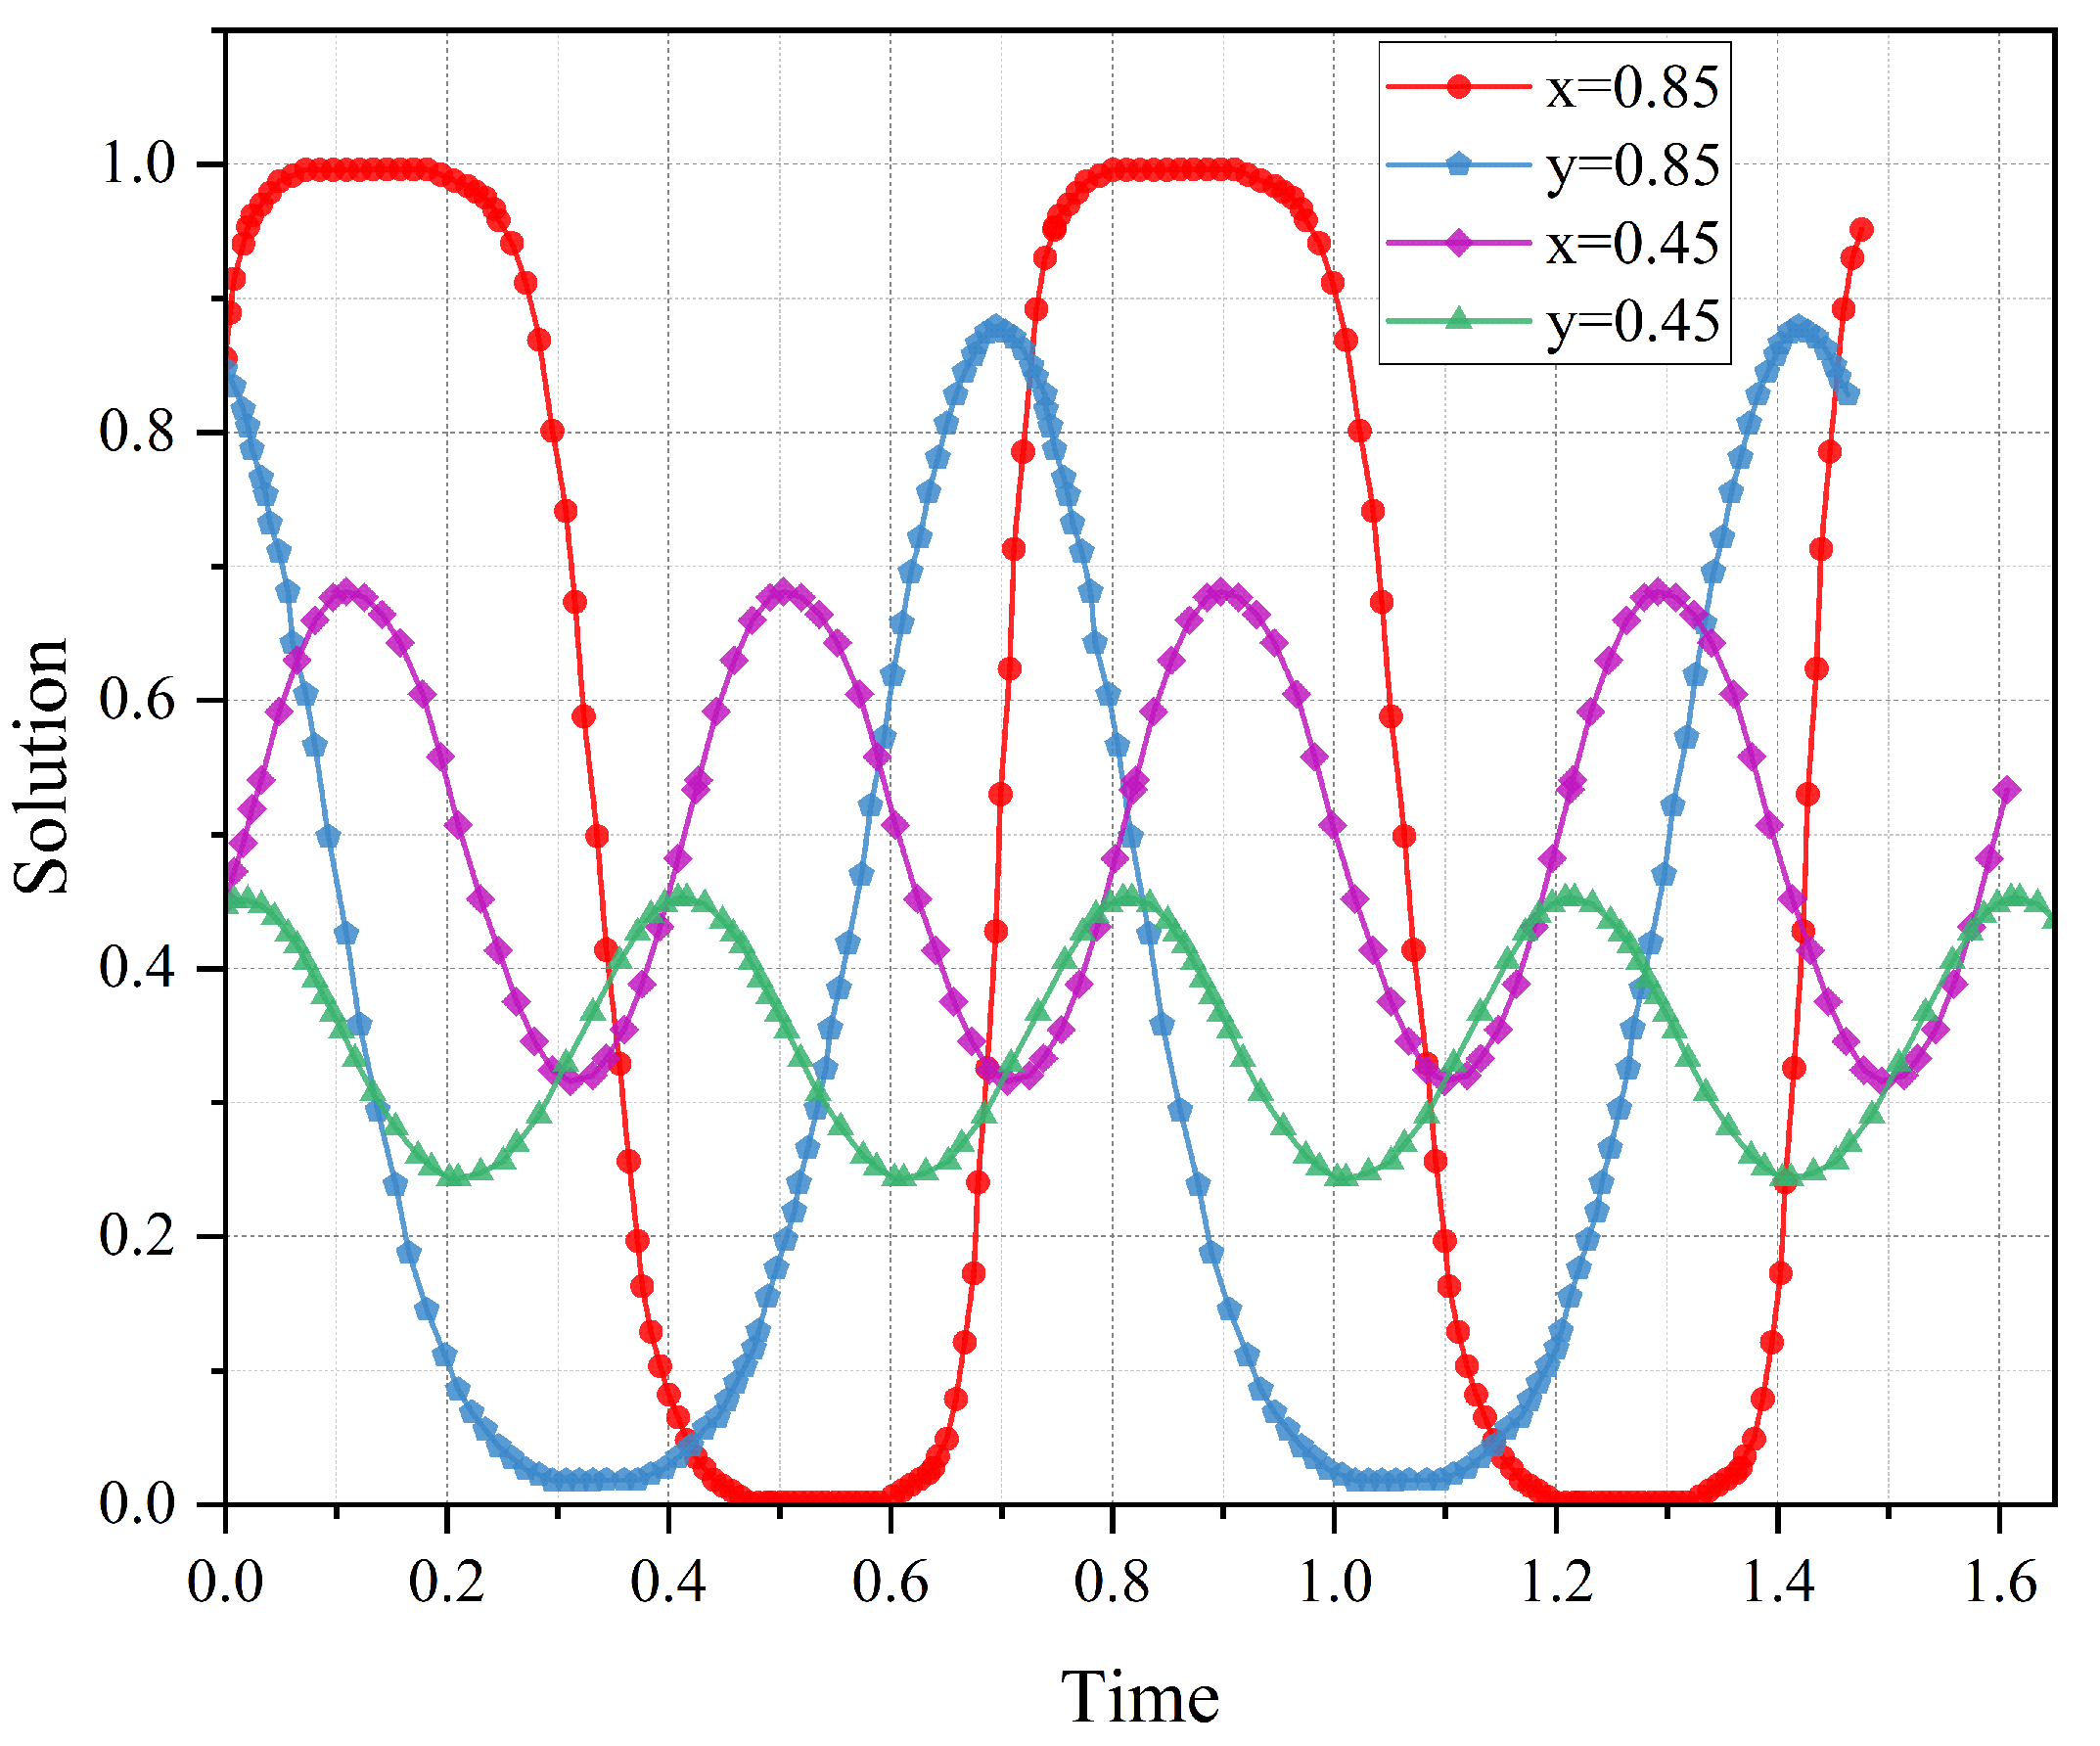
4.2. Simulation Based on Case 7
5. Conclusions
- Single-parameter analysis reveals that when decreases below 0.11, the convergence speed of the CNO’s rational investment strategies increases by 40%, validating the effectiveness of asset utilization constraints. Conversely, when exceeds 0.2, the probability of the system reaching ideal equilibrium plummets by 58%, indicating that high return rates inhibit regulatory efficacy. Dual-parameter synergy studies demonstrate that 4 combined with forms a “high-threshold, high-return” mechanism, while and trigger a “low-incentive trap”. A steep phase transition gradient is observed within and intervals. These results necessitate establishing a product threshold dynamic regulation mechanism to overcome single-parameter optimization limitations.
- Under the current regulatory framework, there is no evolutionarily stable equilibrium between the CNO and the IESM with strategies of (rational investment, lenient regulation). The existing policies, which primarily rely on the relevance to the information transmission process to define allowable costs and effective assets, can not provide sufficient incentives for the CNO to engage in rational investment strategies under lenient regulatory conditions. As a result, the CNO continues to engage in excessive investment, leading to an increase in information transmission prices. These increased costs are then passed on to users, resulting in a loss of social welfare.
- To accurately delineate effective assets and determine allowable costs, the criteria should be refined using the degree of asset utilization as a key metric. This ensures only efficiently utilized assets are considered effective, preventing underutilized assets from being included in cost calculations. This approach leads to a more precise determination of allowable costs, crucial for curbing the CNO’s excessive investment behavior by reducing incentives for over-provisioning non-contributory assets.
Author Contributions
Funding
Data Availability Statement
Conflicts of Interest
Abbreviations
| IES | Integrated Energy System |
| NS | Network Slicing |
| VPP | Virtual Power Plant |
| SAC | Smart Agent Communication |
| D2D | Device-to-Device |
| ROI | Return on Investment |
| PCR | Price-Cap Regulation |
| THz | Terahertz |
| RAN | Radio Access Network |
| TransN | Transmission Networking |
| CoreN | Core Network |
| AMF | Access and Mobility Management Function |
| UPF | User Plane Function |
| UDM | Unified Data Management |
| IESM | Integrated Energy System Manager |
| CNO | Communication Network Operator |
| EP | Equilibrium Point |
| ESS | Evolutionarily Stable Strategy |
| SP | Saddle Point |
| CS | Central Point |
| QoS | Quality of Service |
| ROE | Return On Equity |
References
- Aghdam, F.H.; Mudiyanselage, M.W.; Mohammadi-Ivatloo, B.; Marzband, M. Optimal scheduling of multi-energy type virtual energy storage system in reconfigurable distribution networks for congestion management. Appl. Energy 2023, 333, 120569. [Google Scholar] [CrossRef]
- Ren, Z.; Li, H.; Xu, Y.; Li, W.; Li, Z.; Dai, Y. A radial-grouping-based planning method for electrical collector systems in tidal current generation farms. Renew. Energy 2021, 165, 632–641. [Google Scholar] [CrossRef]
- Pu, Y.; Li, Q.; Luo, S.; Chen, W.; Breaz, E.; Gao, F. Peer-to-Peer electricity-hydrogen trading among integrated energy systems considering hydrogen delivery and transportation. IEEE Trans. Power Syst. 2024, 39, 3895–3911. [Google Scholar] [CrossRef]
- Gungor, V.C.; Sahin, D.; Kocak, T.; Ergut, S.; Buccella, C.; Cecati, C.; Hancke, G.P. Smart grid technologies: Communication technologies and standards. IEEE Trans. Ind. Inform. 2011, 7, 529–539. [Google Scholar] [CrossRef]
- Habibi, M.A.; Han, B.; Fellan, A.; Jiang, W.; Sanchez, A.G.; Pavon, I.L.; Boubendir, A.; Schotten, H.D. Toward an open, intelligent, and end-to-end architectural framework for network slicing in 6G communication systems. IEEE Open J. Commun. Soc. 2023, 4, 1615–1658. [Google Scholar] [CrossRef]
- He, Y.; Ye, X.; Cui, L.; Fournier-Viger, P.; Luo, C.; Huang, J.Z.; Suganthan, P.N. Wireless network slice assignment with incremental random vector functional link network. IEEE Trans. Netw. Sci. Eng. 2023, 10, 1283–1296. [Google Scholar] [CrossRef]
- Kong, P.-Y.; Song, Y. Joint consideration of communication network and power grid topology for communications in community smart grid. IEEE Trans. Ind. Inform. 2020, 16, 2895–2905. [Google Scholar] [CrossRef]
- Feng, C.; Chen, Q.; Wang, Y.; Ma, J.; Wang, X. Frequency regulation service provision for virtual power plants through 5G RAN slicing. IEEE Trans. Smart Grid 2022, 13, 4943–4956. [Google Scholar] [CrossRef]
- Wang, Z.; Liu, Y.; Ma, Z.; Liu, X.; Ma, J. LiPSG: Lightweight Privacy-Preserving Q-Learning-Based energy management for the IoT-Enabled smart grid. IEEE Internet Things J. 2020, 7, 3935–3947. [Google Scholar] [CrossRef]
- Zhou, B.; Zou, J.; Chung, C.Y.; Wang, H.; Liu, N.; Voropai, N.; Xu, D. Multi-microgrid energy management systems: Architecture, communication, and scheduling strategies. J. Mod. Power Syst. Clean Energy 2021, 9, 463–476. [Google Scholar] [CrossRef]
- Li, G.; Bie, Z.; Kou, Y.; Jiang, J.; Bettinelli, M. Reliability evaluation of integrated energy systems based on smart agent communication. Appl. Energy 2016, 167, 397–406. [Google Scholar] [CrossRef]
- Deng, R.; Xiao, G.; Lu, R.; Liang, H.; Vasilakos, A.V. False data injection on state estimation in power systems—Attacks, impacts, and defense: A survey. IEEE Trans. Ind. Inform. 2017, 13, 411–423. [Google Scholar] [CrossRef]
- Li, Z.; Shahidehpour, M.; Aminifar, F. Cybersecurity in distributed power systems. Proc. IEEE 2017, 105, 1367–1388. [Google Scholar] [CrossRef]
- Kong, P.-Y. Effects of communication network performance on dynamic pricing in smart power grid. IEEE Syst. J. 2014, 8, 533–541. [Google Scholar] [CrossRef]
- Bauer, J.M.; Bohlin, E. Regulation and innovation in 5G markets. Telecommun. Policy 2022, 46, 102260. [Google Scholar] [CrossRef]
- Laffont, J.J.; Tirole, J. Competition in Telecommunications; MIT Press: Cambridge, MA, USA, 2000; pp. 9–16. [Google Scholar]
- Viscusi, W.K.; Harrington, J.E., Jr.; Sappington, D.E.M. Economics of Regulation and Antitrust; MIT Press: Cambridge, MA, USA, 2018; pp. 43–52. [Google Scholar]
- Averch, H.; Johnson, L.L. Behavior of the firm under regulatory Constraint. Am. Econ. Rev. 1962, 52, 1052–1069. [Google Scholar]
- Sappington, D.E.M.; Weisman, D.L. Price cap regulation: What have we learned from 25 years of experience in the telecommunications industry? J. Regul. Econ. 2010, 38, 227–257. [Google Scholar] [CrossRef]
- Braeutigam, R.R.; Panzar, J.C. Effects of the change from rate-of-return to price-cap regulation. Am. Econ. Rev. 1993, 83, 191–198. [Google Scholar]
- Esplin, R.; Davis, B.; Rai, A.; Nelson, T. The impacts of price regulation on price dispersion in Australia’s retail electricity markets. Energy Policy 2020, 147, 111829. [Google Scholar] [CrossRef]
- Nippa, M.; Patnaik, S.; Taussig, M. MNE responses to carbon pricing regulations: Theory and evidence. J. Int. Bus. Stud. 2021, 52, 904–929. [Google Scholar] [CrossRef]
- Lima, J.W.M.; Noronha, J.C.C.; Arango, H.; Dos Santos, P.E.S. Distribution pricing based on yardstick regulation. IEEE Trans. Power Syst. 2002, 17, 198–204. [Google Scholar] [CrossRef]
- Rudnick, H.; Donoso, J.A. Integration of price cap and yardstick competition schemes in electrical distribution regulation. IEEE Trans. Power Syst. 2000, 15, 1428–1433. [Google Scholar] [CrossRef]
- Dang, S.; Amin, O.; Shihada, B.; Alouini, M.S. What should 6G be? Nat. Electron. 2020, 3, 20–29. [Google Scholar] [CrossRef]
- Yang, P.; Xiao, Y.; Xiao, M.; Li, S. 6G wireless communications: Vision and potential techniques. IEEE Netw. 2019, 33, 70–75. [Google Scholar] [CrossRef]
- Federal Energy Regulatory Commission (FERC). Order No. 888: Promoting Wholesale Competition Through Open Access Nondiscriminatory Transmission Services by Public Utilities; Docket No. RM95-8-000; Federal Energy Regulatory Commission: Washington, DC, USA, 1996. [Google Scholar]
- GSMA Intelligence. The Mobile Economy 2022; GSM Association: London, UK, 2022. [Google Scholar]


| Aspect | Existing Studies | This Paper |
|---|---|---|
| Scope of Participants | Treat communication service providers as passive components in pricing dynamics [14] | Model communication service providers as independent strategic entities |
| Rationality Assumption | Perfect rationality assumption and fixed decision rules without adaptive learning [9,11] | Incorporate adaptive bounded rationality |
| Regulatory Mechanisms | Analyze static ROI/price-cap frameworks without co-evolution [18,19] | Introduce evolutionary dynamics between regulation and investment strategies |
| Asset Utilization | Define “effective assets” via business relevance [18] | Propose asset utilization rate as novel criterion |
| Dynamic Equilibrium | Focus on steady-state equilibria, neglecting cyclical traps [14,19] | Identify and mitigate non-convergent equilibria through parameter-sensitive design |
| IESM | SR | LR | |
|---|---|---|---|
| CNO | RI | ||
| EI |
| EP | |
|---|---|
| (0,0) | |
| (0,1) | |
| (1,0) | |
| (1,1) | |
| EP | |
|---|---|
| (0,0) | |
| (0,1) | |
| (1,0) | |
| (1,1) | |
| 0 |
| EP | Case 1 | Case 2 | Case 3 | ||||||
|---|---|---|---|---|---|---|---|---|---|
| Stability | Stability | Stability | |||||||
| + | − | ESS | + | − | ESS | + | − | ESS | |
| − | ? | SP | + | + | Unstable | − | ? | SP | |
| − | ? | SP | − | ? | SP | + | + | Unstable | |
| + | + | Unstable | − | ? | SP | − | ? | SP | |
| + | 0 | SP | + | 0 | SP | + | 0 | SP | |
| EP | Case 4 | Case 5 | ||||
|---|---|---|---|---|---|---|
| Stability | Stability | |||||
| − | ? | SP | − | ? | SP | |
| + | − | ESS | + | − | ESS | |
| + | + | Unstable | − | ? | SP | |
| − | ? | SP | + | + | Unstable | |
| + | 0 | SP | + | 0 | SP | |
| EP | Case 6 | Case 7 | Case 8 | ||||||
|---|---|---|---|---|---|---|---|---|---|
| Stability | Stability | Stability | |||||||
| − | ? | SP | − | ? | SP | + | − | ESS | |
| − | ? | SP | − | ? | SP | + | + | Unstable | |
| + | + | Unstable | − | ? | SP | + | + | Unstable | |
| + | − | ESS | − | ? | SP | + | − | ESS | |
| + | 0 | SP | + | 0 | CS | + | 0 | SP | |
| EP | Stability Type | CNO Behavior | IESM Behavior | Social Welfare Impact |
|---|---|---|---|---|
| ESS | Overinvestment | Lenient Regulation | Significant Loss | |
| ESS | Rational Investment | Stringent Regulation | Positive Improvement | |
| Saddle Point | Dynamic Oscillations | Dynamic Oscillations | Unstable Fluctuations |
Disclaimer/Publisher’s Note: The statements, opinions and data contained in all publications are solely those of the individual author(s) and contributor(s) and not of MDPI and/or the editor(s). MDPI and/or the editor(s) disclaim responsibility for any injury to people or property resulting from any ideas, methods, instructions or products referred to in the content. |
© 2025 by the authors. Licensee MDPI, Basel, Switzerland. This article is an open access article distributed under the terms and conditions of the Creative Commons Attribution (CC BY) license (https://creativecommons.org/licenses/by/4.0/).
Share and Cite
Cui, K.; Chi, M.; Zhao, Y.; Liu, Z. Evolutionary Game-Based Regulatory Strategy Optimization for Information Transmission Prices in Integrated Energy Systems. Energies 2025, 18, 1452. https://doi.org/10.3390/en18061452
Cui K, Chi M, Zhao Y, Liu Z. Evolutionary Game-Based Regulatory Strategy Optimization for Information Transmission Prices in Integrated Energy Systems. Energies. 2025; 18(6):1452. https://doi.org/10.3390/en18061452
Chicago/Turabian StyleCui, Kun, Ming Chi, Yong Zhao, and Zhiwei Liu. 2025. "Evolutionary Game-Based Regulatory Strategy Optimization for Information Transmission Prices in Integrated Energy Systems" Energies 18, no. 6: 1452. https://doi.org/10.3390/en18061452
APA StyleCui, K., Chi, M., Zhao, Y., & Liu, Z. (2025). Evolutionary Game-Based Regulatory Strategy Optimization for Information Transmission Prices in Integrated Energy Systems. Energies, 18(6), 1452. https://doi.org/10.3390/en18061452