Article

Electrochemical Analysis of Carbon-Based Supercapacitors Using Finite Element Modeling and Impedance Spectroscopy

1
Institute of Biophysics, Johannes Kepler University Linz, Gruberstrasse 40, 4020 Linz, Austria
2
Keysight Technologies GmbH, Keysight Laboratories Austria, Gruberstrasse 40, 4020 Linz, Austria
3
Pleione Energy S.A., Patriarchou Grigoriou & Neapoleos Str., 15310 Athens, Greece
*
Authors to whom correspondence should be addressed.
Energies 2025, 18(6), 1450; https://doi.org/10.3390/en18061450
Submission received: 29 January 2025 / Revised: 3 March 2025 / Accepted: 12 March 2025 / Published: 15 March 2025
(This article belongs to the Section D: Energy Storage and Application)

Abstract

The electrochemical performance of carbon-based supercapacitors containing ionic liquid electrolytes was investigated through calibrated impedance spectroscopy and finite element modeling (FEM). To ensure precisely calibrated complex impedance measurements over a wide frequency range the measured pouch cells were mounted in a pressure fixture with stable terminal contacts, and a two-term impedance calibration workflow was applied. For the physical interpretation of the measurement results, FEM was used. Experimental findings demonstrated a clear dependency of the capacitive behavior on the electrode material, where cells with activated carbon electrodes showed lower impedance compared to cells with graphene electrodes. For FEM, we used a volume-averaged approach to study the effect of the electrode structure on the EIS response of the cells. The simulated impedance results showed a good agreement with experimental data in the middle- to high-frequency regions, ranging from 10 Hz to 10 kHz. Deviations from the ideal Warburg impedance were observed at lower frequencies, suggesting nonlinearity effects of the porous structure on ion transport mechanisms. FEM analysis was performed for both graphene and activated carbon electrodes showing a steeper transition region for activated carbon electrodes, indicating a reduced diffusion resistance for electrolyte ions.

1. Introduction

For the increasing demand of renewable and sustainable energy storage systems, various electrical storage technologies such as batteries and supercapacitors (SCs) have been developed, each characterized by distinct charging–discharging mechanisms and power/energy performances [1,2,3,4]. Rechargeable batteries are renowned for their high energy storage capacity, while thermal runaway and limited cycle life constrain their field of application to low-power applications. Conversely, SCs exhibit exceptional performance in applications requiring high power densities, good reversibility, and long cycle life [5]. Additionally, SCs generate less heat and offer rapid charging/discharging rates, making them ideal for hybrid electric vehicles (EVs), particularly for energy recuperation and providing faster engine start-up [6,7,8]. In this context, hybrid energy storage systems (HESSs) that combine lithium-ion batteries (LIBs) and SCs have emerged as a promising solution for EVs. SCs complement LIBs by handling peak power demands, enhancing regenerative braking efficiency, and reducing the high-current stress on LIBs, thereby improving overall system performance and extending battery life. Furthermore, in specific applications such as start-stop systems and auxiliary power management, SCs can function as standalone energy storage devices, offering superior durability and power delivery compared to conventional batteries [9]. SCs store electric charges through two main mechanisms: (a) electric double layer (EDL) capacitance, which involves electrostatic attraction between the electrode material and electrolyte ions, forming the Helmholtz double layer at the electrode surface, and (b) pseudo-capacitance, which involves Faradaic reactions and electron transfer at the electrode surface [10]. SCs operating via EDL are commonly referred to as electric double-layer capacitors (EDLCs).
Carbon-based materials, such as graphene, activated carbon (AC), carbon onions, carbon nanotubes (CNTs), and carbon fibers, are extensively utilized as SC electrode materials due to their high conductivity, electrochemical stability, and specific surface area (SSA) for ion adsorption [11,12]. The porous structure of carbon electrodes, influenced by the activation process and synthesis type as well as dynamic carbon surface chemistry, significantly impacts their electrical performance [13,14]. The pores are categorized regarding their size into micropores (<2 nm), mesopores (2–50 nm), and macropores (>50 nm). Studies have demonstrated that mesopores with high SSA facilitate the transport of electrolyte ions, thereby enhancing capacitance performance [15]. Additionally, ACs with increased micropore volume and suitable mesopore volume promote electrolyte diffusion and enhance ion adsorption on the carbon surface [16]. Tortuosity (Γ) of porous electrode materials is a critical parameter affecting electrolyte ion transport by quantifying the complexity of the transport pathways within the electrode structure. Geometrically, tortuosity is defined as the ratio of the microscopic path length an ion travels in pores to the Cartesian distance between the path endpoints [17,18]. Tortuosity influences the electrochemical behavior of the electrode by altering the effective conductivity and effective diffusivity of ions [19]. Tailoring electrode pore sizes to match electrolyte ion dimensions improves capacitance [20]. Conventional electrolytes often encounter solvation shell constraints, limiting ion access to pores. To tackle this issue, ionic liquid (IL) electrolytes have been used, as they are purely composed of ions, eliminating solvation effects. Despite their promising performance as EDLC electrolytes [21], ILs’ relatively high viscosity can hinder ion mobility within pores [22,23].
Electrochemical impedance spectroscopy (EIS) and cyclic voltammetry (CV) are key techniques for characterizing EDLC electrochemical performance. CV involves linearly varying the electrical potential over time in triangular cycles at the electrode surface while recording the output current. The resulting current–potential voltammogram provides insights into cell electrochemical dynamics over time. EIS is a widely utilized non-destructive test technique in battery diagnostics. Recent studies showed the use of EIS for evaluating SC performance under varying operational conditions, particularly for prognostics and diagnostics [24]. EIS measures the cell impedance as a function of frequency by applying a small amplitude sinusoidal input (voltage or current) around a steady-state input value, and then recording the output to represent complex impedance in a Nyquist plot. Key applications of EIS include cell quality assessment, an estimation of voltage and charge dependencies, and tracking ageing effects and power fade [25,26]. For instance, Sanchez-Romate et al. demonstrated EIS’s utility in evaluating woven carbon fiber supercapacitors [27], while Catelani et al. applied EIS to characterize hybrid supercapacitors that integrate battery-like energy density with supercapacitor-like power characteristics [28]. In addition, EIS was used to explore the temperature-dependent behavior of supercapacitors [29].
To ensure accurate EIS measurements across a broad frequency spectrum and to support a stable numerical analysis of complex cell processes, precisely measured impedance data are critical. Calibration enables the correction of measurement errors necessary for the EIS system error compensation [30,31]. Here, we implement a multi-term impedance calibration process using a short circuit and a known resistor standard to calibrate the SC measurements. By measuring the calibrating standards, we derive error coefficients that enable us to correct the error model and accurately calibrate the system.
Numerous models and simulation methods have been proposed to simulate and interpret EDLC EIS and CV responses. These models are categorized into atomistic models, equivalent circuits (ECs), and physics-based (PB) models. Atomistic models describe ionic interactions in electrode pores through detailed molecular dynamics (MD) simulations [32,33,34,35], but due to the high computational cost they are limited to studies of small systems. ECs are widely used [36,37,38,39], but they lack clear physical interpretation.
PB models utilize a continuum approach to describe SC transport phenomena and kinetics using conservation and diffusion equations represented by partial differential equations (PDEs). Coupled forms such as Poisson–Nernst–Planck (PNP) and modified Poisson–Nernst–Planck (MPNP) have been implemented in numerical solvers, including FEM methods, to investigate EDLC impedance performance [40,41,42,43,44]. Verbrugge and Liu introduced a PB model based on porous electrode theory, discussing the electrochemical justification and assumptions of the governing equations [45]. Subsequent studies have examined transport properties effects using constant current charge and voltage discharge setups [46]. Extended versions have been developed to study cell properties parametric effects on charging dynamics and performance [47]. Despite the efforts dedicated to employing continuum models for the analysis of EIS responses, which are predominantly applicable at nanoscale levels [42,44], the majority of these models have been oriented towards investigating the charge/discharge dynamics and CV performance of EDLCs.
Here, a one-dimensional modified model based on Verbrugge’s work is implemented to determine the performance relevant material parameters of carbon-based EDLCs by comparing experimentally obtained EIS data with modeled EIS spectra (see Figure 1). Experimental SC cells are prepared in a pouch cell configuration, including two porous carbon electrodes and a porous separator filled with IL electrolyte. Electrode materials include activated carbon and graphene. This approach allows us to study the effects of cell component transport properties on electrochemical behavior. Physical modeling was used to assess the impact of structural electrodes characteristics on the electrochemical performance of SCs. Section 2 provides the cell preparation methods, EIS measurement procedures, and the governing equations utilized in FEM. In Section 3, we first discuss the experimental EIS curves obtained for graphene and activated carbon cells. Following this, an FE model is developed based on the experimental data to analyze the effects of electrode transport properties on the EIS response and to interpret the physical behavior of the cell. The findings are summarized and concluded in Section 4.

2. Materials and Methods

2.1. Materials and Cell Manufacturing

Two different sets of cells were manufactured, the first set using graphene-based electrodes and the second one using activated carbon. An adjustable doctor-blade (DB) film applicator (MTI Corporation, Richmond, CA, USA) that can produce a wet film in the 0–5000 μm range with an accuracy of 10 μm was used for the coating of the supercapacitor electrodes, with a tape casting technique. Commercial activated carbon of 1600–1800 m2/g surface area and particle size (dSD) 4.0–6.5 μm (Jacobi Carbons AB, Kalmar, Sweden), PVDF (Sigma-Aldrich, St. Louis, MO, USA) as a binder, and commercially available carbon black C65 (Imerys, Paris, France), which serves as a conductive additive, were the primary composites of the electrodes prepared with an activated carbon as an active material. The aforementioned materials were then dissolved in the organic solvent NMP (Honeywell, Charlotte, NC, USA) and placed at a magnetic stirrer for 2 h for mixing. The wet film thickness of the doctor blade is adjusted according to the reached viscosity in order to provide a uniform coating that completely covers the substrate surface. An oven with atmospheric conditions was used for the drying process at 60 °C for 1 h.
For the development of the graphene-based electrodes, commercially available graphene nanoplatelets of 600–800 m2/g and carbon black C65, were added in distilled water that served as an aqueous solvent. The solution was subjected to a 2.5 h, 50% pulse at 80 W sonication using a probe Sonicator (Hielscher Ultrasonics, Teltow, Germany). Following homogenization, aqueous-based binders with a combination of styrene butadiene rubber and cellulose, both commercially available products, were added, and the mixture was placed for evaporation until it reached a coating-capable viscosity before being coated with a doctor blade as described above and dried in an oven.
In both cases, the electrodes were cut and placed under vacuum and temperature for conditioning for 12 h at 110° C. The electrodes were then assembled into pouch cells using a cellulose NKK (Nippon Kodoshi Corporation, Kochi-City, Japan) film as a separator, a laminated paper as a protective film and laminated aluminum foil (Targray, Kirkland, QC, Canada) for the casing of the pouch cell. The assembly was performed in a stacked design and the electrode filling and final sealing were performed inside a glove box, filled with inert atmosphere. Before the electrolyte filling and final sealing, the assembly was placed once again for conditioning. As an electrolyte, a commercially available IL TFSI electrolyte (IoLiTec Ionic Liquids Technologies GmbH, Heilbronn, Germany)with electrochemical stability window of 5.3 V and an anodic limit at 2.8 V was used. The cells were finally activated in several charge–discharge cycles, and after these initial cycles, the cells were placed for degassing inside a glove box.

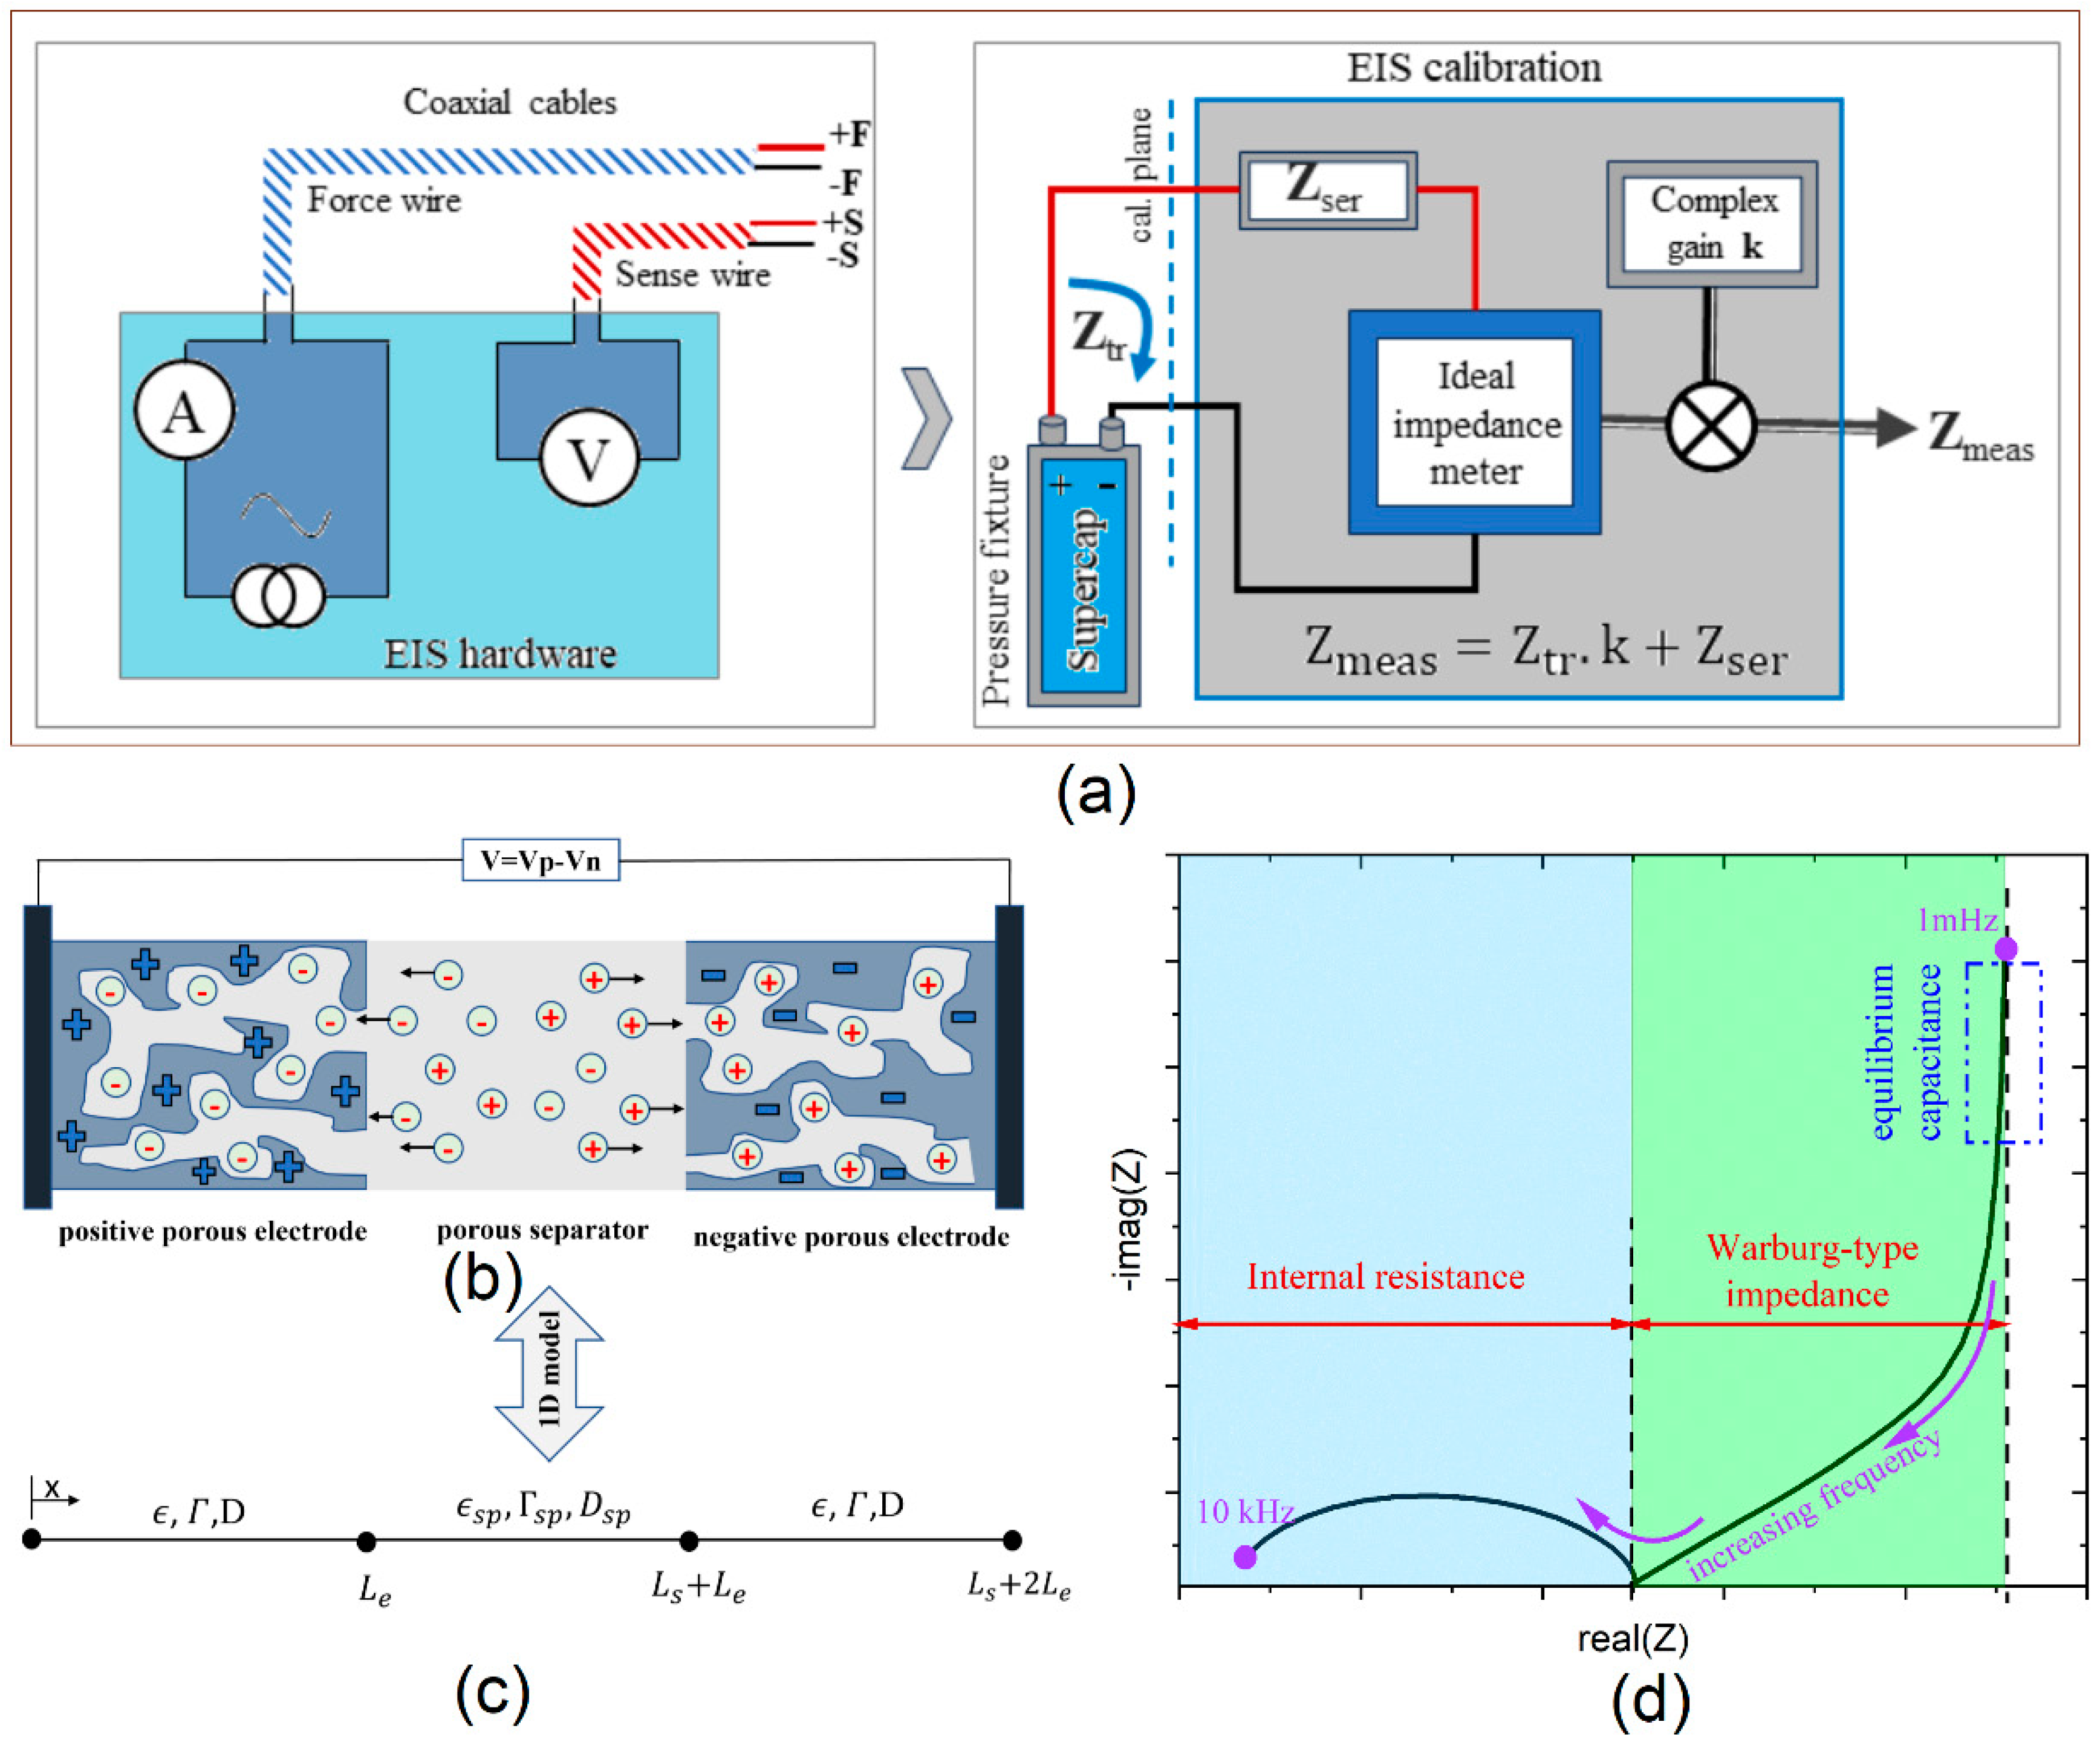
2.2. Experimental Setups

A Keysight Cell Tester (SL1007A, Santa Rosa, CA, USA) was used for the EIS and charge experiments, configured to handle tests up to 6 V and ±25 A with high precision (0.5 mV for voltage and ±0.05% for current measurements). Figure 1a (left) illustrates the measurement setup and fixture used for the supercapacitor cell. This setup minimizes external noise and parasitic effects, leading to clean and reliable impedance spectra, ensuring that the measured impedance accurately reflects the intrinsic properties of the cells. In galvanostatic EIS, an alternating current (AC) sine wave signal is applied to the cell, and the system’s response is recorded. This includes the voltage drop, v(t), across the module terminals and the current, i(t), passing through the cell. To minimize measurement errors, the system utilized a four-wire Kelvin connection setup, separating force and sense terminals at the cell fixture. Custom test fixtures were designed to accommodate the SC pouch cells, incorporating pressure springs and insulation pads to ensure proper contact and minimize wire disturbance. The testing process was managed using Keysight’s Energy Storage Discover (ESD) software (SL1091A, V10.0.0), which facilitates hardware control and execution of test sequences. For the experiments, the SC pouch cells were placed in a pressure fixture and allowed to settle for 30 min. A calibration procedure was performed to correct systematic measurement errors (Figure 1a, right panel). After calibration, the cells were connected to the tester, charged to an initial voltage of 0.7 V, and allowed to stabilize before initiating EIS measurements. EIS was conducted across a frequency range of 1 mHz to 10 kHz, using a 40 mA stimulus current. This current amplitude was selected to minimize voltage fluctuations at low frequencies and to avoid low signal-to-noise levels. Subsequently, the cells were charged to 1.5 V, rested for 10 min, and EIS was conducted. The process was repeated at 2.0 V, with a 10 min stabilization period between each voltage step to ensure consistent and reliable data. CV tests are performed with an AUTOLAB potentiostat/galvanostat (Metrohm Autolab B.V., Utrecht, The Netherlands) device in one electrode pair pouch cell. The measurement is performed in a potential window from 0 to 2.05 V, with a scanning rate of 10, 20, 50, 100, and 200 mV/s, respectively.
For EIS calibration, an electrical short is measured at the fixture terminals, and a shunt standard with a known impedance (100 mΩ) is used to determine frequency-dependent error coefficients to correct the raw EIS data. In the error model, the true impedance is modeled by combining an ideal impedance meter with two error terms, the series error impedance (Zser) and the gain error (K). The measured impedance (ZM) is expressed as follows:
Z M = Z T × + Z s e r × K
where ZT is the true impedance, and Zser and K are the error coefficients [31,48].

2.3. Finite Element Model (FEM)

The schematic representation of the EDLC cell is depicted in Figure 1b, which includes two porous electrodes, a porous separator, and an ionic liquid (IL) electrolyte. Figure 1c presents a one-dimensional geometric illustration of the cell, showing the electrodes with a length Le and the separator with a length Ls along the x-axis. To model the one-dimensional electrochemical behavior of the cell, volume-averaged transport properties for both the electrode and separator materials are utilized. The model proposed by Verbrugge and Liu, along with its subsequent modifications, is applied to describe the governing equations for mass and charge conservation in the system [45,49].
In order to make the model computationally efficient and mathematically traceable, the following assumptions and idealizations were made: (1) The porous electrode theory is implemented to describe the volume-averaged porous medium including carbon solid phase and electrolyte liquid phase. (2) The electrolyte is binary and symmetric, consisting of only one pair of ions with opposite valency. This assumption is consistent with the ionic liquid electrolyte being used in the current study. The two ions are further assumed to have identical diameters and diffusion coefficients. (3) The less complex dilute solution theory is adopted instead of the concentrated-solution theory. (4) The double layer capacity is calculated as volume-averaged value including the Stern-layer, and the thickness is approximated with the radius of the ions. (5) Any bulk motion of the electrolyte or temperature gradients in the electrode and electrolyte are neglected.
Using these considerations the equation for charge conservation in porous electrode the conservation of the total current through the system can be expressed as follows [47,49]:
a C D ψ s ψ l t = κ c 2 ψ l x 2                             0 x L s   a n d   L s + L e x 2 L e + L s
σ 2 ψ s x 2 + κ 2 ψ l x 2 = 0 0 x L s   a n d   L s + L e x 2 L e + L s
where a, C D , ψ s , ψ l , σ , and κ c are the specific surface area, double layer capacitance, solid phase potential, electrolyte potential, solid phase conductivity, and concentration-dependent ionic conductivity, respectively.
Considering the bulk electroneutrality, dilute solution theory and symmetric binary electrolyte assumptions, from this the mass conservation equation of the electrolyte follows with:
ϵ c t = D 2 c x 2 + a C D 2 F ψ 1 ψ 2 t 0 x L s   a n d   L s + L e x 2 L e + L s
where ϵ , c, D, and F are the electrode porosity, the concentration, the diffusion coefficient and the Faraday constant, respectively.
Since the separator is not electrically conductive, the charge and mass balance equations can be reduced to the following form:
κ s p c 2 ψ l x 2 = 0                         L e x L e + L s    
ϵ s p c t = D s p 2 c x 2                         L e x L e + L s
where κ s p (c) is the concentration-dependent ionic conductivity in the separator, ϵ s p is the separator porosity, and Dsp is the diffusion coefficient in the separator.
Applying the effective medium approach and defining D0 as the bulk diffusion coefficient, the effective transport properties of the porous electrode reflecting the structural feature effects like tortuosity can be defined as D = D 0 ϵ Γ , where Γ is the tortuosity of the electrode. Similarly, the effective diffusion coefficient in the separator is defined as D s p = D 0 ϵ s p Γ s p , where Γsp is the tortuosity of the separator. The ionic conductivity of the electrolyte in the electrode and separator is expressed as a linear function of the electrolyte concentration as κ c = 2 F 2 R T D c where R is the universal gas constant and T is the temperature.
In order to solve the aforementioned equations, the following boundary conditions are considered: At the current collector coordinates (x = 0 and x = Ls + 2Le), there is no current/mass flux carried by electrolyte ions ( ψ l x = 0 and c x = 0 ) and current is flowing due to the solid phase potential gradient ( ψ s ). For CV calculations, ψ s is imposed at x = 0 as a function of the linearly varying value with time forming a cycle over the maximum and minimum applied voltages, Emax and Emin, respectively. Similarly, imposing ψs as a harmonic function of the time at x = 0 is applied to simulate the EIS performance of the system. The cell is grounded with ψ s = 0 at x = Ls + 2Le. Other boundary conditions are applied to define the insulating conditions at separator and fluxes continuity at the electrode/separator interface [45,47].
The physical partial differential equations system defined by Equations (1)–(5) is solved using the Coefficient Form PDE interface of COMSOL 6.1 FEM solver. The mathematical model consisted of three electric fields and two concentration fields for two electrodes, one separator and an IL electrolyte. The electric fields and concentration fields were coupled with each other.
The EDL capacitance and its potential dependency is calculated following the Gouy–Chapman–Stern theory, where the Stern and Gouy–Chapman capacitance, C S t , and C G C are put in series and defined by the following relations [50]:
1 C G C S = 1 C S t + 1 C G C    
C S t = ϵ r ϵ 0 λ S
C G C = ϵ r ϵ 0 λ D cosh z e ψ D 2 k B T
where ϵ r is the relative permittivity of the solvent, ϵ 0 is the vacuum permittivity and λS is the thickness of the Stern layer (half of the ion diameter), z is the charge number, e is the elementary charge, kB is the Boltzmann constant, ψD = ψsψl is the potential drop across the double layer, and λD is the diffuse-layer thickness (Debye length, λ D = ϵ r ϵ 0 k B T 2 z e 2 c ).
In order to simulate EIS, a time-harmonic oscillating potential ψs(t) around a steady state potential at x = 0 is imposed, and the resulting harmonic current density Is(t) is measured. The imposed potential ψs(t) and the resulting current density Is(t) can be written as follows:
ψ s t = ψ s s + ψ 0 e x p ( i 2 π f ) I s t = I s s + I 0 exp i ( 2 π f ϕ )
where ψss is the steady-state bias potential, ψ0 is the amplitude of the oscillating potential, Iss is the time-independent dc current density, I0 is the amplitude of the oscillating current density, and ϕ is the phase angle ψs(t) and Is(t). Then, the complex impedance Z can be defined as follows:
Z f = ψ 0 I 0 exp i ϕ = Z r e a l + i Z i m a g
where Zreal and Zimag are the real and imaginary parts of the impedance, respectively.
In CV simulation, the electrode potential at x = 0 is imposed to vary periodically and linearly with time as follows [51]:
ψ s ( t ) = E m i n + ν t                                                 2 ( n 1 ) t h a l f t < ( 2 n 1 ) t h a l f E m a x + υ t 2 n 1 t h a l f                       2 n 1 t h a l f t < 2 n t h a l f                        
where ν is scan rate, n(=1, 2, 3, …) is the cycle number, and thalf = (EmaxEmin)/v is the half the cycle period. The accumulated charge, Q, in the system during one cycle is given by the following relation [51]:
Q = 1 2 I C V v   d ψ
Then, the total capacitance CCV can be obtained from
C C V = Q E m a x E m i n

3. Results and Discussion

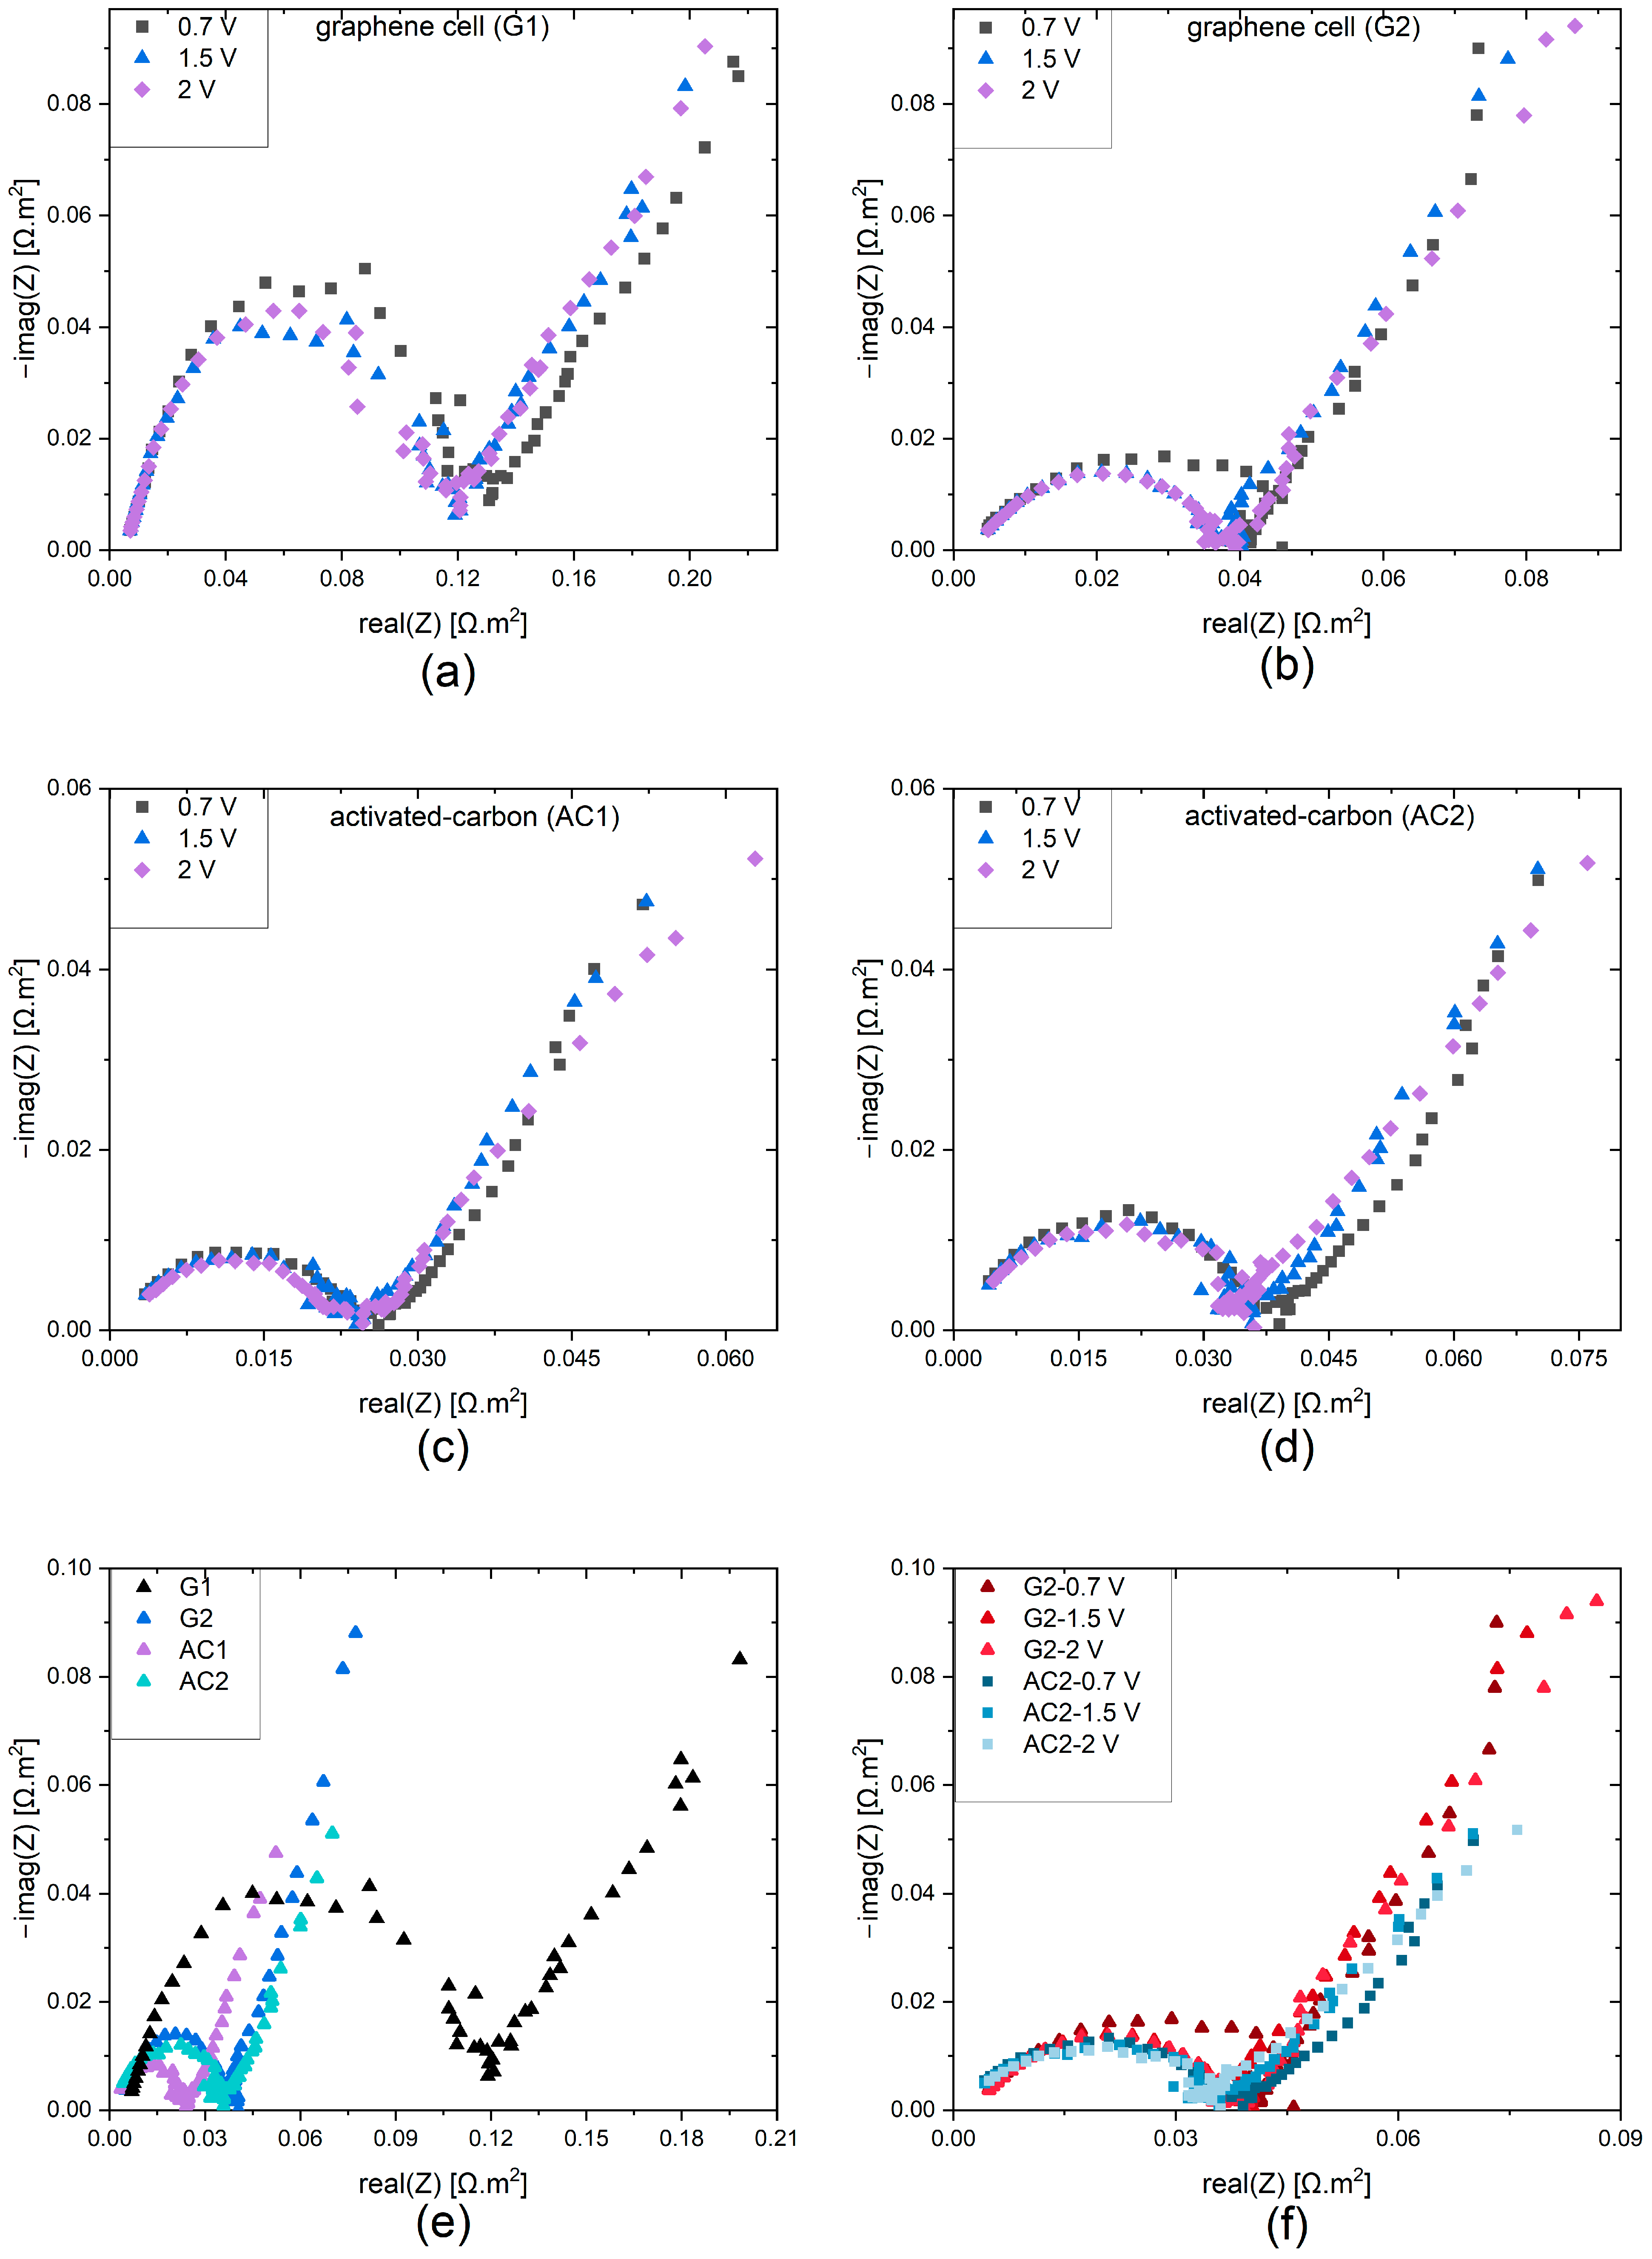
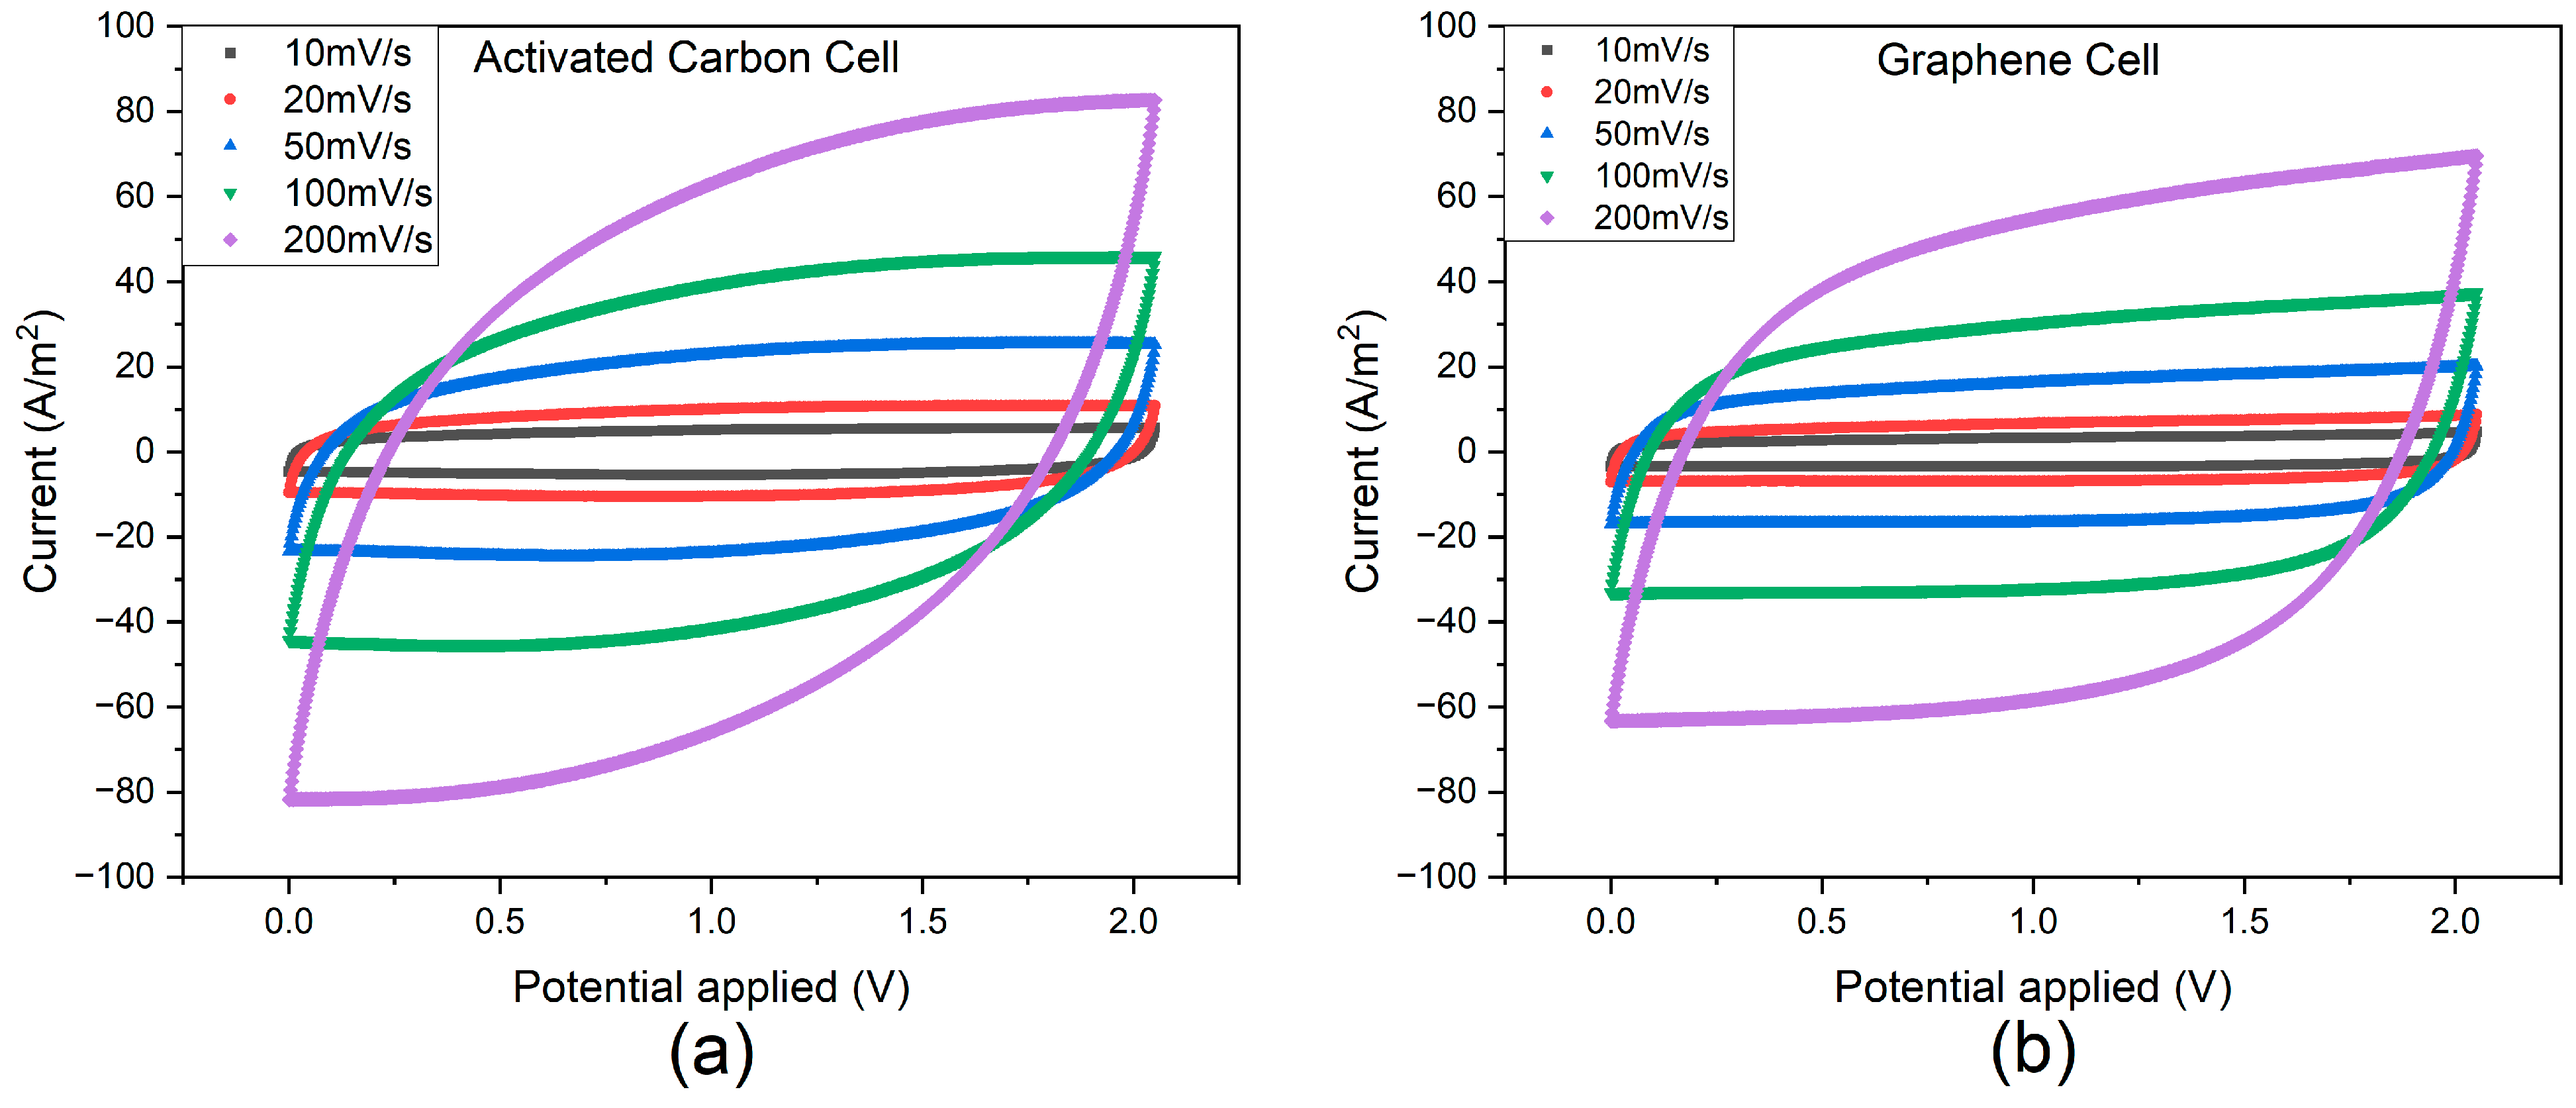
3.1. Experimental Results
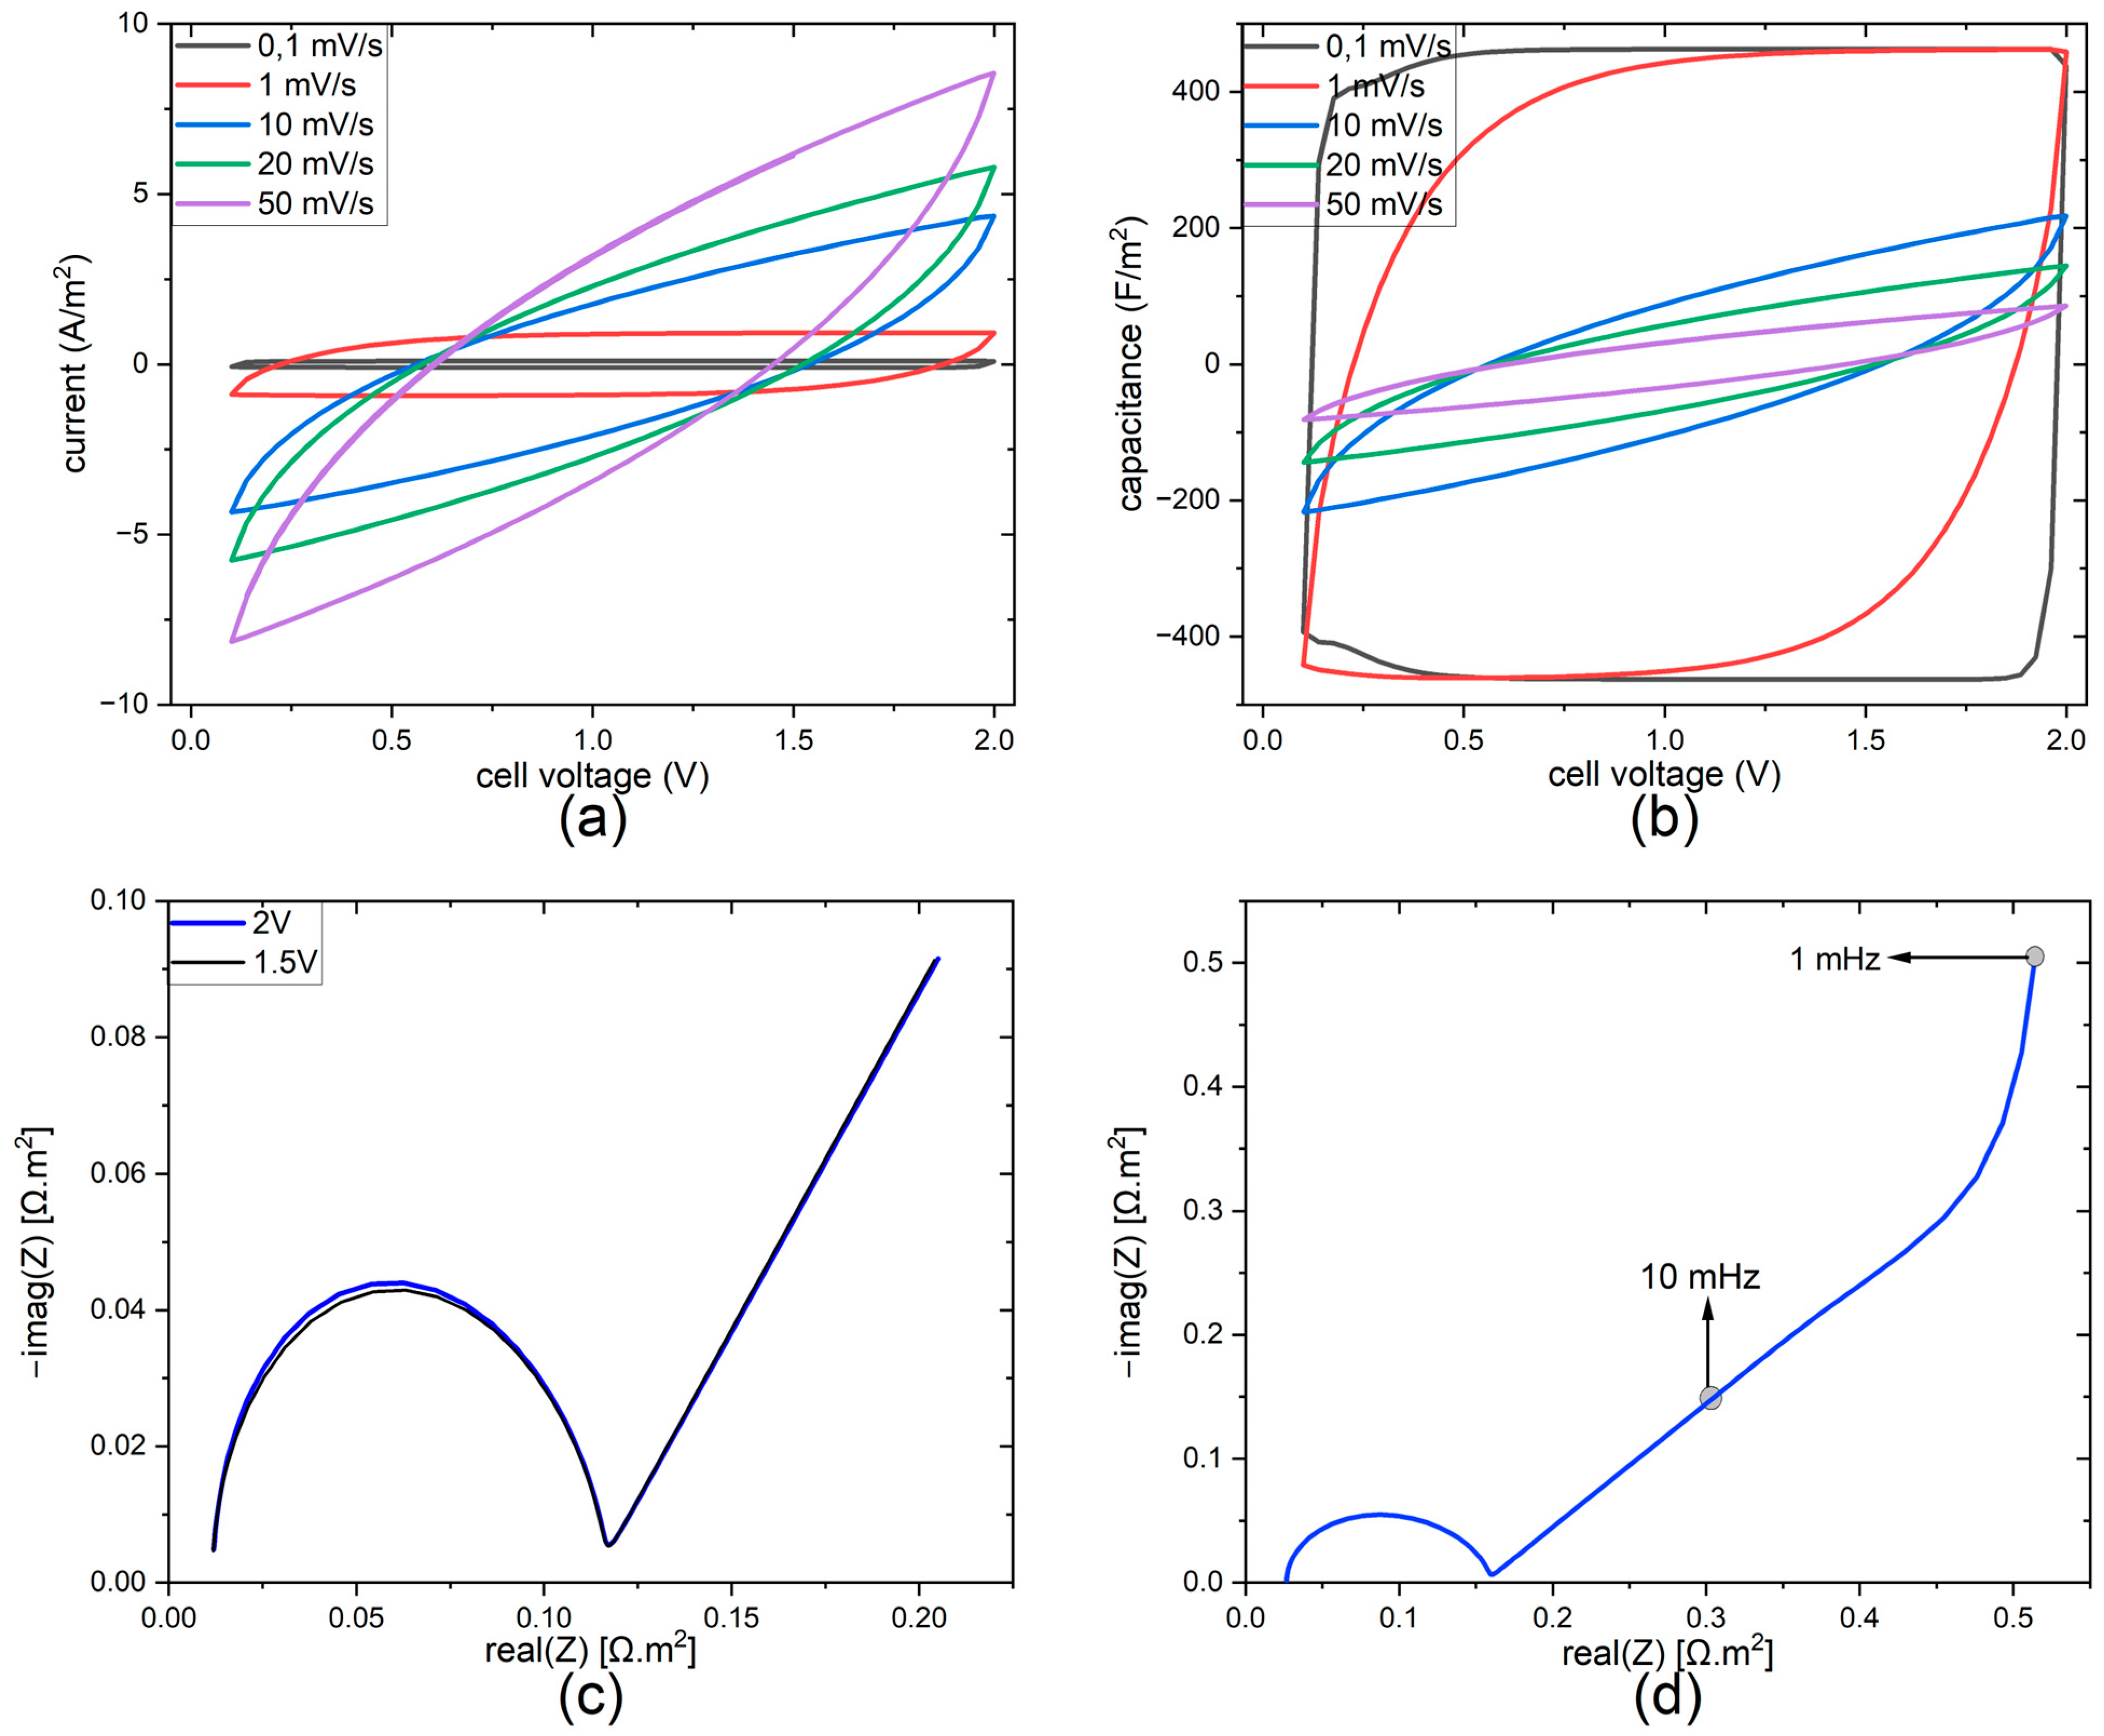
Figure 2 presents representative experimental EIS data for two sets of samples, which include two graphene cells (Figure 2a—G1, Figure 2b—G2), and two activated carbon cells (Figure 2c—AC1, Figure 2d—AC1). Different characteristics are observed across the frequency spectrum. At the low-frequency end of the spectrum, the vertical line represents the equilibrium differential capacitance. This transitions to an inclined line at intermediate frequencies, indicative of electrolyte ion transport within the porous electrode, typically characterized by Warburg-type impedance. At higher frequencies, the response culminates in a semicircle, attributed to the combined effects of the cell’s internal resistance, including contributions from electrode and electrolyte resistances, and the double-layer capacitance [24,42]. The dimensions and positions of these regions can vary and are characteristic for the electrode material and its structure.
In the graphene cells, the maximum capacitance value of the impedance curve remains constant, while due to the manufacturing variability the resistive component for sample G1 is higher than sample G2. A similar behavior is observed in the activated carbon cell samples, where sample AC1 demonstrates a less resistive behavior compared to sample AC2. This can be related to the change in the internal resistance of the cells due to the different ionic transport properties. The data also reveal that the DC voltage has only a negligible influence on the EIS response of the cells, which can be attributed to the electrical double-layer (EDL) charging mechanism where no Faraday reactions are present.
Figure 2e provides a comparison of all samples at a DC voltage of 1.5 V. It is evident that graphene cells exhibit a longer Warburg diffusion part, which can be ascribed to structural differences between the electrodes, for example, specific surface area and pore resistance. A comparison of samples G2 and AC2, shown in Figure 2f, reveals that while their semicircular regions are nearly identical, they differ in their Warburg lengths and slopes. This effect arises from the activated carbon sample having twice the specific surface area of the graphene sample, which is reflected in the shortened diffusion part. The difference in the slope is related to the porous structure characteristics of the two electrodes which results in different transport properties of the ions inside the pores.
Figure 3 depicts the cyclic voltammetry (CV) curves of the two representative samples for activated carbon and graphene cells. The rectangular shape of the CV curves at various scan rates reflects the dominant EDL charging mechanism. Also, it is observed that the current density of the AC sample is higher at the same scan rate compared to the G sample. Moreover, as the scan rate increases, the CV response shows more resistive behavior, deviating from the rectangular-like shape. It is important to note that the CV samples were prepared in a single-pair cell with different mass loadings. Therefore, these results serve a more qualitative than quantitative description of cell performance.

3.2. FEM Results

In order to interpret the experimental EIS and CV results and associate them with the variation in the different physical and chemical cell parameters we carried out detailed FEM simulations. The CV and EIS simulation results of the EDL characteristic charging response are illustrated in Figure 4, based on materials and geometry parameters listed in Table 1 with D0 = 1.75 × 10⁻¹³ m2/s, a = 2.75 × 10⁷ 1/m, Γ = 15, and Γs = 4.08. Note that both the activated carbon- and graphene-based electrodes in this study were designed with identical macroscopic shapes and geometries to allow for a direct comparison of their electrochemical performance. However, despite these structural similarities, certain intrinsic material-dependent properties, such as the diffusion coefficient, specific surface area, and tortuosity, vary between the two electrode types. Therefore, Table 1 provides the model parameters applicable to both electrodes. The simulated CV curve correctly depicts the rectangular shape response indicating the model reliability to represent the EDL electrochemical dynamics. With increasing scan rate, an ohmic response is observed where the rectangular shape contracts to an almost linear curve (Figure 4a). This trend is consistent with the experimental data presented in Figure 3, and it aligns closely with the recent experimental findings reported by [52]. The corresponding capacitance curve is shown in Figure 4b. It is important to note that there exists a critical scan rate below which the maximum capacitance remains nearly constant. This effect has been reported in previous studies where it has been shown that at sufficiently low scan rates, the diffusion time is sufficient for full charge storage, leading to a saturation effect in capacitance [53]. In our study, this effect is captured by the simulation, as at lower scan rates, ion transport is no longer the limiting factor, and the capacitance approaches a stable maximum. The maximum capacitance value is observed at low scan rates, with a maximum cell capacitance of 450 F/m2 for scan rates below 1 mV/s.
The modeled EIS response is illustrated in Figure 4c,d, with Figure 4c showing the Nyquist plot at two different voltages starting at a frequency of 10 mHz. The modeled curve is consistent with the experimental results, affirming the model’s reliability since no electrochemical Faradaic reaction term is included in the governing equations. The modeled curve also displays the linear diffusion impedance at low frequencies, referred to as the Warburg impedance, characterized by a 45-degree angle, followed by the semicircle charge transfer area at higher frequencies.
Figure 4d presents the modeled EIS curve with a starting frequency of 1 mHz, illustrating the transition from the linear Warburg diffusion to the vertical capacitive region. This transition, occurring between the 45-degree Warburg line and the capacitive vertical line, is influenced by the structural properties of the graphene and activated carbon electrodes, such as specific surface area and pore tortuosity. In addition, these factors result in a curved diffusion region instead of a pure linear segment. As a note, in this study, the intercalation of electrolyte species into the graphene pores is disregarded, yielding a linear calculated EIS response in the diffusion region.
Figure 5 shows how carbon electrode properties influence EIS and CV performance based on FEM. The EIS curves are mostly influenced by the bulk diffusion coefficients, D0, as shown in Figure 5a. An increase in the diffusion coefficient contracts the EIS curve, while a decrease causes it to expand. This effect results from the direct correlation between the diffusion coefficient and the transport of electrolyte ions within the porous electrode. A more resistive pathway for ion movement leads to higher resistance values in the EIS response, highlighting the pivotal role of ion mobility in shaping the cell’s electrochemical characteristics [42]. The CV curves with respect to variations in the bulk diffusion coefficient are shown in Figure 5b. An increase in the diffusion coefficient enhances the maximum generated current, pointing to a reduction in the cell resistance. With the scan rate held constant at 10 mV/s, the charge capacity, represented by the area under the CV curve, increases with higher diffusion coefficient values, indicating a more efficient charge storage mechanism due to enhanced ion transport.
Figure 5c,d investigate the effect of separator tortuosity on the cell characteristics. Since the separator functions as an insulator, only electrolyte ions can pass through. The porous separator structure has a significant effect on the size of the charge-transfer semicircle (Figure 5c). At higher frequencies, the more tortuous and the more sluggish the ion movement is, thereby increasing the overall resistance. The middle- and low-frequency regions, determined by electrode transport properties, remain unaffected by separator tortuosity and shift laterally depending on the tortuosity values. This is in agreement with previous experimental findings showing that the separator does not contribute to the capacitance and acts as an additional ionic resistance [55]. The CV results indicate a decrease in accumulated charge with increasing separator tortuosity (Γ), due to the impeded ion movement (Figure 5d). This indicates the function of the separator in maintaining efficient ion transport and minimizing resistive losses.
Electrode tortuosity is a critical factor in defining the impedance of cells, as shown in Figure 5e,f. To capture capacitance at lower frequencies, the minimum frequency in EIS is set to 1 mHz. Higher electrode tortuosity leads to increased resistance to ion transport within the geometrical pores, generating higher resistive component values in the EIS response (Figure 5e). For high tortuosity values, the linear diffusion part is extended, and the transition to the capacitive region occurs at lower frequencies. Conversely, less tortuous electrodes enable quicker stabilization of the capacitive response, resulting in a longer vertical line in the EIS curve. The high- and middle-frequency regions are less impacted by the electrode tortuosity, as these areas are influenced by changes in bulk electrolyte properties, electrode conductivity, and separator tortuosity.
The curvature of the transition zone between Warburg and capacitive lines is influenced by the distribution of pores with varying geometrical shapes. However, as this study does not account for pore geometrical features, the curvature remains unchanged across all cases. The impact of the tortuosity on CV performance is shown in Figure 5f. Higher tortuosity reduces the generated current due to increased resistance to ion flow. Conversely, lower tortuosity enhances charge accumulation, as reflected by the enlarged area bound by the CV curve.
Figure 6 presents the comparison between the experimental data and the simulation results, achieved through the adjustment of model parameters to their optimized values. The EIS response of the G1 cell at minimum frequency of 1 mHz is depicted in Figure 6a together with the FEM results. There is good agreement in the semicircular region, while small differences exist in the middle-low frequency region. Experimental data suggest that for frequencies below 10 mHz, the slope of the curve becomes steeper, indicating a transition to the fully capacitive regime. However, the vertical capacitance line is not observable, suggesting pore resistance impedes stable ion transport. Consequently, geometrical features dictate impedance behavior in this region. The one-dimensional model used here does not include these features, hence the diffusion region follows the Warburg line with a slope of one. For frequencies below 10 mHz, the response remains linear before transitioning into the capacitance region.
The simulated EIS response of the graphene cell G1, shown in Figure 6b, aligns well with experimental data for two different voltages. The voltage-independent nature of the experimental cell is also confirmed, as the model results are independent of the voltage too. The overlapping plots indicate that the cell follows the Warburg linear diffusion region at low frequencies, implying no complex transport response. For activated carbon AC2 and graphene cells G2 shown in Figure 6c, however, the diffusion region deviates significantly from the standard Warburg line, indicating complex pore structures. The semicircular portion of the model matches the experimental data, though the lower frequency region has a steeper slope compared to simulation results. This deviation points towards increased capacitance behavior of the cells.
The one-dimensional volume-averaged porous electrode theory accurately predicts the EIS response of EDLCs at middle to high frequencies. However, low-frequency behavior is influenced by pore distribution and transport properties, requiring higher-dimensional models for accurate representation. While these models provide improved accuracy, they come at an increase in higher computational cost and potential numerical challenges. The results indicate that cells deviating from the Warburg line exhibit higher capacitance performance (see Figure 6c). This finding is crucial for the development of more efficient supercapacitors. Future studies will focus on incorporating higher-dimensional models to account for the complex geometrical features of the pores. Additionally, further experimental validation is required to confirm these findings across a broader range of samples and conditions.

4. Conclusions

In this study, we combined calibrated EIS and CV with FEM to evaluate the performance of carbon-based supercapacitors. Two types of supercapacitor cells were fabricated, one utilizing activated carbon electrodes and the other employing graphene, both integrated with ionic liquid electrolytes. The cells were characterized using CV and EIS techniques at different scanning rates and OCV levels, respectively. A pressure fixture and calibration method were developed to enhance EIS measurement accuracy, establishing a stable and well-defined calibration plane while minimizing wire movements. The calibration protocol employed short and shunt standards with well-defined parameters to correct the error model across a frequency range of 1 mHz to 10 kHz. This broad frequency range enabled the investigation of processes spanning multiple scales, from capacitive equilibrium at low frequencies to ion transport resistance and internal resistance phenomena at higher frequencies. EIS datasets from two graphene cells (G1, G2) and two activated carbon cells (AC1, AC2) were input to the one-dimensional FE model A consistent maximum capacitance was observed for all cells at different voltage levels, with minor differences in resistance values due to manufacturing variability. The results indicate that activated carbon electrodes outperform graphite electrodes, exhibiting twice the capacitance. This enhancement is attributed to the lower imaginary component of the Nyquist plot at the lowest frequency values for AC electrodes. Additionally, AC electrodes exhibit lower overall cell resistance, which facilitates ion transport within the material pores.
A volume-averaged, one-dimensional continuum model was developed to analyze the impedance behavior of the supercapacitors. This model accurately simulates the electrochemical characteristics of cells and show good agreement with experimental measurements, validating its robustness. Linking electrochemical modeling with empirical data provides valuable insights into the interaction between cell transport properties and the impedance responses of carbon-based electrodes. For example, higher diffusion coefficients enhance ion transport within the porous electrode, contracting the EIS curve and increasing current density in CV curves due to lower resistance, while higher electrode tortuosity increases resistance to ion transport, extending the linear diffusion region and delaying the transition to capacitive behavior. The mid-to-high-frequency response, represented by the semicircle region in the EIS Nyquist plot, was accurately modeled across all cases. However, deviations from the ideal Warburg diffusion line were observed in certain cells, attributed to the inherent complexity of structural features such as the pore size and its size distribution. These deviations appear as diffusion lines with varying slopes in the Nyquist plot, where steeper slopes reflect a more pronounced capacitive behavior of the cell. The CV measurement results for activated carbon and graphene cells displayed a rectangular shape at low scan rates, indicating the dominance of the EDL charging mechanism. The current density was higher for the activated carbon sample than for the graphene sample at equivalent scan rates. At higher scan rates, the CV curves deviated from the rectangular shape, showing increased resistive behavior. Simulated CV curves showed a transition from rectangular to curved shapes as scan rates increase, consistent with experimental data and the literature. A maximum capacitance (450 F/m2) was achieved at scan rates below 1 mV/s.
The potential for practical applications of this research is significant. By optimizing the transport properties, such as diffusion coefficient and tortuosity, the performance of supercapacitors can be enhanced. This could lead to the development of more efficient energy storage devices, with improved charge and discharge rates, higher capacitance, and greater overall energy density. Understanding and manipulating the fundamental electrochemical properties of materials at the microscopic level is essential for advancing the technology of next-generation energy storage solutions.

Author Contributions

Conceptualization, A.A., N.A.-Z.-R.-S. and G.G.; methodology, A.A., N.B. and N.A.-Z.-R.-S.; software, A.A.; validation, N.A.-Z.-R.-S., D.H. and G.G.; formal analysis, A.A.; investigation, A.A., N.B., N.P. and K.M.; resources, G.G. and F.K.; data curation, G.G. and N.A.-Z.-R.-S.; writing—original draft preparation, A.A.; writing—review and editing, N.A.-Z.-R.-S., F.K. and G.G.; visualization, A.A.; supervision, G.G. and F.K.; project administration, G.G. and N.A.-Z.-R.-S.; funding acquisition, G.G. and F.K. All authors have read and agreed to the published version of the manuscript.

Funding

This research was partially funded by the Horizon Europe project “EMPHASIS” (Grant Agreement No. 101091997) and the Horizon Europe project “DigiCell” (Grant Agreement No. 101135486).

Data Availability Statement

The data supporting this research are openly available under the CC-BY license agreement in the Zenodo at https://zenodo.org/records/14718573 repository (published on 22 January 2025) under the identifier https://doi.org/10.5281/zenodo.14718573.

Acknowledgments

The authors express their sincere gratitude to Athanasios Masouras for his support and valuable feedback on the discussion of results. Special thanks to Jacobi Carbons for providing the reference material used during electrode preparation.

Conflicts of Interest

The authors declare that the research was conducted in the absence of any commercial or financial relationships that could be construed as a potential conflict of interest.

Abbreviations

The following abbreviations are used in this manuscript:
ACActivated Carbon
CNTsCarbon Nanotubes
CVCyclic Voltammetry
ECEquivalent Circuit
EDLElectric Double Layer
EDLCElectric Double Layer Capacitor
EISImpedance Spectroscopy
EVElectric Vehicle
FEM Finite Element Modeling
GGraphite
HESSHybrid Energy Storage System
ILIonic Liquid
LIBLithium-Ion Battery
MDMolecular Dynamics
MPNPModified Poisson–Nernst–Planck
OCVOpen Circuit Voltage
PDEPartial Differential Equations
PNPPoisson–Nernst–Planck
SSASpecific Surface Area
SCSupercapacitor

References

  1. Chen, N.; Zhang, H.; Li, L.; Chen, R.; Guo, S. Ionogel Electrolytes for High-Performance Lithium Batteries: A Review. Adv. Energy Mater. 2018, 8, 1702675. [Google Scholar] [CrossRef]
  2. Chen, G.Z. Supercapacitor and supercapattery as emerging electrochemical energy stores. Int. Mater. Rev. 2017, 62, 173–202. [Google Scholar] [CrossRef]
  3. Dutta, S.; Bhaumik, A.; Wu, K.C.-W. Hierarchically porous carbon derived from polymers and biomass: Effect of interconnected pores on energy applications. Energy Environ. Sci. 2014, 7, 3574–3592. [Google Scholar] [CrossRef]
  4. Patel, M.R.; Beik, O. Wind and Solar Power Systems: Design, Analysis, and Operation, 3rd ed.; CRC Press: Boca Raton, FL, USA, 2021; ISBN 9780367476939. [Google Scholar]
  5. Liu, Y.; Fan, L.-Z.; Jiao, L. Graphene intercalated in graphene-like MoS2: A promising cathode for rechargeable Mg batteries. J. Power Sources 2017, 340, 104–110. [Google Scholar] [CrossRef]
  6. Burke, A. Ultracapacitors: Why, how, and where is the technology. J. Power Sources 2000, 91, 37–50. [Google Scholar] [CrossRef]
  7. Brodd, R.J.; Bullock, K.R.; Leising, R.A.; Middaugh, R.L.; Miller, J.R.; Takeuchi, E. Batteries, 1977 to 2002. J. Electrochem. Soc. 2004, 151, K1. [Google Scholar] [CrossRef]
  8. Kötz, R.; Carlen, M. Principles and applications of electrochemical capacitors. Electrochim. Acta 2000, 45, 2483–2498. [Google Scholar] [CrossRef]
  9. Ahsan, M.B.F.; Mekhilef, S.; Soon, T.K.; Mubin, M.B.; Shrivastava, P.; Seyedmahmoudian, M. Lithium-ion battery and supercapacitor-based hybrid energy storage system for electric vehicle applications: A review. Int. J. Energy Res. 2022, 46, 19826–19854. [Google Scholar] [CrossRef]
  10. Zhang, S.; Pan, N. Supercapacitors Performance Evaluation. Adv. Energy Mater. 2015, 5, 1401401. [Google Scholar] [CrossRef]
  11. Bokhari, S.W.; Siddique, A.H.; Sherrell, P.C.; Yue, X.; Karumbaiah, K.M.; Wei, S.; Ellis, A.V.; Gao, W. Advances in graphene-based supercapacitor electrodes. Energy Rep. 2020, 6, 2768–2784. [Google Scholar] [CrossRef]
  12. Shchegolkov, A.V.; Lipkin, M.S.; Semenkova, A. Application of carbon nanotubes produced by CVD-method for supercapacitor with LiPF6-based electrolyte. Vopr. Materialoved. 2022, 64–76. [Google Scholar] [CrossRef]
  13. Zhang, P.; Fan, J.; Wang, Y.; Dang, Y.; Heumann, S.; Ding, Y. Insights into the role of defects on the Raman spectroscopy of carbon nanotube and biomass-derived carbon. Carbon 2024, 222, 118998. [Google Scholar] [CrossRef]
  14. Elmouwahidi, A.; Bailón-García, E.; Romero-Cano, L.A.; Zárate-Guzmán, A.I.; Pérez-Cadenas, A.F.; Carrasco-Marín, F. Influence of Surface Chemistry on the Electrochemical Performance of Biomass-Derived Carbon Electrodes for its Use as Supercapacitors. Materials 2019, 12, 2458. [Google Scholar] [CrossRef] [PubMed]
  15. Kim, H.S.; Abbas, M.A.; Kang, M.S.; Kyung, H.; Bang, J.H.; Yoo, W.C. Study of the structure-properties relations of carbon spheres affecting electrochemical performances of EDLCs. Electrochim. Acta 2019, 304, 210–220. [Google Scholar] [CrossRef]
  16. Zhang, K.; Sun, J.; E, L.; Ma, C.; Luo, S.; Wu, Z.; Li, W.; Liu, S. Effects of the Pore Structure of Commercial Activated Carbon on the Electrochemical Performance of Supercapacitors. J. Energy Storage 2022, 45, 103457. [Google Scholar] [CrossRef]
  17. Epstein, N. On tortuosity and the tortuosity factor in flow and diffusion through porous media. Chem. Eng. Sci. 1989, 44, 777–779. [Google Scholar] [CrossRef]
  18. Nemani, V.P.; Harris, S.J.; Smith, K.C. Design of Bi-Tortuous, Anisotropic Graphite Anodes for Fast Ion-Transport in Li-Ion Batteries. J. Electrochem. Soc. 2015, 162, A1415–A1423. [Google Scholar] [CrossRef]
  19. Suthar, B.; Landesfeind, J.; Eldiven, A.; Gasteiger, H.A. Method to Determine the In-Plane Tortuosity of Porous Electrodes. J. Electrochem. Soc. 2018, 165, A2008–A2018. [Google Scholar] [CrossRef]
  20. Leyva-García, S.; Lozano-Castelló, D.; Morallón, E.; Vogl, T.; Schütter, C.; Passerini, S.; Balducci, A.; Cazorla-Amorós, D. Electrochemical performance of a superporous activated carbon in ionic liquid-based electrolytes. J. Power Sources 2016, 336, 419–426. [Google Scholar] [CrossRef]
  21. Tsai, W.-Y.; Lin, R.; Murali, S.; Li Zhang, L.; McDonough, J.K.; Ruoff, R.S.; Taberna, P.-L.; Gogotsi, Y.; Simon, P. Outstanding performance of activated graphene based supercapacitors in ionic liquid electrolyte from −50 to 80 °C. Nano Energy 2013, 2, 403–411. [Google Scholar] [CrossRef]
  22. Sato, T.; Masuda, G.; Takagi, K. Electrochemical properties of novel ionic liquids for electric double layer capacitor applications. Electrochim. Acta 2004, 49, 3603–3611. [Google Scholar] [CrossRef]
  23. Xu, N.; Klein, J.M.; Huang, P.; Alwusaydi, H.A.; Mann, E.K.; Gurkan, B.E. Improved accessibility of porous carbon electrodes with surfactant ionic liquids for supercapacitors. J. Appl. Electrochem. 2019, 49, 151–162. [Google Scholar] [CrossRef]
  24. Perdana, M.Y.; Johan, B.A.; Abdallah, M.; Hossain, M.E.; Aziz, M.A.; Baroud, T.N.; Drmosh, Q.A. Understanding the Behavior of Supercapacitor Materials via Electrochemical Impedance Spectroscopy: A Review. Chem. Rec. 2024, 24, e202400007. [Google Scholar] [CrossRef] [PubMed]
  25. Chan, H.S.; Dickinson, E.J.; Heins, T.P.; Park, J.; Gaberšček, M.; Lee, Y.Y.; Heinrich, M.; Ruiz, V.; Napolitano, E.; Kauranen, P.; et al. Comparison of methodologies to estimate state-of-health of commercial Li-ion cells from electrochemical frequency response data. J. Power Sources 2022, 542, 231814. [Google Scholar] [CrossRef]
  26. Al-Zubaidi R-Smith, N.; Leitner, M.; Alic, I.; Toth, D.; Kasper, M.; Romio, M.; Surace, Y.; Jahn, M.; Kienberger, F.; Ebner, A.; et al. Assessment of lithium ion battery ageing by combined impedance spectroscopy, functional microscopy and finite element modelling. J. Power Sources 2021, 512, 230459. [Google Scholar] [CrossRef]
  27. Sánchez-Romate, X.F.; Del Bosque, A.; Artigas-Arnaudas, J.; Muñoz, B.K.; Sánchez, M.; Ureña, A. A proof of concept of a structural supercapacitor made of graphene coated woven carbon fibers: EIS study and mechanical performance. Electrochim. Acta 2021, 370, 137746. [Google Scholar] [CrossRef]
  28. Catelani, M.; Ciani, L.; Corti, F.; Laschi, M.; Patrizi, G.; Reatti, A.; Vangi, D. Experimental Characterization of Hybrid Supercapacitor Under Different Operating Conditions Using EIS Measurements. IEEE Trans. Instrum. Meas. 2024, 73, 1–10. [Google Scholar] [CrossRef]
  29. Kötz, R.; Hahn, M.; Gallay, R. Temperature behavior and impedance fundamentals of supercapacitors. J. Power Sources 2006, 154, 550–555. [Google Scholar] [CrossRef]
  30. Meddings, N.; Heinrich, M.; Overney, F.; Lee, J.-S.; Ruiz, V.; Napolitano, E.; Seitz, S.; Hinds, G.; Raccichini, R.; Gaberšček, M.; et al. Application of electrochemical impedance spectroscopy to commercial Li-ion cells: A review. J. Power Sources 2020, 480, 228742. [Google Scholar] [CrossRef]
  31. Kasper, M.; Leike, A.; Thielmann, J.; Winkler, C.; Al-Zubaidi R-Smith, N.; Kienberger, F. Electrochemical impedance spectroscopy error analysis and round robin on dummy cells and lithium-ion-batteries. J. Power Sources 2022, 536, 231407. [Google Scholar] [CrossRef]
  32. Burt, R.; Birkett, G.; Zhao, X.S. A review of molecular modelling of electric double layer capacitors. Phys. Chem. Chem. Phys. 2014, 16, 6519–6538. [Google Scholar] [CrossRef] [PubMed]
  33. Georgi, N.; Kornyshev, A.A.; Fedorov, M.V. The anatomy of the double layer and capacitance in ionic liquids with anisotropic ions: Electrostriction vs. lattice saturation. J. Electroanal. Chem. 2010, 649, 261–267. [Google Scholar] [CrossRef]
  34. Jiang, X.; Huang, J.; Zhao, H.; Sumpter, B.G.; Qiao, R. Dynamics of electrical double layer formation in room-temperature ionic liquids under constant-current charging conditions. J. Phys. Condens. Matter 2014, 26, 284109. [Google Scholar] [CrossRef]
  35. Merlet, C.; Rotenberg, B.; Madden, P.A.; Taberna, P.-L.; Simon, P.; Gogotsi, Y.; Salanne, M. On the molecular origin of supercapacitance in nanoporous carbon electrodes. Nat. Mater. 2012, 11, 306–310. [Google Scholar] [CrossRef] [PubMed]
  36. Højgaard Olesen, L.; Bazant, M.Z.; Bruus, H. Strongly nonlinear dynamics of electrolytes in large ac voltages. Phys. Rev. E Stat. Nonlin. Soft Matter Phys. 2010, 82, 11501. [Google Scholar] [CrossRef] [PubMed]
  37. Pilon, L.; Wang, H.; d’Entremont, A. Recent Advances in Continuum Modeling of Interfacial and Transport Phenomena in Electric Double Layer Capacitors. J. Electrochem. Soc. 2015, 162, A5158–A5178. [Google Scholar] [CrossRef]
  38. Satpathy, S.; Misra, N.K.; Shukla, D.k.; Goyal, V.; Bhattacharyya, B.K.; Yadav, C.S. An in-depth study of the electrical characterization of supercapacitors for recent trends in energy storage system. J. Energy Storage 2023, 57, 106198. [Google Scholar] [CrossRef]
  39. Maria Lozito, G.; Intravaia, M.; Corti, F.; Patrizi, G.; Laschi, M.; Ciani, L.; Vangi, D.; Reatti, A. Equivalent Circuit Modelling of Hybrid Supercapacitors Through Experimental Spectroscopic Measurements. IEEE Access 2024, 12, 78449–78462. [Google Scholar] [CrossRef]
  40. Wang, H.; Pilon, L. Intrinsic limitations of impedance measurements in determining electric double layer capacitances. Electrochim. Acta 2012, 63, 55–63. [Google Scholar] [CrossRef]
  41. Lian, C.; Jiang, D.; Liu, H.; Wu, J. A Generic Model for Electric Double Layers in Porous Electrodes. J. Phys. Chem. C 2016, 120, 8704–8710. [Google Scholar] [CrossRef]
  42. Mei, B.-A.; Munteshari, O.; Lau, J.; Dunn, B.; Pilon, L. Physical Interpretations of Nyquist Plots for EDLC Electrodes and Devices. J. Phys. Chem. C 2018, 122, 194–206. [Google Scholar] [CrossRef]
  43. Aderyani, S.; Flouda, P.; Shah, S.A.; Green, M.J.; Lutkenhaus, J.L.; Ardebili, H. Simulation of cyclic voltammetry in structural supercapacitors with pseudocapacitance behavior. Electrochim. Acta 2021, 390, 138822. [Google Scholar] [CrossRef]
  44. Mei, B.-A.; Lau, J.; Lin, T.; Tolbert, S.H.; Dunn, B.S.; Pilon, L. Physical Interpretations of Electrochemical Impedance Spectroscopy of Redox Active Electrodes for Electrical Energy Storage. J. Phys. Chem. C 2018, 122, 24499–24511. [Google Scholar] [CrossRef]
  45. Verbrugge, M.W.; Liu, P. Microstructural Analysis and Mathematical Modeling of Electric Double-Layer Supercapacitors. J. Electrochem. Soc. 2005, 152, D79. [Google Scholar] [CrossRef]
  46. Allu, S.; Velamur Asokan, B.; Shelton, W.A.; Philip, B.; Pannala, S. A generalized multi-dimensional mathematical model for charging and discharging processes in a supercapacitor. J. Power Sources 2014, 256, 369–382. [Google Scholar] [CrossRef]
  47. Kroupa, M.; Offer, G.J.; Kosek, J. Modelling of Supercapacitors: Factors Influencing Performance. J. Electrochem. Soc. 2016, 163, A2475–A2487. [Google Scholar] [CrossRef]
  48. Al-Zubaidi R-Smith, N.; Kasper, M.; Kumar, P.; Nilsson, D.; Mårlid, B.; Kienberger, F. Advanced Electrochemical Impedance Spectroscopy of Industrial Ni-Cd Batteries. Batteries 2022, 8, 50. [Google Scholar] [CrossRef]
  49. Drummond, R.; Howey, D.A.; Duncan, S.R. Low-order mathematical modelling of electric double layer supercapacitors using spectral methods. J. Power Sources 2015, 277, 317–328. [Google Scholar] [CrossRef]
  50. Béguin, F.; Frąckowiak, E. (Eds.) Supercapacitors: Materials, Systems, and Applications; Wiley-VCH: Weinheim, Germany, 2013; ISBN 9783527646661. [Google Scholar]
  51. Wang, H.; Pilon, L. Physical interpretation of cyclic voltammetry for measuring electric double layer capacitances. Electrochim. Acta 2012, 64, 130–139. [Google Scholar] [CrossRef]
  52. Rahim, A.H.A.; Ramli, N.; Nordin, A.N.; Wahab, M.F.A. Supercapacitor performance with activated carbon and graphene nanoplatelets composite electrodes, and insights from the equivalent circuit model. Carbon Trends 2021, 5, 100101. [Google Scholar] [CrossRef]
  53. Lehtimäki, S.; Suominen, M.; Damlin, P.; Tuukkanen, S.; Kvarnström, C.; Lupo, D. Preparation of Supercapacitors on Flexible Substrates with Electrodeposited PEDOT/Graphene Composites. ACS Appl. Mater. Interfaces 2015, 7, 22137–22147. [Google Scholar] [CrossRef] [PubMed]
  54. Yu, L.; Chen, G.Z. Ionic Liquid-Based Electrolytes for Supercapacitor and Supercapattery. Front. Chem. 2019, 7, 272. [Google Scholar] [CrossRef] [PubMed]
  55. Tõnurist, K.; Thomberg, T.; Jänes, A.; Romann, T.; Sammelselg, V.; Lust, E. Influence of separator properties on electrochemical performance of electrical double-layer capacitors. J. Electroanal. Chem. 2013, 689, 8–20. [Google Scholar] [CrossRef]
Figure 1. From calibrated impedance measurements to physics-based performance evaluation. (a) EIS hardware, fixture wiring, and accuracy: (Left) Four-wire connection scheme with twisted force and sense terminals for improved measurement precision, (Right) EIS measurement error model and workflow. The measurement process is modeled as an ideal impedance meter combined with a series error impedance and a gain error term. The measured impedance is expressed as the true impedance modified by a complex gain factor and a series offset. (b) Schematic visualization of the EDLC cell, (c) one-dimensional representation of the FE model, and (d) Nyquist plot of EIS curve with relevant frequency ranges and associated electrochemical processes.
Energies 18 01450 g001
Figure 2. Calibrated impedance spectrum for a frequency range of 10 mHz to 10 kHz (Nyquist plot representation), measured at 23 °C for three open-circuit voltage (OCV) levels: 0.7 V, 1.5 V, and 2 V. The data include graphene-based cells (Cell G1, panel (a); Cell G2, panel (b) and activated carbon-based cells Cell AC1, panel (c); Cell AC2, panel (d)). Panel (e) displays the overlay of impedance spectra for all four cells at an OCV of 1.5 V. Panel (f) compares the overlaid spectra of the two cell types across all three OCV levels, emphasizing variations in low-frequency impedance characteristics between the electrode materials.
Energies 18 01450 g002
Figure 3. Cyclic voltammetry (CV) profiles for two-electrode systems measured at scan rates from 10 mV/s to 200 mV/s, illustrating the electrochemical performance of (a) activated carbon-based cells and (b) graphene-based cells. The profiles highlight the variations in current response and capacitance behavior with increasing scan rates for both electrode materials.
Energies 18 01450 g003
Figure 4. FEM results of the SC model with parameters in Table 1. (a) Simulated CV showing the characteristic rectangular shape at different scan rates, (b) capacitance curve calculated by Equation (13) indicating scan rate dependency, (c) simulated EIS curves optimized with G1 data with D0 = 1.75 × 10⁻¹³ m2/s, a = 2.75 × 10⁷ 1/m, Γ = 15, and Γs = 4.08 showing the voltage independency response and (d) appearing in the equilibrium capacitance region at lower frequencies which turn the curve into a vertical line.
Energies 18 01450 g004
Figure 5. Effect of electrical double-layer (EDL) cell transport properties on CV and EIS responses, with all other parameters held constant as detailed in Table 1. Panels (a,b) show the influence of the diffusion coefficient, while panels (c,d) highlight the effect of separator tortuosity. Panels (e,f) demonstrate the impact of electrode tortuosity on the CV and EIS profiles.
Energies 18 01450 g005
Figure 6. Comparison of FEM simulation results with experimental measurements to investigate the structural effects on the EIS response of carbon electrodes. Panel (a) shows the simulated EIS curve optimized using G1 cell data over a frequency range of 10 kHz to 1 mHz, with good agreement in the semicircle region but deviations in the Warburg and low-frequency regions due to complex ion–pore interactions. Panel (b) presents the optimized simulated EIS curve for G1 cell data over a frequency range of 10 kHz to 10 mHz, with a good match across the entire frequency range. Panel (c) compares the simulated EIS response with experimental data for G2 and AC2 cells (10 kHz to 10 mHz), where the semicircle regions align well, while the experimental Warburg region is steeper.
Energies 18 01450 g006
Table 1. Geometry and materials parameters used in the FEM.
ParameterSymbolUnitValueReference
Separator thicknessLsµm50
Electrode thicknessLeµm95
Electrode nominal surfaceSm20.06–0.2
Electrode porosityε-0.67
Electrode tortuositye-1–20
Separator porosityεsp-0.7
Separator tortuositysp-1–10
Specific surface areaa1/m1–10 × 107
Stern layer thicknessλsNm0.4[54]
Relative permittivityϵr 36[47]
Initial electrolyte concentrationc(0,x)mol/m33000
Electrode conductivityσS/m0.001–1[47,49]
Bulk diffusion coefficientD0m2/s 5 × 10 14 1 × 10⁻¹³
Disclaimer/Publisher’s Note: The statements, opinions and data contained in all publications are solely those of the individual author(s) and contributor(s) and not of MDPI and/or the editor(s). MDPI and/or the editor(s) disclaim responsibility for any injury to people or property resulting from any ideas, methods, instructions or products referred to in the content.

