Article

Thermal Energy Storage Possibilities in the Composite Trombe Wall Modified with a Phase Change Material

by
Joanna Krasoń
*,
Przemysław Miąsik
,
Aleksander Starakiewicz
and
Lech Lichołai
*
Department of Building Engineering, Rzeszow University of Technology, ul. Poznańska 2, 35-959 Rzeszów, Poland
*
Authors to whom correspondence should be addressed.
Energies 2025, 18(6), 1433; https://doi.org/10.3390/en18061433
Submission received: 31 January 2025 / Revised: 11 March 2025 / Accepted: 12 March 2025 / Published: 14 March 2025

Abstract

:
Energy savings issues are important in the context of building operation. An interesting solution for the southern external walls of the building envelope is the thermal storage wall (TSW), also known as the Trombe wall. The article considers four variants of the wall structure, including three containing phase change material (PCM). The purpose of this study was to determine the influence of the amount and location of phase change material in the masonry layer on the storage and flow of heat through the barrier. Each wall is equipped with a double-glazed external collector system with identical physical parameters. The research was carried out in specially dedicated testing stations in the form of external solar energy chambers, subjected to real climatic loads. The distribution of the heat flux density values was determined using experimental tests and was subjected to comparative analysis for the various variants considered using statistical analytical methods. A comparative analysis was performed between the heat flux density values obtained for each barrier in the assumed time interval from the one-year research period. The Kruskal–Wallis test and the median test were used for analyses performed in the Statistica 13.3 programme. The purpose of these analyses was to determine the occurrence of significant differences between individual heat flux flows through the barriers tested. The results obtained indicate that the use of PCM in thermal storage walls extends the time required to transfer the accumulated heat in the barrier to the internal environment while reducing the amplitude of the internal air temperature.

1. Introduction

Reducing the energy consumption used during building operation is necessary to achieve the assumptions of sustainable development. One way to achieve this goal is to use energy-efficient systems that improve the thermal balance of the building. The task of energy-efficient systems is both to obtain energy from renewable sources and to use and distribute it in the building. In the case where the energy security of a single building is considered, it is necessary to design energy acquisition and management systems in this building so that the building becomes as independent of external energy sources as possible. Among renewable energy sources, solar radiation energy offers the greatest possibilities in terms of its use in systems designed in a single building. Solar radiation energy can be obtained by using solutions in active or passive systems.
Active systems are solutions that allow for more controlled energy management but require an additional, external source of energy. The first of the active systems are solar collectors. They use photothermal conversion to convert solar radiation energy into heat. The heat obtained can be used to prepare hot utility water or can be used for hybrid building heating systems. Collector installations can be an additional local source of energy without the need to transmit it over long distances. This applies to all groups of buildings, from single-family and multi-family to public utility buildings [1].
Since domestic hot water is highest in the evening hours, it is worth designing large-capacity domestic hot water tanks in solar collector systems. Heat storage in the form of tanks has two basic advantages. First, it allows for the preparation of a larger amount of domestic hot water. Second, they protect the entire installation from overheating during periods of heat and the greatest solar radiation [2]. The efficiency of collector systems depends on the solutions used, not only the collector itself but also the entire system for obtaining and storing energy. Research is being conducted on modern solutions to improve the efficiency of collector systems [3,4].
The second group of active systems uses photoelectric conversion to convert solar radiation energy into electrical energy. The energy produced can be used as a source of heating or cooling, for preparing hot utility water, etc. If there is a need to use the electrical energy produced by photovoltaic cells in a time period other than that resulting from solar radiation, it is worth using energy storage in the installation. Research on such solutions is carried out in many countries [5,6]. Because of the integration of photovoltaic systems with energy storage, the energy produced during the day can be used in the evening when the demand for its use is the highest. Similarly to collector installations, photovoltaic installations can be a local source of energy obtained on site, significantly improving the energy balance in various types of buildings, for example, hospitals [7], infrastructure facilities [8], and others.
The main disadvantage of active systems is the necessity of using external energy sources for their proper functioning. In the absence of an energy supply from such sources, there is a risk that the active systems used do not function properly.
An alternative solution to active systems is passive systems, in which there is no need to use additional energy sources and external installations. In passive systems, solar energy is obtained by using an appropriate structure of building partitions. Due to the appropriate construction of the building partitions, it is possible to obtain solar radiation energy and transfer it to the interior of the building in the form of heat. The basic classification of passive systems divides them into the following two groups: direct gain systems and indirect gain systems.
The direct gain system consists of obtaining the energy of solar radiation that reaches the interior of the building through the glazed surfaces. On the surfaces of the internal partitions, solar radiation is converted into thermal energy, which remains in the room. The amount of energy obtained in this way depends to a large extent on the technical parameters and types of glazing, for example, the transmittance coefficient, the heat transfer coefficient, and the value of solar radiation. It should be remembered that selecting the appropriate type of glazing in the building combines several important functions, such as ensuring visual comfort, related to correct lighting, thermal comfort related to perceived temperature, and energy comfort, related to minimising energy consumption [9]. The advantage of direct systems is the rapid transfer of energy obtained from solar radiation to the room and a large percentage of solar radiation used in the form of thermal energy. The disadvantage of such systems is the high amplitude of the internal air temperature in the rooms. The heat flux supplied in the form of radiation is characterised by high intensity in short time intervals. This can ultimately lead to the problem of overheating the rooms [10], especially during high external air temperatures.
The indirect gain system operates in two stages. Solar radiation energy is not transferred directly to the room but additionally passes through the accumulation layer located behind the glazing. A classic example of an indirect gain system is the Trombe wall [11]. In a traditional structure, behind the glazing surface, there is an absorber whose task is to absorb as much solar radiation energy as possible and transfer it in the form of heat to the accumulation layer. The task of the accumulation layer is to store the acquired energy and transfer it over a longer period of time to the interior of the room. Therefore, the energy is transferred with a lower intensity but over a longer period of time. Due to such a distribution of the heat flux on the inner surface of the partition, we deal with a smaller amplitude of temperature changes in the adjacent room. An additional advantage of this solution is the phase shift, which results from the fact that energy in the form of heat needs time to pass through the accumulation layer. It is therefore delivered to the room during the night, when the outside air temperature is the lowest and the demand for thermal energy the highest. Therefore, the accumulation layer is a heat storage layer in such solutions.
Integrating technologies that store heat with building elements contributes to reducing peak loads, ensuring a more efficient management of energy used in buildings [12]. To increase the efficiency of passive storage systems, phase change materials (PCMs) can be used in the storage layer structure. Generally, these materials are used in both passive and active systems [13]. In passive systems, this material is most often applied by incorporating it into the partition structure.
The use of phase change materials in building partitions is intended to increase the heat storage capacity of structural and cladding elements. With low building inertia, that is, in lightweight frame structures, the use of PCM is worth considering. The introduction of PCM as an additional layer or its direct incorporation into the structure of the insulating material can improve the capacity of the wall accumulator and increase its inertia [14]. The use of the heat accumulation potential of building elements integrated with PCM reduces fluctuations in the temperature of indoor air, which improves thermal comfort in the rooms of the building and, at the same time, increases their energy efficiency. Due to the use of PCM in building partitions, the time to release stored heat in these elements can be extended, depending on the solution used, even up to 10 h [15]. In the case of massive partitions, their advantage is the high accumulation of heat, which stabilises the air temperature in the room adjacent to the partition. In the case of the use of PCM in the partition, the accumulated heat in the PCM is released during the occurrence of phase changes in a constant range of temperature values [16]. During phase changes, heat is absorbed or released naturally, which moderates temperature fluctuations in the surrounding environment [17].
Thermal energy storage (TES) is primarily due to latent heat (LHS), which occurs in the properties of a phase change material. Heat storage is related to phase changes occurring in the material, in contrast to sensible heat (SHS), which is linearly dependent on temperature. The advantage of LHS is the achievement of high storage efficiency in a narrow temperature range [18]. Latent heat is more efficient than sensible stored heat because it can provide 5 to 14 times more thermal energy per unit volume than materials with only SHS [19].
An important aspect in partition design is the selection of the right type of PCM. Compared to other types of PCM, organic materials have a high latent heat capacity, are non-toxic, and are biodegradable [20]. Among organic materials, paraffin is the most frequently chosen material for research analyses and practical use in the construction industry. The disadvantages of paraffin include a low thermal conductivity, which ranges from 0.15 W/(m·K) to 0.30 W/(m·K) [21]. The low thermal conductivity of PCM affects the rate of heat storage and discharge from the material. A significant problem with paraffins is their flammability, which affects the safety of building use. Incorporating these materials into building elements or non-flammable coatings can reduce the direct risk of ignition. However, paraffins also have positive features that are necessary to store heat obtained from various sources. From the chemical properties, PCM should be non-toxic and not react with the material it is contained in. Another important property of the PCM used is its stability during the melting and solidification cycles over a longer period of time [22]. An important feature of phase-change materials is their durability as a result of the long-term use of buildings. Research presented in the article [23] shows that the properties of PCM used in TSW, after several years of use, are stable and do not show deterioration of their technical characteristics, including unfavourable changes in the value of latent heat.
Paraffin waxes are chemically stable and adapted to work with metal containers (macroencapsulation). When using containers made of plastics, attention should be paid to the type of material from which it is made, due to the possibility of infiltration and softening of selected polymers [24]. Meeting all the appropriate parameters in one phase change material is very difficult. When selecting PCM for practical use, it is necessary to take into account the properties that will most favourably affect its efficiency while not reacting with the material in which it is incorporated. This paper presents the results of research on paraffin-modified TSW.
Another important element in the effective use of phase change materials is its appropriate location in the building element. Its location is determined by factors such as the purpose of use, the physical properties of PCM (latent heat, melting temperature), the amount of PCM, and the parameters of the building material in which it will be placed [25]. An important factor is also the influence of the environment, that is, the climatic conditions and parameters of the internal environment in which this solution will work.
An important issue of PCM use in construction is the method of its application in the structure of building elements. One of the most common methods used for construction applications is the encapsulation of phase change materials. The method consists of enclosing the PCM in a protective coating, usually a polymer coating, which protects against the external environment and also prevents the risk of leakage of the phase change material. The use of a coating can also control changes in the volume of the material, reduce the risk of PCM ignition, and improve the stability of phase change cycles. However, encapsulation can reduce PCM heat conduction [26]. Due to the size of the capsules and the associated amount of phase change material, the encapsulation method has been divided into the following three types [27]: macroencapsulation with a capsule size of >1000 μm, microencapsulation with capsule sizes of 1 μm to 1000 μm, and nanoencapsulation with capsule sizes of 1 nm to 1000 nm.
The advantage of the PCM macroencapsulation method (mcPCM) is the ability to use a larger amount of material. At the same time, during the phase change, there is a lower risk of a large change in volume, and the risk of PCM leakage is reduced [28]. Macroencapsules are most often used in external building elements, that is, walls or roof coverings, due to the direct contact of phase change material with external boundary conditions and the possibility of using solar radiation energy [16]. In wall masonry elements, ready-made holes are used primarily, where phase change material can be placed [29]. In order to obtain an increase in thermal efficiency in the case of external walls, placing PCM in the central part of their structure proved to be the most advantageous [30,31]. Gao et al. [32] also confirmed the most advantageous location of PCM in the central part of the ceramic block. Analysing the results of numerical simulations of heat flow through ceramic blocks, Mahdaoui et al. [33] confirmed the influence of PCM on the reduction in thermal amplitude and the appearance of a time change in heat flow through the partition. They also found that the higher the latent heat, the greater the accumulation benefits of the partition. They also showed that the melting temperature of PCM should be within the thermal comfort range.
In Trombe walls, the layer responsible for heat accumulation is most often a brick wall located behind the glazing. Modification of this layer with a phase change material allows one to increase the possibility of increased heat accumulation in this layer and then transfer it over a longer period of time to the adjacent room [34,35]. In the structures of building partitions, phase change materials can be placed in both vertical partitions [34] and other elements of building structures, for example, in roofs and flat roofs [36,37]. PCM applications for the collection of heat from the environment are also used in other technical solutions outside the field of construction [38].
This paper presents the results of tests on a thermal storage wall modified with phase change material. To place the phase change material in the partition structure, the macroencapsulation method was used, placing paraffin in plastic containers in the vertical spaces of holes in the structure of ceramic blocks. The aim of the paper is to compare the heat flux density values for different geometric and quantitative configurations of the phase change material incorporated into thermal storage walls. Most publications presenting comparative results of different PCM configurations in building partitions concern numerical simulations or laboratory tests performed in a short time interval. The analysis presented in the article concerns long-term experimental tests conducted simultaneously for all partition configurations presented under the same climatic conditions throughout the calendar year. The novelty of the research is the analysis of the heat flux flow simultaneously for several variants of TSW partitions modified with PCM (in relation to the reference partition), made in real dimensions and subjected to identical real loads of the external environment during long-term tests. The authors paid special attention to the analysis and determination of how the amount of added PCM and its location in the TSW affect the increase in the time of transfer of heat accumulated in the partition to the interior of the adjacent room and, as a result, the increase in energy gains from solar radiation.

2. Materials and Methods

2.1. Research Stand

Experimental studies of thermal storage walls were conducted in two solar chambers located on the premises of the Rzeszów University of Technology, in the southeast part of Poland. During the studies, there were no external elements around the chambers that could cause their shading. The chambers are located in a moderate climate; the geographical location is indicated by the following coordinates: N 50°01′ and E 21°58′. In the given location, the heating season occurs in the months from October to April. The research was carried out throughout the calendar year. Since the essence of the research was to determine the effect of PCM on extending the period of transfer of thermal energy obtained from solar radiation to the room, the article focused on the analysis of time intervals belonging to the heating season, in which there is a demand for such energy.
The external dimensions of each chamber were 4.0 m × 2.2 m × 3.5 m (length × width × height). The internal space of the chamber was divided by a partition wall, dividing the chambers into a research part and a technical part, in which heating devices (electric convector heater) and cooling devices (wall-mounted air conditioner) were installed (Figure 1a). Four variants of the thermal storage walls were located on the south side (Figure 1b).
During the research, climate parameters (solar radiation and air temperature) were measured. The weather station was located above the roof of one of the research chambers.
Data acquisition was performed with research equipment consisting of the following: Almemo 5690-1CPUTG8 stationary recorders and Almemo 2890-9 portable recorders (Ahlborn Mess- und Regelungstechnik GmbH, Holzkirchen, Germany) (Figure 2a); Almemo FTA3900 temperature sensors, that is, thermocouples insulated with glass fibre with a measurement range of minus 25 °C to plus 400 °C; and Almemo FQAD18T plate heat flow metres with dimensions of 120 mm × 120 mm × 1.5 mm, where the measuring surface was 90 mm × 90 mm (Figure 2b). The recorder sets were connected to portable computers, which allowed viewing and recording of measurement data (Figure 2a).
The air temperature in the solar chambers was controlled by a temperature controller connected to a heating or cooling device.

2.2. Materials

The thermal storage walls consisted of the following layers:
  • Masonry, made of slotted ceramic blocks filled with PCM and brick flour, depending on the variant.
  • Collector (collector frame and sets of insulating glass with assumed technical parameters).
In addition to the thermal storage wall modified with phase-change material, a reference partition was prepared in which there was no PCM. In all the partitions considered, the external collector was the same.

2.2.1. Wall Elements

A porous ceramic block with four rows of slots was used to make the wall layer. The block had the following dimensions: 262 mm (length), 248 mm (width), and 249 mm (height). Brick flour, or phase change material, was placed in the block slots in various configurations, depending on the research variant.
The ceramic blocks used in the tests had the following physical parameters: mass 10.921 kg; bulk density 702 kg/m3; specific heat 1.0 kJ/(kg K); thermal conductivity coefficient 0.266 W/m K; compressive strength 10.0 MPa.
For the purpose of conducting the tests, four variants of the wall layer were prepared, differing in the quantitative share and location of the phase change material:
  • Variant I (TSW-PCM1e)—one row of slots from the outside (1e) filled with PCM and the remaining slots filled with brick flour (Figure 3a).
  • Variant II (TSW-PCM2e)—two rows of slots from the outside (2e) filled with PCM and the remaining slots filled with brick flour (Figure 3b).
  • Variant III (TSW-PCM2c)—two middle rows of slots (2c) filled with PCM and the remaining slots filled with brick flour (Figure 3c).
  • Variant IV (TSW-noPCM)—all slots filled with brick flour, reference partition (Figure 3d).

2.2.2. Phase Change Material (PCM)

In this study, an organic phase change material (paraffin) RT25HC with a high latent heat capacity was used. Its capacity is higher by about 25–30% than traditional phase-change materials in the RT category. In addition, this paraffin was characterised by a narrow temperature range in the melting and solidification range and a limited volume change during the phase change [39].
The phase change material had the following physical parameters: melting region from 22 °C to 26 °C, solidification region from 26 °C to 22 °C, specific heat of 2.0 kJ/(kg∙K), thermal conductivity coefficient (both phases) of 0.2 W/(m∙K), heat of transformation (latent heat) of 230 ± 7.5% kJ/kg, and bulk density of 880 kg/m3 (solid state) and 770 kg/m3 (liquid state).
The gaps in the ceramic blocks were filled with phase change material in the construction laboratory prior to the process in the test chambers. To tightly fill the holes in the ceramic elements of the block with phase change material, we first placed polypropylene bags in the appropriate rows of blocks.

2.2.3. Brick Flour

To fill the gaps in the ceramic elements, waste material was used, that is, brick flour with a grain size of 0 to 2 mm. The purpose of using the flour was to increase the accumulation of thermal energy and reduce the thermal resistance in the gaps of the block.

2.2.4. Glazing Units

The G1 glazing unit was used for whose experimental tests; the properties are presented in Table 1. When selecting the types of glazing units, thermal insulation and the highest possible total transmittance of solar radiation energy “g” were taken into account.

2.3. Research Methodology

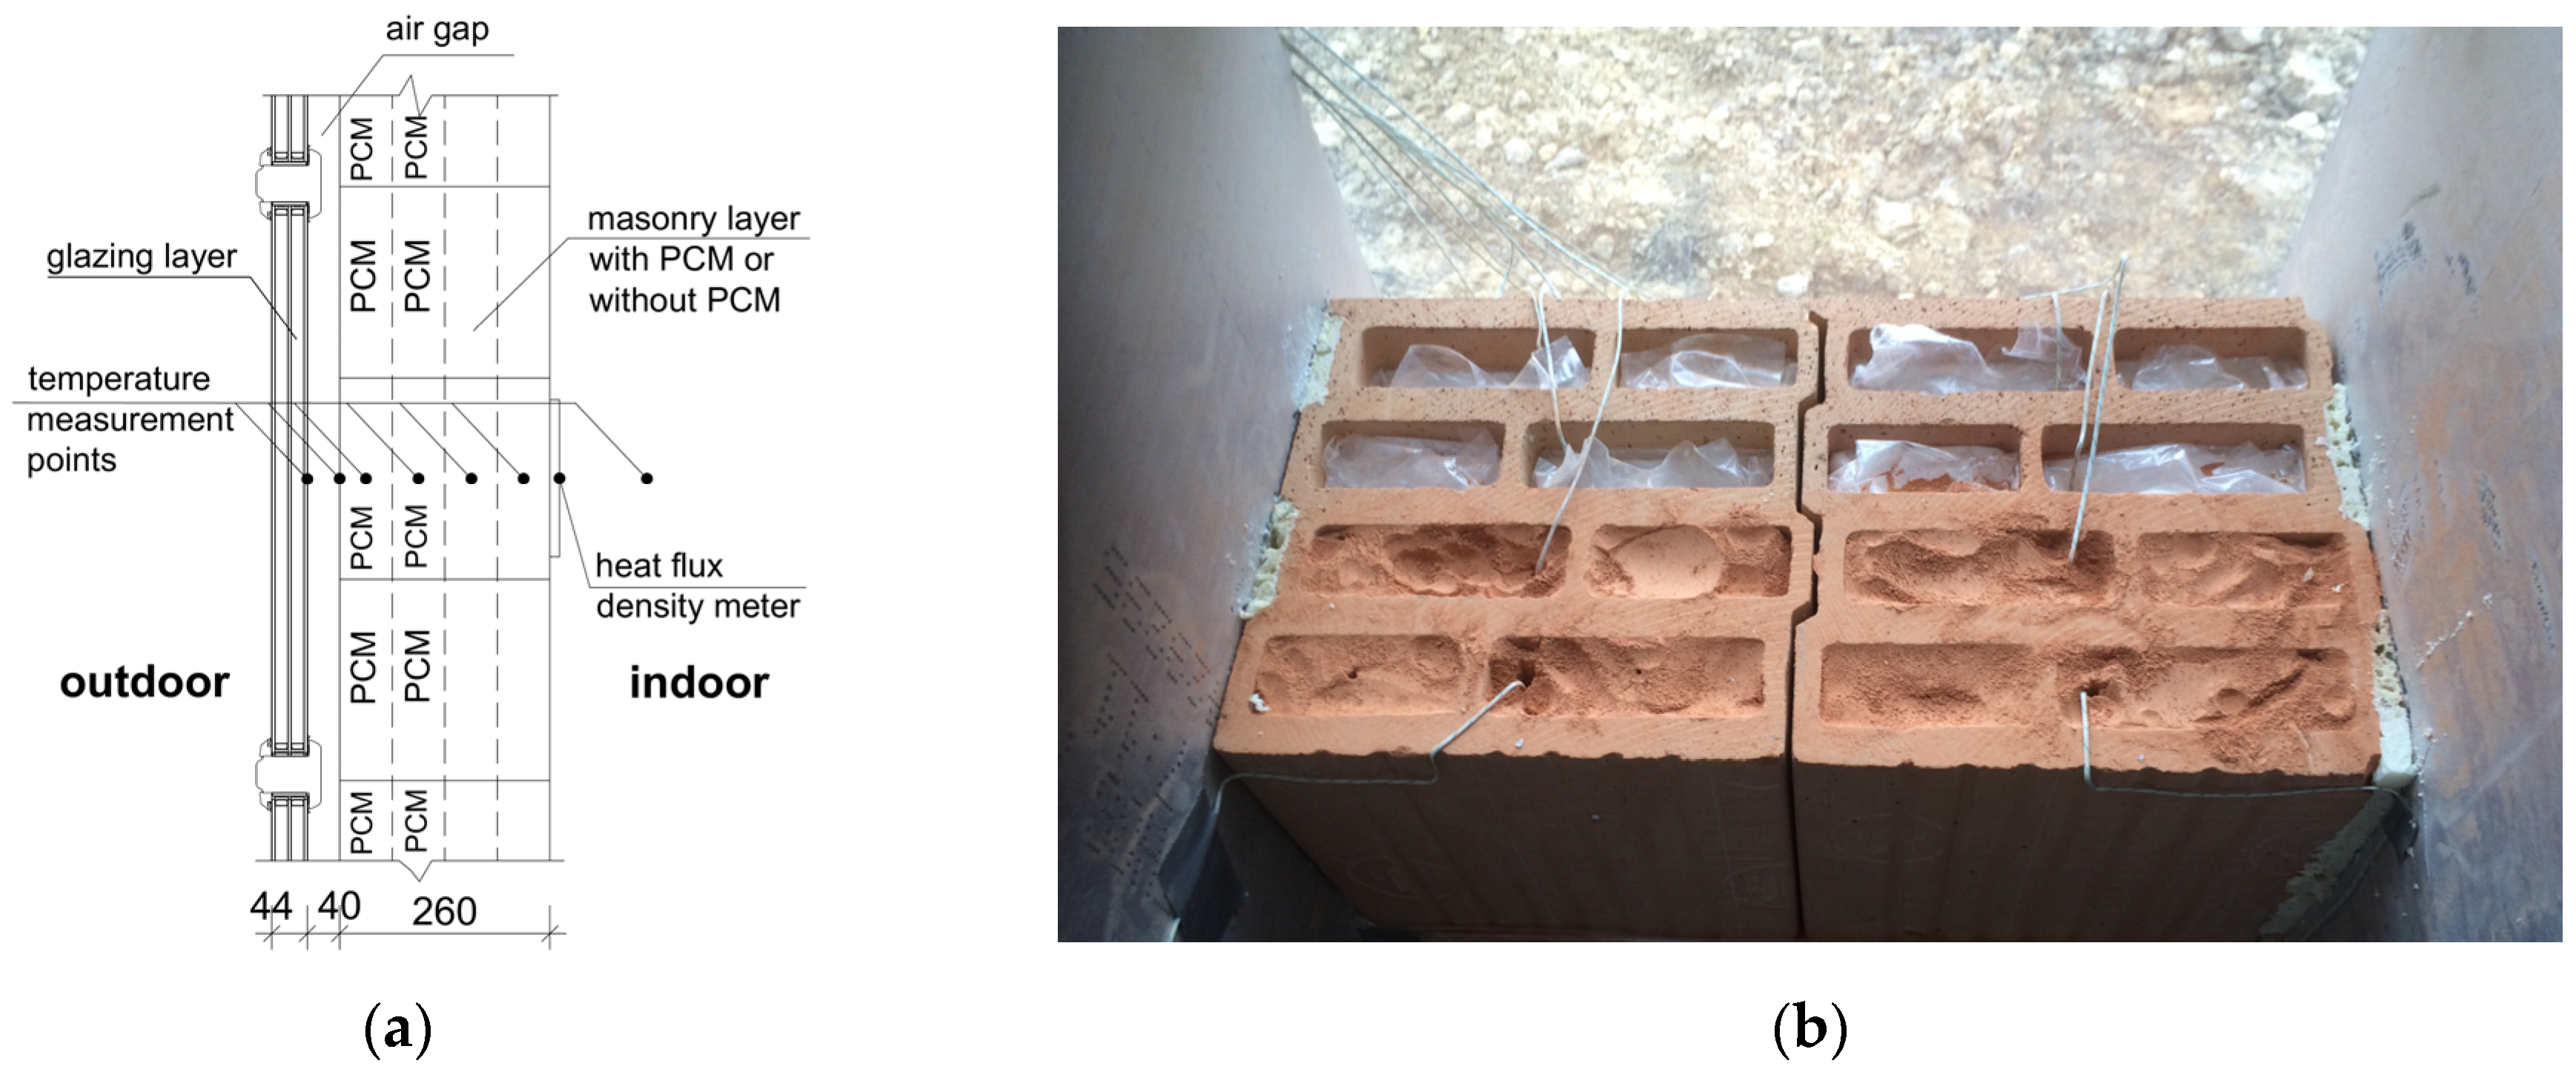
In each chamber, two analysed partitions were placed. In the first chamber, variants II and IV were placed, while in the second chamber, variants I and III were made. The dimensions of each partition were the same and amounted to 260 mm × 496 mm × 1743 mm (width × length × height). Figure 4 shows a diagram of the construction of the partition placed in the solar energy chamber.
In order to limit the mutual thermal impact of the partitions on the heat flow, a 200 mm thick extruded polystyrene (XPS) thermal insulation was placed between them. In addition, a 150 mm thick XPS thermal insulation layer was placed on the side of the external walls of the chamber. An additional 100 mm thick thermal insulation layer was also made below and above all the walls. The thermal insulation layers were extended to the collector frame and glazing to create separate air spaces in each of the tested walls. In this way, separate, independent heat flow conditions were created for each of the tested partitions.
After the wall was completed, the outer surface of the wall was painted black to increase the absorption of solar radiation energy by the absorber layer. There was a 40 mm air gap between the glazing and the absorber.
All variants of thermal storage walls were measured using thermocouples and heat flux density sensors described in Point 2.1. The thermocouples were placed on the surface of each partition layer. In the wall layer, temperature sensors were placed in all rows of ceramic block slots (Figure 5).
Plate heat flow metres were placed on the inner surface of the masonry layer. Sensors were attached using thermally conductive paste. Plate heat flow sensors were used to directly measure the heat flux density values on the inner surface of the partition. Measured values were recorded in a text file at a rate of one reading per five minutes.
The internal air temperature was recorded in the chambers. The temperature value was assumed to be 20 °C in both test chambers. Due to the stabilisation of the internal temperature, heat flow through each partition did not affect the heat flux density value of the adjacent wall. The internal air temperature was maintained by means of a temperature controller to which the heating and cooling devices and the internal air temperature sensor were connected. Data from all sensors were recorded at five minute intervals. During the tests, the values of total and direct solar radiation intensity and external air temperature were also recorded. The values of the meteorological parameters were also recorded at five-minute intervals. These values were averaged in the analyses to hourly values. The location of the chambers allowed for the same influence of external factors on each wall tested.

Analysis of Variance (ANOVA)—Kruskal–Wallis Test and Median Test

One of the statistical methods used in the analysis of the results is analysis of variance (ANOVA).
The purpose of this analysis is to investigate the significance of differences between multiple mean values of samples from multiple groups [40]. The results of observations in these groups can be, for example, the heat flux density values obtained in the analysed studies.
The results obtained may depend on one or more factors acting simultaneously. To use ANOVA tests in the analysis, four basic assumptions must be met.
  • Random variables are independent in the analysed groups.
  • The variables analysed in this study are measurable.
  • The distribution of variables in each analysed group is normal.
  • There is homogeneity (uniformity) of variance in all analysed groups.
If the above requirements are not met (the normal distribution or homogeneity of variance is not met), a nonparametric test should be used to compare mean values in multiple groups, including the nonparametric Kruskal–Wallis (K-W) test and the median test.
The condition for using the K-W test is to obtain the value of the explained (dependent) variable, measured on a scale of at least intervals in a continuous manner, and the independence of the obtained observations in the analysed groups. In the Kruskal–Wallis test, the comparison of observed values is performed on the sums of ranks, in contrast to the ANOVA test, in which values based on mean values or variances are used. Determining the rank consists of assigning a number of ordered measurements of a given observation according to their obtained values. In the case of repeated values of the studied observation, a tied rank is assigned. The same values are assigned the same rank, which is defined as the average of the subsequent rank numbers.
The Kruskal–Wallis test statistic, H, is given by Equation (1) [41] as follows:
H = 12 N N + 1 j = 1 k R j 2 n j 3 N + 1 ,
where
  • k—number of trials.
  • Rj—sum of ranks in the j-th trial.
  • nj—number of cases in the j-th trial.
  • N—number of cases in all combined trials.
In the case of tied ranks, an additional correction to Equation (1) should be included. Then, Equation (1) takes the form (2) [41] as follows:
H = 12 N N + 1 j = 1 k R j 2 n j 3 N + 1 / 1 T N 3 N ,
where
  • T = t3 − t.
  • t—number of cases occurring in the associated outcome group.
In the Kruskal–Wallis test, multiple comparisons are performed for the analysed groups. They consist of comparing the mean ranks for all pairs of samples. In the analysis, among other things, the probability levels p with the Bonferroni correction are determined for the two-sided test for each pair analysed that will be compared.
In addition to the K-W test, the analysis used the median test, which was used to characterise the data by comparing the obtained median values obtained from each observed group. Calculations are performed on the basis of a contingency table (cross table).
The starting point for the analysis was the values of the heat flux density measured on the inner surface of the wall layer of each partition. The value of heat flux density was marked with a “minus” (−) sign when the heat flow was toward the internal air and with a “plus” (+) sign when the heat flowed towards the external environment.
In selected time intervals, the heat flux density values were averaged to hourly values. All obtained heat flux density values, for each partition variant, were assigned to the observed group.
In the conducted studies, due to the impossibility of meeting all the conditions assumed for the ANOVA variance analysis (failure to obtain a normal distribution for individual groups of heat flux density values), a comparative analysis was performed between the heat flux density values obtained for each partition using the Kruskal–Wallis test and the median test in the Statistica 13.3 programme. The aim of the analysis was to determine the occurrence of significant differences between individual heat flux flows, that is, groups of heat flux density values occurring in each tested barrier. Note that the heat flux density value assumed as the initial value in a given period may be a value obtained from the preceding period and may partially affect the results in the analysed time period. This phenomenon particularly concerns TSW-PCM partitions.
For the assumed statistical analysis, the null hypothesis was adopted (3) as follows:
H 0 : q W I = q W I I = q W I I I = q W I V ,
qWi,j is the average rank determined on the basis of the heat flux density values of the analysed partition variants.
It is assumed that if there is a smaller number of ranks in the partition in the analysed time period, it means that the heat flow through the partition is more stable without significant unfavourable fluctuations. The alternative hypothesis H1 assumed that not all heat flux distributions of the tested partitions were the same, that is, the equation of the alternative hypothesis takes the following form (4):
H 1 : i , j I , , I V q W i q W j
The probability level p was assumed to be lower than the assumed significance level α = 0.05. A box-and-whisker plot and a categorised histogram were used to graphically present the results obtained. The box-and-whisker plot graphically presents the range of flux density value variability. The plots were made separately for all partitions. The categorised histogram enabled the analysis of the distribution of the obtained heat flux density values for each variant.

3. Results

Three time periods were selected for the analysis, which were characterised by high daytime sunshine in the first period, followed by a period of cloudiness with little or no sunshine. However, they differed in the number of sunny and cloudy days and the outside air temperature at night and during the day. The basis for selecting the time periods was the heating season, which in Poland starts on 1 October and ends on 30 April. It depends on the climatic conditions in a given calendar year and the energy characteristics of the building.

3.1. 23 November to 6 December

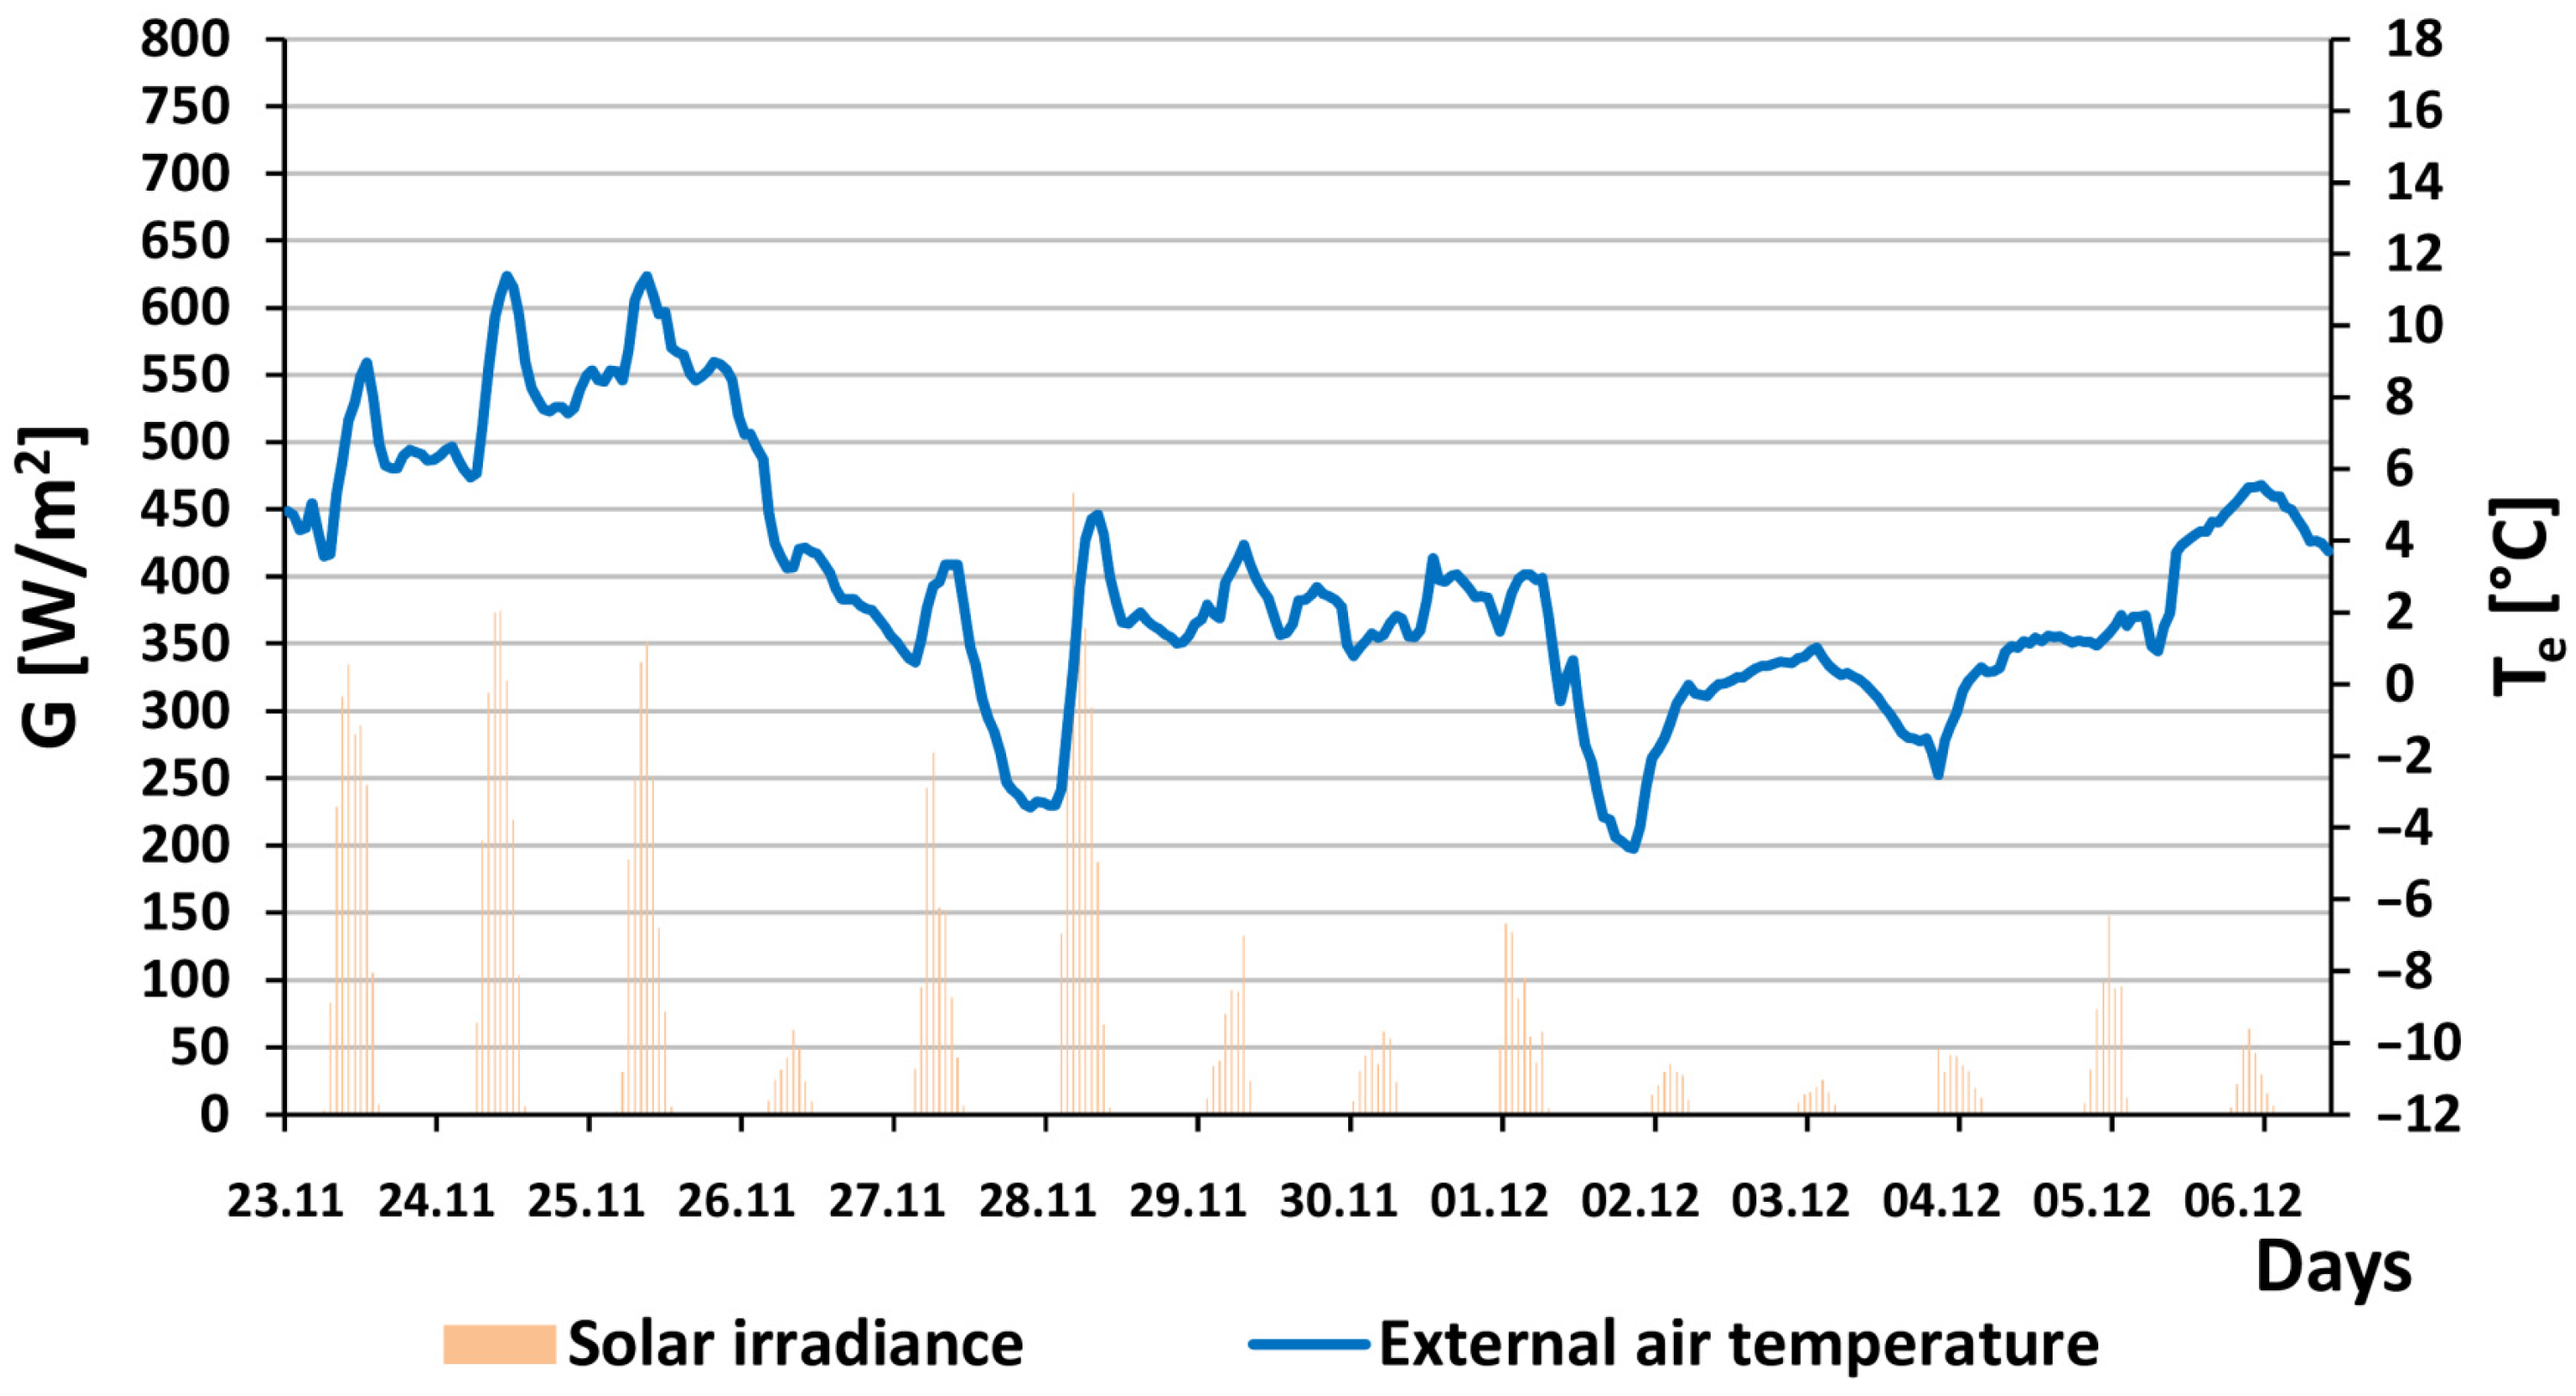
The first time interval adopted for the analysis was the period from 23 November to 6 December. Figure 6 shows the distribution of the total intensity of solar radiation G and the outdoor air temperature Te in the assumed research period. This interval was characterised by the greatest insolation in the first period (23–28 November), except for one day (26 November). In this period, the highest daily sum of total solar radiation intensity was 2249 W/(m2∙day). This period was followed by 8 cloudy days with low values of the intensity of solar radiation. The maximum outdoor air temperature in this time period was 11.4 °C, the minimum was −4.6 °C, and the average temperature was 2.8 °C.
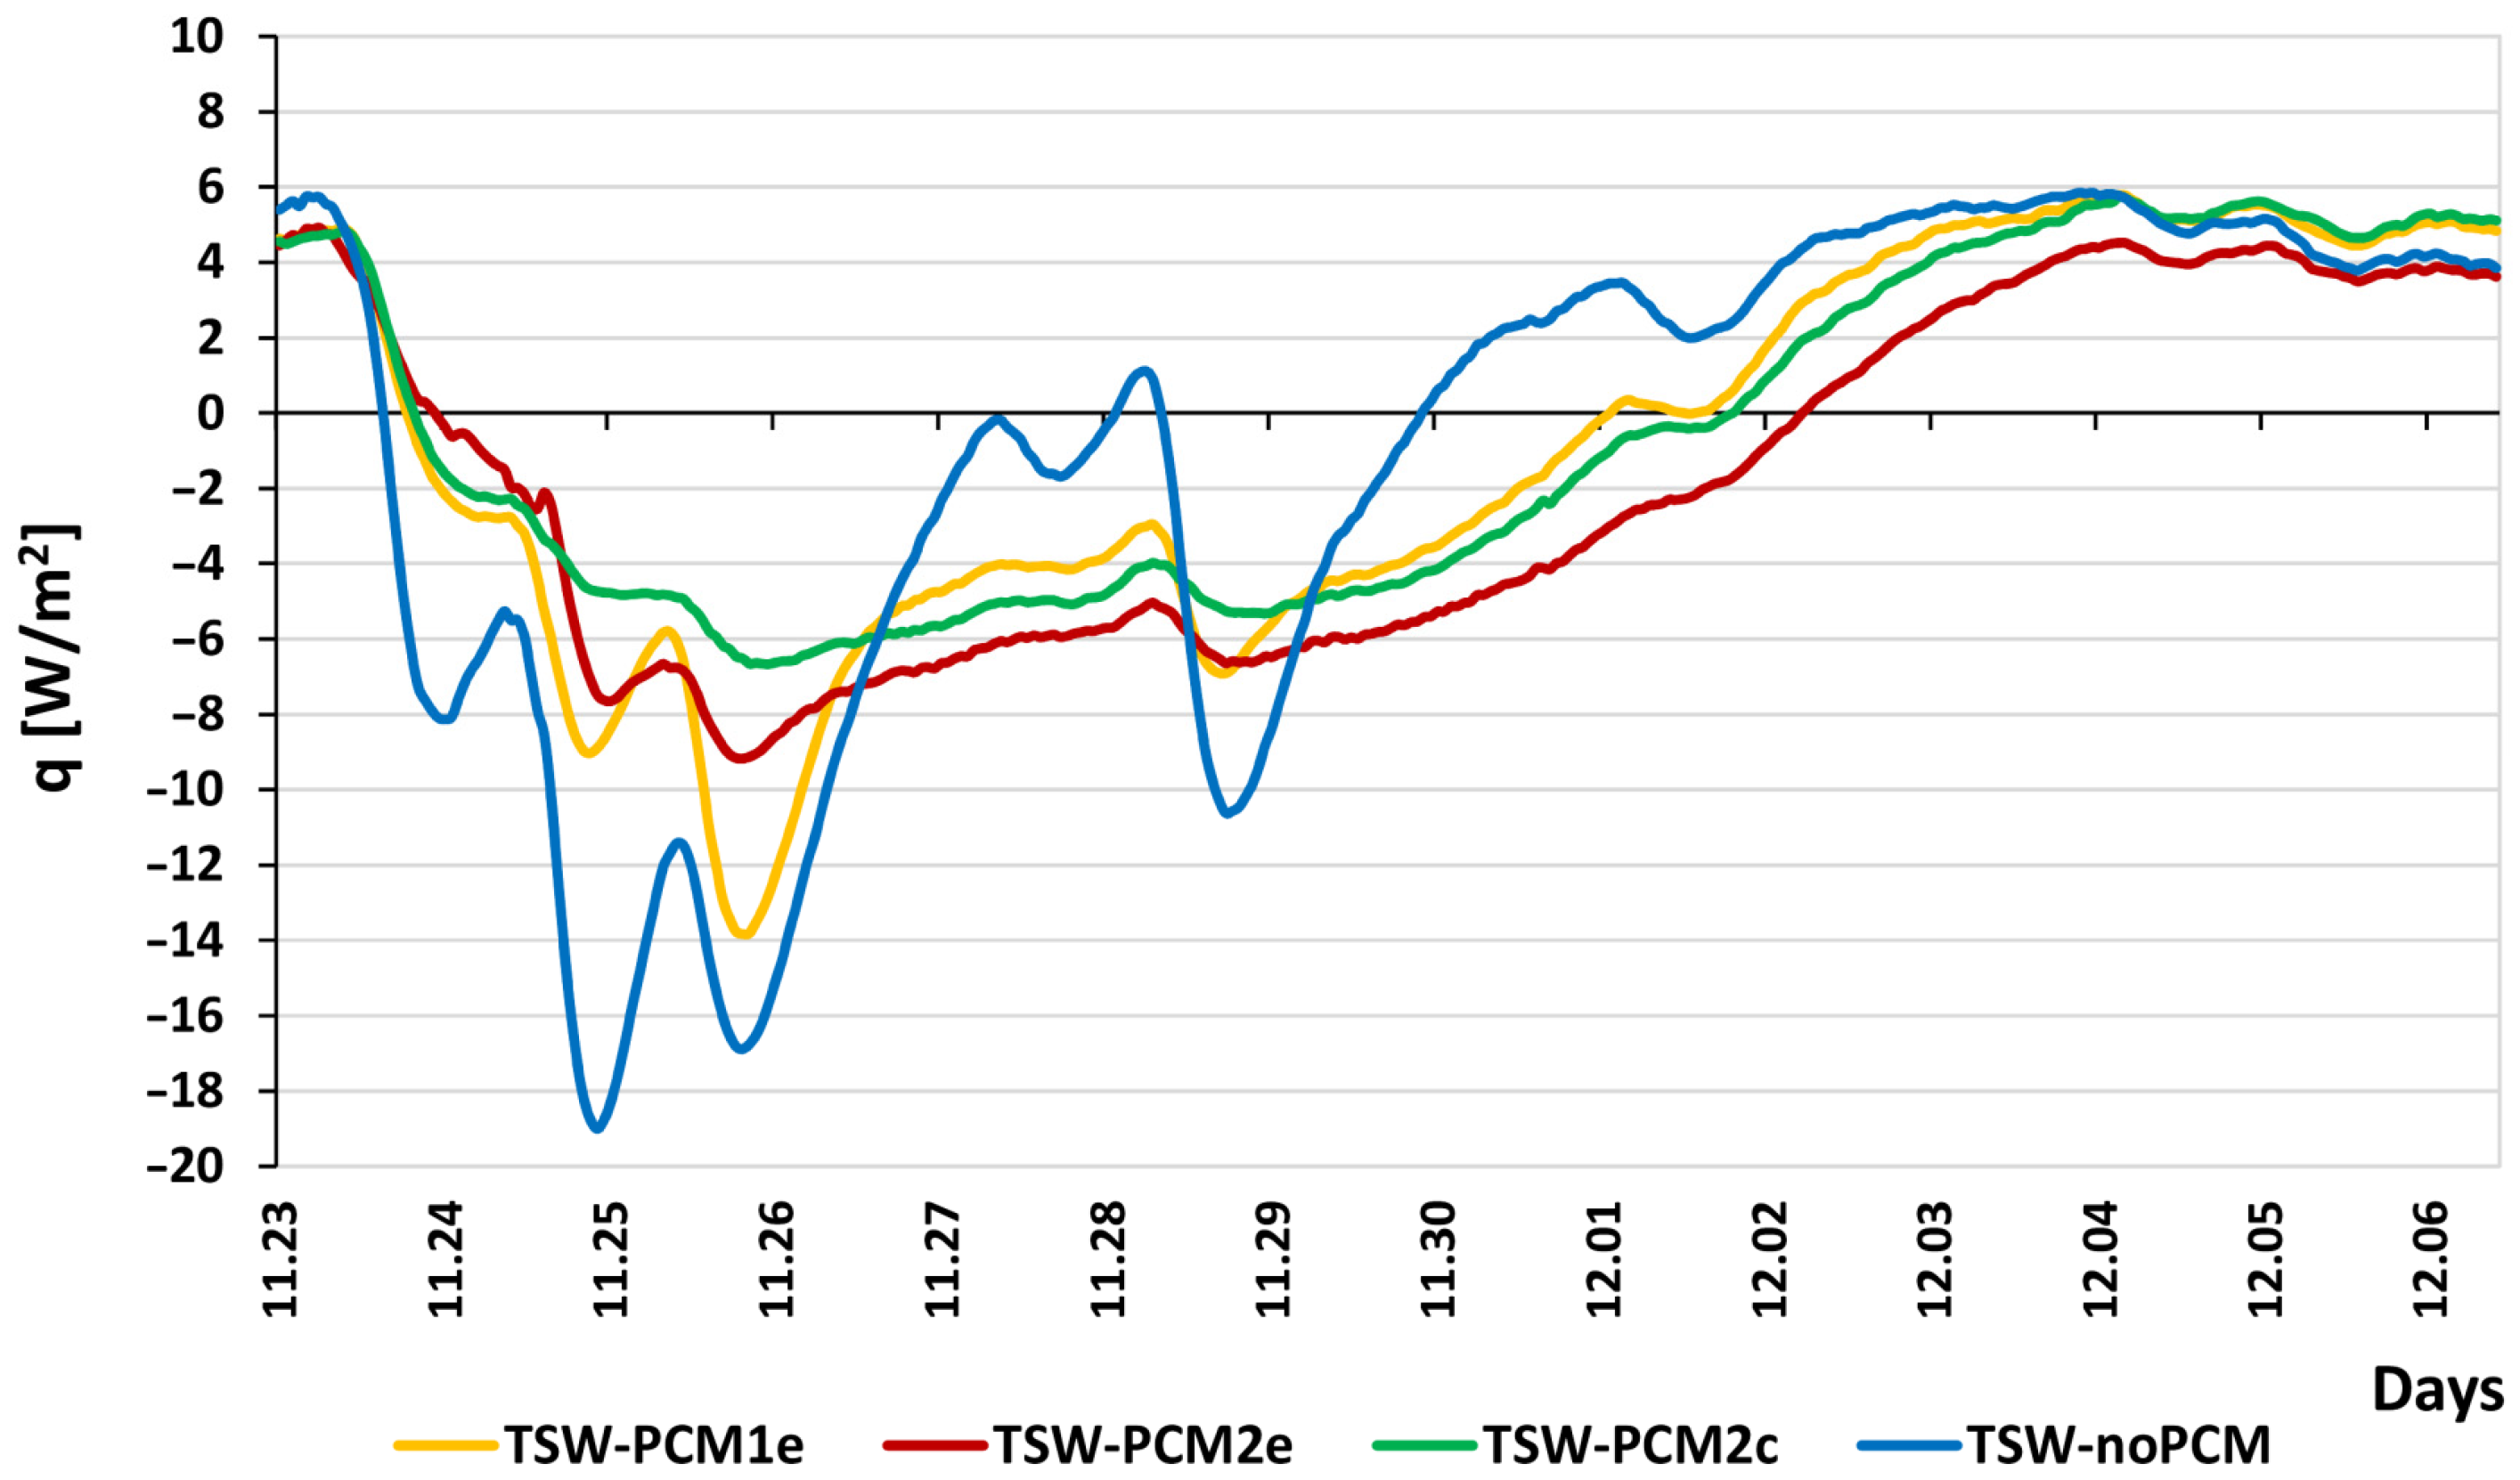
Figure 7 shows the heat flux density distribution for all partitions analysed. During sunny days, the highest heat flux density values were shown by the TSW-noPCM partition (variant IV). In partitions modified with PCM, the highest values appeared in variant I, due to the presence of the smallest amount of phase change material. This enabled the fastest heat flow to the inner surface of the partition. During cloudy days, the heat flux in variant IV changed the direction of the flow very quickly (changing the sign from negative to positive). In this partition, the time of heat release towards the internal environment was a maximum of one day. In the other partitions, the heat gains lasted from two to three days. They occurred the longest in the TSW-PCM2e partition.
In the statistical analysis, an interval was assumed in which both sunny and cloudy days occurred. It was noted that the initial values of the heat flux density were close to the final values in the selected time interval. During sunny days, there were visible differences in the distribution of heat flux for individual partitions.
Based on the analysis of the R rank results obtained from the Kruskal–Wallis test (Table 2), it was found that the greatest difference in heat flux flow occurred between the TSW-PCM2e partition and the other partitions.
The differences in the median values between the TSW-PCM walls were small and amounted to the following: for Variant I—1.66 W/m2, for Variant II—2.44 W/m2, and for Variant III—1.99 W/m2. For the TSW-noPCM partition, the median value was 1.93 W/m2 and was significantly different from the values of the walls for the TSW-PCM (Figure 8). The median value for this partition was positive, that is, the heat flow in this partition in more than 50% of the entire time period was directed towards the external environment.
The deviations of the maximum values for TSW-noPCM clearly showed significant fluctuations in the heat flux flow through the above partition. Large values of the maximum deviations also occurred in the TSW-PCM1e variant, and they differed significantly from the other TSW-PCM partitions.
The histograms created in Figure 9 show the categorised heat flux density values for individual partitions. The values in the TSW-PCM2e wall were distributed most evenly without significant outliers. In the remaining cases, the ranges varied. In the TSW-PCM2c variant, the most values appeared in the range from −4.0 to −6.0 W/m2 and in the range from 4.0 to 6.0 W/m2. The most unfavourable distribution of the heat flux density values was observed in the case of TSW-noPCM. These values occurred in the range from 2.0 to 6.0 W/m2, that is, the heat flow toward the outside air dominated. In the selected time period, the highest stability of the observed heat flux density values was demonstrated by TSW-PCM2e.

3.2. 17 to 25 February

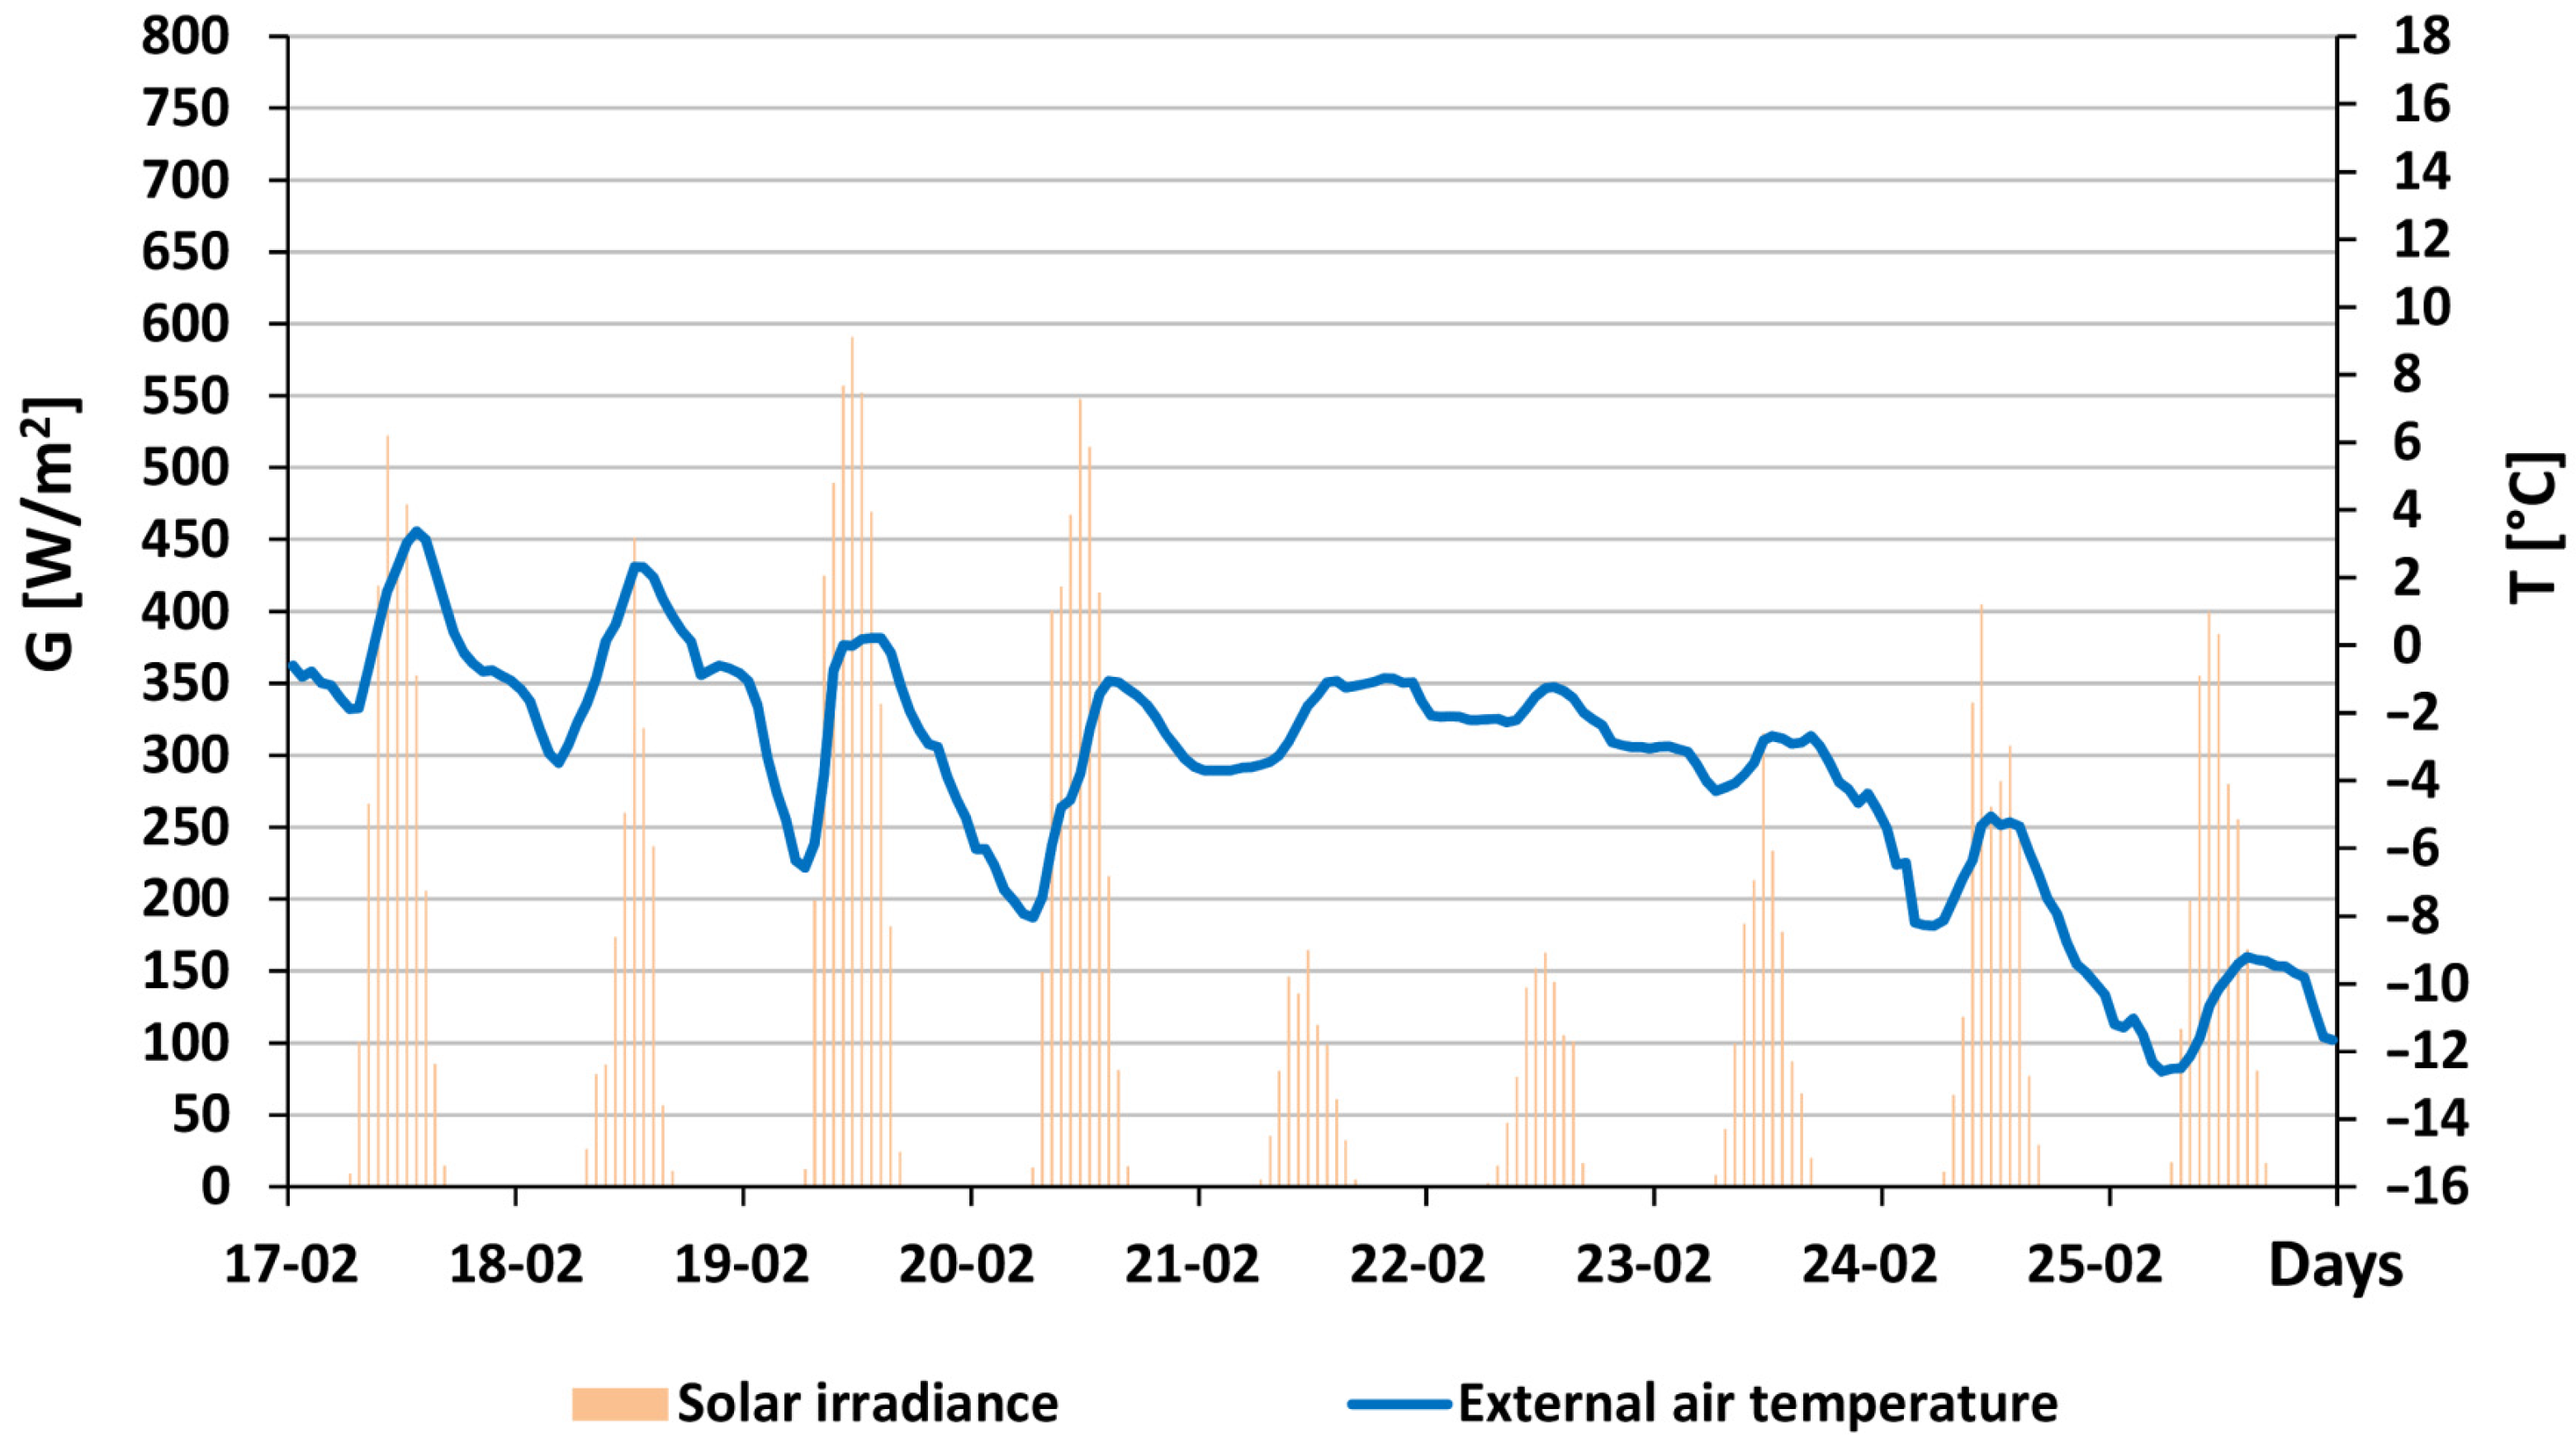
In February, the selected interval was characterised by four sunny days, in which the maximum daily sum of the total intensity of solar radiation was 3837 W/(m2∙day) (Figure 10). It was higher than the value obtained in the previous interval. Then, there were cloudy days with low solar radiation intensity values. In the last two days of the analysed interval, the insolation increased, and the value was about 2200 W/(m2∙day). It should be noted that during this period, the outside air temperature remained mostly below 0 °C. The minimum outside air temperature value was −12.6 °C, while the average temperature was −4 °C.
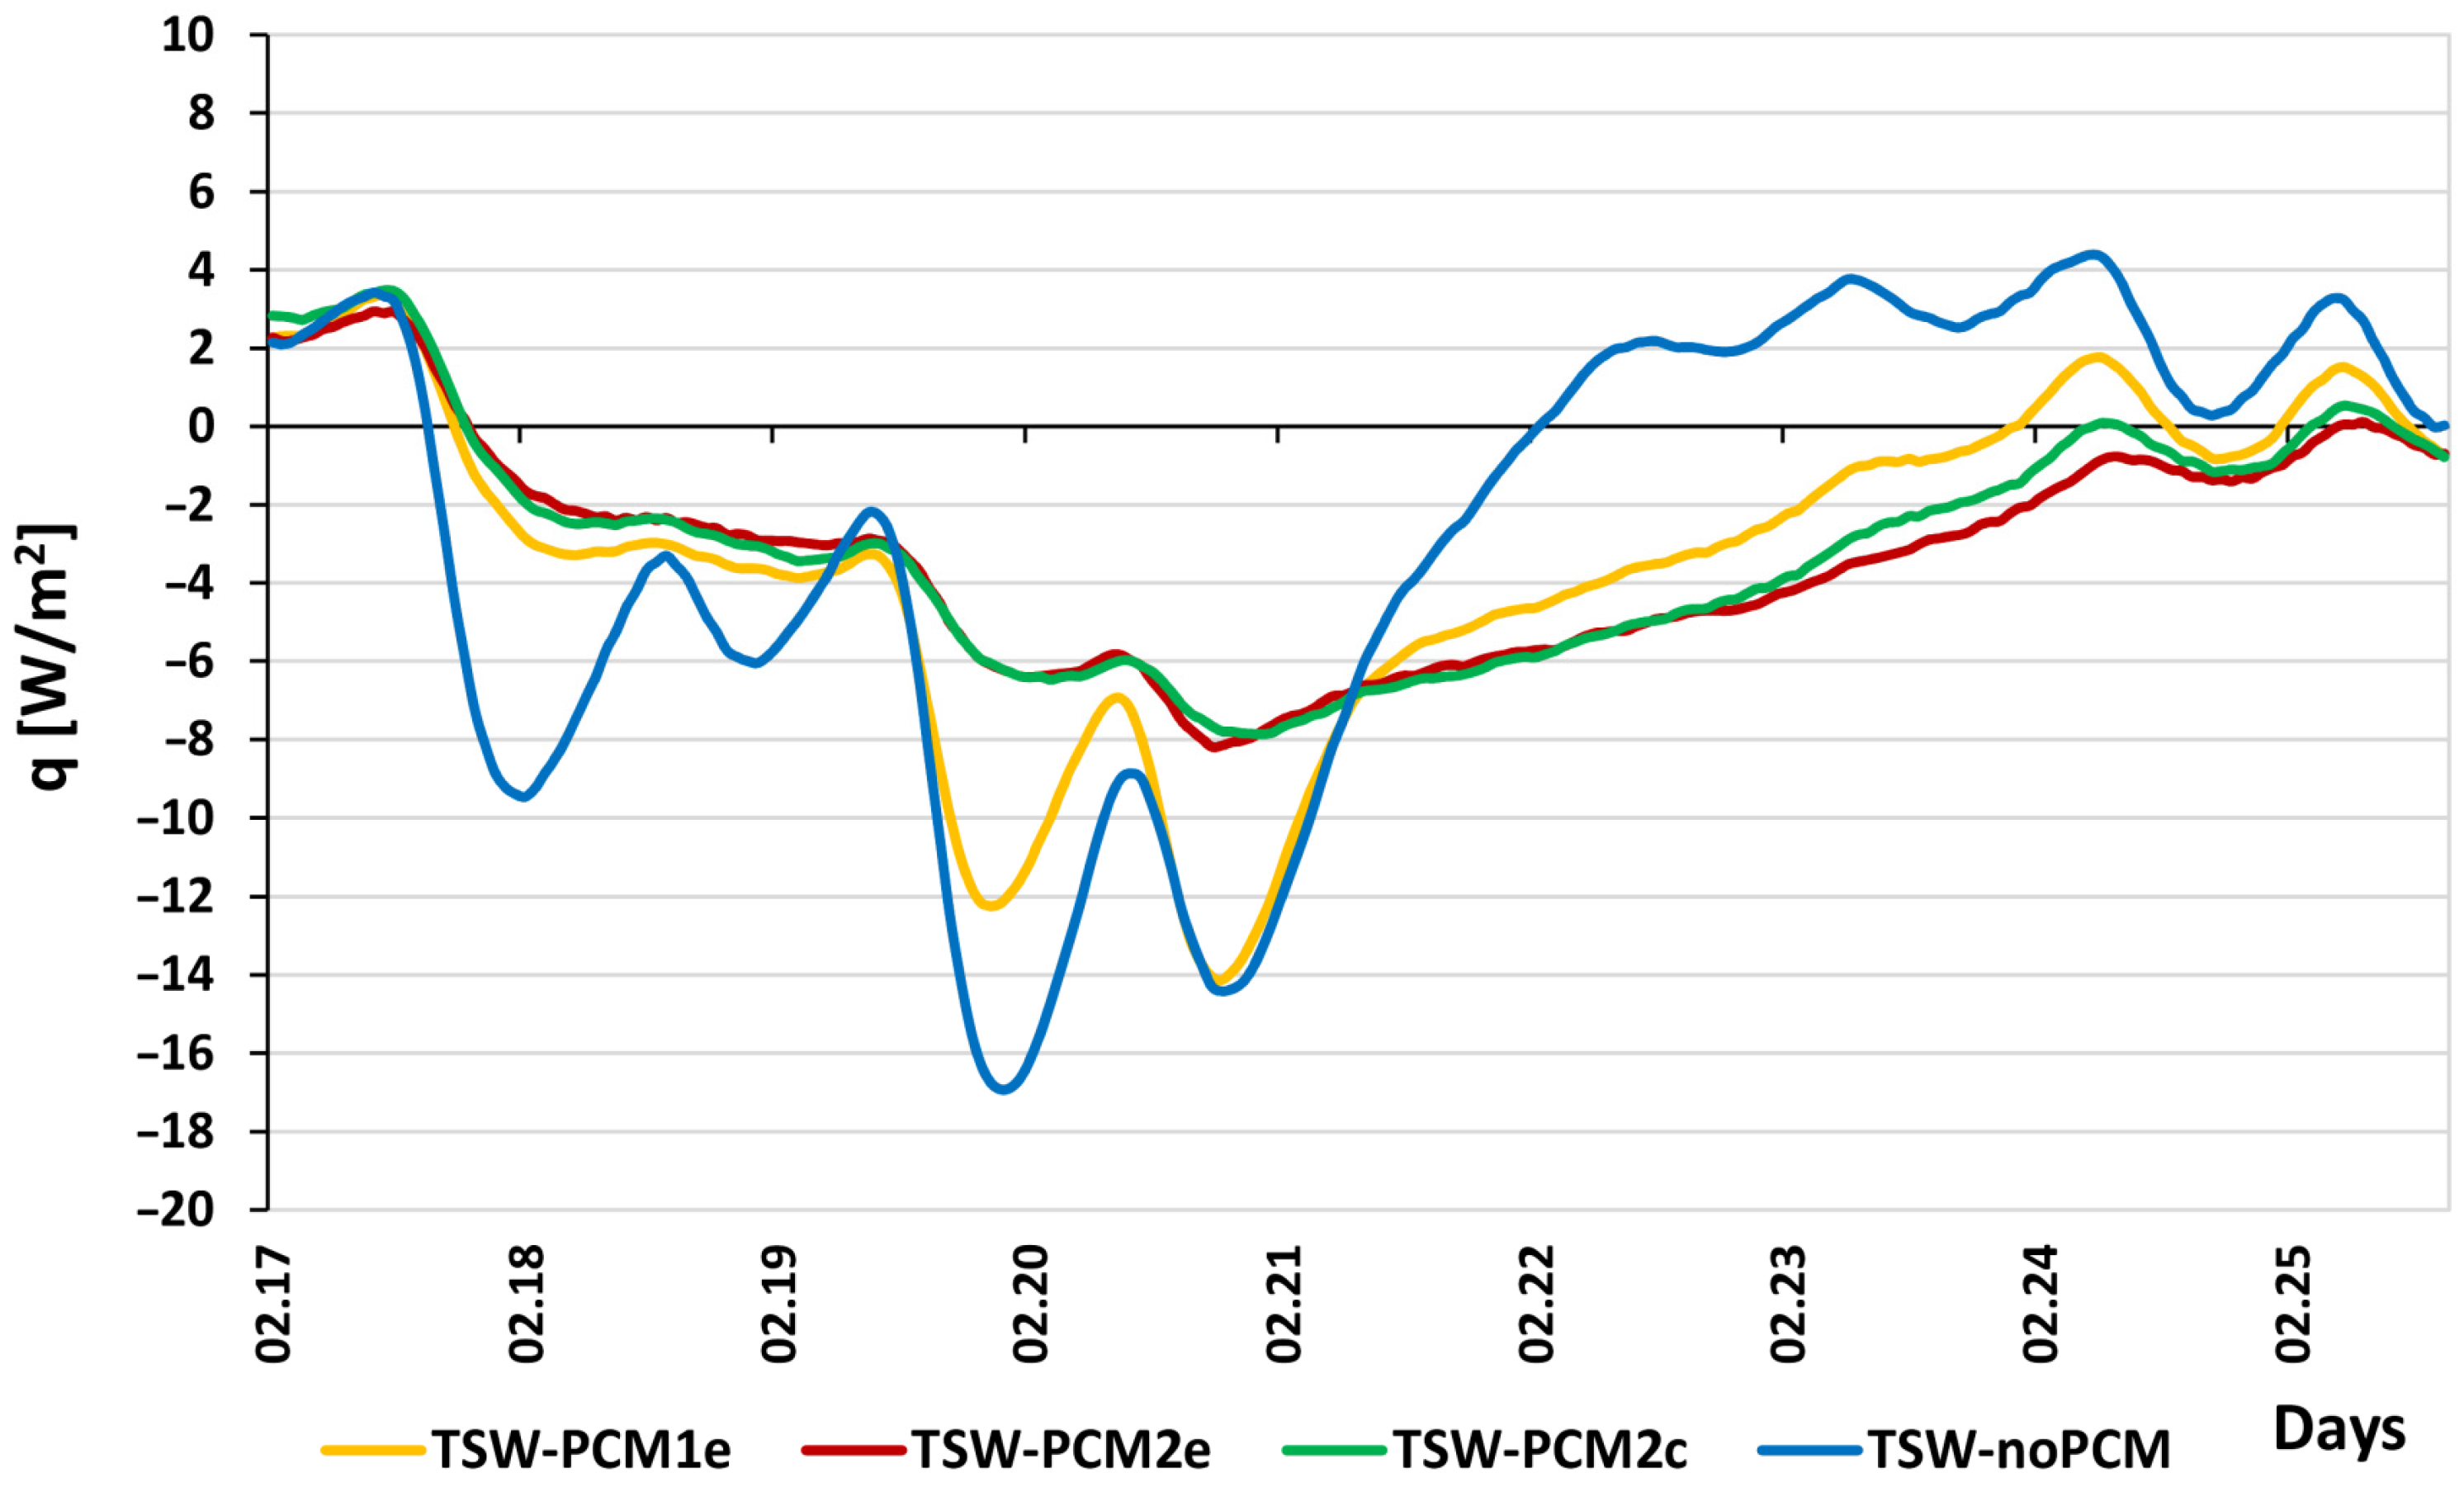
During the sunny period, the heat flow through all partitions was favourable, that is, toward the internal environment (Figure 11). For variants II and III, most of the heat flux density values were negative even in the range after cloudy days. In the remaining two cases, heat losses through the partition occurred. These were the days with the lowest outside air temperature values in the studied time period.
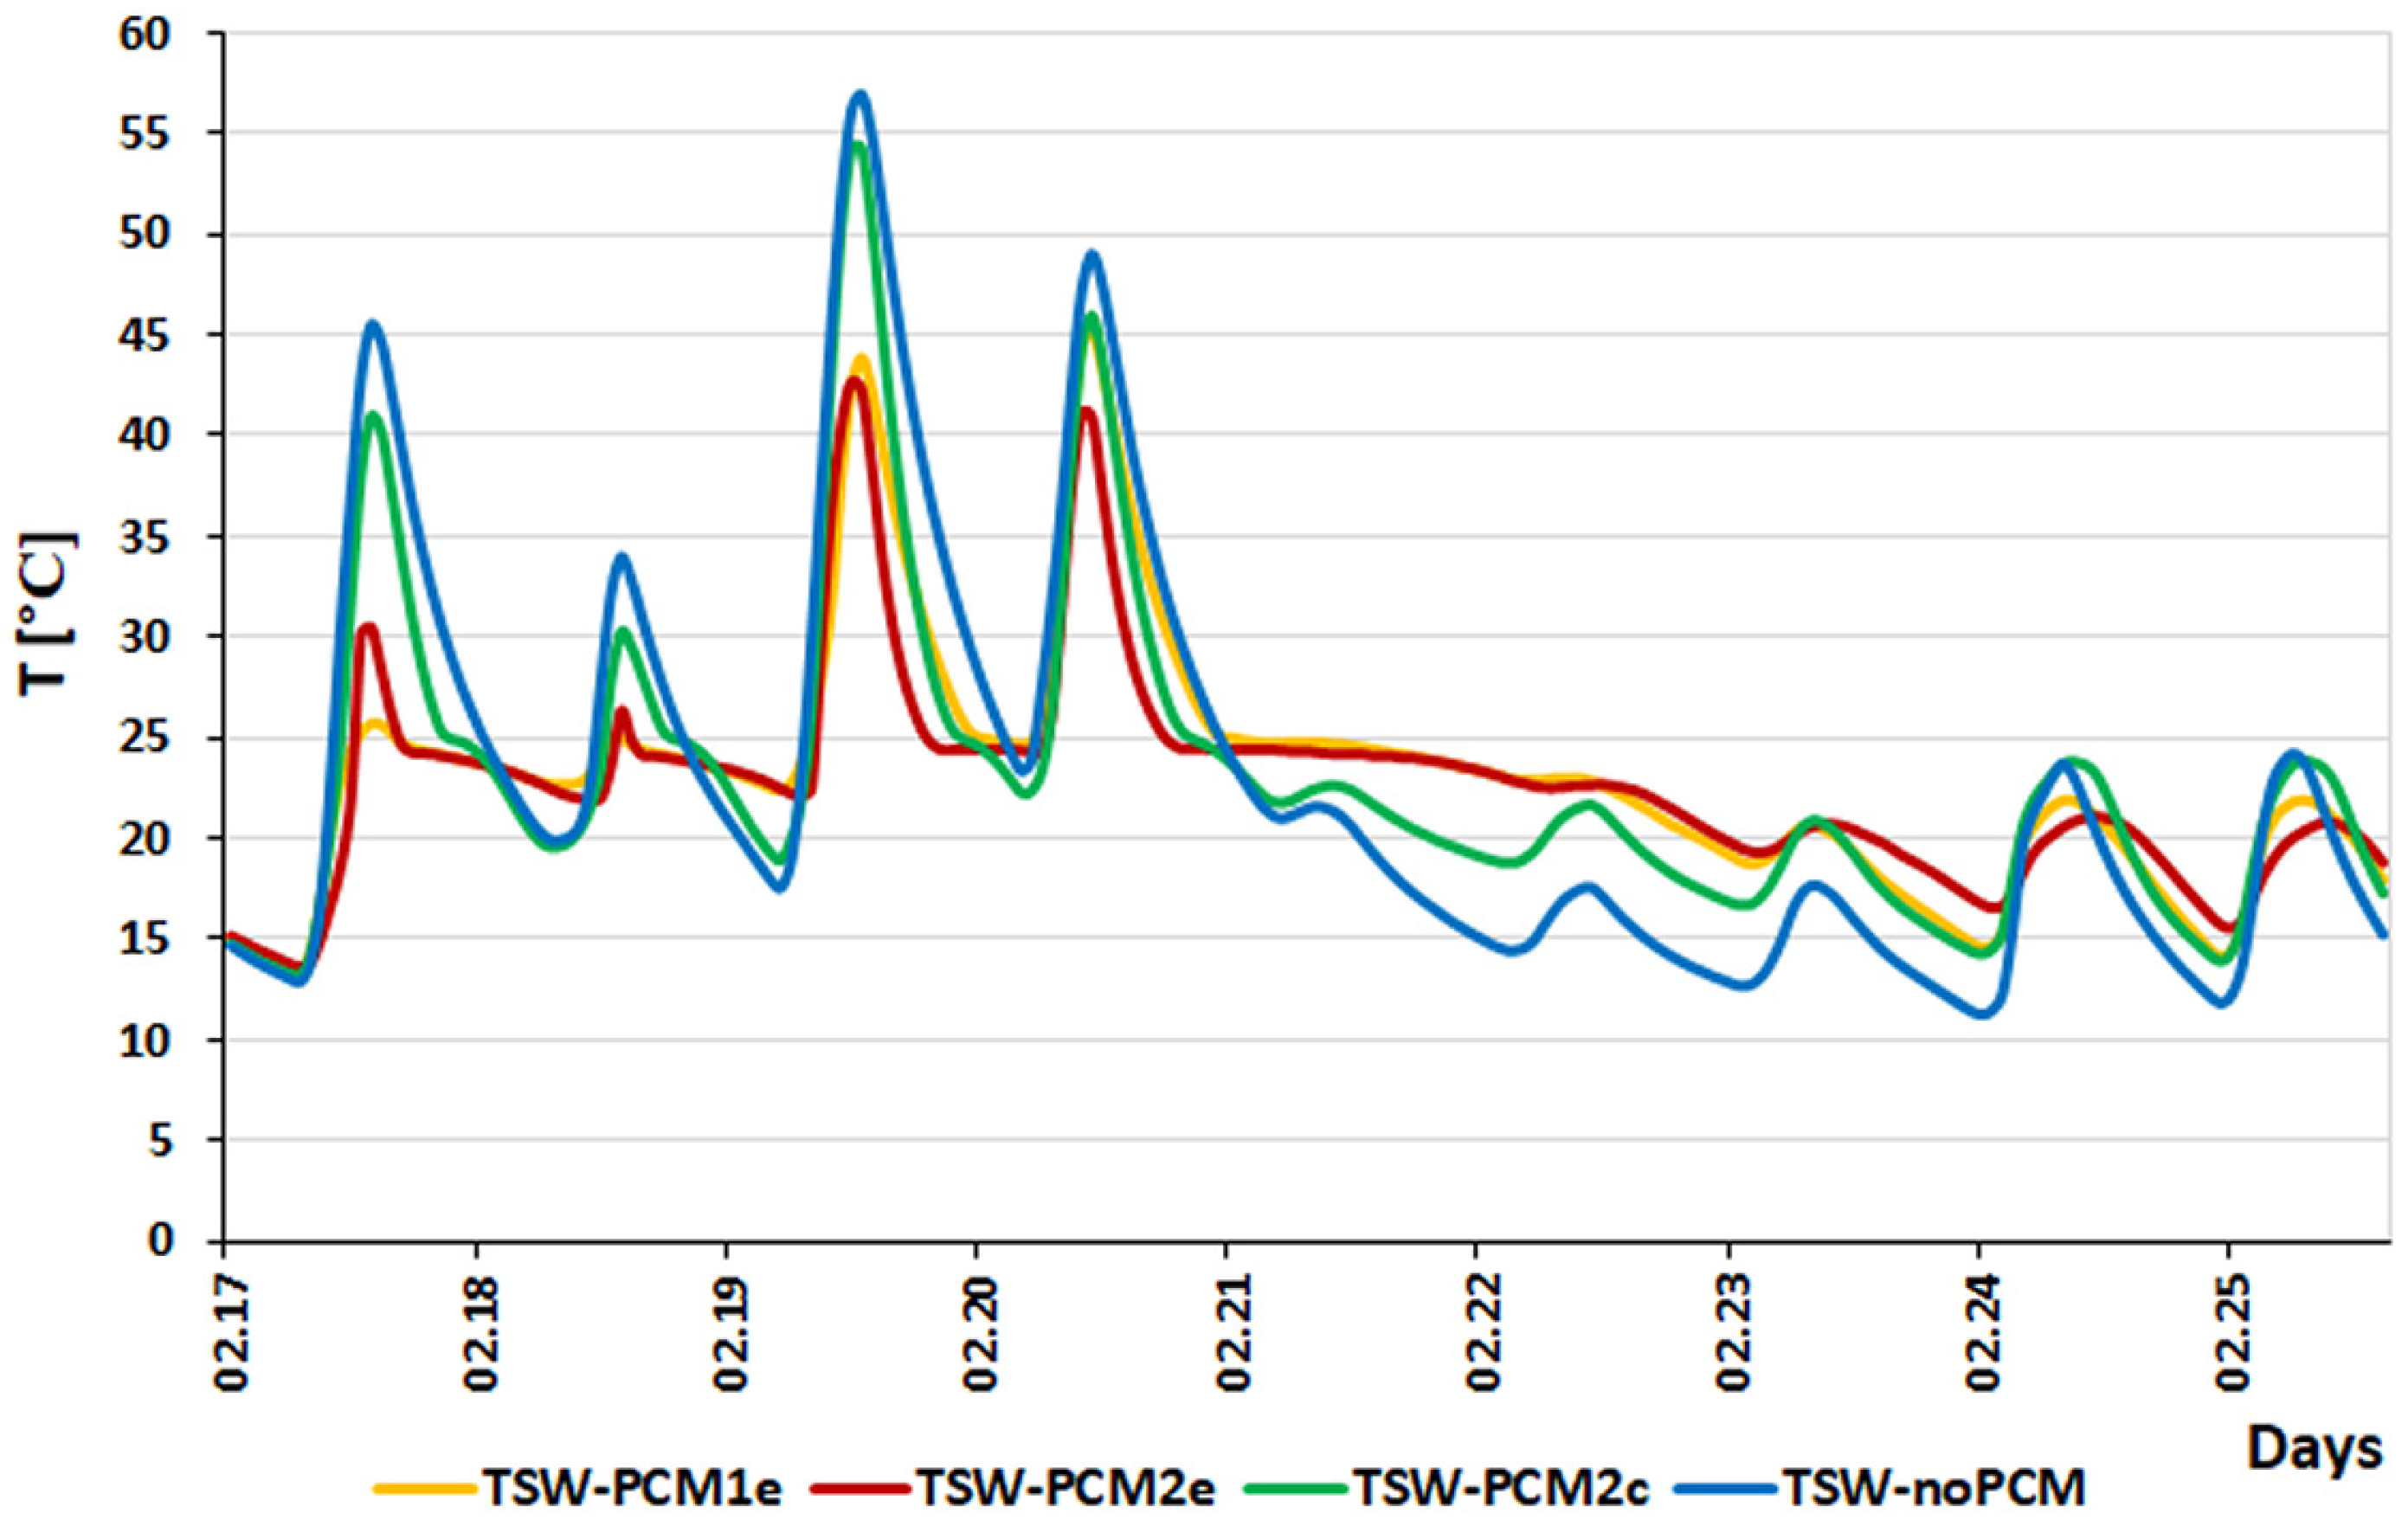
Figure 12 shows the temperature distribution in the first row of slots located in the accumulation layer on the outside. During the first two sunny days, it is visible that the maximum temperature values in the variants that contain phase change material in the first row (TSW-PCM1e and TSW-PCM2e) are significantly lower than in the other two variants. This is the result of the absorption of a large part of the thermal energy by the phase change material during the change in its state from solid to liquid. During the next two days, the phase change material underwent a full change in state; therefore, it no longer absorbs additionally supplied energy, and its maximum temperature increases significantly due to insolation. The following days were cloudy. During the two days immediately following the sunny days, the temperature in the partitions containing phase change material in the first external row dropped very slowly due to the change in the state of this material from liquid to solid. During this period, the two remaining barriers (TSW-PCM2c and TSW-noPCM) showed significantly greater temperature changes in the analysed row of slots.
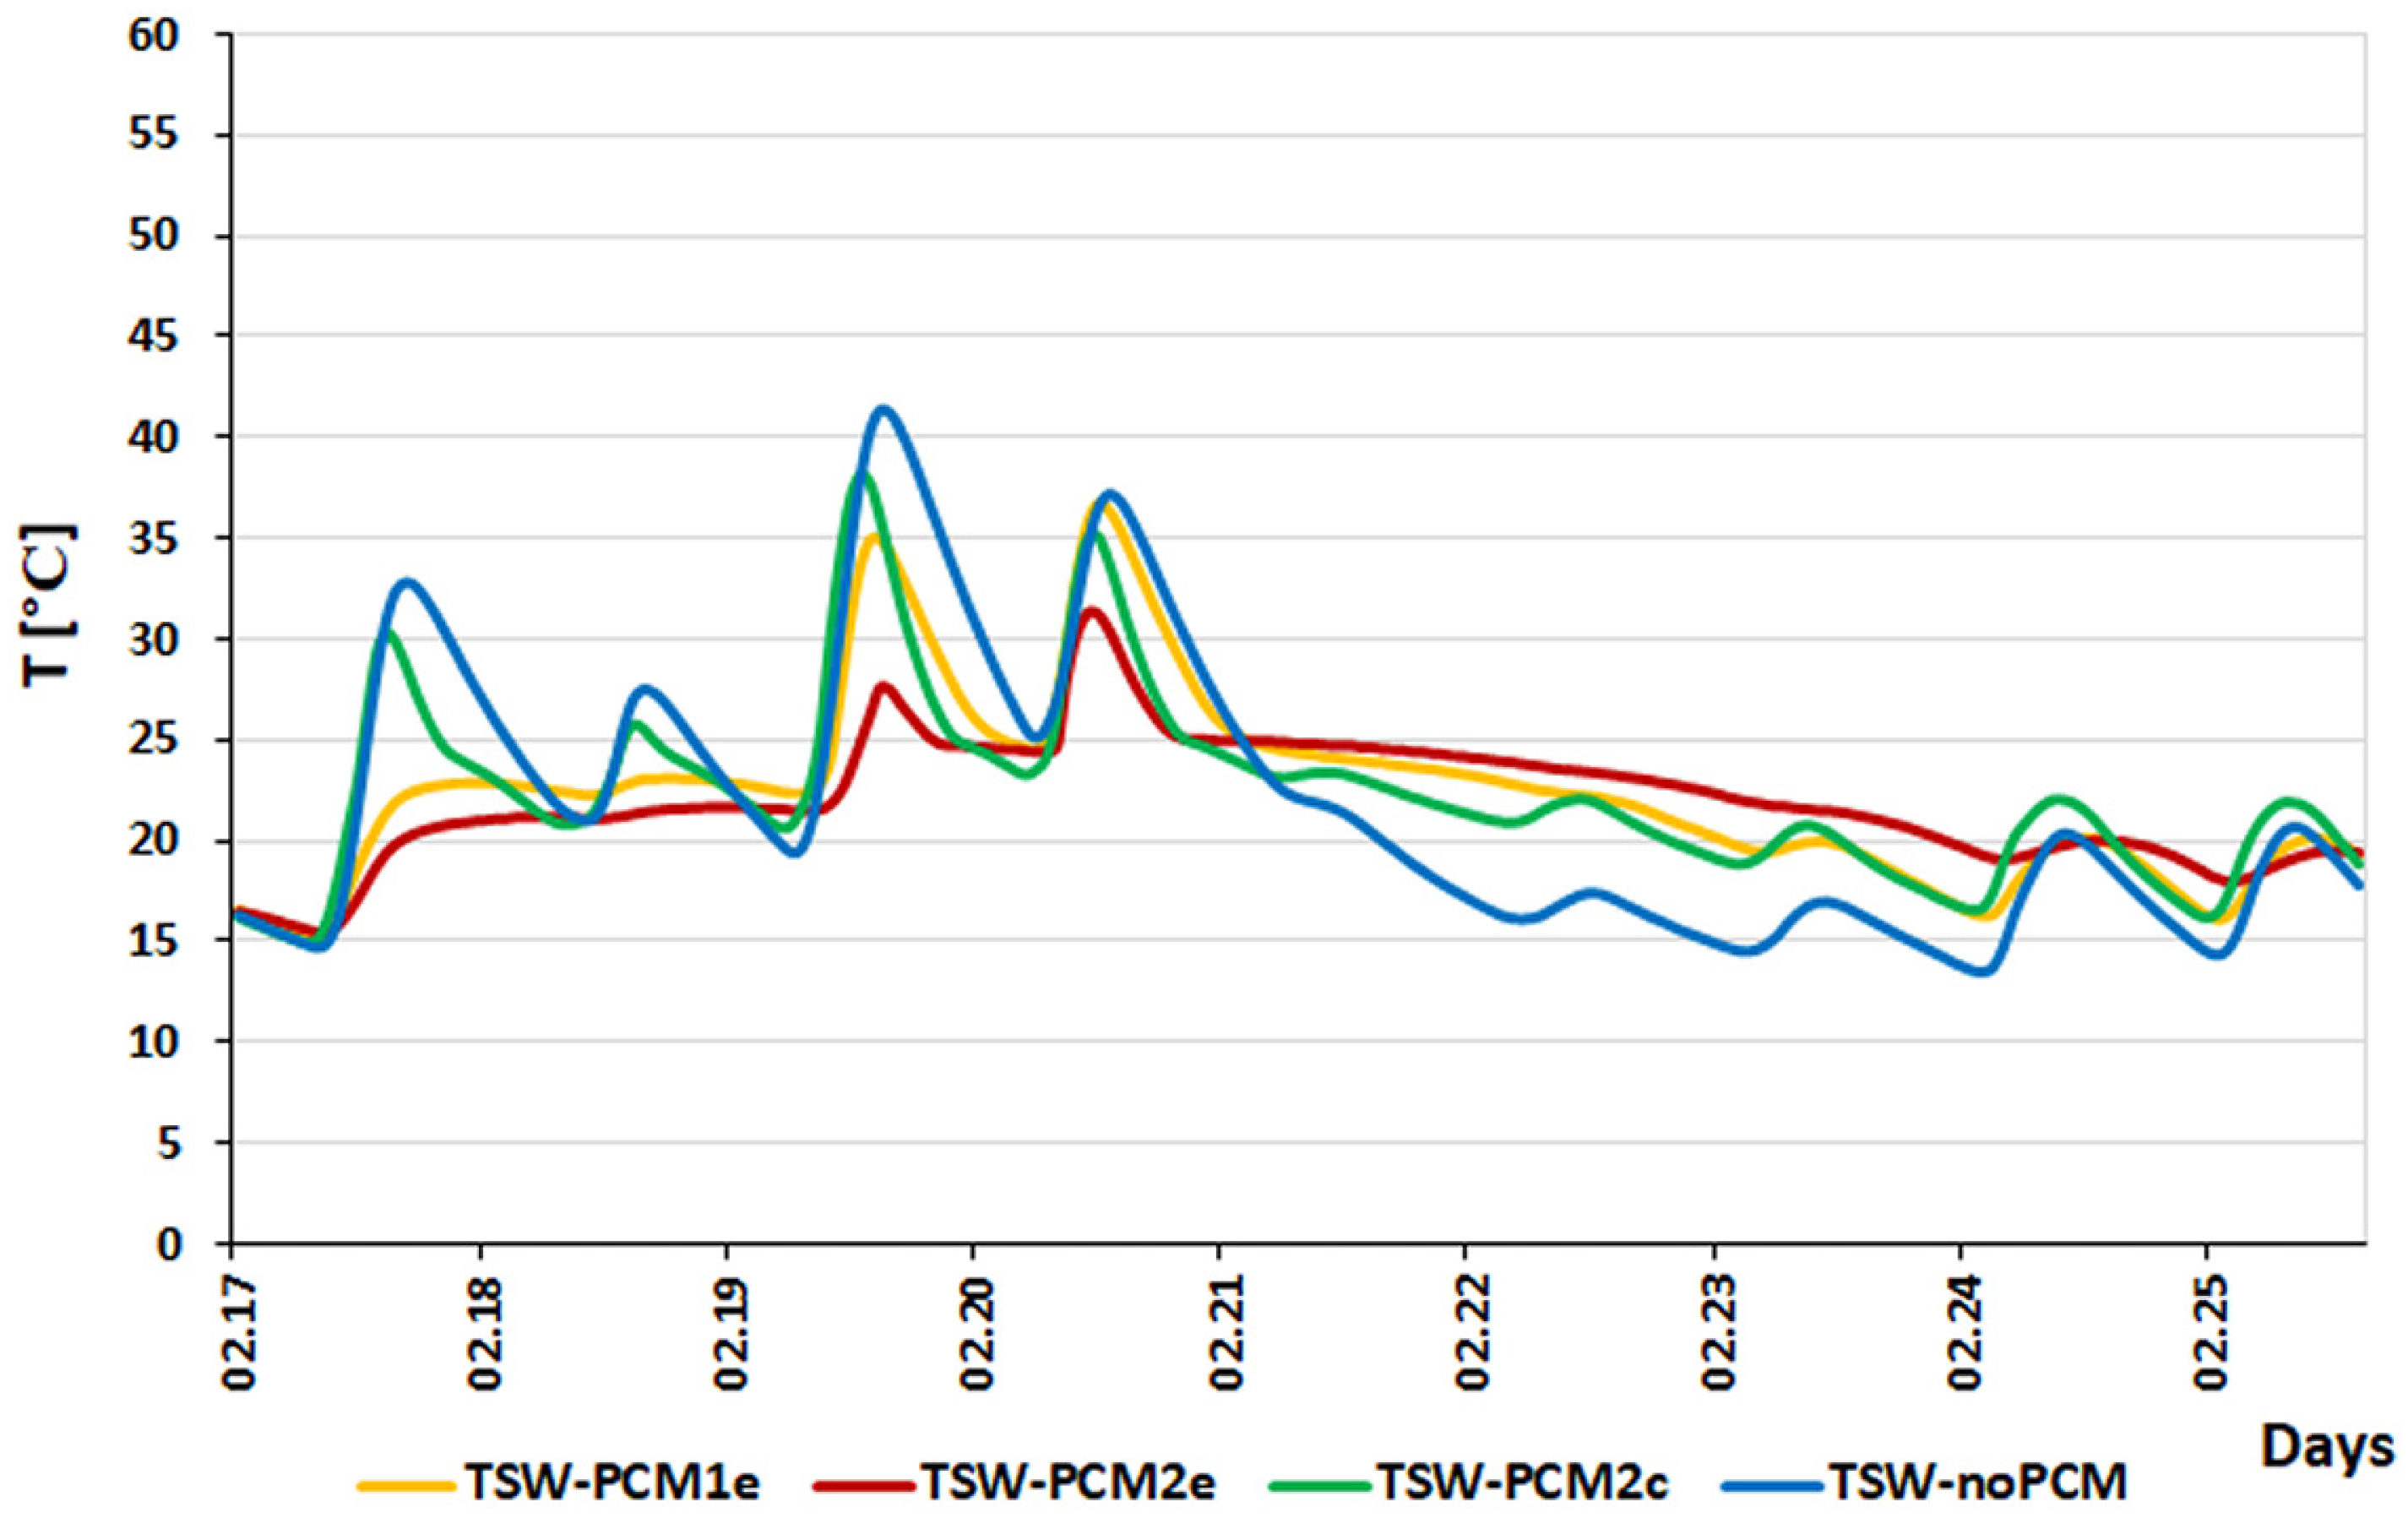
Figure 13 shows the temperature distribution in the second row of slots (from the outside) located in the accumulation layer. The TSW-noPCM wall shows the largest temperature amplitudes. The TSW-PCM2e barrier shows the smallest temperature fluctuations in the slot. The reason for this effect is that in this partition, during the first two solar days, the main part of the heat energy was absorbed by the first PCM layer located on the outside in the first row of slots (similarly to the TSW-PCM1e partition). From the third solar day, the largest differences occur between the TSW-PCM2e and TSW-PCM1e barriers. In the TSW-PCM1e barrier, there is no phase change material in the second slot, which is why there is a rapid increase in temperature. In the TSW-PCM2e barrier, a full phase change is visible (transition from solid to liquid state) and, as a result, also a temperature increase, but smaller than in the other partitions. During the next night, partial solidification occurs, but during the next sunny day, the temperature increases significantly due to the lack of further absorption of heat energy as a result of the completion of the full phase change process. During cloudy days, there is a long, three-day period during which the phase change material in the second gap of the TSW-PCM2e barrier solidifies, and thanks to this, its temperature drops very slowly. In the other partitions, the temperature change occurs much faster; the greatest intensity of changes occurs in the barrier without the phase change material (TSW-noPCM).
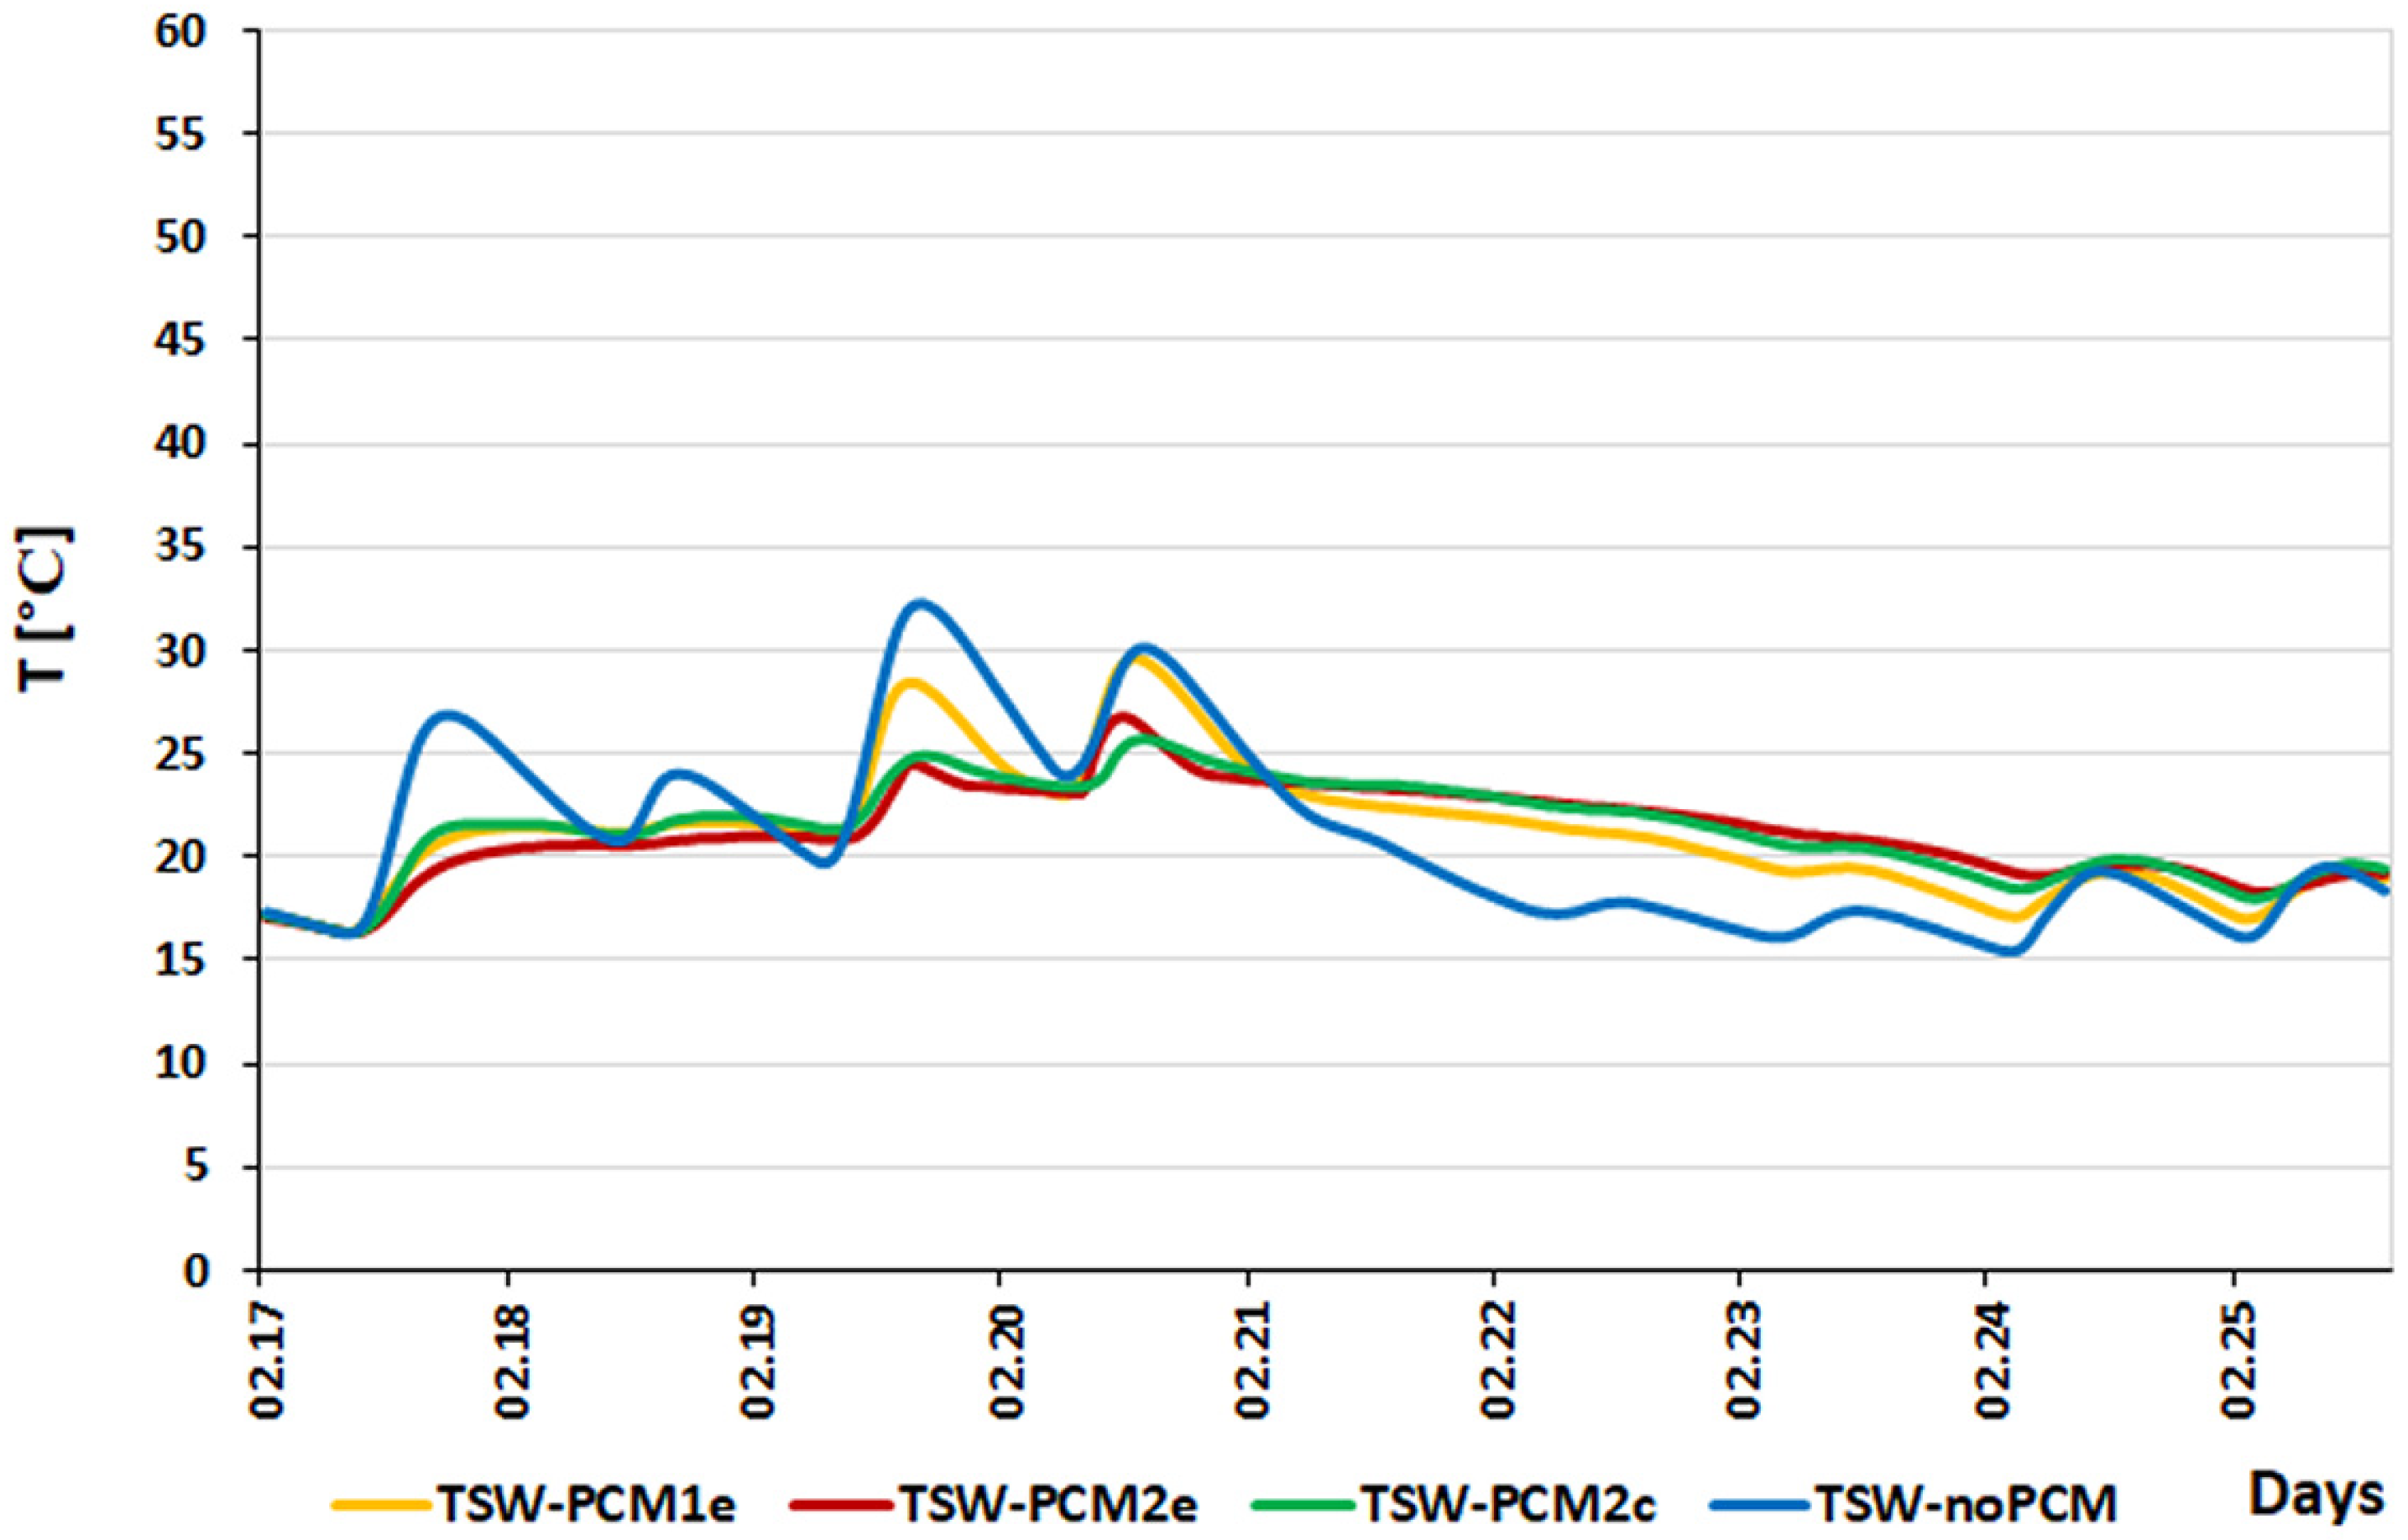
Figure 14 shows the temperature distribution in the third row of external slots located in the accumulation layer. The TSW-noPCM wall shows the largest temperature fluctuations. The TSW-PCM2c barrier shows the smallest temperature fluctuations, which contain PCM in this slot. In this barrier, the phase change in PCM occurs only during the third and fourth days of insolation. This is because the hole is located in the central part of the barrier (at a large distance from the absorber), and the temperature increase in this part of the partition as a result of insolation is smaller than in the first two external slots.
In the analysed interval, statistically significant differences (p < 0.05) occurred between the TSW-PCM2e, TSW-PCM2c partitions, and the TSW-noPCM partition. No significant differences in the heat flux density values were demonstrated between the remaining partitions (Table 3).
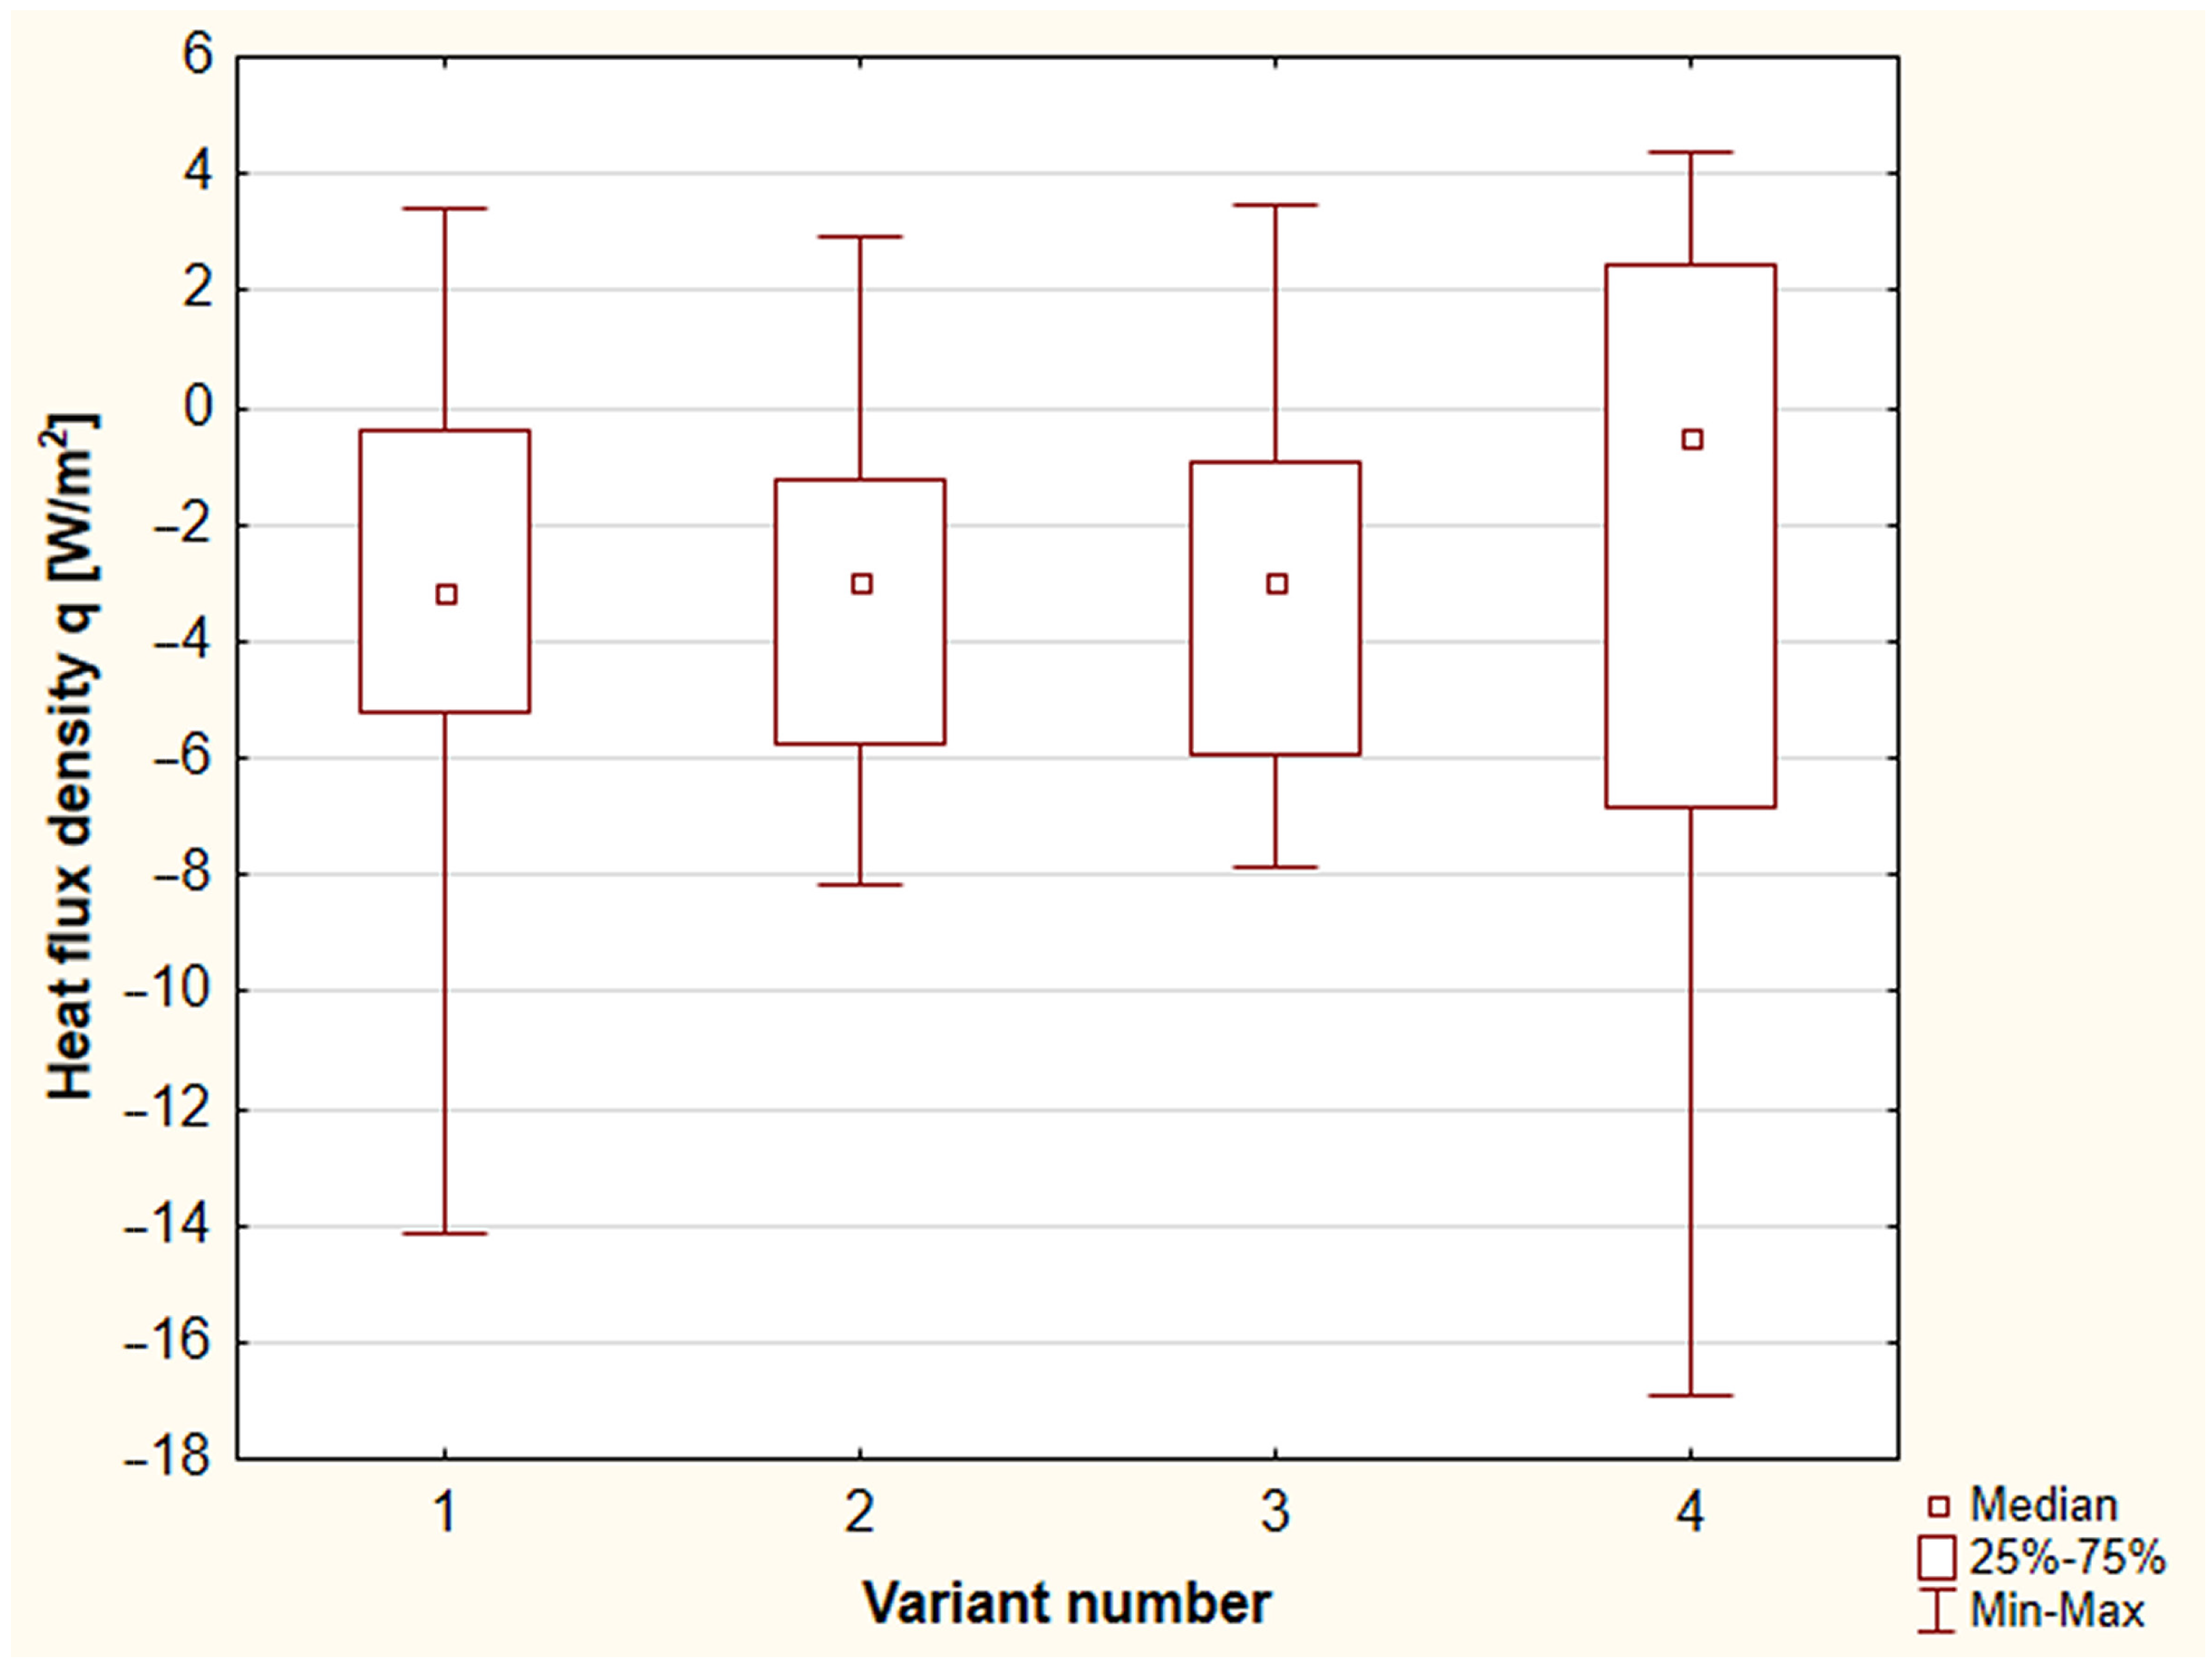
In the graph (Figure 15) based on the median, the greatest differences occurred between the TSW-PCM2e. The TSW-PCM2c partitions and the TSW-noPCM wall were confirmed by the test result presented in Table 3. The median values for all TSW-PCM partitions were similar and ranged from −3.0 W/m2 to −3.2 W/m2, while for variant IV, the median value was 0.5 W/m2.
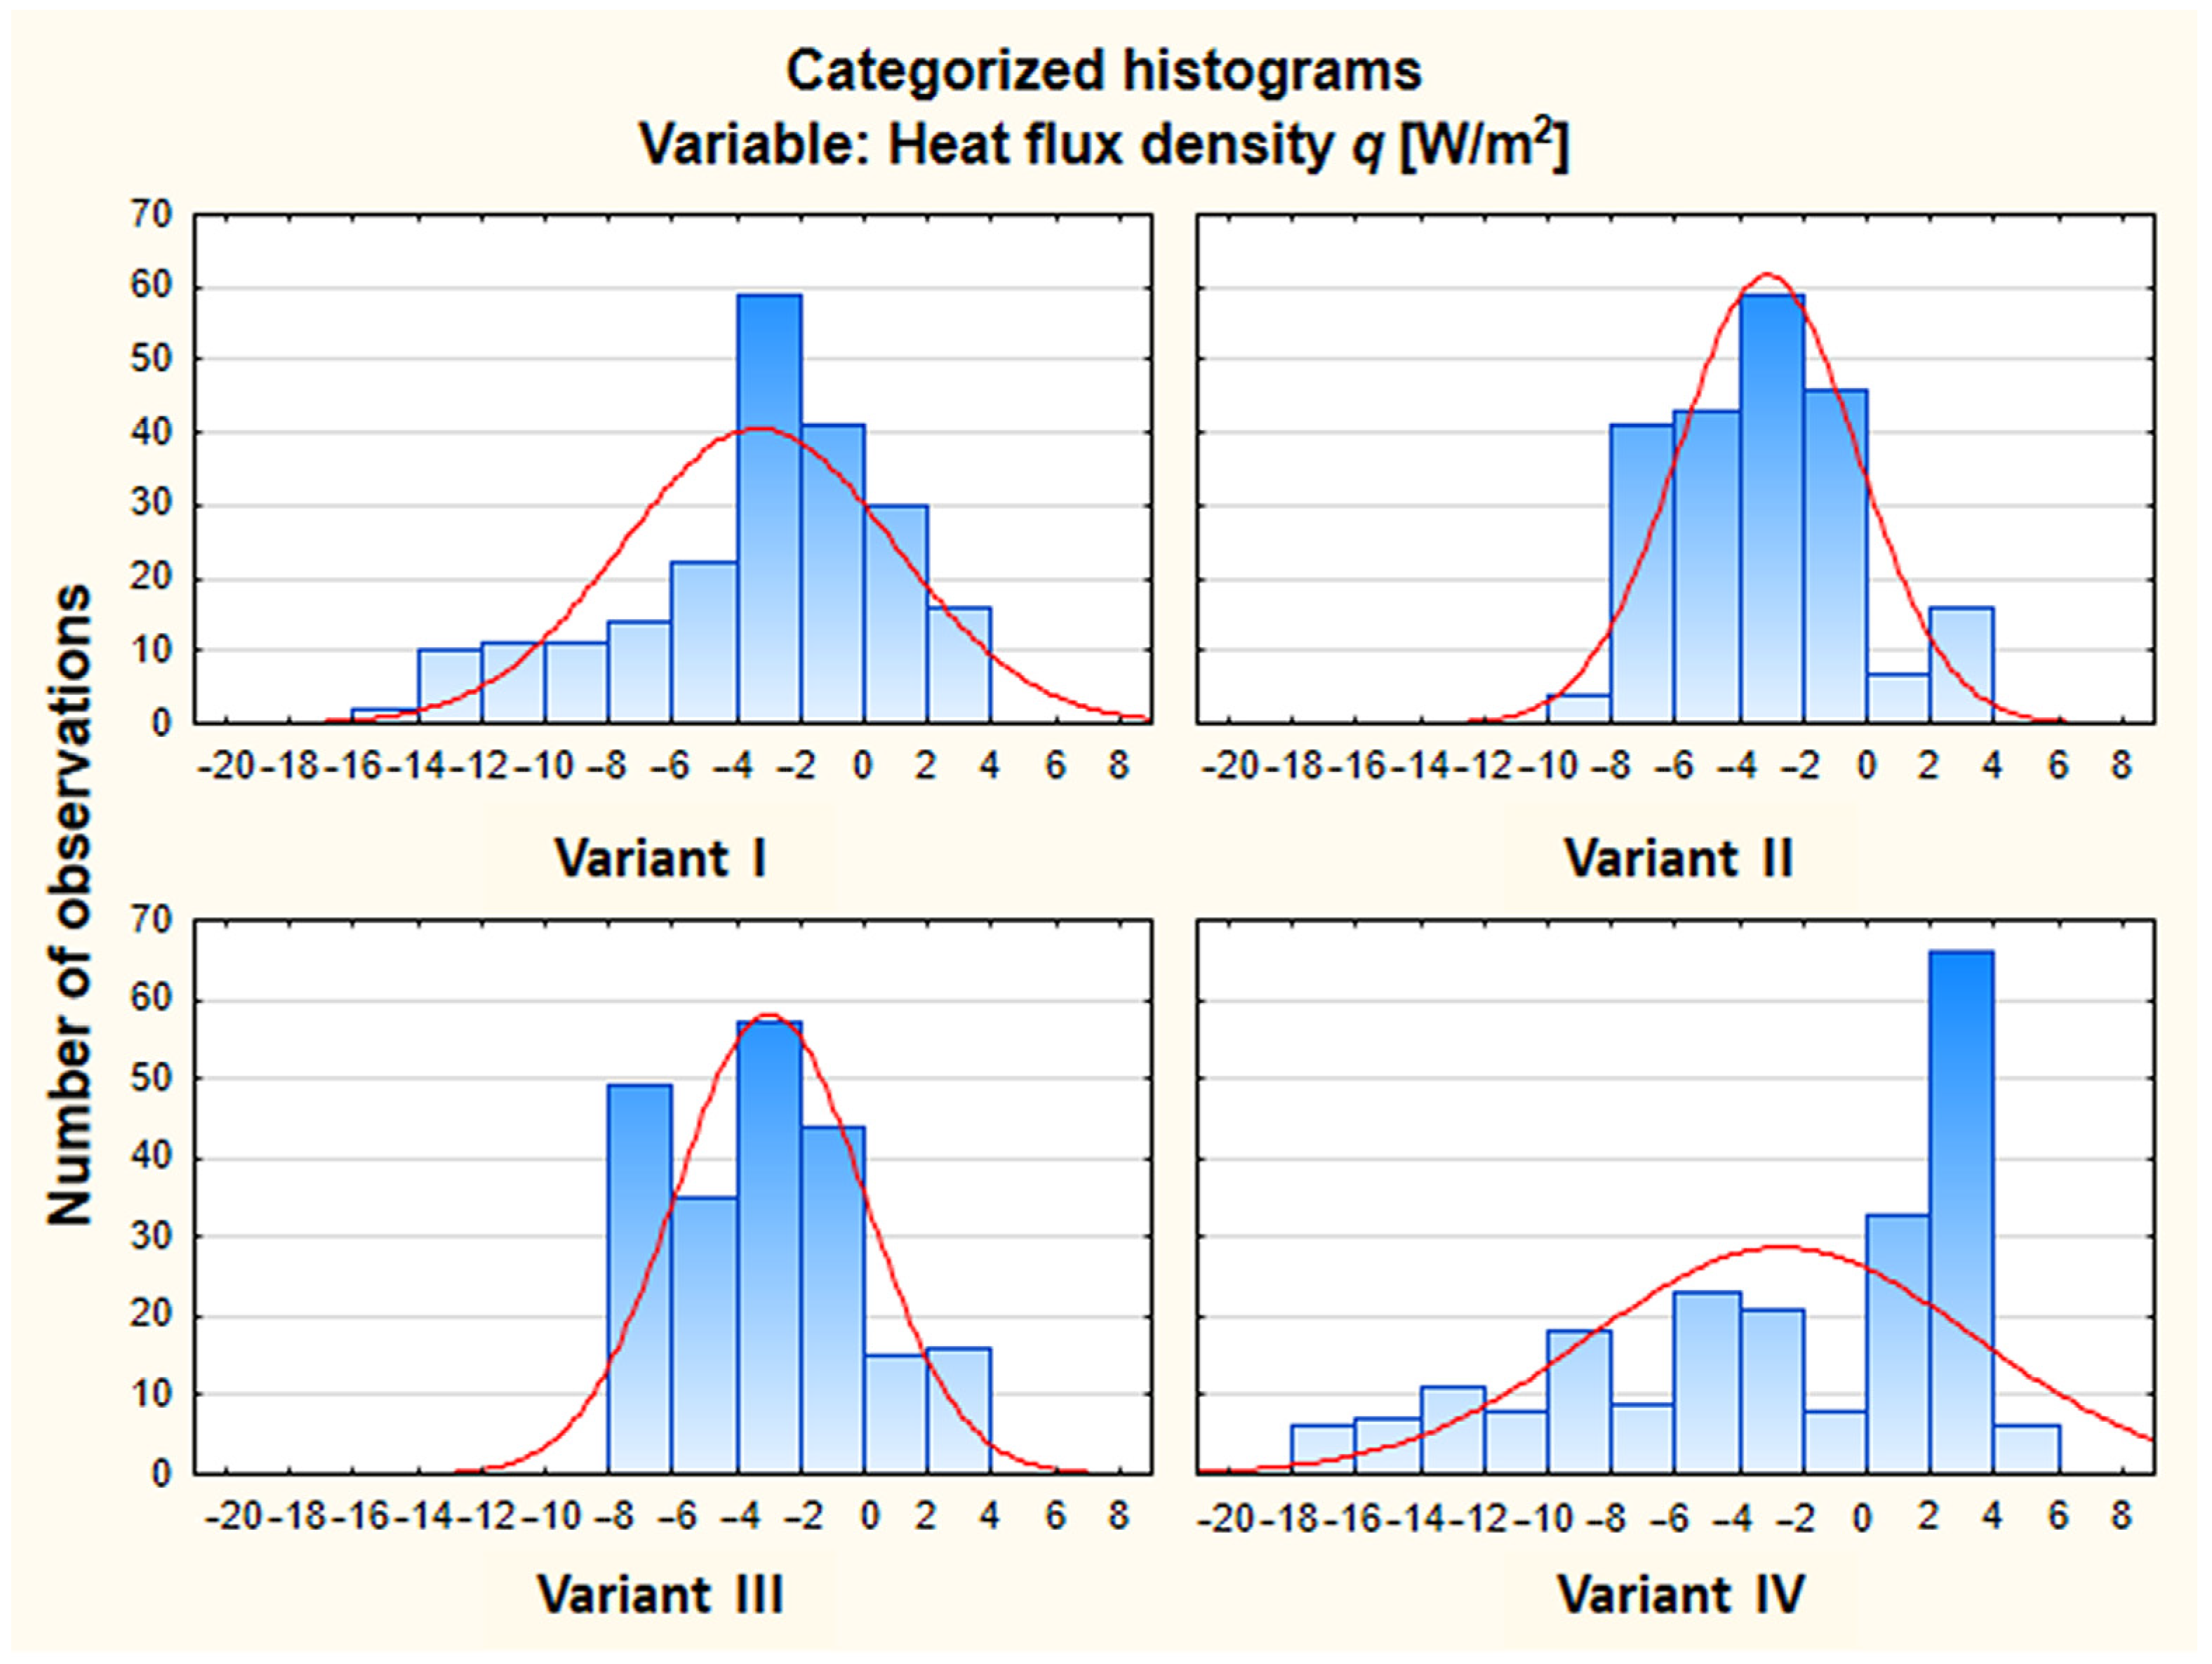
The best distribution of observed values was obtained in variants II and III. The range of values obtained of the heat flux density in these partitions was similar and the most favourable. The highest number of observed values was in the range of 0.0 W/m2 to −8.0 W/m2 (Figure 16).
The most varied heat flux density values were observed in the TSW-noPCM partition, indicating significant heat flow fluctuations in the analysed time period.

3.3. 8 to 20 March

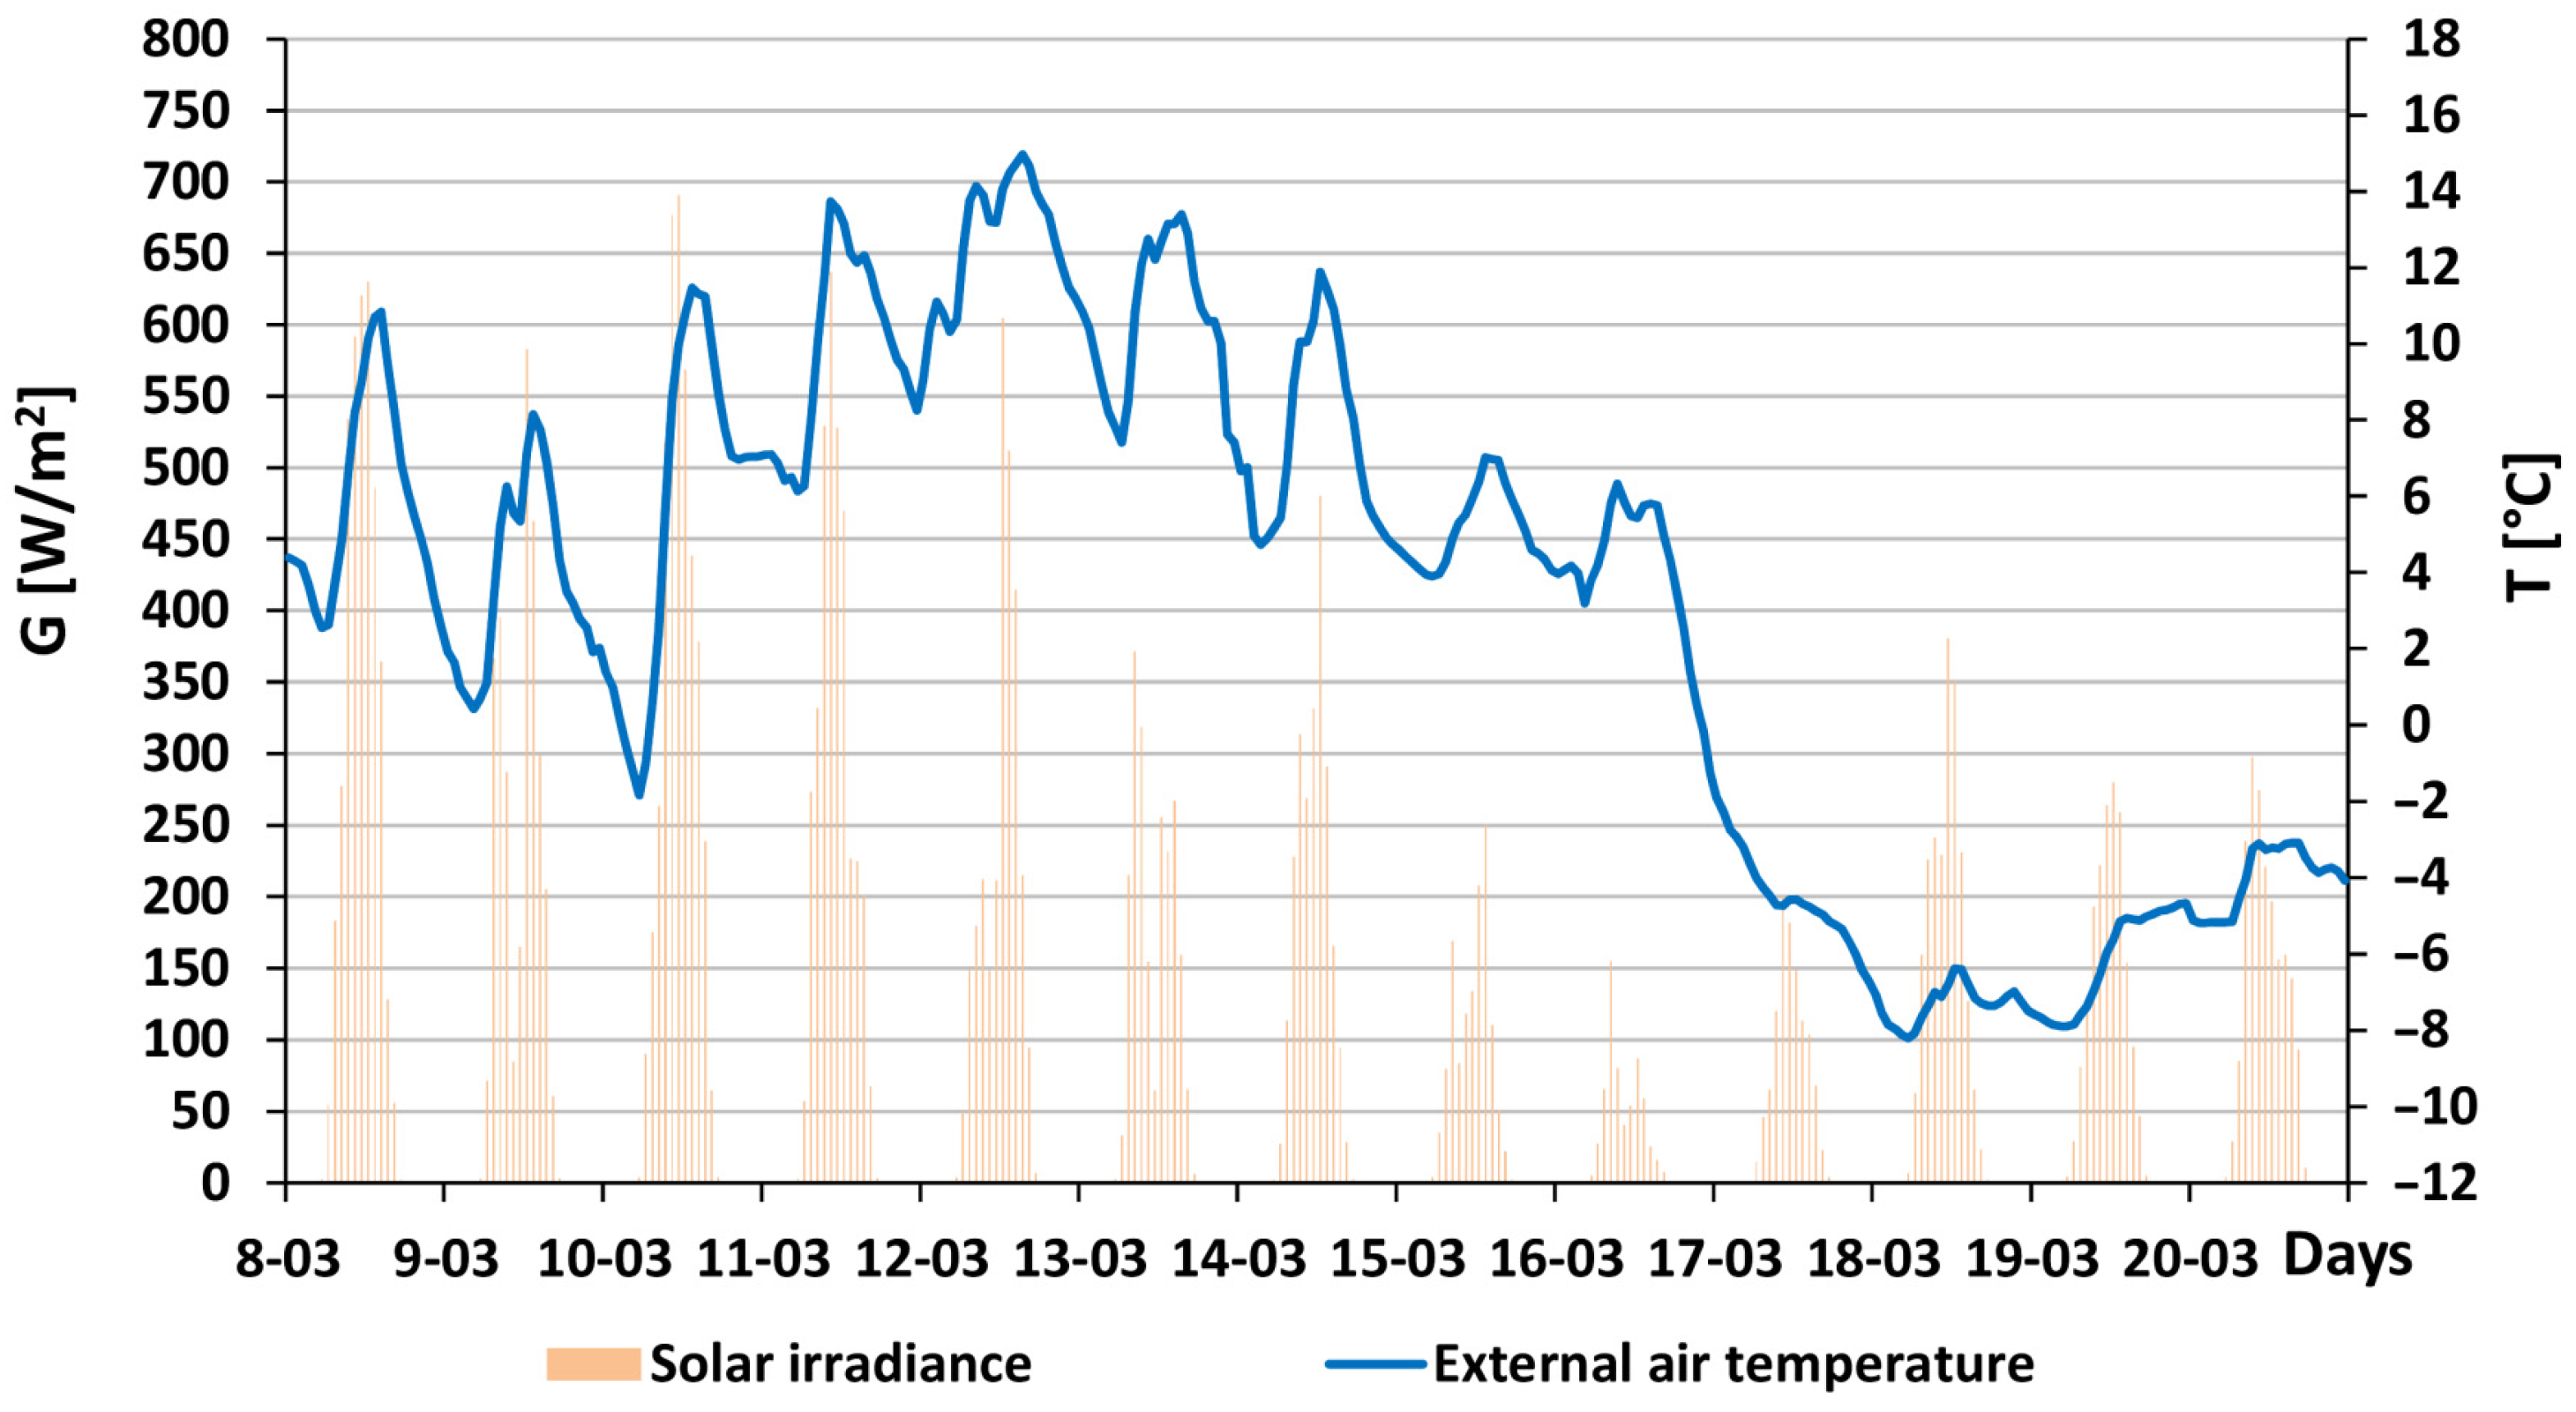
The selected period in March was the most sunny of the research periods (Figure 17). The highest daily sum of the total solar radiation intensity was 4109 W/(m2∙day). During the sunny days, the maximum temperature was approximately 15.0 °C and the minimum was −1.8 °C, indicating significant temperature fluctuations. After a period of 6 sunny days, cloudy days followed, and a significant drop in the temperature of the outside air occurred.
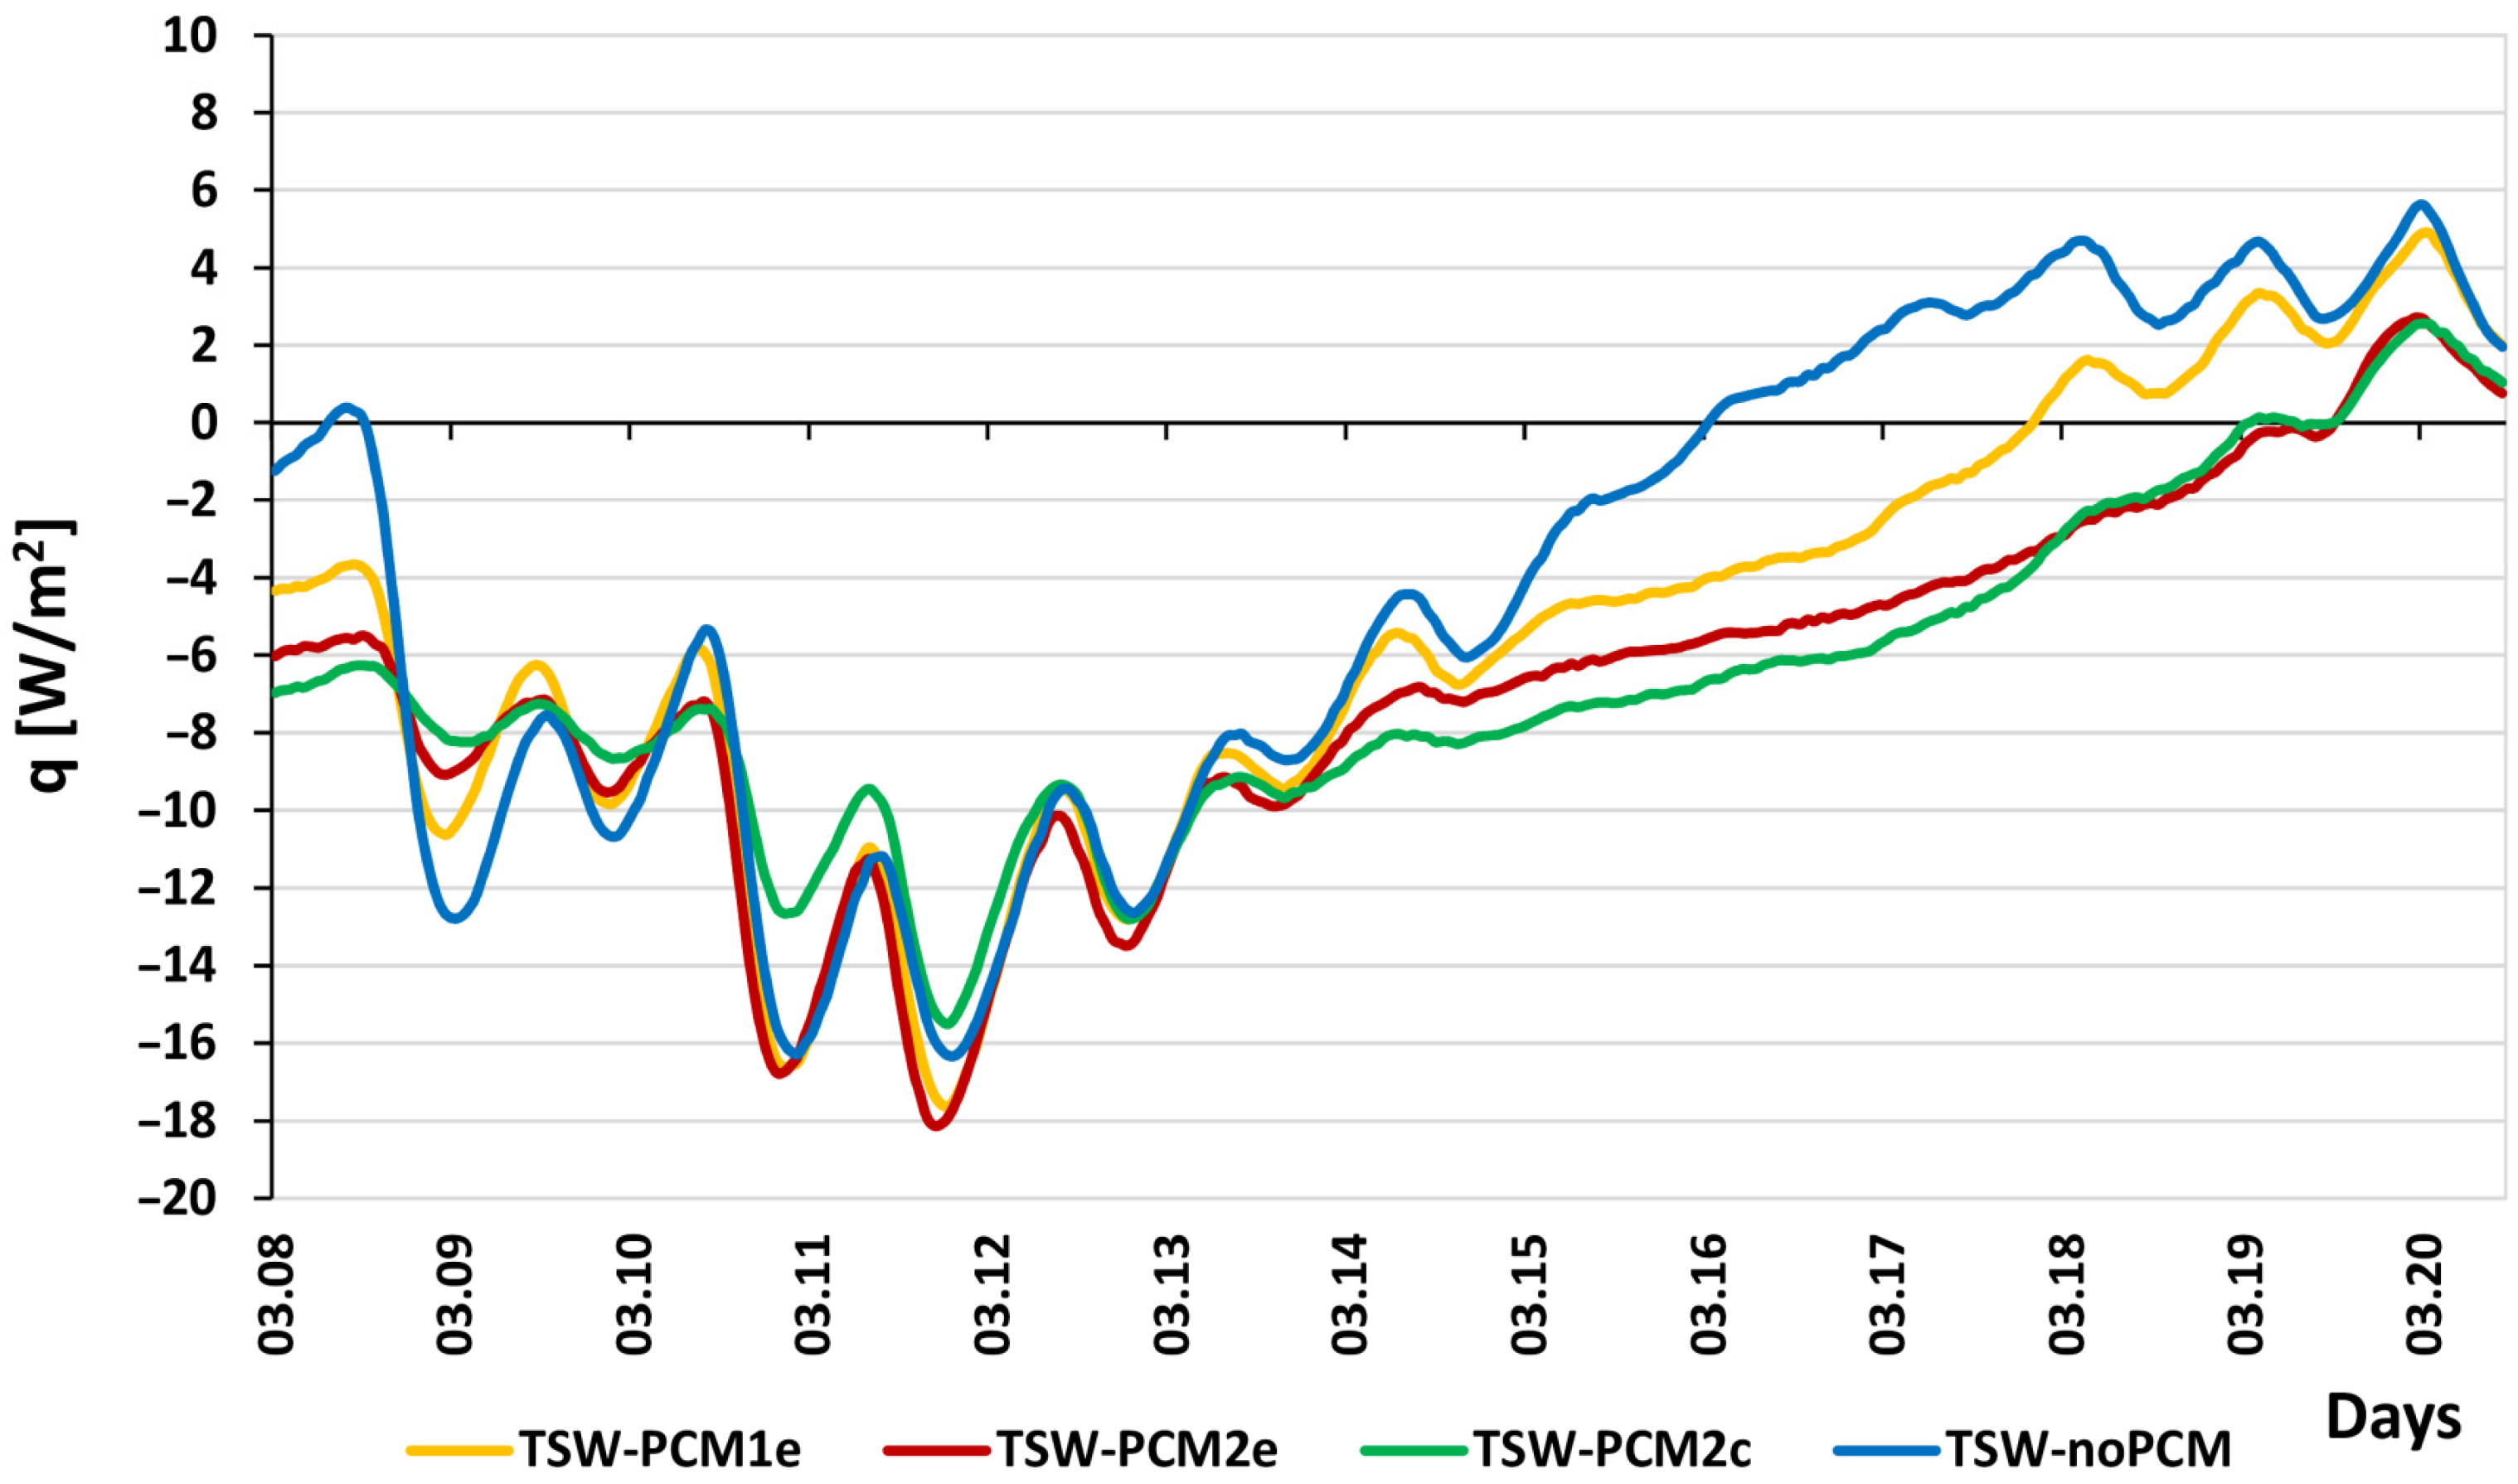
Figure 18 shows the distribution of the heat flux density values for all partitions analysed. During the period of several sunny days, the heat flux flow through the tested partitions was similar. The lowest heat flow through the partition in this period occurred in TSW-PCM2c.
The differentiated heat flux flow occurred after March 14, that is, after the period of sunny days. The shortest time to release the accumulated heat energy occurred in the TSW-noPCM partition. Heat losses in this partition occurred about 2 days after the moment of the occurrence of cloudy days.
In the TSW-PCM1e partition, heat losses occurred after about 4 days. The stored thermal energy in the wall layer was transferred to the inner surface of the partition for the longest time in the TSW-PCM2e and TSW-PCM2c. It amounted to about 6 days. It can also be noted that in the initial period of cloudy days, variant III obtained higher heat flux density values than variant II. In the second time interval, the heat flow for both partitions was very similar.
Due to the similar heat flow distribution during sunny days, the time period from 13 to 20 March was adopted for statistical analysis. The analysis confirmed the largest differences (p < 0.05) between the heat flux density values of the TSW-noPCM partition and the TSW-PCM2e and TSW-PCM2c partitions (Table 4). Significant differences also occurred between TSW-PCM1e and the remaining variants. In the analysed time period, there were no significant differences in the heat flux flow between variants II and III.
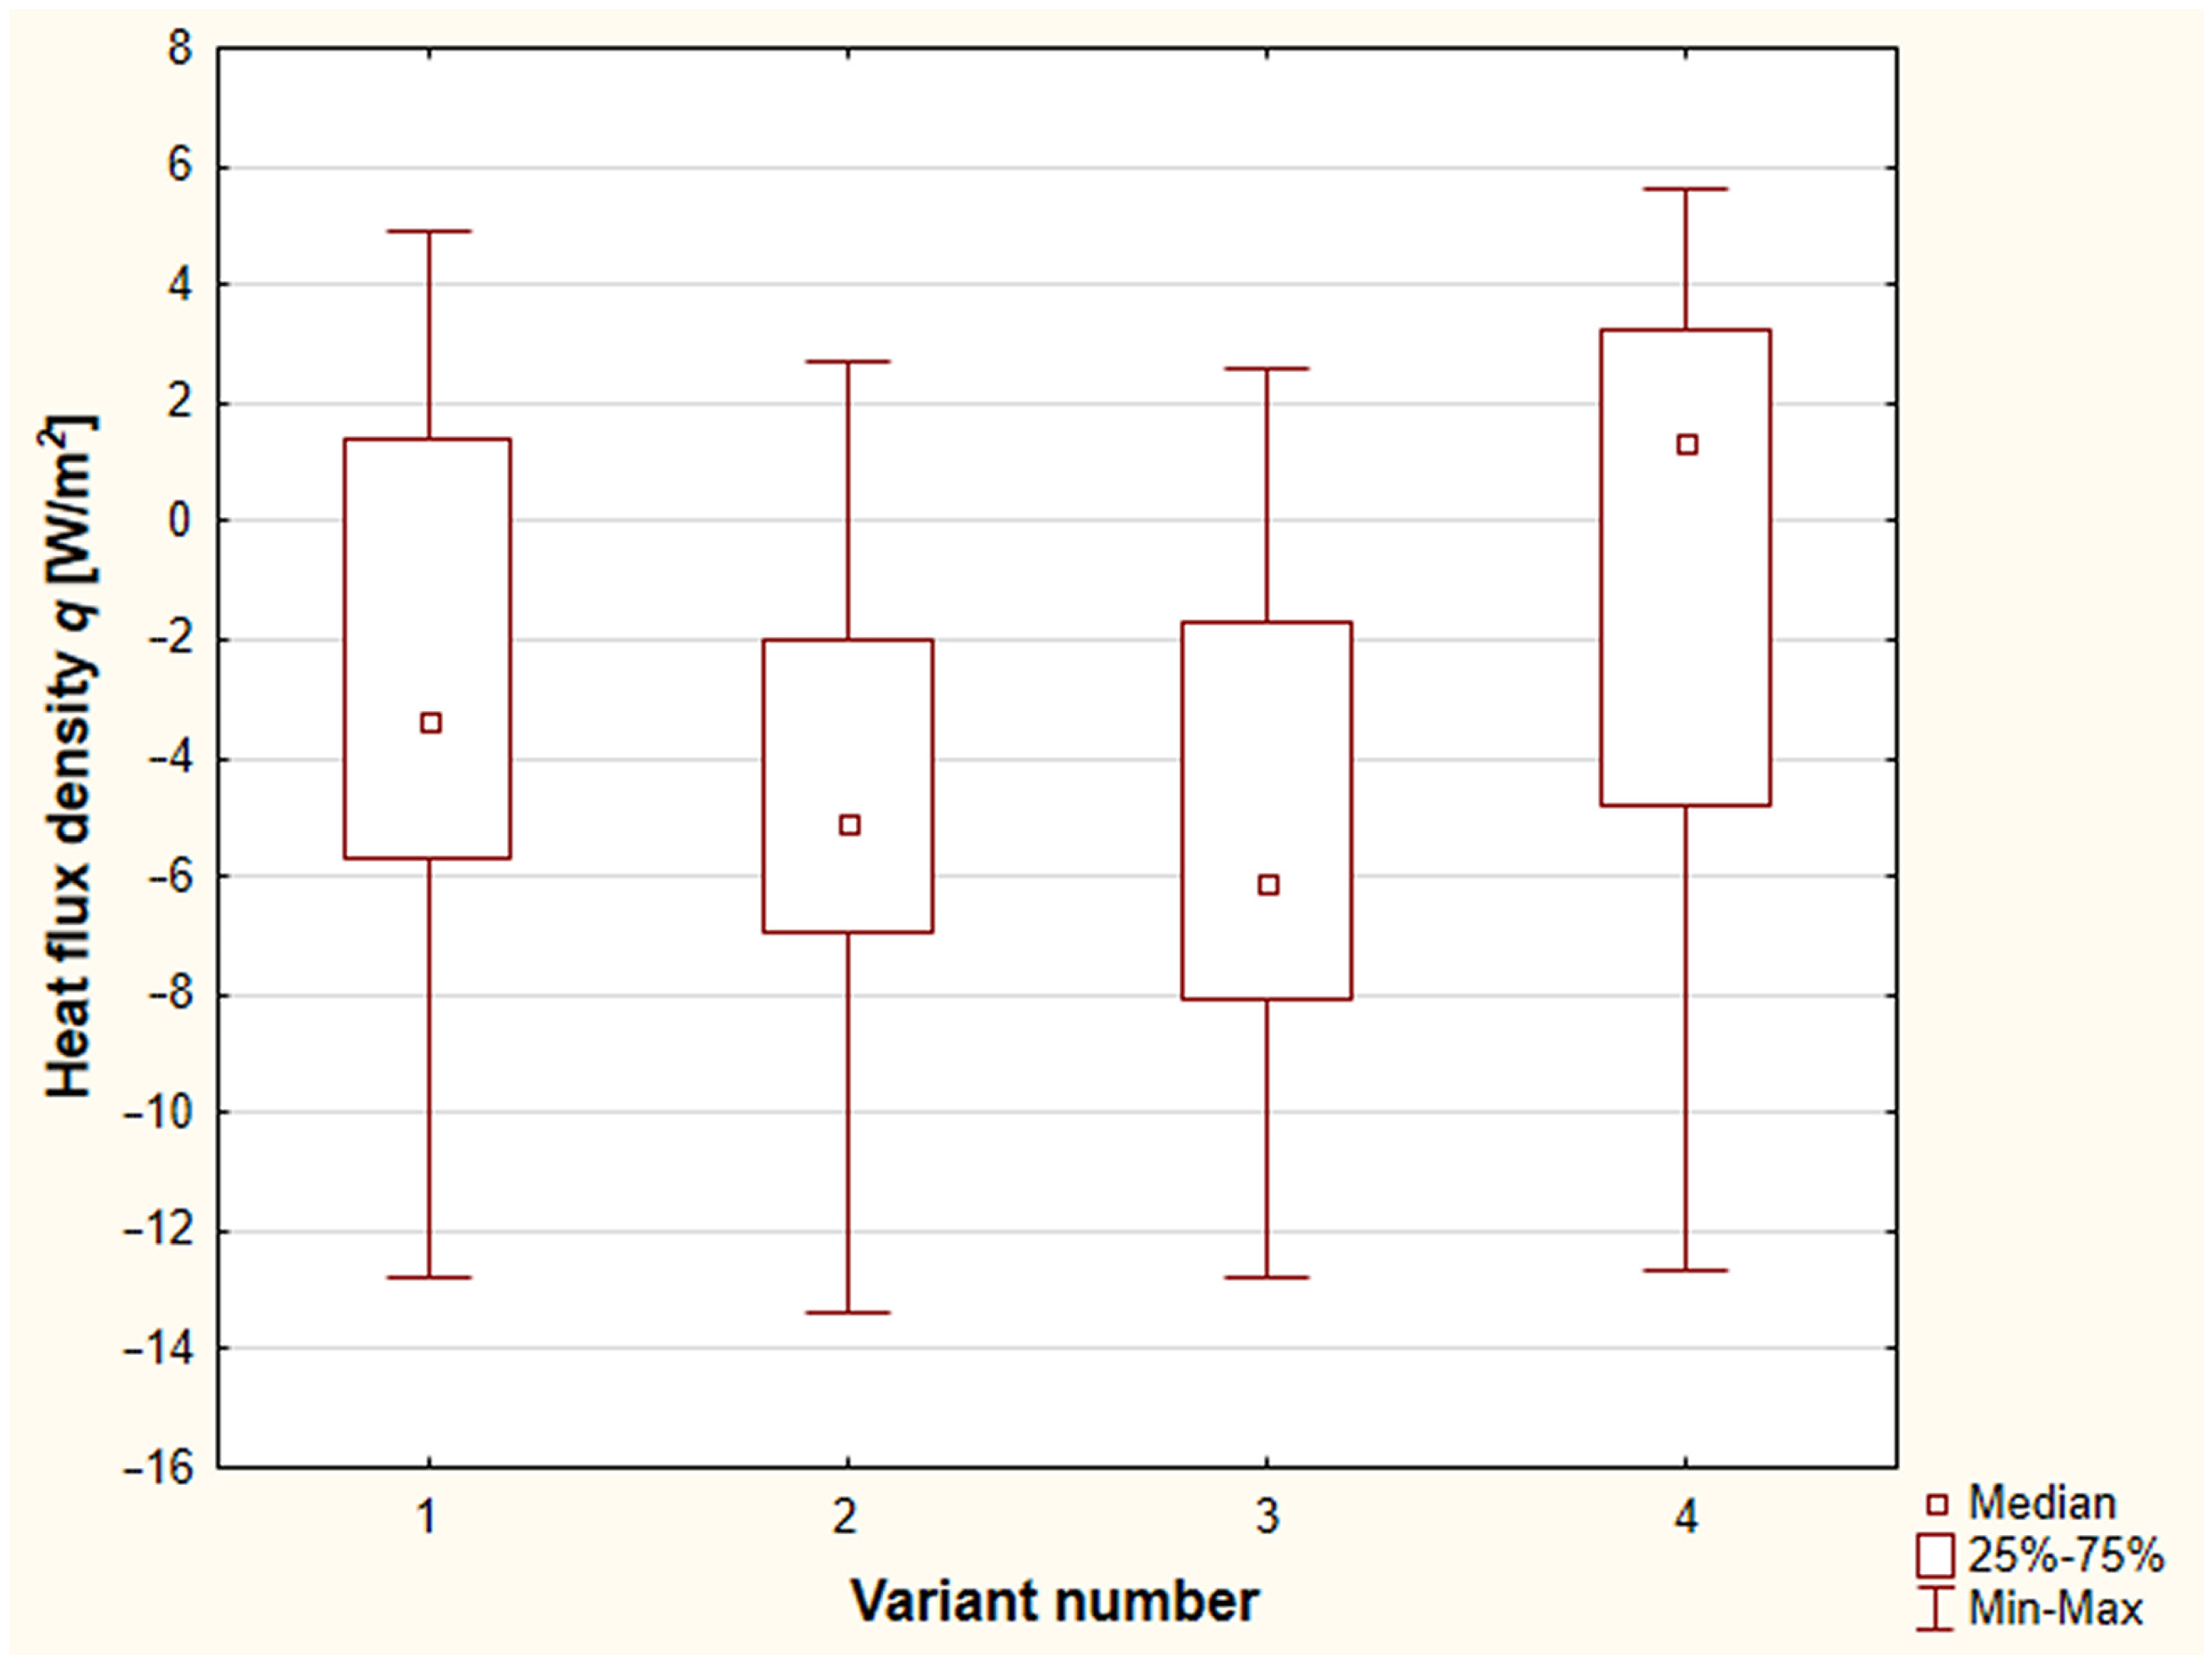
Figure 19 shows the statistical distribution of the heat flux density values for the individual variants of the partitions tested. The minimum and maximum values define the full range of values measured for a given variant. The central point defines the median value, that is, the heat flux value for 50% of the readings. The graph shows that variant four is characterised by the least favourable distribution of heat flow through the partition (the median value is positive and amounts to 1.32 W/m2, which means that more than 50% of the measured readings had a value above zero, so heat losses through the partition occurred in a period longer than the gains). In turn, in variants 2 and 3, over 75% of the readings had a negative value, that is, the period of gains was more than three times longer than the period of heat losses through the barrier.
The highest number of heat flux density in the range of −2.0 to −10.0 W/m2 occurred in the TSW-PCM2e and TSW-PCM2c partitions, while the highest number of observations in the range in which losses occurred was in the TSW-noPCM (Figure 20).

4. Discussion

An important feature of PCM is the ability to release the thermal energy stored in this material towards the inner surface of the partition over a longer period of time. Due to this phenomenon, the accumulated thermal energy can be used to reduce heat losses and the resulting drops in air temperature in the room during cloudy days.
It should be noted that the analysed time intervals are a fragment of a longer research period in which different climatic conditions occurred. They may have an impact on the preceding analysed research periods. Intervals were selected in which the initial values of the heat flux density were different, and heat losses or gains occurred.
In the first time interval from 23 November to 6 December, it was noted that with low solar radiation and lower outside air temperature, the most favourable heat flux density distribution occurred in variant II, that is, in the partition with two rows of PCM on the glazing side. In the remaining cases, in the TSW-PCM partitions, the statistical values did not differ significantly.
In the case of the time period from 17 to 25 February, it can be seen that during the low outside air temperature, the greatest differences were observed between the variant without PCM and the remaining partition variants.
In the period from 8 to 20 March, during the occurrence of higher outside air temperature values, the longest time interval for the transfer of accumulated thermal energy occurred in variants II and III, where the largest amount of phase-change material was present. In the first period of cloudy days, the heat flux density values were higher for variant III. This resulted from the process of overlapping the accumulated thermal energy from the entire solar period in the central part of the wall element. In the second period of cloudy days, similar flux values were obtained for variants II and III.

5. Conclusions

The aim of the article was to demonstrate differences in the values of the heat flux density in thermal storage walls modified with phase-change material. In the partitions, this material differed in quantity and location in the wall layer. Additionally, these partitions were compared to a reference wall without PCM.
The following conclusions were adopted:
  • At high sunlight and high outside temperature, there are no significant differences between TSW-PCM2e and TSW-PCM2c.
  • At low solar radiation and average external temperatures and then cloudy days, there are differences in heat flow between TSW-PCM2e and TSW-PCM2c. TSW-PCM2e heats up faster during sunny days, and PCM solidifies faster from the outside during cloudy days.
  • Regardless of weather conditions, the TSW-noPCM partition is the most dynamic in terms of heat flow both in the heating and cooling process.
  • In high sunlight and low outside temperatures, TSW-noPCM and TSW-PCM1e heat up the fastest, while TSW-PCM2e and TSW-PCM2c do not show any differences between them. TSW-noPCM cools down the fastest.
  • During sunny days, the TSW-PCM2c wall heats up the slowest because the thermal energy storage is located in the middle of the accumulation layer.
  • The TSW-PCM2e wall has the greatest accumulation capacity, and its cooling time is the longest.
  • For variable weather conditions, the optimal solution appears to be the walls of TSW-PCM2e and TSW-PCM2c.
  • Analysis of the temperature distribution in individual parts of the accumulation layer for the selected study period (from 17 to 25 February) showed that the phase change material undergoes a complete phase transformation at different times depending on the location of the PCM.
Further studies will focus on determining the proper location of PCM in the partition depending on the assumed effect (acquisition of the maximum amount of heat or extension of the stability of the comfortable temperature in the room during the period of no room heating) depending on the assumed solidification and melting temperatures of PCM. Based on the results obtained, it will be possible to select the appropriate solution for the configuration of the PCM-modified partition.

Author Contributions

Conceptualisation, J.K., P.M., A.S. and L.L.; methodology, J.K., P.M., A.S. and L.L.; software (Statistica 13.3 programme), J.K.; validation, J.K.; formal analysis, J.K., P.M., A.S. and L.L.; investigation, J.K. and P.M.; resources, J.K., P.M., A.S. and L.L.; data curation, J.K. and P.M.; writing—original draft preparation, J.K., P.M., A.S. and L.L.; writing—review and editing, J.K., P.M., A.S. and L.L.; visualisation, J.K., P.M. and A.S.; supervision, L.L.; project administration. J.K., P.M., A.S. and L.L.; funding acquisition, L.L. All authors have read and agreed to the published version of the manuscript.

Funding

This research received no external funding.

Data Availability Statement

Data are contained within the article.

Conflicts of Interest

The authors declare no conflicts of interest.

References

  1. Omeiza, L.A.; Abid, M.; Dhanasekaran, A.; Subramanian, Y.; Raj, V.; Kozak, K.; Mamudu, U.; Azad, A.K. Application of solar thermal collectors for energy consumption in public buildings—An updated technical review. J. Eng. Res. 2023; in press. [Google Scholar]
  2. Vahidhosseini, S.M.; Rashidi, S.; Hsu, S.-H.; Yan, W.-M.; Rashidi, A. Integration of solar thermal collectors and heat pumps with thermal energy storage systems for building energy demand reduction: A comprehensive review. J. Energy Storage 2024, 95, 112568. [Google Scholar] [CrossRef]
  3. Karaağaç, M.O.; Akıncı, B.; Ergün, A. Enhancing the performance of parabolic trough solar collectors: Cost-effective innovative designs for sustainable energy harvesting. Appl. Therm. Eng. 2024, 253, 123693. [Google Scholar] [CrossRef]
  4. Al-jarjary, A.S.; Ahmed, O.K.; Algburi, S. Enhancement methods for the performance of storage solar collectors: A brief review. Results Eng. 2024, 22, 102302. [Google Scholar] [CrossRef]
  5. Ayadi, B.; Al-Ebrahim, M.A.; Rajhi, W.; Abu-Hamdeh, N.H.; Nusier, O.K.; Pham, V.; Karimipour, A. Simultaneous use of renewable energies and phase change materials to reduce energy consumption in Saudi buildings: Examine the photovoltaic cells. Case Stud. Therm. Eng. 2024, 55, 104143. [Google Scholar] [CrossRef]
  6. Lis, M.; Antonov, V.; Olczak, P. Hybrid photovoltaic and energy storage system in order to enhance self-consumption energy—Poland case study. J. Energy Storage 2024, 91, 112096. [Google Scholar] [CrossRef]
  7. Yu, D.; Tan, X.; Liu, Z.; Li, D.; Wang, Z.; Yan, P.; Ni, J. Energy saving and carbon reduction schemes for hospital with photovoltaic power generation and system upgrading technology. Heliyon 2023, 9, e21447. [Google Scholar] [CrossRef]
  8. Guan, B.; Yang, H.; Li, H.; Gao, H.; Zhang, T.; Liu, X. Energy consumption characteristics and rooftop photovoltaic potential assessment of elevated metro station. SCS 2023, 99, 104928. [Google Scholar] [CrossRef]
  9. Lu, W. Dynamic Shading and Glazing Technologies: Improve Energy, Visual, and Thermal Performance. Energy Built Environ. 2024, 5, 211–229. [Google Scholar] [CrossRef]
  10. Xie, X.; Xu, B.; Fei, Y.; Chen, X.; Pei, G.; Ji, J. Passive energy-saving design strategy and realization on high window-wall ratio buildings in subtropical regions. Renew. Energy 2024, 229, 120709. [Google Scholar] [CrossRef]
  11. Xiao, Y.; Yang, Q.; Fei, F.; Li, K.; Jiang, Y.; Zhang, Y.; Fukuda, H.; Ma, Q. Review of Trombe wall technology: Trends in optimization. Renew. Sustain. Energy Rev. 2024, 200, 114503. [Google Scholar] [CrossRef]
  12. Faraj, K.; Khaled, M.; Faraj, J.; Hachem, F.; Castelain, C. Phase change material thermal energy storage systems for cooling applications in buildings: A review. Renew. Sustain. Energy Rev. 2020, 119, 109579. [Google Scholar] [CrossRef]
  13. Cabeza, L.F.; Castell, A.; Barreneche, C.; de Gracia, A.; Fernández, A.I. Materials used as PCM in thermal energy storage in buildings: A review. Renew. Sustain. Energy Rev. 2011, 15, 1675–1695. [Google Scholar] [CrossRef]
  14. Kośny, J.K.; Kossecka, E.; Brzezinski, A.; Tleoubaev, A.; Yarbrough, D.W. Dynamic thermal performance analysis of fiber insulations containing bio-based phase change materials (PCMs). Energy Build. 2012, 52, 122–131. [Google Scholar] [CrossRef]
  15. Tlili, I.; Alharbi, T. Investigation into the effect of changing the size of the air quality and stream to the trombe wall for two different arrangements of rectangular blocks of phase change material in this wall. J. Build. Eng. 2022, 52, 104328. [Google Scholar] [CrossRef]
  16. Marani, A.; Nehdi, M.L. Integrating phase change materials in construction materials: Critical review. Constr. Build. Mater. 2019, 217, 36–49. [Google Scholar] [CrossRef]
  17. Wang, X.; Li, W.; Luo, Z.; Wang, K.; Shah, S.P. A critical review on phase change materials (PCM) for sustainable and energy efficient building: Design, characteristic, performance and application. Energy Build. 2022, 260, 111923. [Google Scholar] [CrossRef]
  18. Sarbu, I.; Dorca, A. Review on heat transfer analysis in thermal energy storage using latent heat storage systems and phase change materials. Int. J. Energy Res. 2019, 43, 29–64. [Google Scholar] [CrossRef]
  19. Devaux, P.; Farid, M.M. Benefits of PCM underfloor heating with PCM wallboards for space heating in winter. Appl. Energy 2017, 191, 593–602. [Google Scholar] [CrossRef]
  20. Ismail, A.; Wang, J.; Salami, B.A.; Oyedele, L.; Otukogbe, G.K. Microencapsulated phase change materials for enhanced thermal energy storage performance in construction materials: A critical review. Constr. Build. Mater. 2023, 401, 132877. [Google Scholar] [CrossRef]
  21. Xia, L.; Zhang, P.; Wang, R.Z. Preparation and thermal characterization of expanded graphite/paraffin composite phase change material. Carbon 2010, 48, 2538–2548. [Google Scholar] [CrossRef]
  22. Al-Yasiri, Q.; Szabó, M. Incorporation of phase change materials into building envelope for thermal comfort and energy saving: A comprehensive analysis. J. Build. Eng. 2021, 36, 102122. [Google Scholar] [CrossRef]
  23. Żelazna, A.; Lichołai, L.; Krasoń, J.; Miąsik, P.; Mikušová, D. The Effects of Using a Trombe Wall Modified with a phase Change Material, from the Perspective of a Building’s Life Cycle. Energies 2023, 16, 7689. [Google Scholar] [CrossRef]
  24. Melcer, A.; Klugmann-Radziemska, E.; Lewandowski, W. Phase change materials. Properties, classification, advantages and disadvantages. Przemysł Chem. 2012, 91, 1000–1011. (In Polish) [Google Scholar]
  25. Al-Absi, Z.A.; Isa, M.H.; Ismail, M. Phase Change Materials (PCMs) and Their Optimum Position in Building Walls. Sustainability 2020, 12, 1294. [Google Scholar] [CrossRef]
  26. Rodriguez-Ubinas, E.; Ruiz-Valero, L.; Vega Sanchez, S.; Neila-González, F.J. Applications of Phase Change Material in highly energy-efficient houses. Energy Build. 2012, 50, 49–62. [Google Scholar] [CrossRef]
  27. Shchukina, E.; Graham, M.; Zheng, Z.; Shchukin, D. Nanoencapsulation of phase change materials for advanced thermal energy storage systems. Chem. Soc. Rev. 2018, 47, 4156. [Google Scholar] [CrossRef] [PubMed]
  28. Lamrani, B.; Johannes, K.; Kuznik, F. Phase change materials integrated into building walls: An updated review. Renew. Sustain. Energy Rev. 2021, 140, 110751. [Google Scholar] [CrossRef]
  29. Lachheb, M.; Younsi, Z.; Youssef, N.; Bouadila, S. Enhancing building energy efficiency and thermal performance with PCM-Integrated brick walls: A comprehensive review. Built Environ. 2024, 256, 111476. [Google Scholar] [CrossRef]
  30. Alawadhi, E.M. Thermal analysis of a building brick containing phase change material. Energy Build. 2008, 40, 351–357. [Google Scholar] [CrossRef]
  31. Hichem, N.; Noureddine, S.; Saifi, N.; Djamila, D. Experimental and Numerical Study of a Usual Brick Filled with PCM to Improve the Thermal Inertia of Buildings. Energy Procedia 2013, 36, 766–775. [Google Scholar] [CrossRef]
  32. Gao, Y.; He, F.; Meng, X.; Wang, Z.; Zhang, M.; Yu, H.; Gao, W. Thermal behavior analysis of hollow bricks filled with phase-change material (PCM). J. Build. Eng. 2020, 31, 101447. [Google Scholar] [CrossRef]
  33. Mahdaoui, M.; Hamdaoui, S.; Ait Msaad, A.; Kousksou, T.; El Rhafiki, T.; Jamil, A.; Ahachad, M. Building bricks with phase change material (PCM): Thermal performances. Constr. Build. Mater. 2021, 269, 121315. [Google Scholar] [CrossRef]
  34. Krasoń, J.; Lichołai, L. Thermal efficiency of a modified thermal storage wall containing phase change material in comparative test periods. E3S Web Conf. 2018, 49, 00059. [Google Scholar] [CrossRef]
  35. Lichołai, L.; Krasoń, J.; Miąsik, P.; Starakiewicz, A. Udział materiału zmienno-fazowego w pracy energetycznej przegrody kolektorowo-akumulacyjnej w przejściowych warunkach klimatycznych. J. Civ. Eng. Environ. Archit. (JCCEA) 2017, 64, 495–504. [Google Scholar] [CrossRef]
  36. Alawadhi, E.M.; Alqallaf, H.J. Building roof with conical holes containing PCM to reduce the cooling load: Numerical study. Energy Convers. Manag. 2011, 52, 2958–2964. [Google Scholar] [CrossRef]
  37. Ben Hamida, M.B.; Nguyen, L.M.Q.; Hajjar, A.; Izadi, M.; Sheremet, M.A.; Alrasheedi, N.H.; Hajlaoui, K. Role of applying PCMs on thermal behavior of innovative unit roof enclosure. J. Energy Storage 2024, 77, 109918. [Google Scholar] [CrossRef]
  38. Ben Hamida, M.B.; Hajlaoui, K.; Almeshaal, M.A. A 3D numerical analysis using phase change material for cooling circular light emitting diode. Case Stud. Therm. Eng. 2023, 43, 102792. [Google Scholar] [CrossRef]
  39. PCM RT-Line. Available online: https://www.rubitherm.eu/en/index.php/productcategory/organische-pcm-rt (accessed on 15 September 2024).
  40. Textbook. Available online: https://www.statsoft.pl/textbook/stathome.html (accessed on 15 September 2024).
  41. Siegel, S. Nonparametric Statistics for the Behavioral Sciences; McGraw-Hill Book Company, Inc.: New York, NY, USA, 1956; pp. 184–193. [Google Scholar]
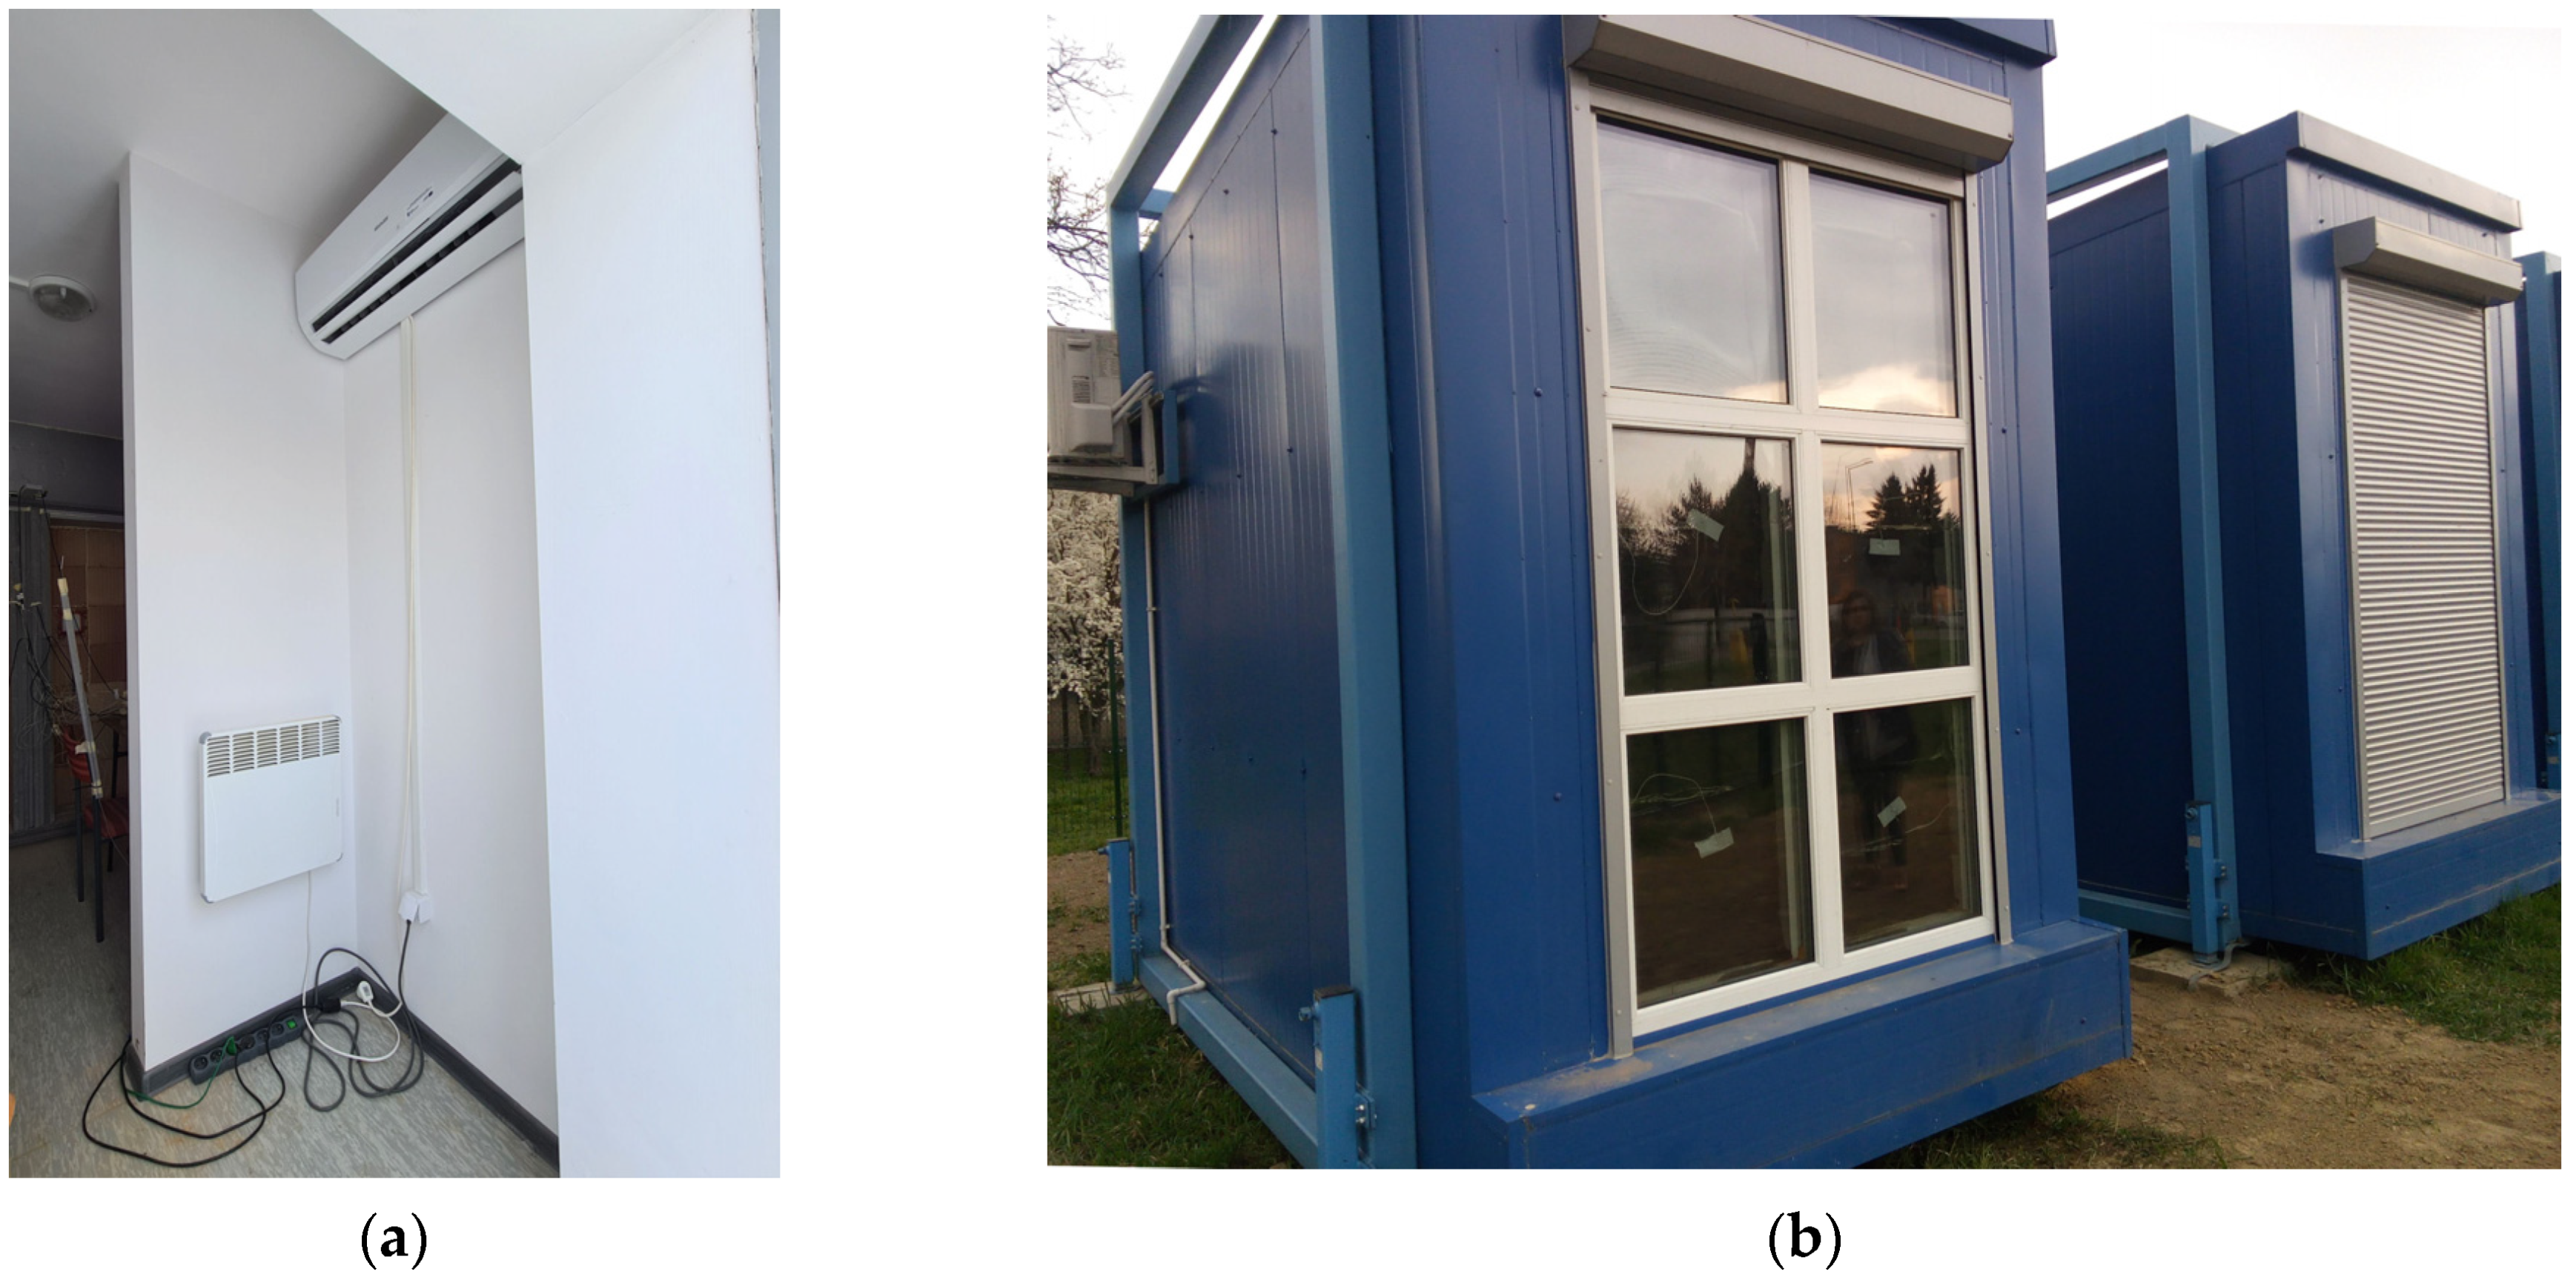
Figure 1. Test stand: (a) view of the heating and cooling device and (b) collector.
Energies 18 01433 g001
Figure 2. Equipment used in the research: (a) stationary and portable recorders and (b) thermocouple and plate heat flow metre.
Energies 18 01433 g002
Figure 3. Types of wall layer: (a) Variant I (TSW-PCM1e), (b) Variant II (TSW-PCM2e), (c) Variant III (TSW-PCM2c), and (d) Variant IV (TSW-noPCM).
Energies 18 01433 g003
Figure 4. TSWs placed in the chamber: (a) diagram and (b) view.
Energies 18 01433 g004
Figure 5. Sensor arrangement in the wall: (a) diagram and (b) view.
Energies 18 01433 g005
Figure 6. Distribution of the solar radiation intensity and outside air temperature values in the period from 23 November to 6 December.
Energies 18 01433 g006
Figure 7. Distribution of the density of heat flux for the tested walls in the period from 23 November to 6 December.
Energies 18 01433 g007
Figure 8. Graph based on the median for the TSW-PCM and TSW-noPCM partitions in the period from November 23 to December 6.
Energies 18 01433 g008
Figure 9. Categorised histograms for the analysed TSW-PCM and TSW-noPCM partitions in the period from 23 November to 6 December.
Energies 18 01433 g009
Figure 10. Distribution of the solar radiation intensity values and the outside air temperature in the period from 17 to 25 February.
Energies 18 01433 g010
Figure 11. Distribution of the density of heat flux for the tested walls in the period from 17 to 25 February.
Energies 18 01433 g011
Figure 12. Temperature distribution in the first row of slots (from the outside) located in the accumulation layer in the period from 17 to 25 February.
Energies 18 01433 g012
Figure 13. Temperature distribution in the second row of slots (from the outside) located in the accumulation layer in the period from 17 to 25 February.
Energies 18 01433 g013
Figure 14. Temperature distribution in the third row of slots (from the outside) located in the accumulation layer in the period from 17 to 25 February.
Energies 18 01433 g014
Figure 15. Graph based on the median for the tested TSW-PCM and TSW-noPCM partitions in the period from 17 to 25 February.
Energies 18 01433 g015
Figure 16. Categorised histograms for the analysed TSW-PCM and TSW-noPCM partitions from 17 to 25 February.
Energies 18 01433 g016
Figure 17. Distribution of the solar radiation intensity values and the outside air temperature in the period 8 to 20 March.
Energies 18 01433 g017
Figure 18. Distribution of the density of heat flux for the tested walls in the period of 8 to 20 March.
Energies 18 01433 g018
Figure 19. Graph based on the median for the tested TSW-PCM and TSW-noPCM partitions in the period from 13 to 20 March.
Energies 18 01433 g019
Figure 20. Categorised histograms for the analysed TSW-PCM and TSW-noPCM partitions in the period from 13 to 20 March.
Energies 18 01433 g020
Table 1. Properties of the glazing sets.
Type of
Glazing Set
Construction
of the Set
Coefficient
Ug
Coefficient
g
Thickness
of the Set
--(W/m2K)(%)(mm)
G1LE 4/16Ar/4/16Ar/33.1LE+A(SSP G) 40.65044
Table 2. Results of the Kruskal–Wallis ANOVA test of ranks and multiple comparisons of mean ranks for all partitions from 23 November to 6 December.
Research Period: 23 November–6 December 2017
Dependent: Heat Flux Density
qWi
p-Value for Multiple Comparisons.
Independent (Grouping) Variable: Variant No.
K-W Test: H (3, N = 1344) = 32.32604 p = 0.0000
-1
R:700.17
2
R:568.60
3
R:706.95
4
R:714.28
TSW-PCM1e 0.0000671.0000001.000000
TSW-PCM2e0.000067 0.0000230.000007
TSW-PCM2c1.0000000.000023 1.000000
TSW-noPCM1.0000000.0000071.000000
Table 3. Results of the Kruskal–Wallis ANOVA test of ranks and multiple comparisons of mean ranks for all partitions from 17 to 25 February.
Research Period: 17–25 February 2018
Dependent: Heat Flux Density
qWi
p-Value for Multiple Comparisons.
Independent (Grouping) Variable: Variant No.
Test K-W: H (3. N = 864) = 12.42811 p = 0.0061
-1
R:422.19
2
R:406.85
3
R:417.52
4
R:483.44
TSW-PCM1e 1.0000001.0000000.064521
TSW-PCM2e1.000000 1.0000000.008556
TSW-PCM2c1.0000001.000000 0.036292
TSW-noPCM0.0645210.0085560.036292
Table 4. Results of the Kruskal–Wallis ANOVA test of ranks and multiple comparisons of mean ranks for all partitions from 13 to 20 March.
Research Period: 13–20 March 2018.
Dependent: Heat Flux Density
qWi
p-Value for Multiple Comparisons.
Independent (Grouping) Variable: Variant No.
Test K-W: H (3. N = 768) = 111.8052 p = 0.000
-1
R:414.53
2
R:321.90
3
R:292.83
4
R:508.74
TSW-PCM1e 0.0002570.0000000.000190
TSW-PCM2e0.000257 1.0000000.000000
TSW-PCM2c0.0000001.000000 0.000000
TSW-noPCM0.0001900.0000000.000000
Disclaimer/Publisher’s Note: The statements, opinions and data contained in all publications are solely those of the individual author(s) and contributor(s) and not of MDPI and/or the editor(s). MDPI and/or the editor(s) disclaim responsibility for any injury to people or property resulting from any ideas, methods, instructions or products referred to in the content.