Article

Analysis and Research on the Flow Characteristics of Ice-Containing Filling Slurry Based on the Population Balance Model

1
Energy School, Xi’an University of Science and Technology, Xi’an 710054, China
2
Key Laboratory of Western Mines and Hazards Prevention, Ministry of Education of China, Xi’an 710054, China
*
Authors to whom correspondence should be addressed.
Energies 2025, 18(6), 1430; https://doi.org/10.3390/en18061430
Submission received: 6 February 2025 / Revised: 10 March 2025 / Accepted: 11 March 2025 / Published: 13 March 2025
(This article belongs to the Section B: Energy and Environment)

Abstract

:
In practical engineering applications, the cold storage functional backfill cooling system is prone to pipe clogging due to the agglomeration and crushing effects of the components of the ice particle-containing filling slurry. In addition, the fluidity of the slurry becomes more complex due to the change in the particle size distribution (PSD) during the pipeline transportation of the filling slurry, which limits the practical application effectiveness of the system. In order to promote the application and sustainable development of mining solid waste resources, a CFD–PBM coupling model was established to simulate the flow of the ice-containing filling slurry in horizontal circular tubes. On this basis, the effects of the initial ice content, inlet flow rate, initial particle size of tailings, and filling slurry concentration on the caking phenomenon during pipeline transportation were analyzed. The distribution of the pressure drop along the pipeline was also analyzed and calculated. The results show that the higher the flow velocity, the lower the slurry concentration, the larger the tailings’ particle size, the lower the ice content, and the lower the likelihood of agglomeration during transportation of the filling slurry.

1. Introduction

The cold storage backfill cooling system has significant advantages in mine cooling and mine solid waste treatment. By adding ice particles to the filling slurry, the adjacent stope can be cooled radiatively [1,2,3]. As the core link of the system, the safe transportation of ice-containing filling slurry [4,5] is key to ensuring the stable operation of the system. Due to the differences in density among the components in the ice slurry, it exhibits non-uniform characteristics during pipeline transportation. This non-uniformity is closely related to flow velocity, pipe diameter, and the particle size of tailings [6]. In the conveying process, the filling slurry will not only segregate and settle but also experience agglomeration and the crushing of tailings particles [7,8], leading to changes in the distribution of dynamic particle sizes and causing pipeline blockage issues.
In view of the pipeline transport characteristics of filling slurry, scholars have conducted extensive research. Based on fluent simulations, Zhang [9] revealed the feasibility of non-powered transportation of filling slurry using coal gangue as the main aggregate and established a hydraulic gradient prediction model. Wang [10] conducted a filling slurry ratio test and a transportation characteristic test for total tailings with high sulfur content and extremely fine particle sizes to optimize their performance in engineering applications. Zhang Liang [11] determined the rheological parameters of high-concentration slurry through experiments and carried out numerical simulations of the flow process of slurry in pipelines using ANSYS software. However, the above studies mostly focus on the flow characteristics and ratio optimization of the filling slurry and pay relatively little attention to the settlement mechanism. In terms of settlement behavior, Guo Jiang [12] used a fluid–solid coupling method to analyze the slurry deposition mechanism. Jesse Capecelatro [13] used an Euler–Lagrange model to study the laws of slurry flow and settlement in horizontal pipes. Sunil K. Arora [14] used the Euler–Lagrange model combined with large eddy simulation (LES) to numerically simulate the flow and settling behavior of slurry in turbulent pipelines. However, existing models generally simplify the filling slurry into a single particle size of solid–liquid two-phase flow, ignoring that the actual filling slurry is a complex multiphase flow system composed of water and different particle sizes of tailings [15,16,17]. Liu Lang [18] used a mixed multiphase flow model to study the settling behavior of ice-containing filling slurry with two different particle size combinations under various ice–water ratios [19]. However, the modeling problem of the dynamic particle size evolution of ice-containing filling slurry during transportation remains unsolved. In the actual transportation process, the particle size distribution (PSD) of the tailings particles in the pipeline changes due to collisions, agglomeration, and crushing between the particles, which may lead to pipe blockages and even pipe explosions.
In the mine filling operation, research on the dynamic characteristics of the PSD of ice-containing filling slurry is insufficient; nevertheless, studies on the flow characteristics of other slurries can provide valuable references for related research on ice-containing filling slurry. Among them, Onokoko [6] used a single-phase flow model to study the flow characteristics of propylene glycol ice slurry in a horizontal circular pipe and found that the ice particles were evenly distributed in the main stream area of the pipe but unevenly distributed near the pipe wall. However, the single-phase flow model is an idealized and simplified method for studying the flow characteristics of ice slurry. In fact, ice slurry is a complex two-phase mixture of solid and liquid phases. To capture the flow characteristics of the solid–liquid two-phase flow of ice slurry, Wang [20] used a mixed computational fluid dynamics model to study the flow characteristics of ice slurry with an average particle size of 100 μm in a horizontal circular pipe, analyzing the distribution of the velocity, ice particle concentration, and pressure drop. It was found that the rheological behavior of ice slurry is significantly affected by the asymmetric flow distribution. Mohammad Rezaeip [21] combined the Euler–Euler model (EEM) with particle dynamics theory to study the viscosity characteristics of ice particles in ice slurry in a continuous U-shaped tube. Amin Kamyar [22] used the EEM to discuss the effects of particle diameter, inlet velocity, and ice volume fraction on the particle distribution and pressure drop of ice slurry in a U-shaped tube. The results show that the particle diameter and ice volume fraction are negatively correlated with the distribution trend of ice slurry particles in the pipeline. From the above analysis, it can be seen that the traditional two-phase flow model can simulate ice slurry behavior under different working conditions. However, the model assumes that the solid particle diameter in the ice slurry remains unchanged and ignores the particle size changes caused by agglomeration and fragmentation during the actual flow process. This assumption lacks multi-scale dynamic verification, which is essential for accurately modeling these changes.
As the traditional multiphase flow model cannot accurately simulate the dynamic changes in particle size, many scholars introduced the population balance model (PBM) to solve this issue and deeply study the agglomeration and fragmentation mechanisms of particles inside the slurry, thereby revealing the evolution laws of the PSD. Cai [23] used the computational fluid dynamics–population balance model (CFD–PBM) to analyze the flow characteristics of ice slurry in a 90° bend pipe, solved the PBM using the method of moments, and obtained the particle size distribution characteristics of ice slurry particles in the pipe. Sha Mi [24] conducted an exhaustive study on the particle size distribution characteristics of ice slurry in horizontal circular and U-shaped tubes using the EEM. The results showed that the PSD of ice slurry particles during the flow process is multiply affected by the flow rate, initial particle size, and ice content. In particular, the size distribution of ice slurry particles inside the U-tube exhibits more significant inhomogeneity. Qun Du [25] studied the flow characteristics of ice slurry in horizontal water tubes during the supercooling release process, as well as the evolution and distribution of ice particles in the supercooled water. The PBM was used to analyze the growth, aggregation, and fragmentation of ice slurry particles, considering the effects of flow velocity, subcooling, and inlet ice volume fraction. Although the above scholars used the CFD–PBM to numerically simulate the flow characteristics of slurry, they did not systematically compare the differences between the traditional CFD method and the CFD–PBM method. Dan Xu [26] conducted a quantitative comparative analysis of the differences between the CFD–PBM method and the traditional CFD method in simulating the flow characteristics of ice slurry. The results show that the two methods exhibit significant differences in the distribution of ice particle size, velocity near the wall, and ice volume fraction when simulating ice slurry flow. Tao Jin [27] used the CFD–PBM model to conduct a deep analysis of the flow characteristics of slush nitrogen particles in horizontal pipes and calculated the changes in PSD caused by particle breakage. Compared with the traditional two-fluid model, this numerical model significantly improves performance in simulating slush nitrogen flow. In summary, compared with the traditional CFD model, the CFD–PBM method can more accurately describe the flow characteristics of ice slurry in pipelines based on actual ice grain size distribution, meaning that the simulation results are closer to reality. In addition, the CFD–PBM model realizes bidirectional tight coupling between the particle phase and the liquid phase by considering the agglomeration and fragmentation behavior of particles and combining this with interphase forces, thus capturing and simulating the complex dynamic behavior of multiphase flow more accurately [28,29,30].
In view of the current research gap in the dynamic particle size distribution characteristics of ice-containing filling slurry, this paper systematically studies the flow characteristics of ice-containing filling slurry using the coupling method of the Euler–Euler two-fluid model and the population balance model to promote the efficient application of filling operations in practical engineering and reduce pipeline blockages. Specifically, a multiphase flow model of ice particles, tailings, and slurry was established, and the influences of ice content, flow velocity, tailings’ particle size, and slurry concentration on the flow characteristics of ice-containing filling slurry in the pipeline were quantitatively analyzed. Combined with the kinetics of particle coalescence and breakage, the spatiotemporal evolution law of the PSD in the pipeline was revealed, providing a theoretical basis for optimizing the mine’s filling system. Furthermore, this study addressed the theoretical gap in the dynamic particle size evolution mechanism of filling slurry containing ice particles, which has significant implications for improving filling efficiency and promoting the resource utilization of solid waste.

2. Theoretical Model

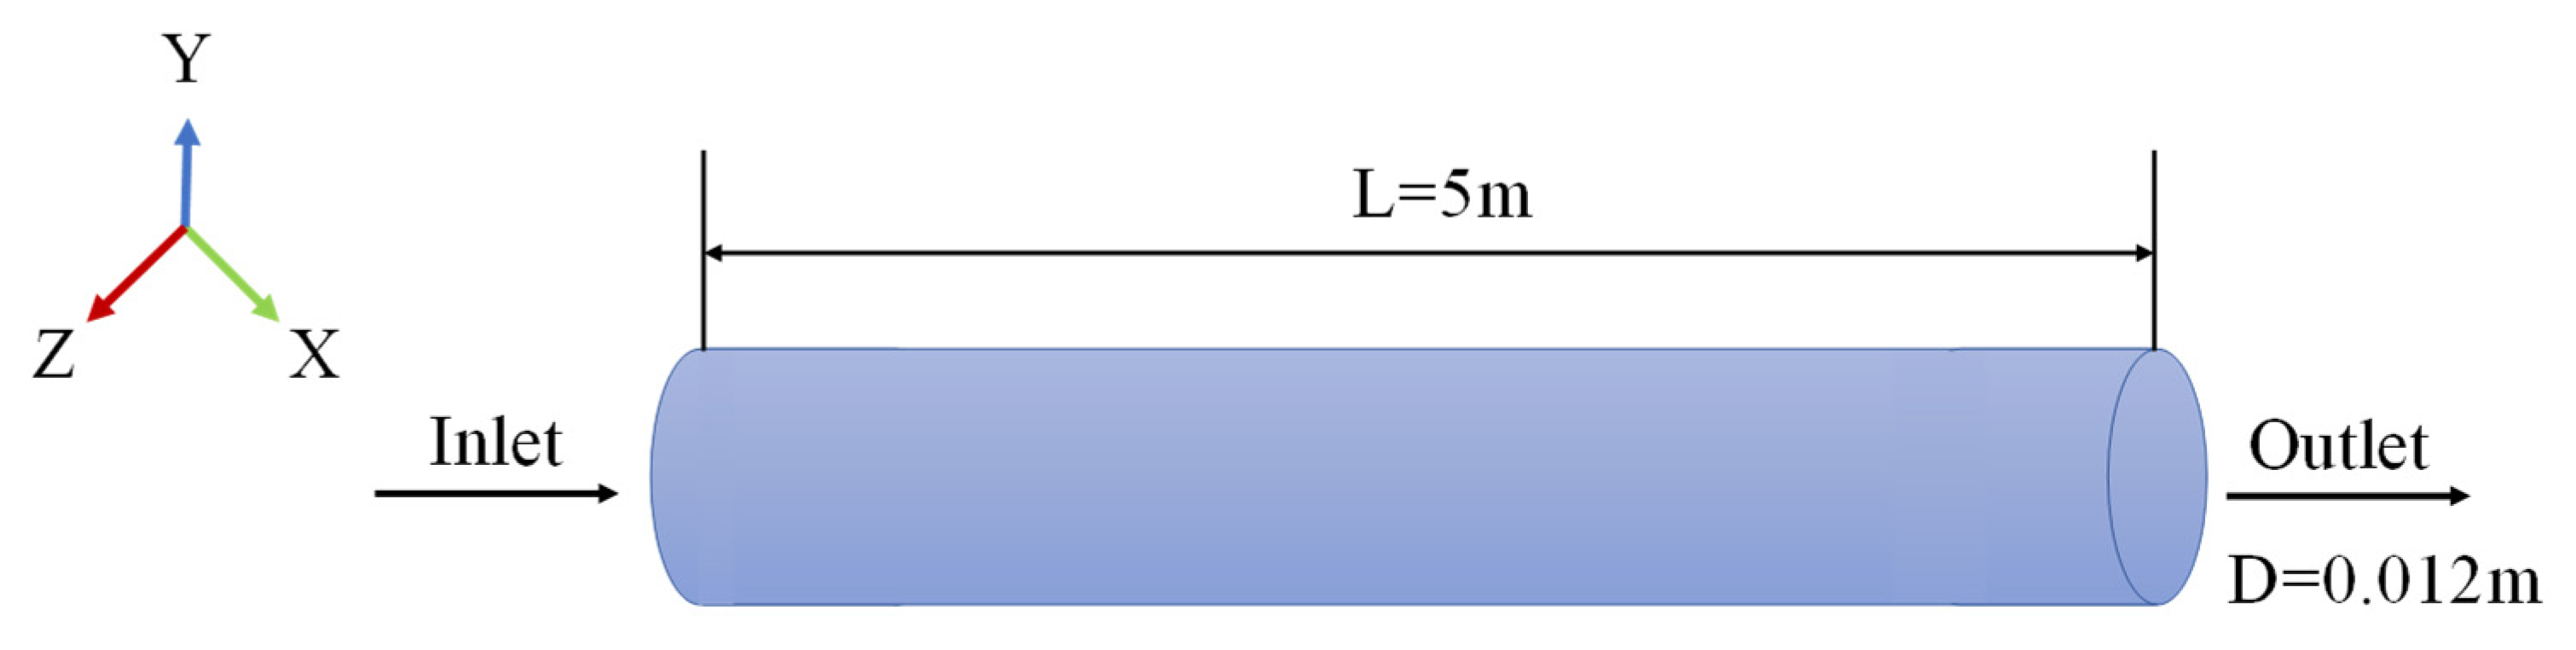
2.1. Geometric Model

A section of a circular tube with a length of 5 m and a diameter of 0.012 m was selected as the object for numerical simulation. Figure 1 shows the dimensions of the circular pipe.

2.2. Governing Equations

In this paper, the EEM was selected to simulate the flow of the ice-containing filling slurry in a circular tube. The ice-containing filling slurry is mainly composed of ice, water, and tailings, and its main physical parameters are shown in Table 1.
In this study, to establish appropriate governing equations, we made the following assumptions:
(1)
When the ice particle-containing slurry flows in a circular tube, it is assumed that the inlet velocity remains constant;
(2)
It is assumed that the flow of fillers containing ice particles in the pipeline is in a heterogeneous isothermal flow state.
In this model, water and ice particles are regarded as a continuous fluid, and tailings as a granular phase. Both the continuous phase and the granular phase have their own governing equations.

2.2.1. Multiphase Flow Model

The continuity equation:
t ( α l ρ l ) + ( α l ρ l v l ) = 0
t ( α s ρ s ) + ( α s ρ s v s ) = 0
The expression for the volume fraction is shown below:
α s + α l = 1
where α is the volume fraction; ρ represents the density; v represents the vector value of the velocity. s represents the solid phase (in this case, tailings), and l represents the liquid phase (in this case, water and ice).
The momentum equation for the liquid phase is as follows:
t ( α l ρ l v l ) + ( α l ρ l v l v l ) = α l P + τ l ¯ ¯ + α l ρ l g + F s l
τ l ¯ ¯ = α l μ l , e f f [ v l + ( v l ) T ] 2 3 α l μ l , e f f ( v l ) I ¯ ¯
The momentum equation of the particle phase is as follows:
t ( α s ρ s v s ) + ( α s ρ s v s v s ) = α s P + τ s ¯ ¯ + α s ρ s g + F l s
τ s ¯ ¯ = α s v s [ v s + ( v s ) T ] α l ( λ s 2 3 v s ) ( v s ) I ¯ ¯
where P is the pressure; τ s ¯ ¯ is the shear stress of the solid phase; τ l ¯ ¯ is the shear stress of the liquid phase; μ l , e f f is the viscosity of the liquid phase; F is the force between the solid and liquid phases; and g is the acceleration due to gravity.

2.2.2. Turbulence Model

The ice-containing filling slurry is transported through the pipeline in a turbulent flow regime. Therefore, this paper adopts the standard k ε turbulence model to study the turbulent process of the ice-containing filling slurry. The specific turbulence equation is shown as follows [31]:
( ρ k ν ) = ( μ t σ k k ) + G k ρ ε
( ρ ε ν ) = ( μ t σ ε ε ) + ε k + ( C 1 ε G k C 2 ε ρ ε )
where: k is the turbulent kinetic energy; ε is the turbulent dissipation rate; and G k is the turbulence kinetic energy generated by the laminar velocity gradient. μ t = ρ C μ k 2 ε is the eddy mean viscosity; C μ = 0.09 , C 1 ε = 1.44 , C 2 ε = 1.92 , σ k = 1 , σ ε = 1.3 .

2.2.3. Particle Dynamics Model

When solving the constitutive equation of the phase in the filling slurry containing ice particles, the viscosity of the tailing sand cannot be found directly. Therefore, the fluid dynamics theory of particles was used in this paper to describe tailings particles and calculate their viscosity [32]. This is mainly achieved by treating solid particles as dense gases, assuming that the particles flow and collide with each other due to the hot molecular motion of the gas. The wave energy of the solid particles can be expressed by the temperature of the particles. θ s represents the particle’s temperature, expressed as follows:
θ s = 1 3 v s i v s i ¯
where v s i is the pulse speed of the solid particle.
θ s is calculated using the following energy transfer equation [27]:
3 2 t ( ρ s α s θ s ) + ( ρ s α s θ s v s ) = P s τ s ¯ ¯ v s + ( h θ s θ s ) γ θ s + ϕ l s
where:
γ θ s = 12 ( 1 e s s 2 ) g 0 . s s d s π ρ s α s 2 θ s 3 / 2
ϕ l s = 3 k s l θ s
h θ s = 150 ρ s d p θ s π 384 ( 1 + e s s ) 6 5 ( 1 + e s s ) α s g o + 1 2 + 2 ρ s d p g o α s 2 ( 1 + e s s ) θ s π 1 / 2
P s = α s ρ s θ s + 2 ρ s θ s g 0 α s 2 ( 1 + e s s )
where: γ θ s is the collision dissipation rate of energy per unit volume; ϕ l s is the energy transfer rate between the solid phase and the liquid phase; P s represents the particle phase pressure; e s s is the restitution coefficient of the collision between particles; h θ s is the particle temperature diffusion coefficient; and g 0 is the radial distribution function, which can be expressed as:
g 0 = 1 α s α s , max 1 / 3 1
The shear viscosity of the solid, denoted by μ s , is presented as follows [33]:
μ s = 4 5 α s ρ s d s g 0 ( 1 + e s s ) θ s π + 10 ρ s d s θ s π 6 ( 3 e s s ) 1 + 4 5 g 0 α s ( 1 + e s s ) 2 + P s sin ϕ 2 I 2 D
The solid volume viscosity, denoted by ζ s , is presented as follows [34]:
ζ s = 4 3 α s 2 ρ s d s g 0 ( 1 + e s s ) θ s π
where: d s is the particle size of the solid phase, expressed by the Sauter diameter [35].
The effects of drag and lift were considered in this study. Drag plays a dominant role in the interphase force [36], which has a mathematical expression:
F D = h s l ( v s v l )
where h s l is the momentum exchange coefficient between the solid phase and the liquid phase, expressed as follows [37]:
h s l = 3 C D α s α l ρ l v l v s α l 2.65 4 d s ( α s < 0.2 ) 150 α s 2 μ 1 α l d s + 1.75 ρ 1 α s v l v 2 d s ( α s > 0.2 )
C D represents the resistance coefficient obtained by Schiller and Naumann [38], which can be expressed as:
C D = 24 Re s [ 1 + 0.15 ( Re s ) 0.687 ] ( Re s 1000 ) 0.44 ( Re s > 1000 )
This paper mainly considers Staffman’s lift [39], which is expressed as follows:
F L = C l α s ρ l ( v l v s ) × ( v l )

2.2.4. PBM Model

The PBM model was introduced to research the evolution and distribution characteristics of the particle size of the filling slurry containing ice particles during pipeline transportation. The PBE (population balance equation) is used to describe the evolution process of the PSD over time caused by particle nucleation, growth, agglomeration, fragmentation, and other behavior processes. The PBE is expressed as follows [40]:
n ( P : x , t ) t + [ v s n ( p : x , t ) ] + [ G ( p ) n ( P : x , t ) ] P = B a g ( P : x , t ) D a g ( P : x , t ) + B b r ( P : x , t ) D b r ( P : x , t )
where n ( P : x , t ) represents the quantity density function with particle size; and G ( P ) n ( P : x , t ) is the growth rate of tailings particles. Because the filling slurry containing ice particles transported in the pipeline is in an isothermal flow state, the growth process of tailings particles is not studied in this paper. v s represents the velocity vector of the particle; B a g ( P : x , t ) and D a g ( P : x , t ) represent the growth and reduction rates of tailings particles due to the agglomeration effect, respectively; and B b r ( P : x , t ) and D b r ( P : x , t ) represent the growth and reduction rates of tailings particles due to the crushing effect, respectively.
In this study, the integral approximation-based QMOM method is used to solve the PBE. The moments of the PSD of tailings are defined as follows [41]:
m k ( x , t ) = 0 n ( P : x , t ) P k k d P
where k k is the number of moments.
According to the method of moment conversion presented here, the moment of the PBE is expressed as:
m k k t + v m k k = 0 k k P k k 1 G ( P ) n ( P : x , t ) d P + B a g ( P : x , t ) D a g ( P : x , t ) + B b r ( P : x , t ) D b r ( P : x , t )
where, B a g ( P : x , t ) , D a g ( P : x , t ) , B b r ( P : x , t ) and D b r ( P : x , t ) expand as follows:
B a g = 1 2 0 n ( λ : x , t ) 0 β ( P , λ ) ( P 3 + λ 3 ) k k / 3 n ( λ : x , t ) d P d λ
D a g = 0 P k k n ( λ : x , t ) 0 β ( P , λ ) n ( λ : x , t ) d P d λ
B b r = 0 P k k 0 a ( λ ) b ( P / λ ) n ( λ : x , t ) d P d λ
D b r = 0 P k k a ( P ) n ( P : x , t ) d P
where β ( P , λ ) is the agglomeration probability of two tailing particles with lengths P and λ , respectively, a ( P ) represents the crushing probability of tailing particles with length P , and b ( P / λ ) represents the probability of tailing particles with length P fragmenting into particles of size λ .
The OMOM method uses Gaussian orthogonal approximation to solve the above equation, and the algorithm is presented as follows:
m k ( x , t ) = 0 n ( P ; x , t ) d k k d P i = 1 N w i P i k
In this formula, w i and P i k represent the characteristic weights and the characteristic abscissa, respectively, and can be obtained through the difference calculation of low-order moments. According to the above Gaussian orthogonal approximation method, this can be converted to a PBE of moments [24]:
m k t + [ u m k ] = 1 2 i = 1 N w i j = 1 N w j ( P j = 1 N ) ( P i 3 + P j 3 ) k k / 3 β ( P i , P j ) i = 1 N P i k w i j = 1 N w j β ( P i , P j ) + i = 1 N w i 0 P k k a ( P i ) q ( P / P i ) d P i = 1 N P i k w i a ( P i )

2.2.5. Agglomeration and Fragmentation Model

Brownian motion and the turbulent flow of fluids are the main factors affecting solid collision frequency during the conveying of filler slurry in the pipeline. Therefore, the agglomeration model proposed by Marchisio is adopted in this paper, and the expression is as follows [42]:
β ( P , λ ) = 2 k B T 3 μ ( P + λ ) 2 P λ + 4 3 3 π 10 1 / 2 ε ν 1 / 2 ( P + λ ) 3
Contrary to the agglomeration dynamic process of tailings particles, the crushing dynamic process describes how tailings particles break into smaller pieces due to collision and other factors. The original particle size and minimum turbulent vortices are the main influences in this process. In this paper, a crushing model determined by the system’s turbulent velocity is adopted as follows [43]:
α ( P ) = c 1 ν c 2 ε c 3 P c 4
In this formula, the values of c 1 ~ c 4 are 0.006, −1.25, 0.75, and 1, respectively.

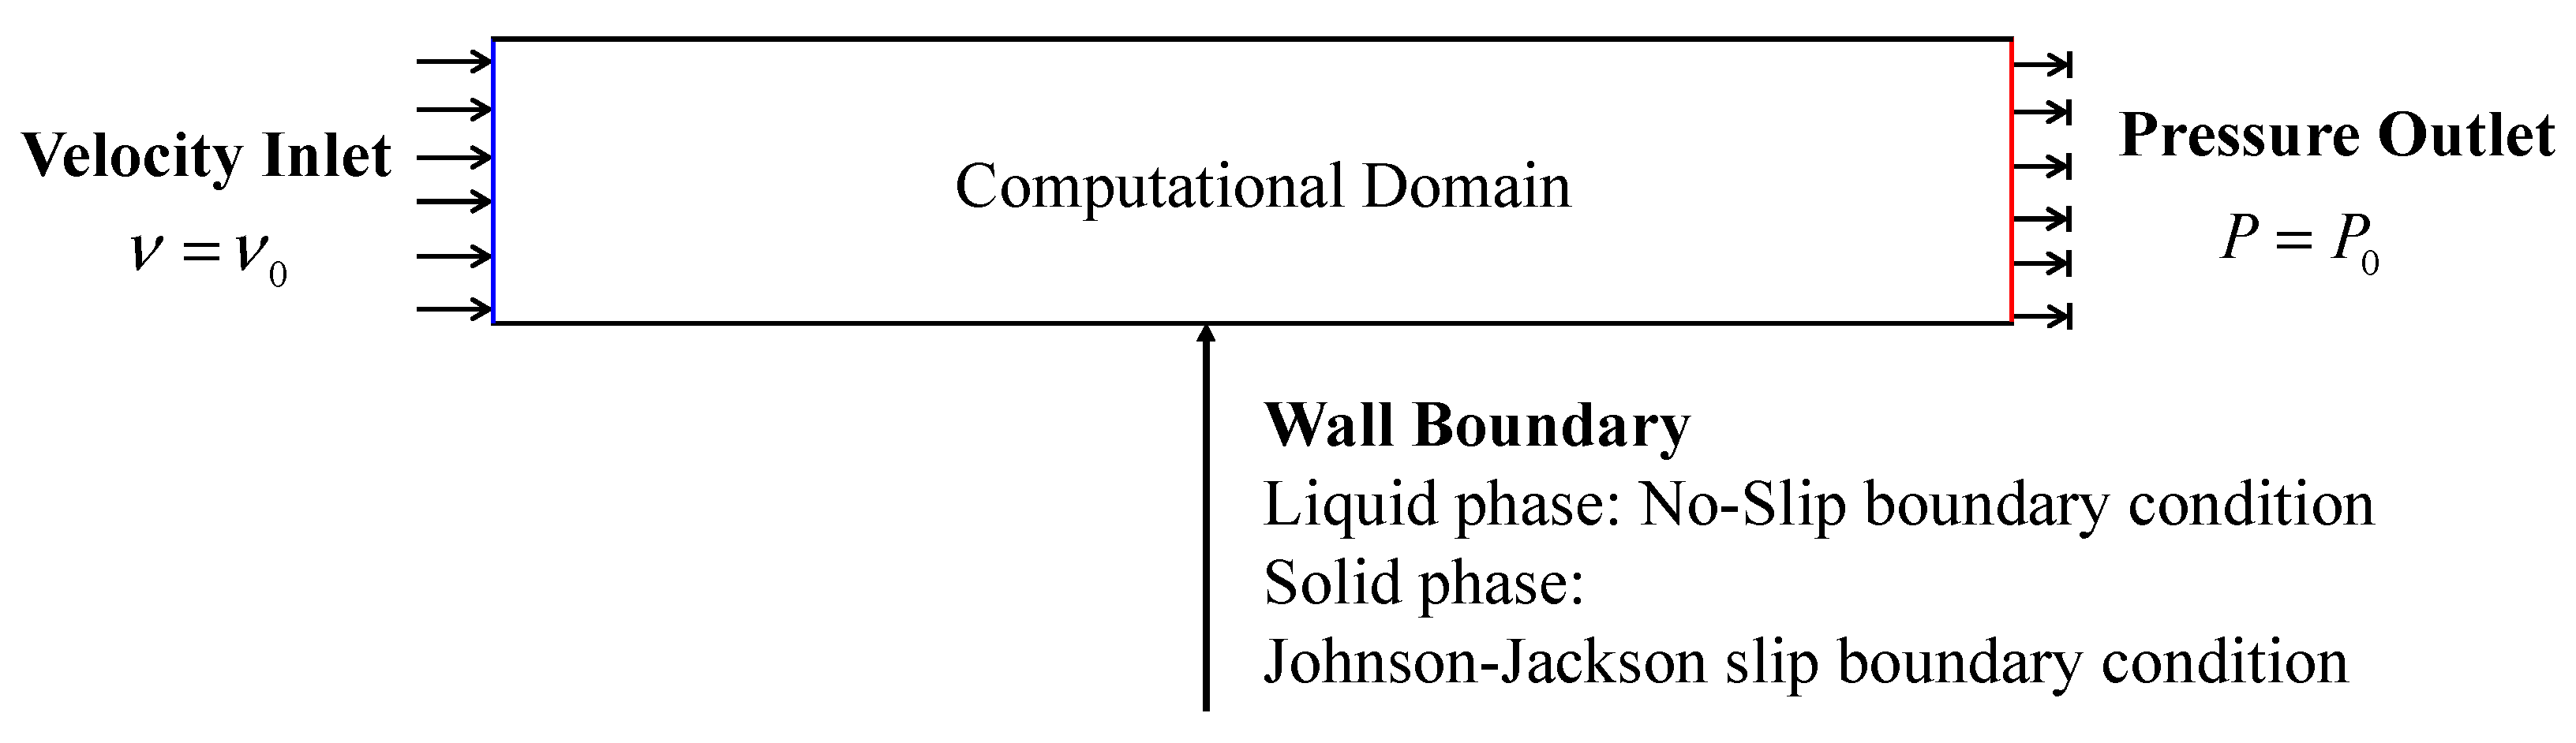
2.3. Boundary Condition

Velocity boundary conditions were set at the pipe inlet, while pressure boundary conditions were applied at the pipe outlet. For the pipe wall boundary conditions, the liquid phase adheres to the no-slip wall condition, meaning that the liquid-phase velocity matches the pipe wall velocity. Meanwhile, the particle phase employs the Johnson–Jackson slip wall condition to simulate the horizontal and vertical momentum losses of solid particles due to friction on the pipe wall. The boundary condition diagram of the pipeline is shown in Figure 2. Among them, the particle–particle collision recovery coefficient, particle–wall collision recovery coefficient, and wall rebound coefficient are set as 0.9, 0.9, and 0.015, respectively. The CFD–PBM model was solved under unsteady-state conditions. The control equations were discretized using the finite volume method, and the discrete equations were solved by the coupled SIMPLE algorithm. Additionally, the relaxation coefficient of the governing equation needs to be adjusted according to the calculation.

2.4. The Coupling Mechanism of CFD and PBM Models

First, the flow velocity and PSD of the solid and liquid phases of the filling slurry are obtained by solving the continuity equation, momentum conservation equation, and energy conservation equation in the EEM. Then, according to the agglomeration and fragmentation of solid particles in the ice-containing filling slurry, the PBM equation is solved using the quadrature method of moments to obtain the moments of the PBM equation and the PSD of solid particles. Finally, through the calculation of the Sauter mean diameter and interphase resistance correction, the physical quantities, such as the flow velocity of the solid phase and liquid phase, the volume fraction, and the size distribution of the solid phase, are updated by the CFD multiphase flow model, thereby achieving the coupling of the two models. Based on the above process, the coupling of the CFD Euler–Euler multiphase flow model and the PBM model is realized.

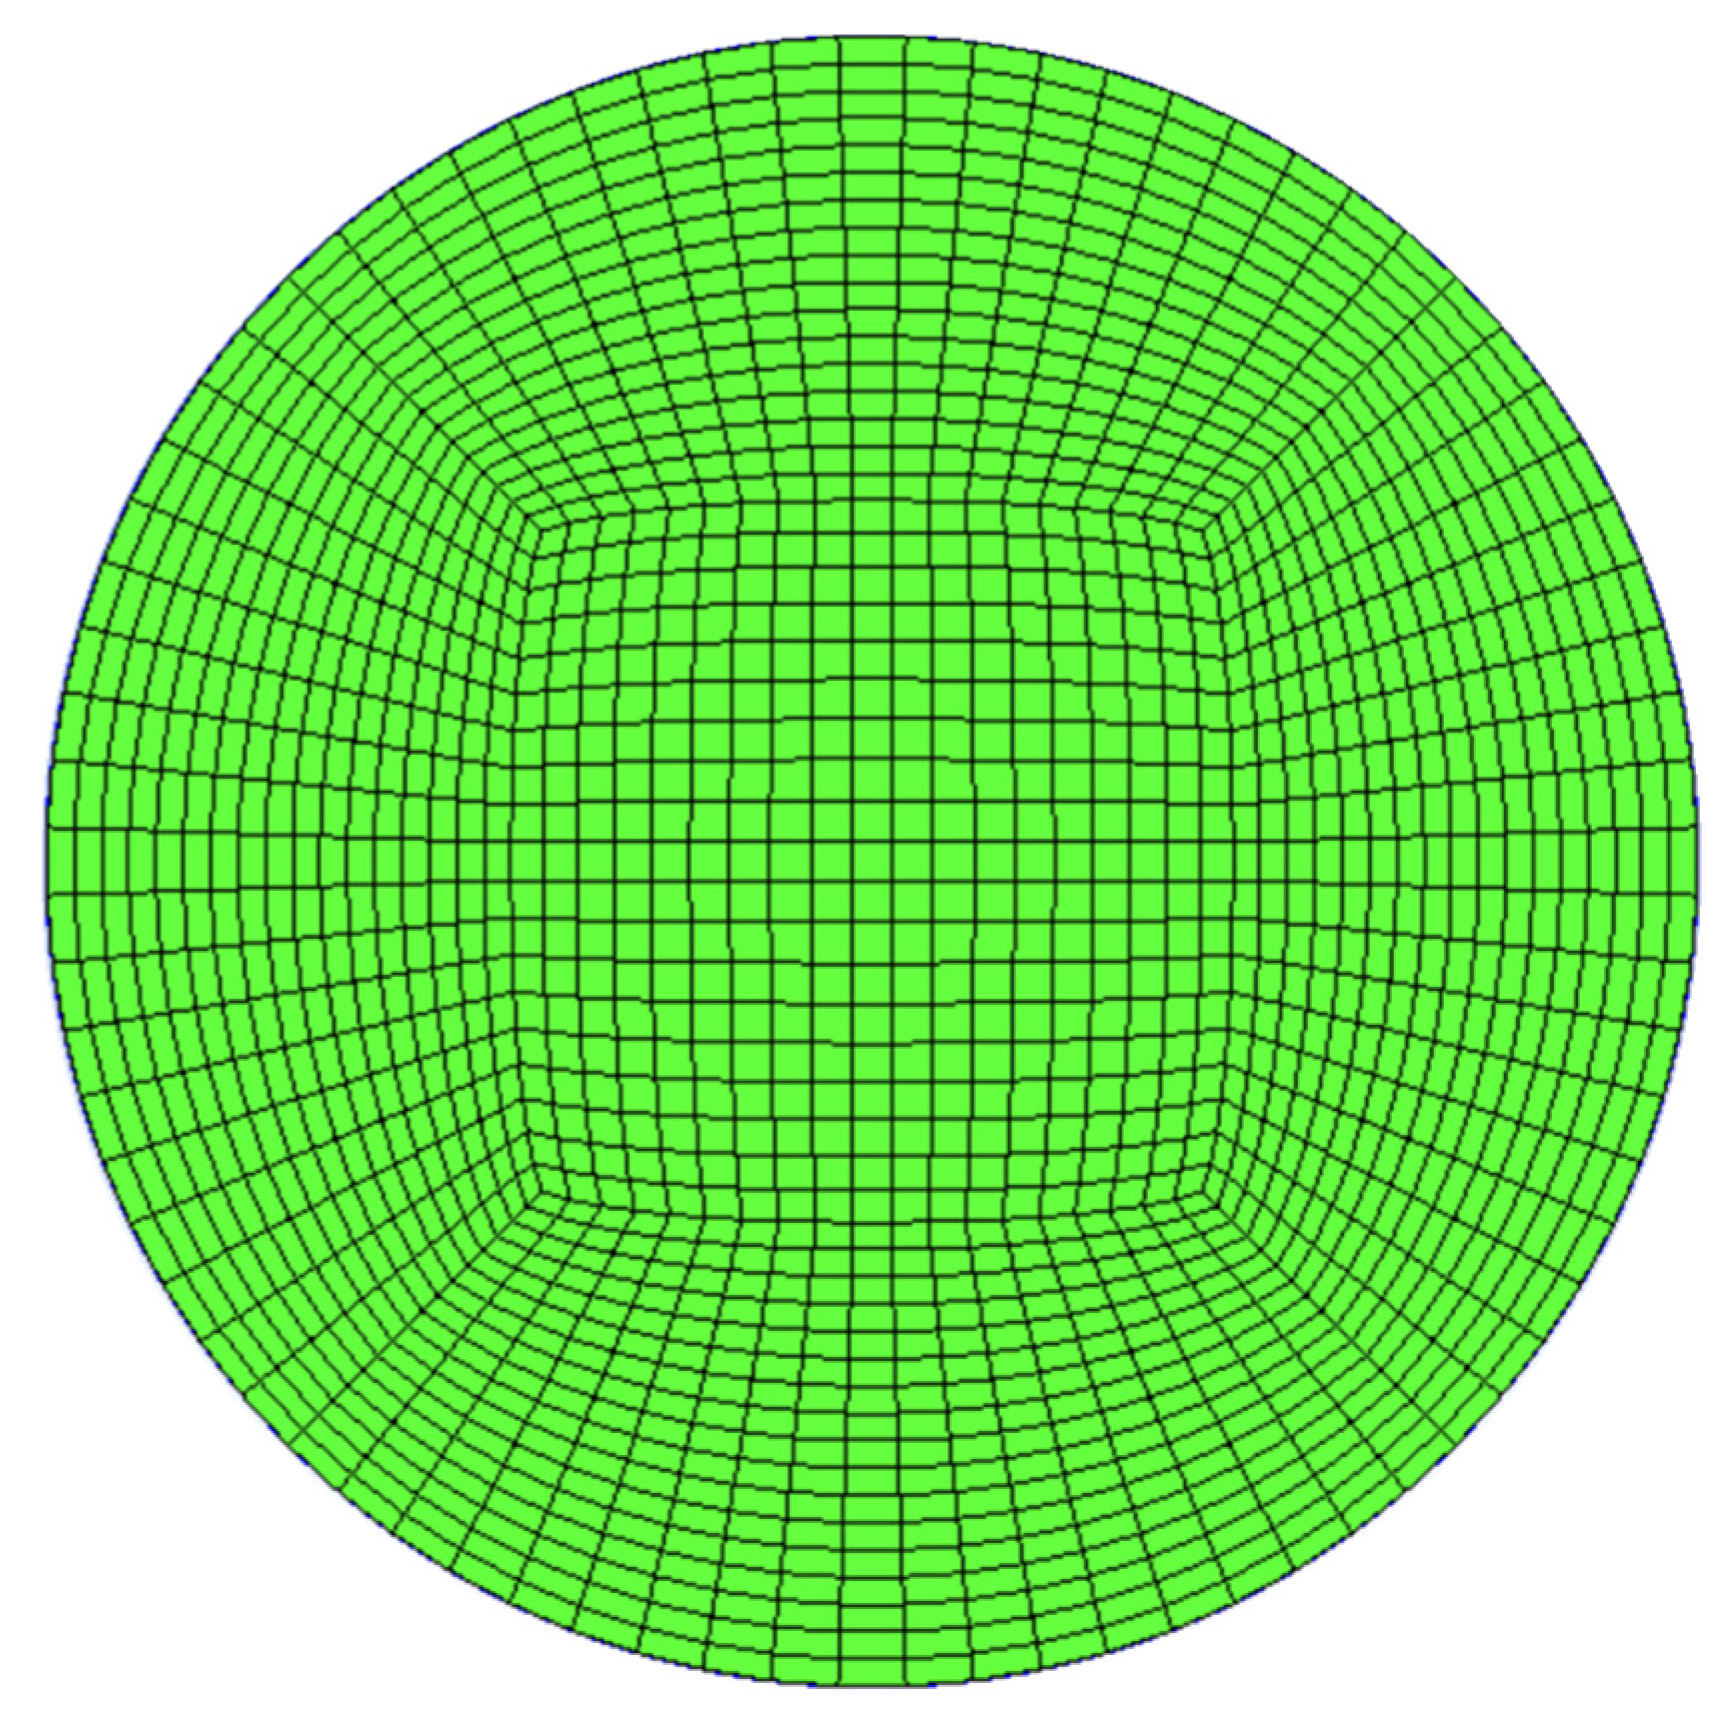
2.5. Computational Grid and Independence Verification

In order to eliminate the errors caused by the calculation grid in the numerical model, this paper verifies grid independence. The physical model of the circular tube is meshed using meshing software (ICEM CFD 2022 R1) to generate a hexahedral mesh. The grid cross-section diagram of the circular tube is shown in Figure 3. The number of circular tube meshes is 261,261, 495,099, 1,050,000, and 2,066,252, respectively. The exit velocity of the circular tube is selected as the verification parameter. When the exit velocity value does not change significantly with the increase in the number of grids, the grid is considered to meet the independence requirement. As shown in Figure 4, when the grid count is 1,050,000 and 2,066,252, the velocity difference at the tube outlet is very small. After comprehensive consideration, a grid number of 1,050,000 is chosen for simulation calculations.

3. Verification and Analysis of the Model

In order to verify the veracity of the constructed CFD–PBM coupled model in predicting the flow characteristics of ice-containing filling slurries in horizontal circular tubes, the results obtained from the numerical simulations were meticulously compared with the experimental data of Vuarnoz et al. [44], as shown in Figure 5a. The comparison was carried out by simulating the flow of ice slurry inside a horizontal circular tube with a diameter of 0.023 m and a length of 25 m and using the exit velocity of the tube as the key validation parameter. The results of the comparison show that the error between the numerical simulation results and the experimental data is within acceptable limits.
In addition, in order to further verify the veracity of the model in calculating the average diameter of the particles, we also compared the numerical calculation results with the experimental data from Cai et al. [45]. To facilitate the visual comparison of the results, we chose the diameter of ice particles as the core comparison parameter, and the results are shown in Figure 5b.
In the comparison of numerical simulation and experimental results, the root mean square error (RMSE) and the coefficient of determination (R2) are important indicators to measure the difference between the two and are used to quantify the accuracy of the simulation results. In order to evaluate the accuracy of the established model, the following formulas are used to calculate the RMSE and R2:
R M S E = 1 n i = 1 n ( y i y ^ i ) 2
R 2 = 1 i = 1 n ( y i y ^ i ) 2 i = 1 n ( y i y ¯ ) 2
where y i is the experimental value, y ^ i is the predicted value of the model, and y ¯ is the average value of the experimental value. After calculation, the RMSE and R2 are 0.89 μm and 0.98, respectively. In summary, the CFD–PBM model constructed in this study can accurately calculate the particle size distribution characteristics of ice-containing filling slurry during the flow process.

4. Results and Discussion

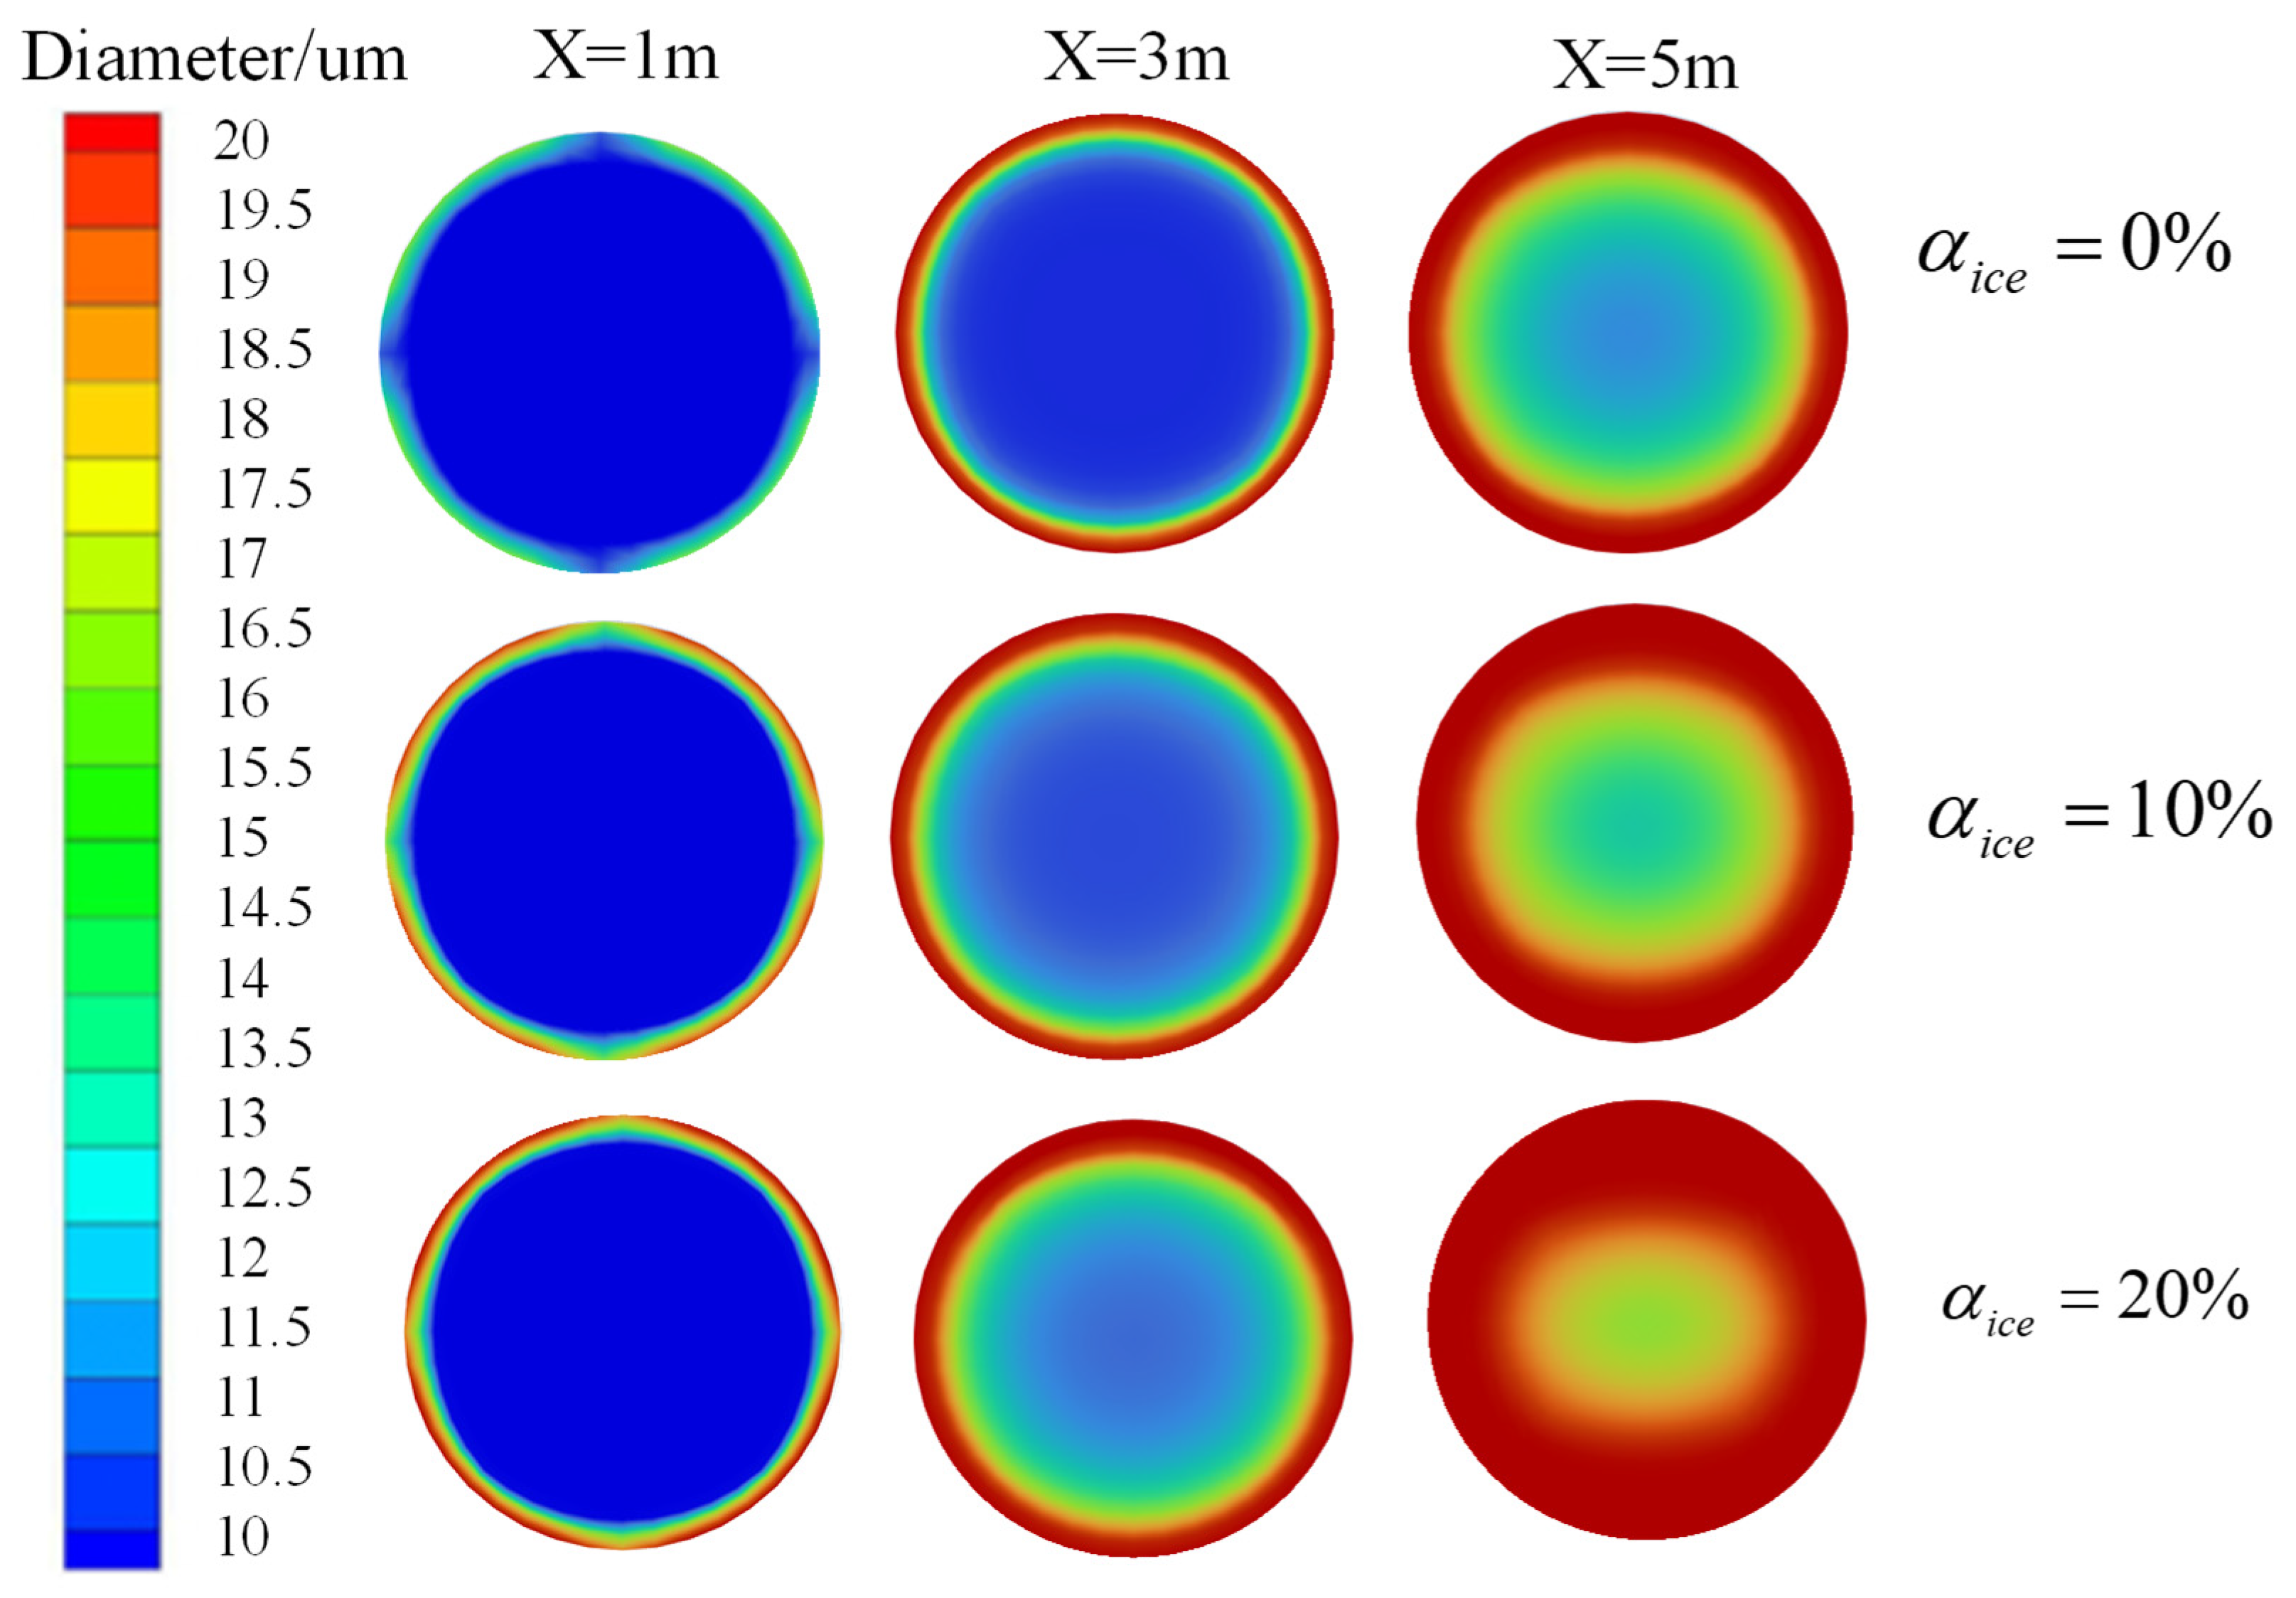
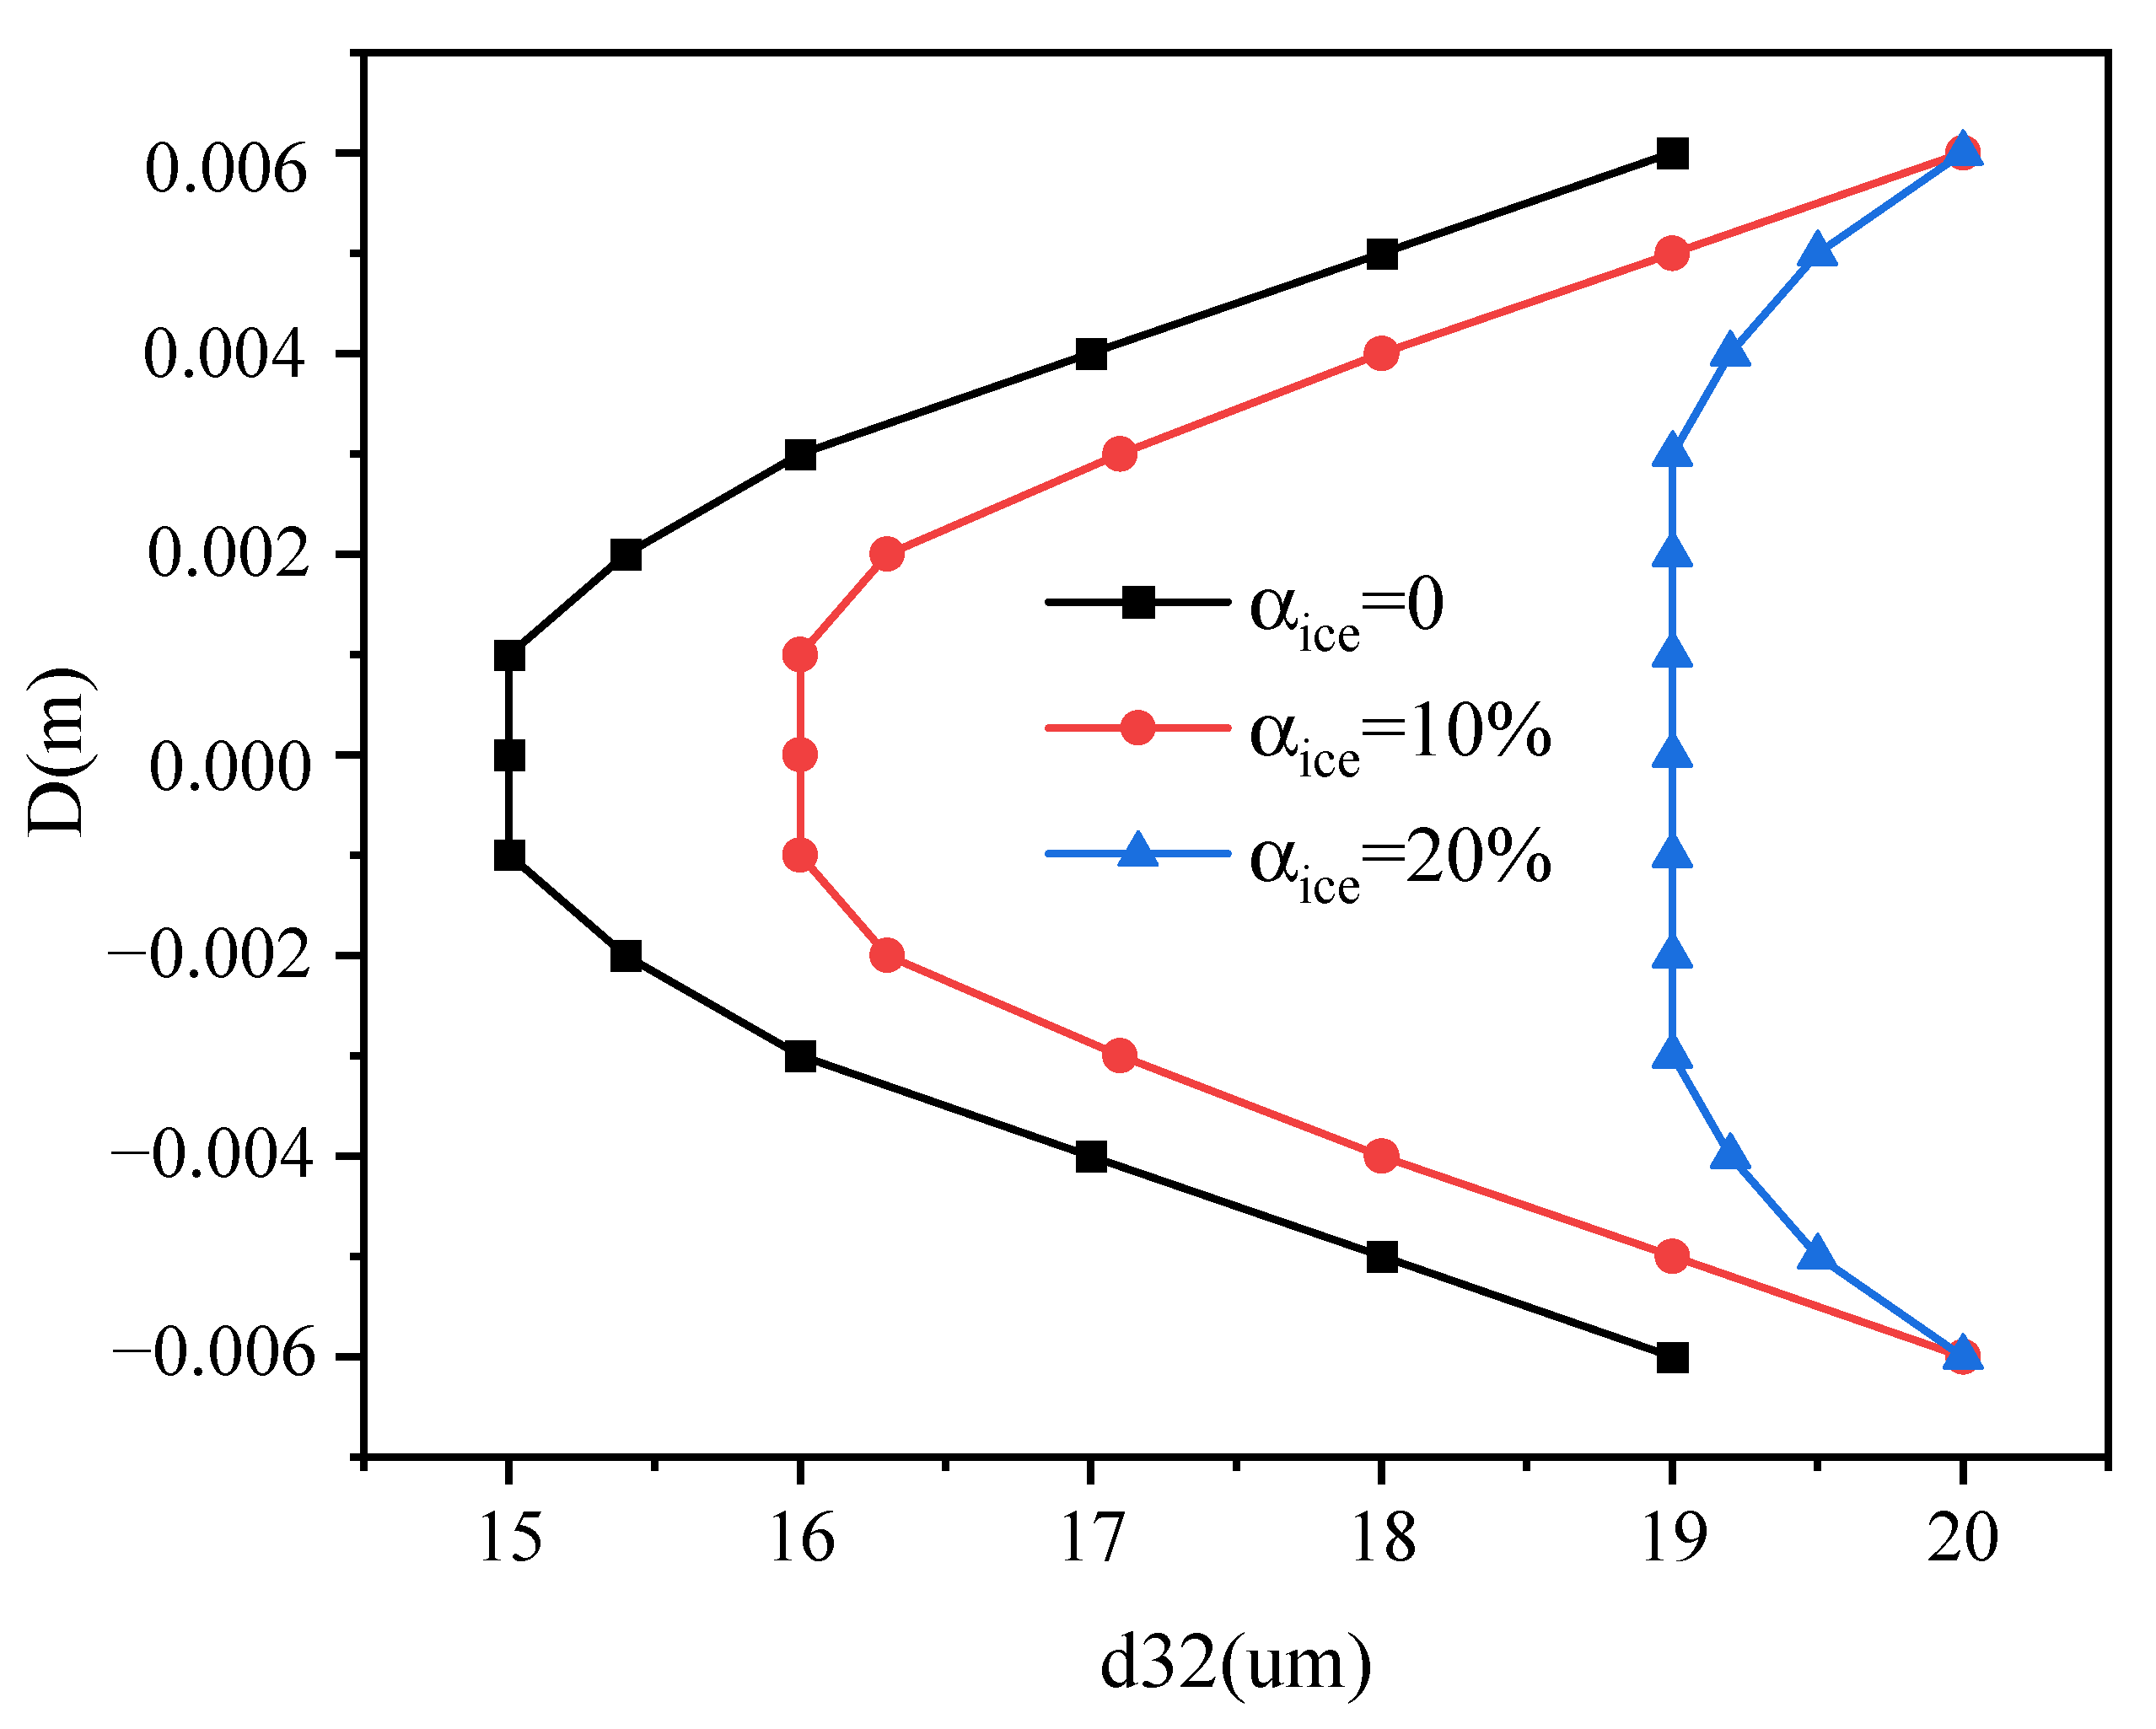
4.1. Ice Content in the Filling Slurry

By simulating the flow of ice-containing filling slurry in a horizontal circular tube, the mechanism by which ice particle content influences the agglomeration effect of the slurry was studied. Figure 6 shows the cloud image of the diameter distribution of tailings particles at different cross-sections (YZ cross-sections) when slurries with different ice contents flow through the round pipe (this paper uses the Sauter mean diameter d32 instead of the average diameter). As shown in Figure 6, the PSD of tailings on the pipe wall section indicates that particles near the wall are larger, while those at the pipe’s center are smaller. This phenomenon aligns with research findings on ice slurry flow processes reported in the literature [24], where similar characteristics have been observed. The reason for this phenomenon is that in the initial stage of pipeline flow, the collision between slurry components is less severe, and wall adhesion is primarily responsible. Therefore, the agglomeration effect of the slurry primarily occurs in the vicinity of the pipe wall. As the ice content in the filling slurry increases, the corresponding proportion of water in the filling slurry decreases, and the collisions between particles intensify, leading to a stronger agglomeration effect. Consequently, there is a gradual increase in the proportion of large-sized tailings near the pipe wall.
To investigate the evolution characteristics of tailings’ particle sizes in horizontal circular tubes with different ice contents, a numerical simulation study was carried out. The flow velocity was set at 1.5 m/s, the initial d32 was 10 μm, and the changes in filling slurries with 0%, 10%, and 20% ice content in the tube were investigated. Figure 7 illustrates the impact of varying ice content levels in the filling slurry on the PSD of tailings at the outlet of the circular pipe. When the ice content is 0%, 10%, and 20%, the minimum diameters of the tailings at the exit section of the circular pipe are 15 μm, 16 μm, and 19 μm, respectively. As the ice content in the filling slurry increases, the particle size of the tailing sand in the pipeline also increases. Moreover, the higher the ice content, the more significant the increase. When the ice content in the slurry is 0% and 10%, the minimum diameter of the tailings at the outlet section of the round tube differs by only 1 μm, indicating that adding 10% ice to the filling slurry has a minimal impact on its fluidity and pipeline transport characteristics. However, when the ice content in the slurry increases to 20%, the diameter of tailings at the outlet of the circular pipe exceeds 19 μm, indicating that the agglomeration effect is significantly enhanced. Therefore, in practical engineering applications, when ice-containing slurry is used for mine filling operations, the amount of ice grains added should be strictly controlled. Excessive addition of ice grains will significantly affect the flow of slurry during pipeline transportation and may lead to adverse phenomena such as pipeline blockages. It is recommended to control the ice content in the filling slurry to within 20% to ensure the stable performance of the material and smooth transportation through the pipeline.

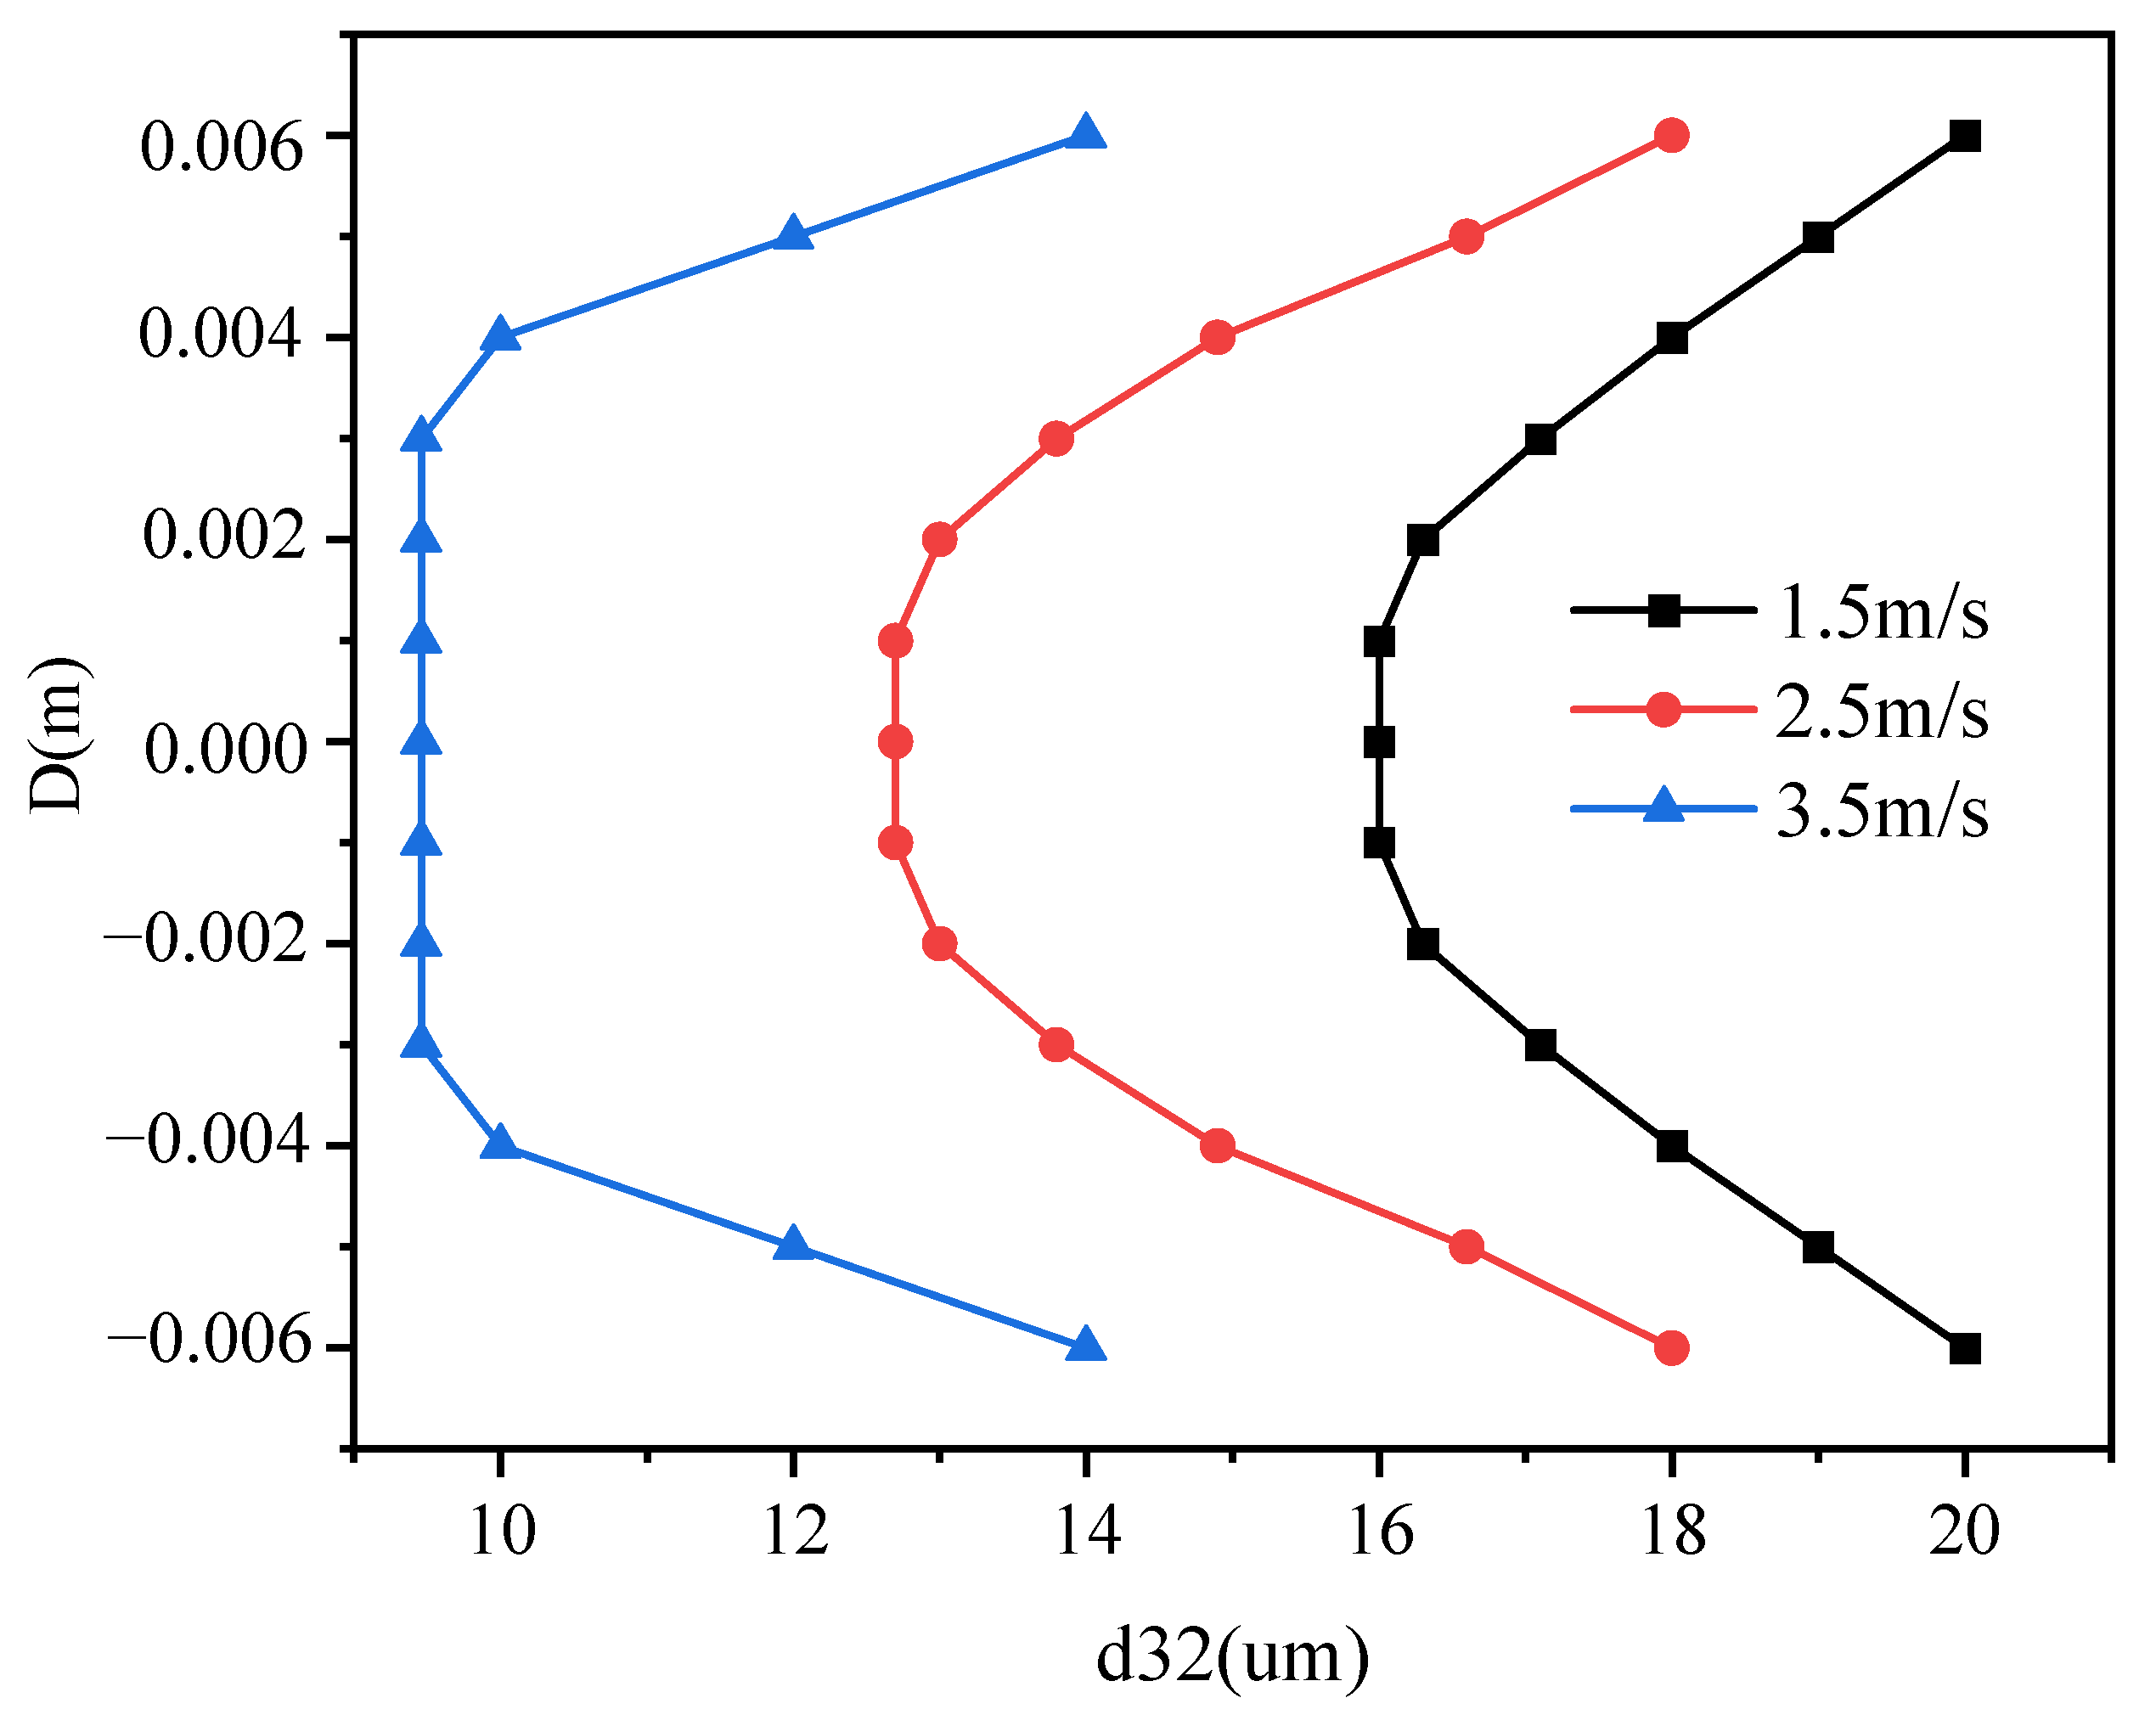
4.2. Pipe Inlet Velocity

Numerical simulations were carried out to study the effect of circular pipe inlet flow velocity on the evolutionary characteristics of tailing sand particle size in ice-containing particle-filled slurries. When the initial ice content is 10% and the initial d32 is 10 μm, we set three inlet velocities at 1.5 m/s, 2.5 m/s, and 3.5 m/s for simulation, respectively. The PSD curve of tailings in the outlet section of the round pipe is obtained, as shown in Figure 8. The graph clearly demonstrates the correlation between the pipe’s inlet velocity and the tailing sand’s particle size: as the flow velocity of the filling slurry at the pipe inlet increases, the tailing sand’s particle size at the pipe outlet decreases accordingly. When the flow velocities are 1.5 m/s, 2.5 m/s, and 3.5 m/s, respectively, the minimum particle sizes of the tailings at the outlet of the pipeline are 16.0 μm, 12.9 μm, and 9.45 μm, respectively.
Although a higher inlet flow velocity is favorable for collisions between solid-phase particles, which tends to enhance the aggregation between tailing sand particles, the increase in flow velocity also intensifies turbulent shear within the cylindrical pipe. However, when the velocity is high, turbulent shear becomes dominant, leading to a decrease in the average size of the tailing sand aggregates. When the flow velocity is increased to 3.5 m/s, the particle size of the tailing sand in the mainstream area of the circular pipe is already smaller than its initial average value. This reflects that the crushing effect of the filling slurry has an obvious advantage at this velocity. Only near the wall of the circular pipe does the particle size of the tailing sand show a slight increase. These observations reveal the phenomenon where the agglomeration and fragmentation of the tailing sand particles are antagonistic to each other during the flow process. Because of this, when conveying ice-containing filling slurry, the inlet velocity of the pipeline should not be set too low in order to prevent pipe blockage.

4.3. Initial Particle Size of Tailings

In order to investigate how the initial average particle size of the tailing sand particles affects the change in the particle size of the filling slurry with added ice particles when it is flowing in the pipe, a numerical simulation was conducted. The simulation was conducted at a velocity of 1.5 m/s and an ice content of 10%, with four different initial average particle sizes set at 10 μm, 100 μm, 200 μm, and 300 μm. Figure 8 demonstrates the PSD of tailings along the pipe axis in the ice-containing filling slurry under these conditions. As can be seen from Figure 9, when the initial particle size of tailings is 10 μm, 100 μm, and 200 μm, respectively, the particle size of tailings at the outlet of the pipeline increases by 100%, 6%, and 1.5%, respectively. Additionally, the larger the initial particle size, the smaller the relative increase in particle size during pipeline transportation. It can be observed that within the initial particle size range of 10 to 200 μm, the particle size of tailing sand gradually increases along the pipeline axis under different flow conditions. This indicates that the 10–200 μm range represents the development stage for the growth of tailings’ particle diameters. Since the agglomeration effect between tailings particles is stronger than the crushing effect, the particle size of tailings particles exhibits a slow growth trend.
When the initial particle size of the tailings is 300 μm, the particle size decreases gradually along the pipeline’s axis. Finally, at the outlet of the pipeline, the particle size of the tailings drops to 289 μm, representing a decrease of 3.8% compared to the initial particle size, which is significantly lower than the initial value. This indicates that when the diameter of tailing sand particles is greater than or equal to 300 μm, the crushing effect among the components of the filling slurry within the pipe becomes predominant, while the agglomeration effect is less significant. Additionally, it demonstrates that larger initial particle sizes of tailing sand result in a stronger turbulent shear effect, leading to a gradual reduction in particle size in the main flow area of the tailing sand. Consequently, during the conveyance of ice-containing filling slurry, utilizing tailing sand particles with diameters exceeding 300 μm can effectively prevent the caking of the filling slurry within the pipeline.

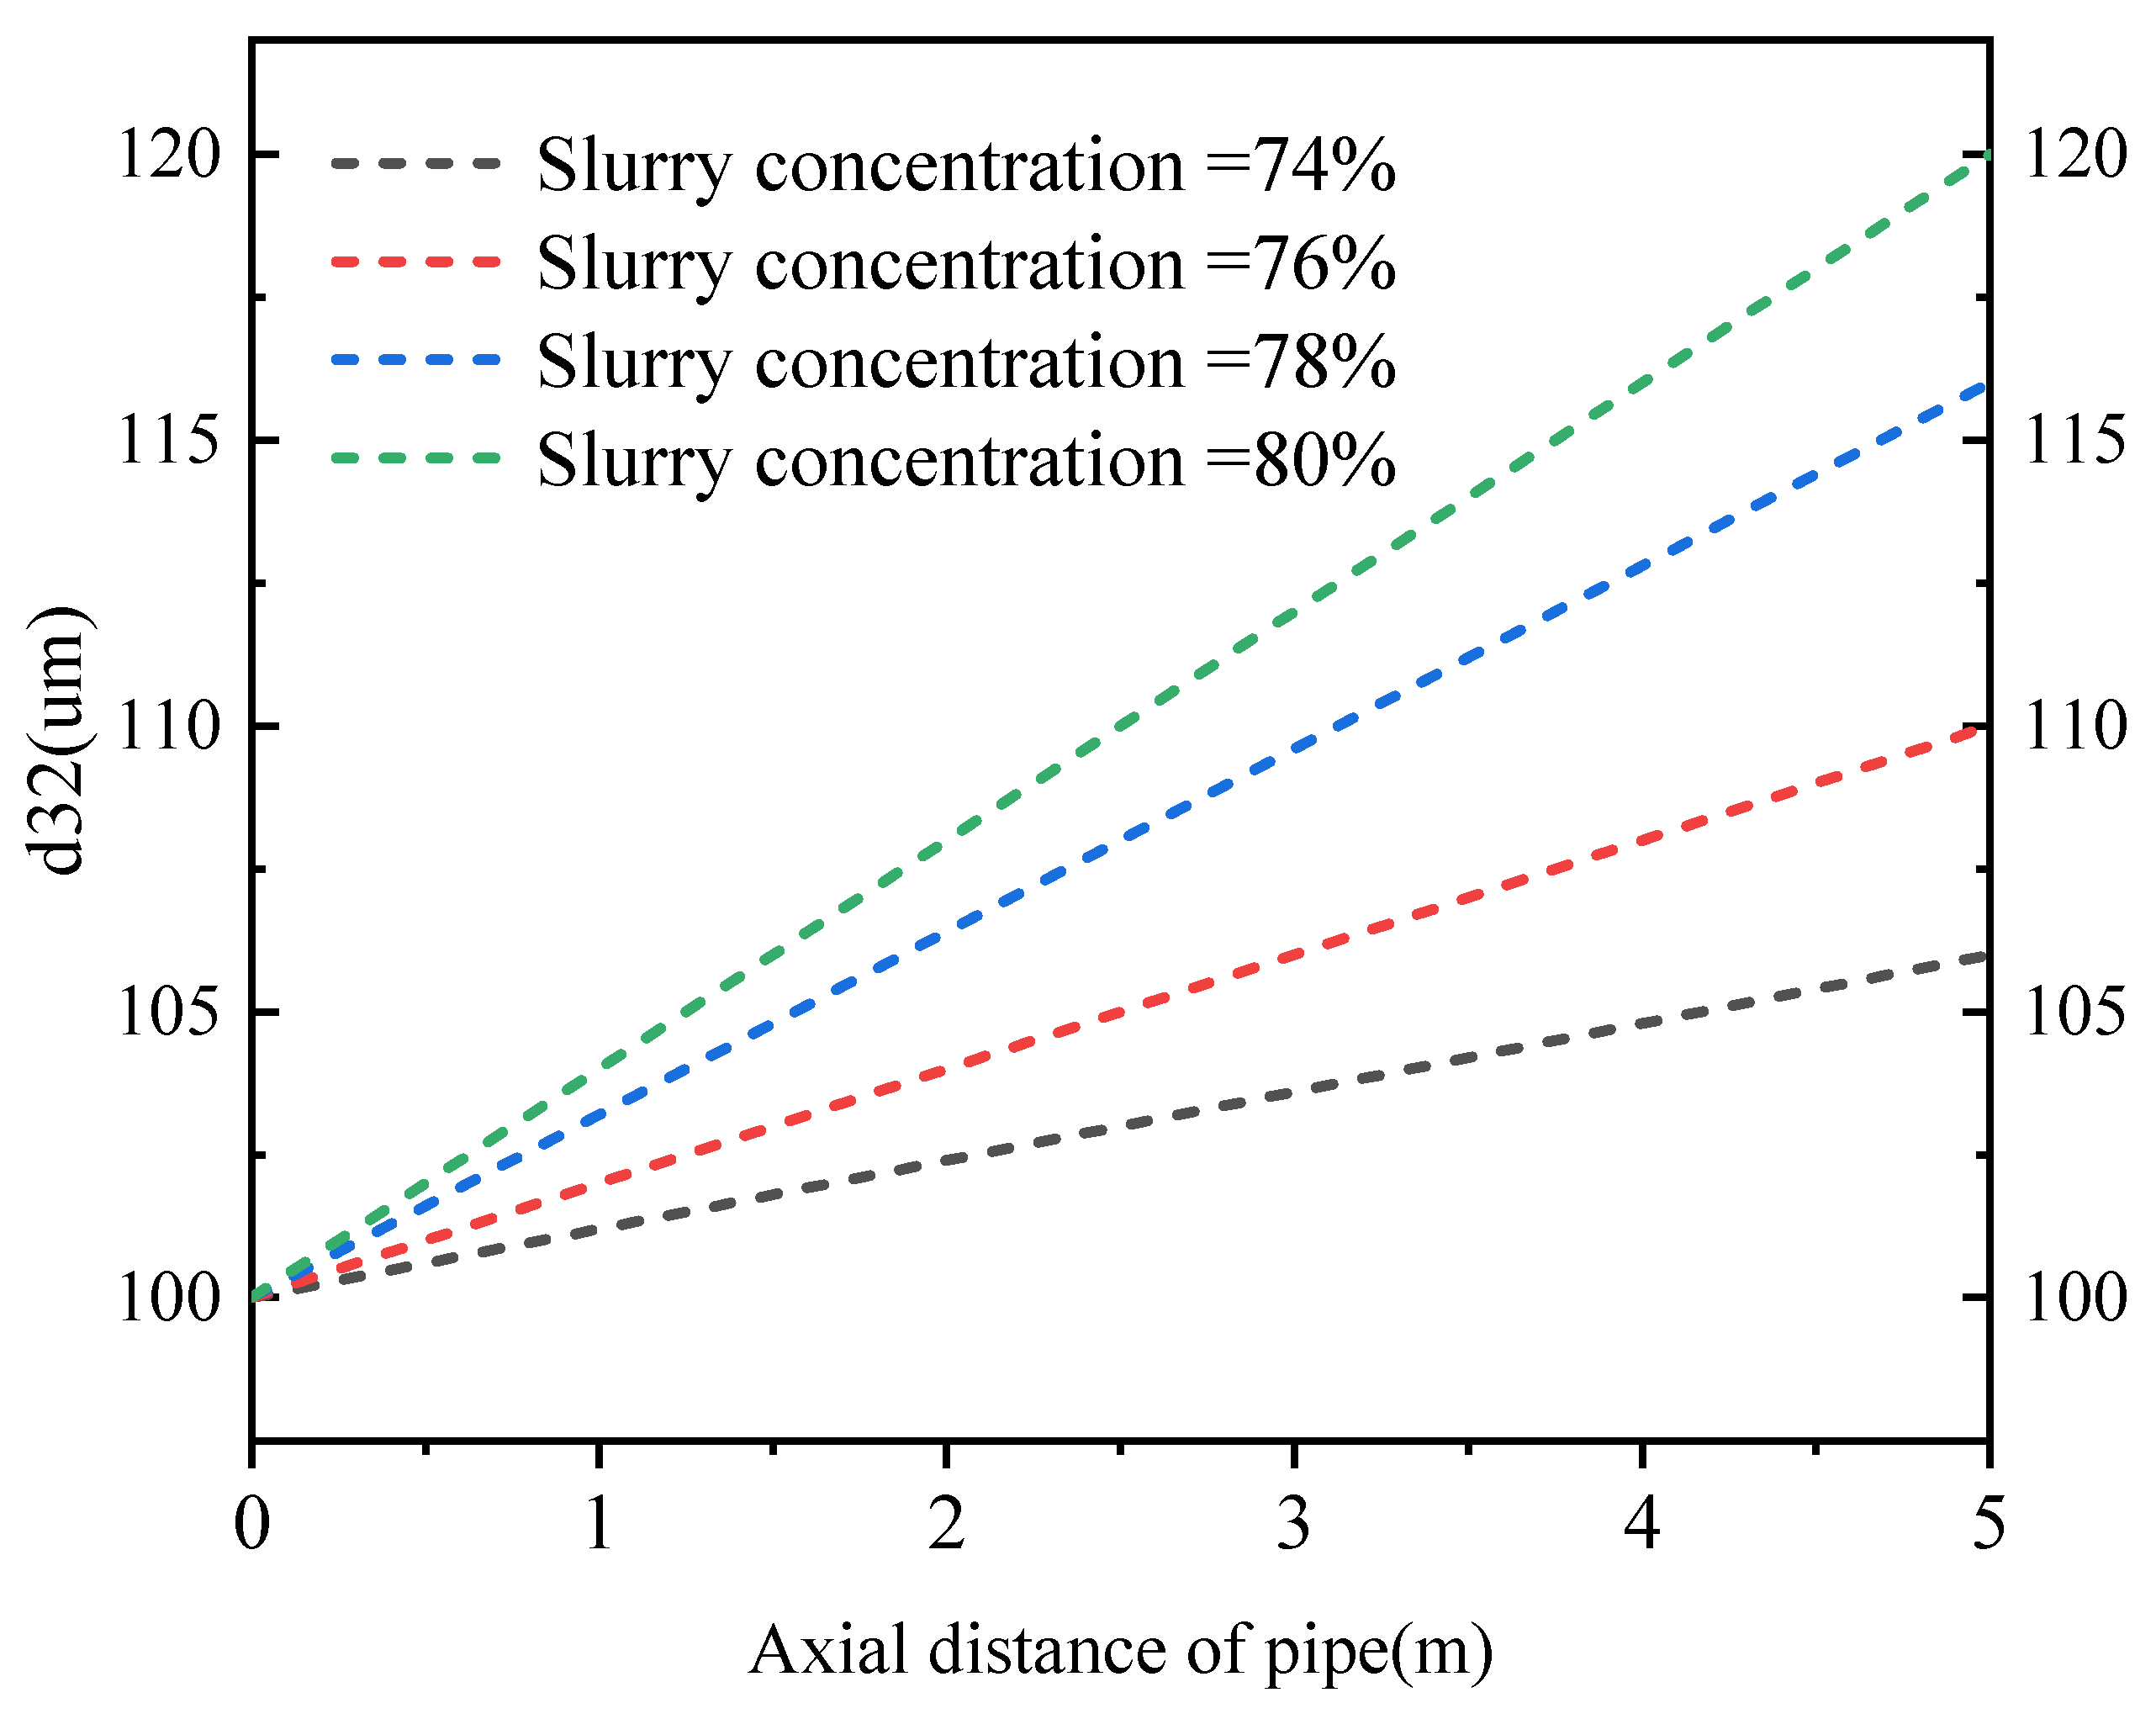
4.4. The Concentration of Filling Slurry

In order to study the effect of filling slurry concentration on the agglomerating phenomenon in the conveying process of ice-containing filling slurry, a numerical simulation was conducted. The simulations considered different slurry concentrations (74%, 76%, 78%, and 80%) with an ice content of 10% and a consistent inlet velocity of 1.5 m/s. Figure 10 and Figure 11, respectively, show the particle size changes of tailing particles with initial average particle sizes of 10 μm and 100 μm when the filling slurry flows through a horizontal circular tube at different concentrations. When the initial particle size of the tailings is 10 μm, based on a slurry concentration of 74%, the particle size of the tailings at the outlet of the pipeline increases by 25%, 60%, and 75%, respectively, as the slurry concentration increases by 2%, 4%, and 6%. Similarly, when the initial particle size of the tailings is 100 μm, under the same concentration increment conditions, the particle size of the tailings at the pipe outlet increases by 3.7%, 9.4%, and 13.2%, respectively.
According to the data in the chart, with the increase in slurry concentration, the average particle size of the ice-containing filling slurry at the outlet section of the circular tube increases significantly. As the slurry concentration increases, the water content in the filling slurry relatively decreases, leading to increased friction and adhesion between solid particles, as well as a higher collision frequency among particles, thus exacerbating the agglomeration phenomenon of the ice-containing filling slurry. At this point, the agglomeration caused by Brownian motion has a greater influence on solid particles compared to that caused by turbulence. Moreover, under the same slurry concentration, the smaller the initial particle size of the tailing sand particles, the larger the increase in the particle size of the tailings at the outlet of the pipe, indicating that smaller particle sizes of tailing sand lead to stronger agglomeration effects in the pipe. Therefore, in the process of conveying filling slurry that contains ice particles, the concentration of the slurry should not be too high. If the concentration is too high, the agglomeration between particles will increase, enlarging the particle size of tailings, which may lead to pipeline blockages and affect the successful transportation of the slurry.

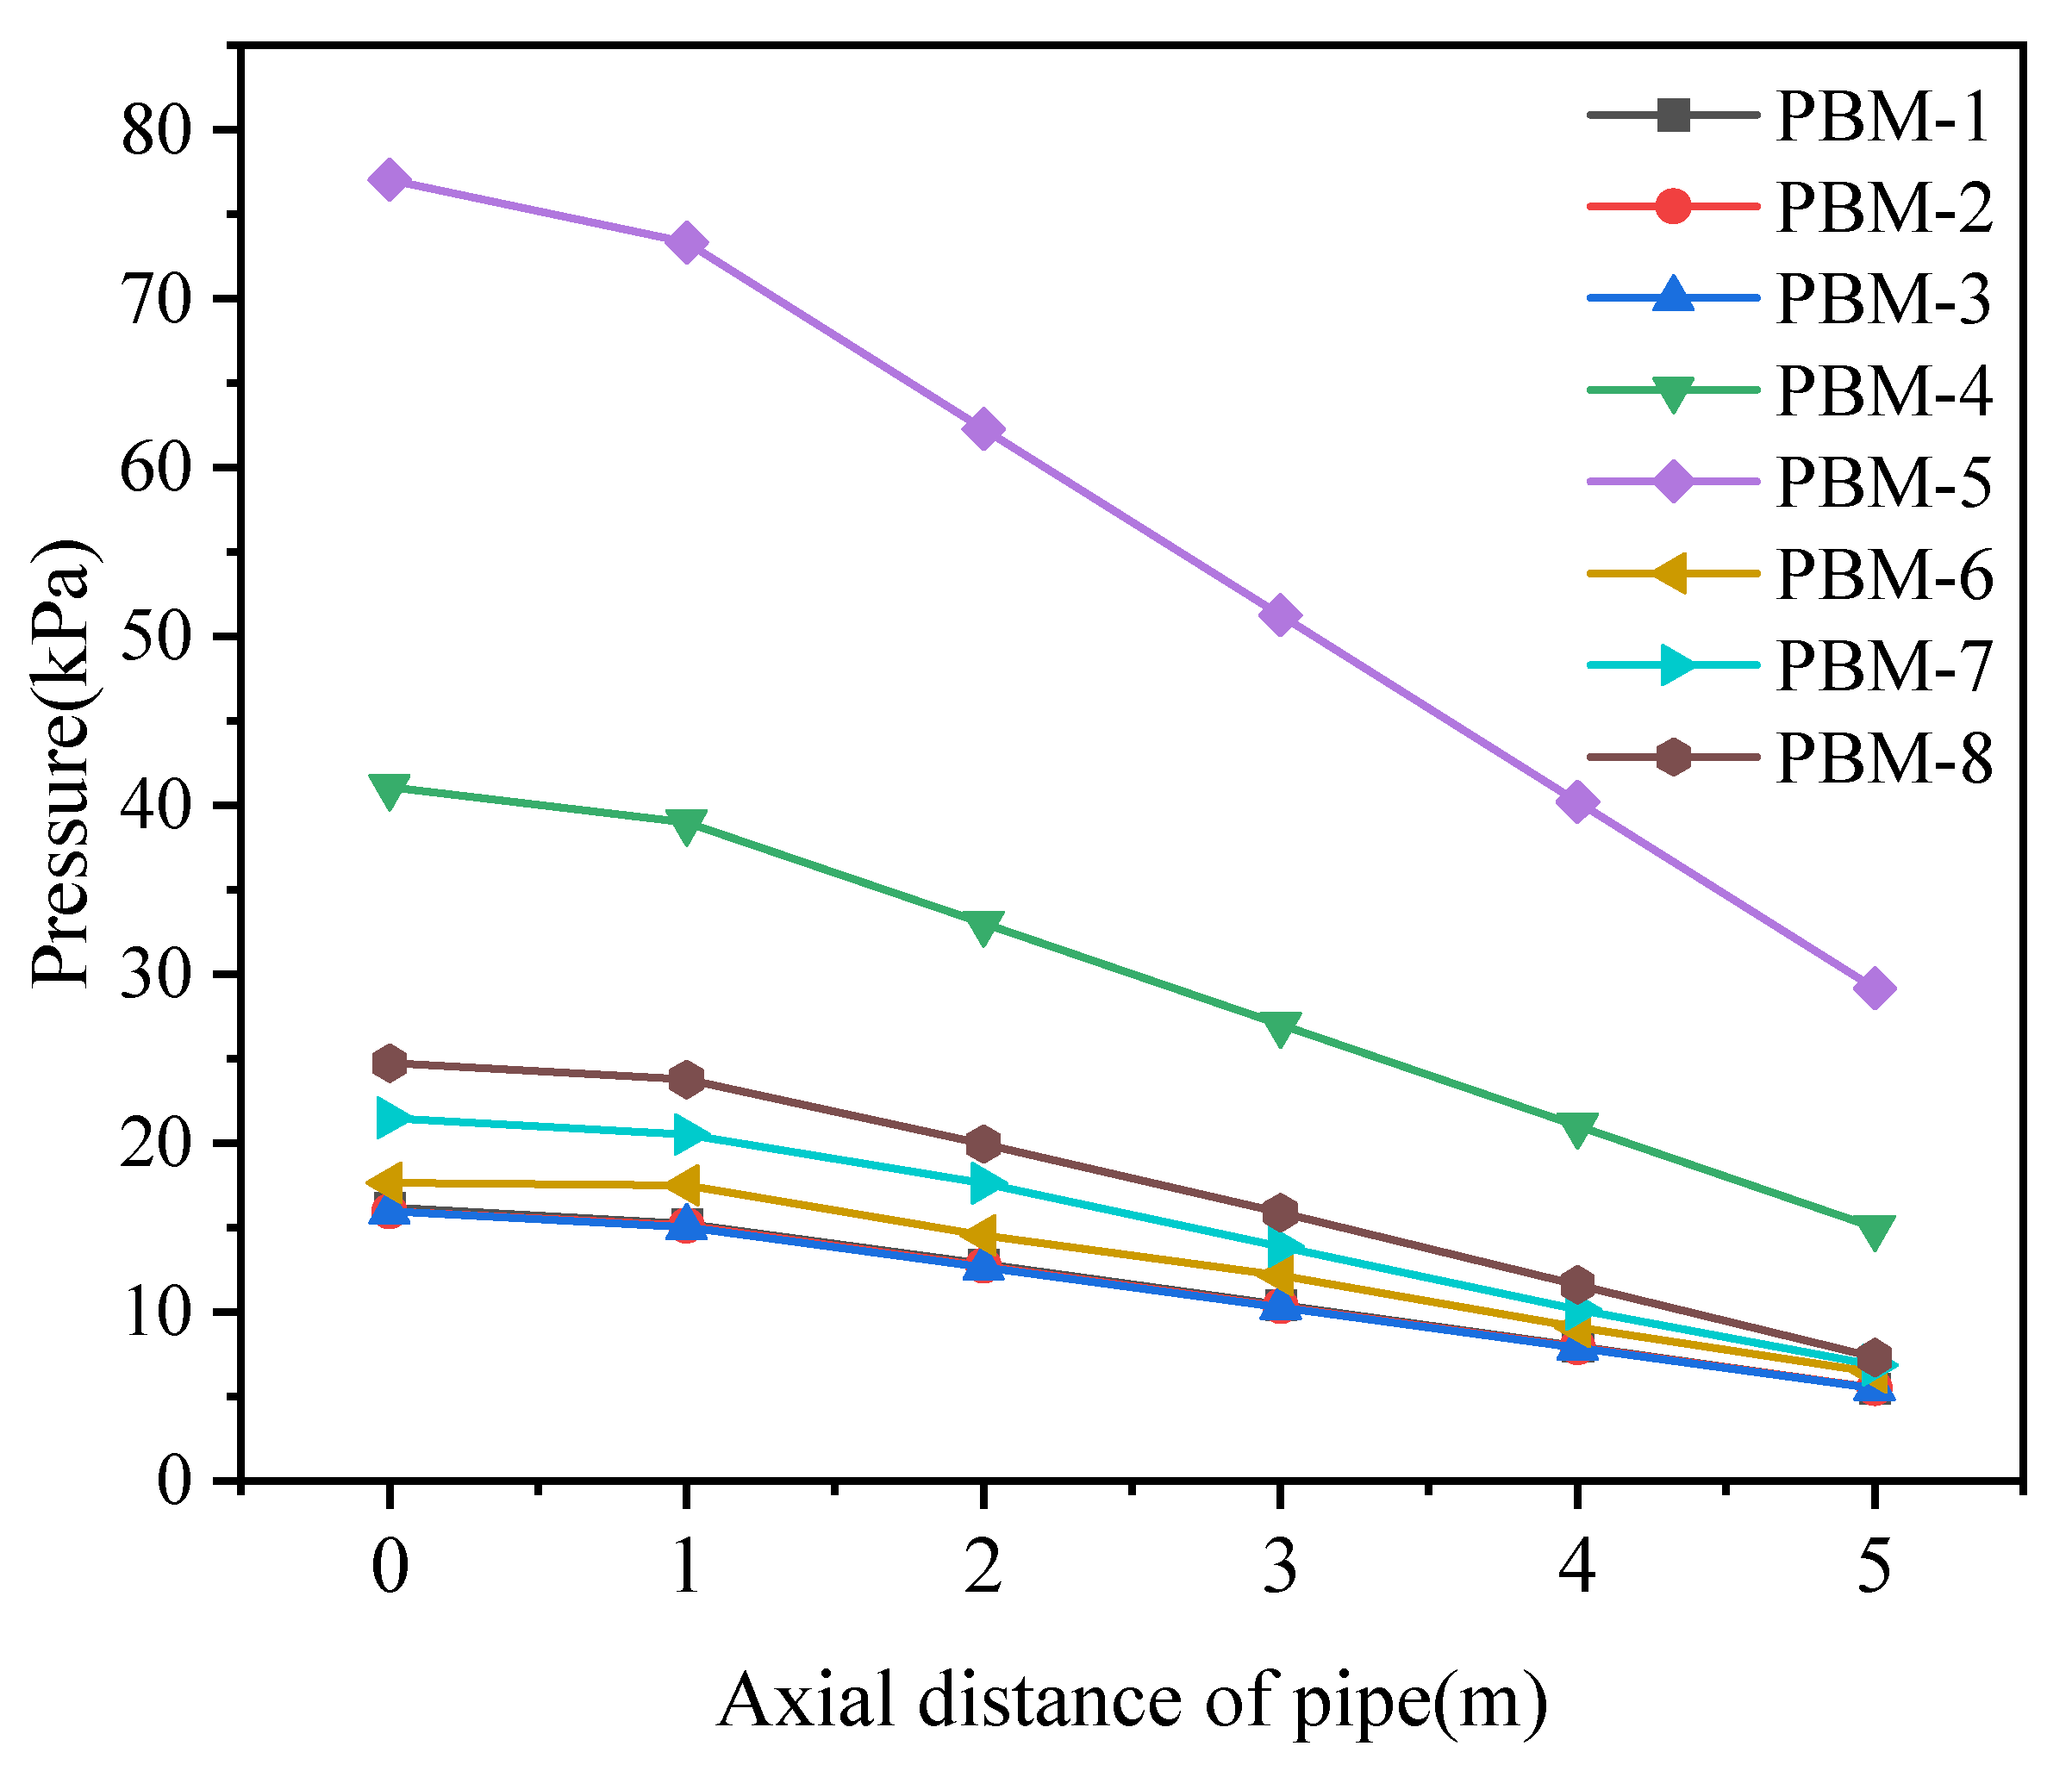
4.5. Pressure Drop Along the Pipeline

In order to more accurately analyze the flow characteristics of the ice-containing filling slurry in horizontal pipelines, the pressure distribution within the pipeline was calculated. The pressure referred to in this paper is the relative pressure of the ice-containing filling slurry. In order to obtain the pressure distribution in the pipeline, a number of numerical simulation conditions are set up, and the pressure distribution is calculated in detail based on these conditions. The specific parameter settings are shown in Table 2.
Figure 12 shows the pressure distribution along the pipeline axis under different flow conditions based on the CFD–PBM model. It can be seen from the pressure calculation results of each working condition that the pressure in the pipeline reaches its maximum at the entrance and gradually decreases along the pipeline axis when the pipeline size is fixed. Specifically, when the flow velocities are 1.5 m/s, 2.5 m/s, and 3.5 m/s, the corresponding pressure drops are 10.46 kPa, 26.08 kPa, and 47.9 kPa, respectively. With the increase in the inlet speed of the pipeline, the pressure drop between the inlet and outlet of the pipeline also increases correspondingly. With a base flow velocity of 1.5 m/s, the pressure drop increases by 149% and 358% when the velocity increases to 2.5 m/s and 3.5 m/s, respectively. This is because in the pipeline flow process, the increase in flow rate results in greater energy dissipation and kinetic energy demand, leading to a larger pressure drop.
When the initial particle size of the tailings is 10 μm, 100 μm, 200 μm, and 300 μm, the pressure drop of the pipeline is 10.46 kPa, 11.24 kPa, 14.66 kPa, and 17.42 kPa, respectively. Compared with the 10 μm tailings, when the size of the tailings increases to 100 μm, 200 μm, and 300 μm, the corresponding pipeline pressure drop increases by 7.4%, 40.15%, and 66.53%, respectively. The results show that the pressure drop along the pipeline increases gradually with the increase in the initial particle size of the tailings. When the particle size is larger, the drag force between the tailings and the fluid increases, leading to an increase in flow resistance within the pipeline, thus increasing the pressure drop. However, compared with the influence of velocity changes on the pipeline’s pressure drop, the pressure drop increase caused by changes in the tailings’ particle size is relatively minor. This indicates that the impact of flow velocity on the pipeline‘s pressure drop is more significant than that of the initial particle size of tailings. Additionally, as shown in Figure 12, changes in ice content within the pipe have a negligible effect on the pipeline pressure drop.

5. Conclusions

In this study, a CFD–PBM model was used to numerically simulate the flow characteristics of ice-containing filling slurry and the particle size distribution of tailings in a circular pipe, and the following conclusions were drawn:
(1)
With the increase in ice content, the risk of agglomeration of the ice-containing filling slurry significantly increases during pipeline transportation. It is recommended to control the ice content to within 20% to reduce the occurrence of caking.
(2)
When the inlet velocity of the round pipe is high, due to the effects of turbulent shear forces and particle breakage, the caking phenomenon is less likely to occur during the transport of the filling slurry in the pipe. Additionally, the higher the flow velocity, the smaller the increase in the particle size of the tailings.
(3)
The larger the size of the tailings, the weaker the agglomeration effect. To ensure the safe transportation of filling slurry containing ice particles, it is recommended to select tailings with a particle size greater than 300 microns.
(4)
Filling slurry with a high concentration exhibits a strong agglomeration effect. Therefore, on the basis of meeting the fluidity and strength requirements of the filling slurry, a lower concentration should be used to ensure smooth transportation.
(5)
The pressure drop along the pipeline is proportional to the inlet velocity and the particle size of the tailings. The addition of ice particles to the filling slurry has almost no effect on the pipeline pressure drop.

Author Contributions

M.W.: Conceptualization, Supervision, Writing original draft; F.Z.: Methodology, Writing—review and editing, Data curation; L.L.: Validation, Resources, Investigation; G.W.: Validation, Formal analysis; W.N.: Writing—original draft; D.K.: Writing—review and editing. All authors have read and agreed to the published version of the manuscript.

Funding

The authors are grateful for the support provided by the National Natural Science Foundation of China (Nos. 51904224, 51674188), the Scientific Research Project of Youth Innovation Team Construction of Shaanxi Provincial Department of Education (No. 21JP077), and the Natural Science Basic Research Plan in Shaanxi Province of China (Nos. 2018JQ5183, 2022JM-173).

Data Availability Statement

The original contributions presented in this study are included in the article. Further inquiries can be directed to the corresponding author.

Conflicts of Interest

The authors declare no conflicts of interest concerning the publication of this paper.

Nomenclature

P Pressure
F Force
G Turbulent kinetic energy
C Coefficient of resistance
L Length
D The diameter of the Pipe
P Horizontal coordinates of the node
ρ Density
α volume fraction
v Velocity vector
g Gravitational acceleration
τ ¯ ¯ Shear stress
ε Turbulent dissipation rate
θ Particle temperature
μ Shear viscosity
ζ Volume viscosity
d The diameter of the particle
e s s Collision restitution coefficient
g 0 Radial distribution function
h Diffusion and exchange coefficients
σ Prandtl coefficient
Re Reynolds number
B a g , k The birth moment of particle aggregation
D a g , k The death moment of particle aggregation
B b r , k The birth moment of particle breakage
D b , r k The death moment of particle breakage
k k The order of the moment
w Weighting
s Solid phase (particle phase)
l Liquid phase (fluid phase)
DResistance
siFluctuation
effEffective
tAverage eddy current
tlTurbulence
PBEThe population balance equation
PBMThe population balance model
EEMEuler–Euler model
PSDParticle size distribution

References

  1. Panão, M.R.O.; Franco, P.A.G.; Costa, J.J. Effect of Atomizer Geometry on Particle Formation in Dry-Ice Sprays. Int. J. Multiph. Flow 2020, 130, 103358. [Google Scholar] [CrossRef]
  2. Wang, M.; Liu, P.; Shang, S.; Chen, Q.; Zhang, B.; Liu, L. Numerical and Experimental Studies on the Cooling Performance of Backfill Containing Phase Change Materials. Build. Environ. 2022, 218, 109155. [Google Scholar] [CrossRef]
  3. Wang, M.; Liu, P.; Liu, L.; Geng, M.; Wang, Y.; Zhang, Z. The Impact of the Backfill Direction on the Backfill Cooling Performance Using Phase Change Materials in Mine Cooling. Renew. Energy 2022, 201, 1026–1037. [Google Scholar] [CrossRef]
  4. Wang, M.; Wang, Y.; Geng, M.; Shang, S.; Zhang, B.; Liu, L.; Wen, G. Effect of Cold Storage Backfill on Thermal Comfort of Mine Stope Based on Standard Effective Temperature. Energy Build. 2023, 300, 113632. [Google Scholar] [CrossRef]
  5. Wang, M.; Geng, M.; Liu, L.; Wang, Y.; Shang, S.; Wen, G. Numerical and Experimental Study on the Cooling Performance of Cold Load Storage Functional Backfill Considering the Coupled Heat and Moisture Transfer. J. Build. Eng. 2023, 78, 107673. [Google Scholar] [CrossRef]
  6. Onokoko, L. Experimental and Numerical Investigation of Isothermal Ice Slurry Flow. Int. J. Therm. Sci. 2018, 126, 82–95. [Google Scholar] [CrossRef]
  7. Wang, J.; Wang, S.; Zhang, T.; Battaglia, F. Numerical and Analytical Investigation of Ice Slurry Isothermal Flow through Horizontal Bends. Int. J. Refrig. 2018, 92, 37–54. [Google Scholar] [CrossRef]
  8. Bordet, A.; Poncet, S.; Poirier, M.; Galanis, N. Flow Visualizations and Pressure Drop Measurements of Isothermal Ice Slurry Pipe Flows. Exp. Therm. Fluid Sci. 2018, 99, 595–604. [Google Scholar] [CrossRef]
  9. Zhang, Q.; Xie, S.; Zheng, J.; Wang, X. Research on the Settlement Law of Filling Slurry and Feasibility Analysis of Transportation. J. Chongqing Univ. 2011, 34, 105–109. [Google Scholar]
  10. Wang, H.; Zhang, A.; He, M. Experimental Study on the Proportion and Transportation Characteristics of High-Sulfur Ultra-Fine Full Tailings Filling Materials. China Mine Eng. 2014, 43, 4. [Google Scholar]
  11. Zhang, L.; Luo, T.; Xu, Y.; Chen, Z.; Liu, J. Research on Rheological Properties of High Concentration Filling Slurry and Simulation Optimization of Pipeline Transportation. Min. Res. Dev. 2016, 36, 36–41. [Google Scholar] [CrossRef]
  12. Guo, J.; Liu, M.; Zhang, B. Settlement mechanism of two-phase flow pipeline in deep well filling. Gold Sci. Technol. 2016, 24, 86–93. [Google Scholar]
  13. Capecelatro, J.; Desjardins, O. Eulerian–Lagrangian Modeling of Turbulent Liquid–Solid Slurries in Horizontal Pipes. Int. J. Multiph. Flow 2013, 55, 64–79. [Google Scholar] [CrossRef]
  14. Arolla, S.K.; Desjardins, O. Transport Modeling of Sedimenting Particles in a Turbulent Pipe Flow Using Euler–Lagrange Large Eddy Simulation. Int. J. Multiph. Flow 2015, 75, 1–11. [Google Scholar] [CrossRef]
  15. Liu, L.; Xin, J.; Zhang, B.; Zhang, X.; Wang, M.; Qiu, H.; Chen, L. Basic Theory and Application Exploration of Functional Backfilling in Mines. J. China Coal Soc. 2018, 43, 1811–1820. [Google Scholar] [CrossRef]
  16. Wang, M.; Liu, L.; Chen, L.; Zhang, X.; Zhang, B.; Ji, C. Cold Load and Storage Functional Backfill for Cooling Deep Mine. Adv. Civ. Eng. 2018, 2018, 5435214. [Google Scholar] [CrossRef]
  17. Wang, M.; Liu, L.; Zhang, B.; Zhang, X.; Xun, C.; Zhao, Y.; Tu, B. Basic Theory of Cold-Carrying/Storage Functional Backfilling in Mines. J. China Coal Soc. 2020, 45, 1336–1347. [Google Scholar] [CrossRef]
  18. Liu, L.; Fang, Z.; Qi, C.; Zhang, B.; Guo, L.; Song, K.I.-I.L. Numerical Study on the Pipe Flow Characteristics of the Cemented Paste Backfill Slurry Considering Hydration Effects. Powder Technol. 2019, 343, 454–464. [Google Scholar] [CrossRef]
  19. Liu, L.; Fang, Z.Y.; Wu, Y.P.; Lai, X.P.; Wang, P.; Song, K.-I. Experimental Investigation of Solid-Liquid Two-Phase Flow in Cemented Rock-Tailings Backfill Using Electrical Resistance Tomography. Constr. Build. Mater. 2018, 175, 267–276. [Google Scholar] [CrossRef]
  20. Wang, J.; Zhang, T.; Wang, S. Heterogeneous Ice Slurry Flow and Concentration Distribution in Horizontal Pipes. Int. J. Heat Fluid Flow 2013, 44, 425–434. [Google Scholar] [CrossRef]
  21. Rezaei, M.; Pakravan, H.A. Numerical Study of Ice Slurry Flow and Heat Transfer in Successive U-Bends as Part of Tubular Heat Exchangers. Int. J. Therm. Sci. 2023, 191, 108357. [Google Scholar] [CrossRef]
  22. Kamyar, A.; Aminossadati, S.M.; Leonardi, C.R.; Sasmito, A.P.; Poncet, S. Flow Characterisation of Monopropylene Glycol Ice Slurry through a Horizontal U-Bend: A Numerical Approach. Eur. J. Mech. B/Fluids 2020, 82, 93–105. [Google Scholar] [CrossRef]
  23. Cai, L.; Liu, Z.; Mi, S. Investigation on Flow Characteristics of Ice Slurry in Horizontal 90° Elbow Pipe by a CFD-PBM Coupled Model. Adv. Powder Technol. 2019, 30, 2299–2310. [Google Scholar] [CrossRef]
  24. Mi, S.; Geng, S.; Cai, L.; Xu, C. Investigation on the Flow Characteristics of a Phase Change Material Slurry in Horizontal and U-Shaped Tubes Based on CFD-PBM. Chem. Eng. Res. Des. 2024, 201, 409–424. [Google Scholar] [CrossRef]
  25. Du, Q.; Chen, M.; Song, W.; Qin, K.; Feng, Z. Investigation on the Evolution of Ice Particles and Ice Slurry Flow Characteristics during Subcooling Release. Int. J. Heat Mass Transf. 2023, 209, 124008. [Google Scholar] [CrossRef]
  26. Xu, D.; Liu, Z.; Cai, L.; Tang, Y.; Yu, Y.; Xu, A. A CFD-PBM Approach for Modeling Ice Slurry Flow in Horizontal Pipes. Chem. Eng. Sci. 2018, 176, 546–559. [Google Scholar] [CrossRef]
  27. Jin, T.; Li, Y.; Wu, S.; Liu, Y. Numerical Modeling for the Flow and Heat Transfer of Slush Nitrogen in a Horizontal Pipe Based on Population Balance Equations. Appl. Therm. Eng. 2017, 123, 301–309. [Google Scholar] [CrossRef]
  28. Gao, Y.; Ning, Y.; Xu, M.; Wu, C.; Mujumdar, A.S.; Sasmito, A.P. Numerical Investigation of Aqueous Graphene Nanofluid Ice Slurry Passing through a Horizontal Circular Pipe: Heat Transfer and Fluid Flow Characteristics. Int. Commun. Heat Mass Transf. 2022, 134, 106022. [Google Scholar] [CrossRef]
  29. Van De Ven, T.G.M.; Mason, S.G. The Microrheology of Colloidal Dispersions VII. Orthokinetic Doublet Formation of Spheres. Colloid Polym. Sci. 1977, 255, 468–479. [Google Scholar] [CrossRef]
  30. Wang, X.; Cui, B.; Wei, D.; Song, Z.; He, Y.; Bayly, A.E. Effect of Feed Solid Concentration on Tailings Slurry Flocculation in a Thickener by a Coupled CFD-PBM Modelling Approach. J. Environ. Chem. Eng. 2021, 9, 106385. [Google Scholar] [CrossRef]
  31. Yao, Y.; Su, J.-W.; Luo, Z.-H. CFD-PBM Modeling Polydisperse Polymerization FBRs with Simultaneous Particle Growth and Aggregation: The Effect of the Method of Moments. Powder Technol. 2015, 272, 142–152. [Google Scholar] [CrossRef]
  32. Zhang, P.; Shi, X.J. Thermo-Fluidic Characteristics of Ice Slurry in Horizontal Circular Pipes. Int. J. Heat Mass Transf. 2015, 89, 950–963. [Google Scholar] [CrossRef]
  33. Liu, S.-S.; Xiao, W.-D. Numerical Simulations of Particle Growth in a Silicon-CVD Fluidized Bed Reactor via a CFD–PBM Coupled Model. Chem. Eng. Sci. 2014, 111, 112–125. [Google Scholar] [CrossRef]
  34. Shi, X.J.; Zhang, P. Two-Phase Flow and Heat Transfer Characteristics of Tetra-n-Butyl Ammonium Bromide Clathrate Hydrate Slurry in Horizontal 90° Elbow Pipe and U-Pipe. Int. J. Heat Mass Transf. 2016, 97, 364–378. [Google Scholar] [CrossRef]
  35. Huilin, L.; Gidaspow, D.; Bouillard, J.; Wentie, L. Hydrodynamic Simulation of Gas–Solid Flow in a Riser Using Kinetic Theory of Granular Flow. Chem. Eng. J. 2003, 95, 1–13. [Google Scholar] [CrossRef]
  36. Lee, D.W.; Yoon, E.S.; Joo, M.C.; Sharma, A. Heat Transfer Characteristics of the Ice Slurry at Melting Process in a Tube Flow. Int. J. Refrig. 2006, 29, 451–455. [Google Scholar] [CrossRef]
  37. Nayak, B.B.; Chatterjee, D.; Mullick, A.N. Numerical Prediction of Flow and Heat Transfer Characteristics of Water-Fly Ash Slurry in a 180° Return Pipe Bend. Int. J. Therm. Sci. 2017, 113, 100–115. [Google Scholar] [CrossRef]
  38. Ekambara, K.; Sanders, R.S.; Nandakumar, K.; Masliyah, J.H. Hydrodynamic Simulation of Horizontal Slurry Pipeline Flow Using ANSYS-CFX. Ind. Eng. Chem. Res. 2009, 48, 8159–8171. [Google Scholar] [CrossRef]
  39. Shi, X.J.; Zhang, P. Conjugated Heat and Mass Transfer during Flow Melting of a Phase Change Material Slurry in Pipes. Energy 2016, 99, 58–68. [Google Scholar] [CrossRef]
  40. Hulburt, H.M.; Katz, S. Some Problems in Particle Technology. Chem. Eng. Sci. 1964, 19, 555–574. [Google Scholar] [CrossRef]
  41. John, V.; Angelov, I.; Öncül, A.A.; Thévenin, D. Techniques for the Reconstruction of a Distribution from a Finite Number of Its Moments. Chem. Eng. Sci. 2007, 62, 2890–2904. [Google Scholar] [CrossRef]
  42. Marchisio, D.L.; Vigil, R.D.; Fox, R.O. Implementation of the Quadrature Method of Moments in CFD Codes for Aggregation–Breakage Problems. Chem. Eng. Sci. 2003, 58, 3337–3351. [Google Scholar] [CrossRef]
  43. Peng, S.J.; Williams, R.A. Direct Measurement of Floc Breakage in Flowing Suspensions. J. Colloid Interface Sci. 1993, 166, 321–332. [Google Scholar] [CrossRef]
  44. Vuarnoz, D.; Sari, O.; Egolf, P.W.; Liardon, H. Ultrasonic velocity profiler uvp-xw for ice- slurry flow characterisation. In Proceedings of the ISUD 3: Third International Symposium on Ultrasonic Doppler Methods for Fluid Mechanics and Fluid Engineering, Lausanne, Switzerland, 9–11 September 2002. [Google Scholar]
  45. Cai, L.; Mi, S.; Liu, Z. Experimental study on the evolution law of ice crystal particle size during the flow of ice slurry. J. Refrig. 2023, 44, 131–138. [Google Scholar]
Figure 1. Geometric model of the circular tube.
Energies 18 01430 g001
Figure 2. Schematic diagram of the boundary conditions.
Energies 18 01430 g002
Figure 3. Schematic diagram of the pipeline grid section.
Energies 18 01430 g003
Figure 4. Grid independence verification.
Energies 18 01430 g004
Figure 5. Comparison of simulation results with experimental data in the literature. (a) Exit velocity, Vuarnoz et al. [44]. (b) Mean diameter, Cai et al. [45].
Energies 18 01430 g005
Figure 6. PSD of tailings on different YZ sections of a circular tube.
Energies 18 01430 g006
Figure 7. Diameter distribution of outlet cross-sections (YZ cross-sections) of round tubes with different ice content levels.
Energies 18 01430 g007
Figure 8. Diameter distribution of the outlet cross-section (YZ cross-section) of round tubes with different mobilities.
Energies 18 01430 g008
Figure 9. PSD of tailings along the axis of a horizontal circular pipe; (ad) indicate that the particle sizes of the tailings are 10 μm, 100 μm, 200 μm, and 300 μm, respectively.
Energies 18 01430 g009
Figure 10. PSD of filling slurry under different solid-phase volume fractions (initial particle size is 10 μm).
Energies 18 01430 g010
Figure 11. PSD of filling slurry under different solid-phase volume fractions (initial particle size is 100 μm).
Energies 18 01430 g011
Figure 12. Distribution of pipeline axial pressure.
Energies 18 01430 g012
Table 1. Composition and physical parameters of ice-containing filling slurry.
Constituent ElementsParameterValueUnit
waterDensity913 k g / m 3
Viscosity8.90 × 10−4 P a / s
IceDensity1000 k g / m 3
TailingsDensity3500 k g / m 3
Table 2. Simulation parameter values under different working conditions.
Operating Condition NameInlet Velocity (m/s)Initial Size of Tailings (μm)Ice Content (%)
PBM-11.5100
PBM-21.51010%
PBM-31.51020%
PBM-42.51010%
PBM-53.51010%
PBM-61.510010%
PBM-71.520010%
PBM-81.530010%
Disclaimer/Publisher’s Note: The statements, opinions and data contained in all publications are solely those of the individual author(s) and contributor(s) and not of MDPI and/or the editor(s). MDPI and/or the editor(s) disclaim responsibility for any injury to people or property resulting from any ideas, methods, instructions or products referred to in the content.

