
Research on Cross-Circuitry Fault Identification Method for AC/DC Transmission System Based on Blind Signal Separation Algorithm

Abstract
1. Introduction
2. Structural Design of AC/DC Transmission Systems
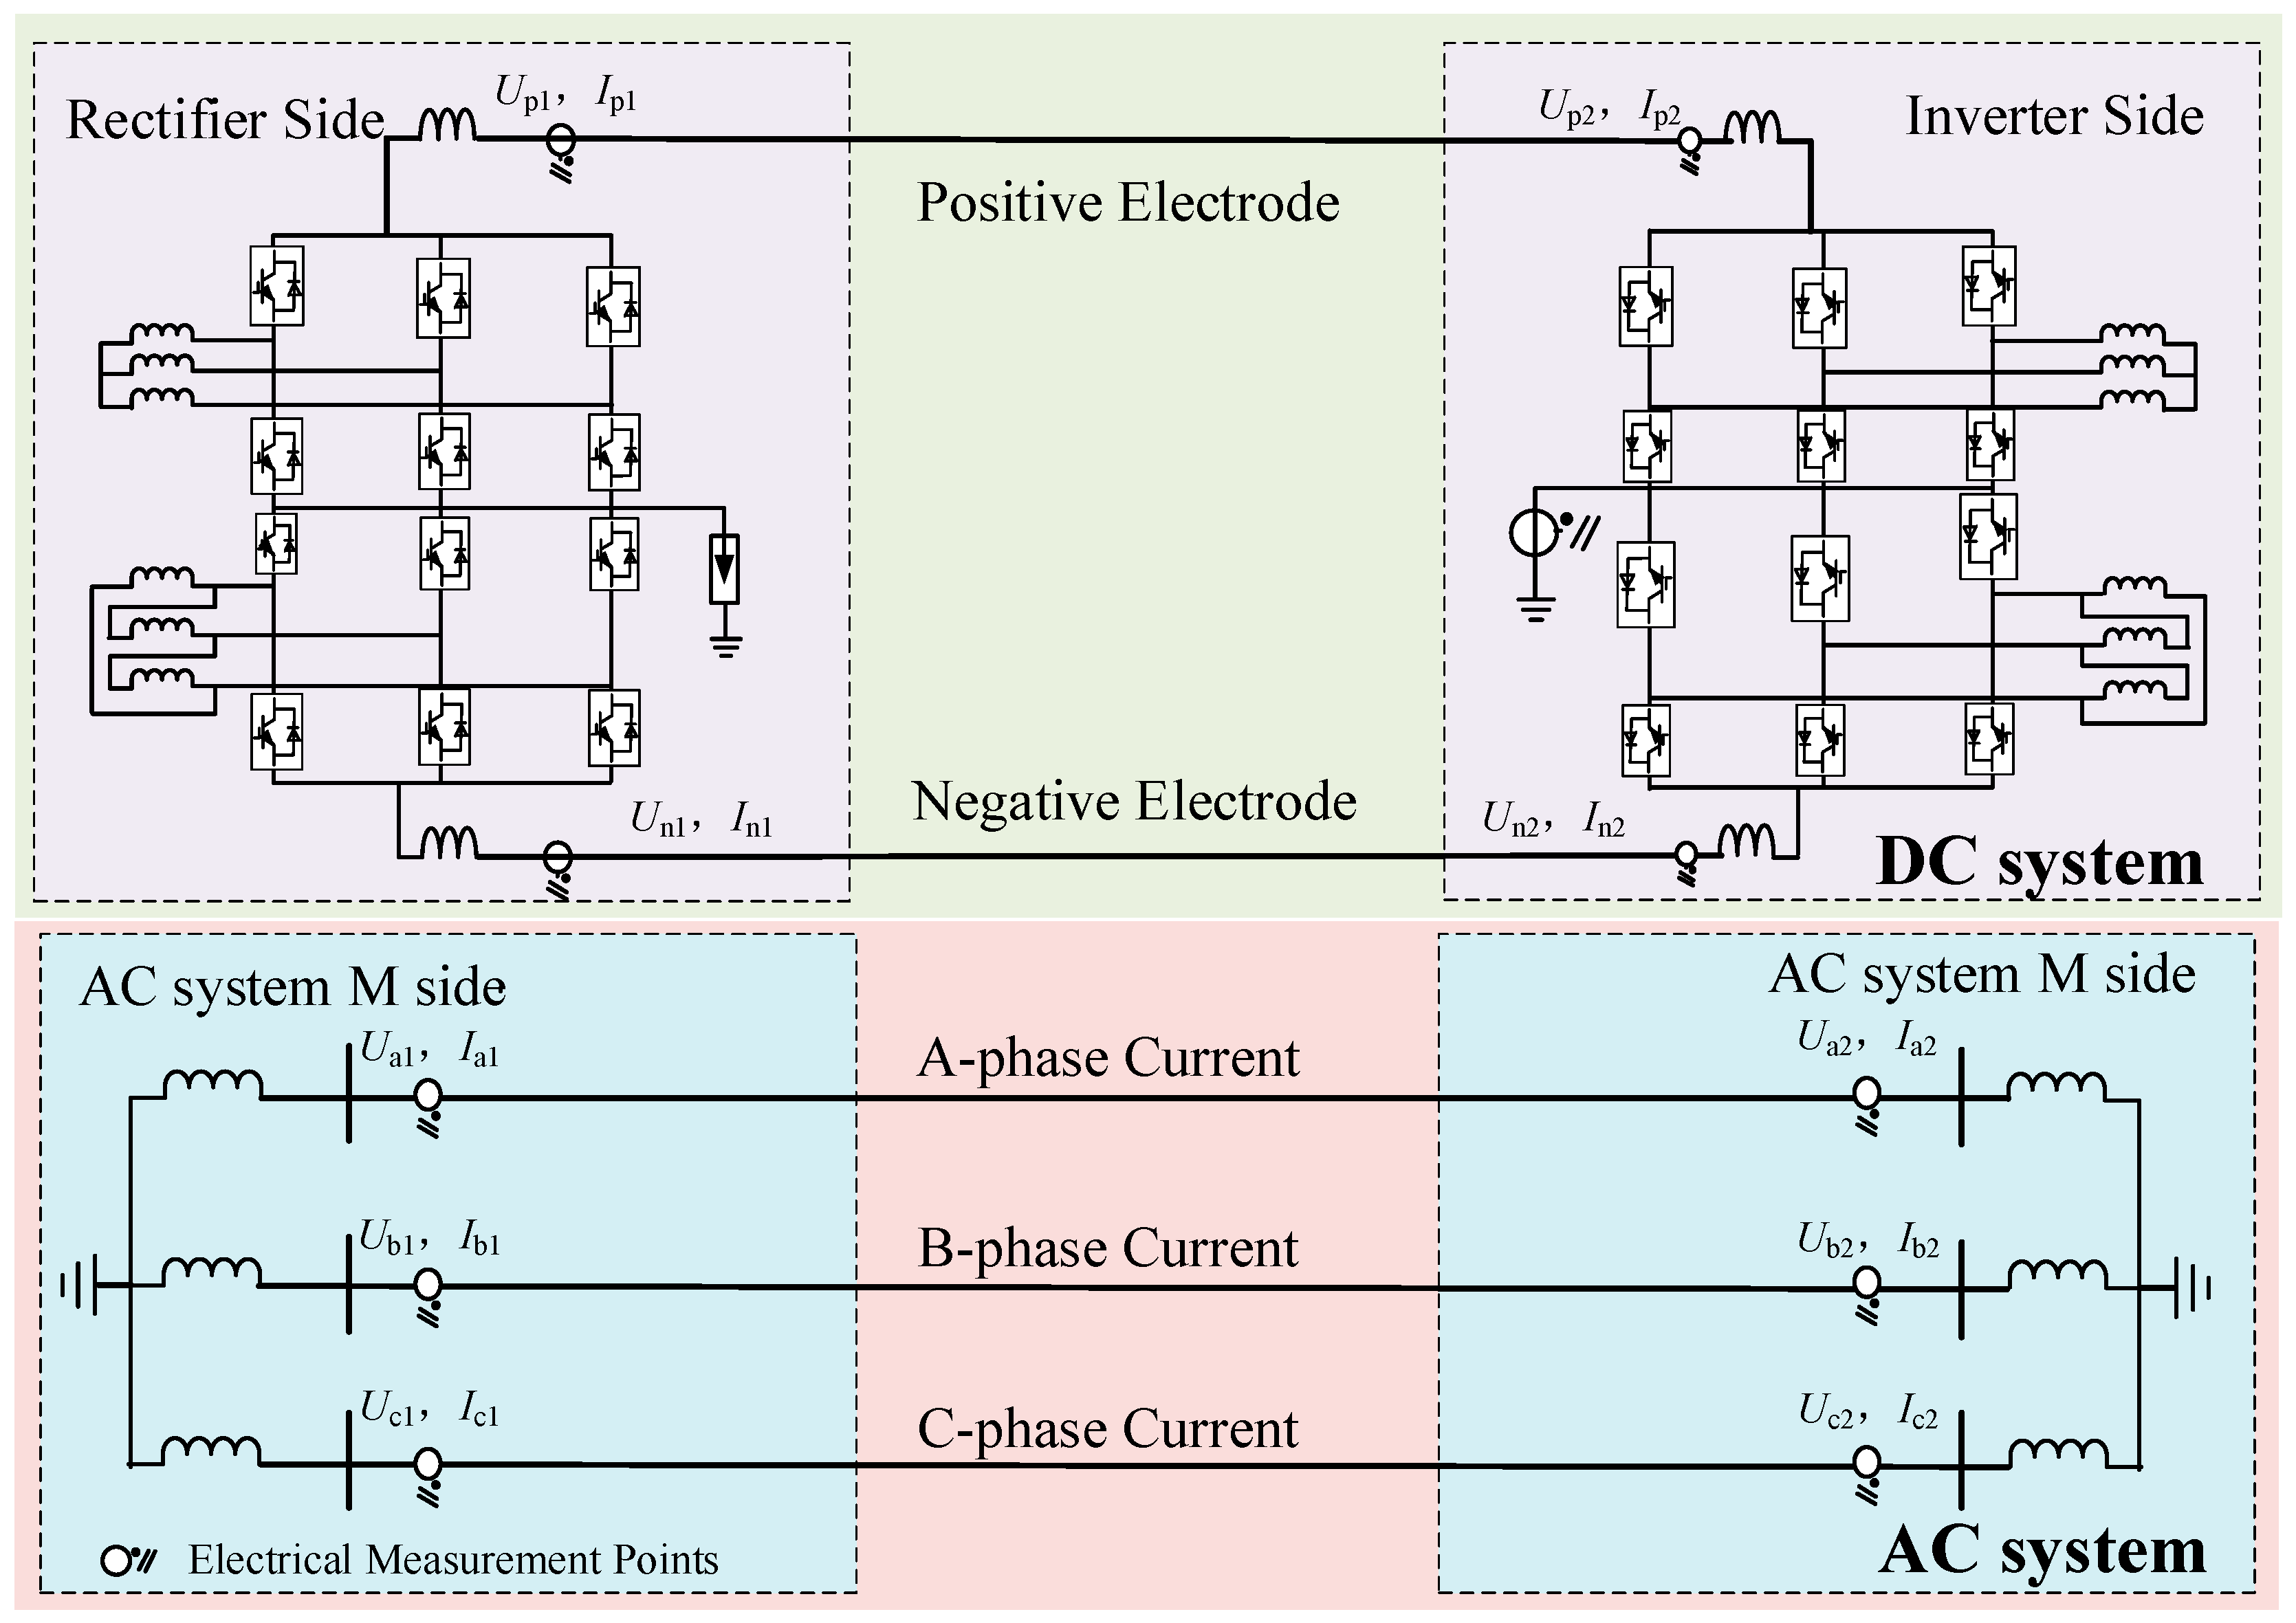
2.1. System Architecture of AC/DC Transmission Systems
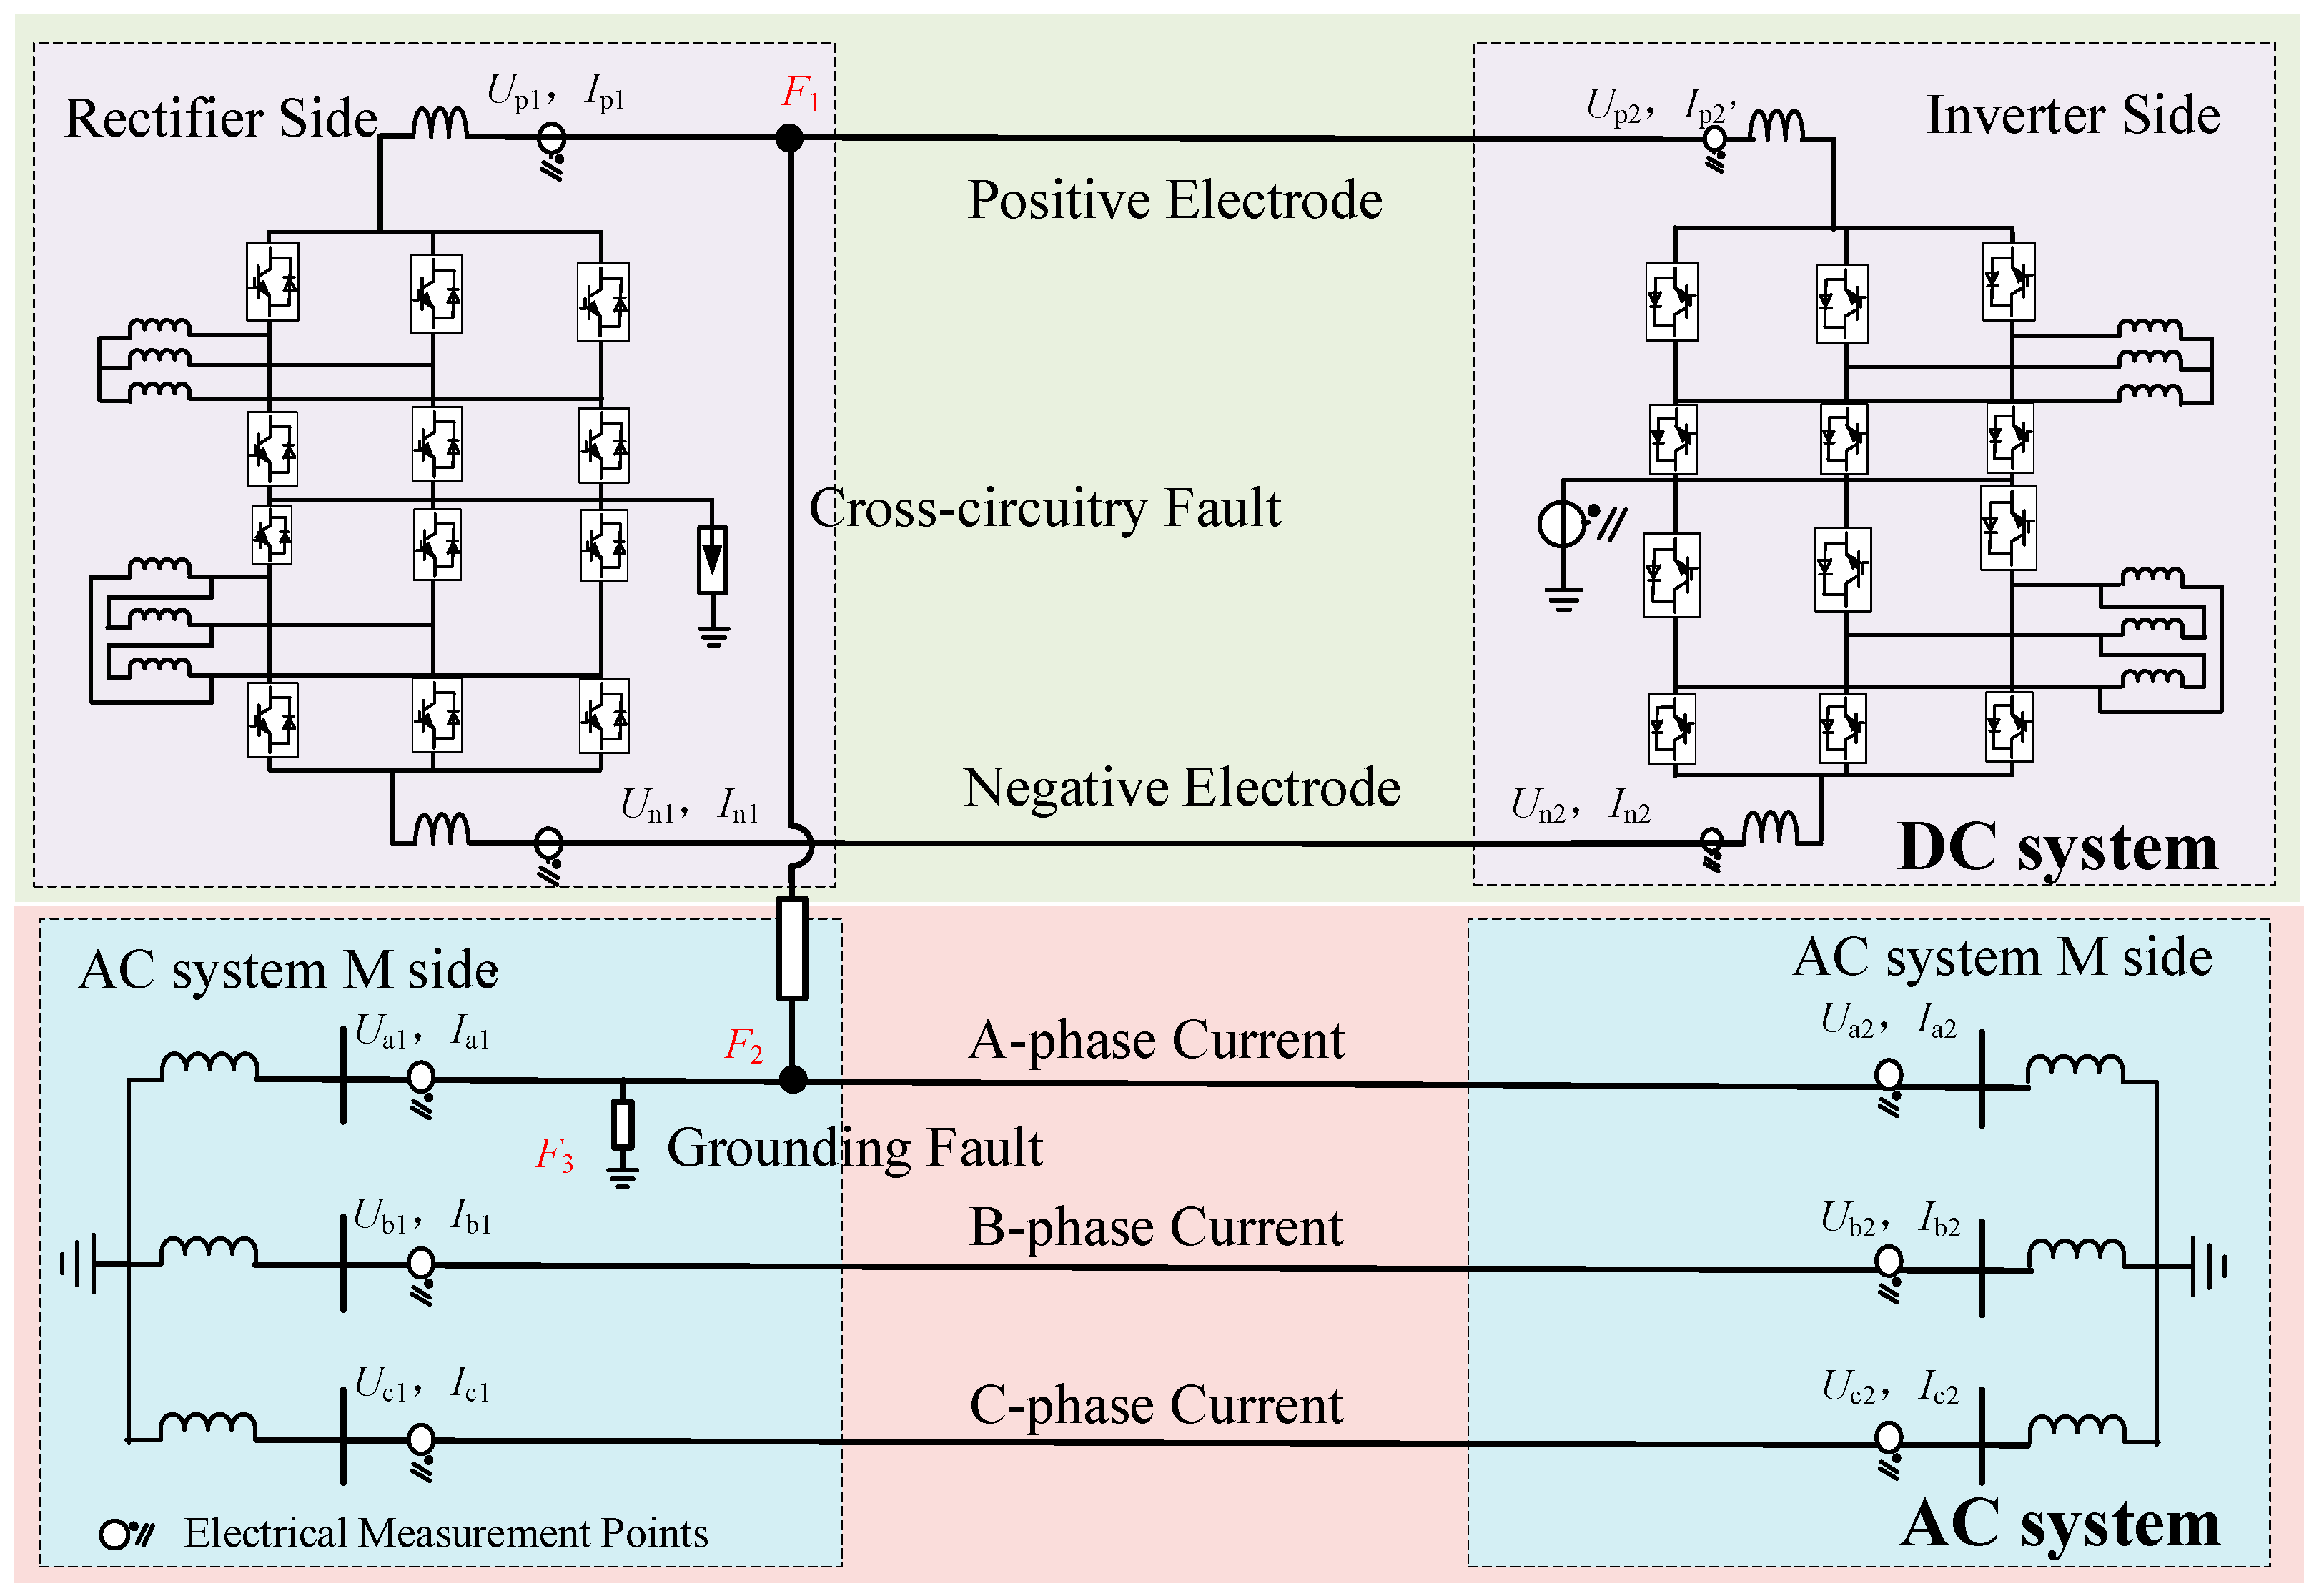
2.2. Analysis of Cross-Circuitry Fault System Architecture
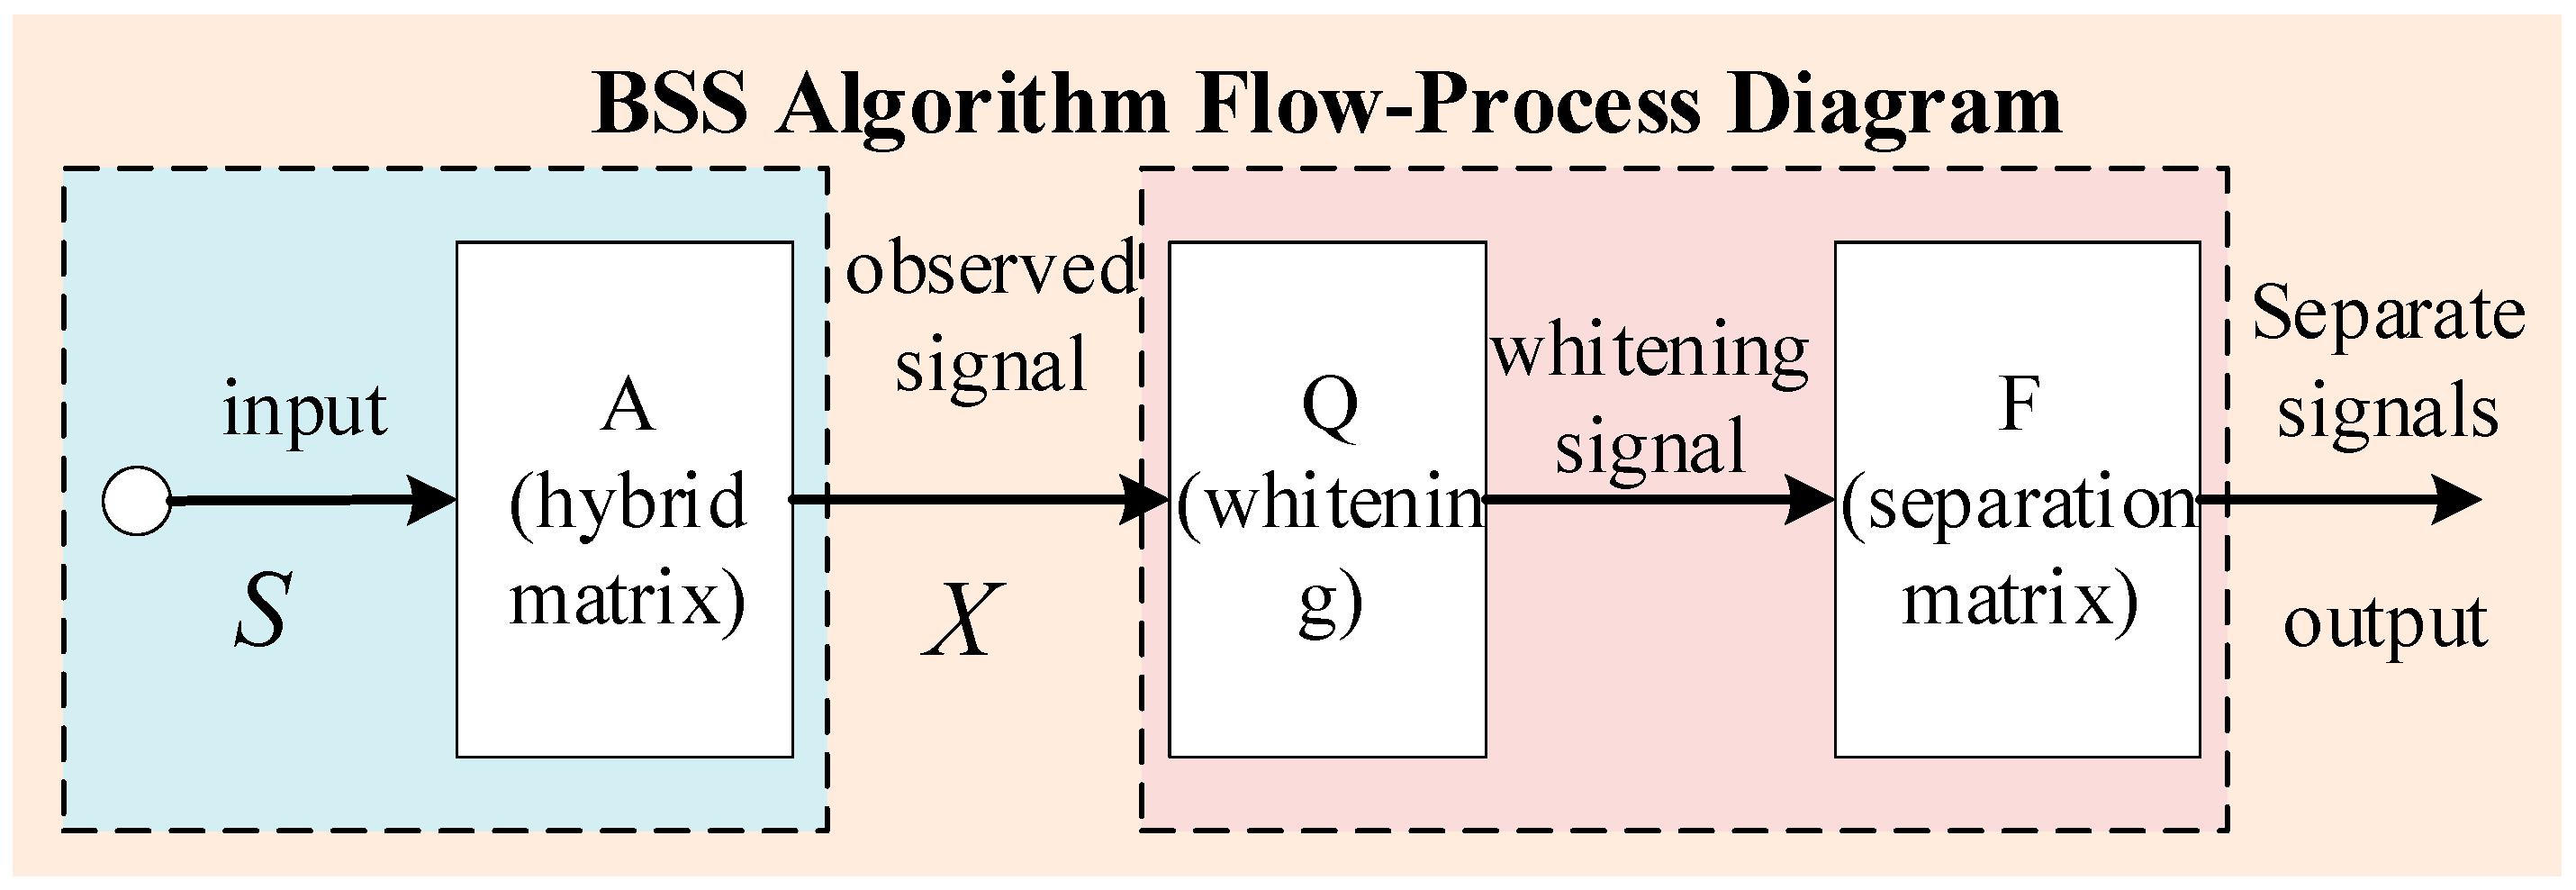
2.3. Principles of BSS Algorithm
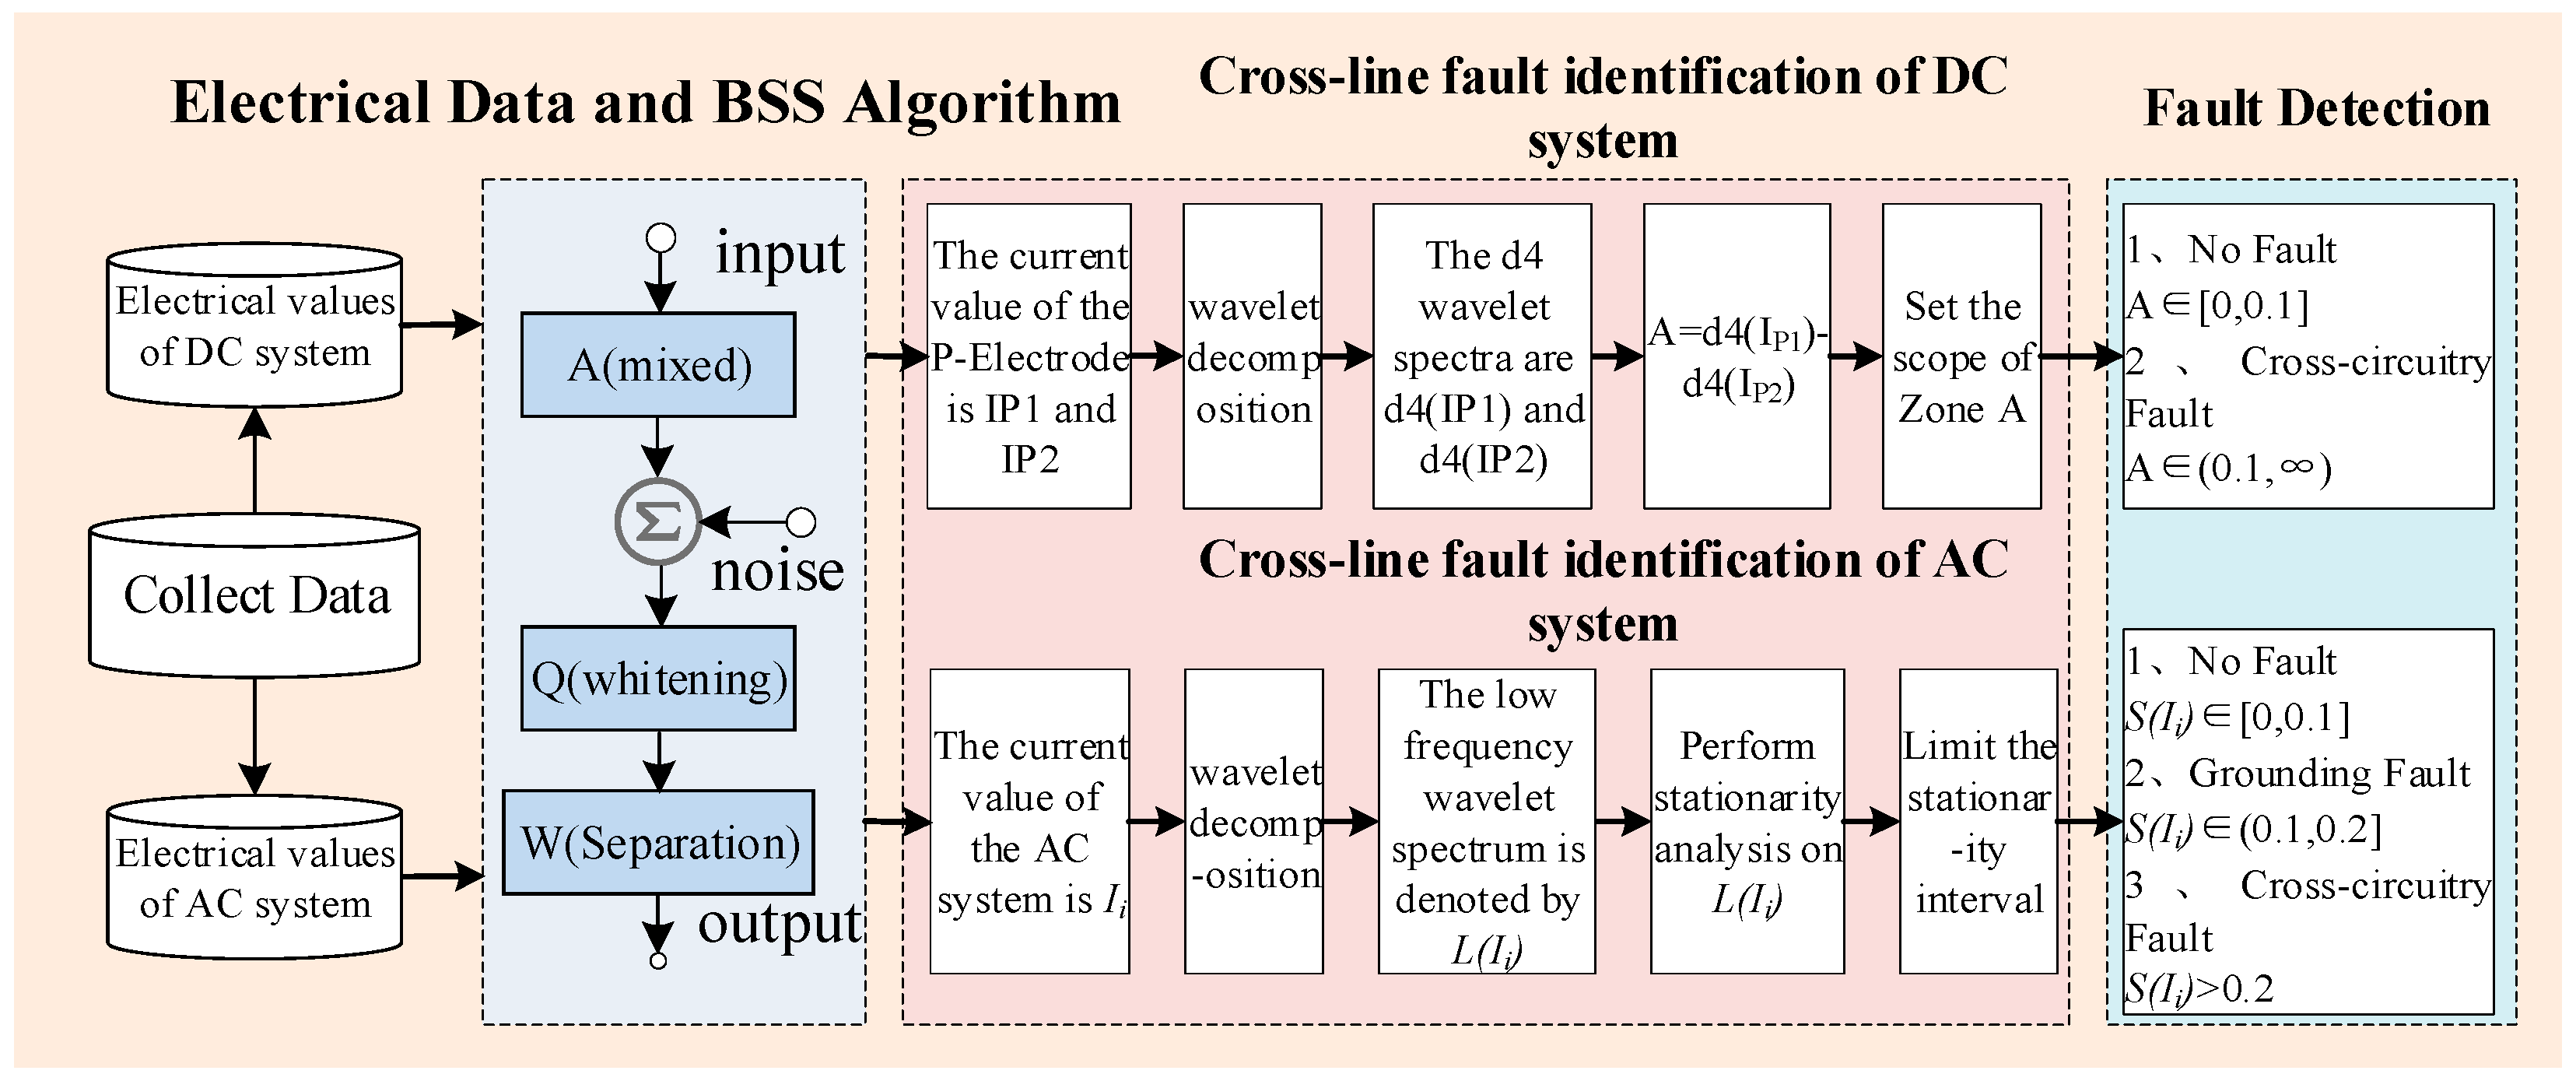
3. Design of a Fault Identification Scheme Based on the AC/DC Transmission System
3.1. Design of DC System Fault Detection Scheme
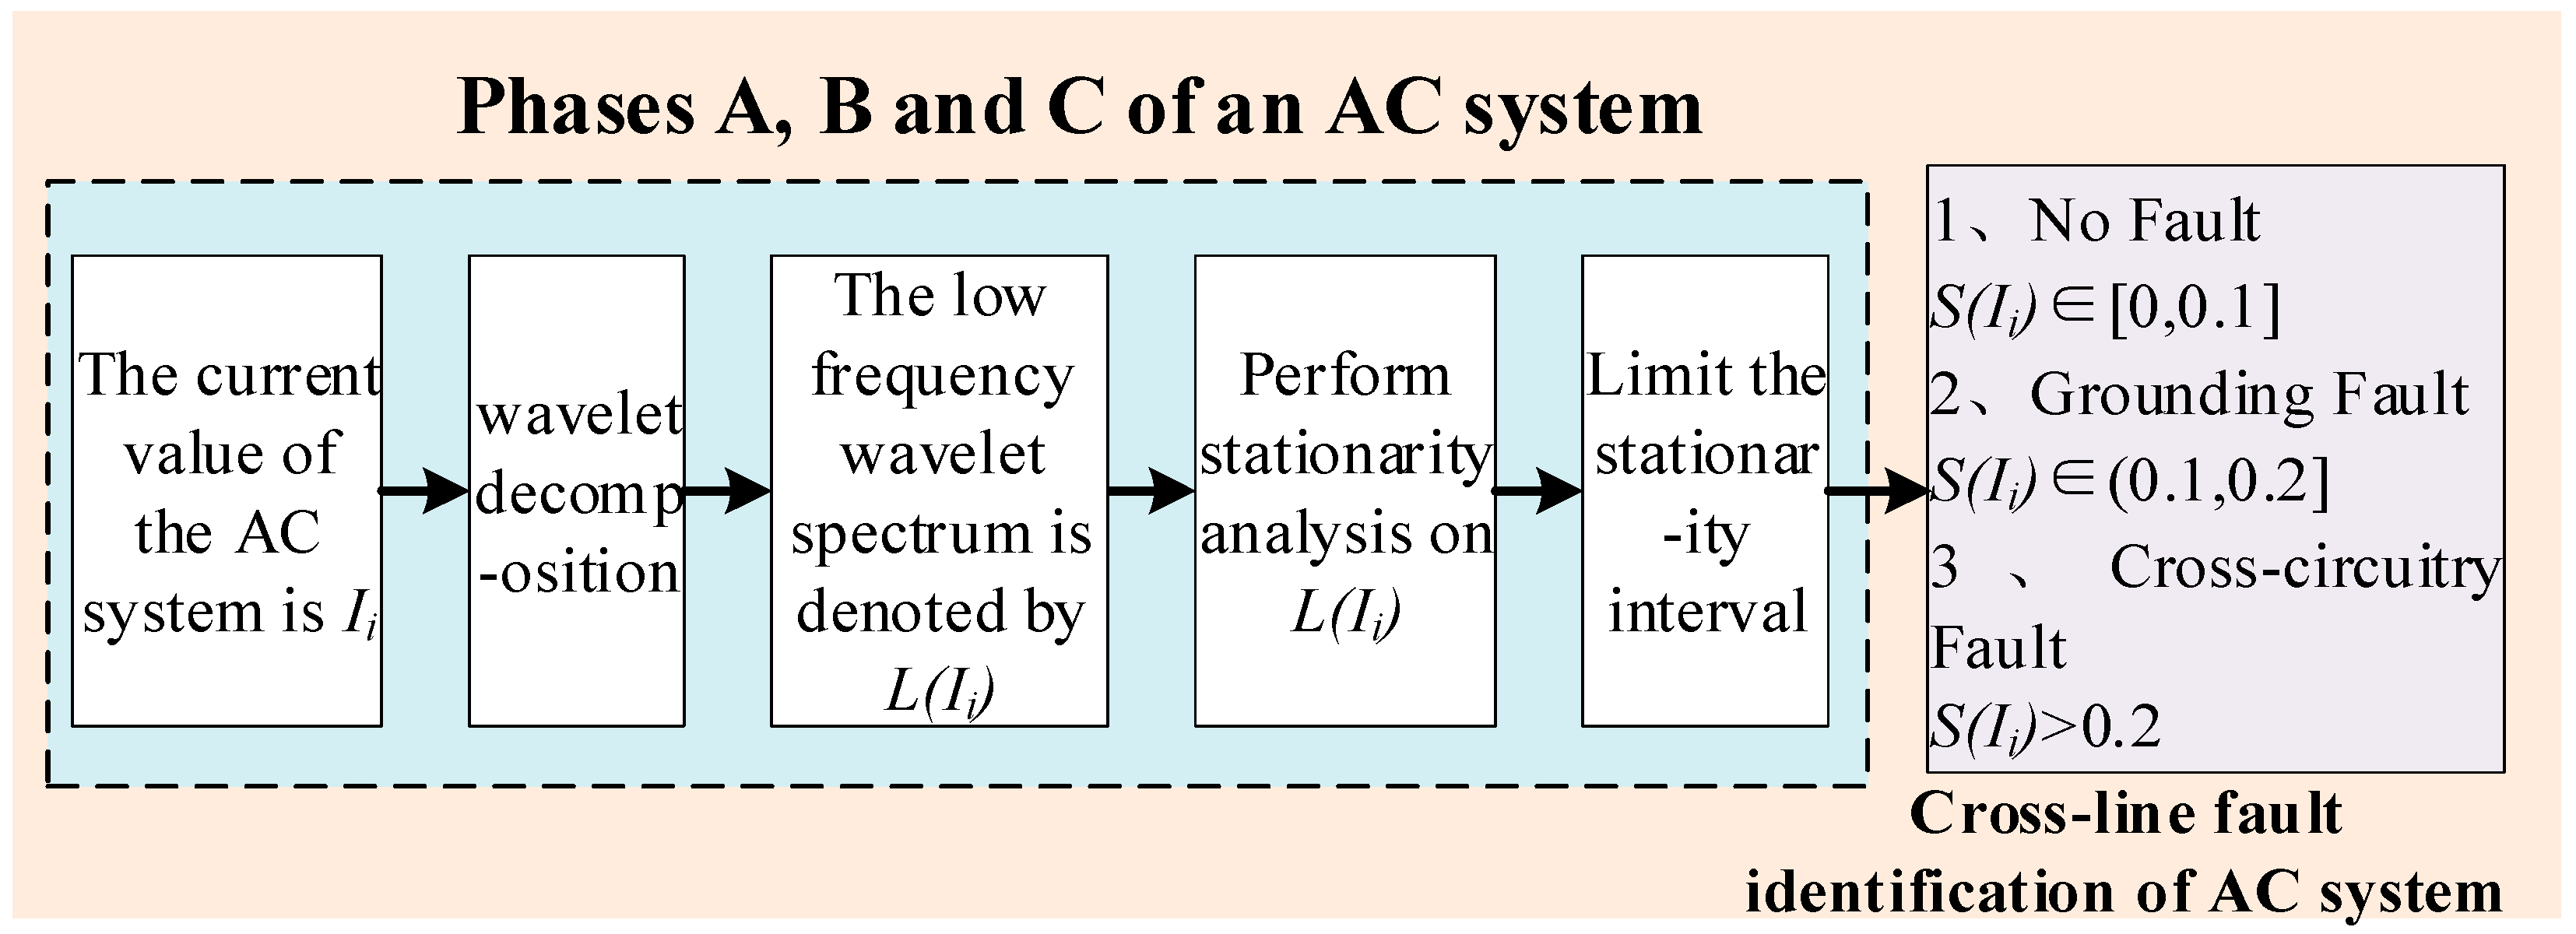
3.2. Design of AC System Fault Detection Scheme
3.3. BSS Algorithm Denoising Analysis
4. Experimental Analysis of AC/DC Transmission Systems
4.1. Analysis of the BSS Algorithm
4.2. Analysis of the DC Side
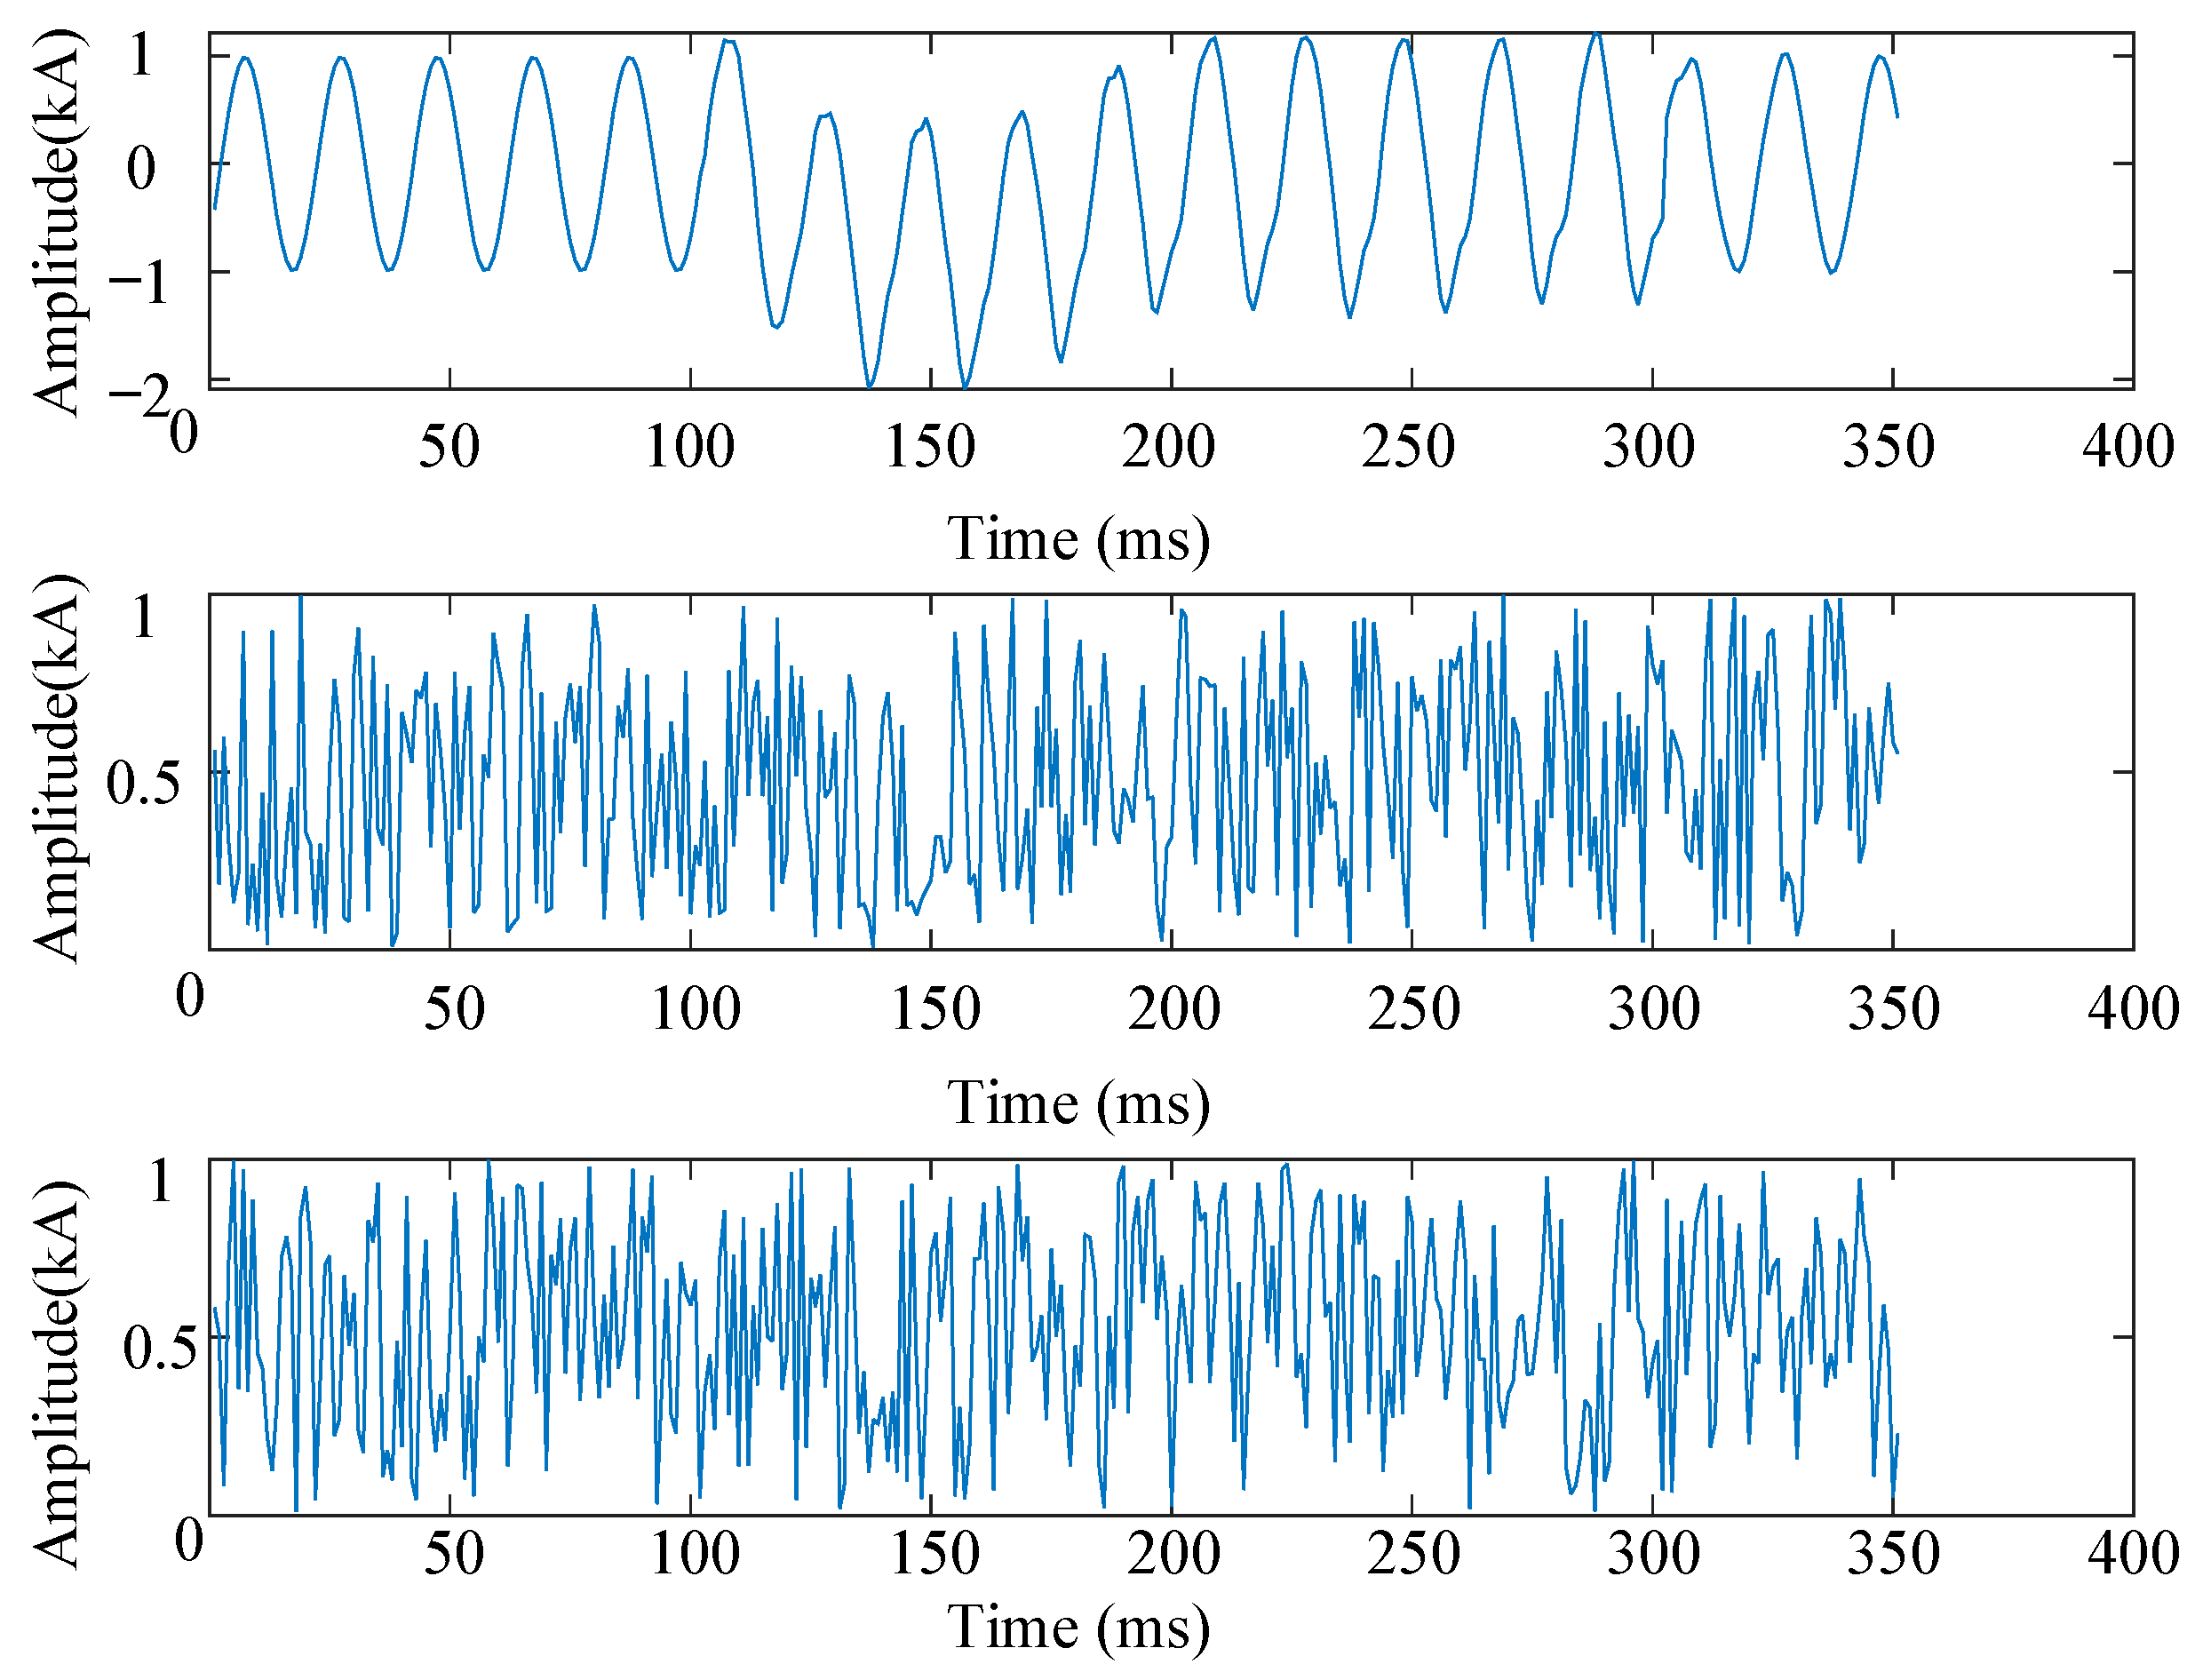
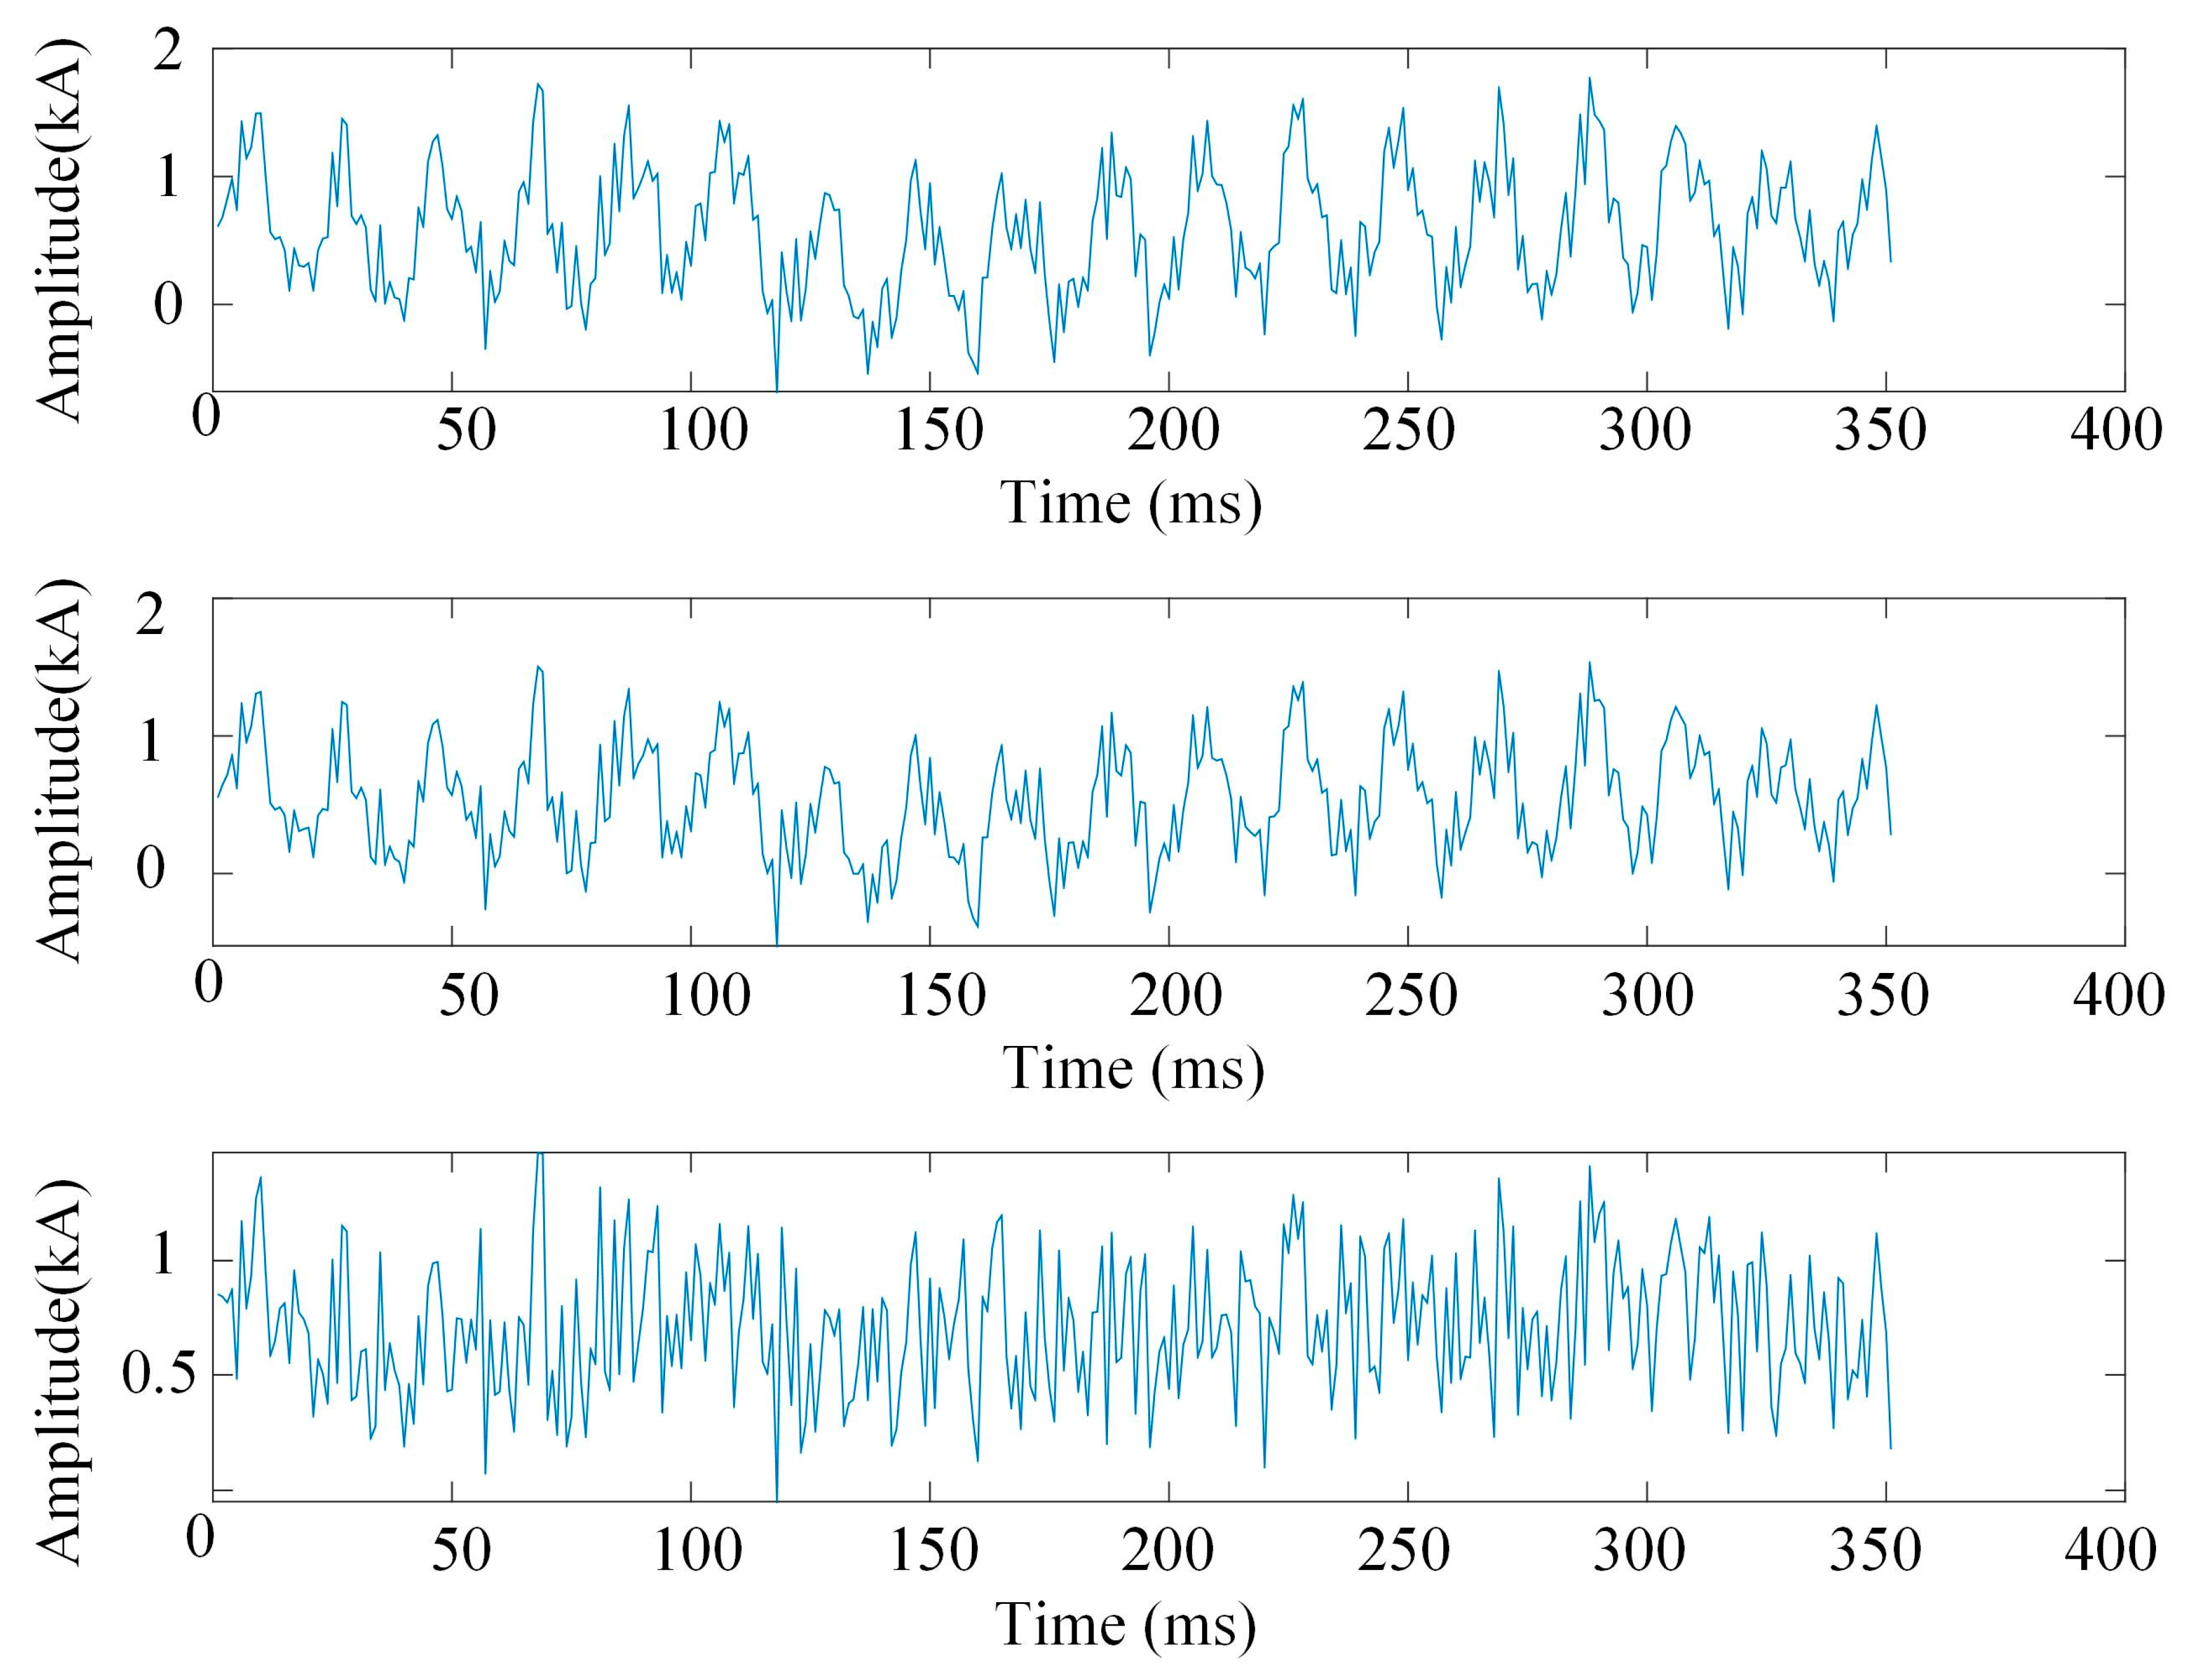
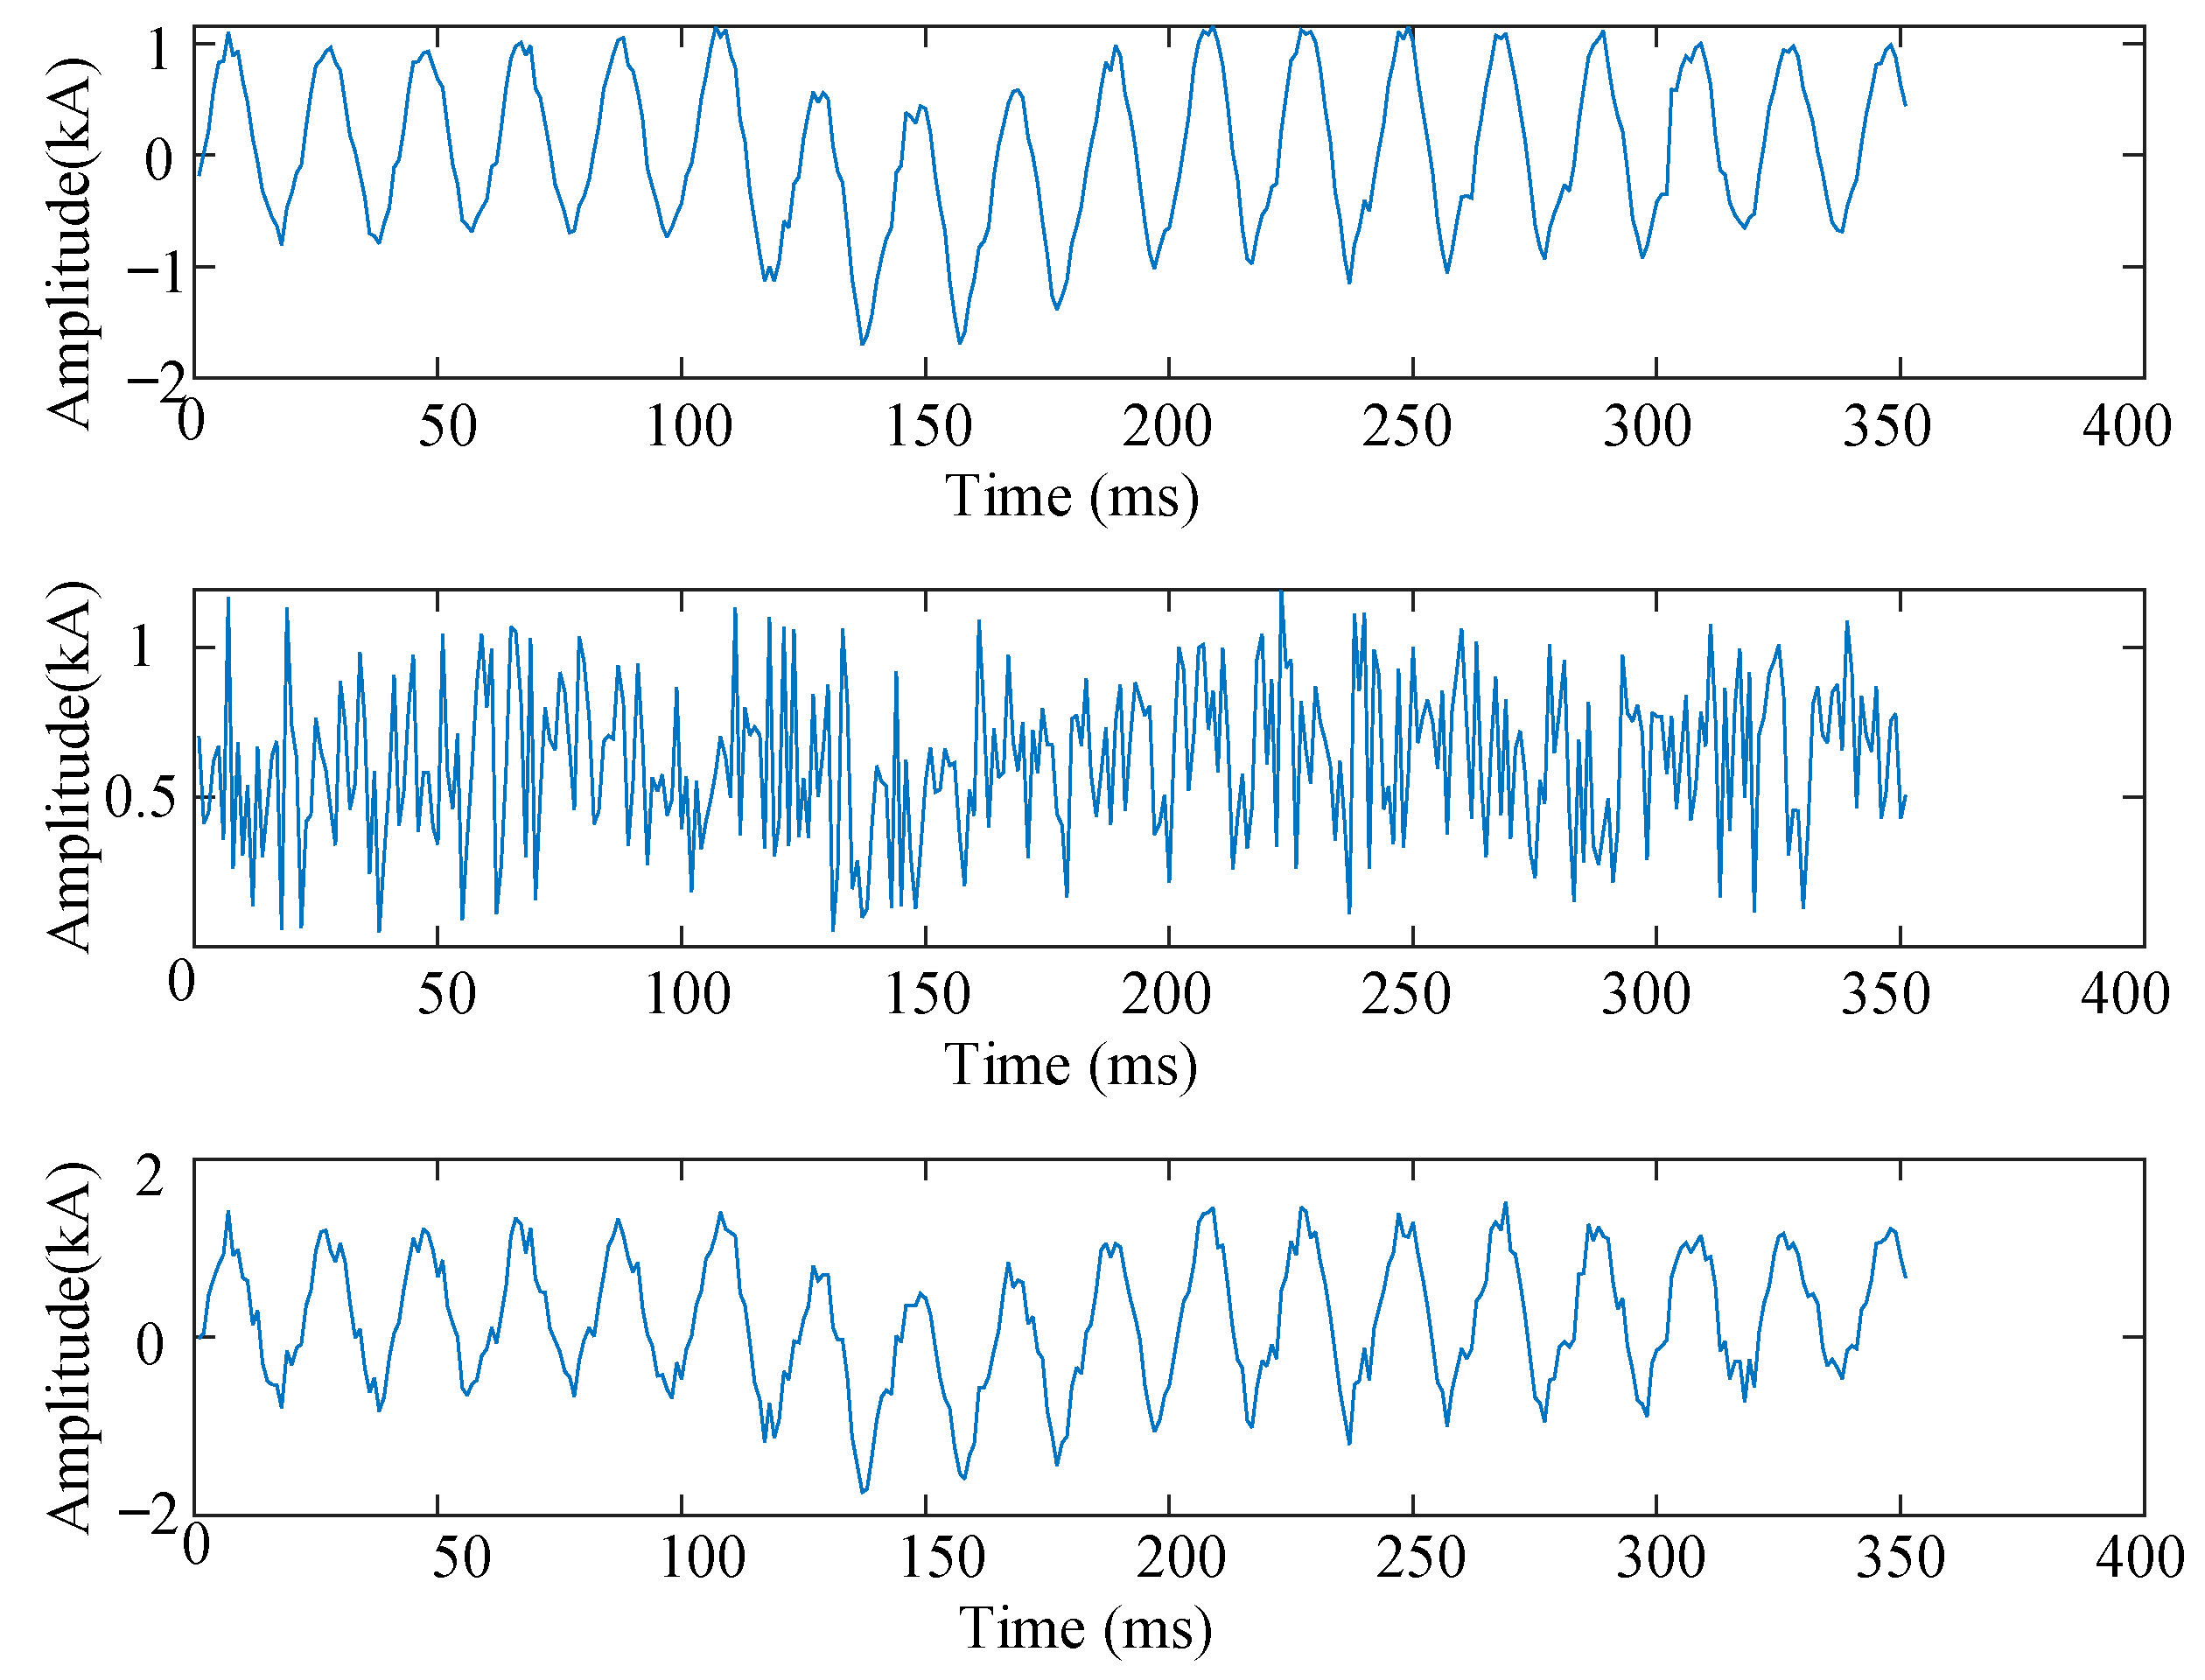
4.3. Analysis of the AC Side
4.4. Summary of the Experiment
5. Conclusions
Author Contributions
Funding
Data Availability Statement
Conflicts of Interest
References
- Li, S.; Li, Z.; Shahidehpour, M.; Huang, W.; Zheng, J.H. Dispatchable region for distributed renewable energy generation in reconfigurable AC–DC distribution networks with soft open points. Appl. Energy 2024, 371, 123704. [Google Scholar] [CrossRef]
- Abd el-Ghany, H.A.; Elmezain, M.I.; Rashad, E.M.; Ahmed, E.S. Discrete-wavelet-based scheme for protection coordination of hybrid AC/DC distribution networks. Alex. Eng. J. 2024, 90, 76–88. [Google Scholar] [CrossRef]
- Zhao, Q.; Tan, J.; Zhang, L.; Peng, Y.; Shu, F.; Chen, L. Analysis of the Impact of Relay Protection in AC/DC Hybrid Power Grid Based on PSCAD. In Proceedings of the 2024 International Conference on HVDC (HVDC), Urumqi, China, 8–9 August 2024; pp. 110–114. [Google Scholar] [CrossRef]
- Seo, H.-C.; Gwon, G.-H.; Park, K.-W. Development of New Protection System Using Direction of Fault Current in Radial-Type LVDC Distribution System with PV System. J. Electr. Eng. Technol. 2024, 19, 2767–2777. [Google Scholar] [CrossRef]
- Mehdi, A.; Hassan, S.J.U.; Haider, Z.; Arefaynie, A.D.; Song, J.-S.; Kim, C.-H. A systematic review of fault characteristics and protection schemes in hybrid AC/DC networks: Challenges and future directions. Energy Rep. 2024, 12, 120–142. [Google Scholar] [CrossRef]
- Elmezain, M.I.; Abd el-Ghany, H.A.; Rashad, E.M.; Ahmed, E.S. A fast protection of hybrid AC/DC distribution network based on feature extraction of DWT. Electr. Eng. 2024, 106, 7783–7802. [Google Scholar] [CrossRef]
- Arévalo, P.; Jurado, F. Impact of artificial intelligence on the planning and operation of distributed energy systems in smart grids. Energies 2024, 17, 4501. [Google Scholar] [CrossRef]
- Khosravi, M.; Trik, M.; Ansari, A. Diagnosis and classification of disturbances in the power distribution network by phasor measurement unit based on fuzzy intelligent system. J. Eng. 2024, 2024, e12322. [Google Scholar] [CrossRef]
- Gallegos, J.; Arévalo, P.; Montaleza, C.; Jurado, F. Sustainable electrification—Advances and challenges in electrical-distribution networks: A review. Sustainability 2024, 16, 698. [Google Scholar] [CrossRef]
- Meng, Q.; Hussain, S.; Luo, F.; Wang, Z.; Jin, X. An online reinforcement learning-based energy management strategy for microgrids with centralized control. IEEE Trans. Ind. Appl. 2024, 61, 1501–1510. [Google Scholar] [CrossRef]
- Hassan, O.A.; Lai, W.K.; Darlis, N.; Norjali, R.; Zohari, H.; Baharom, M.N.R.; Mustafa, N. Development of an Automatic Ventilation System Using Internet of Things for Smart Kitchen Applications. Adv. Fluid Heat Mater. Eng. 2024, 2, 11–22. [Google Scholar]
- Zhou, K.; Gao, F.; Hou, Z.; Meng, X. Power Conversion Internet of Things: Architecture, Key Technologies and Prospects. IEEE Trans. Ind. Inform. 2024, 20, 10587–10598. [Google Scholar] [CrossRef]
- Li, P.; Yang, P.; Liu, J.; Zhang, Z.; Shi, X.; Liu, L. UHV AC/DC power grid geomagnetically induced currents harmonic characteristics analysis. Int. J. Electr. Power Energy Syst. 2024, 160, 110088. [Google Scholar] [CrossRef]
- Wang, P.; Guo, D.; Hu, J.; Wang, W.; Xu, D. Natural Power Factor Correction and Soft Switching Design for a Single-Stage Bidirectional Dual Active Bridge AC-DC Converter. IEEE Trans. Power Electron. 2024, 39, 5349–5360. [Google Scholar] [CrossRef]
- Jiang, S.; Peng, K.; Zhao, X.; Chen, J.; Jiang, Y.; Liu, Y. A high-frequency reduced-order model for parameters optimization of AC/DC distribution systems considering random disturbances. Sustain. Energy Technol. Assess. 2024, 71, 103969. [Google Scholar] [CrossRef]
- Abdelwanis, M.I.; Elmezain, M.I. A comprehensive review of hybrid AC/DC networks: Insights into system planning, energy management, control, and protection. Neural Comput. Appl. 2024, 36, 17961–17977. [Google Scholar] [CrossRef]
- Liang, Z.; Chung, C.; Zhang, W.; Wang, Q.; Lin, W.; Wang, C. Enabling high-efficiency economic dispatch of hybrid AC/DC networked microgrids: Steady-state convex bi-directional converter models. IEEE Trans. Smart Grid 2024, 16, 45–61. [Google Scholar] [CrossRef]
- de Lopez Diz, S.; Lopez, R.M.; Sanchez, F.J.R.; Peña, E.J.B. A Digital Twin Approach for Online Impedance-Based Stability Analysis of Three-Phase AC Systems. IEEE Trans. Ind. Electron. 2024, 71, 16845–16856. [Google Scholar] [CrossRef]
- Düllmann, P.; Klein, C.; Winter, P.; Köhler, H.; Steglich, M.; Teuwsen, J.; Leterme, W. Preventive DC-side decoupling: A system integrity protection scheme to limit the impact of DC faults in offshore multi-terminal HVDC systems. IET Gener. Transm. Distrib. 2024, 18, 3801–3816. [Google Scholar] [CrossRef]
- Zhang, Z.; Cai, D.; Bamisile, O.; Huang, Q. Overview of Fault Diagnosis in High Voltage Direct Current Transmission Systems. In Proceedings of the 2024 6th Asia Energy and Electrical Engineering Symposium (AEEES), Chengdu, China, 28–31 March 2024; pp. 603–609. [Google Scholar] [CrossRef]
- Ouyang, J.; Chen, Y.; Pan, X.; Diao, Y. An Improved Suppression Method of AC Transient Overvoltage for Line Commuted Converter Based High Voltage Direct Current Considering AC-DC System Coupling. Electronics 2024, 13, 1844. [Google Scholar] [CrossRef]
- Gao, J.; Zhao, Y.; Lu, Y.; Xu, G. Resonance Detection Method of AC-DC Hybrid Micro-grid Based on Wavelet Transform and Fast Fourier Transform. J. Phys. Conf. Ser. 2024, 2747, 012003. [Google Scholar] [CrossRef]
- Xia, Y.; Li, X.; Liu, Z.; Liu, Y. Application of Underdetermined Blind Source Separation Algorithm on the Low-Frequency Oscillation in Power Systems. Energies 2023, 16, 3571. [Google Scholar] [CrossRef]
- Wang, G.; Wang, Y.; Min, Y.; Lei, W. Blind source separation of transformer acoustic signal based on sparse component analysis. Energies 2022, 15, 6017. [Google Scholar] [CrossRef]
- Li, W.; Sha, P.; Qian, W.; Li, S.; Deng, J.; Zhang, G. Identification of Sub/Super-synchronous Oscillation Parameters of Wind Power System Based on INMF Combined Blind Signal Separation. In Proceedings of the 2024 8th International Conference on Green Energy and Applications (ICGEA), Singapore, 7–9 March 2024; pp. 154–161. [Google Scholar] [CrossRef]
- Nair, M.S.; Jalaludheen, D.B.; Noorjahan, M.; Panthar, L.; Subairkutty, A.S.S.; AkkaraVeetil, A.; Kunduparambil, A.; Kishore, K.; Baiju, A.T. Hardware implementation of blind signal separation for efficient fetal PCG signal extraction. AIP Conf. Proc. 2024, 3059, 45–53. [Google Scholar] [CrossRef]
- Wang, Y.; Huo, C.; Xu, F.; Zheng, L.; Hao, L. Ultra-Short-Term Distributed Photovoltaic Power Probabilistic Forecasting Method Based on Federated Learning and Joint Probability Distribution Modeling. Energies 2025, 18, 197. [Google Scholar] [CrossRef]
- Agrawal, J.; Gupta, M.; Garg, H. Blind source separation in perspective of ica algorithms: A review. In Proceedings of the 2022 International Conference on Computational Intelligence and Sustainable Engineering Solutions (CISES), Greater Noida, India, 20–21 May 2022; pp. 78–85. [Google Scholar] [CrossRef]
- Chu, X.; Liu, Q.; Lü, H.; Yan, Y.; Xu, L. Protection Scheme for Subsea Observatory Power Supply System Based on Control and Protection Coordination. Trans. China Electrotech. Soc. 2023, 38, 1780–1792. [Google Scholar] [CrossRef]
- Xie, J.; Liu, X.; Wang, M. SFKNN-DPC: Standard deviation weighted distance based density peak clustering algorithm. Inf. Sci. 2024, 653, 119788. [Google Scholar] [CrossRef]
- Amirteimoury, F.; Memarzadeh, G.; Keynia, F. Using stacking ensemble learning to predict multi-step wind speed based on wavelet transformation, two-steps feature selection method, and neural networks. Measurement 2025, 244, 116500. [Google Scholar] [CrossRef]
- Wei, J.; Huang, X.; Zhang, Q.; Liu, Y.; Wu, S.; Chen, Z. Health State Estimation of Lithium Battery Based on Wavelet Packet Transform and Transformer. In Proceedings of the 2023 8th International Conference on Power and Renewable Energy (ICPRE), Shanghai, China, 22–25 September 2023; pp. 851–855. [Google Scholar] [CrossRef]


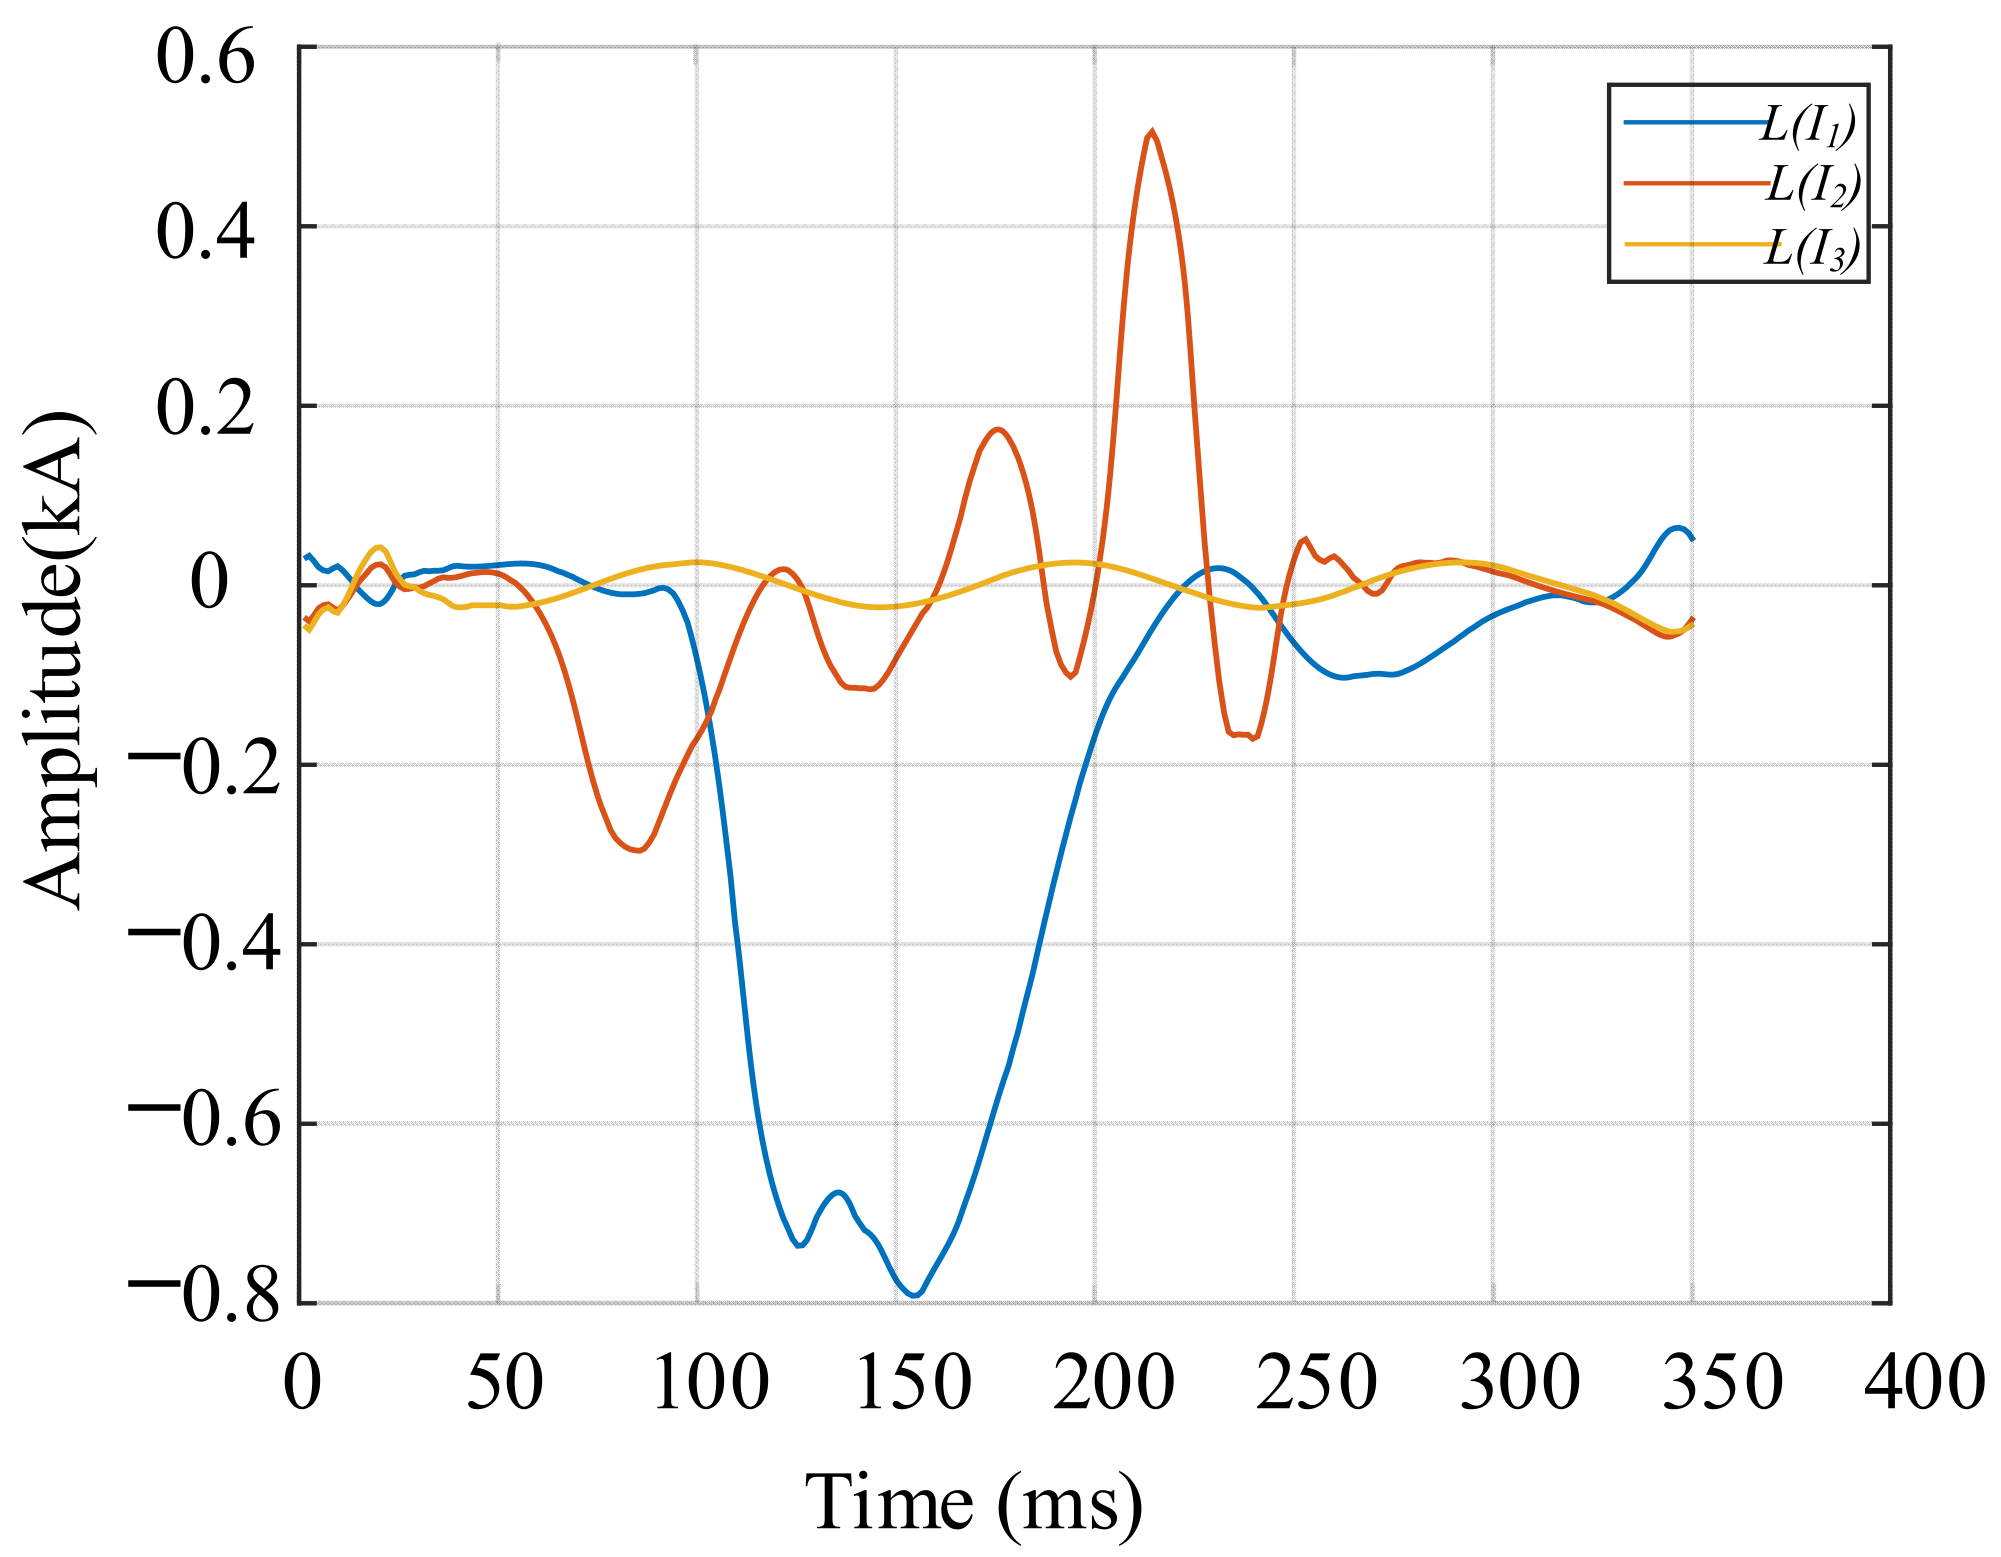
| Signal Name | Absolute Area of the Signal |
|---|---|
| The original signal | 8.49248 |
| Signal after separation | 8.42338 |
| The difference between the two signals | 0.12473 |
| Fault Number | Fault Type | Fault Interval |
|---|---|---|
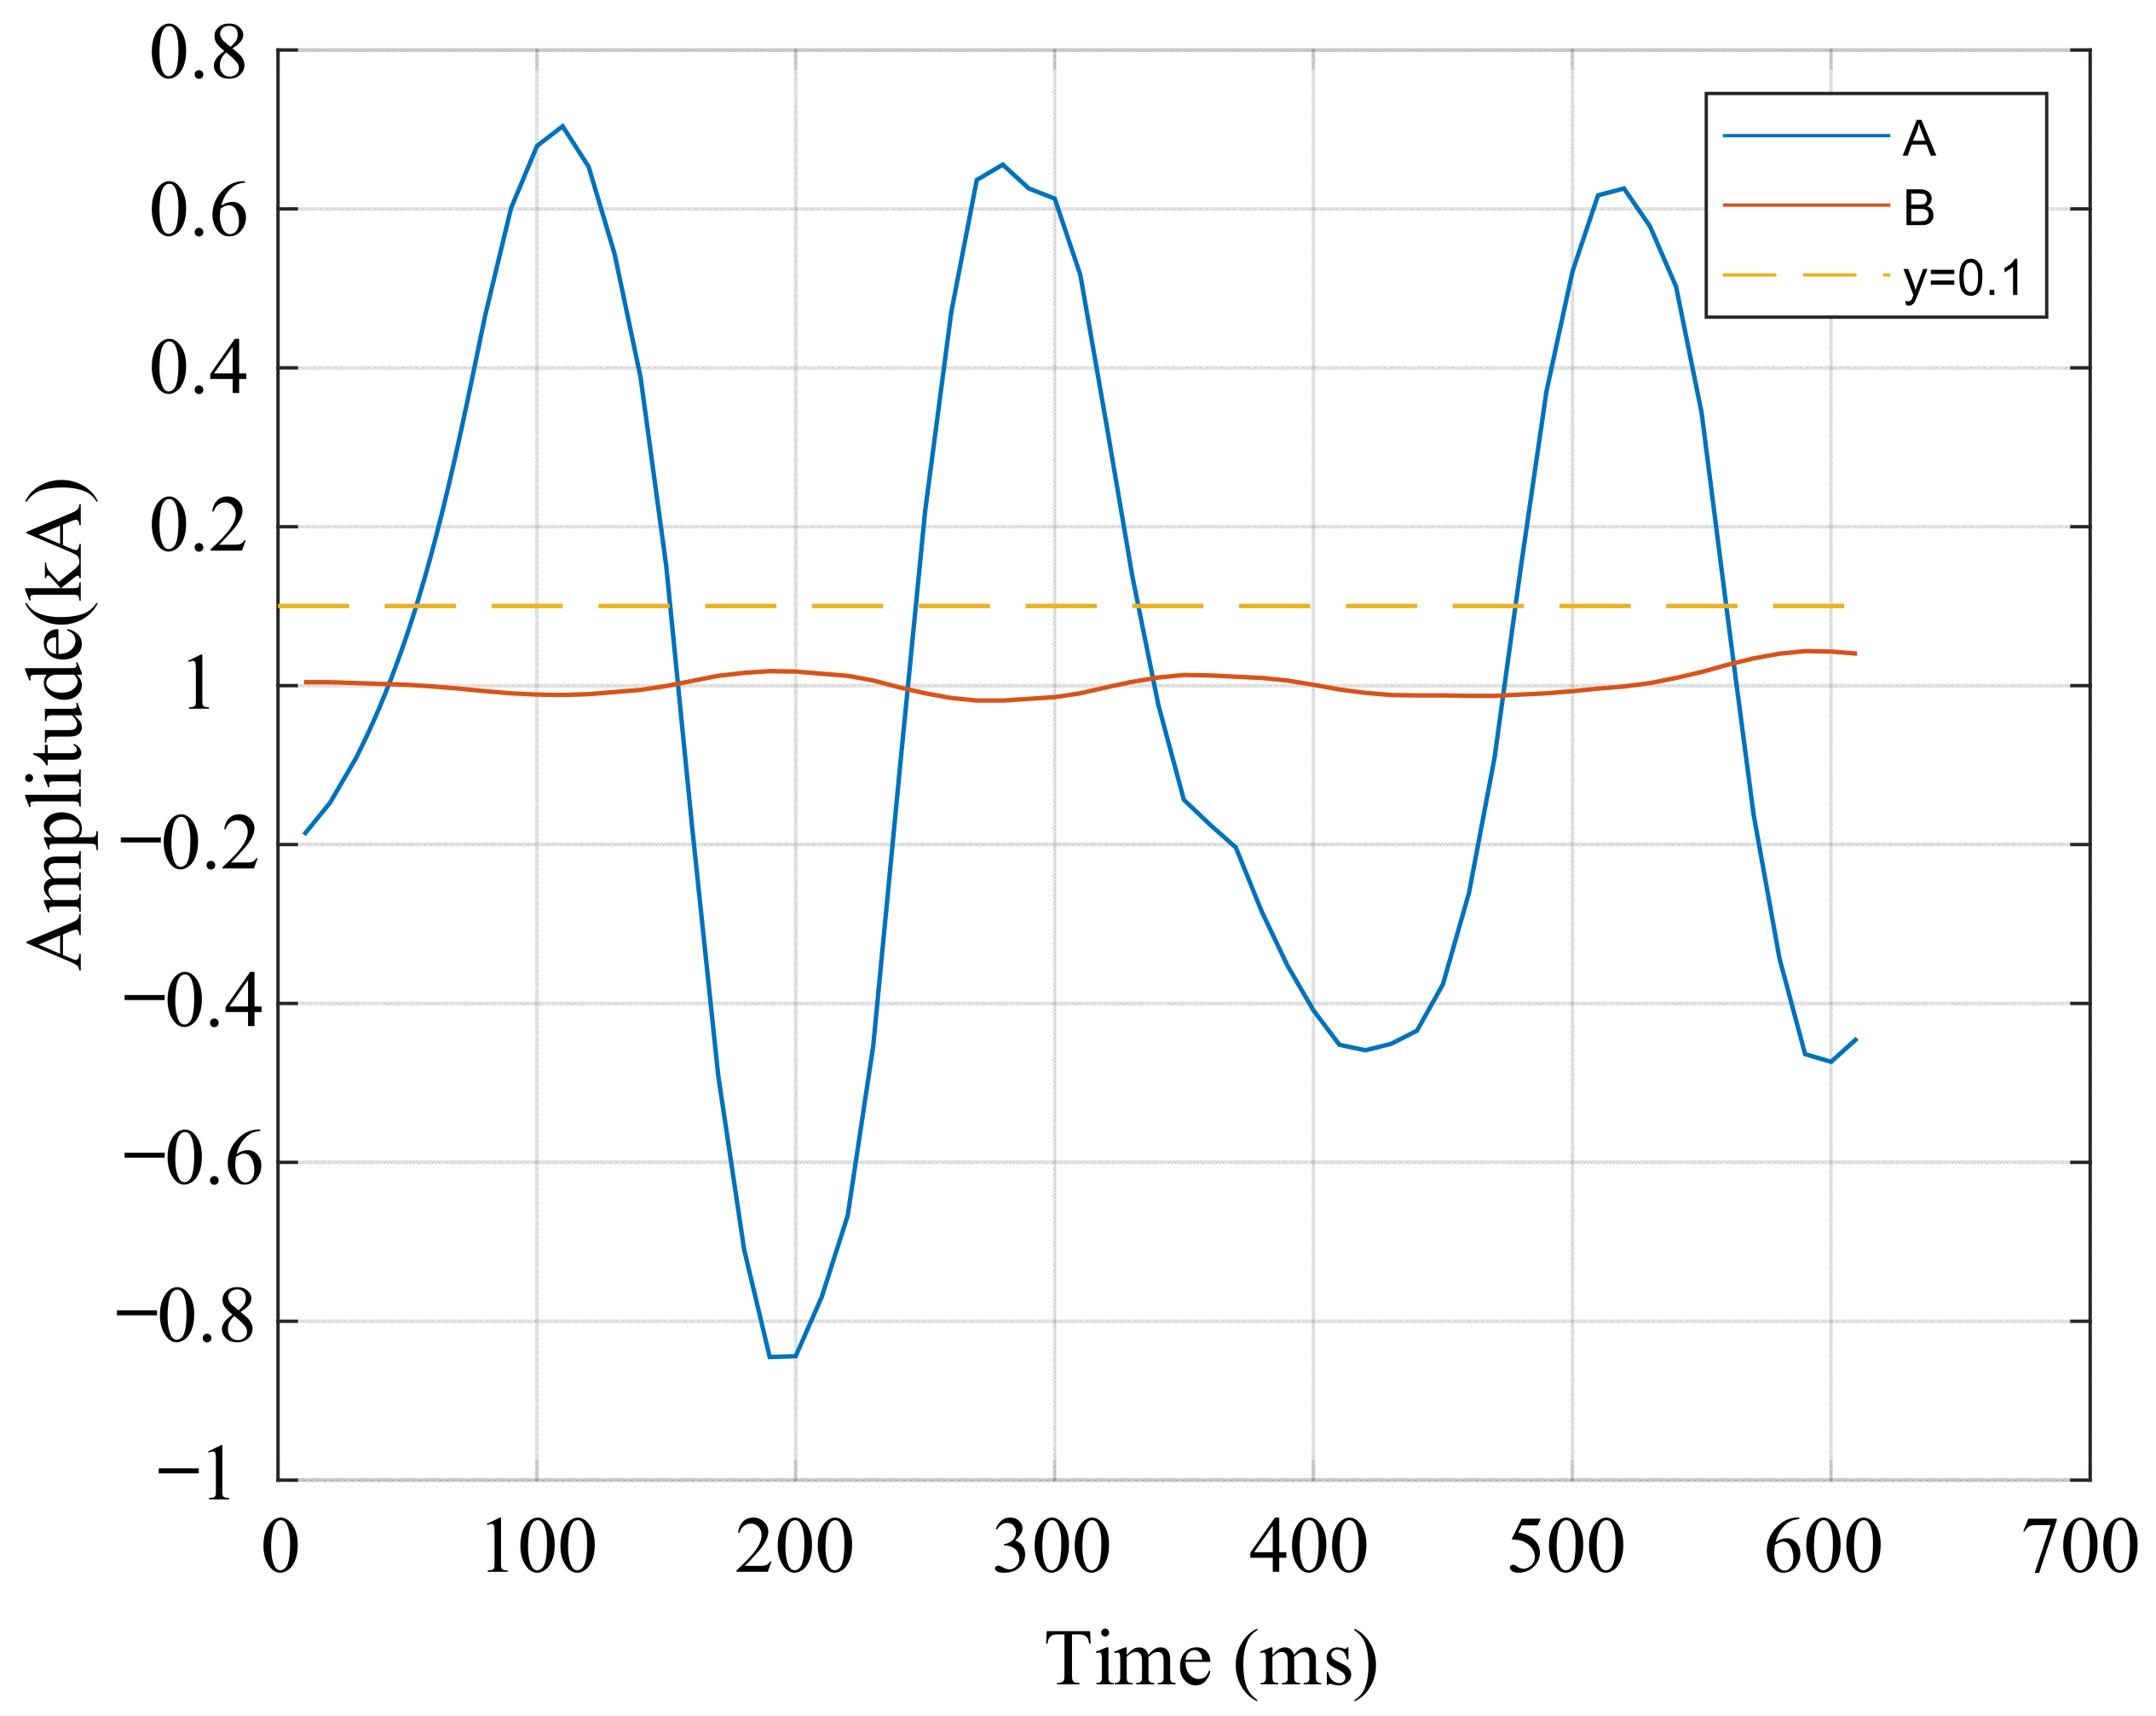
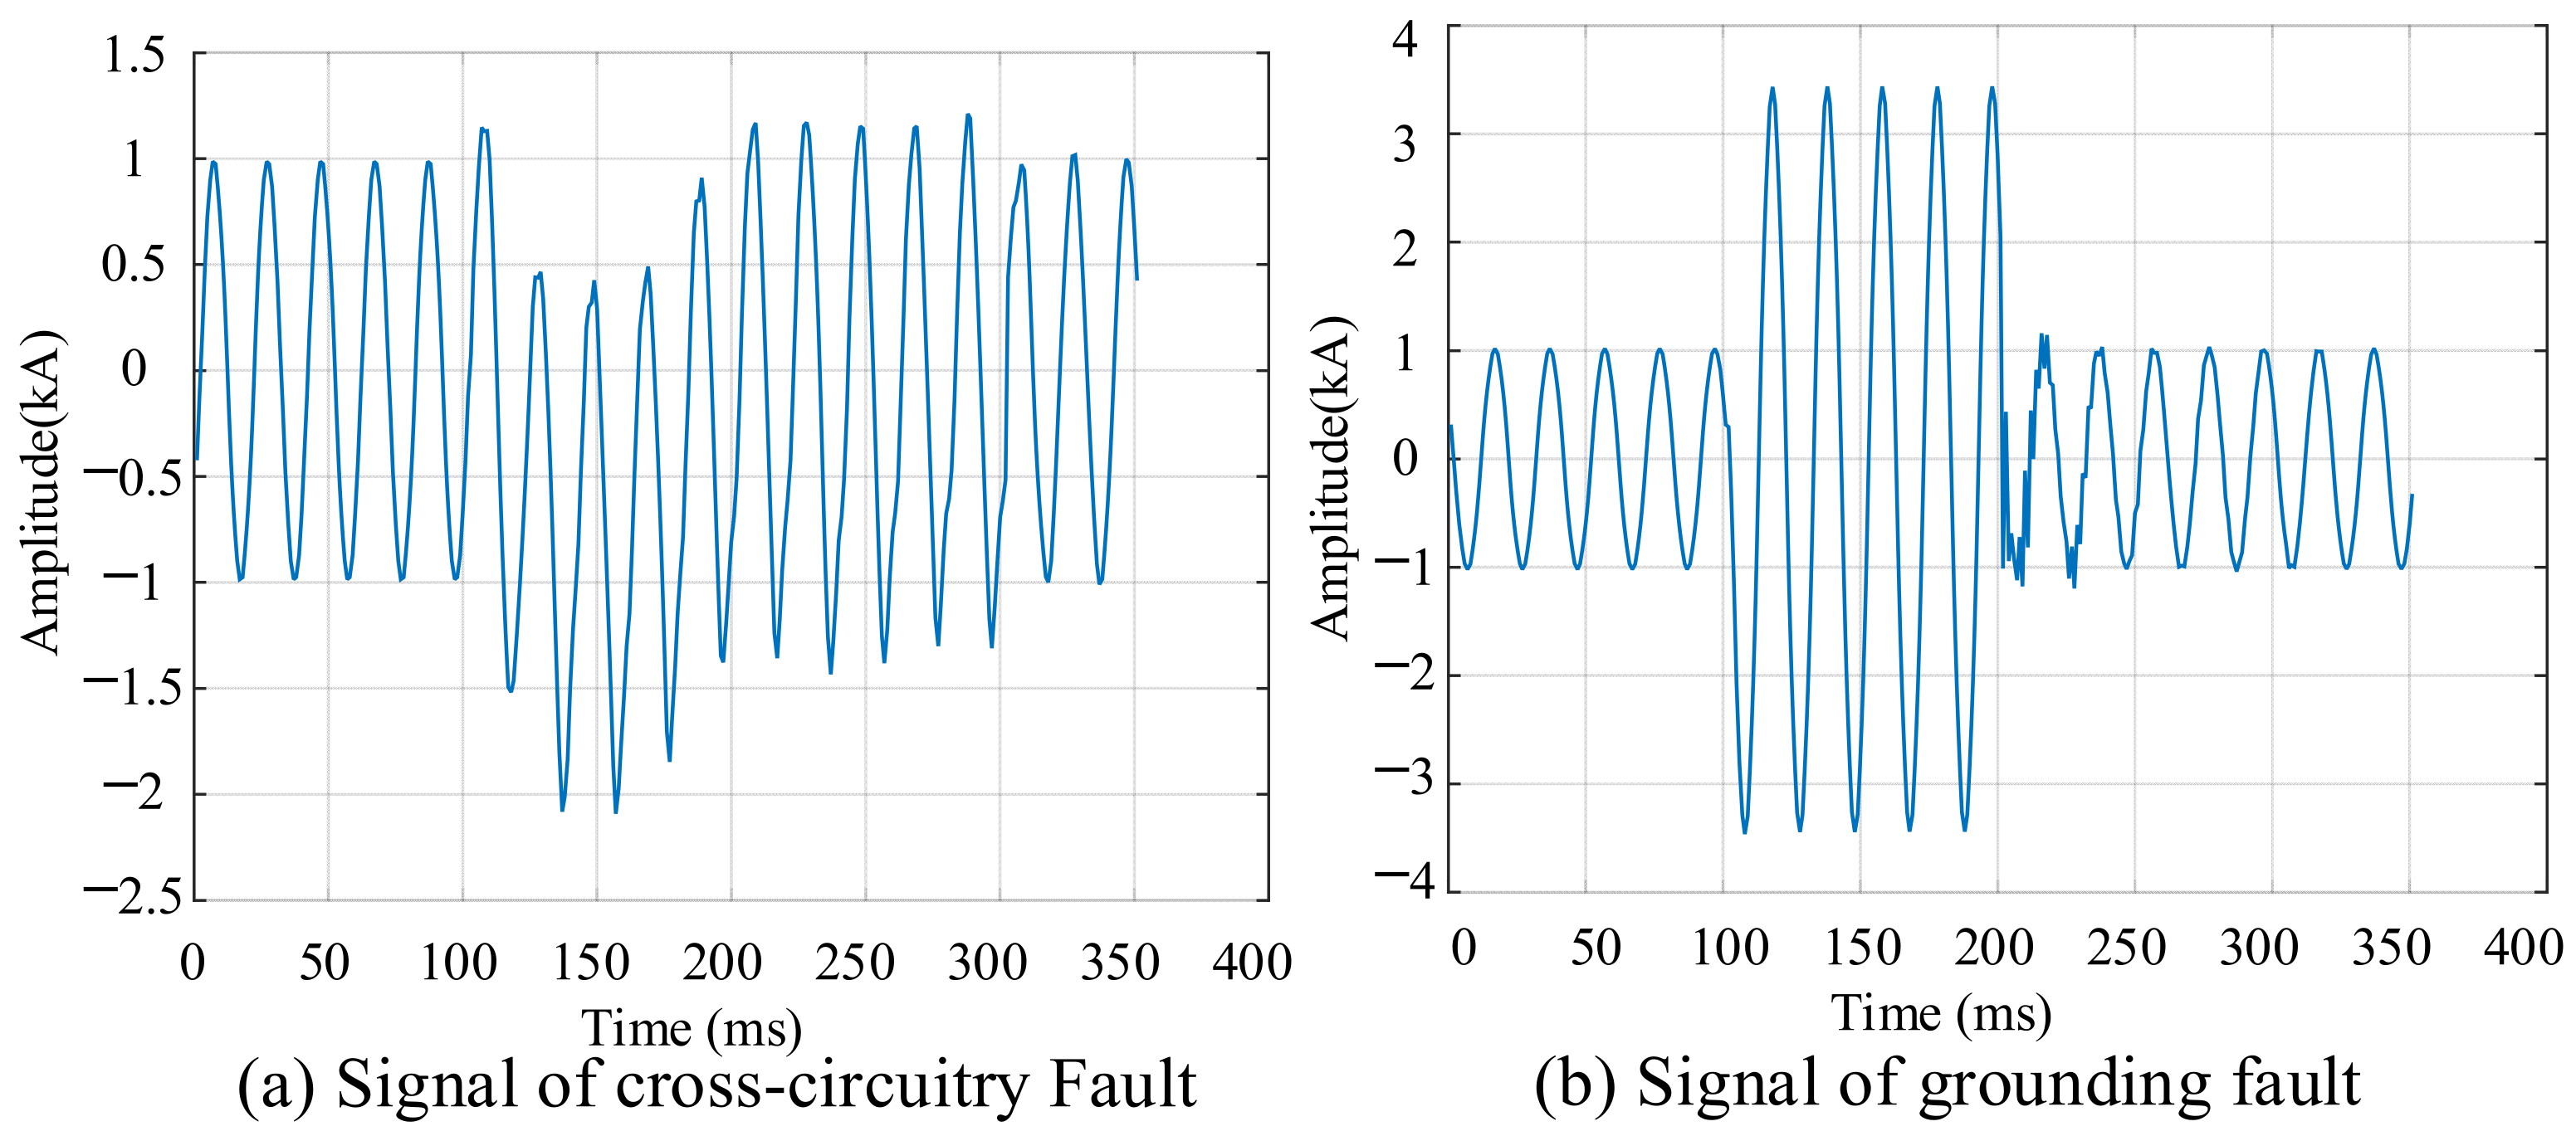
| 1 | Cross-circuitry Fault | S(Ii) ∈ [0, 0.1] |
| 2 | Grounding Fault | S(Ii) ∈ (0.1, 0.2] |
| 3 | No Fault | S(Ii) > 0.2 |
Disclaimer/Publisher’s Note: The statements, opinions and data contained in all publications are solely those of the individual author(s) and contributor(s) and not of MDPI and/or the editor(s). MDPI and/or the editor(s) disclaim responsibility for any injury to people or property resulting from any ideas, methods, instructions or products referred to in the content. |
© 2025 by the authors. Licensee MDPI, Basel, Switzerland. This article is an open access article distributed under the terms and conditions of the Creative Commons Attribution (CC BY) license (https://creativecommons.org/licenses/by/4.0/).
Share and Cite
Tao, Y.; Kong, X.; Wang, C.; Zheng, J.; Bin, Z.; Lin, J.; Xu, S. Research on Cross-Circuitry Fault Identification Method for AC/DC Transmission System Based on Blind Signal Separation Algorithm. Energies 2025, 18, 1395. https://doi.org/10.3390/en18061395
Tao Y, Kong X, Wang C, Zheng J, Bin Z, Lin J, Xu S. Research on Cross-Circuitry Fault Identification Method for AC/DC Transmission System Based on Blind Signal Separation Algorithm. Energies. 2025; 18(6):1395. https://doi.org/10.3390/en18061395
Chicago/Turabian StyleTao, Yan, Xiangping Kong, Chenqing Wang, Junchao Zheng, Zijun Bin, Jinjiao Lin, and Sudi Xu. 2025. "Research on Cross-Circuitry Fault Identification Method for AC/DC Transmission System Based on Blind Signal Separation Algorithm" Energies 18, no. 6: 1395. https://doi.org/10.3390/en18061395
APA StyleTao, Y., Kong, X., Wang, C., Zheng, J., Bin, Z., Lin, J., & Xu, S. (2025). Research on Cross-Circuitry Fault Identification Method for AC/DC Transmission System Based on Blind Signal Separation Algorithm. Energies, 18(6), 1395. https://doi.org/10.3390/en18061395